Article

Performance Enhancement of an Upflow Anaerobic Dynamic Membrane Bioreactor via Granular Activated Carbon Addition for Domestic Wastewater Treatment

1
Key Lab of Northwest Water Resource, Environment and Ecology, MOE, Xi’an University of Architecture and Technology, Xi’an 710055, China
2
International Science & Technology Cooperation Center for Urban Alternative Water Resources Development, Xi’an 710055, China
3
Institute of Fluid Science, Tohoku University, 2-1-1 Katahira, Aoba-ku, Sendai 980-8577, Japan
*
Author to whom correspondence should be addressed.
Sustainability 2023, 15(2), 1055; https://doi.org/10.3390/su15021055
Submission received: 4 December 2022 / Revised: 29 December 2022 / Accepted: 3 January 2023 / Published: 6 January 2023
(This article belongs to the Special Issue Sustainable Technologies by Advanced Anaerobic Wastewater Treatment)

Abstract

:
Developing low-carbon advanced processes for sustainable wastewater treatment is of great importance to increase bioenergy recovery and to reduce the greenhouse gas effect. In this study, the influence of adding 25 g/L of granular activated carbon (GAC) on the process performance was studied with a lab-scale GAC amended anaerobic dynamic membrane (G-AnDMBR) used to treat real domestic wastewater, which was compared to a control bioreactor without the GAC addition (C-AnDMBR). Due to the initial adsorption effect of GAC and the high microbial activity of the attached biomass of GAC, the G-AnDMBR achieved a better removal of the total chemical oxygen demand (TCOD) and turbidity compared to the C-AnDMBR, with the average removal rate increasing from 82.1% to 86.7% and from 88.7% to 93.2%. The gaseous methane production increased from 0.08 ± 0.05 to 0.14 ± 0.04 L/d, and the total methane production rate was enhanced from 0.21 ± 0.11 to 0.23 ± 0.09 LCH4/gCOD. Thus, the treatment performance of the G-AnDMBR was superior to that of the C-AnDMBR, and the addition of GAC could improve the effluent quality during the initial dynamic membrane formation process. In addition, the buffering effect of GAC made the G-AnDMBR maintain a relatively stable solution environment. The G-AnDMBR showed a transmembrane pressure (TMP) increasing rate of 0.045 kPa/d, which was obviously lower than that of the C-AnDMBR (0.057 kPa/d) because the nonfluidized GAC could trap fine sludge particles and adsorb soluble extracellular polymer substances (SEPSs), thus inhibiting the over formation of the dynamic membrane layer. A microbial property analysis indicated that GAC induced a change in the microbial community and enhanced the gene abundance of type IV pili and that it also potentially accelerated the direct interspecific electron transfer (DIET) among syntrophic bacteria and methanogens by enriching specific functional microorganisms. The results indicated that the integration of GAC and the AnDMBR process can be a cost-effective and promising alternative for domestic wastewater treatment and bioenergy recovery.

1. Introduction

Nowadays, great research efforts have been made to transform the traditional municipal wastewater (MWW) treatment paradigm into a low-carbon and sustainable one, positively coping with the crisis of nonrenewable energy and resources as well as climate change [1,2]. The anaerobic membrane bioreactor (AnMBR) is considered to be a competitive process for anaerobic treatment, which was developed by coupling anaerobic digestion with membrane technology. The AnMBR shows some unique advantages, including the complete retention of the biomass and pathogens, a low sludge yield, a small footprint, methane-rich biogas generation as well as good stability [3,4]. The successful applications of AnMBRs have extended from treating organic-rich solid wastes and agroindustrial wastewater to treating low-strength wastewater (such as MWW) [5]. However, membrane fouling and a low methane recovery are the major limitations restricting the AnMBR process for cost-effective MWW treatment due to the high hydraulic loading rate applied and the substantial produced biogas loss in the form of dissolved methane, respectively [6,7].
As for membrane fouling mitigation, the emerging low-cost and antifouling dynamic membrane filtration technology can be used to upgrade AnMBRs to anaerobic dynamic membrane bioreactors (AnDMBRs) [6]. In AnDMBRs, coarse pore meshes (10–200 μm) are adopted as supporting materials to facilitate the retention and accumulation of the fine particles in an anaerobic sludge, forming an additional filtration layer (the so called dynamic membrane or secondary membrane) [8]. The dynamic membrane (DM) can achieve comparative retention effects compared to microfiltration (MF) membranes at a much lower filtration resistance. More importantly, the filtration duration of AnDMBRs can be prolonged due to the antifouling property of the DM, and the DM can be removed through hydraulic cleaning and regenerated when the filtration ability of the DM seriously deteriorates [9]. For example, when an AnDMBR was set up for treating wastewater, a stable operation under a high flux (90 LMH) and low fouling (fouling rate of 0.57 kPa/d) was realized by reducing the hydraulic retention time (HRT) to 2 h [10]. However, a further increase in the flux and a decrease in the HRT negatively affected the organics removal, biogas production and DM filtration behavior. The results indicated that the conflict between the methane production and membrane filtration performance should be well addressed.
On the other hand, it is recognized that adding adsorbents or external conductive particles into the bioreactors can improve the process performance [11,12,13,14]. Commonly used conductive materials include carbon-based additives, with powdered activated carbon (PAC), granular activated carbon (GAC) and biochar as the representatives. Coupling these conductive materials with anaerobic digestion is a promising in situ method to upgrade the existing anaerobic digestion because these additives can play some important roles, such as providing suitable colonies for the electroactive biomass, applying the adsorption effect, accelerating the extracellular electron transfer, pH buffering and providing electrons, among others [15,16]. For instance, a PAC addition enhanced the AnMBR performance in terms of the fouling control by reducing the excessive accumulation of a cake layer and altering the predominant microbial communities [17]. In another work, a pilot-scale GAC-synergized AnMBR was developed with good system robustness, which was verified over the seasonal temperature change [18]. A microbial analysis indicated that GAC carriers promoted the direct interspecies electron transfer (DIET) among syntrophic microorganisms since the enrichment of the specific electroactive biomass was detected. The results provided sound evidence of the multifunction played by carbon-based conductive materials. However, pure adsorbent materials undergo an additional regeneration process after adsorption saturation to recover their adsorption function [11,12,19]. The adsorption function of biochar is lower than that of activated carbon [20]. PAC is easy to be discharged from the bioreactor, causing potential environmental risks [13]. Therefore, the addition of GAC was preferentially considered in this study.
Although previous studies have verified the performance enhancement and potential mechanisms of conductive materials supplemented into anaerobic digesters (especially AnMBRs), to the best our knowledge, limited work has been done to combine the merits of DM technology with conductive materials in the same anaerobic digester. Therefore, it is of great interest to develop a conductive-material-assisted AnDMBR process and to verify its effectiveness in real municipal wastewater treatment.
GAC produced from various organic wastes is very easy to produce and recycle, which has the advantage of easy availability and a low cost [13]. The aim of this study was to develop a novel combined anaerobic bioreactor by integrating GAC particles with a lab-scale AnDMBR for cost-effective domestic wastewater treatment. Compared to the control reactor (C-AnDMBR), under similar operating conditions, the process performance enhancement and the underlying mechanisms were investigated. Since limited work has been conducted previously, the obtained results will provide a useful reference for the practical application of low-cost integrated AnDMBRs.

2. Materials and Methods

2.1. Lab-Scale Experimental Setup and Operational Conditions

A laboratory-scale AnDMBR (3.7 L working volume) with a self-made flat-sheet dynamic membrane (DM) module installed at the top was developed to treat domestic wastewater. The supporting material used was nylon mesh, which has a pore size of approximately 75 μm, and the effective filtration area of double sides was 0.02 m2. The wastewater entered the bottom of the reactor through a peristaltic pump, passing through the sludge bed and the DM module in turn, and, finally, the effluent was achieved by using another peristaltic pump. Influent peristaltic pump (Longer BT-100, Shanghai, China) was connected to a water level controller (JYB-714A, Delixi Electric, Wenzhou, China) to maintain a stable water level. The other peristaltic pump was connected to a timer, ensuring the intermittent discharge of the membrane permeate in a constant flux mode. The transmembrane pressure (TMP), monitored in real time by the pressure sensor (SIN-P400, Hong Kong, China) connected to the outlet pipe, could reflect the degree of membrane contamination. Biogas yield from the reactor headspace was measured daily with a wet-type gas flowmeter (TC-2, Fushun, China). The water bath device was adopted to keep the bioreactor at room temperature (25 ± 1 °C).
To investigate the impact of adding GAC particles on AnDMBR performance, the comparison experiment was conducted and divided into 2 stages according to whether GAC was added or not. The control group without GAC supplementation was named C-AnDMBR running for 124 d, while the other one was named G-AnDMBR with GAC addition. The operating conditions are shown in Table 1. At the end of phase I, 25 g/L of GAC (1–3 mm particle size) was added directly into the reactor. Since biomass yield was low at room temperature, no sludge was discharged except for sampling. Thus, the SRT of the AnDMBRs could be regarded as infinite. The inoculated sludge was collected from a local full-scale upflow anaerobic sludge blanket (UASB) process treating brewery wastewater. The real domestic wastewater was taken from a local wastewater treatment plant in Xi’an, China, and the concentration of influent pollutants in the two phases was slightly different. The total chemical oxygen demand (TCOD) concentration was 176.8–696.1 and 374.8–725.0 mg/L, and the dissolved chemical oxygen demand (SCOD) concentration was 60.2–180.9 and 76.2–211.8 mg/L. The content of total phosphorus (TP) was 5.9–11.4 and 4.8–9.7 mg/L, the content of total nitrogen (TN) was 42.7–88.1 and 40.1–71.0 mg/L. The content of phosphate (PO4-P) was 4.2–7.3 and 3.5–6.5 mg/L, and the content of ammonia nitrogen (NH4+-N) was 33.9–70.0 and 32.8–58.3 mg/L. The content of polysaccharides (PSs) was 3.6–8.9 and 4.7–9.3 mg/L, and the content of proteins (PNs) was 19.5–44.4 and 16.8–37.8 mg/L. Influent turbidity was 61.0–468.8 and 195.4–330.3 NTU.

2.2. Analytical Methods

Sludge concentration (MLSS and MLVSS), chemical oxygen demand (TCOD and SCOD), content of total phosphorus (TP and PO43−-P) and content of total nitrogen (TN and NH4+-N) were determined using standard analytical methods [21]. Extracellular polymeric substances (EPSs) were extracted through heating treatment, and the main components were PNs and PSs, which were analyzed using Lowry–Folin method and Anthrone method, respectively [22,23]. The dissolved methane was measured using headspace method [24]. In detail, the effluent sample was quickly transferred to the serum bottle (122 mL) and sealed, and 40 mL of water sample was replaced by N2 (40 mL) using a plastic syringe to create a headspace. Then, the serum bottle was moved to an oscillator at 25 °C (120 rpm for 24 h). Finally, the amount of dissolved methane was calculated according to the gas volume released into the headspace, biogas composition and known methane solubility. The main components of biogas (CH4, CO2 and N2) were analyzed with a gas chromatograph (GC7900, Tianmei, China). The morphologies of new nylon mesh, dynamic membrane and GAC particles were analyzed through scanning electron microscopy (SEM) (VEGA 3LMH, Tescan Corporation, Brno, Czech). The inorganic element composition of DM and GAC was analyzed with an EDX analyzer (INCA Energy 350, Oxford, UK).

2.3. Specific Methanogenic Activity (SMA)

SMA of sludge samples from the AnDMBRs at the end of two phases was measured according to a previous study [10]. Substrates in the form of sodium formate, sodium acetate and sodium propionate (COD = 0.5 g/L) together with sampled sludge and micro-nutrients were added to the serum bottles. Each bottle was rinsed with N2 for 5 min to maintain the strict anaerobic environment. Then the sealed bottles were moved to a water bath oscillator (25 °C, 120 rpm) for 10 d. The bottles were shaken for 10 min, and then the overpressure in the headspace was released with a glass syringe to ensure the initial pressure balance. Biogas yield and biogas composition were measured at regular intervals to determine the SMA. Duplicate samples were set for each group of batch tests to ensure accuracy.

2.4. Metagenomic Analysis

At the end of each experimental stage, sludge samples, including anaerobic sludge, DM layer and GAC-biofilm collected from the AnDMBRs, were commissioned to Majorbio (Shanghai, China) for metagenomic sequencing analysis. Samples (including S1, S2, GB, DM1 and DM2) referred to the sludge of C-AnDMBR and G-AnDMBR, the GAC-biofilm and the DM layer of C-AnDMBR and G-AnDMBR. DNA was extracted (dNeasy PowerSoil Kit, QIAGEN, Toronto, ON, Canada) and fragmented to about 400 bp (M220, Covaris, Woburn, MA, USA). After bridge PCR, Illumina Hiseq 2500 platform was used for DNA sequencing. Based on the initial data sequence information, Fastp was used to cut out low-quality and N-containing reads to obtain high-quality reads. Megahit was used to assemble the short fragment reads into contigs after quality control. In addition, MetaGene was used to perform open reading frame prediction on contigs to obtain the genes of each sample [25]. Finally, using NR database (Non-Redundant Protein Sequence Database) and KEGG database [26] (Kyoto Encyclopedia of Genes and Genomes), DIAMOND made species annotations and gene annotations for the nonredundant gene sets constructed by CD-HIT [27,28].

3. Results and Discussion

3.1. Pollutant Removal Performance

The change in the TCOD concentration and the TCOD removal rate are shown in Figure 1a. The average TCOD removal of the G-AnDMBR (86.7 ± 2.9%) was 4.6% higher than that of the C-AnDMBR (82.1 ± 5.1%), which was lower than the GAC-amended UASB with a TCOD removal increased by 12.0% [29]. It may be due to the differences in the properties of the GAC particles and the anaerobic sludge. The removal rates of the TCOD of the anaerobic sludge and the DM layer in the C-AnDMBR were 76.4 ± 5.5% and 5.7 ± 2.6%, while those of the G-AnDMBR were 81.3 ± 4.0% and 5.6 ± 1.9%, indicating that the increased removal of the TCOD was mainly due to GAC-induced adsorption and biodegradation [15]. As documented, GAC could provide an adsorption location for various refractory substances in the actual sewage, extending the biodegradation time and further removing contaminants [30]. In addition, it has been reported that under a different HRT, the removal rate of the TCOD of a UASB with GAC is more stable [15]. The removal rates of the TCOD of the AnDMBRs were higher than those of the conventional anaerobic digesters reported in the literature [10,31] because the slightly higher HRT (HRT = 12 h in this study, and HRT = 8 h, 4 h, 2 h or 1 h in the literature) could increase the degradation of organic matter by microorganisms, prevent the loss of microbial metabolites, and, ultimately, reduce the effluent TCOD.
The effluent TCOD was always lower than the supernatant TCOD. The well-formed dynamic membrane could effectively trap the COD. On the other hand, the active biomass within the DM layer could degrade part of the organic matter [32]. Similarly, the SCOD removal rate of the G-AnDMBR (55.8 ± 1.2%) was higher than that of the C-AnDMBR (46.3 ± 1.5%). The SCOD accounted for 84.1 ± 9.9% and 86.3 ± 13.8% of the TCOD in the effluent of the AnDMBRs, indicating that the residue COD contained some fine particles and colloids [9].
The removal of TCOD, PSs, PNs, nitrogen, phosphorus and other pollutants is shown in Table 2. The C-AnDMBR (12.8 ± 7.1% and 23.6 ± 8.4%) and G-AnDMBR (16.2 ± 5.0% and 26.0 ± 6.7%) had a poor TN and TP removal. Only particulate nitrogen and phosphorus substances (such as organic matter) in domestic wastewater could be intercepted by an anaerobic sludge bed and dynamic membrane. The results manifested that the AnDMBR could effectively remove organic matter but could not remove nutrients. Therefore, it is important to combine the AnDMBR with a nutrient removal process to further improve the effluent quality.
The ratio of PNs to PSs in the EPS was approximately 4:1. Figure 1b,c shows the variations in the PN and PS concentrations in various samples and the associated removal rates. Compared with the C-AnDMBR, the removal rates of PNs and PSs by the G-AnDMBR were increased by 4.8% and 4.7%, respectively, possibly due to the positive roles played by the GAC particles and the altered DM property. A higher removal of organic matter will function as available substrates, contributing to enhanced methane production.
As shown in Figure 1d, the pH of the influent ranged from 7.70 to 8.73 within weak alkaline conditions, while the pH of the sludge samples in the C-AnDMBR and G-AnDMBR was 7.23–7.35 and 7.18–7.31. However, it was found that the G-AnDMBR was more stable, indicating that the addition of GAC could maintain a relatively stable solution environment due to the buffering effect of GAC. In addition, the average effluent pH (7.69 ± 0.19 and 7.73 ± 0.06) of the two reactors was higher than that of the supernatant (7.46 ± 0.29 and 7.53 ± 0.14). It was proposed that the dynamic membrane could not only trap the volatile organic acids (VFAs) produced and convert them into methane but that it could also degrade the nitrogen-containing organic matter accumulated on the fouling layer, producing alkalinity [32]. Alibardi et al. [32] found that the effluent pH (7.1–8.7) was higher than that of the influent (6.8–7.5) when treating synthetic wastewater at an ambient temperature.

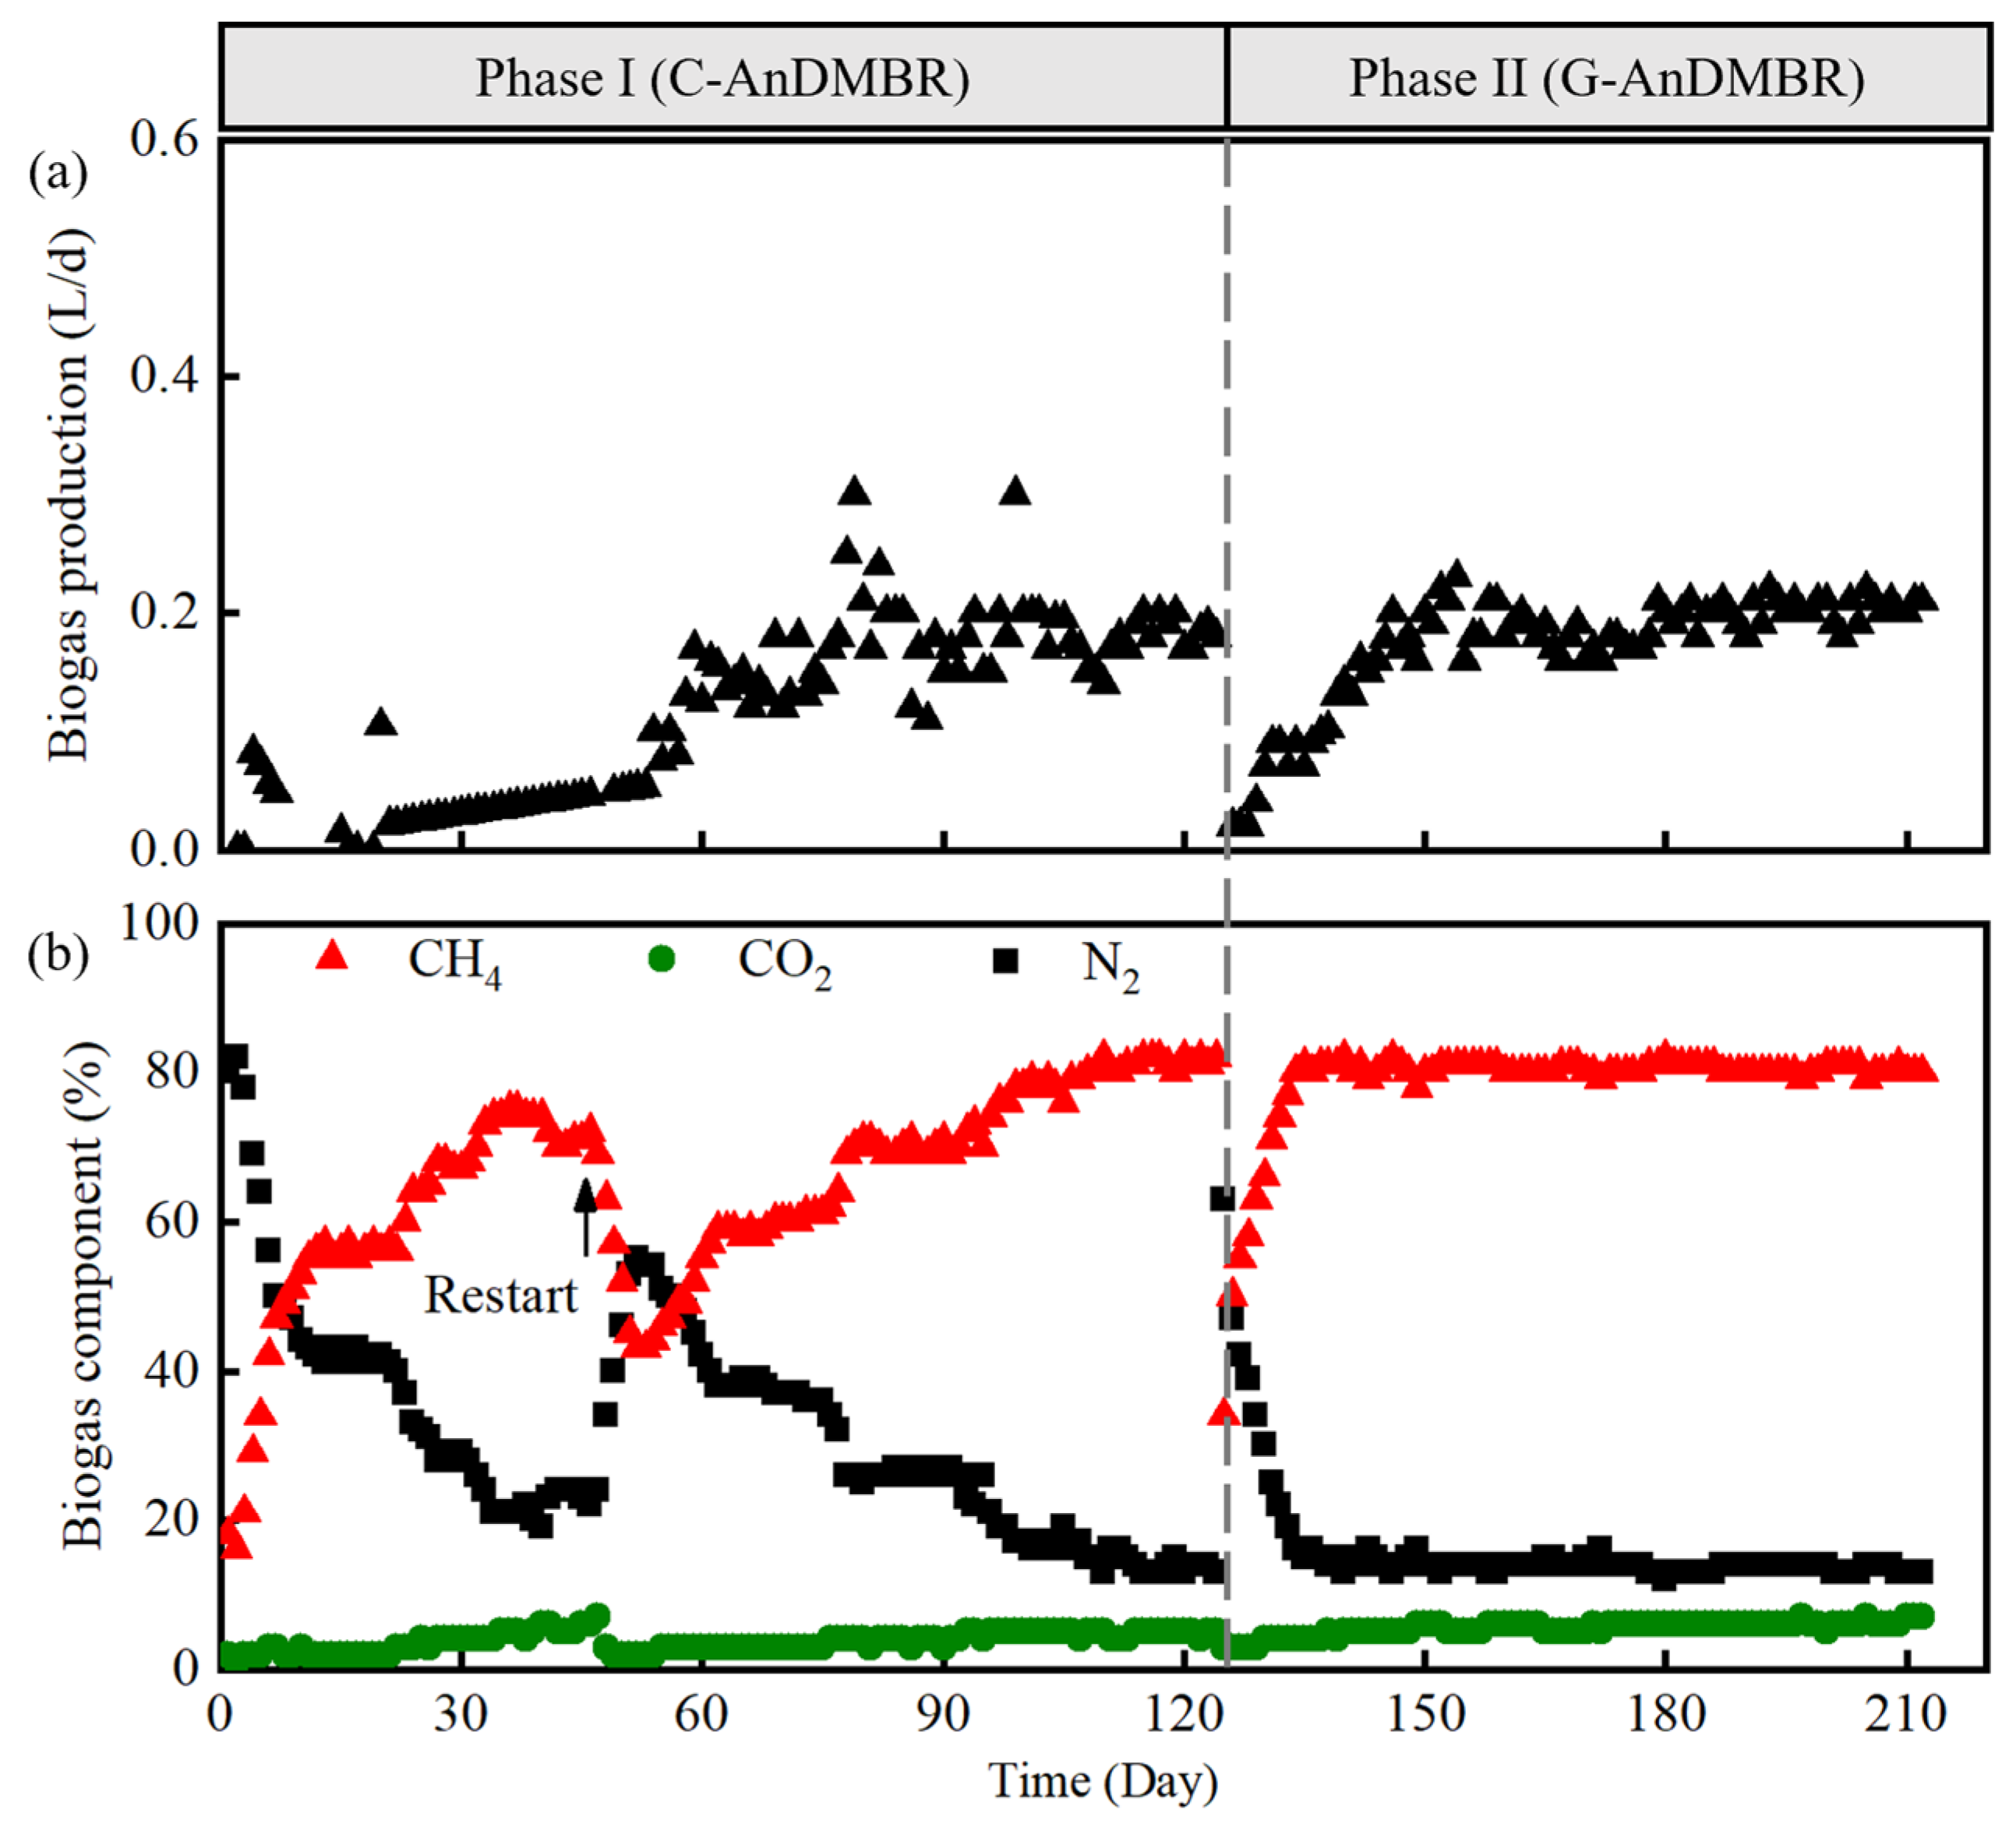
3.2. Methanogenic Performance

The methanogenic performance of the two AnDMBRs is summarized in Table 3. The profile of the biogas generation is shown in Figure 2a. Under stable operation conditions, the average biogas production of the C-AnDMBR and G-AnDMBR was 0.12 ± 0.08 and 0.17 ± 0.07 L/d, and the average methane production was 0.08 ± 0.05 and 0.14 ± 0.04 L/d. Apparently, the lower gas production was likely due to the restriction of the biogas production by the sulfate reduction; the low organic strength of wastewater; and the high methane solubility at low temperatures, leading to a dissolved methane loss [33]. In addition, the moderate to low biodegradability of the particulate organic matter (the influent particulate COD accounting for more than 70% of the TCOD in this study) reduced the efficiency of converting organic matter into biogas [34]. By monitoring the biogas components, it became well known that the main components of the biogas were CH4, N2 and CO2 as shown in Figure 2b. Under stable operation conditions, the content of CH4 was the highest, N2 was the second, and CO2 was the lowest. In addition, it was recognized that N2 mainly came from the air dissolved in the influent. It is important that the impurities in the biogas (such as N2 and CO2) affected the quality of the biogas and also impacted its further utilization as a renewable energy source. There were some differences in the methanogenic properties between the C-AnDMBR and G-AnDMBR. Firstly, the methane content of the biogas in the G-AnDMBR (79–82%) was higher than that in the C-AnDMBR (78–81%). It has been reported that a GAC-amended UASB achieved a higher percentage (1–2%) of methane than a UASB without a GAC addition [16]. Secondly, the gaseous methane production rate (0.05 ± 0.01 LCH4/g COD) of the G-AnDMBR was 1.67 times that of the C-AnDMBR (0.03 ± 0.01 LCH4/g COD), indicating that GAC promoted the methanogenic performance. For example, when treating toxic organic pollutants, the maximum methane production rate of a GAC assisted digester was increased by 259% compared to that of the control [35]. Zhang et al. [29] stated that adding GAC could increase the specific biomass growth rate and improve the maximum methane production rate by 41%.
The solubility of methane was easily influenced by the mass transfer, low HRT and temperature conditions among other factors [9,10,32,33,36], so it was necessary to measure the dissolved methane, especially at low temperatures. The soluble methane production rate (0.18 ± 0.08 LCH4/g COD) of the G-AnDMBR was a little more than that of the control group (0.17 ± 0.10 LCH4/g COD). The dissolved methane accounted for 85% and 79% of the total methane production in the C-AnDMBR and G-AnDMBR, respectively, highlighting the urgent need for dissolved methane recovery from the AnDMBR effluent.
By conducting methanogenic activity tests, it was noted that, compared to the C-AnDMBR (0.044 ± 0.004, 0.014 ± 0.002 and 0.036 ± 0.005 LCH4/gCOD), the SMA of the G-AnDMBR (0.090 ± 0.006, 0.029 ± 0.002 and 0.039 ± 0.006 LCH4/gCOD) with acetate, formate and propionate as the substrates was 1.1, 1.1 and 0.1 times higher, respectively. The results indicated that GAC mainly enhanced the SMA when acetate acid was used as the substrate, which corresponded to the results that the G-AnDMBR produced more methane. It was speculated that GAC could stimulate the enrichment of DIET-active microorganisms [36], thus promoting the methane generation rate and amount.

3.3. Filtration Performance

The filtration performance of the AnDMBRs was reflected by the varying profiles of the TMP, flux and effluent turbidity as shown in Figure 3. A constant flux of approximately 15 LMH was maintained during the two experimental phases, lasting for 125 and 88 days, respectively. Compared with the gravity-driven constant-pressure filtration mode, the pump-driven constant flux filtration mode adopted in this experiment had the advantages of a high flux and long operation time [10].
As shown in Figure 3a, the TMPon (TMP value when effluent pump was on) increased slowly in both phases, and the maximum value of the G-AnDMBR (4.9 kPa) was lower than that of the C-AnDMBR (8.6 kPa). The possible reasons were as follows: (1) compared to the C-AnDMBR, the G-AnDMBR experienced a shorter operational time, resulting in a lower cake layer resistance; (2) GAC and the associated biofilm adsorbed soluble microbial products to reduce their adhesion on the cake layer, making the structure of the cake layer loose [37]; or (3) improving the sludge properties (such as increasing the average particle size of the sludge) increased the permeability of the dynamic membrane. The TMPon increasing rates of the C-AnDMBR and G-AnDMBR were 0.045 kPa/d and 0.057 kPa/d, both of which were much lower than those of the AnMBRs reported in the literature [6]. The increasing rates of the ΔTMP (the difference in the TMP values of TMPon and TMPoff) were 0.030 kPa/d and 0.025 kPa/d for the C-AnDMBR and G-AnDMBR. The lower values of the TMPon and ΔTMP increasing rates of the G-AnDMBR indicated that GAC could alleviate membrane fouling and prolong the stable operational time. The results showed that more severe membrane fouling did not occur during the two phases, so there was no need for physical or chemical cleaning to restore the DM permeability even after several months of operation.
As shown in Figure 3b, the initial effluent turbidity (27.5–86.6 NTU) of the C-AnDMBR was relatively high and unstable, indicating that the initial self-forming DM could not retain materials with a small particle size at the beginning or until 20 days of operation for mature DM formation, which was consistent with the previously reported results [38]. After 3 days of operation, the effluent turbidity of the G-AnDMBR decreased to below 25.0 NTU. It was noted that the adsorption effect of GAC could improve the effluent quality by rejecting fine particles and colloids. In general, the turbidity removal rate of the G-AnDMBR (93.2%) was 4.5% higher than that of the C-AnDMBR (88.7%), ensuring a stable effluent quality.

3.4. Properties of Anaerobic Sludge and DM

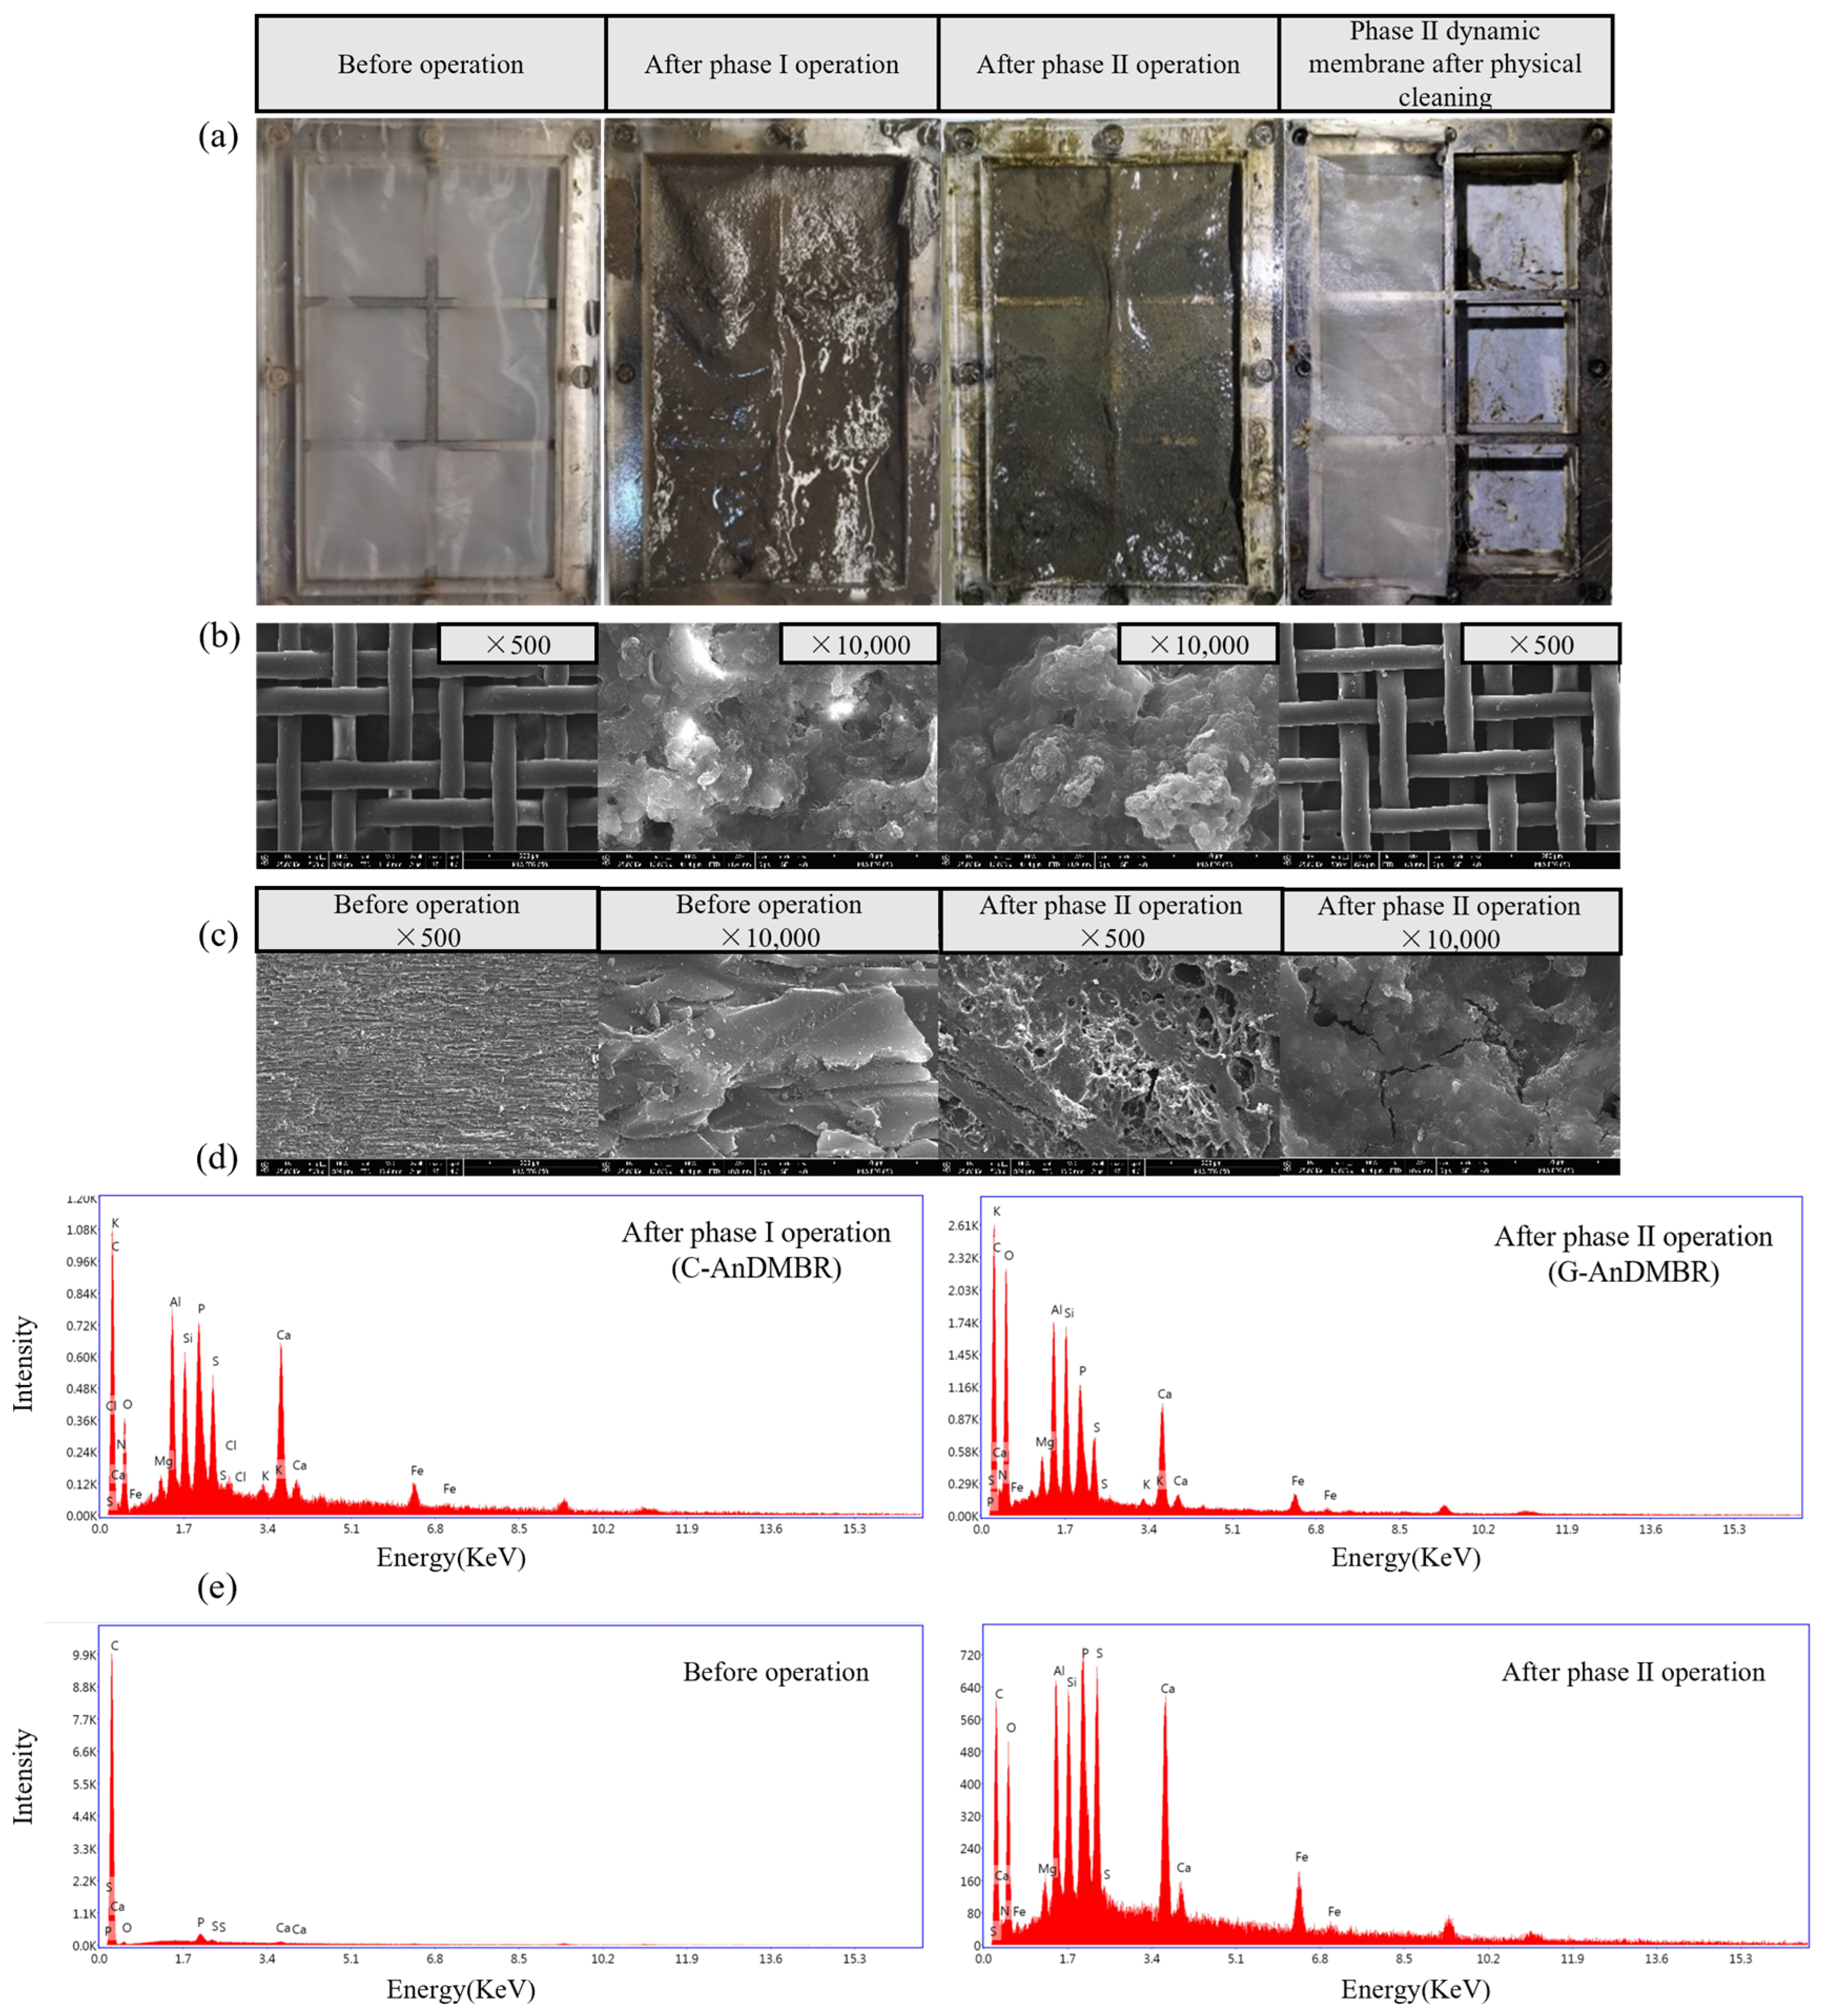
3.4.1. DM Properties

The photos of the membrane modules obtained at the end of the two phases are shown in Figure 4a. The DM was unevenly distributed on the mesh surface, which was thin on the top and thick on the bottom of the membrane modules. In addition, Jiao et al. [39] reported the formation of heterogeneous dynamic membranes due to uneven biogas sparging in an AnDMBR. Figure 4b shows the SEM photos, including the DM layers, the new mesh and the mesh after physical cleaning. There was no apparent discrepancy in the morphology of the DM layers between the two phases, which were porous, compact and rough in morphology. However, the surface properties of the membrane changed after the addition of activated carbon (PAC = 4.5 g/L) using a biogas-sparging bioreactor in a previous study [17]. However, in this work, the GAC was situated at the bottom of the upflow reactor without scouring action on the membrane modules. The cleaning methods of the membrane modules were as follows: only hydraulic cleaning supplemented by sponge scrubbing was adopted to remove various foulants on the surface of the nylon mesh. According to the photos of the membrane modules and SEM, it could be inferred that there was no significant difference in the membrane properties before or after cleaning, indicating a good recovery of the membrane permeability after using physical cleaning alone. The colors of the DM layers in both the AnDMBRs were black and brown, and part of the DM layer was a gel layer. The average DM thickness of the G-AnDMBR (0.9 mm) was thinner than that of the C-AnDMBR (2.1 mm). Compared to the C-AnDMBR (192.0 g/m2 and 84.2 g/m2), the TSS (76.8 g/m2) and VSS (43.2 g/m2) of the DM in the G-AnDMBR were lower, indicating that GAC could delay the aggregation of various pollutants on the nylon mesh, which was consistent with the slow TMP growth rate of the G-AnDMBR (Section 3.3).
The EPS concentration on the DM layer could directly reflect the membrane fouling. The contents of the soluble extracellular polymers (SEPSs) and bound extracellular polymers (BEPSs) of the C-AnDMBR were 0.59 g/m2 and 2.88 g/m2. The contents of the SEPSs and BEPSs of the G-AndMBR were 0.21 g/m2 and 1.19 g/m2. It is observed that the EPS content of the G-AnDMBR was much lower. The main reasons may be as follows: (1) there was an enhanced microbial degradation of EPSs by the GAC-associated biofilm, or (2) GAC could modify the structural stability of the sludge flocs, thus reducing the release of EPSs from the sludge mixture [40].
As shown in Figure 4d, an EDX analyzer was used to analyze the components and content of the inorganic elements in the DM layer. The elemental composition was basically the same, but the main element, C, of the C-AnDMBR was 65.65%, while the content of the G-AnDMBR decreased to 50.07%. It was noted that the DM layer in the C-AnDMBR contained the elements Al (1.82%), P (1.82%), S (0.98%), K (0.11%), Ca (1.50%) and Fe (0.32%), which were higher compared to those of the G-AnDMBR. A recent study reported that Al, K, Ca and Fe can bridge biopolymers and cells, making the cake layer thicker [41]. At the same time, the interaction among C, Fe, P and S made their content increase together [42].
As shown in Figure 4c, the clean GAC surface had a clear texture and sharp edges. Different from the fine, smooth surface of the mesoporous silica monoliths reported by the Awual group, the morphology of clean GAC was rough and porous [11]. After a long-term operation, uniform and smooth biomasses accumulated on the surface of the GAC, which was presumed to be the GAC-biofilm. Meanwhile, the inorganic elements of the GAC and GAC-biofilm were analyzed as shown in Figure 4e. The elemental contents of the original GAC were as follows: 95.86% C, 3.72% O, 0.27% P, 0.09% S and 0.07% Ca. The elemental composition of the GAC-biofilm was as shown below: 53.04% C, 11.06% N, 25.77% N, 0.33% Mg, 1.92% Al, 1.58% Si, 2.33% P, 1.69% S, 1.65% Ca and 0.63% Fe. The significant decrease in the C content and the obvious change in the element species further proved that the biofilm was formed on the GAC surface. In addition, it was found that the elemental composition of the GAC-biofilm was almost the same as that of the DM layer in the C-AnDMBR and G-AnDMBR, indicating that GAC could function as suitable supporting media for active biofilm attachment.

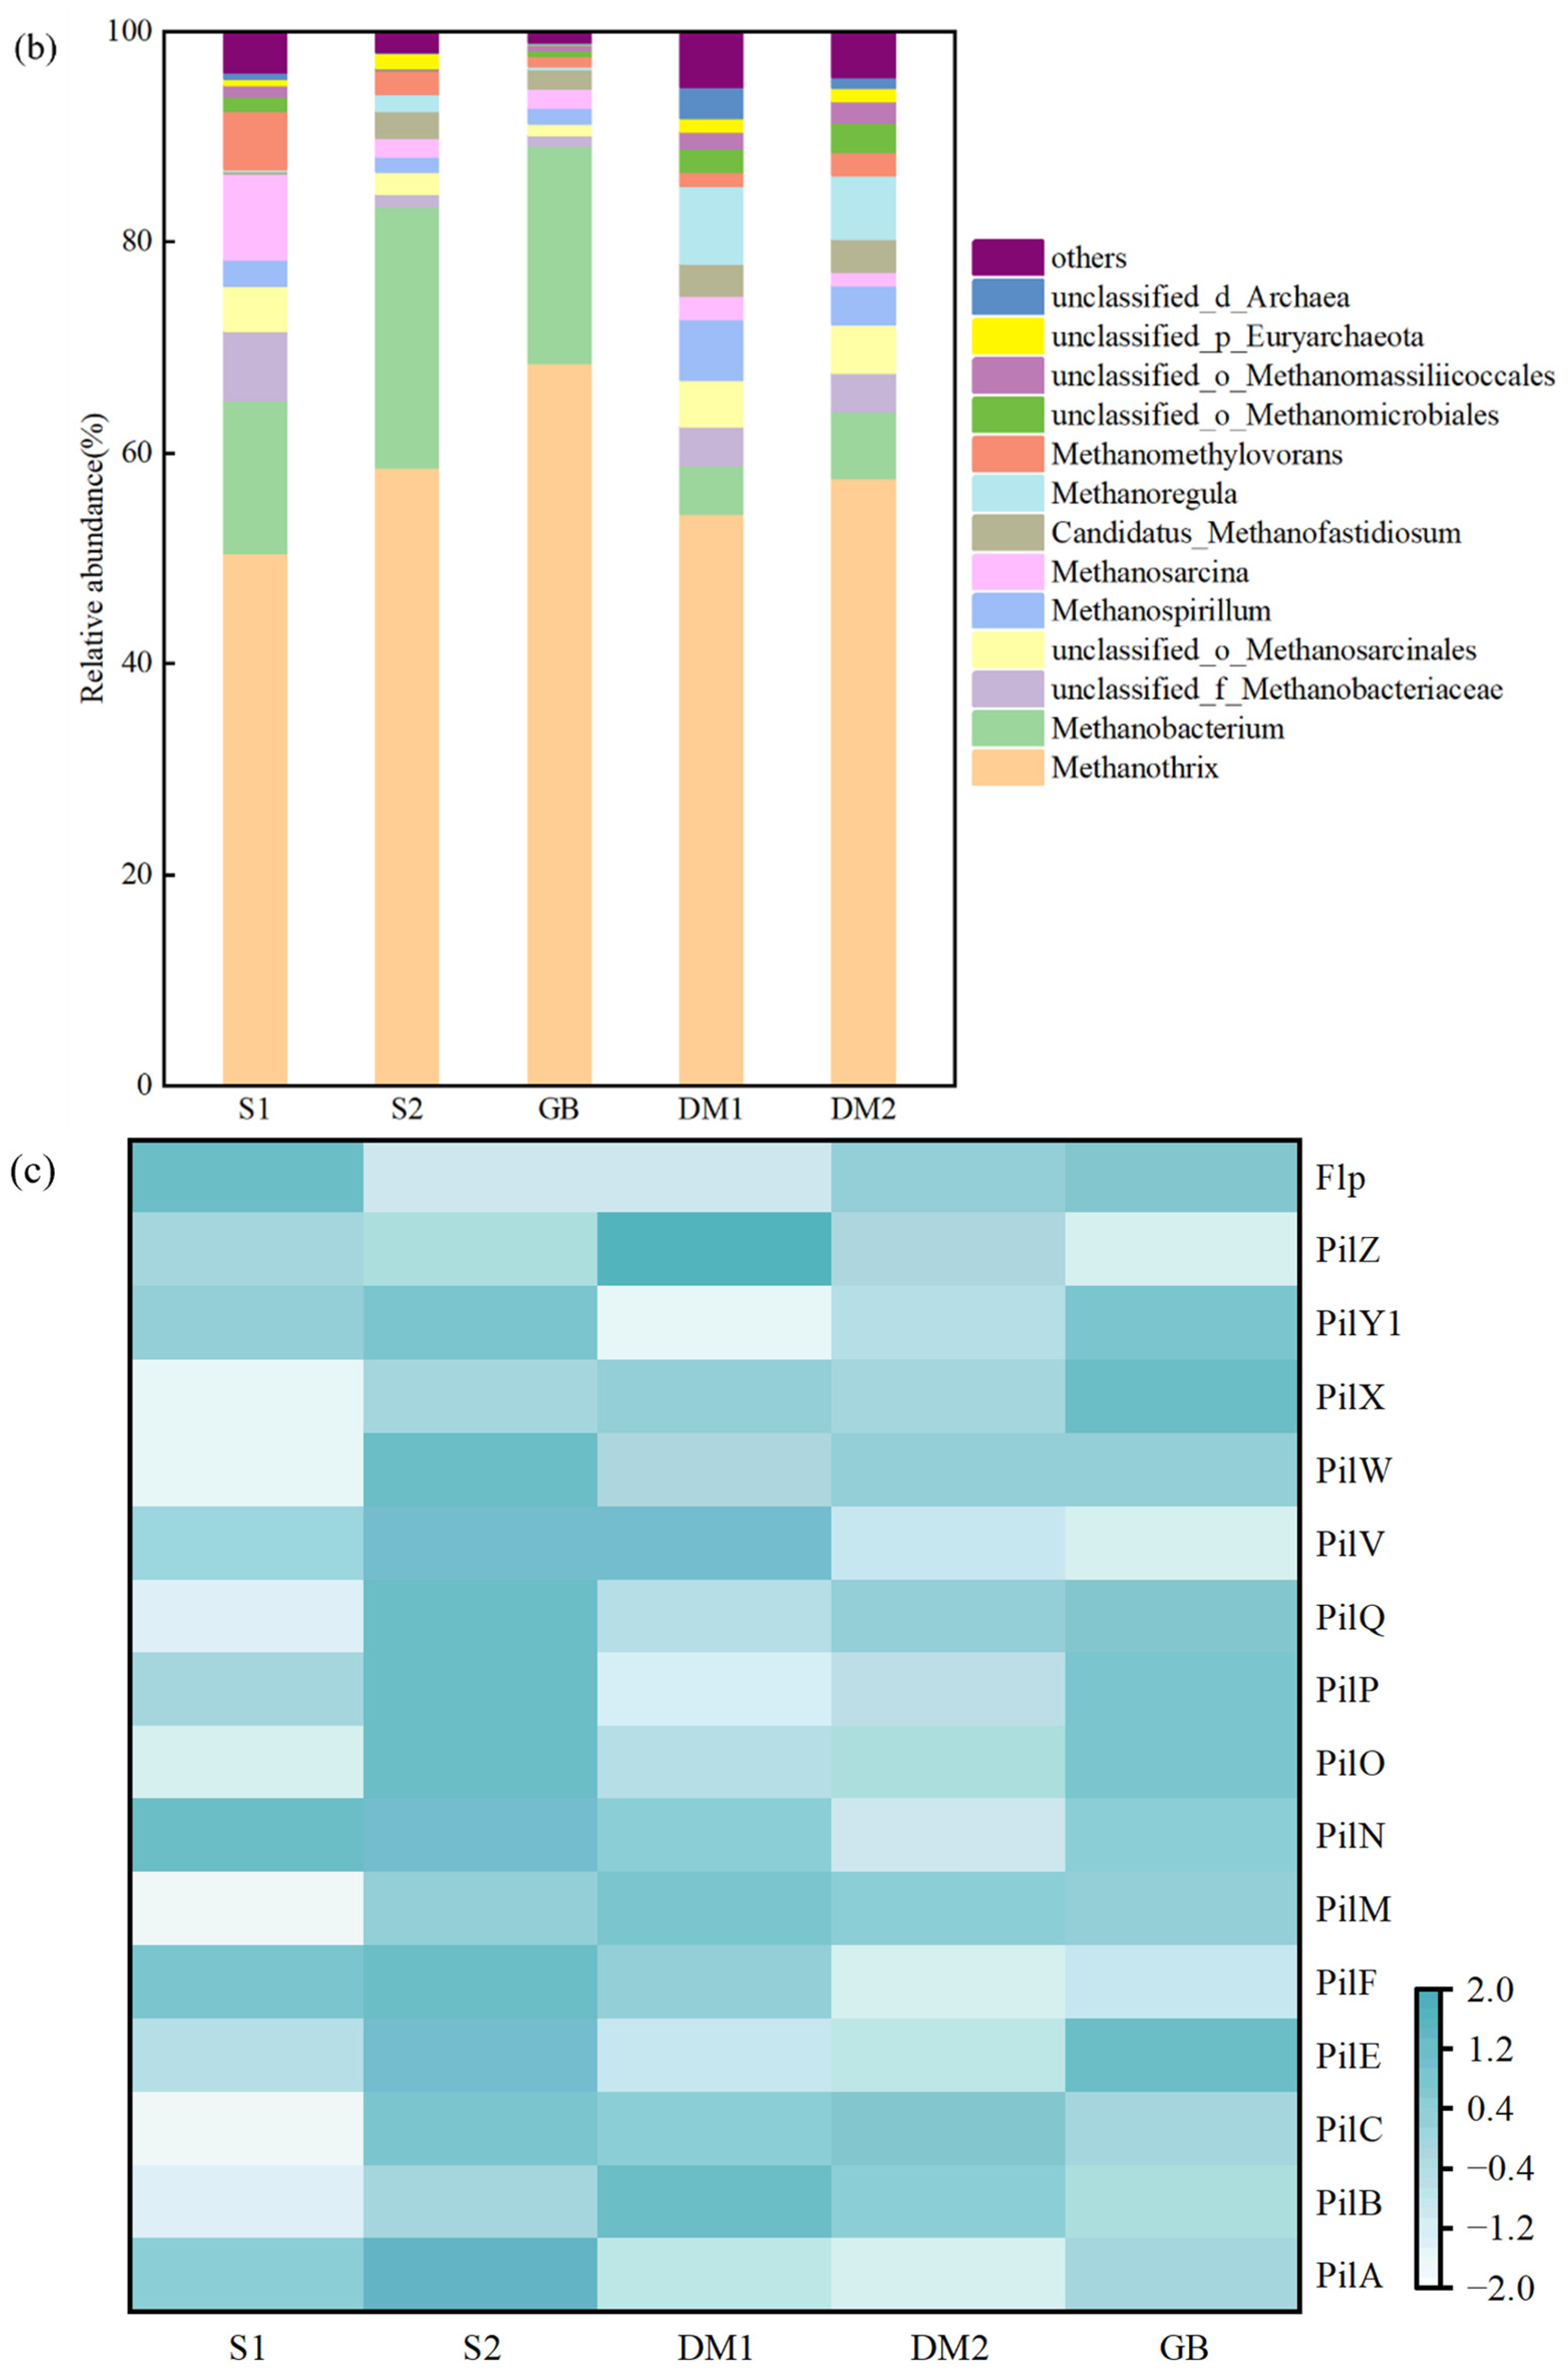
3.4.2. Microbial Community Analysis

Metagenomic sequencing analyses can simultaneously detect the DNA of all the microorganisms in a biomass sample, so the abundance of the bacteria and archaea in the anaerobic sludge (S1, S2) and the GAC-biofilm (GB) of the AnDMBRs was compared. The abundance of the bacteria in S1, S2 and GB were 1.68 × 10⁷, 1.82 × 10⁷ and 1.92 × 10⁷ RPKM (reads per kilobase million [43]), respectively. The archaea abundance of S1, S2 and GB were 4.07 × 10⁶, 4.11 × 10⁶ and 4.25 × 10⁶ RPKM. GAC could promote the abundance of bacteria and archaea, which was in line with a previous study [44]. Figure 5a presents the bacterial community composition at the phylum level of the anaerobic sludge (S1, S2), GAC-biofilm (GB) and DM layer (DM1, DM2). The community composition of the five samples was similar, including Proteobacteria (S1, S2, GB, DM1 and DM2 of 37.5%, 18.9%, 16.5%, 30.8% and 31.0%), Chloroflexi (12.8%, 25.7%, 24.7%, 15.7% and 14.0%) and Bacteroidetes (9.9%, 14.4%, 18.6%, 6.1% and 8.4%), which was the same as previous results [45]. Adding GAC could reduce the relative amount of Proteobacteria in the anerobic sludge and GAC-biofilm and could increase the relative amounts of Bacteroidetes and Chloroflexi. Compared with the C-AnDMBR, the relative amount of the bacterial community in the DM layer of the G-AnDMBR did not change significantly because there was no direct contact between the GAC and the DM layer.
Figure 5b shows the changes in the archaea communities at the genus level in the five samples, namely S1, S2, GB, DM1 and DM2. Methanothrix (also known as Methanosaeta; S1, S2, GB, DM1 and DM2 of 50.5%, 58.7%, 68.6%, 54.3% and 57.7%) was found to be the main methanogen, indicating that acetoclastic methanogenesis was the dominant pathway. Compared with S1 (14.5%), the relative abundance of the hydrogenotrophic methanogens in S2 (Methanobacterium: 24.8%) increased because the proportion of Spirochaetes, whose products were H2 and CO2, increased [46]. In addition, Candidatus_Methanofastidiosum appeared in S2 (2.6%) and the GAC-biofilms (1.9%), possibly because the GAC provided a suitable environment for the growth of the methylotrophic methanogens. Compared with the sludge samples, the proportions of Methanothrix in DM1 and DM2 were similar; meanwhile, the proportions of Methanobacterium (14.5%, 24.8%, 20.6%, 4.5% and 6.4%) declined, and the proportions of Methanoregula (0.2%, 1.6%, 0.2%, 7.3% and 6.1%) increased.
Type IV pilus assembly proteins and/or conductive materials have been reported to directly participate in the DIET [44,47]; thus, the gene abundance of type IV pilus assembly proteins (PilA, PilB, etc.) was analyzed as shown in Figure 5c. Obviously, most of the gene abundance of the type IV pilus assembly proteins in S2 (higher abundance of pili such as PilA, PilB, PilC and PilM: 3262, 9894, 8262 and 4278 RPKM) was higher than that in S1 (2912, 8370, 4378 and 3318 RPKM), indicating that S2 produced more conductive pili to improve the DIET capacity [44], which was also confirmed by the high methanogenesis rate of the GAC-AnDMBR. However, the abundance of the related genes in the GAC-biofilm (2738, 9646, 7020 and 4274 RPKM) was lower than that in S2 because the electrons were transferred directly to the methanogens participating in the DIET through the GAC (such as Methanothrix and Methanosacrcina) [45]. It was observed from the figure that there was little discrepancy in the gene abundance in the DM layer between the two phases because there was no obvious discrepancy in the bacterial communities in the DM layers.

4. Conclusions

The performance of the C-AnDMBR and G-AnDMBR in treating real domestic wastewater was compared to explore the advantages of GAC. Due to the adsorption effect of GAC and the action of the GAC associated biofilm, the removal performance and filtration performance of the G-AnDMBR were improved as verified by the long-term operation. In particular, the addition of GAC could enhance the effluent quality of the G-AnDMBR before the formation of a stable dynamic membrane. Although GAC could improve the SMA of the anaerobic sludge, the dissolved methane production still accounted for 79% of the total methane production due to the limited mass transfer of the upflow reactor configuration. GAC could conduct the DIET in the following two aspects: (1) by functioning as conductive materials that could directly take part in the electron transport or (2) by enriching the specific functional microorganisms that could conduct the electron transfer by producing conductive pili. Therefore, adding GAC was verified as a practical and promising method to enhance the process performance of the AnDMBRs via playing multiple roles.

Author Contributions

Conceptualization, Y.H.; methodology, L.L., Y.Q. and D.C.; investigation, L.L., Y.Q. and D.C.; writing—original draft preparation, L.L.; writing—review and editing, Y.H., R.C. and J.J.; visualization, L.L.; supervision, Y.H. and Y.Y.; funding acquisition, Y.H. and Y.Y. All authors have read and agreed to the published version of the manuscript.

Funding

This work was supported by the Natural Science Foundation of the Shaanxi Province (grant no. 2022JM-237), the China Postdoctoral Science Foundation (grant no. 2021MD703870) and the Shaanxi Provincial Program for Innovative Research Team (no. 2019TD-025).

Institutional Review Board Statement

Not applicable.

Informed Consent Statement

Not applicable.

Data Availability Statement

The data that supported the findings of this study are available from the corresponding author upon reasonable request.

Conflicts of Interest

The authors declare no conflict of interest.

References

  1. Ali, M.; Khan, S.J.; Mehbub Malik, S.; Shahzad, H.M.A.; Visvanathan, C. Up-concentration of wastewater to maximize biogas potential: A step towards positive energy wastewater treatment. J. Water Proc. Eng. 2020, 36, 101246. [Google Scholar] [CrossRef]
  2. Ansari, A.J.; Hai, F.I.; Guo, W.; Ngo, H.H.; Price, W.E.; Nghiem, L.D. Factors governing the pre-concentration of wastewater using forward osmosis for subsequent resource recovery. Sci. Total Environ. 2016, 566–567, 559–566. [Google Scholar] [CrossRef] [PubMed]
  3. Aslam, A.; Khan, S.J.; Shahzad, H.M.A. Anaerobic membrane bioreactors (AnMBRs) for municipal wastewater treatment- potential benefits, constraints, and future perspectives: An updated review. Sci. Total Environ. 2022, 802, 149612. [Google Scholar] [CrossRef]
  4. Lei, Z.; Yang, S.; Li, Y.Y.; Wen, W.; Wang, X.C.; Chen, R. Application of anaerobic membrane bioreactors to municipal wastewater treatment at ambient temperature: A review of achievements, challenges, and perspectives. Bioresour. Technol. 2018, 267, 756–768. [Google Scholar] [CrossRef]
  5. Gouveia, J.; Plaza, F.; Garralon, G.; Fdz-Polanco, F.; Pena, M. Long-term operation of a pilot scale anaerobic membrane bioreactor (AnMBR) for the treatment of municipal wastewater under psychrophilic conditions. Bioresour. Technol. 2015, 185, 225–233. [Google Scholar] [CrossRef]
  6. Hu, Y.; Cai, X.; Xue, Y.; Du, R.; Ji, J.; Chen, R.; Sano, D.; Li, Y.-Y. Recent developments of anaerobic membrane bioreactors for municipal wastewater treatment and bioenergy recovery: Focusing on novel configurations and energy balance analysis. J. Clean. Prod. 2022, 356, 131856. [Google Scholar] [CrossRef]
  7. Chen, C.; Guo, W.; Ngo, H.H.; Lee, D.-J.; Tung, K.-L.; Jin, P.; Wang, J.; Wu, Y. Challenges in biogas production from anaerobic membrane bioreactors. Renew. Energy 2016, 98, 120–134. [Google Scholar] [CrossRef]
  8. Siddiqui, M.A.; Biswal, B.K.; Saleem, M.; Guan, D.; Iqbal, A.; Wu, D.; Khanal, S.K.; Chen, G. Anaerobic self-forming dynamic membrane bioreactors (AnSFDMBRs) for wastewater treatment—Recent advances, process optimization and perspectives. Bioresour. Technol. 2021, 332, 125101. [Google Scholar] [CrossRef]
  9. Hu, Y.; Wang, X.C.; Ngo, H.H.; Sun, Q.; Yang, Y. Anaerobic dynamic membrane bioreactor (AnDMBR) for wastewater treatment: A review. Bioresour. Technol. 2018, 247, 1107–1118. [Google Scholar] [CrossRef]
  10. Yang, Y.; Zang, Y.; Hu, Y.; Wang, X.C.; Ngo, H.H. Upflow anaerobic dynamic membrane bioreactor (AnDMBR) for wastewater treatment at room temperature and short HRTs: Process characteristics and practical applicability. Chem. Eng. J. 2020, 383, 123186. [Google Scholar] [CrossRef]
  11. Awual, M.R. A novel facial composite adsorbent for enhanced copper(II) detection and removal from wastewater. Chem. Eng. J. 2015, 266, 368–375. [Google Scholar] [CrossRef]
  12. Kubra, K.T.; Salman, M.S.; Znad, H.; Hasan, M.N. Efficient encapsulation of toxic dye from wastewater using biodegradable polymeric adsorbent. J. Mol. Liq. 2021, 329, 115541. [Google Scholar] [CrossRef]
  13. Lei, Z.; Ma, Y.; Wang, J.; Wang, X.C.; Li, Q.; Chen, R. Biochar addition supports high digestion performance and low membrane fouling rate in an anaerobic membrane bioreactor under low temperatures. Bioresour. Technol. 2021, 330, 124966. [Google Scholar] [CrossRef] [PubMed]
  14. Yang, S.; Zhang, Q.; Lei, Z.; Wen, W.; Huang, X.; Chen, R. Comparing powdered and granular activated carbon addition on membrane fouling control through evaluating the impacts on mixed liquor and cake layer properties in anaerobic membrane bioreactors. Bioresour. Technol. 2019, 294, 122137. [Google Scholar] [CrossRef] [PubMed]
  15. Zhang, Y.; Zhang, L.; Guo, B.; Zhou, Y.; Gao, M.; Sharaf, A.; Liu, Y. Granular activated carbon stimulated microbial physiological changes for enhanced anaerobic digestion of municipal sewage. Chem. Eng. J. 2020, 400, 125838. [Google Scholar] [CrossRef]
  16. Zhang, Y.; Guo, B.; Zhang, L.; Zhang, H.; Liu, Y. Microbial community dynamics in granular activated carbon enhanced up-flow anaerobic sludge blanket (UASB) treating municipal sewage under sulfate reducing and psychrophilic conditions. Chem. Eng. J. 2021, 405, 126975. [Google Scholar] [CrossRef]
  17. Lei, Z.; Yang, S.; Li, X.; Wen, W.; Huang, X.; Yang, Y.; Wang, X.; Li, Y.Y.; Sano, D.; Chen, R. Revisiting the effects of powdered activated carbon on membrane fouling mitigation in an anaerobic membrane bioreactor by evaluating long-term impacts on the surface layer. Water Res. 2019, 167, 115137. [Google Scholar] [CrossRef]
  18. Chen, C.; Sun, M.; Liu, Z.; Zhang, J.; Xiao, K.; Zhang, X.; Song, G.; Chang, J.; Liu, G.; Wang, H.; et al. Robustness of granular activated carbon-synergized anaerobic membrane bioreactor for pilot-scale application over a wide seasonal temperature change. Water Res. 2021, 189, 116552. [Google Scholar] [CrossRef]
  19. Salman, M.S.; Hasan, M.N.; Kubra, K.T.; Hasan, M.M. Optical detection and recovery of Yb(III) from waste sample using novel sensor ensemble nanomaterials. Microchem. J. 2021, 162, 105868. [Google Scholar] [CrossRef]
  20. Wang, G.; Li, Q.; Dzakpasu, M.; Gao, X.; Yuwen, C.; Wang, X.C. Impacts of different biochar types on hydrogen production promotion during fermentative co-digestion of food wastes and dewatered sewage sludge. Waste Manag. 2018, 80, 73–80. [Google Scholar] [CrossRef]
  21. Nepa, C. Water and Wastewater Monitoring Methods, 4th ed.; Chinese Environmental Science Publishing House: Beijing, China, 2002. [Google Scholar]
  22. Gaudy, A.F. Colorimetric Determination of Protein and Carbohydrate. Ind. Water Wastes 1962, 7, 17–22. [Google Scholar]
  23. Lowry, O.; Rosebrough, N.; Farr, A.L.; Randall, R. Protein Measurement with the Folin Phenol Reagent. J. Biol. Chem. 1951, 193, 265–275. [Google Scholar] [CrossRef] [PubMed]
  24. Hu, Y.; Du, R.; Nitta, S.; Ji, J.; Rong, C.; Cai, X.; Qin, Y.; Li, Y.-Y. Identification of sustainable filtration mode of an anaerobic membrane bioreactor for wastewater treatment towards low-fouling operation and efficient bioenergy production. J. Clean. Prod. 2021, 329, 129686. [Google Scholar] [CrossRef]
  25. Noguchi, H.; Park, J.; Takagi, T. MetaGene: Prokaryotic gene finding from environmental genome shotgun sequences. Nucleic Acids Res. 2006, 34, 5623–5630. [Google Scholar] [CrossRef] [PubMed] [Green Version]
  26. Kanehisa, M.; Sato, Y.; Kawashima, M.; Furumichi, M.; Tanabe, M. KEGG as a reference resource for gene and protein annotation. Nucleic Acids Res. 2016, 44, D457–D462. [Google Scholar] [CrossRef] [Green Version]
  27. Buchfink, B.; Reuter, K.; Drost, H.G. Sensitive protein alignments at tree-of-life scale using DIAMOND. Nat. Methods 2021, 18, 366–368. [Google Scholar] [CrossRef]
  28. Fu, L.; Niu, B.; Zhu, Z.; Wu, S.; Li, W. CD-HIT: Accelerated for clustering the next-generation sequencing data. Bioinformatics 2012, 28, 3150–3152. [Google Scholar] [CrossRef]
  29. Zhang, Y.; Guo, B.; Dang, H.; Zhang, L.; Sun, H.; Yu, N.; Tang, Y.; Liu, Y. Roles of granular activated carbon (GAC) and operational factors on active microbiome development in anaerobic reactors. Bioresour. Technol. 2022, 343, 126104. [Google Scholar] [CrossRef]
  30. Yang, Y.; Deng, W.; Hu, Y.; Chen, R.; Wang, X.C. Gravity-driven high flux filtration behavior and microbial community of an integrated granular activated carbon and dynamic membrane bioreactor for domestic wastewater treatment. Sci. Total Environ. 2022, 825, 153930. [Google Scholar] [CrossRef]
  31. Hu, Y.; Yang, Y.; Yu, S.; Wang, X.C.; Tang, J. Psychrophilic anaerobic dynamic membrane bioreactor for domestic wastewater treatment: Effects of organic loading and sludge recycling. Bioresour. Technol. 2018, 270, 62–69. [Google Scholar] [CrossRef]
  32. Alibardi, L.; Bernava, N.; Cossu, R.; Spagni, A. Anaerobic dynamic membrane bioreactor for wastewater treatment at ambient temperature. Chem. Eng. J. 2016, 284, 130–138. [Google Scholar] [CrossRef]
  33. Smith, A.L.; Skerlos, S.J.; Raskin, L. Psychrophilic anaerobic membrane bioreactor treatment of domestic wastewater. Water Res. 2013, 47, 1655–1665. [Google Scholar] [CrossRef]
  34. Zhang, L.; De Vrieze, J.; Hendrickx, T.L.G.; Wei, W.; Temmink, H.; Rijnaarts, H.; Zeeman, G. Anaerobic treatment of raw domestic wastewater in a UASB-digester at 10 °C and microbial community dynamics. Chem. Eng. J. 2018, 334, 2088–2097. [Google Scholar] [CrossRef]
  35. Liu, T.; Ou, H.; Su, K.; Hu, Z.; He, C.; Wang, W. Promoting direct interspecies electron transfer and acetoclastic methanogenesis for enhancing anaerobic digestion of butanol octanol wastewater by coupling granular activated carbon and exogenous hydrogen. Bioresour. Technol. 2021, 337, 125417. [Google Scholar] [CrossRef]
  36. Zhang, Y.; Guo, B.; Zhang, L.; Liu, Y. Key syntrophic partnerships identified in a granular activated carbon amended UASB treating municipal sewage under low temperature conditions. Bioresour. Technol. 2020, 312, 123556. [Google Scholar] [CrossRef]
  37. Ding, A.; Liang, H.; Qu, F.; Bai, L.; Li, G.; Ngo, H.H.; Guo, W. Effect of granular activated carbon addition on the effluent properties and fouling potentials of membrane-coupled expanded granular sludge bed process. Bioresour. Technol. 2014, 171, 240–246. [Google Scholar] [CrossRef]
  38. Alibardi, L.; Cossu, R.; Saleem, M.; Spagni, A. Development and permeability of a dynamic membrane for anaerobic wastewater treatment. Bioresour. Technol. 2014, 161, 236–244. [Google Scholar] [CrossRef]
  39. Jiao, C.; Hu, Y.; Zhang, X.; Jing, R.; Zeng, T.; Chen, R.; Li, Y.Y. Process characteristics and energy self-sufficient operation of a low-fouling anaerobic dynamic membrane bioreactor for up-concentrated municipal wastewater treatment. Sci. Total Environ. 2022, 843, 156992. [Google Scholar] [CrossRef]
  40. Yu, Z.; Hu, Y.; Dzakpasu, M.; Wang, X.C.; Ngo, H.H. Dynamic membrane bioreactor performance enhancement by powdered activated carbon addition: Evaluation of sludge morphological, aggregative and microbial properties. J. Environ. Sci. 2019, 75, 73–83. [Google Scholar] [CrossRef]
  41. Wang, Z.; Wu, Z.; Yin, X.; Tian, L. Membrane fouling in a submerged membrane bioreactor (MBR) under sub-critical flux operation: Membrane foulant and gel layer characterization. J. Membr. Sci. 2008, 325, 238–244. [Google Scholar] [CrossRef]
  42. Hu, Y.; Zang, Y.; Yang, Y.; Duan, A.; Wang, X.C.; Ngo, H.H.; Li, Y.Y.; Du, R. Zero-valent iron addition in anaerobic dynamic membrane bioreactors for preconcentrated wastewater treatment: Performance and impact. Sci. Total Environ. 2020, 742, 140687. [Google Scholar] [CrossRef] [PubMed]
  43. Lawson, C.E.; Wu, S.; Bhattacharjee, A.S.; Hamilton, J.J.; McMahon, K.D.; Goel, R.; Noguera, D.R. Metabolic network analysis reveals microbial community interactions in anammox granules. Nat. Commun. 2017, 8, 15416. [Google Scholar] [CrossRef] [PubMed] [Green Version]
  44. Dang, H.; Yu, N.; Mou, A.; Zhang, L.; Guo, B.; Liu, Y. Metagenomic insights into direct interspecies electron transfer and quorum sensing in blackwater anaerobic digestion reactors supplemented with granular activated carbon. Bioresour. Technol. 2022, 352, 127113. [Google Scholar] [CrossRef] [PubMed]
  45. Park, J.H.; Park, J.H.; Je Seong, H.; Sul, W.J.; Jin, K.H.; Park, H.D. Metagenomic insight into methanogenic reactors promoting direct interspecies electron transfer via granular activated carbon. Bioresour. Technol. 2018, 259, 414–422. [Google Scholar] [CrossRef]
  46. Wu, W.; Chen, G.; Wang, Z. Enhanced sludge digestion using anaerobic dynamic membrane bioreactor: Effects of hydraulic retention time. Energy 2022, 261, 125396. [Google Scholar] [CrossRef]
  47. Yin, Q.; Gu, M.; Hermanowicz, S.W.; Hu, H.; Wu, G. Potential interactions between syntrophic bacteria and methanogens via type IV pili and quorum-sensing systems. Environ. Int. 2020, 138, 105650. [Google Scholar] [CrossRef]
Figure 1. Pollutant removal and pH variation of the AnDMBRs: (a) COD removal; (b) protein removal; (c) polysaccharide removal and (d) variation in pH.
Sustainability 15 01055 g001
Figure 2. Biogas production of the AnDMBRs: (a) biogas production and (b) biogas composition.
Sustainability 15 01055 g002
Figure 3. Filtration performance of the AnDMBRs: (a) the variation of TMP and flux and (b) the variation of turbidity.
Sustainability 15 01055 g003
Figure 4. Morphology and composition of dynamic membrane and GAC: (a) digital pictures of dynamic membrane; (b) SEM pictures of dynamic membrane; (c) SEM pictures of GAC; (d) EDX profile of dynamic membrane and (e) EDX profile of GAC.
Sustainability 15 01055 g004
Figure 5. Metagenomic analysis of microorganism in sludge samples: (a) bacterial phylum; (b) archaea genus and (c) genetic composition of type IV pilus assembly proteins. (S1, S2, GB, DM1 and DM2 refer to the sludge of C-AnDMBR and G-AnDMBR, the GAC- biofilm and the DM layer of C-AnDMBR and G-AnDMBR, respectively.)
Sustainability 15 01055 g005aSustainability 15 01055 g005b
Table 1. Operational conditions of the AnDMBRs during two experimental phases.
ParameterPhase I (C-AnDMBR)Phase II (G-AnDMBR)
Period (d)1–124125–212
Temperature (°C)25 ± 1
HRT (h)12
Flux (LMH)15
Filtration to relaxation time ratio4:1
Initial MLSS (g/L)10.20 ± 0.1412.20 ± 0.17
Initial MLVSS (g/L)4.07 ± 0.035.90 ± 0.07
Table 2. Removal performance of concerned pollutants of the AnDMBRs.
ParameterPhase I (C-AnDMBR)Phase II (G-AnDMBR)
InfluentSupernatantEffluentRemoval RateInfluentSupernatantEffluentRemoval Rate
TCOD (mg/L)456.7 ± 151.2107.8 ± 32.381.6 ± 27.782.1 ± 5.1%454.7 ± 79.285.1 ± 18.459.6 ± 12.586.9 ± 2.9%
Polysaccharide (mg/L)7.4 ± 1.54.6 ± 1.34.1 ± 1.244.6 ± 8.9%7.1 ± 1.04.2 ± 0.93.6 ± 0.749.3 ± 8.6%
Protein (mg/L)34.0 ± 5.122.4 ± 3.619.7 ± 3.042.1 ± 6.0%29.0 ± 5.718.2 ± 4.115.4 ± 3.946.9 ± 6.3%
TN (mg/L)54.6 ± 13.849.2 ± 12.547.6 ± 12.412.8 ± 7.1%56.9 ± 8.350.1 ± 9.547.7 ± 9.016.2 ± 5.0%
NH4+-N (mg/L)44.6 ± 10.050.0 ± 9.548.3 ± 9.3-43.5 ± 6.344.9 ± 9.445.5 ± 8.0-
TP (mg/L)7.2 ± 1.95.9 ± 1.55.5 ± 1.323.6 ± 8.4%7.7 ± 1.56.0 ± 1.15.7 ± 1.126.0 ± 6.7%
PO4-P (mg/L)5.2 ± 0.85.6 ± 0.85.5 ± 0.9-4.8 ± 0.85.3 ± 0.85.3 ± 0.9-
pH7.94 ± 0.197.46 ± 0.297.69 ± 0.19-7.95 ± 0.097.53 ± 0.147.73 ± 0.06-
Turbidity (NTU)261.8 ± 106.188.0 ± 53.829.7 ± 11.588.7 ± 10.0%236.0 ± 26.243.0 ± 10.916.1 ± 4.893.2 ± 1.7%
Table 3. A summary of methanogenic performance.
ParameterPhase I (C-AnDMBR)Phase II (G-AnDMBR)
Biogas production (L/d)0.12 ± 0.080.17 ± 0.07
Methane production (L/d)0.08 ± 0.050.14 ± 0.04
Gaseous methane production rate (L CH4/g COD)0.03 ± 0.010.05 ± 0.01
Dissolved methane production rate (L CH4/g COD)0.17 ± 0.100.18 ± 0.08
Total methane production rate (L CH4/g COD)0.21 ± 0.110.23 ± 0.09
Disclaimer/Publisher’s Note: The statements, opinions and data contained in all publications are solely those of the individual author(s) and contributor(s) and not of MDPI and/or the editor(s). MDPI and/or the editor(s) disclaim responsibility for any injury to people or property resulting from any ideas, methods, instructions or products referred to in the content.

