
Mass and Volumetric Abrasive Wear Measurements of the Mining Conical Picks

Faculty of Mechanical Engineering and Robotics, AGH University of Science and Technology, al. Mickiewicz 30, 30-059 Krakow, Poland
*
Author to whom correspondence should be addressed.
Sustainability 2023, 15(1), 850; https://doi.org/10.3390/su15010850
Submission received: 9 December 2022
/
Revised: 26 December 2022
/
Accepted: 28 December 2022
/
Published: 3 January 2023
(This article belongs to the Special Issue Diagnostics and Nondestructive Testing as an Important Factor of Sustainability)
Abstract
:The wearing of cutting tools is a bottleneck of many branches in the industry. However, the tools used in the mining sector are extraordinarily prone to rapid deterioration since many rocks exhibit aggressive abrasive properties. A typical example of a fast wearing cutting tool is a conical pick. It is used in the mining industry and other businesses requiring rock cutting, such as in roadworks and tunnelling. Both manufacturers and users attempt to find a way to enhance the lifespan of the working surface of conical picks via different approaches, namely heat treatment, chemical treatment, work hardening, and hardfacing, etc. To correctly estimate the resistance to abrasive wear for a particular conical pick, one must select appropriate procedures and methods. By this time, the most common estimation method is to measure the mass loss before and after cutting, preserving the specified and constant conditions. This method was developed for users (mines) and manufacturers of cutting tools, especially conical picks. Alternative methods of assessing the picks’ wear are also sought. In this paper, the authors perform additional volumetric loss measurements via a photogrammetric approach, which results in a 3D scan of brand-new and exploited conical pick. Three different sets of four picks were measured both in the domain of mass loss and volume loss, and the results were compared. Slight differences in parameters C2 and C3 were found. Additionally, the authors enclose recommendations regarding the proper use of the methods mentioned above, mainly focusing on the ability to perform linear and angular measurements of the tool performed on the 3D scan.
1. Introduction
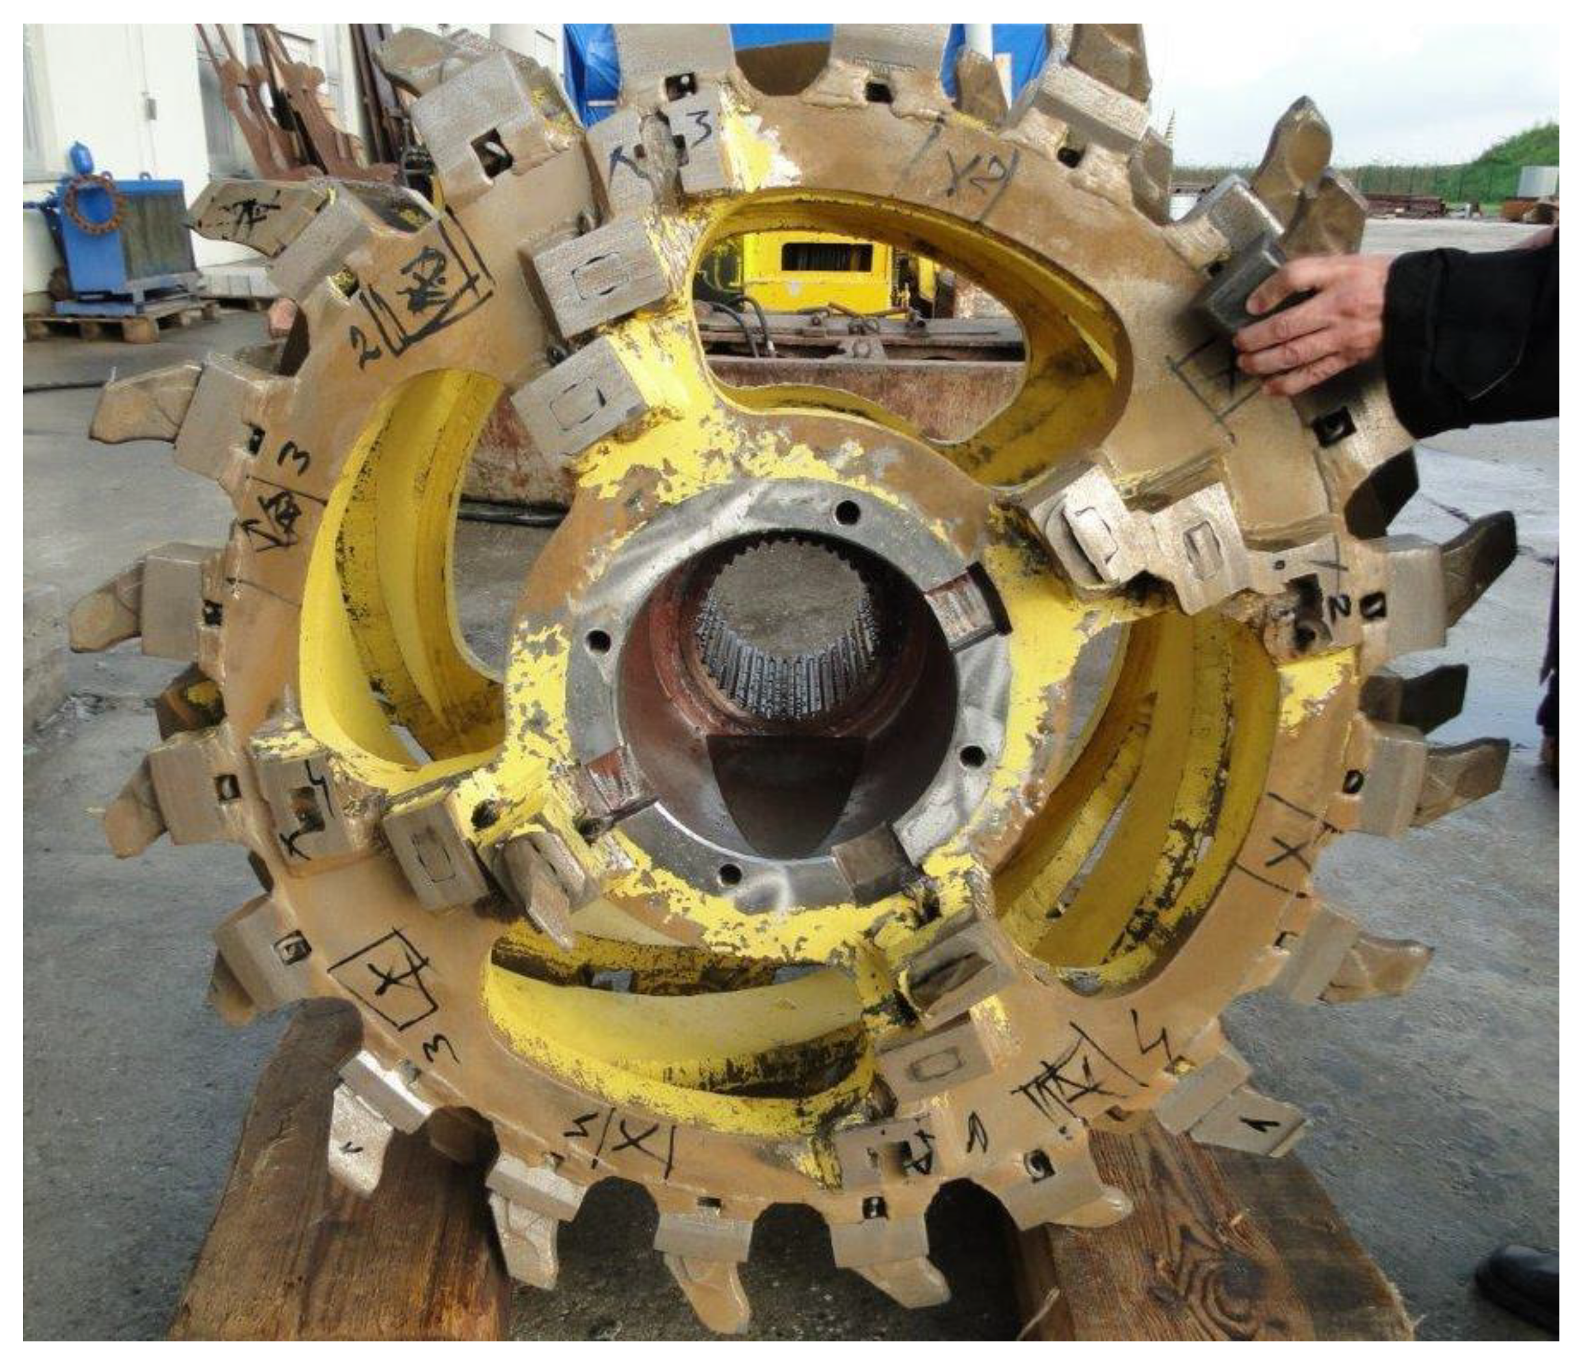
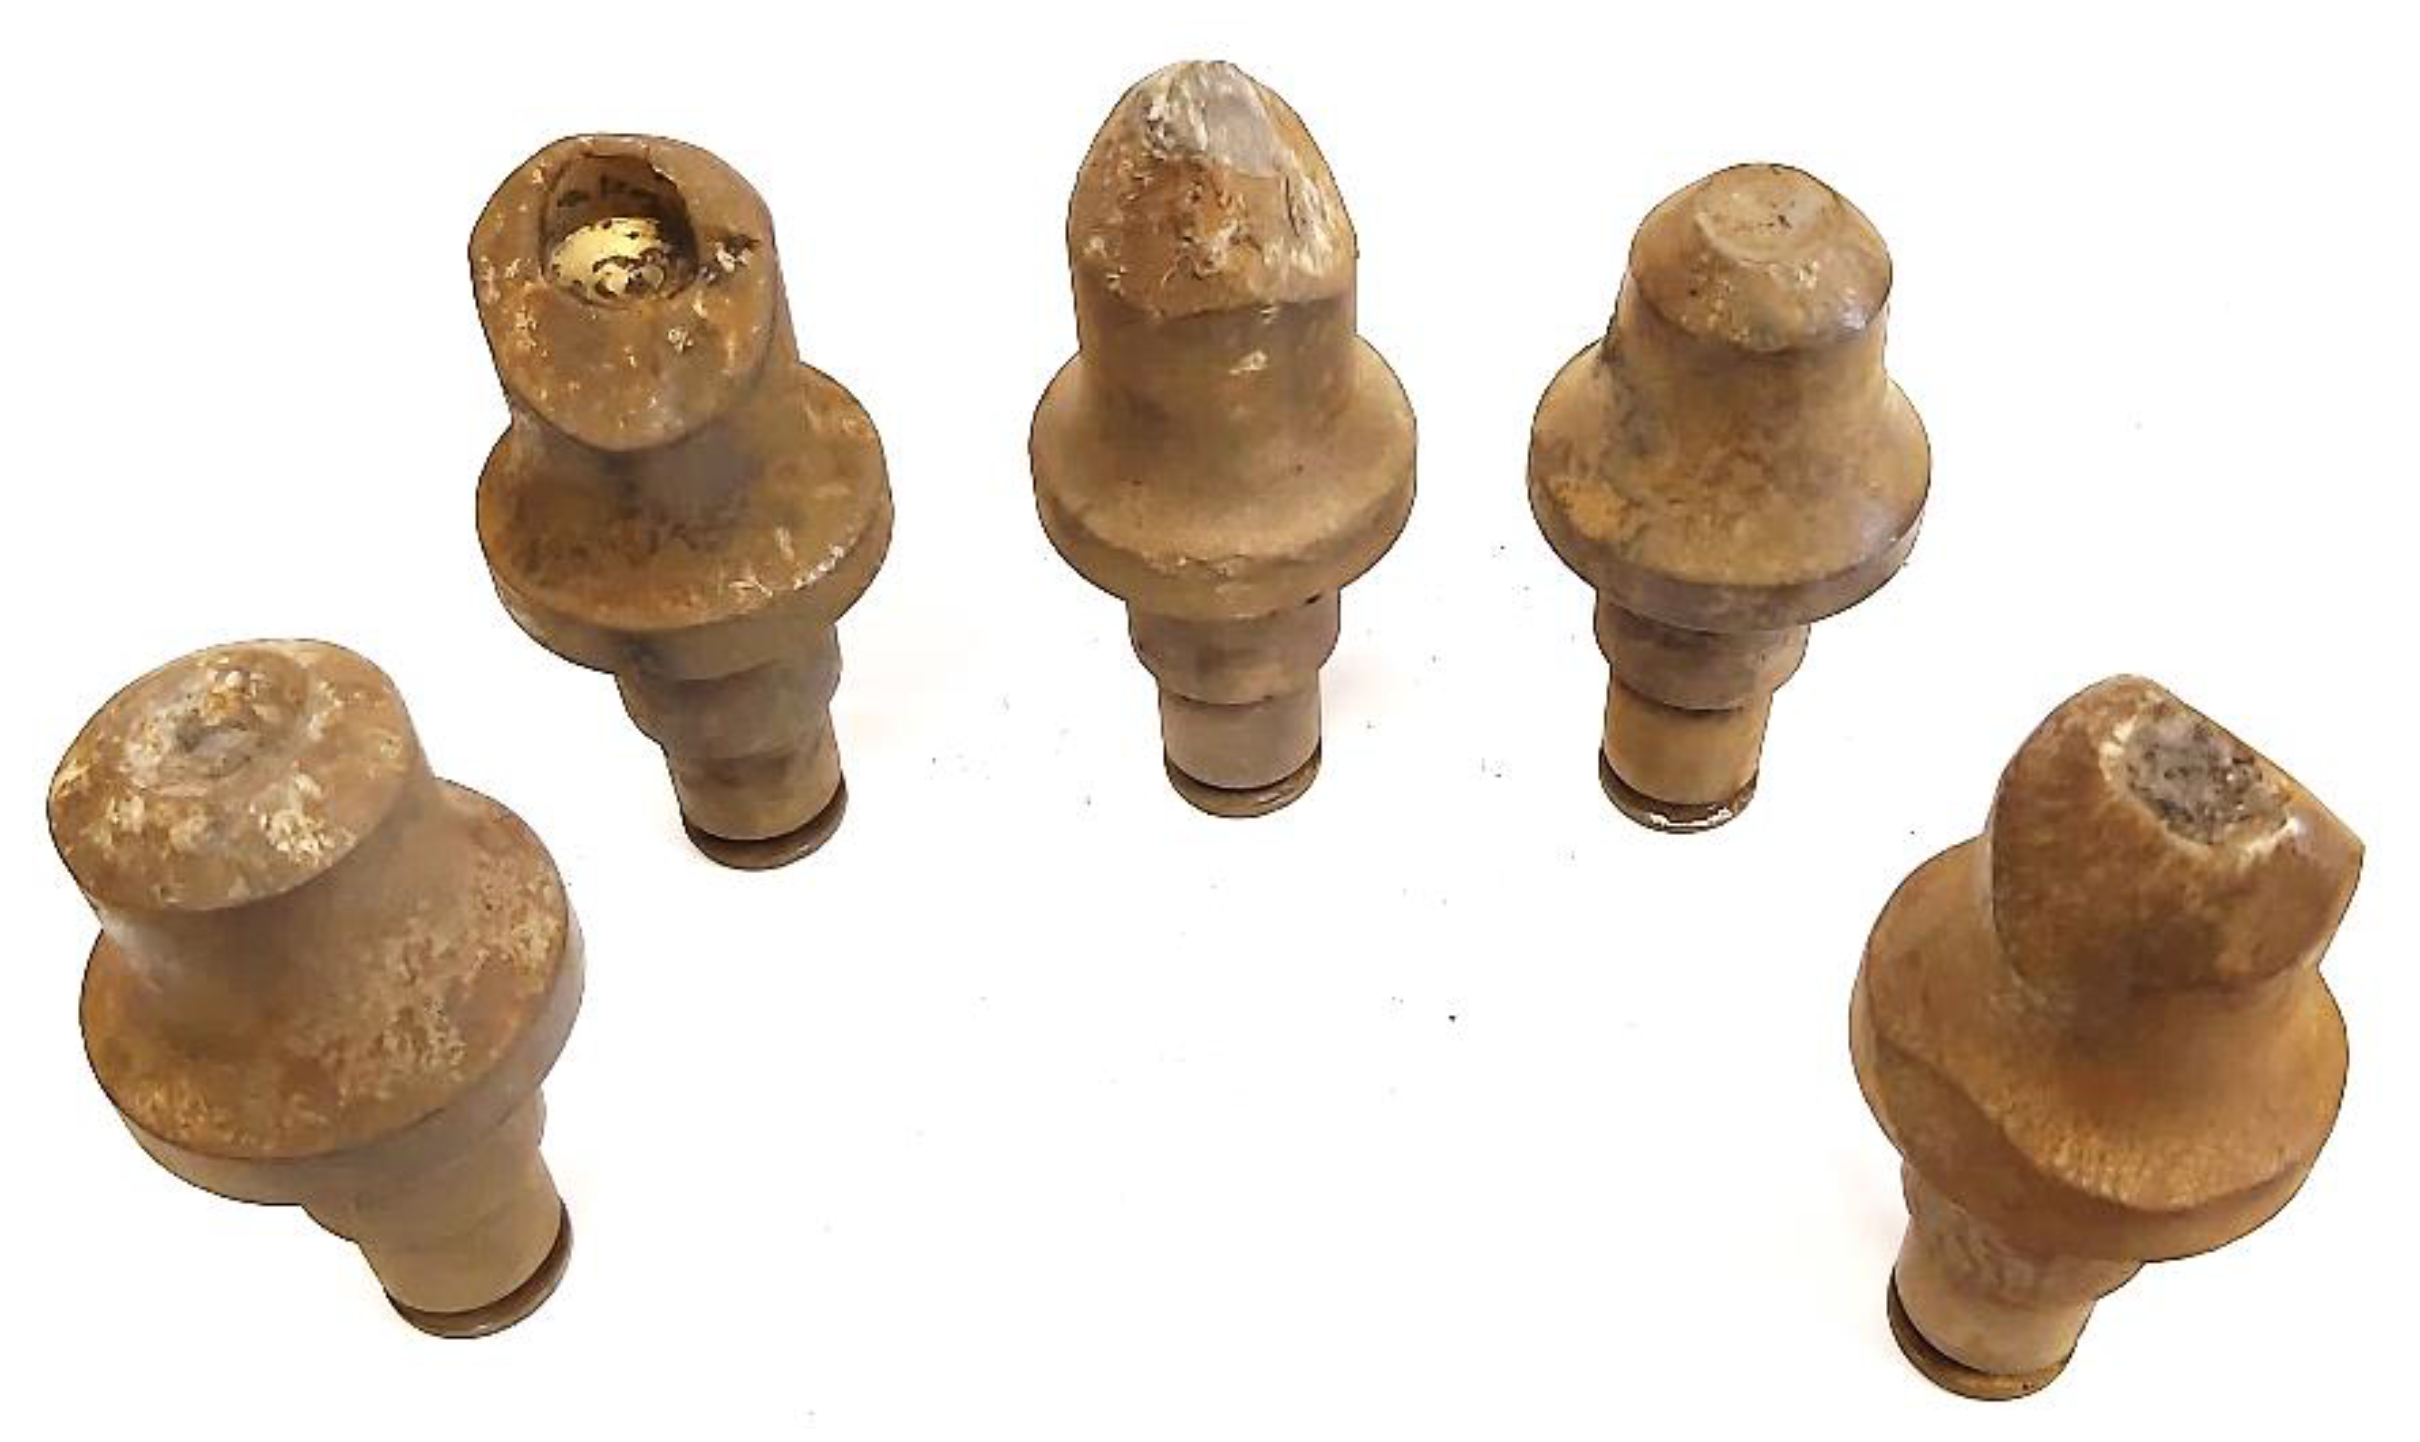
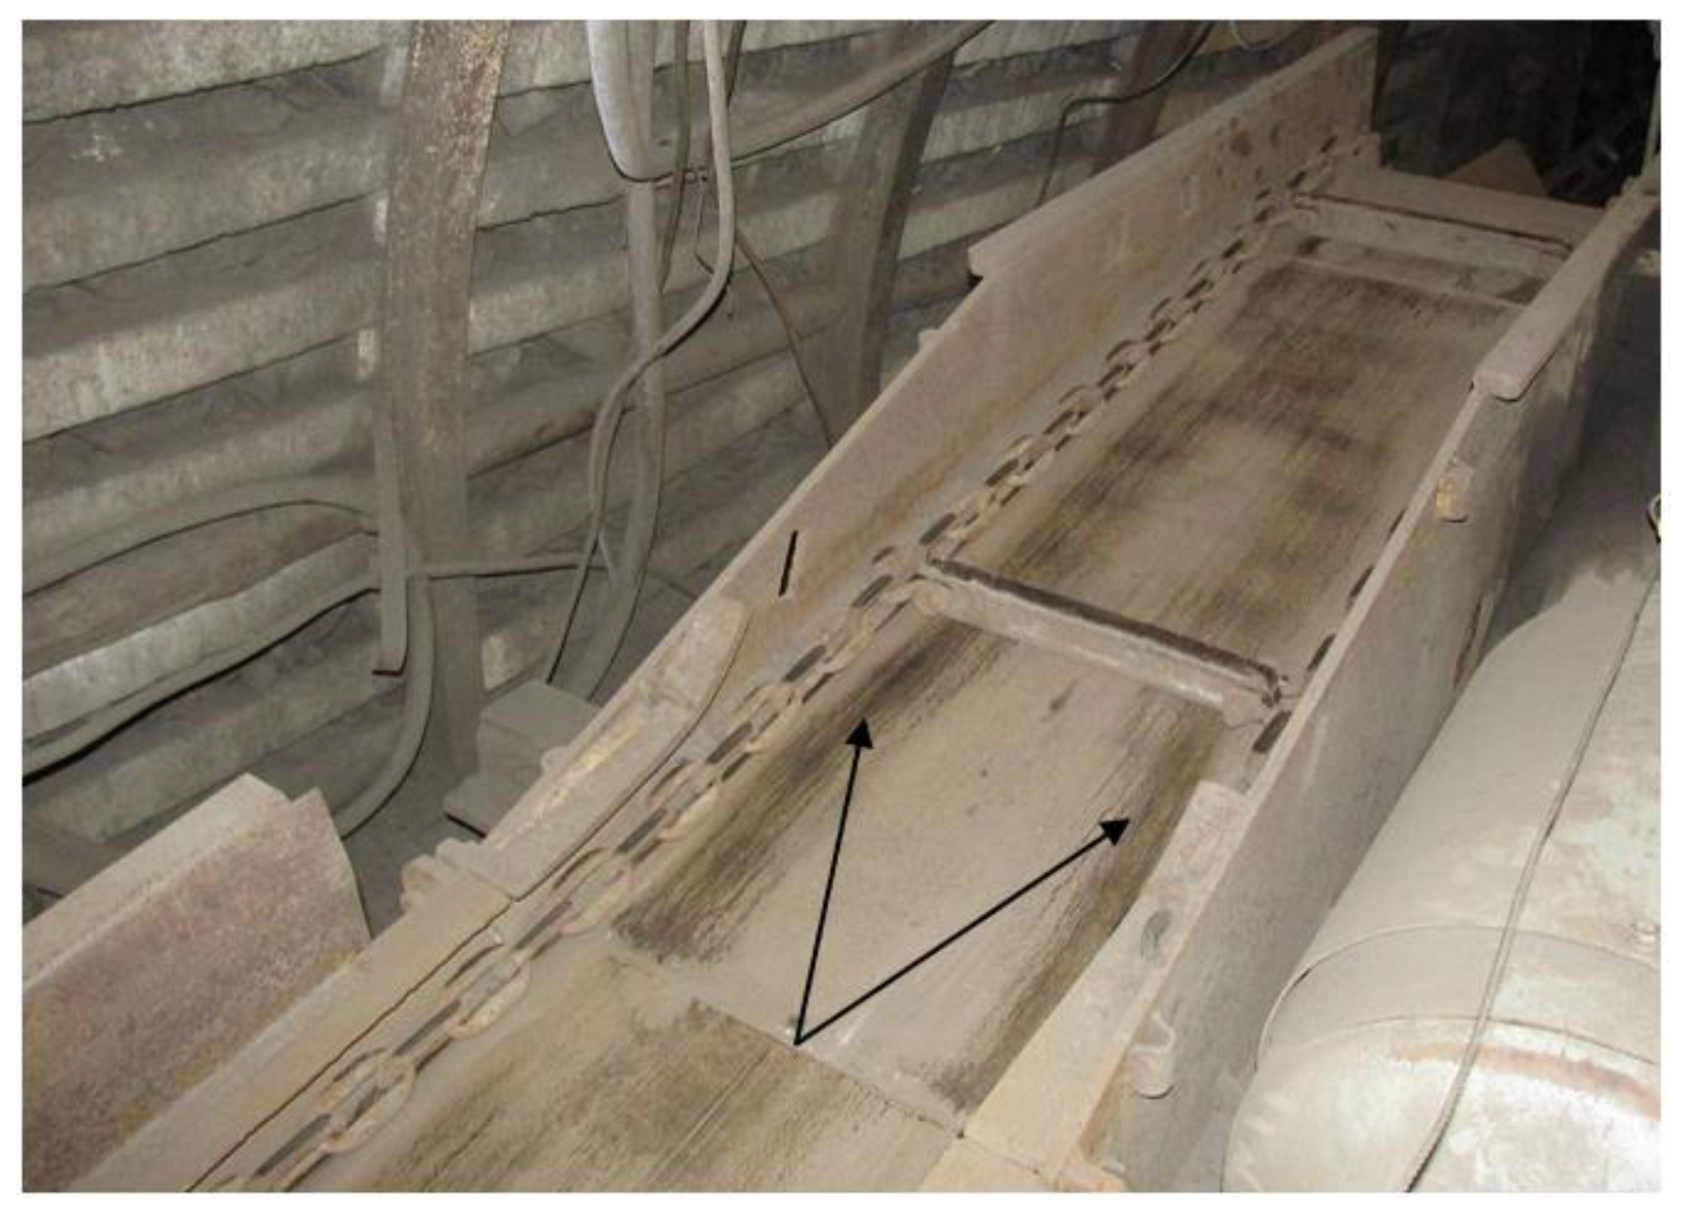
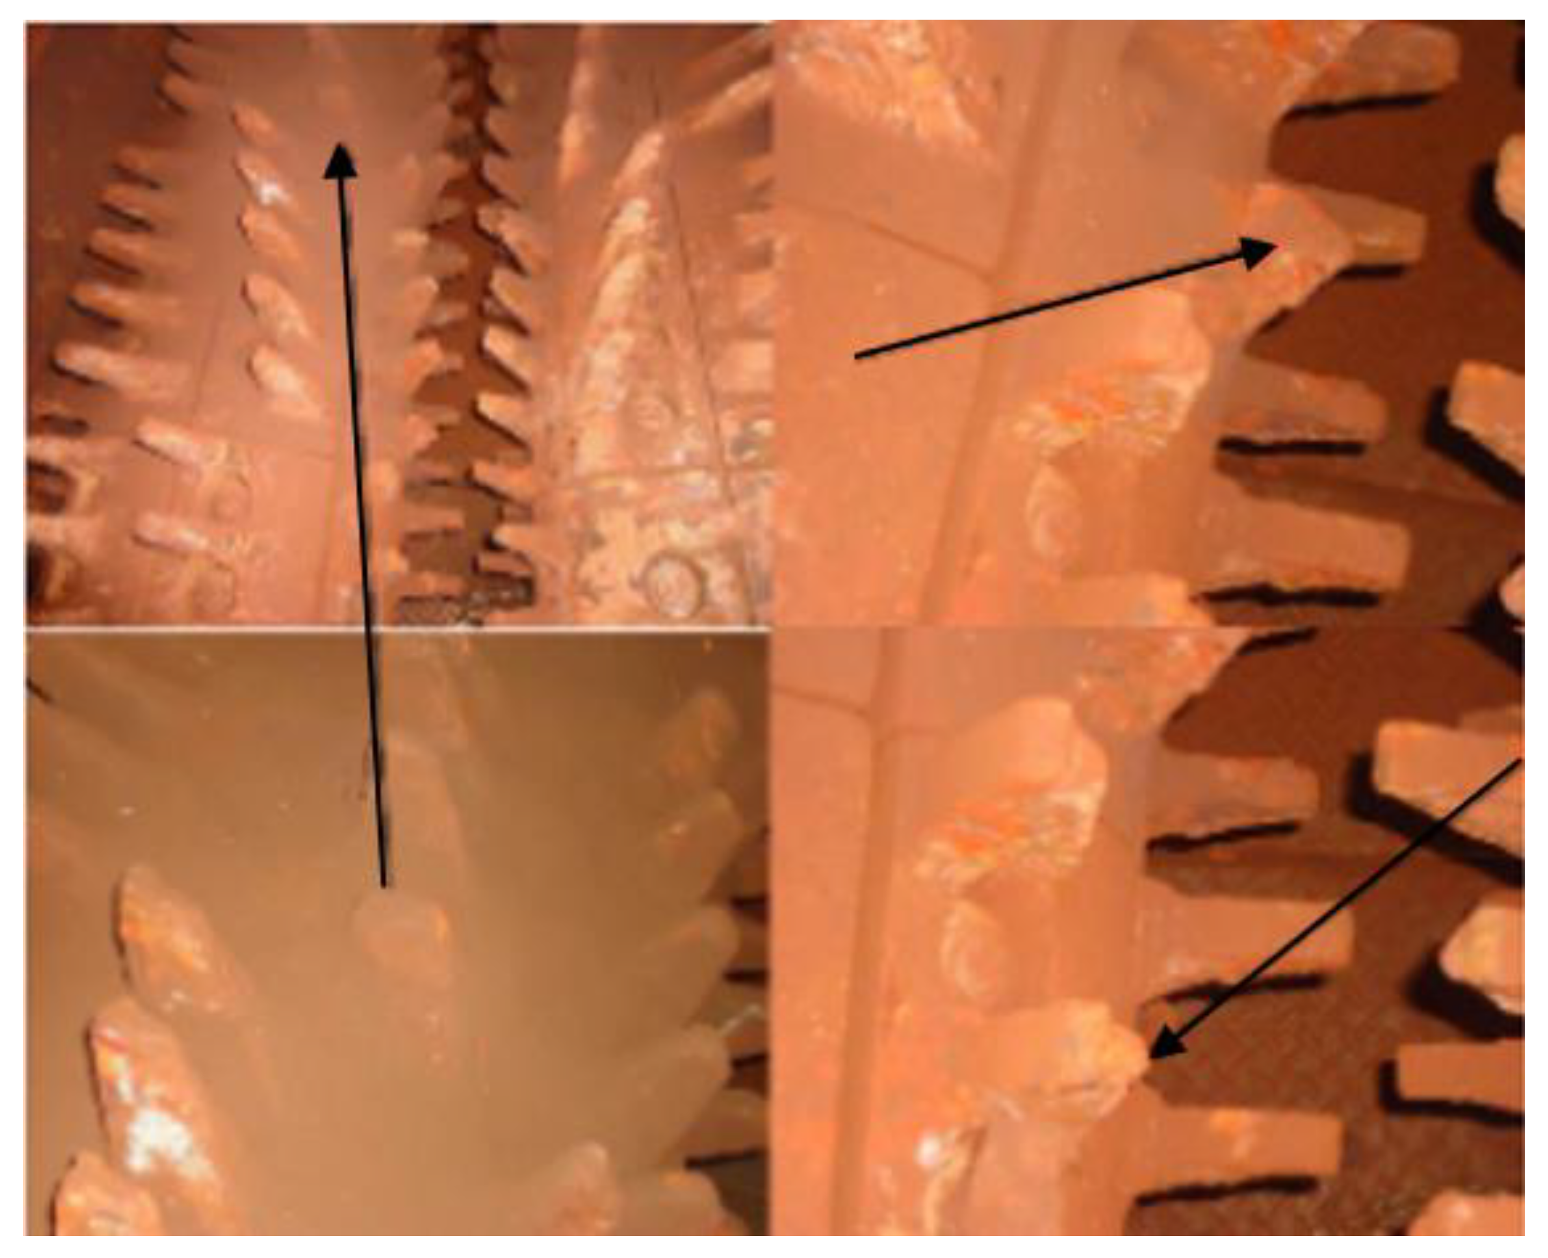
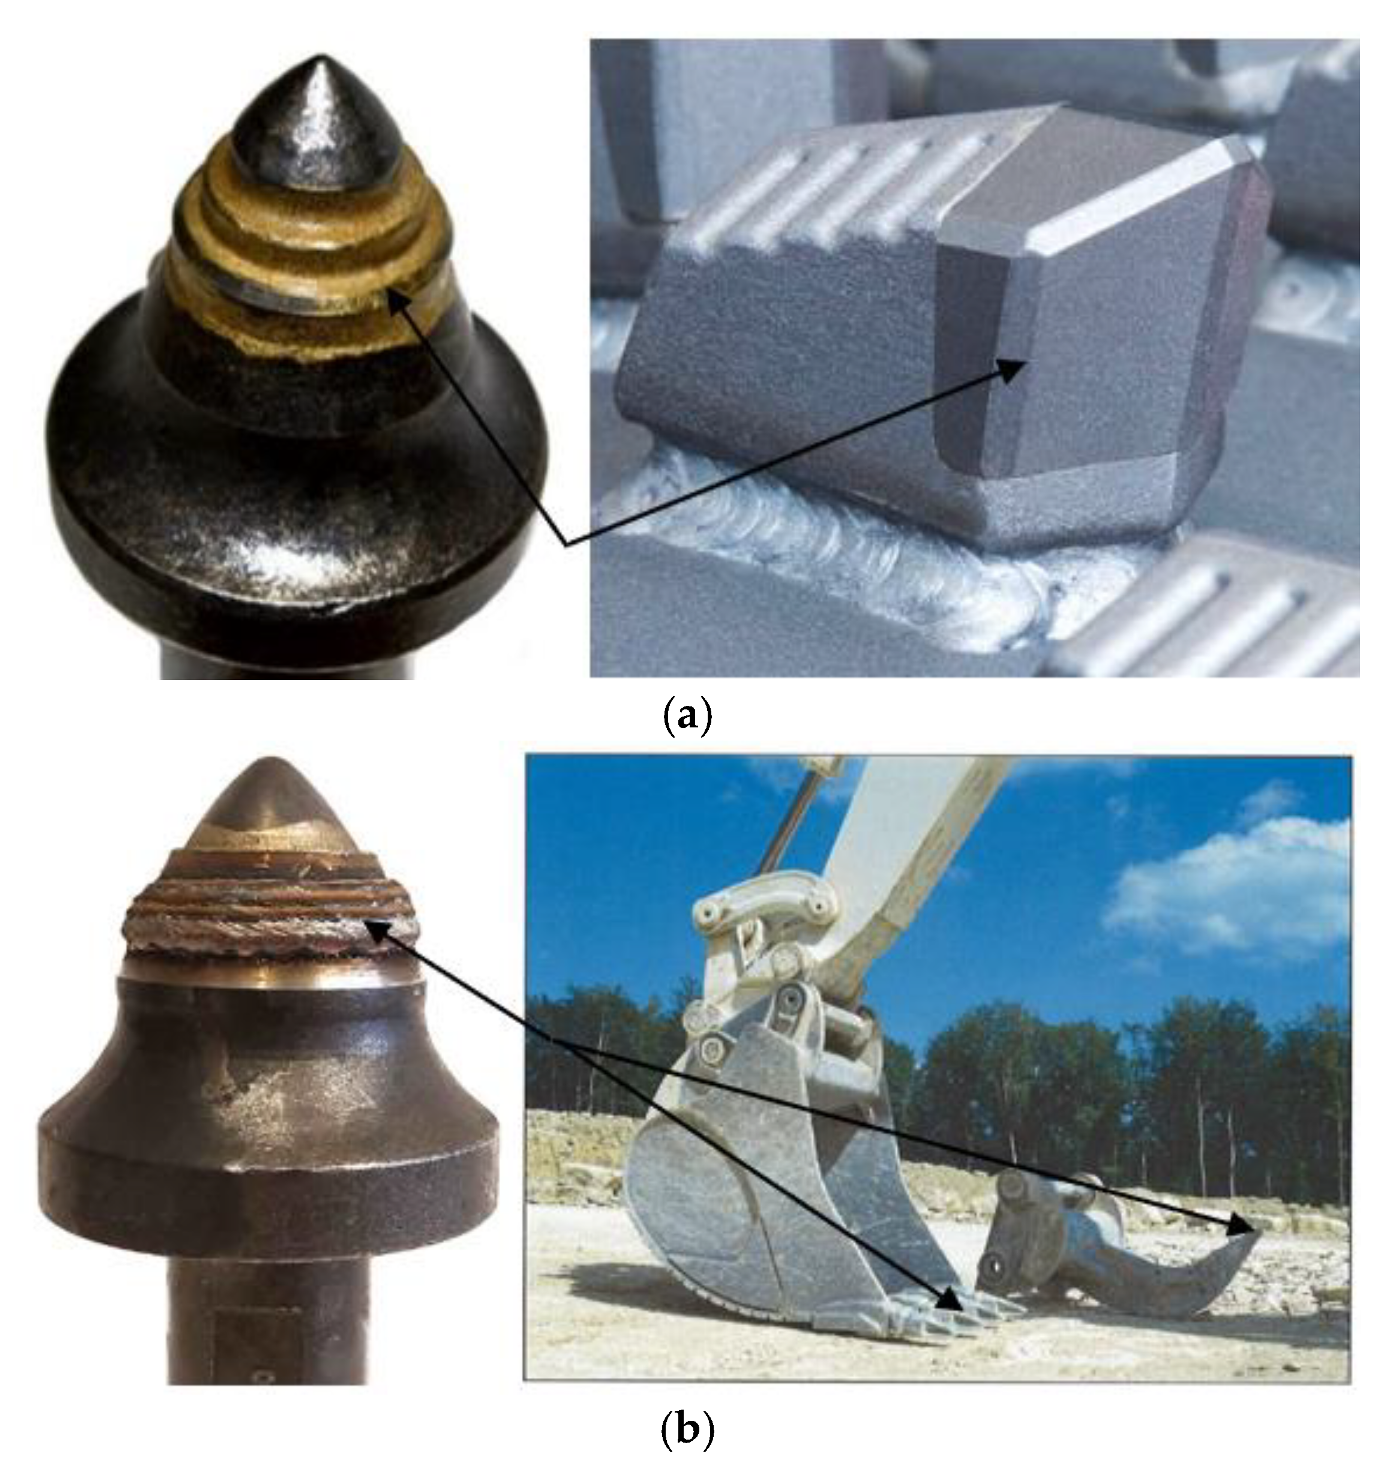
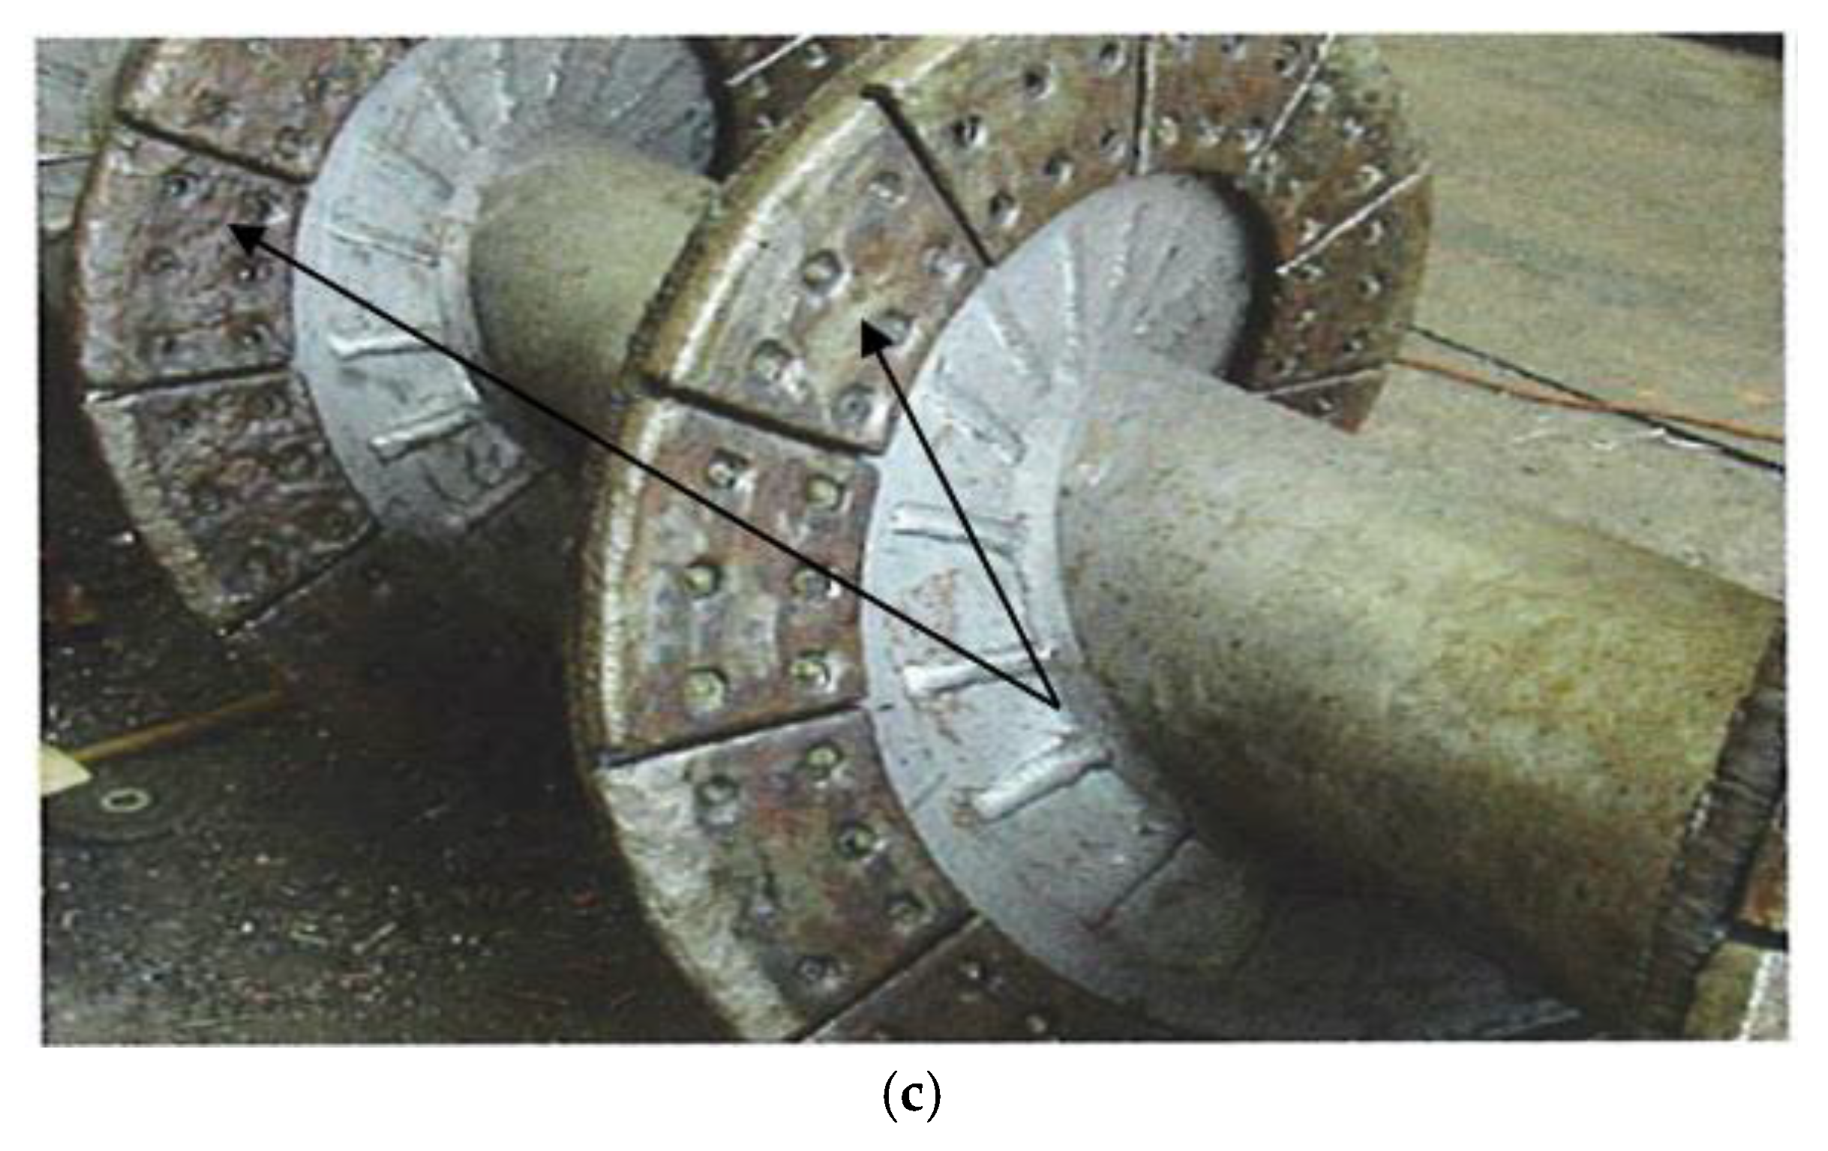
The abrasive wear of machine parts is inevitably connected with most industry branches. However, in the mining sector (mineral extraction, logistics, and processing) the wear cost is exceptionally high, and estimated to exceed billions of dollars annually [1]. The working surfaces of cutting heads (Figure 1) [2,3], conical picks (Figure 2) [4,5,6], scraper conveyors (Figure 3) [7] or crushers (Figure 4) [8,9] are constantly deteriorated when in contact with sharp, hard, and abrasive particles [10,11]. Thus, they must be fabricated with properly selected, wear-resistant materials.
Despite the careful material selection, one must consider utilizing one of the available technologies, which helps to increase the lifespan of critical working surfaces. Those technologies are based on several different, and sometimes combinatorial, approaches. The most popular of the approaches are, for instance, heat treatment [12,13], chemical treatment [14,15], mechanical treatment [16], and hardfacing and thermal spraying [17,18,19]. The heat treatment of steel increases the material’s hardness, and thus also the resistance to wear. However, this approach delivers excellent results only in applications with low levels of heat since otherwise, tempering can occur, and increased hardness properties of the steel will be lost. In case of elevated temperature working circumstances (such as power machinery operating with high friction), one must consider applying temperature-resistant coating (Figure 5).
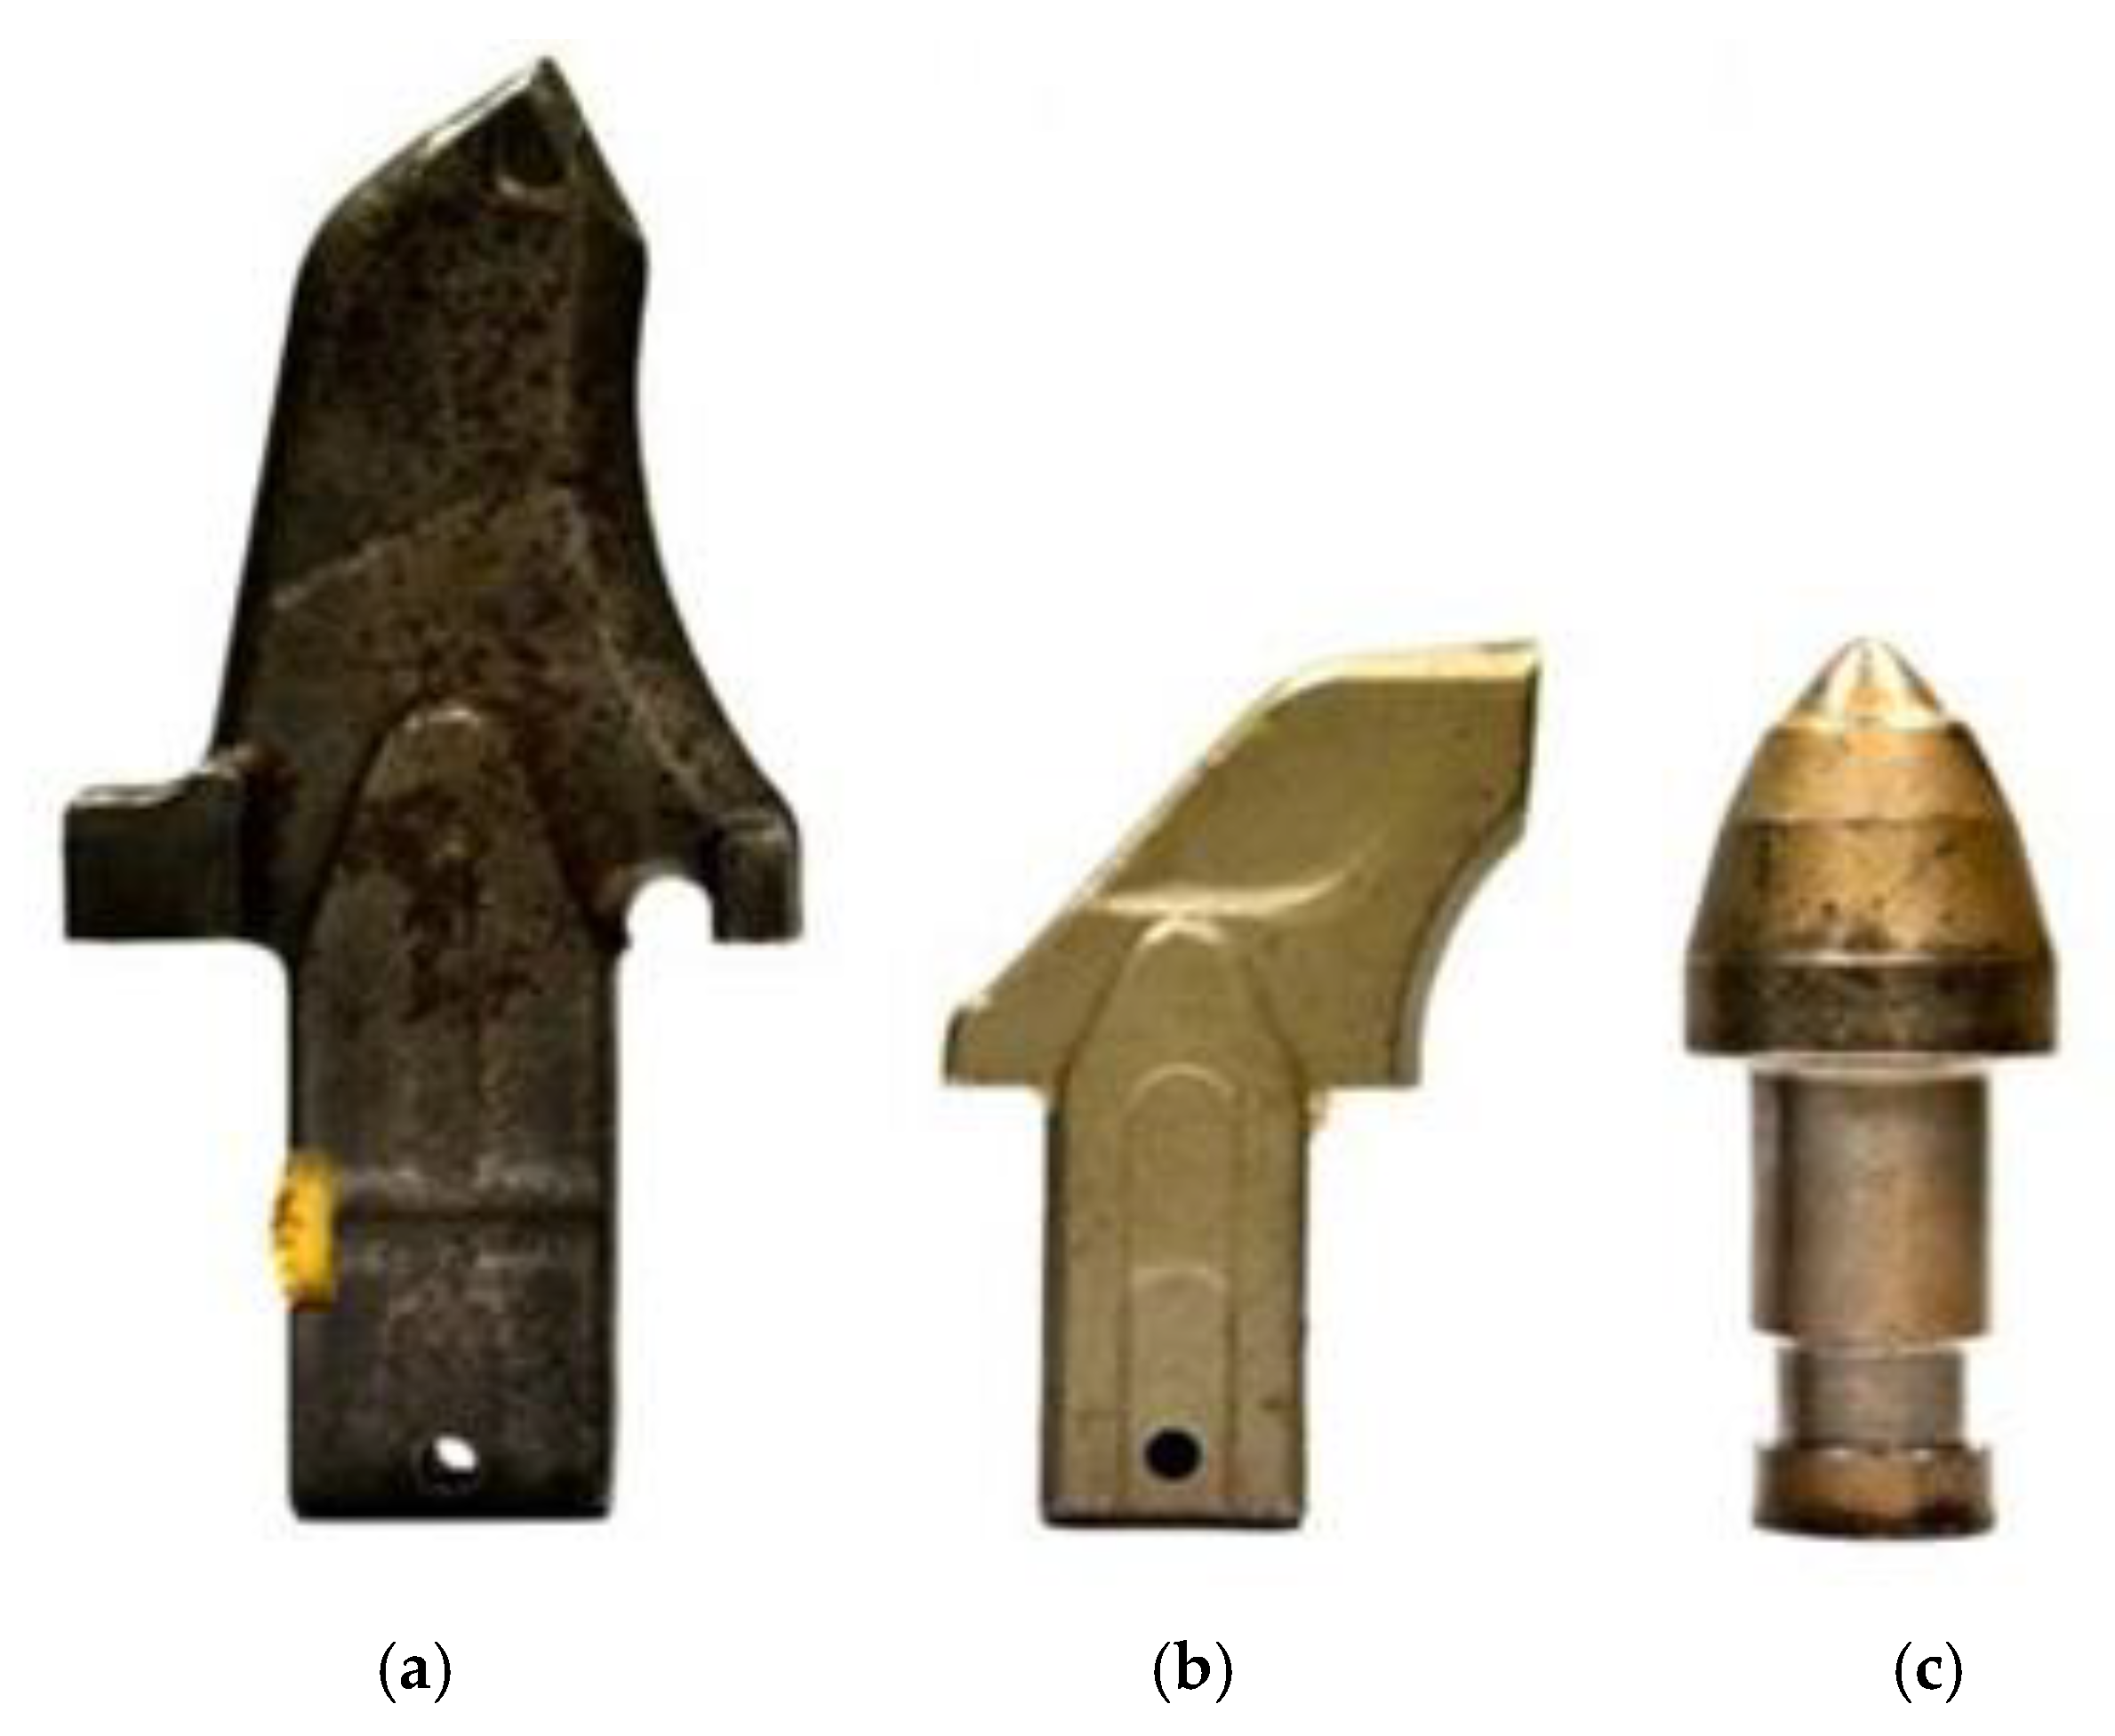
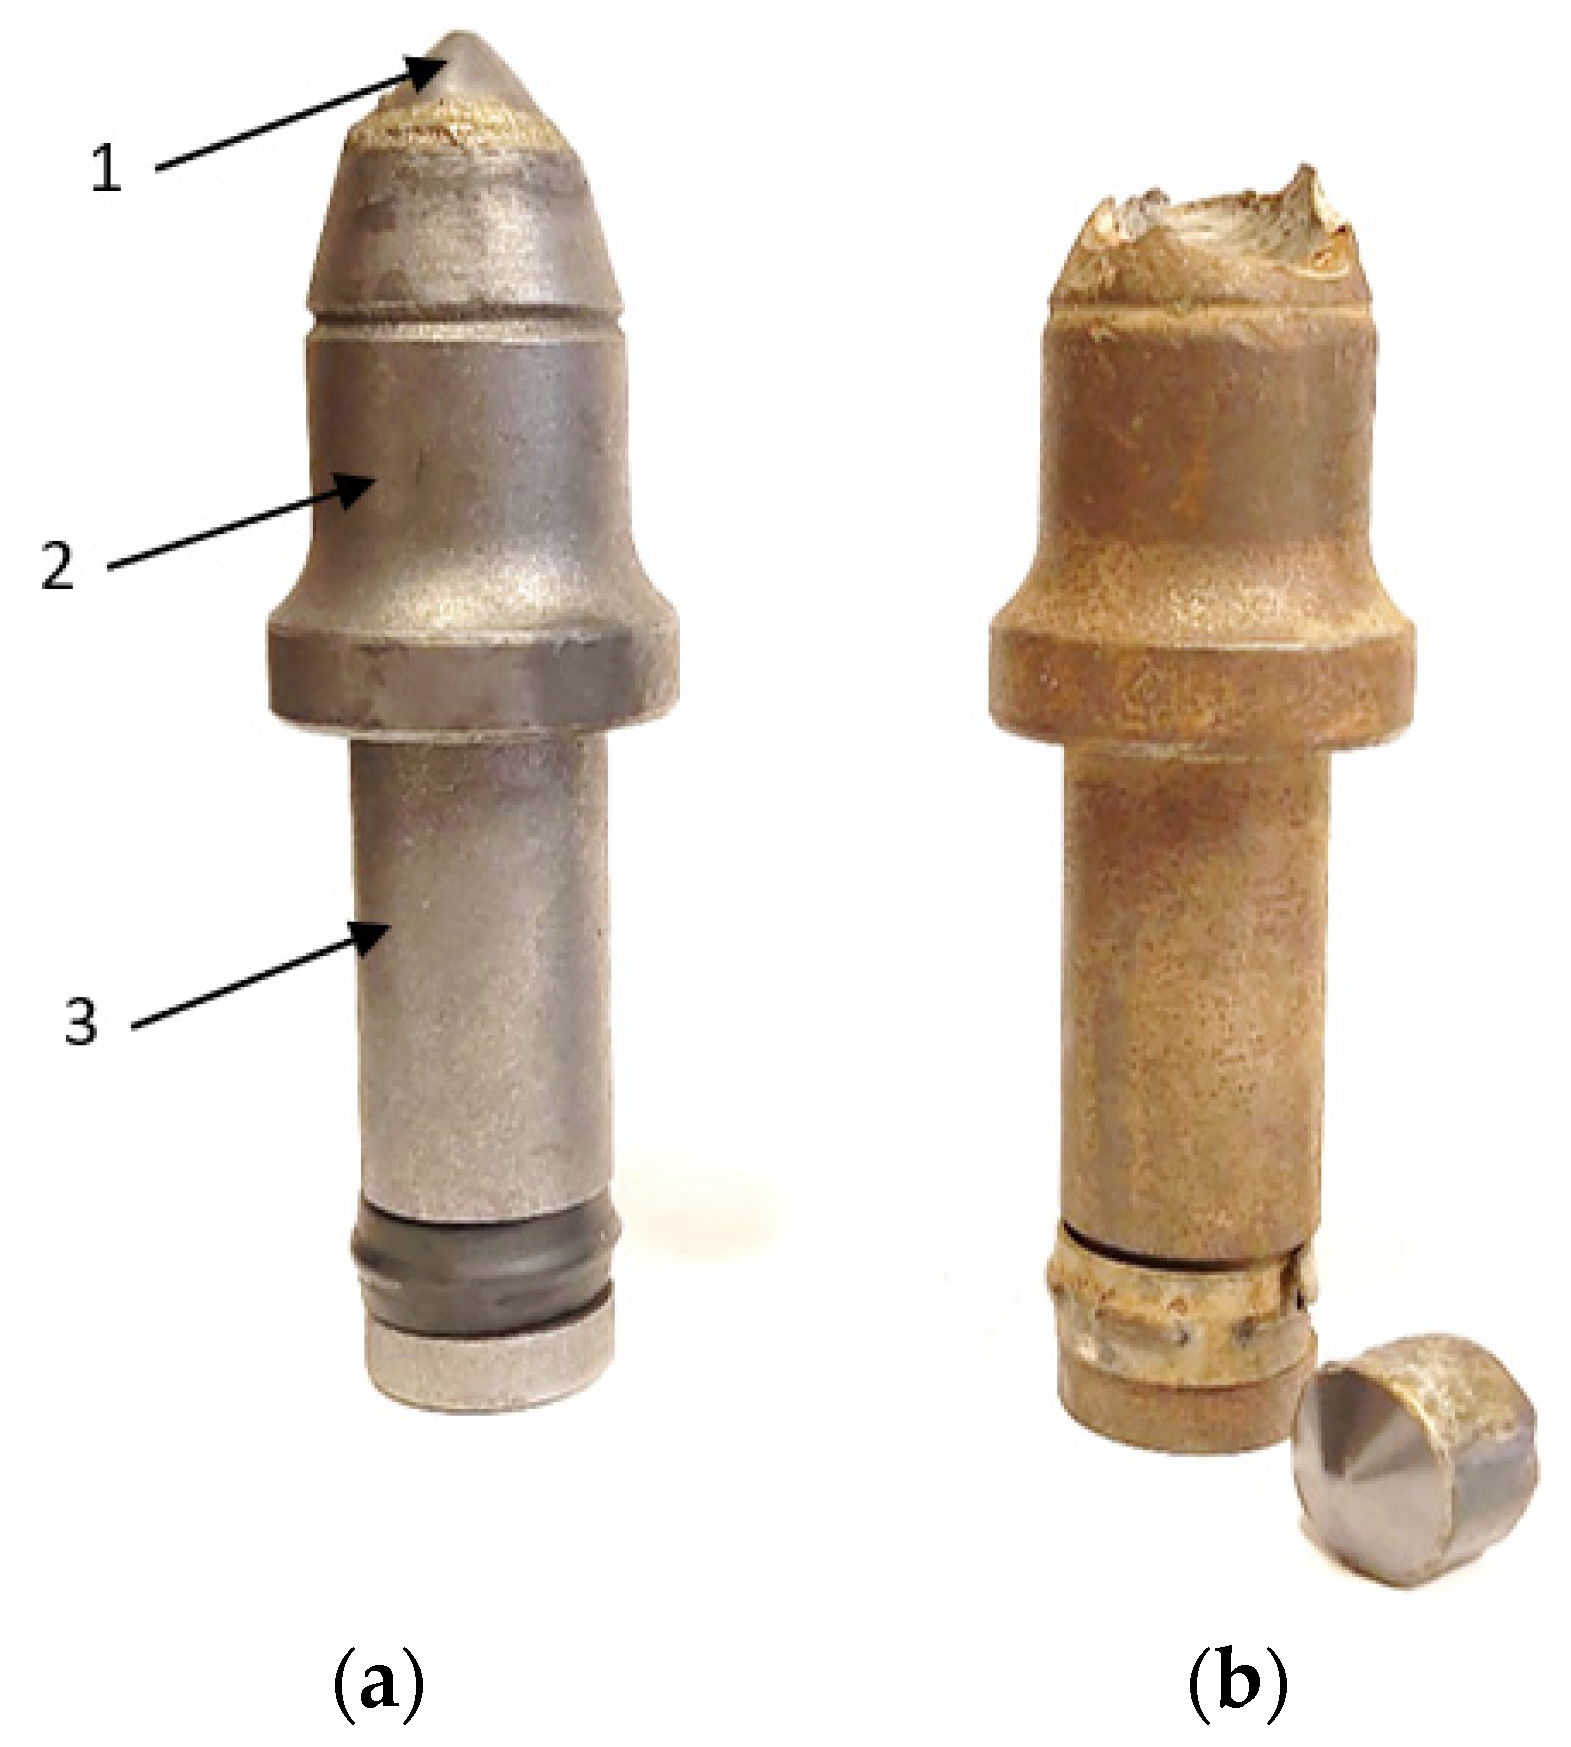
Notably, the problem of possible tempering of the tool exists in the case of most rock-cutting machines end-tools, such as conical picks (sometimes named “tangential-rotary cutters”) (Figure 6). In order to increase the durability of the tools, the manufacturers tend to use heat-treated, high-grade alloy steels with tungsten carbide insert [23,24,25,26] and sometimes additional cooling systems implemented in the cutting head [27,28]. Practice and studies show that frequently, the first thing to deteriorate is the working surface of the conical pick, which also acts as the holder of the TC insert. It can lead to premature wear of the tool due to the loss of the WC-Co insert, which is itself operable (Figure 7). Some manufacturers apply additional hardfaced, wear-resistant coating [29,30] (Figure 8), yet other technologies can also be utilized.
Being provided with a wide variety of conical picks fabricated with different technologies, an objective method of durability assessment had to be invented. In order to achieve this goal, a unique measurement method and a testing stand were developed. This method is based on cutting an artificially made mineral block with constant cutting parameters (i.e., feed and rotational speed of the cutting head) for a given set of cutters and measuring the mass loss of the tools before and after exploitation. In this paper, the authors additionally used a new method of conical pick volumetric loss assessment via 3D photogrammetry scanning [31,32] and compared the results from both types of measurement. It should be emphasized that this method has not been used to determine the volumetric pick’s loss so far.
2. Materials and Methods
The wear rate assessment was carried out on three distinctive sets of four conical picks. Their working parts were coated with different materials that theoretically had to increase their lifespan. The chemical composition and technological parameters of the coatings were selected by the manufacturers. All three types of picks were the tools of a roadheader cutting head. The working part’s length was either 70 mm (N1, N2) or 65 mm (N3). In the current study, the authors tested the following sets of tools:
- Set of four conical picks with 70 mm long hardfaced working part and WC-Co (tungsten carbide in cobalt matrix) insert of ϕ22 mm in diameter and cutting angle 2βu = 105°, further referred to as N1 (Figure 9),
- Set of four conical picks with 70 mm long hardfaced working part and WC-Co (tungsten carbide in cobalt matrix) insert of ϕ22 mm in diameter and cutting angle 2βu = 105°, further referred to as N2 (Figure 10),
- Set of four conical picks with 65 mm long hardfaced working part WC-Co (tungsten carbide in cobalt matrix) insert of ϕ25 mm in diameter and cutting angle 2βu = 95°, further referred to as N3 (Figure 11).
The holding part of every tool is annotated with the number 1–4, which refers to the position on the test disc.
3. The Wear Rate Assessment of a Conical Pick
The beforementioned wear rate estimation is carried out empirically via mass loss evaluation of brand-new and exploited picks, tested with constant cutting and feed conditions. Similarly, a volumetric wear estimation can be conducted via photogrammetry, also in an empiric manner. In both cases, the tests can be performed with a unique testing stand, described later in this section.
The authors measured the initial mass and volume for every given tool before the testing and the mass and volume loss after each run. Before the testing procedure, the following steps were required to be prepared:
- mineral sample fabricated out of silica-rich cement,
- test disc with appropriate tool mounting system,
- tools’ enumeration and measurement of their initial mass and volume.
After the preparations, each of the four conical picks was mounted in the appropriate test disc holder, respecting the enumeration. The next step was to cut the mineral sample with constant advance and cutting speed. After each cutting run, the tools were removed to weigh and take the pictures necessary for obtaining a 3D scan. The cut output of the mineral sample was also calculated. Having collected the values mentioned above, the wear rate was possible to calculate.
The parameters and conditions for the current study were the following:
- cutting a mineral sample composed of cement, sand, and basaltic aggregate,
- specific mass of the mineral sample: γw = 2.3 Mg/m3,
- volume of the whole mineral sample: Vp = 8.125 × 106 cm3,
- initial volume of mineral sample (reserved for each set of tools) Vw = 5 × 106 cm3,
- average uniaxial compressive strength (UCS) of the mineral sample: Rc = 30 ÷ 35 MPa,
- advance speed: vp = 0.05 m/min,
- rotational speed of the test disc: n = 42 rpm,
- length of the cut: 50 mm,
- web cut: 152 mm,
- outside diameter of the test disc, measured between the tool insert tips:
- ∘
- ϕ1823 mm for conical picks with 70 mm long working part,
- ∘
- ϕ1813 mm for conical picks with 65 mm long working part.
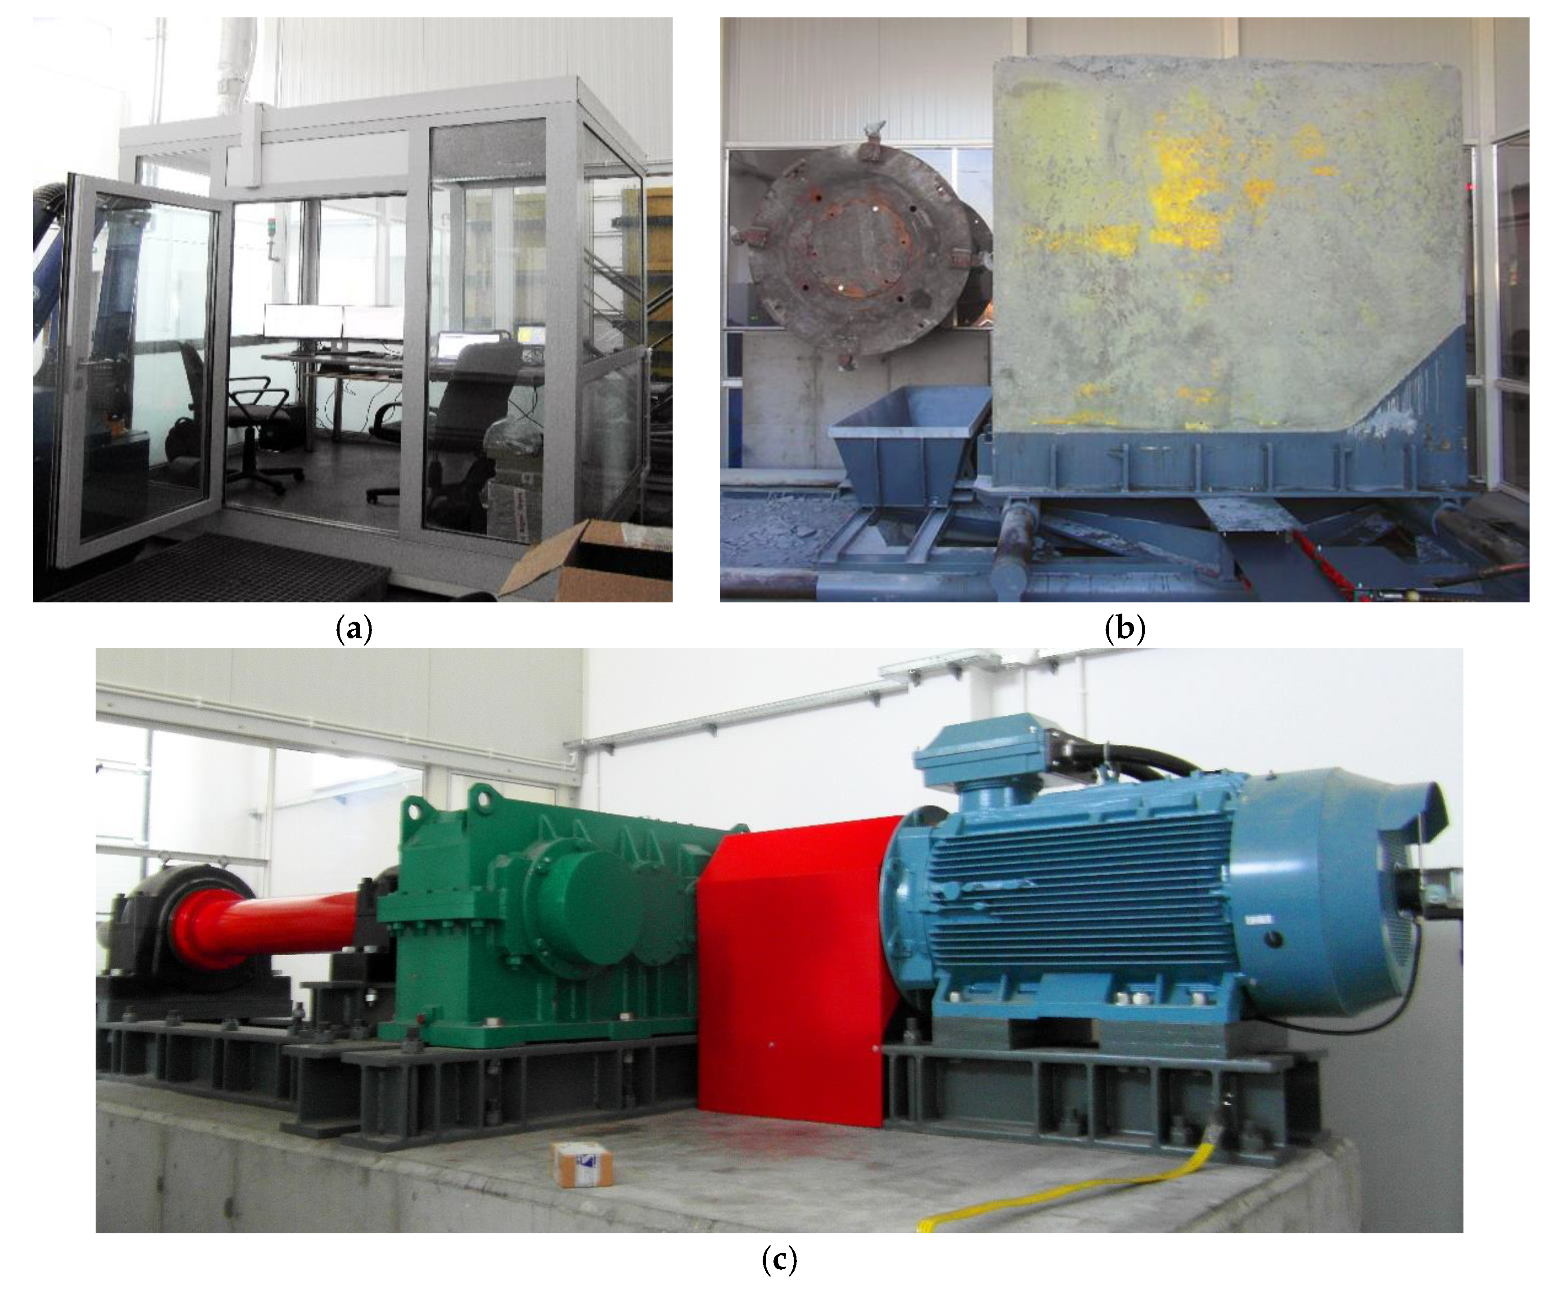
The tests were performed using the special testing stand belonging to the Department of Machinery Engineering and Transport AGH UST. The rig fulfils the assumptions stated for the rock-cutting tool wear assessment. This testing rig enables the user to simulate the rock-cutting process in a controlled environment, either with an artificial sample fabricated with cement mixed with mineral aggregate or a natural mineral sample. The main sections of the test rig are as follows (Figure 12):
The linear motion of the mineral sample and rotational motion of the cutting head (test disc) result in grain decohesion of the mineral material via impact from the cutting tools. The evaluation of the wear rate parameter is only possible when the cutting parameters are kept constant since, without the test setup’s repeatability, the wear rate comparison would be impractical.
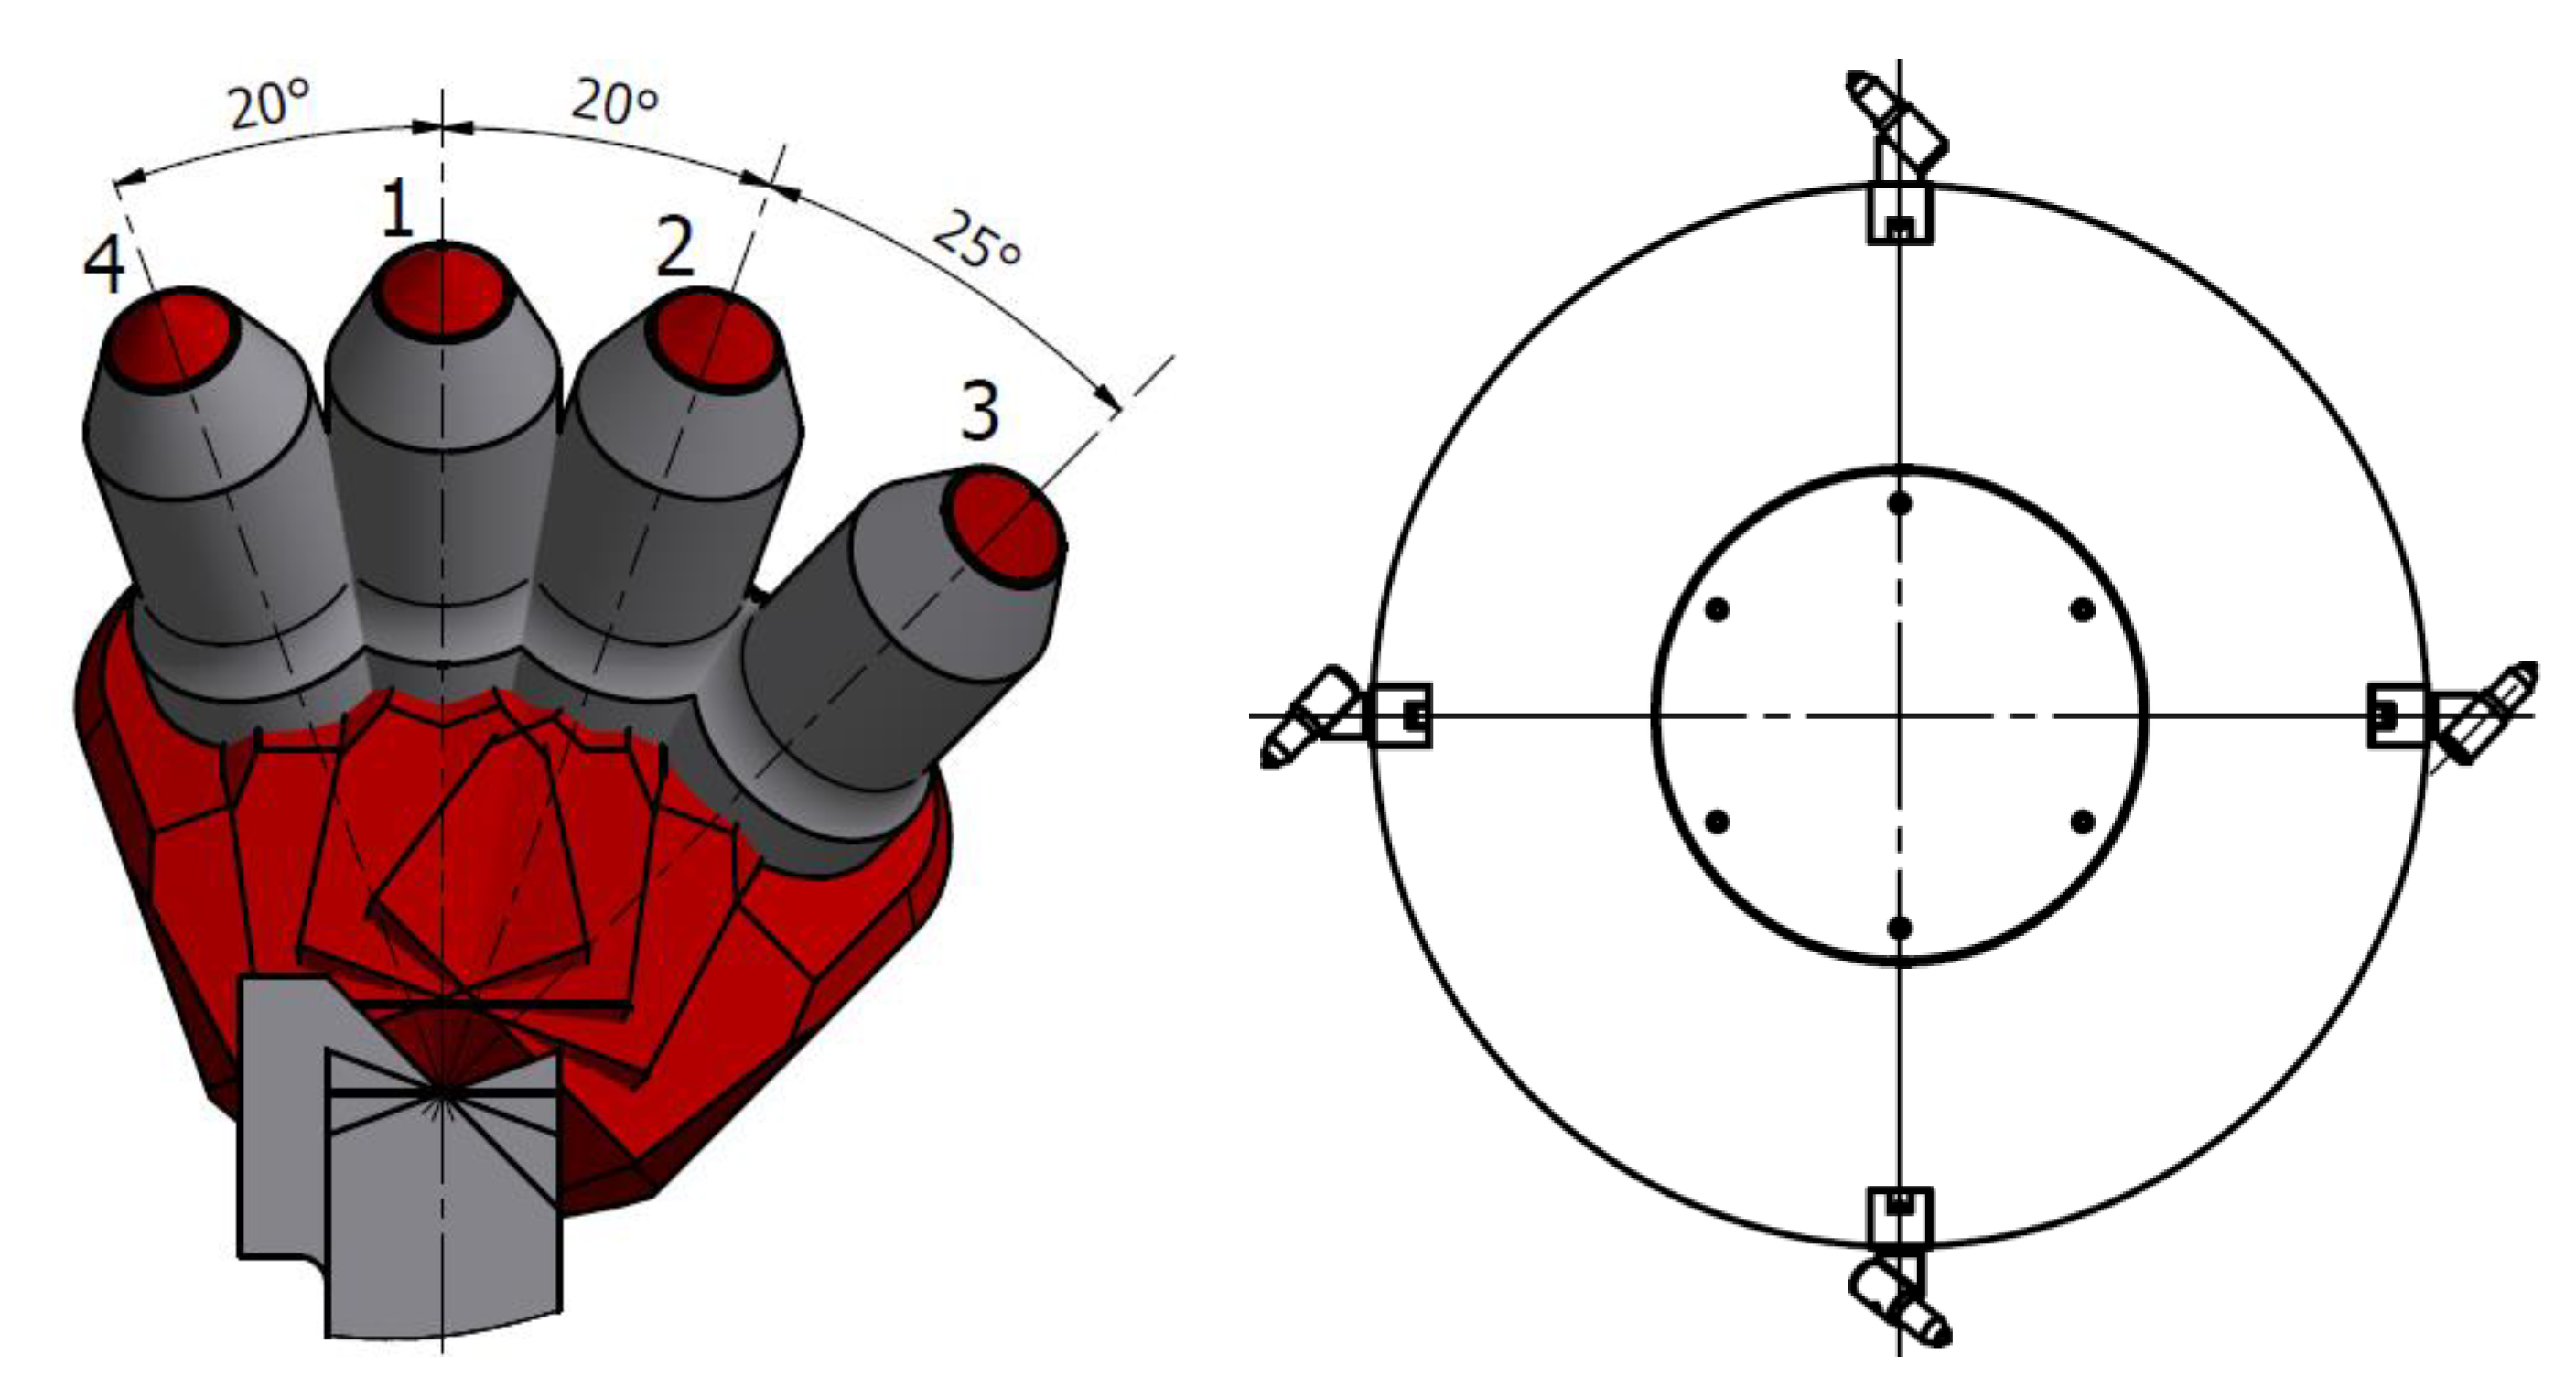
The conical picks are mounted every 90° on the test disc circumference, according to the scheme visible in Figure 13. The holders are enumerated from 1 to 4.
3.1. Mass Loss Assessment
In order to estimate the wear rate of the conical pick, one has to measure the tool’s mass before and after the test and additionally calculate the volume of the cut mineral sample. The mass is measured with a high precision scale, with a readability of 0.001 g. A specific parameter of the wear rate—called C2—can be calculated later. The C2 parameter is the product of the tool’s mass loss Δm and initial volume of mineral sample Vw, divided by the initial mass m of the tool and volume of the cut mineral sample Vu, as seen in Formula (1).
where:
- C2—mass wear rate of the tested pick,
- Δm—mass loss of the conical pick (body plus WC-Co insert), g,
- m—mass of the pick before test, g,
- Vw—initial volume of the mineral sample, cm3,
- Vu—volume of mineral cut during the test, cm3.
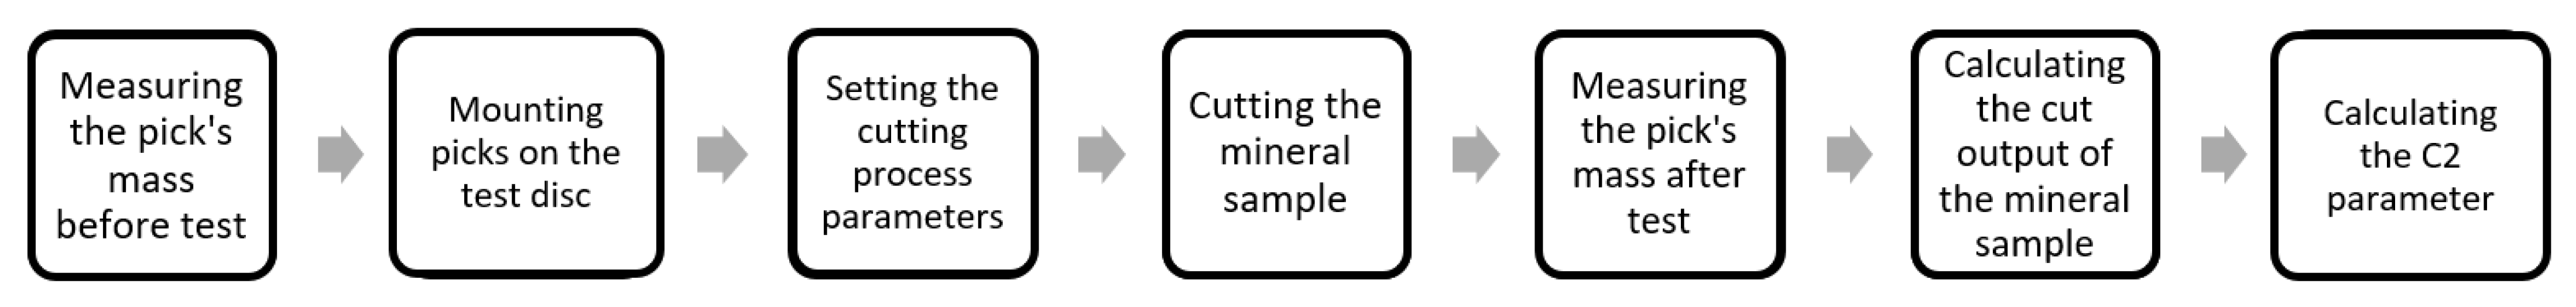
Tests of all pick types are carried out by the methodology and test plan described above [4,33]. A schematic of the algorithm used to estimate the C2 parameter showed in Figure 14. It allows for comparing the durability of tested picks. Please note that the lower the C2 score a given tool has, the higher its durability.
3.2. Volumetric Loss Assessment
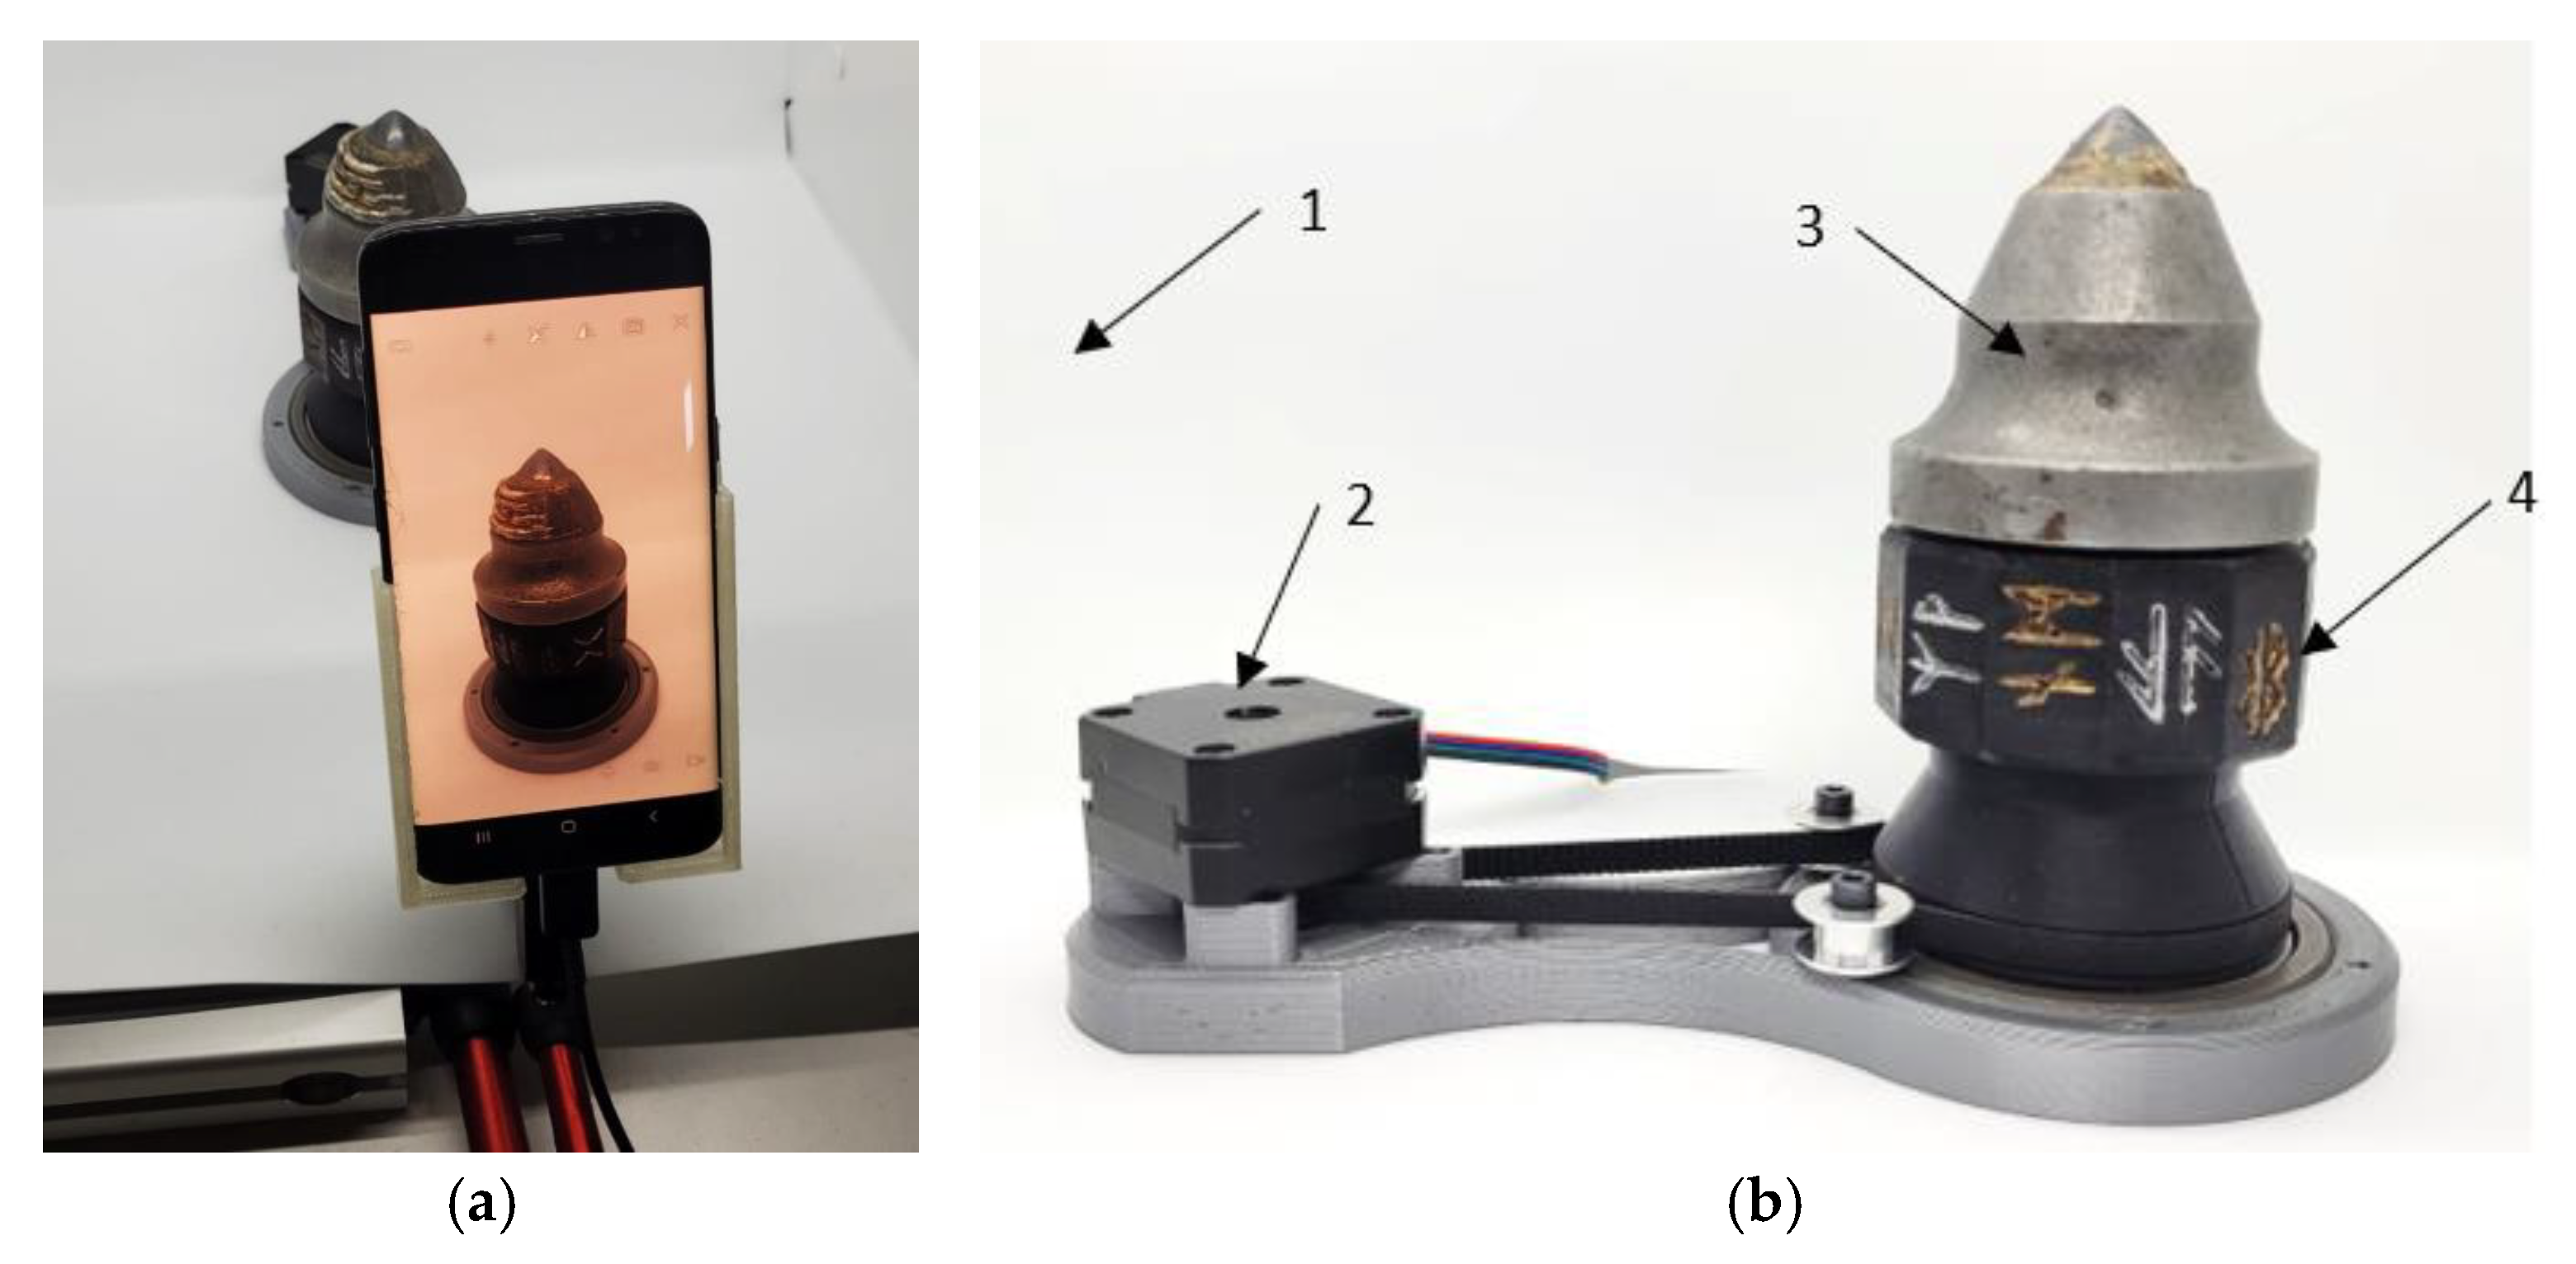
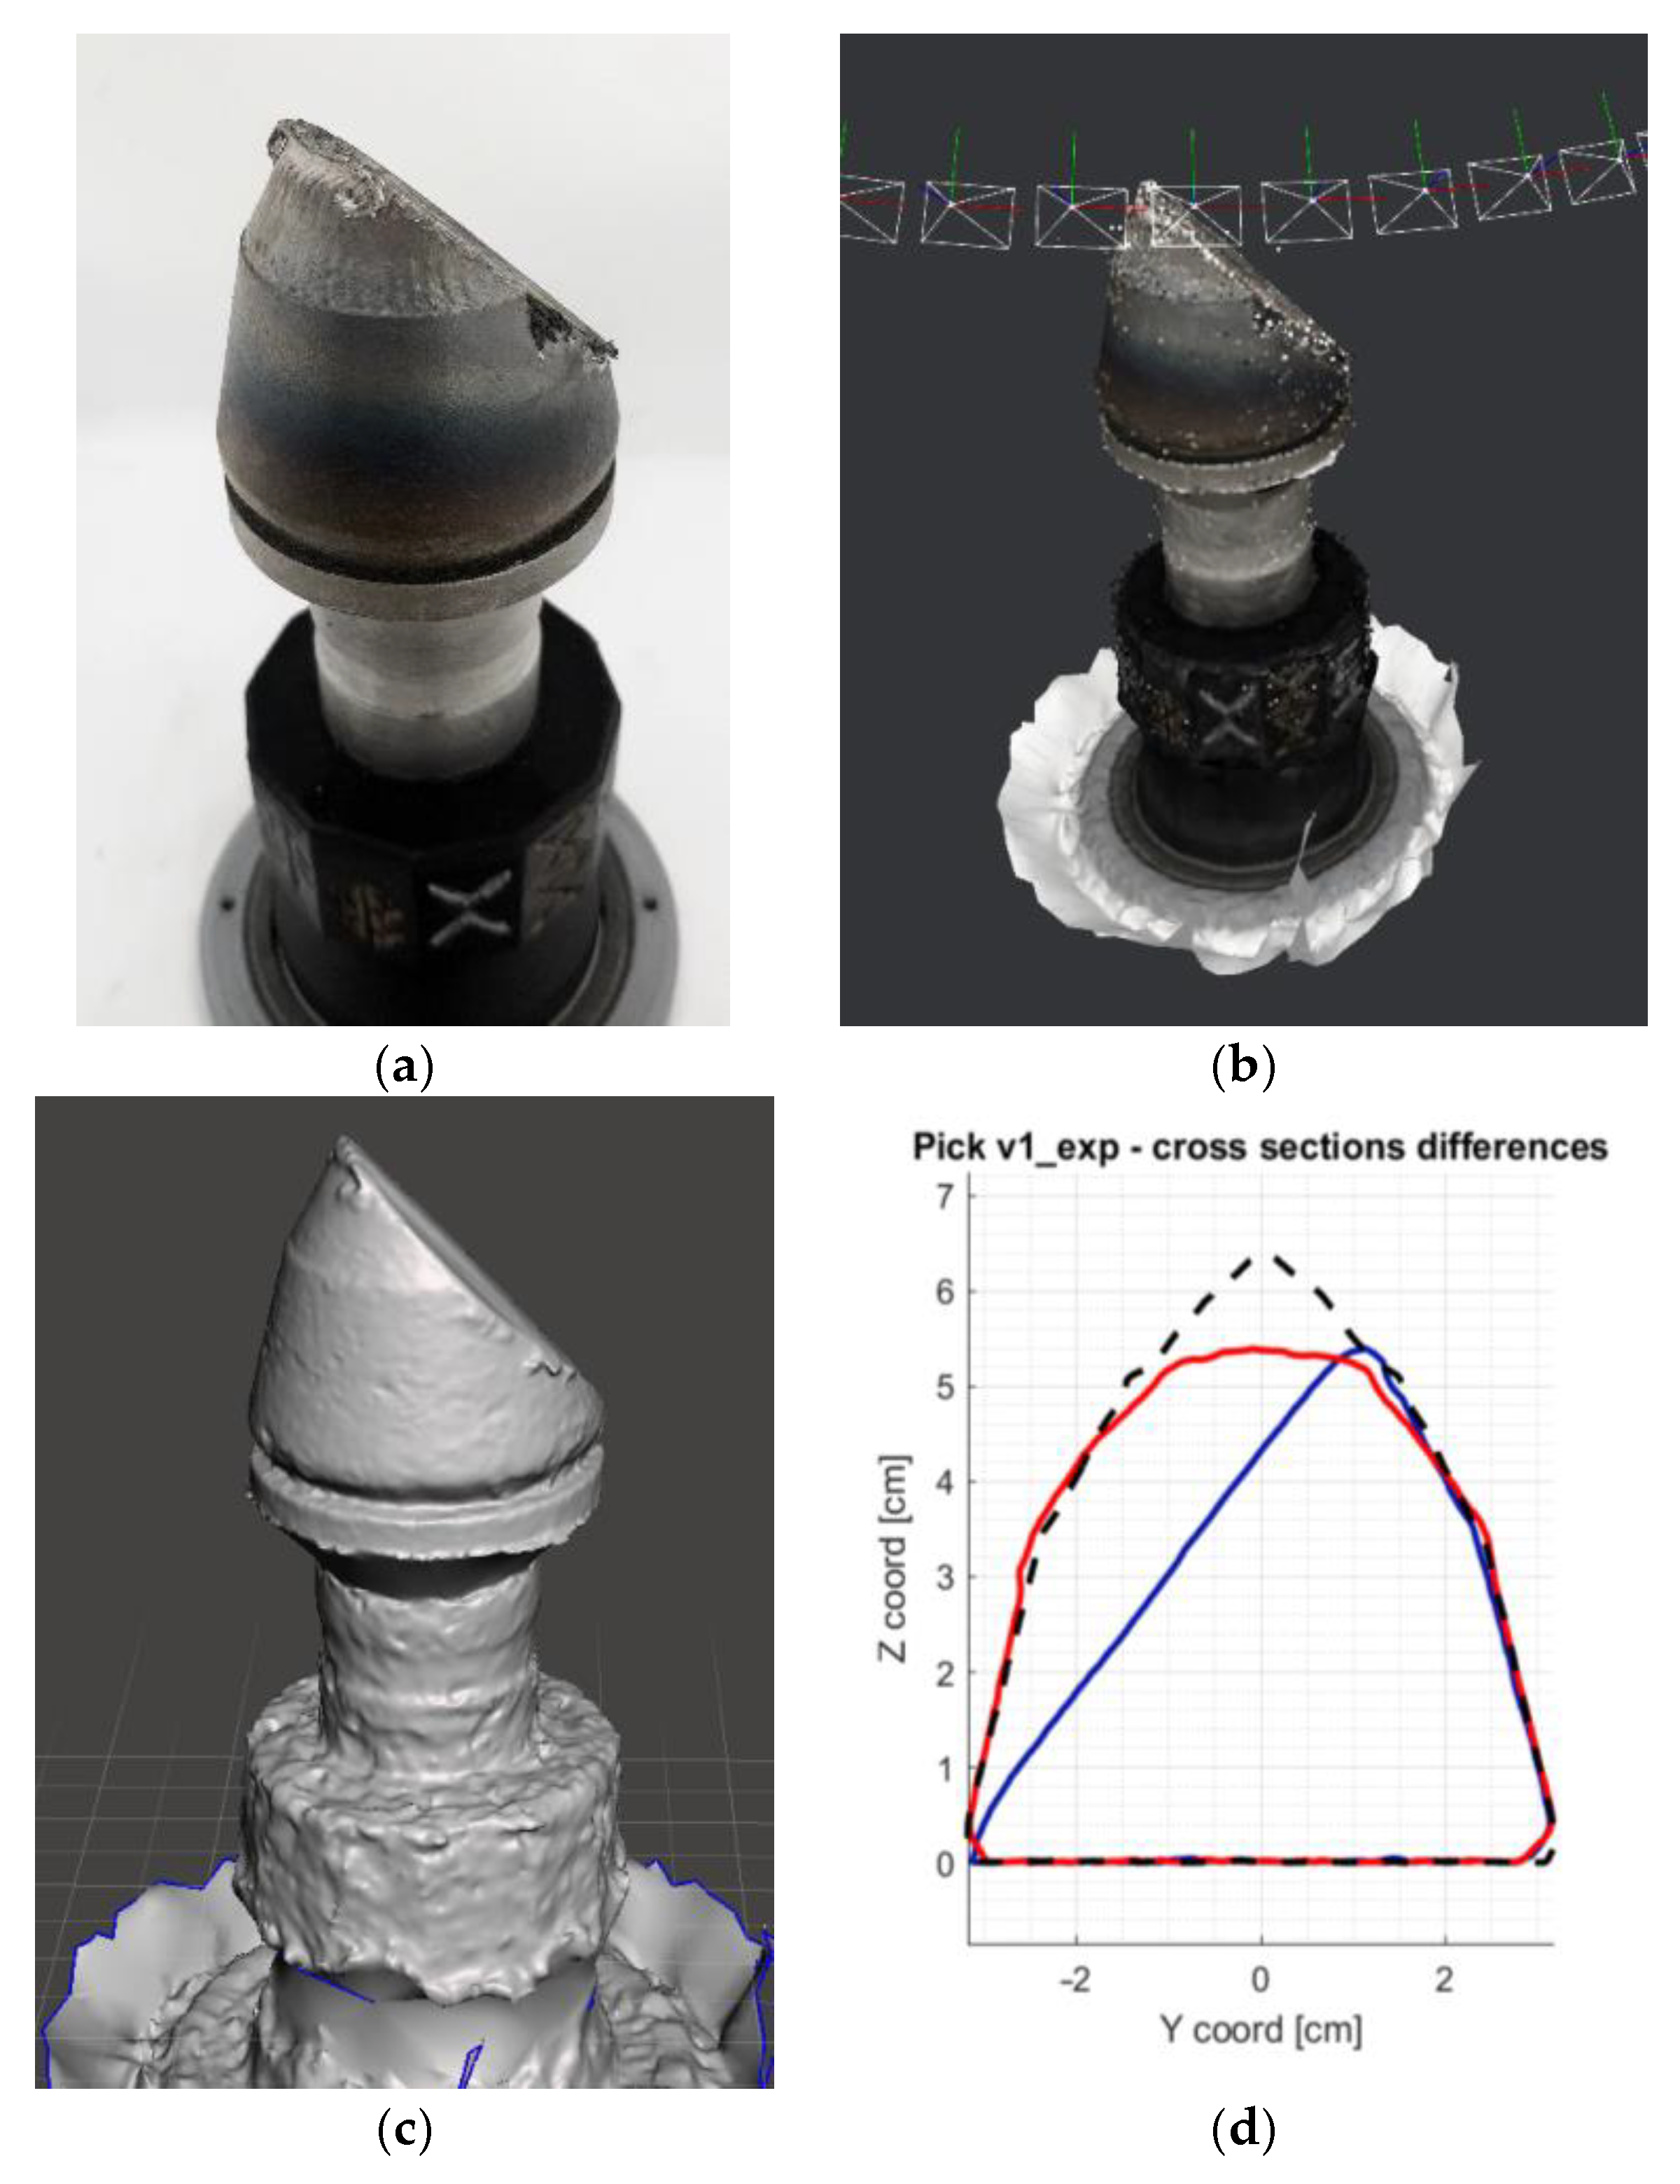
The volumetric wear rate is estimated via a photogrammetric approach. The three-dimensional scan of the tool is achieved by capturing a series of sharp images of the object taken from different angles. In order to allow the authors to achieve repeatable results, a special scanning chamber had to be designed (Figure 15). It was constructed with a 12.2 MPix Sony IMX333 digital camera matrix (Sony, Tokyo, and Japan, Figure 15a), a photography tent with rigid white walls and a controllable LED light source (Figure 15b) and a turntable with a stepper motor. The turntable’s motion was controlled with Arduino Nano (Arduino, Sommerville, MA, USA) and TMC2208 stepper motor driver (Trinamic GmBH, Hamburg, Germany). The rotation of the scanned object was conjugated with the camera shutter, which captured the image every 6°, making 60 pictures of the tool in total. The additional geometrical patterns on the turntable mount helped the algorithm with the 3D object reconstruction and found more characteristic points. Those points were the base for input in the MeshRoom photogrammetric program (Alicevision Association, Paris, France). The light source, a controlled LED strip and the camera lens were additionally covered with a polarization film to diminish the reflections occurring on the scanned, metallic objects.
The 3D scan in the .stl format was later processed in the MATLAB R2021B environment (Mathworks, Natick, MA, USA) to find the axis of symmetry of the captured conical pick, align the models before and after exploitation and calculate the volumetric difference (Figure 16).
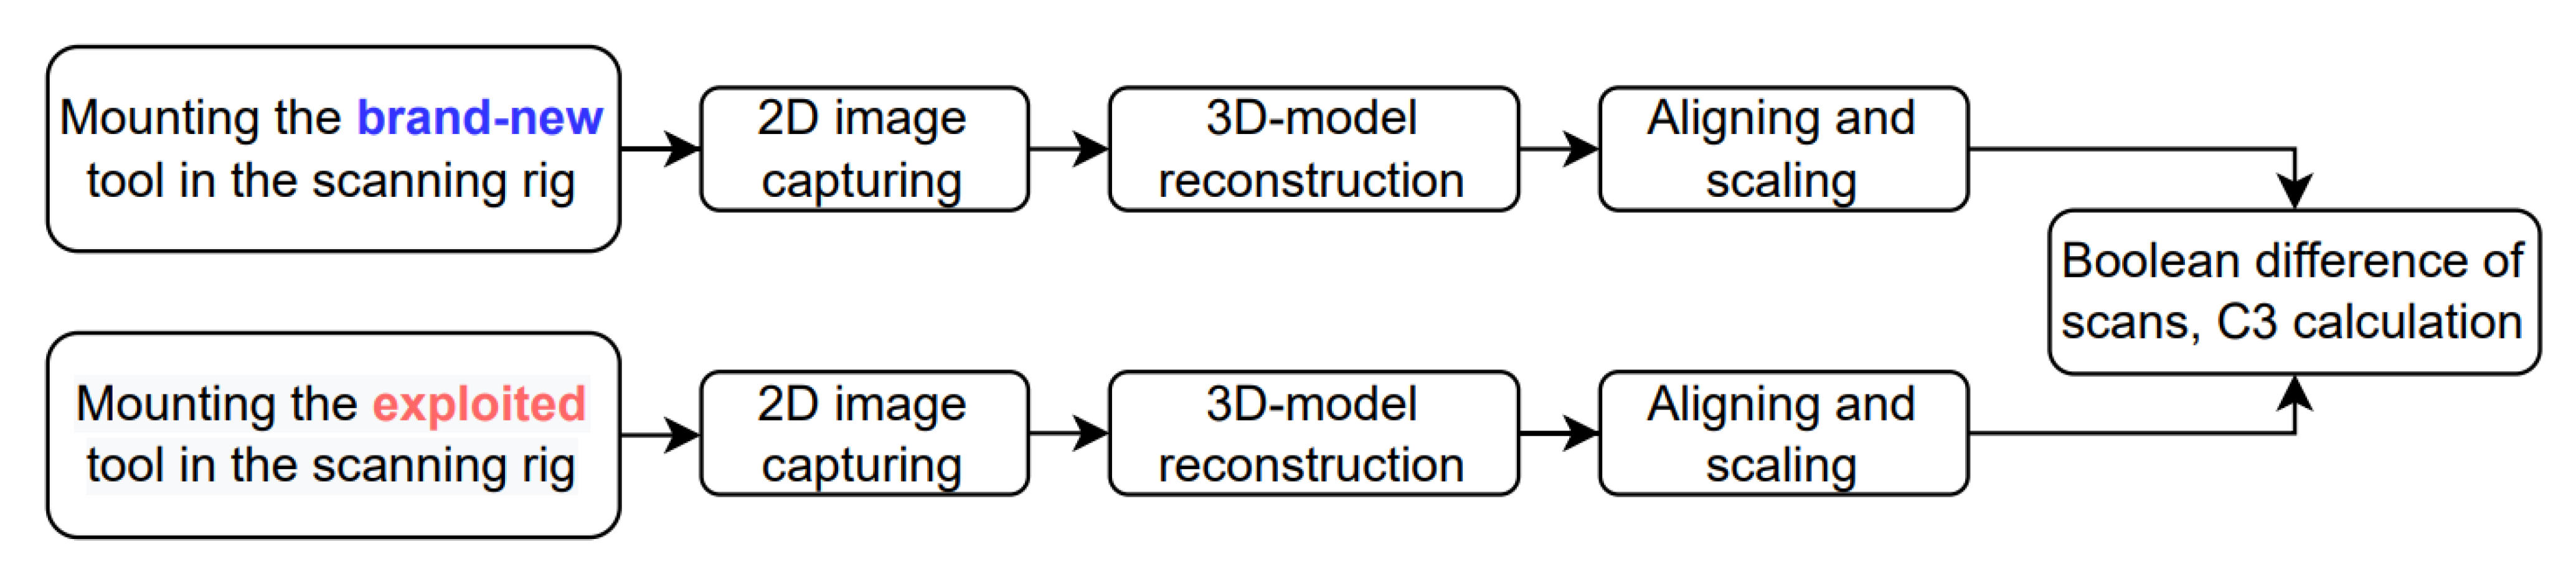
The procedure used to obtain the volume of the brand-new and worn-out pick is presented in Figure 17. The volumetric wear rate parameter was developed similarly to the mass loss assessment. However, in this case, it is based on the product of the tool’s volumetric difference ΔV and the initial volume of mineral sample Vw divided by the product of the initial volume of the tool V and the volume of the rock-cut Vu, according to the Formula (2).
where:
- C3—volumetric wear rate of the inspected pick,
- ΔV—volumetric loss of the conical pick (body plus WC-Co insert), cm3,
- V—pick volume before the test, cm3,
- Vw—initial volume of mineral sample, cm3,
- Vu—volume of rock cut during the test, cm3.
Similarly to the mass wear rate, the lower value of the C3 parameter in the given tool scores, the higher durability it exhibits.
4. Results and Analysis
According to the method and procedures described above, a series of test runs were conducted. The cement-silica sample was cut with three distinctive sets of conical picks with different hardfaced coatings. Every set of four mining tools was weighted, scanned, and then mounted on the test disc. The mineral sample moved at a constant advance speed vp, and the test disk rotational speed n was kept constant during all tests. After the test, the tools were de-mounted, left to cool down, and measured (weighted and scanned) again to estimate the paper’s goal, namely to determine the mass and volume loss.
4.1. Conical Pick Mass Loss Assessment
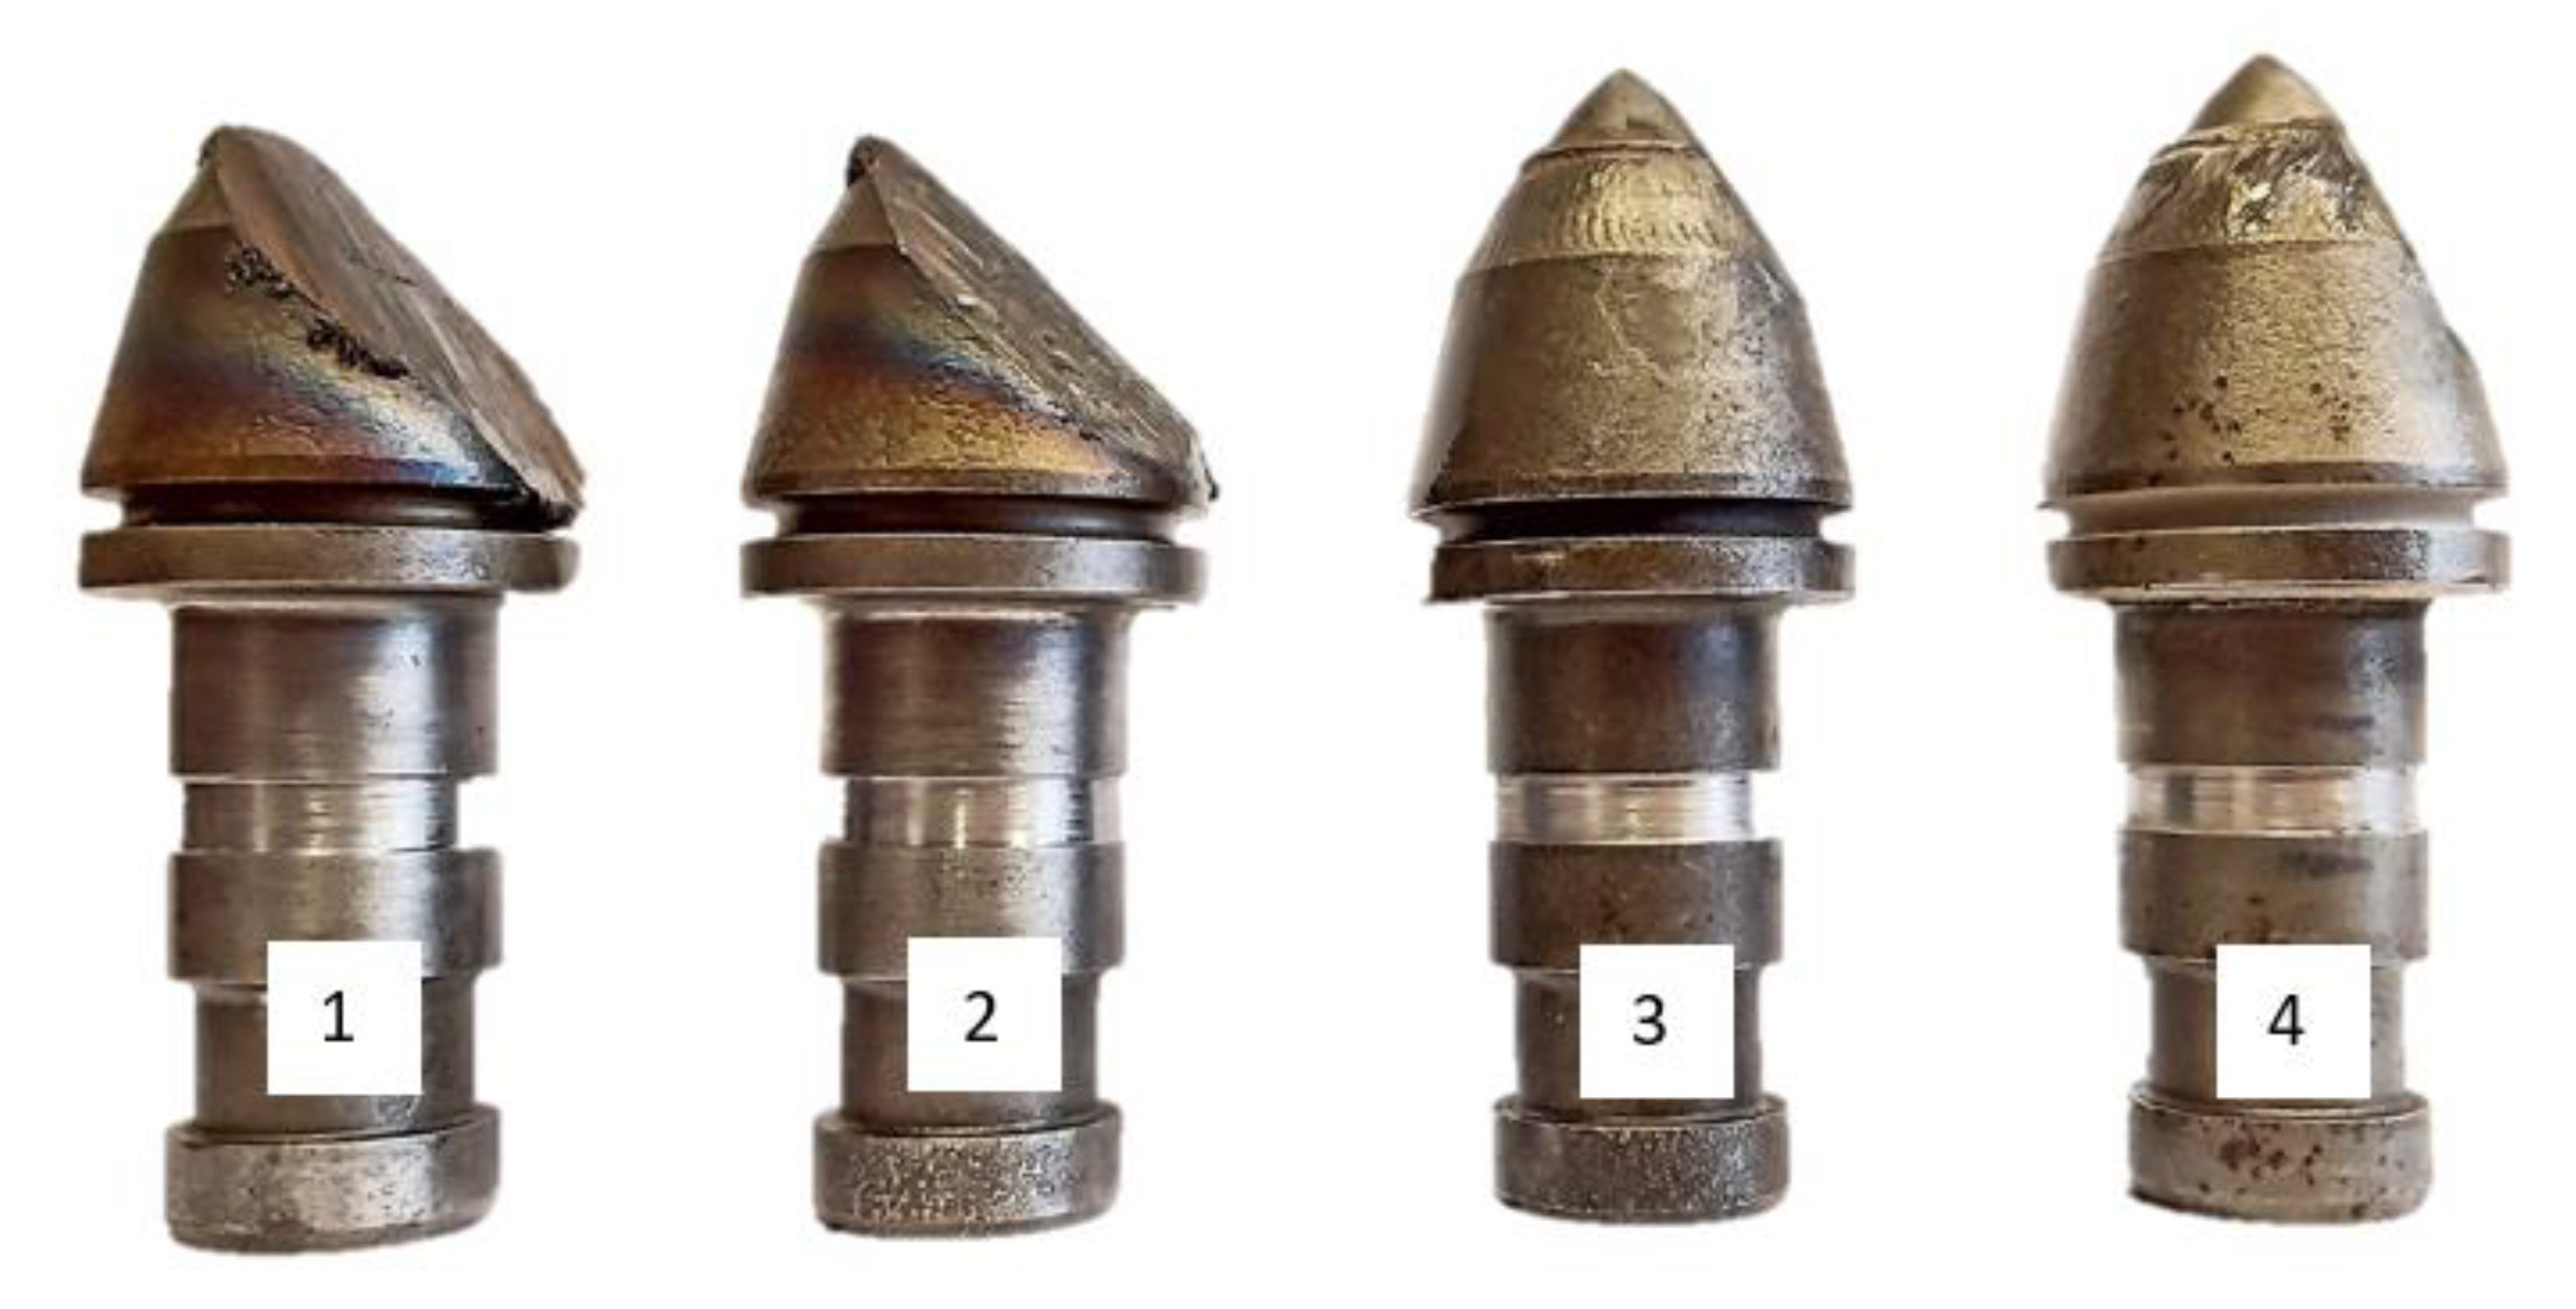
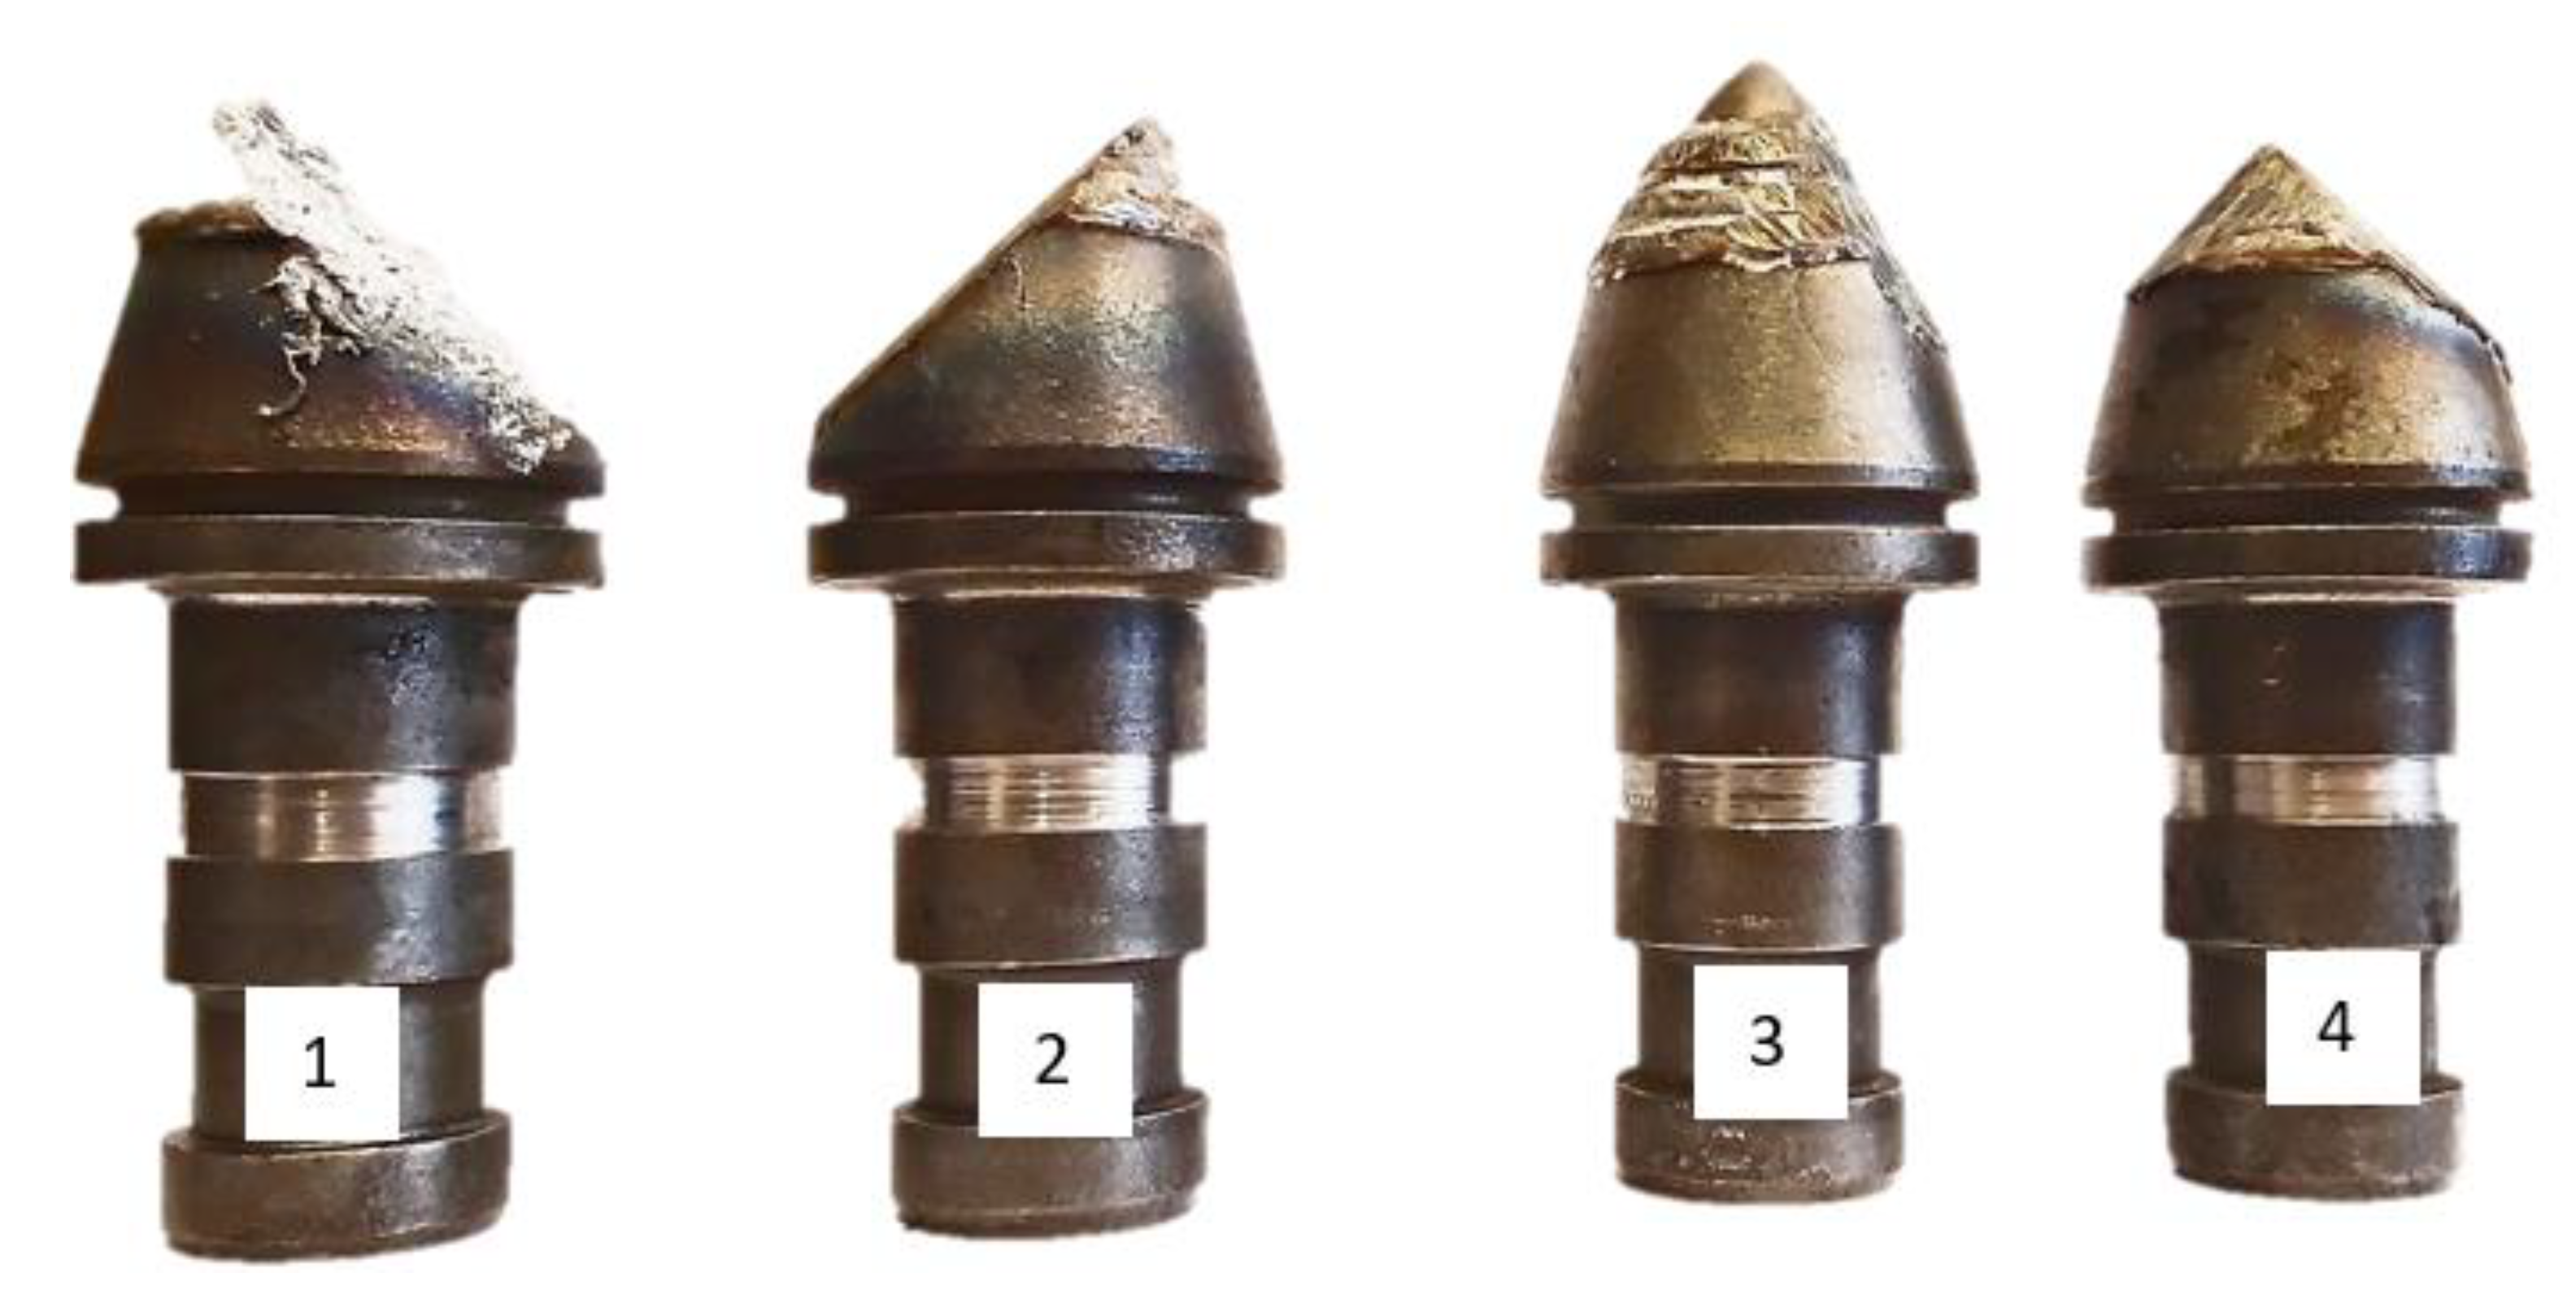
After breaking the mineral sample, the conical picks were removed from the test disc and photographed (Figure 18, Figure 19 and Figure 20). The numbers on the figures correspond with the tool position on the test disc. Next, the cut output Vu was assessed to be later substituted into the C2 parameter formula. The results for every pick (1, 2, 3, and 4) in each set (N1, N2, and N3) are presented in Table 1, Table 2 and Table 3, respectively. The mean values for each set are aggregated in Table 4. It is noticeable that the wear rate of tested picks strongly depends on their position on the test disc. Considering the obtained C2 parameter values (both for separate tools and whole sets), it appears that the N1 set scored the lowest value, the N3 the highest, and the N2 set placed itself in between.
4.2. Conical Pick Volume Loss Assessment
After the mass loss assessment, a similar routine was performed to measure the volumetric loss. The input data was extracted from the 3D models of the examined tools, both before and after the test. The corresponding stereolithographic objects in the .stl format were scaled and aligned concerning the main axis and bottom of the working part of the scanned conical picks. The resulting point clouds were subjected to Delaunay triangulation. Next, the volumes of pre- and post-test solids were calculated, and the volume of the exploited tool was subtracted from the volume of the brand-new one. An exemplary result of the N1 (position 1) tool is visible in Figure 21. Similarly, to the mass loss outcome values, the final volume loss values were combined in the consecutive Table 5, Table 6 and Table 7, and their mean values were aggregated in Table 8. In this case, it also appeared that the volumetric loss strongly depended on the position of a particular pick on the test disc. It confirms a correlation between the traditional C2 wear rate parameter and the proposed C3 parameter. Additionally, the authors compared the selected range of linear dimensions (measured with calliper and height gauge) (Figure 9, Figure 10 and Figure 11) with the measured digitally on the scans (Figure 22). The results seem promising and may simplify the measuring routine in the future, especially if the WC-Co insert could be measured with higher precision. Another future development possibility is to also implement ultrasonic density scanning, which could enable the user to determine the exact dimensions of the tool tip without using destructive methods. Both dimensional measurements and ultrasonic inspection could greatly aid the quality control departments of the manufacturer’s company and the mines.
5. Discussion
Having the experiment conducted adequately, the wear rate of the studied sets of conical picks (and their protective coatings) could be assessed. The authors underline that all test parameters (tool arrangement, mineral sample composition, feed and cutting speed) were kept constant during every test run. Hence the calculated C2 (and C3) parameters can be treated as reliable. In the case of both assessed parameters (C2 and C3), the lower score the given tool has, the better. Thus, its durability and wear resistance are considered higher. Table 9 contains aggregated results of C2 (mass loss) and C3 (volumetric loss) for every tested conical pick of all three sets (N1, N2, and N3, arranged concerning the position on the test disc and also the average values for every set.
The lowest value of the C2 parameter was scored by N1 (C2_N1 = 27.614) tools set with a thin layer of automatically applied hardfacing coating, meaning that their properties offer the highest wear resistance and most extended lifecycle. The N3 set of tools—with singular, circular hard facing resembling a steel ring—scored C2_N3 = 34.972, a 26% higher value compared to the set N1. The N2 set of tools scored the highest value (C2_N2 = 40.695), which was approx. 47% higher than the N1 set (Table 2).
Analysing the values of C3 parameters, the authors confirmed that the minor volumetric loss was still observed in the N1 toolset. The C3 values for toolset N2 and toolset N3 were fundamentally very similar (Table 8), slightly diverging from the results of mass loss measurement.
Notably, the tool position on the test disc has a noticeable impact on the pick durability (Figure 13)—mainly because the cutting force differs for each angular deviation. It is evident on the C2 and C3 values for every tool mounted on position 3—regardless of the tool set, the wear was close to none. The highest tool degradation was observed at positions 1 (N2, N3) and 2 (N1).
On average, the lowest C2 and C3 scores were observed among the N1 set of conical picks. Those tools had their surface coated with a protective layer originally by the manufacturer. The N2 set consisted of the same tools. However, the user modified their surface, and the test has proven that it was counterproductive. Regardingthe highest C2 and C3 results, the fastest mass loss was observed in the N2 group, and the fastest volume loss was observed in the N3 group. Nevertheless, the C3 parameter values obtained for N2 and N3 sets were barely different (C3_N2 = 82.80, and C3_N3 = 84.0). It leads to the conclusion that the volumetric loss assessment method needs further development to enhance precision and reliability.
The ability to perform linear measurements of the digital model seems to be the most profitable outcome of the presented method (Table 10). The drawbacks of the current 3D-scanning setup are mainly related to the focal point. In this test, the authors focused the camera on the hardfaced coating protective layer (with many characteristic points for the reconstruction software) and not on the WC-Co insert (which has a smooth, reflective surface). This problem can be solved either by performing more consecutive scans with different camera angles or adding a secondary camera to perform stereometric photogrammetry. The brazing filler impeded the measurement of the WC-Co insert diameter, which obstructed looking for the insert boundaries projected on a 2D plane.
6. Conclusions
The experiment confirmed that keeping the cutting parameters constant, the wear rate is influenced by the type of hardfaced coating and the position on the test disc. It leads to the conclusion that the hardfacing can have a positive or negative influence on the pick durability if applied with incorrect parameters—for instance, the variable geometry of the padding can block the rotational motion of the tool, resulting in observably faster wear. The additional thick, wear-resistant layer should increase the lifespan of the cutting tool. However, the lowest C2 score was noted in the pick set N1, which was hardfaced by the original manufacturer with a thin coating layer.
The C3 measurement of volumetric loss is also helpful. Nevertheless, compliance with the C2 parameter must be improved. By this time, the most significant advantage of the volumetric measurement is the possibility of performing linear, diametral, and angular measurements. Therefore, further work is proposed to improve the effectiveness of evaluating the picks’ volumetric wear.
Author Contributions
Conceptualization, J.P. and A.W.-P.; Methodology, K.K. and J.P.; Software, J.P. and A.W.-P.; Validation, T.W.; Formal analysis, K.M., J.P. and T.W.; Writing—original draft, K.M. and J.P.; Writing—review & editing, K.M.; Visualization, A.W.-P.; Supervision, K.K. All authors have read and agreed to the published version of the manuscript.
Funding
Works financed by the AGH University of Science and Technology.
Institutional Review Board Statement
Not applicable.
Informed Consent Statement
Not applicable.
Data Availability Statement
Data presented in the article are original and not inappropriately selected, manipulated, enhanced, or fabricated.
Conflicts of Interest
The authors declare no conflict of interest.
References
- Mendez, P.F.; Barnes, N.; Bell, K.; Borle, S.D.; Gajapathi, S.S.; Guest, S.D.; Izadi, H.; Gol, A.K.; Wood, G. Welding processes for wear resistant overlays. J. Manuf. Process. 2014, 16, 4–25. [Google Scholar] [CrossRef]
- Cheluszka, P.; Mikuła, S.; Mikuła, J. Theoretical consideration of fatigue strengthening of conical picks for rock cutting. Tunn. Undergr. Space Technol. 2022, 125, 104481. [Google Scholar] [CrossRef]
- Kotwica, K. Atypical and innovative tool, holder and mining head designed for roadheaders used to tunnel and gallery drilling in hard rock. Tunn. Undergr. Space Technol. 2018, 82, 493–503. [Google Scholar] [CrossRef]
- Krauze, K.; Bołoz, Ł.; Wydro, T.; Mucha, K. Investigations into the wear rate of conical picks with abrasion-resistant coatings in laboratory conditions. IOP Conf. Ser. Mater. Sci. Eng. 2019, 679, 012012. [Google Scholar] [CrossRef]
- Bołoz, Ł. Directions for increasing conical picks’ durability. New Trends Prod. Eng. 2019, 2, 277–286. [Google Scholar] [CrossRef] [Green Version]
- Krauze, K.; Mucha, K.; Wydro, T. Evaluation of the Quality of Conical Picks and the Possibility of Predicting the Costs of Their Use. Multidiscip. Asp. Prod. Eng. 2020, 3, 491–504. [Google Scholar] [CrossRef]
- Shi, Z.; Zhu, Z. Case study: Wear analysis of the middle plate of a heavy-load scraper conveyor chute under a range of operating conditions. Wear 2017, 380, 36–41. [Google Scholar] [CrossRef]
- Okechukwu, C.; Dahunsi, O.A.; Oke, P.K.; Oladele, I.O.; Dauda, M. Development of hardfaced crusher jaws using ferro-alloy hardfacing inserts and low carbon steel substrate. J. Tribol. 2018, 18, 20–39. [Google Scholar]
- Cleary, P.W.; Sinnott, M.D.; Morrison, R.D.; Cummins, S.; Delaney, G.W. Analysis of cone crusher performance with changes in material properties and operating conditions using DEM. Miner. Eng. 2017, 100, 49–70. [Google Scholar] [CrossRef]
- Guido Mine Touristic Brochure. Available online: www.kopalniaguido.pl (accessed on 16 November 2022).
- Takraf Tenova Product Brochure. Available online: www.tenova.com (accessed on 16 November 2022).
- Ayadi, S.; Hadji, A. Effect of Chemical Composition and Heat Treatments on the Microstructure and Wear Behavior of Manganese Steel. Inter. Metalcast 2021, 15, 510–519. [Google Scholar] [CrossRef]
- Tęcza, G.; Sobula, S. Effect of Heat Treatment on Change Microstructure of Cast High-manganese Hadfield Steel with Elevated Chromium Content. Arch. Foundry Eng. 2014, 14, 67–70. [Google Scholar]
- Kato, H.; Eyre, T.S.; Ralph, B. Wear mechanism map of nitrided steel. Acta Metall. Mater. 1994, 42, 1703–1713. [Google Scholar] [CrossRef]
- Wu, Q.; Qin, T.; Shen, M.; Rong, K.; Xiong, G.; Peng, J. Effect of Gas Nitriding on Interface Adhesion and Surface Damage of CL60 Railway Wheels under Rolling Contact Conditions. Metals 2020, 10, 911. [Google Scholar] [CrossRef]
- Krawczyk, K.; Bembenek, M.; Pawlik, J. The Role of Chemical Composition of High-Manganese Cast Steels on Wear of Excavating Chain in Railway Shoulder Bed Ballast Cleaning Machine. Materials 2021, 14, 7794. [Google Scholar] [CrossRef] [PubMed]
- Ahmed, S. Hardfaced Wear-Resistant Coatings for Mining Tools. Master’s Thesis, Tampere University, Tampere, Finland, 2019. [Google Scholar]
- Pawlik, J.; Cieślik, J.; Bembenek, M.; Góral, T.; Kapayeva, S.; Kapkenova, M. On the Influence of Linear Energy/Heat Input Coefficient on Hardness and Weld Bead Geometry in Chromium-Rich Stringer GMAW Coatings. Materials 2022, 15, 6019. [Google Scholar] [CrossRef] [PubMed]
- Bembenek, M.; Prysyazhnyuk, P.; Shihab, T.; Machnik, R.; Ivanov, O.; Ropyak, L. Microstructure and Wear Characterization of the Fe-Mo-B-C—Based Hardfacing Alloys Deposited by Flux-Cored Arc Welding. Materials 2022, 15, 5074. [Google Scholar] [CrossRef]
- Betek Product Brochure. Available online: www.betek.de (accessed on 26 November 2022).
- Kasztelewicz, Z.; Bodziony, P.; Patyk, M.; Zajączkowski, M. Koparki Jednonaczyniowe: Budowa i Technologia Pracy; Agencja Wydawniczo-Poligraficzna ART-TEKST: Poland, Kraków, 2017. [Google Scholar]
- Technogenia Product Brochure. Available online: www.technogenia.com (accessed on 2 December 2022).
- Nahak, S.; Dewangan, S.; Chattopadhyaya, S.; Królczyk, G.; Hloch, S. Discussion on Importance of Tungsten Carbide-Cobalt (Wc-Co) Cemented Carbide and Its Critical Characterization for Wear Mechanisms Based on Mining Applications. Arch. Min. Sci. 2018, 63, 1. [Google Scholar] [CrossRef]
- Katiyar, P.K.; Singh, P.K.; Singh, R.; Iava Kumar, A. Modes of failure of cemented tungsten carbide tool bits (WC/Co): A study of wear parts. Int. J. Refract. Met. Hard Mater. 2016, 54, 27–38. [Google Scholar] [CrossRef]
- Chinnasamy, M.; Rathanasamy, R.; Palaniappan, S.K.; Pal, S.K. Microstructural Transformation Analysis of Cryogenic Treated Conical Rock Cutting Bits for Mining Applications. Int. J. Refract. Met. Hard Mater. 2023, 110, 105995. [Google Scholar] [CrossRef]
- Mucha, K.; Augustyn-Nadzieja, J.; Szczotok, A.; Krauze, K. An Improved Procedure for the Quality Control of Sintered Carbide Tips for Mining Applications, Based on Quantitative Image Analysis of the Microstructure. Materials 2021, 14, 1236. [Google Scholar] [CrossRef]
- Averin, E.; Zhabin, A.; Polyakov, A.; Linnik, Y.; Linnik, V. Transition between relieved and unrelieved modes when cutting rocks with conical picks. PMI 2021, 249, 329–333. [Google Scholar] [CrossRef]
- Hurt, K.G.; MacAndrew, K.M. Cutting Efficiency and Life of Rock-Cutting Picks. Min. Sci. Technol. 1985, 2, 139–151. [Google Scholar] [CrossRef]
- Palaniappan, S.K.; Pal, S.K.; Dikshit, M.P. A Study on Rock Cutting Forces and Wear Mechanisms of Coated Picks by Lab-Scale Linear Cutting Machine. In Proceedings of the 28th International Symposium on Mine Planning and Equipment Selection—MPES 2019; Topal, E., Ed.; Springer Series in Geomechanics and Geoengineering; Springer: Cham, Switzerland, 2020. [Google Scholar] [CrossRef]
- Palaniappan, S.K.; Pal, S.K.; Chinnasamy, M.; Rathanasamy, R. Efficiency of Rock Cutting and Wear Behavior of Coated Bits via Lab-Scale Linear Rock-Cutting Machine, Experimental Approach. Int. J. Geomech. 2022, 23, 06022041. [Google Scholar] [CrossRef]
- Pawlik, J.; Wróblewska-Pawlik, A.; Bembenek, M. The Volumetric Wear Assessment of a Mining Conical Pick Using the Photogrammetric Approach. Materials 2022, 15, 5783. [Google Scholar] [CrossRef] [PubMed]
- Collins, T.; Woolley, S.I.; Gehlken, E.; Chang, E. Automated Low-Cost Photogrammetric Acquisition of 3D Models from Small Form-Factor Artefacts. Electronics 2019, 8, 1441. [Google Scholar] [CrossRef] [Green Version]
- Krauze, K.; Bołoz, Ł.; Wydro, T.; Mucha, K. Durability testing of tangential-rotary picks made of different materials. Min. Inform. Autom. Electr. Eng. 2017, 1, 26–34. [Google Scholar] [CrossRef]
Figure 1.
Worn-out blade endings and pick holders of a milling cutting head.

Figure 2.
Examples of worn-out conical picks.

Figure 3.
Example of a worn-out chute of a scraper conveyor [10].
Figure 3.
Example of a worn-out chute of a scraper conveyor [10].

Figure 4.
Example of worn and snapped teeth of a roller crusher [11].
Figure 4.
Example of worn and snapped teeth of a roller crusher [11].

Figure 5.
Machine parts with abrasion-resistant coatings: (a) tungsten carbide coating, (b) hardfacing, and (c) composite plates [20,21,22].


Figure 6.
Mining cutting picks: (a) tangent, (b) radial, and (c) conical.

Figure 7.
Conical pick: (a). brand new: 1—WC-Co insert, 2—working part, 3—handle part, and (b). worn out example with fallen off WC-Co insert.
Figure 7.
Conical pick: (a). brand new: 1—WC-Co insert, 2—working part, 3—handle part, and (b). worn out example with fallen off WC-Co insert.

Figure 8.
Conical picks with hardfaced working surface.

Figure 9.
Set of N1 picks before testing.

Figure 10.
Set of N2 picks before testing.

Figure 11.
Set of N3 picks before testing.

Figure 12.
Laboratory test stand for testing by cutting or rotary drilling with single cutting tools or heads: (a) operator’s cab, (b) concrete sample with linear displacement system, and (c) cutting head (test disc) drive.
Figure 12.
Laboratory test stand for testing by cutting or rotary drilling with single cutting tools or heads: (a) operator’s cab, (b) concrete sample with linear displacement system, and (c) cutting head (test disc) drive.

Figure 13.
Diagram of the applied pick set with the marking of picks’ numbers [33].
Figure 13.
Diagram of the applied pick set with the marking of picks’ numbers [33].

Figure 14.
Schematic of the algorithm used to estimate the C2 parameter.

Figure 15.
A view of the scanning setup: (a) alignment of the camera with respect to the scanned object and photography tent, and (b) detailed view of the setup: 1—tent’s background, 2—digitally controlled turntable, 3—scanned tool, 4—additional markers.
Figure 15.
A view of the scanning setup: (a) alignment of the camera with respect to the scanned object and photography tent, and (b) detailed view of the setup: 1—tent’s background, 2—digitally controlled turntable, 3—scanned tool, 4—additional markers.

Figure 16.
Schematic of consecutive steps of conical pick geometry capture: (a) exemplary 2D image of the scanned tool, (b) reconstructed 3D model with texture (white rectangles correspond with camera position), (c) stereolitographic model with minor filtering applied, and (d) view of maximal (red) and minimal (blue) cross-sectional projection compared to the uniform cross-section of the template tool (dashed line).

Figure 17.
Schematic of the algorithm used to estimate the volumes of conical picks before and after exploitation and compare their difference.
Figure 17.
Schematic of the algorithm used to estimate the volumes of conical picks before and after exploitation and compare their difference.

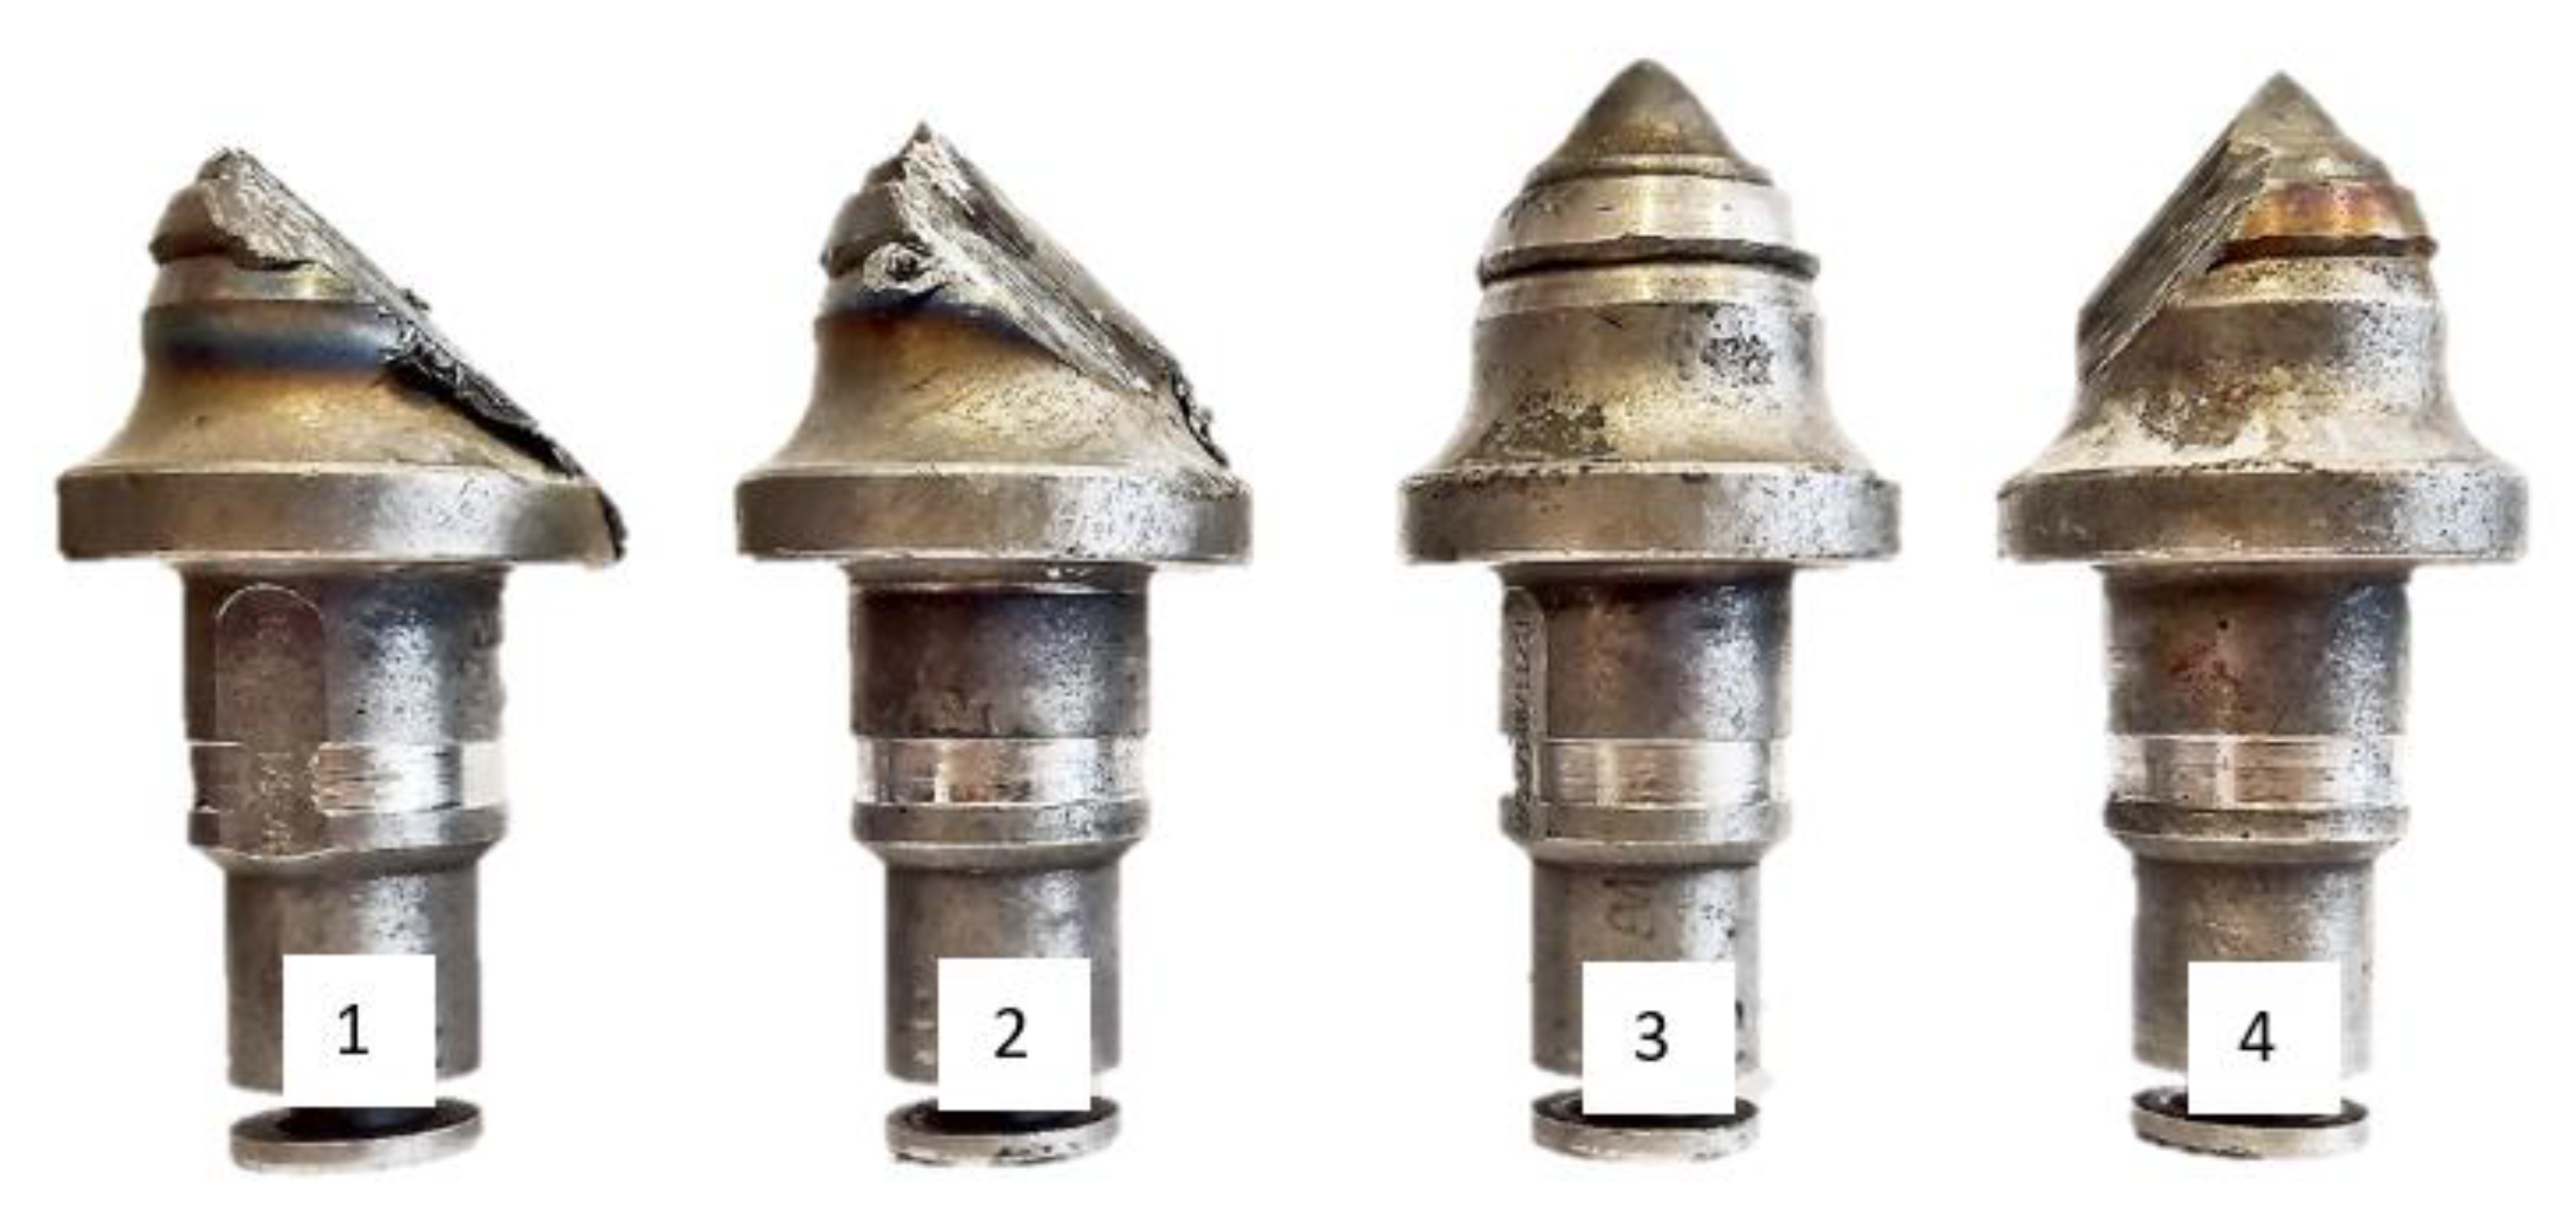
Figure 18.
Set of de-mounted, exploited N1 conical picks, prepared for mass and volume measurements.
Figure 18.
Set of de-mounted, exploited N1 conical picks, prepared for mass and volume measurements.

Figure 19.
Set of de-mounted, exploited N2 conical picks, prepared for mass and volume measurements.
Figure 19.
Set of de-mounted, exploited N2 conical picks, prepared for mass and volume measurements.

Figure 20.
Set of de-mounted, exploited N3 conical picks, prepared for mass and volume measurements.
Figure 20.
Set of de-mounted, exploited N3 conical picks, prepared for mass and volume measurements.

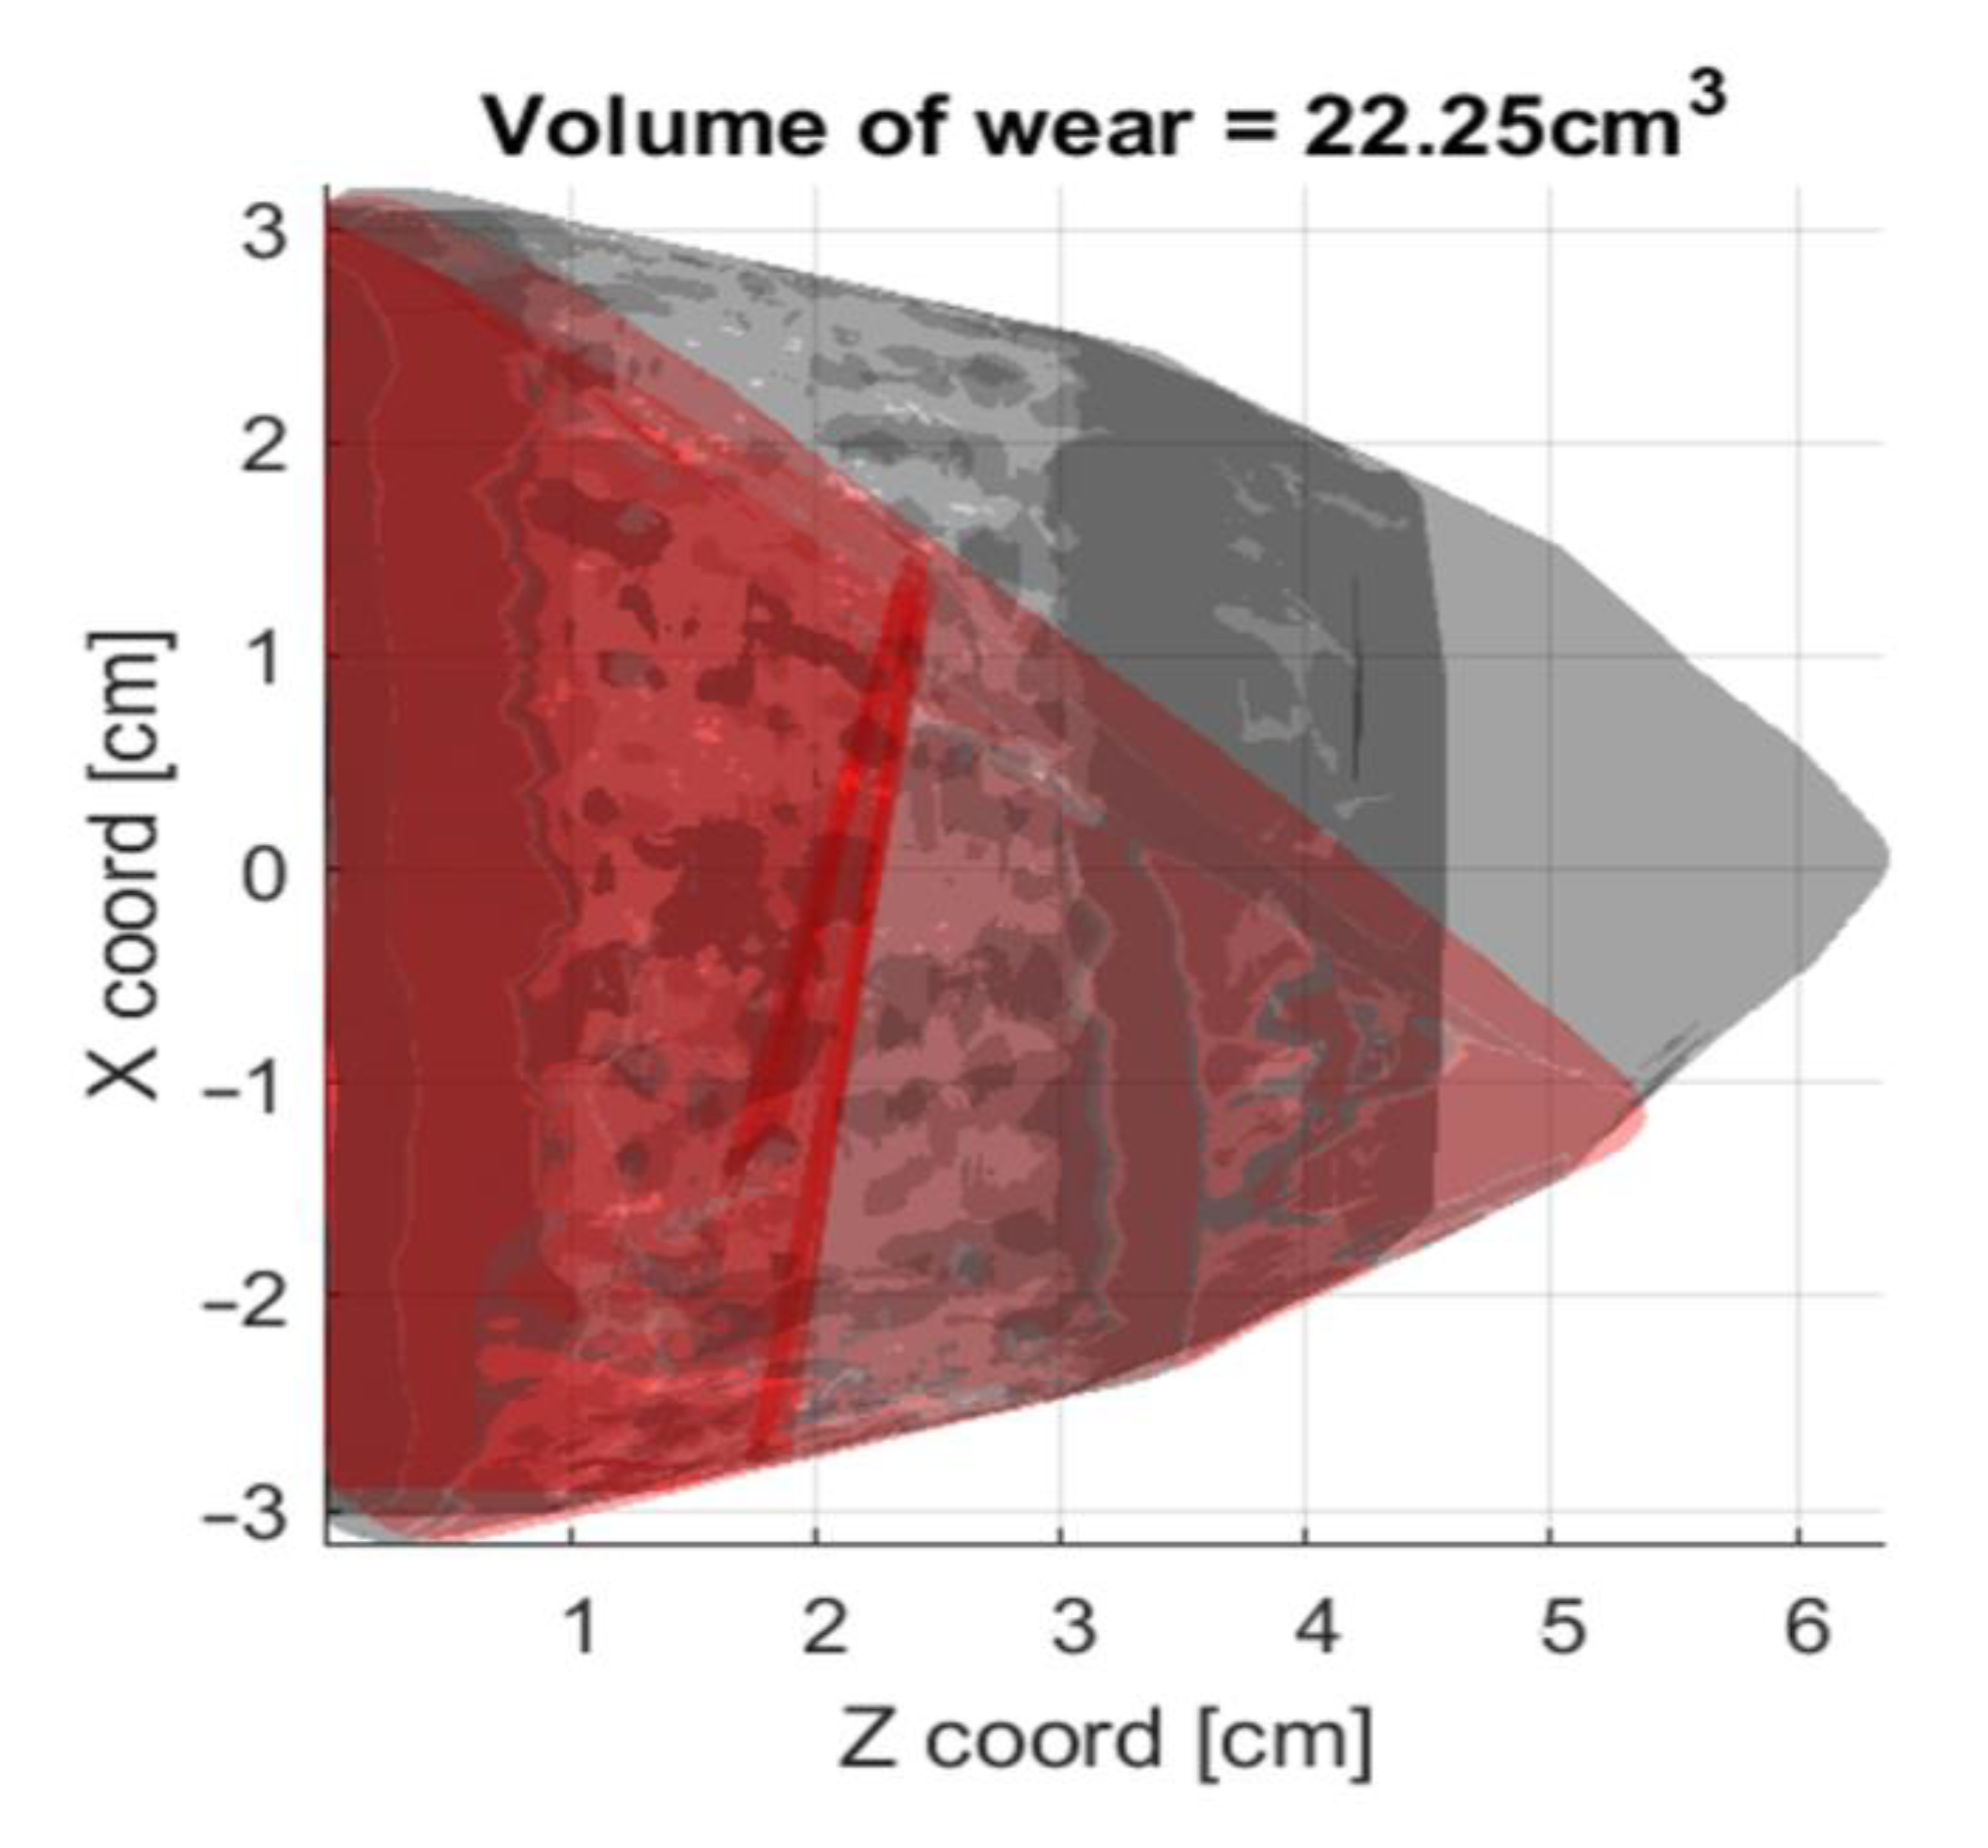
Figure 21.
Exemplary result fromf measurement of the volumetric loss of N1 pick (position 1). The grey outline refers to the brand-new tool scan, the red one shows the minimal cross-section of the particular tool.
Figure 21.
Exemplary result fromf measurement of the volumetric loss of N1 pick (position 1). The grey outline refers to the brand-new tool scan, the red one shows the minimal cross-section of the particular tool.

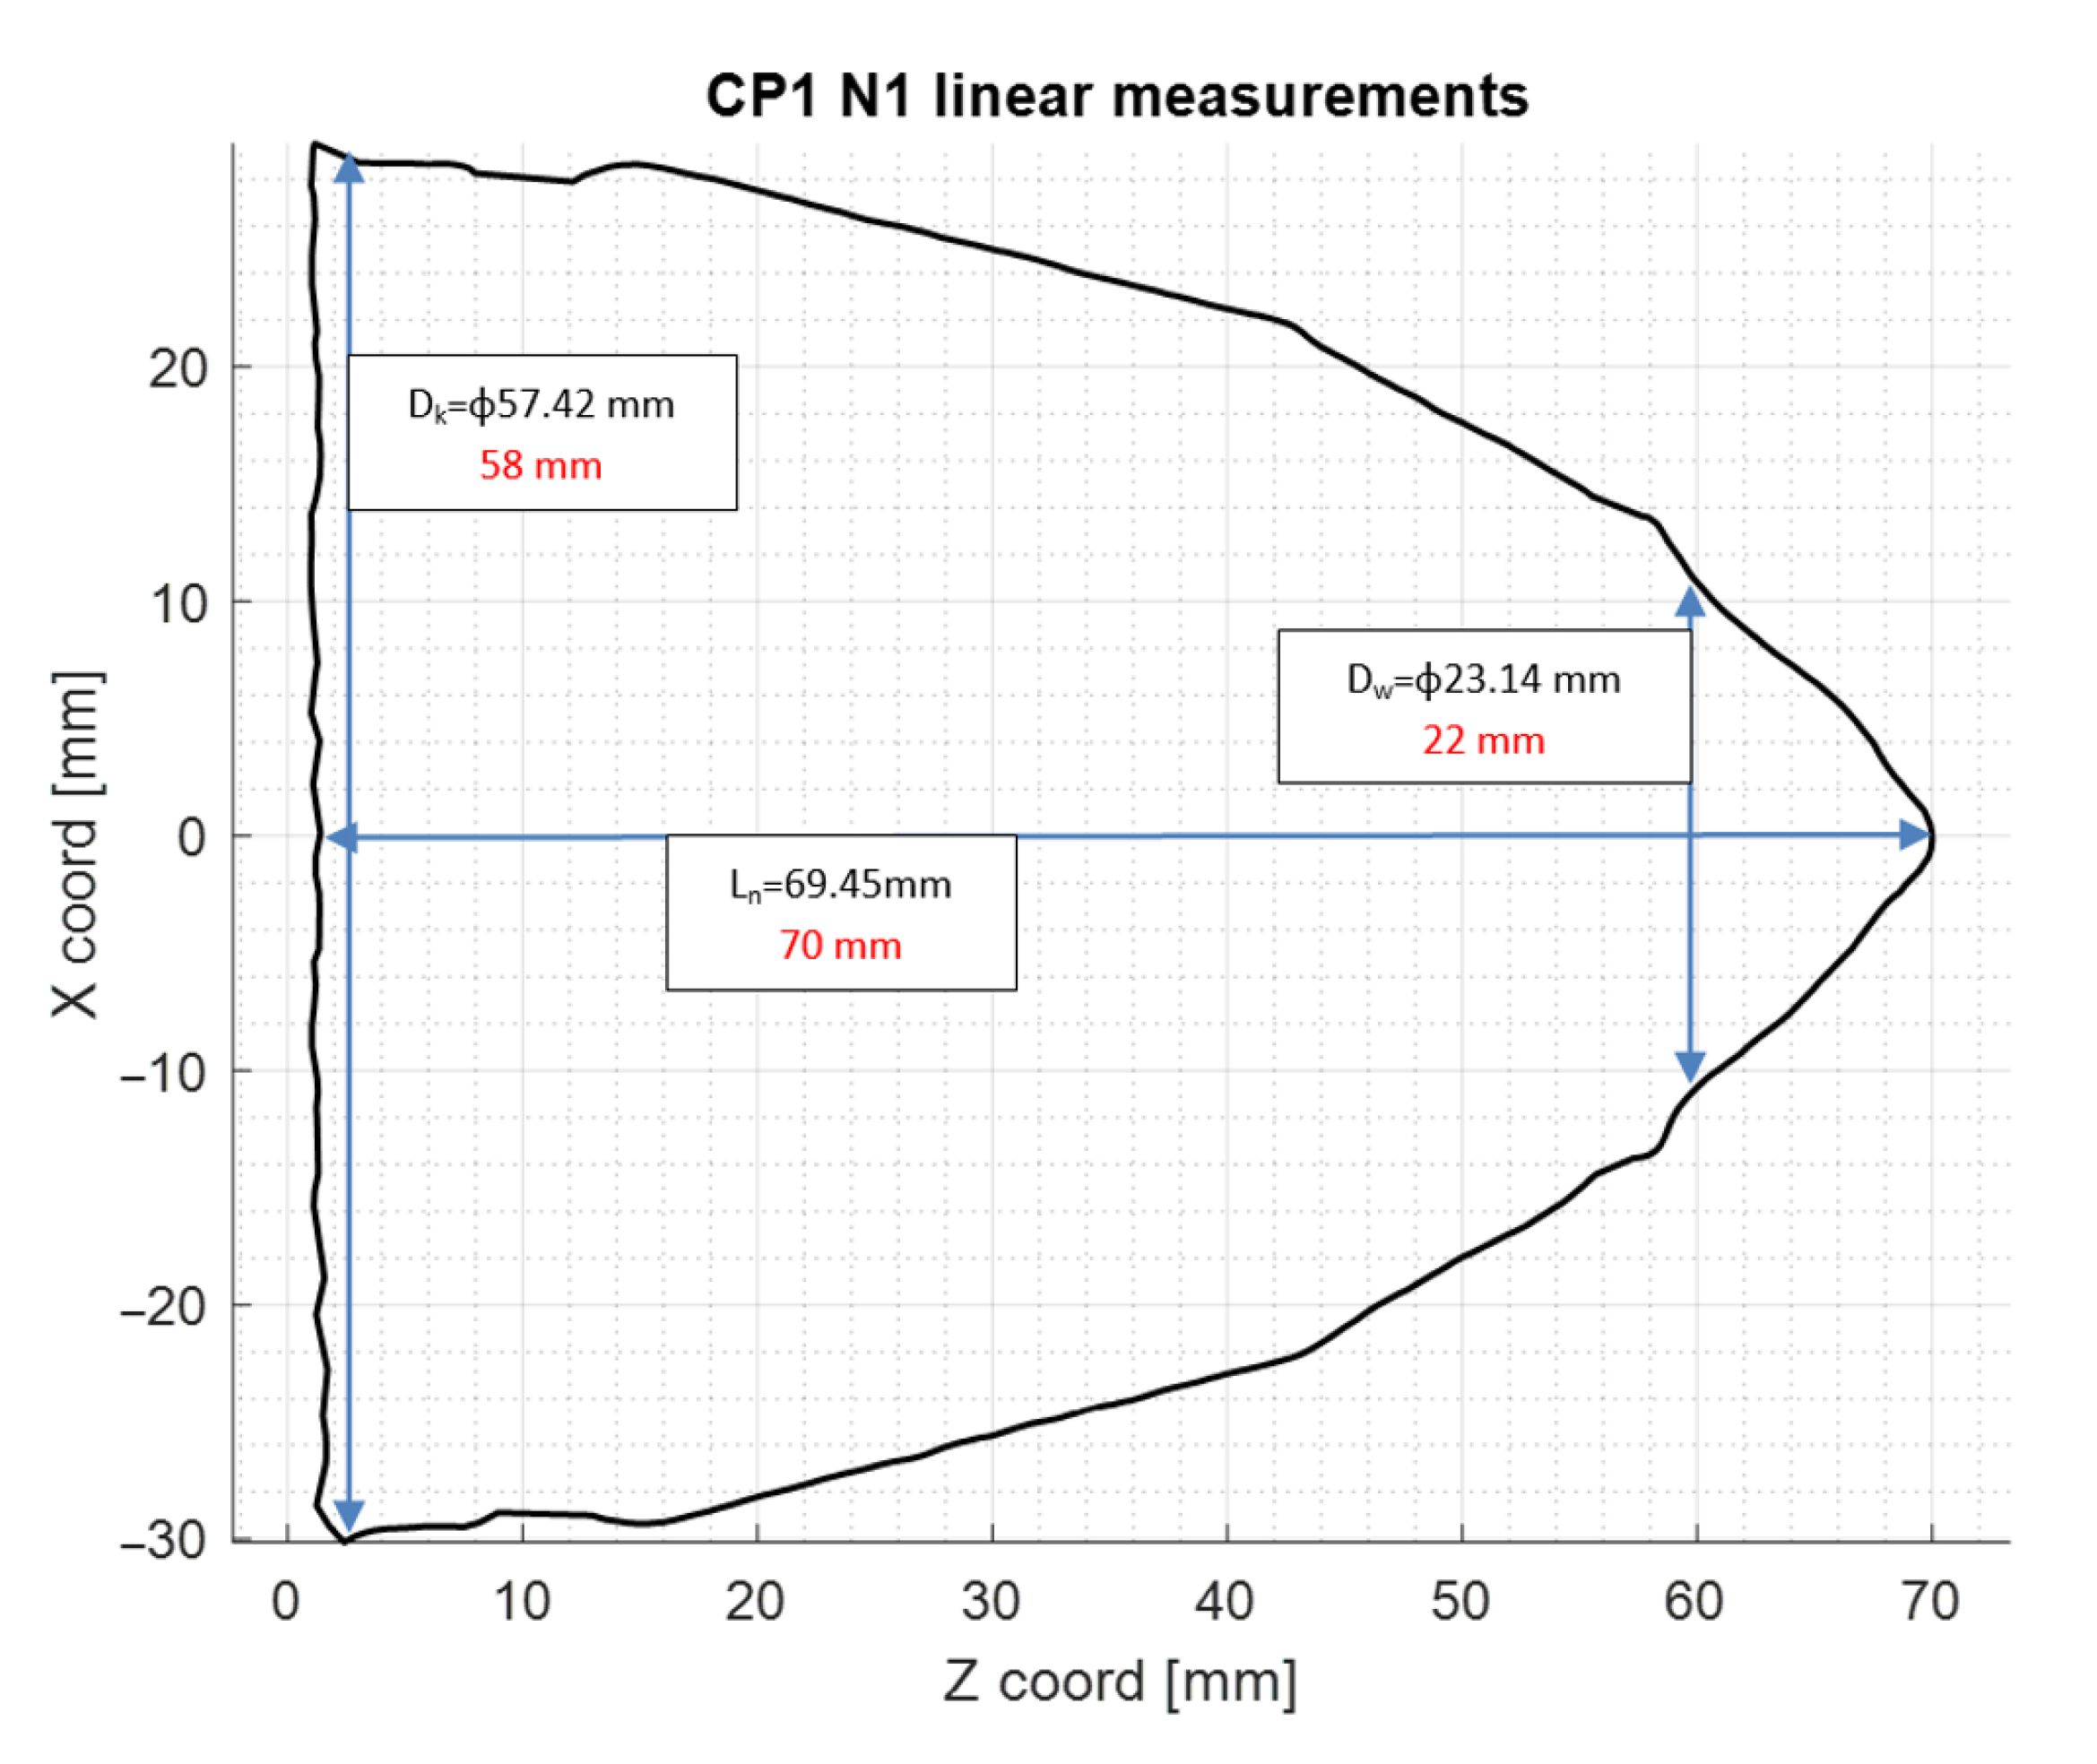
Figure 22.
Averaged cross-sectional dimensions of the scanned N1 (position 1) pick. The black dimensions refer to the virtual measurement of the scan, and the red dimensions refer to the manually measured values.
Figure 22.
Averaged cross-sectional dimensions of the scanned N1 (position 1) pick. The black dimensions refer to the virtual measurement of the scan, and the red dimensions refer to the manually measured values.


Table 1.
A comparison table of the measured and calculated C2 values for the N1 set of tools.
| Pick N1 | Initial Volume of Mineral Sample Vw = 5 × 106 cm3 | ||||||
|---|---|---|---|---|---|---|---|
| Lp. | Position on the Test Disc | Manufacturer’s Description | Mass of the Pick | Tool’s Mass Loss Δm = m − mp [g] | Cut Output Vu [cm3] | C2 [–] | |
| Before Test m [g] | After Test mp [g] | ||||||
| 1 | 1 | - | 1534.59 | 1335.18 | 199.41 | 12 × 103 | 54.14 |
| 2 | 2 | - | 1533.80 | 1348.44 | 185.36 | 50.35 | |
| 3 | 3 | - | 1527.27 | 1524.15 | 3.12 | 0.85 | |
| 4 | 4 | - | 1539.10 | 1520.24 | 18.86 | 5.11 | |
| Mean value of relative mass loss of pick C2: | C2: 27.61 | ||||||
Table 2.
A comparison table of the measured and calculated C2 values for the N2 set of tools.
| Pick N2 | Initial Volume of Mineral Sample Vw = 5 × 106 cm3 | ||||||
|---|---|---|---|---|---|---|---|
| Lp. | Position on the Test Disc | Manufacturer’s Description | Mass of the Pick | Tool’s Mass Loss Δm = m − mp [g] | Cut Output Vu [cm3] | C2 [–] | |
| Before Test m [g] | After Test mp [g] | ||||||
| 1 | 1 | - | 1543.70 | 1335.18 | 208.52 | 12 × 103 | 56.28 |
| 2 | 2 | - | 1552.71 | 1328.08 | 224.63 | 60.28 | |
| 3 | 3 | - | 1552.60 | 1531.80 | 20.80 | 5.58 | |
| 4 | 4 | - | 1548.64 | 1397.61 | 151.03 | 40.64 | |
| Mean value of relative mass loss of pick C2: | C2: 40.70 | ||||||
Table 3.
A comparison table of the measured and calculated C2 values for the N3 set of tools.
| Pick N3 | Initial Volume of Mineral Sample Vw = 5 × 106 cm3 | ||||||
|---|---|---|---|---|---|---|---|
| Lp. | Position on the Test Disc | Manufacturer’s Description | Mass of the Pick | Tool’s Mass Loss Δm = m − mp [g] | Cut Output Vu [cm3] | C2 [–] | |
| Before Test m [g] | After Test mp [g] | ||||||
| 1 | 1 | - | 1381.42 | 1193.46 | 187.96 | 9 × 10³ | 74.57 |
| 2 | 2 | - | 1380.98 | 1255.93 | 125.05 | 49.65 | |
| 3 | 3 | - | 1382.53 | 1381.18 | 1.35 | 0.54 | |
| 4 | 4 | - | 1383.46 | 1345.33 | 38.13 | 15.11 | |
| Mean value of relative mass loss of pick C2: | C2: 34.97 | ||||||
Table 4.
A comparison table for the mean values of the C2 parameter for N1, N2, and N3 tools.
| Lp. | Position on the Test Disc | Pick N1 | Pick N2 | Pick N3 |
|---|---|---|---|---|
| 1 | 1 | 54.14 | 56.28 | 74.60 |
| 2 | 2 | 50.35 | 60.28 | 49.65 |
| 3 | 3 | 0.85 | 5.58 | 0.54 |
| 4 | 4 | 5.11 | 40.64 | 15.11 |
| Mean C2 | 27.61 | 40.70 | 34.97 | |
Table 5.
A comparison table of the measured and calculated C3 values for the N1 set of tools.
| Pick N1 | Initial Volume of Mineral Sample Vw = 5 × 106 cm3 | ||||||
|---|---|---|---|---|---|---|---|
| Lp. | Position on the Test Disc | Manufacturer’s Description | Pick Volume | Volumetric loss ΔV = V − Vp [cm3] | Cut Output Vu [cm3] | C3 [–] | |
| Before Test V [cm3] | After Test Vp [cm3] | ||||||
| 1 | 1 | - | 110.39 | 88.14 | 22.25 | 12 × 103 | 84.00 |
| 2 | 2 | - | 117.98 | 92.57 | 25.41 | 89.70 | |
| 3 | 3 | - | 108.77 | 108.77 | 0 | 0 | |
| 4 | 4 | - | 116.74 | 113.22 | 3.52 | 12.60 | |
| Mean value of relative volumetric loss of pick C3: | C3: 46.60 | ||||||
Table 6.
A comparison table of the measured and calculated C3 values for the N2 set of tools.
| Pick N2 | Initial Volume of Mineral Sample Vw = 5 × 106 cm3 | ||||||
|---|---|---|---|---|---|---|---|
| Lp. | Position on the Test Disc | Manufacturer’s Description | Pick Volume | Volumetric Loss ΔV = V − Vp [cm3] | Cut output Vu [cm3] | C3 [–] | |
| Before Test V [cm3] | After Test Vp [cm3] | ||||||
| 1 | 1 | - | 117.89 | 87.97 | 29.92 | 12 × 103 | 105.70 |
| 2 | 2 | - | 113.08 | 82.90 | 30.18 | 111.20 | |
| 3 | 3 | - | 118.55 | 107.36 | 11.19 | 39.30 | |
| 4 | 4 | - | 113.50 | 93.11 | 17.96 | 74.80 | |
| Mean value of relative volumetric loss of pick C3: | C3: 82.80 | ||||||
Table 7.
A comparison table of the measured and calculated C3 values for the N3 set of tools.
| Pick N3 | Initial Volume of Mineral Sample Vw = 5 × 106 cm3 | ||||||
|---|---|---|---|---|---|---|---|
| Lp. | Position on the Test Disc | Manufacturer’s Description | Pick volume | Volumetric Loss ΔV = V − Vp [cm3] | Cut Output Vu [cm3] | C3 [–] | |
| Before Test V [cm3] | After Test Vp [cm3] | ||||||
| 1 | 1 | - | 71.22 | 48.07 | 23.15 | 9 × 10³ | 180.60 |
| 2 | 2 | - | 73.94 | 60.62 | 13.32 | 100.10 | |
| 3 | 3 | - | 69.11 | 69.11 | 0 | 0 | |
| 4 | 4 | - | 73.39 | 66.09 | 7.31 | 55.30 | |
| Mean value of relative volumetric loss of pick C3: | C3: 84.00 | ||||||
Table 8.
A comparison table for the mean values of the C3 parameter for the N1, N2, and N3 tools.
| Lp. | Position On The Test Disc | Pick N1 | Pick N2 | Pick N3 |
|---|---|---|---|---|
| 1 | 1 | 84.0 | 105.70 | 180.60 |
| 2 | 2 | 89.7 | 111.20 | 100.10 |
| 3 | 3 | 0 | 39.30 | 0 |
| 4 | 4 | 12.60 | 74.80 | 55.30 |
| Mean C3 | 46.60 | 82.80 | 84.00 | |
Table 9.
A comparison table of mean values of the C2 and C3 parameters for each tool of the N1, N2, and N3 set.
Table 9.
A comparison table of mean values of the C2 and C3 parameters for each tool of the N1, N2, and N3 set.
| Lp. | Position on the Test Disk | Pick N1 | Pick N2 | Pick N3 | |||
|---|---|---|---|---|---|---|---|
| C2 | C3 | C2 | C3 | C2 | C3 | ||
| 1 | 1 | 54.14 | 84.00 | 56.28 | 105.70 | 74.60 | 180.60 |
| 2 | 2 | 50.35 | 89.70 | 60.28 | 111.20 | 49.65 | 100.10 |
| 3 | 3 | 0.85 | 0 | 5.58 | 39.30 | 0.54 | 0 |
| 4 | 4 | 5.10 | 12.60 | 40.64 | 74.80 | 15.11 | 55.30 |
| Mean | 27.61 | 46.60 | 40.70 | 82.80 | 34.97 | 84.00 | |
Table 10.
A comparison table of mean values of the selected diameters and working parts’ heights of N1, N2, and N3 pick.
Table 10.
A comparison table of mean values of the selected diameters and working parts’ heights of N1, N2, and N3 pick.
| Pick Dimension | Pick N1 | Pick N2 | Pick N3 | ||||||
|---|---|---|---|---|---|---|---|---|---|
| Manual Measurement | Scan Measurement | Difference | Manual Measurement | Scan Measurement | Difference | Manual Measurement | Scan Measurement | Difference | |
| Ln | 70.00 | 69.45 | −0.55 | 70.00 | 69.12 | −0.88 | 65.00 | 63.98 | −1.02 |
| Dk | 58.00 | 57.42 | −0.58 | 58.00 | 57.07 | −0.93 | 65.00 | 64.21 | −0.79 |
| Dw | 22.00 | 23.14 | +1.14 | 22.00 | 22.85 | +0.85 | 25.00 | 25.81 | +0.81 |
Disclaimer/Publisher’s Note: The statements, opinions and data contained in all publications are solely those of the individual author(s) and contributor(s) and not of MDPI and/or the editor(s). MDPI and/or the editor(s) disclaim responsibility for any injury to people or property resulting from any ideas, methods, instructions or products referred to in the content. |
© 2023 by the authors. Licensee MDPI, Basel, Switzerland. This article is an open access article distributed under the terms and conditions of the Creative Commons Attribution (CC BY) license (https://creativecommons.org/licenses/by/4.0/).
Share and Cite
MDPI and ACS Style
Krauze, K.; Mucha, K.; Wydro, T.; Pawlik, J.; Wróblewska-Pawlik, A. Mass and Volumetric Abrasive Wear Measurements of the Mining Conical Picks. Sustainability 2023, 15, 850. https://doi.org/10.3390/su15010850
AMA Style
Krauze K, Mucha K, Wydro T, Pawlik J, Wróblewska-Pawlik A. Mass and Volumetric Abrasive Wear Measurements of the Mining Conical Picks. Sustainability. 2023; 15(1):850. https://doi.org/10.3390/su15010850
Chicago/Turabian StyleKrauze, Krzysztof, Kamil Mucha, Tomasz Wydro, Jan Pawlik, and Aleksandra Wróblewska-Pawlik. 2023. "Mass and Volumetric Abrasive Wear Measurements of the Mining Conical Picks" Sustainability 15, no. 1: 850. https://doi.org/10.3390/su15010850
Note that from the first issue of 2016, this journal uses article numbers instead of page numbers. See further details here.