The Impact of Multidimensional Distance on Agricultural Exports: Evidence from China Based on the Technological Added Value


1
School of Economics, Shandong University of Technology, Zibo 255000, China
2
CICERO Center for International Climate Research, 0349 Oslo, Norway
*
Authors to whom correspondence should be addressed.
Sustainability 2023, 15(1), 393; https://doi.org/10.3390/su15010393
Submission received: 15 November 2022
/
Revised: 16 December 2022
/
Accepted: 20 December 2022
/
Published: 26 December 2022
(This article belongs to the Section Economic and Business Aspects of Sustainability)
Abstract
:Agricultural exports are vulnerable to many distance factors such as geographical, cultural, economic and institutional distance. Panel data were collected from 63 countries (from 2002 to 2020), and fixed effects regression models were employed to estimate the impact of multidimensional distance on China’s agricultural exports. Results found that the institutional, geographical, and cultural distance negatively impacted China’s agricultural exports significantly. The economic distance significantly promoted exports due to the demand and complementarity of trade between countries. After the technological added value is considered, the cultural distance significantly promoted the export of high-tech agricultural products. It is confirmed that the institutional distance remained the greatest obstacle to agricultural exports, and economic distance promoted agricultural exports. It is imperative to focus on promoting mutual cultural understanding and communication of institutional policies to stimulate agricultural exports and improve the exports of agricultural products of high technological content.
1. Introduction
The past has witnessed a bloom in cross-border trade, in which demand for agricultural products such as vegetables, fruits, and crops has continued to grow. However, in recent years, China’s trade deficit in farm products has widened sharply, and export growth has been sluggish in terms of products of comparative advantage, forming an imbalanced situation in the structure, supply, and demand for agricultural products [1], and leading to the unsustainability of agricultural exports. Konstantakopoulou [2] revealed that export-oriented policies may guarantee long-term economic growth in all countries except for Italy because the export-led growth is stable over time and foreign trade is significant for their economies [2]. The characteristics of low-technology (low-tech) added value and poor storage make agricultural products more costly to distribute [3,4]. This has, to a certain extent, hindered exports [5,6]. Communication technology and the internet have significantly reduced the intangible distance between countries [7]. The application of new technologies in the field of transport saves transportation time. It accelerates the international circulation of agricultural products, which in turn, facilitates the export of farm products to some extent. Do distance factors reduce or inhibit agricultural exports? Distance in the CAGE (Cultural distance, administrative distance, geographical distance and economic distance) framework refers to the multidimensional distance [8]. With the rapid growth of cross-border e-commerce and digital trade, what is the impact of multidimensional distance on the structure of agricultural exports? Does it affect the sustainability of agricultural trade? The upgrading structure of farming products exports is essential to high-quality trade development. Therefore, the current study aims to identify the impact of distance factors on agricultural exports, explore the optimization of China’s agricultural exports and provide suggestions for minimizing structural imbalance in agricultural trade.
China has vast areas of farmland with abundant agricultural resources. The export of agricultural products is an important part of China’s foreign trade. Distance is a key factor affecting international trade in agricultural products, including the traditional “hard environment” represented by spatial distance and the “soft environment” represented by the institutional, cultural and economic environment which exerts a growing influence on trade [9]. Studies on China’s agricultural trade have focused on factors such as distance dimensions using various methods. The findings indicate that the factors are complex and diverse [10,11]. The natural attributes of agricultural products, such as perishability and storage resistance, mean that their exports are greatly restrained by time and distance [10]. In addition, economic globalization and regional economic integration contribute to the rapid growth of global trade volume [12,13,14], and competition in international trade is becoming increasingly fierce. With the refinement of the division of labor in global value chains, the change in the export product structure can no longer be effectively measured by the trade-volume indicator. Therefore, a trade model for high-quality development requires an increase in the size of exports and an increase in the technological added value of export products [15].
Studies found that geographical distance inhibits the growth of inter-country trade. However, with the development of the “Internet of Things” and transport technologies, the impact of geographical distance on inter-country trade has gradually diminished [16], and the role of other distance factors, represented by culture and economy, has increased progressively. Pankaj Ghemawat summarized cultural, institutional, geographical and economic distances in a comprehensive national distance (CAGE) framework [8]. Some studies focused on the adoption of technology for agricultural sustainability [17,18]. Until now, relatively few studies have emphasized the impact of agricultural trade based on the framework, especially on technological value-added agricultural exports.
The distance factor influences transactions between countries through trade costs, which, as one of the comparative advantage sources, can impact the structure of a country’s exports [19]. When the technological added value is considered, the distance factors’ impact on agricultural exports might change. The trade structure of products is significant to the development of bilateral trade in both theory and practice. The structure of China’s export commodities was optimized in terms of the technological added value index and overall technology level [20]. The increase in the export of high-technology (high-tech) value-added products has a distinct pulling effect on China’s economic growth compared to low-tech value-added products [21]. Su and Zhou [22] found that the economic scale of ASEAN countries significantly impacts the structure of China’s export trade. Chen and Wang analyzed the factors influencing the structure of agricultural trade, and found that all the factors of geographical location, climate conditions, resource endowment and national economic structure greatly impact the structure of agricultural trade [23].
Based on differences in the technological added value in agricultural exports, there are differences in the impact of distance factors on China’s agricultural exports. Bilateral trade between countries is influenced by trade costs [24], mainly including cultural differences, tariffs, legal barriers, market research, transportation, insurance costs, etc. Different combinations of these trade costs generate different trade relationships between countries [25]. Geographical distance indirectly affects bilateral trade by increasing transport and other trade costs, leading to increased conflict and impeding trade flow. Conversely, a reduction in geographical distance helps bilateral trade [26,27,28,29,30,31]. Previous studies found that distance decreased trade by reducing the quantity of goods transported and the number of transport agencies [32], because the impact of geographical distance on trade is essentially related to international transport and port infrastructure. With instant network communication and transport technologies, national transport systems alleviate the impact of geographical distance between countries on international trade [33]. These factors somewhat mitigate the impact of geographical distance on trade [34,35,36], and geographical distance is not always a key factor in assessing why two nations trade in agri-food products [37]. However, trade restriction does not diminish its impact in low-income countries [38]. Although it has also been found that geographical distance does not always negatively affect bilateral trade under the influence of different combinations of factors [39], in general, countries that are geographically close to each other are more inclined to exploit the trade potential of their neighbors [25]. Therefore, we have proposed the given hypothesis (H1).
Hypothesis 1 (H1).
Geographical distance negatively affects agricultural exports.
Institutional distance refers to differences between countries in terms of regulatory, normative, and cognitive systems. The World Bank Worldwide Governance Indicators (WGI) can cover most countries’ differences [40,41,42]. The institutional environment of countries and the institutional distance between countries are important factors affecting bilateral trade [43,44]. Countries with higher institutional quality suffer from fewer formal and informal barriers to trade and are conducive to international trade [45,46,47,48]. Most scholars argue that institutional distance significantly hinders trade [49,50], while a similar institutional environment is conducive to reducing uncertainty in trade policies, thereby reducing transaction costs and facilitating trade flows. Yao et al. argue that institutional distance does not directly affect export but affects exports by influencing geographical distance and increasing the marginal utility of exports [51]. When measuring institutional distance, Xu et al. included cultural distance in the institutional distance and add legal, macro and microeconomic institutions. Their research shows that all four institutional distances are detrimental to cross-border export and import trade [52].
Hypothesis 2 (H2).
Institutional distance negatively affects agricultural exports.
There are different distance elasticities in foreign trade because of differences in religion, cultural background, and consumer preferences [53], which generate different transaction costs [54]. Earlier studies showed that the impact of cultural distance varies because firms in countries with diverse cultural backgrounds prefer trading over production in the host country [49]. Others argue that cultural distance does not significantly impact total trade [55], particularly in China, where the cultural distance is small [56]. However, most studies have demonstrated that as trade flows become more frequent and cultures between countries continue to collide, trade costs typically increase with greater cultural distance and that cultural distance negatively impacts trade [40,49,57,58,59,60].
Hypothesis 3 (H3).
Cultural distance negatively affects agricultural exports.
The current consensus on how economic distance affects international trade is not uniform. The demand for, and complementarity of, traded goods have a favorable influence [61,62,63], while the competitiveness of traded goods has a negative impact [64,65]. Economic distance has progressively been a key factor determining trade costs as a result of globalization’s ongoing expansion [66]. GDP, GDP per capita, economic alienation, and trip time are typically used to assess economic distance [67]. Economic and institutional distance were categorized by Zhang et al. [65,66,67,68] into positive and negative vectors. Most often, gravity models were used to demonstrate that higher GDP will encourage commerce [69,70,71], and countries with higher per capita income will favor the agri-food trade [72]. However, empirical research revealed that the disparity in per capita income had a detrimental effect on agricultural exports [73]. In addition, Su and Zhou [21] showed that the economy-of-scale of ASEAN countries significantly affects China’s export structure and that a free trade agreement (FTA) always has a stronger impact on the creation of new trade than it does on the diversification of existing trade [70]. As a result, the volume of trade will increase under an FTA [74,75]. The competitiveness of traded products has increased due to deepening economic globalization and inter-country dependence. According to the Alchian–Allen effect [73], product complementarity will increase if the income gaps between nations are wide [41], particularly for high-tech agricultural products.
Hypothesis 4 (H4).
Economic distance positively affects agricultural exports.
In summary, there is a lack of research on the factors influencing agricultural export. The existing studies mainly focused on one-dimensional or three-dimensional distance factors without the influence of “integrated” distance factors. Therefore, we have adopted an approach widely used in previous literature, which is an econometric model based on panel data to empirically analyze the impact of cultural distance, administrative distance, geographical distance and economic distance (CAGE) to explore the impact of multidimensional distance factors on China’s agricultural export trade. We also use this model to analyze in depth the impact of multidimensional distance on the different technological added value of agricultural exports to provide solutions for upgrading the structure of agricultural exports. The study mainly emphasizes the distance-related problem of high trade costs of agricultural exports to provide insight into optimizing China’s agricultural export policy and impact of multidimensional distance on agricultural exports.
2. Materials and Methods
2.1. Methodology
2.1.1. Measurement of Technological Added Value
In high-income countries, products without high-tech added value can barely cover the high cost of labor and their production is eventually moves to low-income countries [15]. Thus, the technological content of a product is closely linked to the income of the economy producing it, and it is higher in high-income than in low-income economies [76]. Hausman [77] first proposed PRODY and EXPY indices to measure the technological added value of the exports and the overall technological content indicating the technological structure of a country’s exports, respectively. Technological added value of agricultural exports was measured using the following PRODY and EXPY index equations:
indicates the technological added value of world product j exports; and represents the overall technological value-added of the export, which measures the technology structure of the country ’s exports. In the above equation, denotes a country, denotes the agricultural product category (HS01-24), denotes the export of product from country , denotes the total export of all categories of agricultural products from country , and denotes GDP per capita from country .
2.1.2. Methodology of Distance Measurement
The cultural distance () index was measured using the theory of cultural dimensions proposed by Hofstede, covering power distance, individualism versus collectivism, masculinity versus feminism, uncertainty avoidance index, long-term versus short-term orientation, and self-indulgence versus restraint. The KSI index proposed by Kogut and Singh [78] was used to measure the following equation:
denotes the cultural distance between the host country and China, denotes the cultural distance in dimension of China, denotes the cultural distance in dimension of the host country, and denotes the variance of cultural distance in dimension .
The KSI has not been updated since it was proposed. Here, the modified KSI was employed. The cultural distance was further calculated by adding the reciprocal of the years of diplomatic relations between China and each of its home countries, according to the measurement method used by Qi et al. [78] with the following equation:
denotes the years of diplomatic relations between the country and China, is its inverse form, indicating that the cultural distance between China and the country decreases from the time of the establishment of diplomatic relations.
The institutional distance () index was adopted from the WGI index published by the World Bank. It includes six dimensions of voice and accountability, political stability and absence of violence/terrorism, government effectiveness, regulatory quality, the rule of law, control of corruption and quality of regulation, which are measured using the following equation:
denotes the institutional distance between the sample country and China, denotes the institutional distance referring to dimension . of the sample country, denotes the institutional distance in dimension of China, and and denote the maximum and minimum values of the institutional distance in dimension of the sample country, respectively.
Economic Distance () implies the different economic sizes and differences between countries. The difference in GDP per capita between the sample countries and China is used to express the economic distance between countries, and was calculated as follows:
denotes the economic distance of the sample country from China in the year , denotes the GDP per capita of the sample country in the year , and is the GDP per capita of China in the year .
2.1.3. CAGE Distance Framework
The CAGE distance theory was proposed by Pankaj Ghemawat and includes cultural, administrative, geographic, and economic distances [8]. Ghemawat argued that different distances have different impacts on different industry sectors and that the CAGE reflects the bilateral nature of countries, capturing the “differences” in the measurement of bilateral distances at different dimensions [8]. The study replaced the administrative distance in CAGE with institutional distance for analysis.
2.1.4. Dynamic Taxonomy
The technological added value of agricultural products in the world HS01-24 categories (referred to as 24 categories of agricultural products) was first calculated and ranked, with each category accounting for about 20% of the technological added value of agricultural products, resulting in five major categories, that is, the high, upper-medium, medium, lower-medium, and low technological content.
2.2. Description of Data
2.2.1. Sample Selection
Based on the total export of 24 categories of agricultural products from 2002 to 2020, countries with a total trade of more than USD 1 billion were selected. Finally, China and 63 sample countries with data availability and validity were selected to calculate technological value-added agricultural products worldwide.
2.2.2. PRODY and EXPY Data
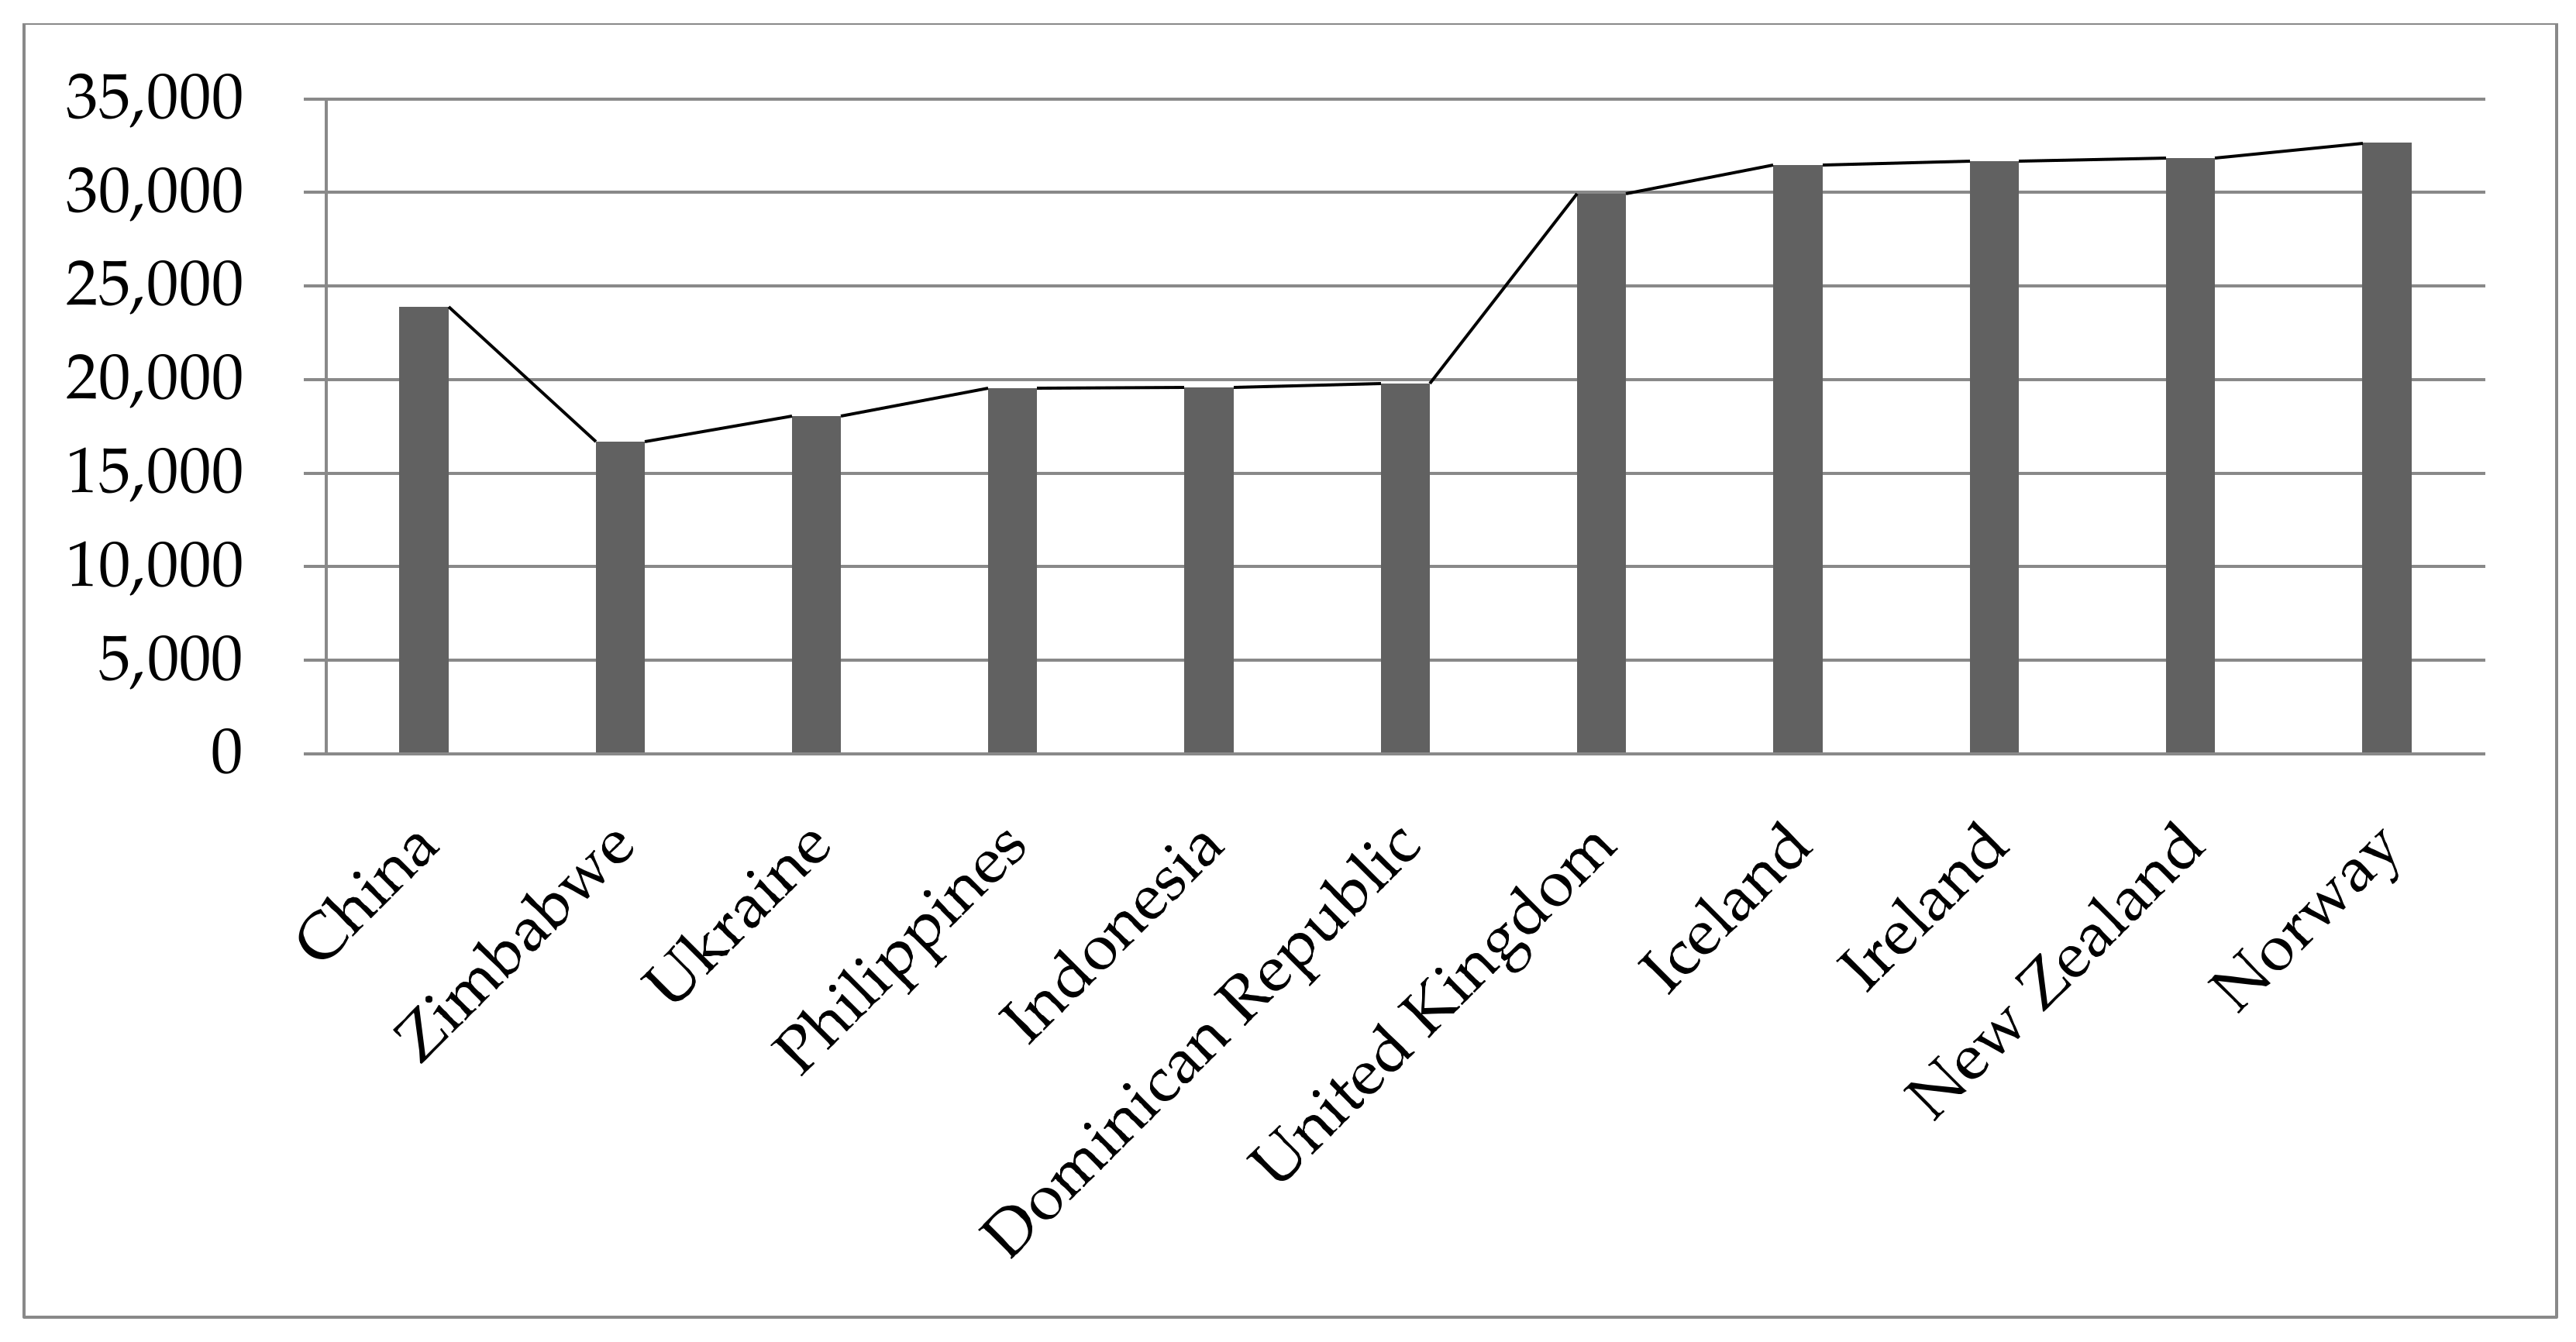
The PRODY index for the world’s agricultural exports is derived from Equation (1). Based on the PRODY index and Equation (2), EXPY index for China and each country as a whole was calculated and shown in Table 1 and Figure 1. Figure 1 shows the top five and bottom five countries in terms of technological content of agricultural exports. Of the 64 countries, China mainly exports agricultural products of medium technological content. Zimbabwe ranks last and Norway ranks first concerning technological content.
Further calculations of the export shares of each major agricultural product category by country based on the PRODY index are shown in Figure 2, which shows the distribution of the export shares of each major agricultural product category between China and sample countries. Only ten countries are presented in Figure 2 because of space. Comparing the export shares of various types of technological value-added agricultural products in the sample countries, the export share of the high-tech value-added agricultural products in Norway was as high as 89.73%. In comparison, the export share of agricultural products of low-tech added value only accounted for 2.5%. The export share of the agricultural products of high technological content in Zimbabwe was only 0.93%, while that of low technological content was 11.83%. The export share of medium and low technological content agricultural exports was up to 83.82%. This indicates if the export share of the agricultural products of high technological content is greater than that of low technological content, the wider the gap, and the higher the country’s overall agricultural export technology mix, and vice versa [76].
China’s agricultural exports ranged from low technological content to high technological content, accounting for 15.21%, 32.68%, 11.41%, 21.95%, and 17.80%, respectively. Products of medium technological content currently dominate the export structure of China’s agricultural products.
2.3. Definitions of Variables and Metrics
2.3.1. Explained Variables
China’s agricultural exports (EX) to each country were used as the explained variable to analyze the impact of multidimensional distance factors.
2.3.2. Core Explanatory Variables
Geographical distance (GD) refers to the straight-line distances from 63 capitals to Beijing, and data are from the CEPII database. Cultural distance (CD) indicates cultural differences between countries. According to the Transaction Cost Theory, cultural backgrounds and language barriers between countries can increase their transaction costs and, to some degree, hinder inter-country trade exchanges. Economic distance (ED) implies the financial gap between countries. Institutional distance (ID) represents the differences in perceptions, norms and regulations at the national level. Institutional distance allows for information asymmetries between countries and therefore increases uncertainty in the trade process.
2.3.3. Control Variables
Whether the country is landlocked was used as a control variable. Since coastal countries have a natural advantage in trade facilitation, “1” is used for landlocked countries and “0” for others. Data are from the CEPII database. The percentage of agricultural value-added to GDP (Agr VA) was used as a control variable. The exchange rate between the sample countries and China (XR) was included as a control variable. The fluctuation of RMB in the world market impacts the cost of trade and trade flows. Foreign direct investment (FDI) in the sample countries to China was used as a control variable to indicate the scale of foreign investment in the sample countries to China, with different levels of investment affecting trade flows with China. Whether or not a free trade agreement (FTA) is signed with China was also a control variable. Signing an FTA with China can lower tariffs, reduce trade frictions and promote trade in agricultural products. The representative symbols of each variable, expected directions and data sources are shown in Table 2.
2.4. Measurement Models
2.4.1. Measurement Models
A regression equation for the measurement model can be written as:
where denotes the natural logarithm of China’s agricultural exports to country in year , is constant, and represents random disturbance terms assumed to be normally distributed at zero mean value [79,80,81] and constant variance [82,83]. GD, ED, ID and CD are the core explanatory variables, denoting geographical distance, economic distance, institutional distance and cultural distance, respectively; is a set of control variables, other than the distance factors, affecting the agricultural trade between the sample countries and China.
2.4.2. Descriptive Statistics of Variables
Table 3 shows the descriptive statistics of the data, including the minimum, maximum, mean, and standard deviation of each data. It can be observed that the data are relatively smooth.
2.4.3. Correlation and Unit Root Test
Table 4 shows the results of the correlation analysis of each variable. It can be seen that China’s agricultural exports to each country are correlated with each variable, except for the correlation coefficient between economic distance and institutional distance. This is as high as 0.836, while the other correlation coefficients are below 0.6. Further examination of the variance inflation factor (VIF) reveals that the results are below 10, so there is no serious multicollinearity between the variables.
To avoid the emergence of “pseudo-regressions” and to ensure the validity of the estimation results, the panel data were analyzed for smoothness and a p-value of 0.000 was obtained from the unit root test (Table 5), indicating that the original hypothesis of the existence of a unit root was rejected, so the data were smooth and could be regressed.
3. Results
3.1. Full Sample Regression
According to the Hausman test of the panel data, the test results show that “Prob > chi2 = 0.0000”, indicating that the original hypothesis of using random effects is rejected. The regression analysis of Equation (7) is carried out based on the fixed effects model, and the analysis results are shown in Table 6.
The estimation results indicated a good fit between the model and the data: the four core explanatory variables being significant, and most of the control variables and all their correlations being as expected. Cultural distance has a significant negative effect on China’s agricultural exports. This may be because countries have different national cultural backgrounds, and the information asymmetry engendered by their cultural differences may increase the difficulty in communication between the two sides [84], thus increasing the uncertainty in the trade process and the transaction costs between countries. These ultimately hinder China’s agricultural exports. Geographical distance significantly hinders China’s agricultural exports. Transport development has not proved to change the effect of geographical distance on China’s agricultural exports, which is a long-term problem. It is detrimental to the agricultural trade in that transportation cost is high because most countries are landlocked, and transport facilities are not well-developed in some coastal countries. Economic distance has a significant positive impact on China’s agricultural exports. The economic disparity between countries makes a difference in the demand for agricultural products, creating complementarity and promoting China’s agricultural exports. Institutional distance has a significant negative impact on China’s agricultural exports. Institutional differences between countries increase trade barriers, weakening bilateral trade and hindering China’s agricultural exports.
In addition to the variables mentioned above, some other variables affect agricultural trade. Firstly, due to their advantageous geographical location, coastal countries can use a combination of sea and land transport when trading, thus reducing trade costs. Their geographical location is conducive to trade compared to inland countries. Secondly, agricultural growth has a positive impact on agricultural exports, as the stability of agricultural production and the increasing share of consumption in a country indicates an increase in the country’s demand for agricultural products, which ultimately benefits bilateral trade based on the differences and complementarity of agricultural products between countries. Thirdly, the scale of foreign investment in China by different countries will also affect China’s agricultural exports. The larger the scale of investment is, the higher the export value will be. Fourthly, a series of measures, such as tariff reduction and the most-favored-nation treatment under a free trade agreement (FTA) will promote trade among members and benefit agricultural exports. Fifth, the exchange rate has a significant positive impact on China’s agricultural exports, indicating that the appreciation of the RMB is conducive to reducing transaction costs and promoting China’s agricultural exports.
3.2. Impacts of Technological Added Value on Agricultural Exports
Improving the technological content of export products is essential for a country to survive and develop in international competition. The enhancement of international competitiveness of agricultural products can be achieved through technological progress and this can promote agricultural exports [85] of farming products with different technological content. However, the influence of distance factors may also vary. Therefore, it is necessary to investigate further the impact of multidimensional distance factors on China’s agricultural exports with the different technological added values in order to gain sustainability of agricultural exports.
Compared with the regression results in Table 6, cultural distance changed significantly in Table 7, positively affecting China’s exports of high-tech value-added agricultural products. Cultural differences between countries bring complementarity, and differentiated agricultural products are more in line with consumer preferences, facilitating agricultural product trade. For exports of upper-medium- and low-tech value-added agricultural products, cultural distance does not have a significant impact. Economic distance also has no significant effect on medium- and low-tech value-added agricultural products. The influence of geographical and institutional distance factors does not change significantly. Therefore, the influence of distance factors also varies for agricultural exports with different technological added values.
3.3. Robust Tests
To reduce the estimation error of the model, the following tests were conducted to demonstrate the robustness of the empirical results in Table 6. The regression was estimated by first censoring the sample with the control variable “FTA”. To further demonstrate that the empirical results do not vary with the estimation method, the ordinary least square method (OLS) wass employed using the above variables. The results are shown in Table 8.
To demonstrate the robustness of the empirical results in Table 7, a benchmark regression was conducted with the additional control variable “contig” (that is, whether there is a common border) since price inequality occurs as agricultural products passing through the border are subject to insurance, freight and non-tariff barriers, etc. [23]. The results of the two robustness tests, shown in Table 8 and Table 9, respectively, are generally consistent with previous papers, indicating that the current study is robust.
4. Conclusions
In the present study, the effects of multidimensional distance on agricultural exports and agricultural exports with various levels of technological added value are compared. First, cultural distance, institutional distance and geographical distance all significantly and negatively impacted China’s agricultural exports, while economic distance had a significant and positive impact on China’s agricultural exports. Institutional distance was the greatest obstacle, followed by geographical and cultural distance. The results are in line with trade policy theory, which holds that the institutional environments of different nations have an impact on trade policies and make exports of agricultural products more difficult. This is substantially different from prior studies in which geographical distance determined bi-lateral agricultural commerce [40,41,42].
Second, because coastal countries have cheaper transportation costs than inland countries, coastal countries are more appealing to China’s agricultural export trade. The scale of foreign investment in China, as well as the signing of an FTA with China, will eliminate tariff barriers and trade frictions, thereby encouraging agricultural exports. Furthermore, agricultural growth reduces agricultural exports with high-tech, upper-medium-tech, and medium-tech added value. The country’s agricultural growth will hinder the exports in these three major categories of agricultural products. Due to COVID-19, the structure of China’s agricultural exports in 2020 was quite different from previous years and characterized by the highest share of agricultural exports being of lower-medium-tech added value. This finding differs from that reached by Arita [86].
Third, the impact of multidimensional distance on agricultural export varies according to the technological added value of Chinese agricultural products. The most significant variation occurs in the dimension of cultural distance. For agricultural exports with high-tech added value, cultural distance greatly impacts the exports, while economic, geographical and institutional distances do not substantially change their impact on export trade. Economic distance has a positive but small effect on agricultural exports with medium-tech added value, but the impact of other distance variables does not show significant variation. As for agricultural exports with lower-medium-tech added value, the impact of distance does not vary significantly. For agricultural exports with low-tech added value, the influence direction of cultural and economic distance does not change. Nonetheless, their impacts diminish marginally, while the influence of others does not differ significantly.
5. Policy Implications and Recommendation for Future Studies
The impact of geographical distance on agricultural trade can be reduced in the short term by building better IT logistics, storage infrastructure and equipment for transporting agricultural products. For long-term benefits, attention should be paid to the differences in institutional environments and cultural backgrounds between countries. To improve the international competitiveness of Chinese agricultural products and reduce the trade deficit, it is possible to lessen institutional and cultural impacts by strengthening communication of institutional policies and by gaining a deeper understanding of the culture and differences between countries.
To achieve long-term agricultural trade development, new agricultural technology must be introduced, and efforts must be made to change the mix of agricultural exports. According to the EXPY ranking of major countries, China’s agricultural exports have a medium degree of technological added value. Technological innovations in agriculture will enhance the international competitiveness of Chinese agricultural products. Policies should be made to encourage growth of agricultural products with hi-tech added value.
The FTA negotiation with neighboring countries should be accelerated to strengthen agricultural cooperation. Signing an FTA with trading partners can further demolish tariff barriers, reduce trade friction, improve trade facilitation and trade efficiency, and promote agricultural exports. Furthermore, signing an FTA with trading partners can help open up new markets. The development of agricultural trade markets is conducive to expanding the scale of China’s agricultural exports and provides a new breakthrough for optimizing the agricultural export structure. Strengthening international cooperation in agriculture increases the global competitiveness of agricultural products and provides new opportunities for narrowing institutional and cultural distance.
Future research should concentrate on optimizing agricultural export composition in order to improve agricultural products’ international competitiveness.
Author Contributions
Introduction and methodology, L.X. and X.Y.; software, C.C.; validation, L.X., X.Y. and C.C.; data curation, C.C.; writing—original draft preparation, L.X. and X.Y.; writing—review and editing, E.E. and T.W.; visualization T.W.; supervision, E.E.; project administration, E.E.; funding acquisition, L.X. and E.E. All authors have read and agreed to the published version of the manuscript.
Funding
This research was funded by the Shandong Provincial Natural Science Foundation (Grant No. ZR2021MG048), and the Taishan Young Scholar Program (No. tsqn202103070), the Taishan Scholar Foundation of Shandong Province, China.
Institutional Review Board Statement
Not applicable.
Informed Consent Statement
Not applicable.
Data Availability Statement
Sources of data are given below: https://www.trademap.org/Index.aspx (accessed on 17 May 2022), http://www.cepii.fr/CEPII/en/bdd_modele/bdd_modele.asp (accessed on 17 May 2022), https://www.hofstede-insights.com/ (accessed on 17 May 2022), https://data.worldbank.org/ (accessed on 17 May 2022), https://data.worldbank.org/ (accessed on 17 May 2022), http://www.stats.gov.cn/tjsj/ndsj/, http://fta.mofcom.gov.cn/ (accessed on 17 May 2022).
Acknowledgments
The authors thank the anonymous reviewers and academic editors’ valuable advice. All authors agreed to acknowledge.
Conflicts of Interest
The authors declare no conflict of interest.
References
- Guo, T.; Wu, X.; Wang, Y. Regional Comparison and Development Strategy of China’s Agricultural Product Export Technology Complexity. Rural Econ. 2022, 10, 10–19. [Google Scholar]
- Konstantakopoulou, I. New evidence on the Export-led-growth hypothesis in the Southern Euro-zone countries (1960–2014). Econ. Bull. 2016, 36, 429–439. [Google Scholar]
- Tang, H.; Xie, T. Digital Economy and Dual-Increasing of Farmers’ Income and Consumption. J. South China Agric. Univ. Soc. Sci. Ed. 2022, 21, 70–81. [Google Scholar] [CrossRef]
- Wang, D. A study on the path of green development of agriculture supported by monetary policy. Macroecon. Manag. 2022, 55–60. [Google Scholar] [CrossRef]
- Dang, L.; Zhao, J. Estimation on the Efficiency and Potential of China’s Agricultural Products Export Trade Along the Belt and Road. J. Northwest AF Univ. (Soc. Sci. Ed.) 2020, 20, 128–136. [Google Scholar] [CrossRef]
- Diao, L.; Chao, Z.; Pang, A. A Study on the Export Efficiency of China’s Agricultural Products to Asian Emerging Market Countries. Res. Financ. Econ. Issues 2020, 102, 106–112. [Google Scholar] [CrossRef]
- Li, J.; Yang, Z.; Han, C.; Liu, H. Analyzing the export of Chinese Agriculture Products to the Belt and Road countries using stochastic frontier trade gravity model. J. Cleaner Production 2020, 41, 135–144. [Google Scholar]
- Ghemawat, P. Distance still matters. The hard reality of global expansion. Harv. Bus Rev. 2001, 79, 137–140. [Google Scholar]
- Wu, T.; Zhang, B.; Cao, Y.; Sun, P. Impact of Multi-Dimensional and Dynamic Distance on China’s Exports of Wooden Forest Products to Countries along the “Belt and Road”. Sustainability 2020, 12, 3339. [Google Scholar] [CrossRef] [Green Version]
- Sun, Z.; Li, X. The trade margins of Chinese agricultural exports to ASEAN and their determinants. J. Integr. Agr. 2018, 17, 2356–2367. [Google Scholar] [CrossRef] [Green Version]
- Zhou, L.; Tong, G. Research on the competitiveness and influencing factors of agricultural products trade between China and the countries along the “Belt and Road”. Alex. Eng. J. 2022, 61, 8919–8931. [Google Scholar] [CrossRef]
- Ha, M.; Yang, Z.; Notteboom, T.; Ng, A.K.; Heo, M. Revisiting port performance measurement: A hybrid multi-stakeholder framework for the modelling of port performance indicators. Transp. Res. Part E Logist. Transp. Rev. 2017, 103, 1–16. [Google Scholar] [CrossRef]
- Hornok, C.; Koren, M. Per-shipment costs and the lumpiness of international trade. Rev. Econ. Stat. 2015, 97, 525–530. [Google Scholar] [CrossRef] [Green Version]
- Baier, S.L.; Bergstrand, J.H.; Mariutto, R. Economic determinants of free trade agreements revisited: Distinguishing sources of interdependence. Rev. Int. Econ. 2014, 22, 31–58. [Google Scholar] [CrossRef]
- Du, X.; Wang, W. Technology Structures of China’ s Exports and Their Changes: 1980–2003. Econ. Res. J. 2007, 7, 137–151. [Google Scholar]
- Yotov, Y.V. A simple solution to the distance puzzle in international trade. Econ. Lett. 2012, 117, 794–798. [Google Scholar] [CrossRef]
- Elahi, E.; Khalid, Z.; Zhang, Z. Understanding farmers’ intention and willingness to install renewable energy technology: A solution to reduce the environmental emissions of agriculture. Appl. Energy 2022, 309, 118459. [Google Scholar] [CrossRef]
- Elahi, E.; Zhang, H.; Lirong, X.; Khalid, Z.; Xu, H. Understanding cognitive and socio-psychological factors determining farmers’ intentions to use improved grassland: Implications of land use policy for sustainable pasture production. Land Use Policy 2021, 102, 105250. [Google Scholar] [CrossRef]
- Hu, C.; Pan, X. Trade Cost, Comparative Advantage and Export Structure: An Empirical Study Based on Industry Panel Data of 30 Countries. J. Quant. Tech. Econ. 2017, 34, 148–161. [Google Scholar] [CrossRef]
- Cao, C.; Chen, J.; Xia, Y. On the Upgrading of China’s Export Commodity Structure to the Five Central Asian Countries against the Background of the “Belt and Road Initiative”. J. Xinjiang Univ. (Philos. Humanit. Soc. Sci.) 2020, 48, 48–56. [Google Scholar] [CrossRef]
- Su, Z.; Zhou, W. Study on the Asymmetric Impact of Changes of Export Structure on Economic Growth in China. World Econ. Stud. 2009, 42–47. [Google Scholar] [CrossRef]
- Su, Z.; Zhou, W. Trade Structure of China Export to ASEAN Countries and Related Changes. J. Int. Trade 2009, 41–51. [Google Scholar] [CrossRef]
- Chen, Y.; Wang, Y. Research on the structure, efficiency and influencing factors of agricultural products trade between China and RCEP member countries-Based on empirical analysis of sub-products. World Agric. 2021, 72–83. [Google Scholar] [CrossRef]
- Novy, D. Gravity redux: Measuring international trade costs with panel data. Econ. Inq. 2013, 51, 101–121. [Google Scholar] [CrossRef] [Green Version]
- Arribas, I.; Bensassi, S.; Tortosa-Ausina, E. Trade integration in the European Union: Openness, interconnectedness, and distance. North Am. J. Econ. Financ. 2020, 52, 101167. [Google Scholar] [CrossRef]
- Chang, Y.; Polachek, S.W.; Robst, J. Conflict and trade: The relationship between geographic distance and international interactions. J. Socio-Econ. 2004, 33, 491–509. [Google Scholar] [CrossRef]
- Seema, N.; Tri, T.N. Does the trade gravity model depend on trading partners? Some evidence from Vietnam and her 54 trading partners. Int. Rev. Econ. Financ. 2016, 41, 220–237. [Google Scholar] [CrossRef]
- Li, W.; Yang, F. The Influencing Factors and Trade Efficiency of China’s Agricultural Products Export to the Countries along the Silk Road Economic Belt-Based on Stochastic Frontier Gravity Model. J. Int. Trade 2019, 7, 100–112. [Google Scholar] [CrossRef]
- Ding, S.; He, S. Analysis on the Efficiency and Influence Factors of China’s Agricultural Products Export to the Five Central Asian Countries. Int. Bus. 2019, 13–24. [Google Scholar] [CrossRef]
- Xu, J.; Li, J. The Impact of National Transportation Infrastructure Quality on Bilateral Trade Cooperation: An Empirical Analysis of the Countries along the Belt and Road. Int. Bus. Res. 2020, 5–14. [Google Scholar] [CrossRef]
- Guo, Y.; Dong, B. Railway and trade in modern China: Evidence from the 1930s. China Econ. Rev. 2021, 69, 101661. [Google Scholar] [CrossRef]
- Hillberry, R.; Hummels, D. Trade responses to geographic frictions: A decomposition using micro-data. Eur. Econ. Rev. 2008, 52, 527–550. [Google Scholar] [CrossRef] [Green Version]
- Halaszovich, T.F.; Kinra, A. The impact of distance, national transportation systems and logistics performance on FDI and international trade patterns: Results from Asian global value chains. Transp. Policy 2020, 98, 35–47. [Google Scholar] [CrossRef]
- Charlotte, E.; Viola, L. International trade, quality sorting and trade costs: The case of Cognac. Rev. World Econ. Weltwirtschaftliches Arch. 2020, 156, 579–609. [Google Scholar] [CrossRef] [Green Version]
- Jason. Query Differing Trade Elasticities for Intra- and International Distances: A Gravity Approach. Rev. Int. Econ. 2020, 28, 913–929. [Google Scholar] [CrossRef]
- Shi, Y.; Lin, N.; Han, Q.; Zhang, T.; Shen, W. A Method for Transportation Planning and Profit Sharing in Collaborative Multi-Carrier Vehicle Routing. Mathematics 2020, 8, 1788. [Google Scholar] [CrossRef]
- Jámbor, A. A távolság szerepe a nemzetközi agrárkereskedelemben. Role Distance Glob. Agri-Food Trade 2021, 61, 3–25. [Google Scholar] [CrossRef]
- Borchert, I.; Yotov, Y.V. Distance, globalization, and international trade. Econ. Lett. 2017, 153, 32–38. [Google Scholar] [CrossRef] [Green Version]
- Wan, Y. An Empirical Analysis about the bilateral trade influencing factors between China and the Countries along the Belt and One Road. Inq. Into Econ. Issues 2019, 110, 134–141. [Google Scholar]
- Wan, L.; Gao, X. The Influence of Cultural, Geographical and Institutional Distance on China’s Import and Export Trade: An Empirical Test of the Trade Data with 32 Countries or Regions. Int. Econ. Trade Res. 2014, 30, 39–48. [Google Scholar] [CrossRef]
- Li, W.; Liu, H. Construction of “The Belt and Road” from the perspective of multi-dimensional distance—Space, economy, culture and system. Int. Econ. Trade Res. 2016, 32, 99–112. [Google Scholar] [CrossRef]
- Wang, R.; Xiao, H. Based on the empirical research of Asian countries along the “Belt and Road”. J. China Agric. Univ. 2021, 26, 176–184. [Google Scholar] [CrossRef]
- De Groot, H.L.F.; Linders, G.; Rietveld, P.; Subramanian, U. The Institutional Determinants of Bilateral Trade Patterns. Kyklos 2004, 57, 103–123. [Google Scholar] [CrossRef]
- Álvarez, I.C.; Barbero, J.; Rodríguez-Pose, A.; Zofío, J.L. Does Institutional Quality Matter for Trade? Institutional Conditions in a Sectoral Trade Framework. World Dev. 2018, 103, 72–87. [Google Scholar] [CrossRef]
- Bojnec, S.; Fertő, I. The institutional determinants of bilateral Agricultural and food trade. Appl. Stud. Agribus. Commer. 2009, 3, 53–57. [Google Scholar] [CrossRef]
- Bilgin, M.H.; Gozgor, G.; Lau, C.K.M. Institutions and gravity model: The role of political economy and corporate governance. Eurasian Bus. Rev. 2017, 7, 421–436. [Google Scholar] [CrossRef]
- Sheikh, M.R.; Chaudhry, I.S.; Gul, N.; Akhtar, M.H. Institutional Determinants of Bilateral Trade Flows: A Panel Data Analysis. Rev. Econ. Dev. Stud. 2018, 4, 247–260. [Google Scholar] [CrossRef] [Green Version]
- Chishti, M.Z.; Hussain, B.; Khursheed, M.A. Impact of Institutional Quality on Bilateral Exports: Exploring the role of Development. J. Appl. Econ. Bus. Stud. 2021, 5, 17–34. [Google Scholar] [CrossRef]
- Linders, G.; Slangen, A.; De Groot, H.L.; Beugelsdijk, S. Cultural and institutional determinants of bilateral trade flows. Tinbergen Inst. Discuss. Pap. 2005, 3. [Google Scholar] [CrossRef] [Green Version]
- Mendonça, T.G.D.; Lirio, V.S.; Braga, M.J.; Silva, O.M.D. Institutions and Bilateral Agricultural Trade. Procedia Econ. Financ. 2014, 14, 164–172. [Google Scholar] [CrossRef] [Green Version]
- Yao, X.; Fang, S.; Le, W.; Chen, R.; Song, M. A Study on the Effect of Standard Distance on Exports—Evidence from the “Belt and Road”. Inq. Into Econ. Issues 2021, 179–190. [Google Scholar]
- Xu, J.; Zhou, S.; Angang, H. Institutional Distance, Neighboring Effects and Bilateral Trade: An Empirical Analysis Based on Spatial Panel Model of “One Belt and One Road” Countries. J. Financ. Econ. 2017, 43, 75–85. [Google Scholar] [CrossRef]
- Luigi, G.; Paola, S.; Luigi, Z. Cultural Biases in Economic Exchange? Q. J. Econ. 2009, 124, 1095–1131. [Google Scholar] [CrossRef] [Green Version]
- Fratianni, M.; Kang, H. Heterogeneous distance–elasticities in trade gravity models. Econ. Lett. 2006, 90, 68–71. [Google Scholar] [CrossRef]
- Möhlmann, J.L.; Ederveen, S.; de Groot, H.L.; Linders, G. Intangible barriers to international trade: A sectoral approach. Tinbergen Inst. Discuss. Pap. 2009. [Google Scholar] [CrossRef] [Green Version]
- Lankhuizen, M.B.M.; de Groot, H.L.F. Cultural distance and international trade: A non-linear relationship. Lett. Spat. Resour. Sci. 2016, 9, 19–25. [Google Scholar] [CrossRef]
- Beugelsdijk, S.; Groot, H.D.; Linders, G.; Slangen, A. Cultural distance, institutional distance and international trade. In Proceedings of the 44th Congress of the European Regional Science Association: “Regions and Fiscal Federalism”, Porto, Portugal, 25–29 August 2004. [Google Scholar]
- Tadesse, B.; White, R. Cultural distance as a determinant of bilateral trade flows: Do immigrants counter the effect of cultural differences? Appl. Econ. Lett. 2010, 17, 147–152. [Google Scholar] [CrossRef]
- Gokmen, G. Clash of civilizations and the impact of cultural differences on trade. J. Dev. Econ. 2017, 127, 449–458. [Google Scholar] [CrossRef]
- Harms, P.; Shuvalova, D. Cultural distance and international trade in services: A disaggregate view. Econ. Syst. 2020, 44, 100786. [Google Scholar] [CrossRef]
- Mendel, J.M.; Korjani, M.M. On establishing nonlinear combinations of variables from small to big data for use in later processing. Inf. Sci. 2014, 280, 98–110. [Google Scholar] [CrossRef]
- Wang, Q.; Xu, W. A Research on Chinese Inter-provincial Trade Based on Spatial Panel Interaction Model under Mufti-dimensional Distances. China Ind. Econ. 2014, 3, 31–43. [Google Scholar] [CrossRef]
- Hongbo, L.; Xiang, R.L.; David, A.C.; Yang, Y. Perceived cultural distance and international destination choice: The role of destination familiarity, geographic distance, and cultural motivation. J. Destin. Mark. Manag. 2018, 9, 300–309. [Google Scholar] [CrossRef]
- Ailan, L.; Cuicui, L.; Zhixuan, W. The roles of cultural and institutional distance in international trade: Evidence from China’s trade with the Belt and Road countries. China Econ. Rev. 2020, 61, 101234. [Google Scholar] [CrossRef]
- Lawrence, E.R.; Raithatha, M.; Rodriguez, I. The effect of cultural and institutional factors on initiation, completion, and duration of cross-border acquisitions. J. Corp. Financ. 2021, 68. [Google Scholar] [CrossRef]
- Zheng, H.; Zhuang, P. The influence of economic distance on the trade cost of agricultural products—An Empirical Study Based on China and the Belt and Road countries. J. Commer. Econ. 2022, 63, 153–156. [Google Scholar]
- Wu, J.; Ruan, J.; Xu, G. Economies Agglomeration, Economies Distance and Farmer’s Income Growth: A Study on Direct and Spillover Effects. China Econ. Q. 2017, 16, 297–320. [Google Scholar] [CrossRef]
- Zhang, J.; Yi, C.; Huang, J. Cross-national Distance and the OFDI Performance of Chinese Firms in “One Belt and One Road”. Asia-Pac. Econ. Rev. 2020, 95–104. [Google Scholar] [CrossRef]
- Jie, H.; Zhihong, T. The effect of trade creation in China-Asean free trade area based on the gravity model. J. Intell. Fuzzy Syst. 2020, 38, 7061–7065. [Google Scholar] [CrossRef]
- Jagdambe, S.; Kannan, E. Effects of ASEAN-India Free Trade Agreement on agricultural trade: The gravity model approach. World Dev. Perspect. 2020, 19. [Google Scholar] [CrossRef]
- Klimczak, Ł.; Trivić, J. Institutions and Intra-Regional Trade in CEFTA 2006: A Gravity Approach. Innovation 2018, 17, 11–25. [Google Scholar] [CrossRef]
- Natale, F.; Borrello, A.; Motova, A. Analysis of the determinants of international seafood trade using a gravity model. Marine Policy 2015, 60, 98–106. [Google Scholar] [CrossRef]
- Duc Nha, L. Globalization, Logistics and Food Supply: Evidence from Vietnam. Malays. J. Econ. Stud. 2021, 58, 267–291. [Google Scholar]
- Stender, F.; Berger, A.; Brandi, C.; Schwab, J. The Trade Effects of the Economic Partnership Agreements between the European Union and the African, Caribbean and Pacific Group of States: Early Empirical Insights from Panel Data*. J. Common. Mark. Stud. 2021, 59, 1495–1515. [Google Scholar] [CrossRef]
- Nastić, V. Application of gravity model for analysis of Bosnia and Herzegovina export. Zb. Rad. Ekon. Fak. U Istočnom Sarajevu 2013, 7, 123–136. [Google Scholar]
- Zhou, X. Technological Structure and Determinants of Producer Services Trade: An Empirical Study Based on the Index of Sophistication. Int. Econ. Trade Res. 2014, 30, 13–27. [Google Scholar] [CrossRef]
- Hausman, D.M. The Philosophy of Economics: An Anthology; Cambridge University Press: Cambridge, UK, 2007. [Google Scholar]
- Qi, J.; Li, L.; Yang, L. Location Choice of Chinese OFDI: Based on the Threshold Effect and Test of Cultural Distance. J. Int. Trade 2012, 12, 137–147. [Google Scholar] [CrossRef]
- Elahi, E.; Khalid, Z. Estimating smart energy inputs packages using hybrid optimisation technique to mitigate environmental emissions of commercial fish farms. Appl. Energy 2022, 326, 119602. [Google Scholar] [CrossRef]
- Elahi, E.; Khalid, Z.; Tauni, M.Z.; Zhang, H.; Lirong, X. Extreme weather events risk to crop-production and the adaptation of innovative management strategies to mitigate the risk: A retrospective survey of rural Punjab, Pakistan. Technovation 2022, 117, 102255. [Google Scholar] [CrossRef]
- Elahi, E.; Khalid, Z.; Weijun, C.; Zhang, H. The public policy of agricultural land allotment to agrarians and its impact on crop productivity in Punjab province of Pakistan. Land Use Policy 2020, 90, 104324. [Google Scholar] [CrossRef]
- Elahi, E.; Weijun, C.; Zhang, H.; Abid, M. Use of artificial neural networks to rescue agrochemical-based health hazards: A resource optimisation method for cleaner crop production. J. Clean. Prod. 2019, 238, 117900. [Google Scholar] [CrossRef]
- Elahi, E.; Zhixin, Z.; Khalid, Z.; Xu, H. Application of an artificial neural network to optimise energy inputs: An energy-and cost-saving strategy for commercial poultry farms. Energy 2022, 244, 123169. [Google Scholar] [CrossRef]
- Adesse, B.; White, R. Does cultural distance hinder trade in goods? A comparative study of nine OECD member nations. Open Econ. Rev. 2010, 21, 237–261. [Google Scholar] [CrossRef]
- Wan, X.; Sun, A. A Comparative Research Export Perspective on Competitiveness between China and of Agricultural Products for ASEAN-From the of Technical Content and Competition Situation. Int. Bus. 2016, 64–73. [Google Scholar] [CrossRef]
- Arita, S.; Martínez-Zarzoso, I.; Ali, S. Has global agricultural trade been resilient under coronavirus (COVID-19)? Findings from an econometric assessment of 2020. Food Policy 2022, 107, 102204. [Google Scholar] [PubMed]
Figure 1.
Technological content of agricultural exports for various countries (EXPY). Data source: Agricultural exports data were taken from https://www.trademap.org/Index.aspx (accessed on 17 May 2022).
Figure 1.
Technological content of agricultural exports for various countries (EXPY). Data source: Agricultural exports data were taken from https://www.trademap.org/Index.aspx (accessed on 17 May 2022).

Figure 2.
Share of technological value-added agricultural exports of various countries.


Table 1.
Technological content of agricultural exports of various countries (USD).
| Countries | EXPY | Countries | EXPY | Countries | EXPY | Countries | EXPY |
|---|---|---|---|---|---|---|---|
| Zimbabwe | 16,694 | Russia | 21,821 | Hungary | 24,236 | Korea | 27,150 |
| Ukraine | 18,064 | Argentina | 21,940 | Spain | 24,281 | Australia | 27,305 |
| Philippines | 19,539 | Bulgaria | 22,043 | Slovak Republic | 24,362 | France | 27,449 |
| Indonesia | 19,576 | India | 22,278 | Ethiopia | 24,362 | Uruguay | 27,526 |
| Dominican Republic | 19,789 | Turkey | 22,463 | Croatia | 24,641 | Switzerland | 27,547 |
| Malaysia | 19,897 | Thailand | 22,528 | Portugal | 24,663 | Japan | 28,748 |
| Romania | 20,268 | Uganda | 22,830 | Greece | 24,787 | Denmark | 28,752 |
| Peru | 20,641 | Vietnam | 22,927 | Chile | 24,923 | Sweden | 28,976 |
| Serbia | 20,682 | Brazil | 22,928 | Czech Republic | 25,097 | Luxembourg | 29,471 |
| Colombia | 20,740 | Jordan | 23,206 | Latvia | 25,324 | Singapore | 29,821 |
| Pakistan | 20,868 | El Salvador | 23,609 | Poland | 25,637 | Belarus | 29,898 |
| Nigeria | 20,893 | Ecuador | 23,800 | The Netherlands | 25,772 | United Kingdom | 29,941 |
| Costa Rica | 20,923 | China | 23,888 | Estonia | 26,089 | Iceland | 31,464 |
| South Africa | 21,477 | Lithuania | 23,976 | Slovenia | 26,656 | Ireland | 31,660 |
The EXPY index indicates the overall technological added value of a country’s agricultural exports. Data source: The data of export volumes were taken from https://www.trademap.org/Index.aspx, accessed on 17 May 2022.
Table 2.
Variables and data sources.
| Variables | Symbols | Expected Signs | Data Sources |
|---|---|---|---|
| Explanatory variables | Geographical Distance (GD) | − | CEPII France database |
| Cultural Distance (CD) | − | Hofstede | |
| Institutional Distance (ID) | − | World Bank database | |
| Economic Distance (ED) | + | World Bank database | |
| Control variables | No for landlocked countries (landlocked) | − | CEPII France database |
| Value added in agriculture as a percentage of GDP (Agri VA) | + | World Bank database | |
| Foreign Direct Investment (FDI) | + | China Statistical Yearbook | |
| The exchange rate with China (XR) | + | World Bank database | |
| Whether to enter into a Free Trade Agreement (FTA) with China | + | China Free Trade Zone Service Network | |
| No for landlocked countries (landlocked) | − | CEPII France database |
Table 3.
Summary statistics of variables.
| Variables | Obs. | Average | p50 | Std. | Min. | Max. |
|---|---|---|---|---|---|---|
| EX | 1197 | 11.30 | 11.27 | 2.355 | 0 | 16.29 |
| GD | 1197 | 8.941 | 8.940 | 0.534 | 6.860 | 9.870 |
| ED | 1197 | 8.922 | 8.910 | 1.517 | 2.530 | 11.62 |
| ID | 1197 | 0.340 | 0.330 | 0.180 | 0.0200 | 0.720 |
| FDI | 1197 | 8.734 | 9.430 | 4.168 | 0 | 15.85 |
| FTA | 1197 | 0.133 | 0 | 0.340 | 0 | 1 |
| XR | 1197 | 4.534 | 3.630 | 3.324 | 0.390 | 24.57 |
| Landlocked | 1197 | 0.143 | 0 | 0.350 | 0 | 1 |
| Agri VA | 1197 | 6.369 | 3.860 | 7.223 | 0 | 45.88 |
Data source: Refer to Table 2.
Table 4.
Testing for cross-sectional dependence.
| EX | CD | GD | ED | ID | FDI | FTA | XR | Landlocked | |
|---|---|---|---|---|---|---|---|---|---|
| CD | −0.272 *** | 1 | |||||||
| GD | −0.413 *** | 0.479 *** | 1 | ||||||
| ED | 0.162 *** | 0.00700 | −0.095 *** | 1 | |||||
| ID | 0.067 ** | 0.094 *** | 0.0190 | 0.836 *** | 1 | ||||
| FDI | 0.506 *** | −0.240 *** | −0.354 *** | 0.437 *** | 0.454 *** | 1 | |||
| FTA | 0.272 *** | −0.141 *** | −0.194 *** | −0.00200 | −0.0270 | 0.064 ** | 1 | ||
| XR | −0.095 *** | 0.086 *** | −0.159 *** | −0.226 *** | −0.291 *** | −0.215 *** | 0.157 *** | 1 | |
| Landlocked | −0.501 *** | 0.0380 | 0.054 * | 0.057 ** | −0.00300 | −0.096 *** | −0.104 *** | 0.270 *** | 1 |
| Agri VA | −0.182 *** | 0.238 *** | −0.065 ** | −0.470 *** | −0.548 *** | −0.335 *** | 0.100 *** | 0.360 *** | 0.218 *** |
***, **, and * indicate significance level of parameters at 1%, 5% and 10%, respectively. Data source: Refer to Table 2.
Table 5.
Unit root test.
| Variables | Statistics | p-Value | Variables | Statistic | p-Value | ||
|---|---|---|---|---|---|---|---|
| EX | Inverse chi-squared (38) | P | 447.3186 | 0.0000 | ID | 537.6269 | 0.0000 |
| Inverse normal | Z | −18.3311 | 0.0000 | −20.7241 | 0.0000 | ||
| Inverse logit t (99) | L * | −28.4287 | 0.0000 | −34.1752 | 0.0000 | ||
| Modified inv. chi-squared | Pm | 46.9521 | 0.0000 | 57.3111 | 0.0000 | ||
| CD | Inverse chi-squared (38) | P | 460.1617 | 0.0000 | FDI | 439.9510 | 0.0000 |
| Inverse normal | Z | −19.1331 | 0.0000 | −18.2897 | 0.0000 | ||
| Inverse logit t (99) | L * | −29.2510 | 0.0000 | −27.9650 | 0.0000 | ||
| Modified inv. chi-squared | Pm | 48.4253 | 0.0000 | 46.1069 | 0.0000 | ||
| ED | Inverse chi-squared (38) | P | 398.8171 | 0.0000 | Agri VA | 254.6021 | 0.0000 |
| Inverse normal | Z | −17.4236 | 0.0000 | −12.1142 | 0.0000 | ||
| Inverse logit t (99) | L * | −25.3512 | 0.0000 | −16.0102 | 0.0000 | ||
| Modified inv. chi-squared | Pm | 41.3886 | 0.0000 | 24.8460 | 0.0000 |
Z represents the standard normal distribution.
L* test typically agrees with Z test and L* has a t distribution (Data source: Refer to Table 2).
Table 6.
Impact of multidimensional distance on China’s agricultural exports.
| Core Explanatory Variables | EX | Control Variables | EX |
|---|---|---|---|
| CD | −0.0882 * | FDI | 0.257 *** |
| (0.0455) | (0.0127) | ||
| GD | −0.767 *** | FTA | 0.438 *** |
| (0.103) | (0.137) | ||
| ED | 0.125 ** | XR | 0.0351 ** |
| (0.0569) | (0.0146) | ||
| ID | −2.107 *** | Landlocked | −3.103 *** |
| (0.525) | (0.131) | ||
| Agri VA | 0.00512 | ||
| (0.00825) | |||
| Constant | 15.90 *** | ||
| (1.079) |
R2 = 0.605. ***, **, and * indicate significance level of parameters at the 1%, 5% and 10%, respectively. Data source: Refer to Table 2.
Table 7.
Impact of multidimensional distances on agricultural exports with TVA1.
| EX | HT 2 | UmT 3 | MT 4 | LmT 5 | LT 6 |
|---|---|---|---|---|---|
| CD | 0.157 ** | −0.0483 | −0.393 *** | −0.168 *** | −0.0666 |
| (0.0656) | (0.0498) | (0.0568) | (0.0538) | (0.0581) | |
| GD | −1.426 *** | −0.666 *** | −0.778 *** | −0.541 *** | −0.867 *** |
| (0.148) | (0.112) | (0.128) | (0.121) | (0.131) | |
| ED | 0.224 *** | 0.107 * | 0.0545 | 0.180 *** | 0.114 |
| (0.0821) | (0.0624) | (0.0711) | (0.0673) | (0.0728) | |
| ID | −3.577 *** | −1.814 *** | −2.685 *** | −3.773 *** | −1.983 *** |
| (0.757) | (0.575) | (0.656) | (0.621) | (0.671) | |
| FDI | 0.301 *** | 0.258 *** | 0.285 *** | 0.289 *** | 0.314 *** |
| (0.0183) | (0.0139) | (0.0158) | (0.0150) | (0.0162) | |
| FTA | 0.705 *** | 0.328 ** | 0.177 | 0.702 *** | 0.858 *** |
| (0.198) | (0.150) | (0.171) | (0.162) | (0.175) | |
| XR | −0.0163 | 0.0149 | 0.0228 | 0.00897 | 0.0719 *** |
| (0.0210) | (0.0159) | (0.0182) | (0.0172) | (0.0186) | |
| Landlocked | −3.363 *** | −2.819 *** | −3.623 *** | −3.810 *** | −3.877 *** |
| (0.190) | (0.144) | (0.164) | (0.155) | (0.168) | |
| Agri VA | −0.111 *** | −0.0105 | −0.0458 *** | 0.00341 | 0.0694 *** |
| (0.0119) | (0.00904) | (0.0103) | (0.00976) | (0.0106) | |
| Constant | 19.03 *** | 13.68 *** | 15.14 *** | 12.60 *** | 13.12 *** |
| (1.556) | (1.182) | (1.348) | (1.276) | (1.380) | |
| R2 | 0.577 | 0.539 | 0.607 | 0.593 | 0.574 |
1 TVA: Technological Value-Added. 2 HT: High-Tech. 3 UmT: Upper-Medium-Tech. 4 MT: Medium-Tech. 5 LmT: Low-Medium-Tech. 6 LT: Low-Tech. ***, **, and * indicate significance level of parameters at the 1%, 5% and 10%, respectively (Data source: Refer to Table 2).
Table 8.
Robustness test I.
| EX | Model 1 | Model 2 | EX | Model 1 | Model 2 |
|---|---|---|---|---|---|
| CD | −0.114 ** | −0.0739 *** | FDI | 0.259 *** | 0.246 *** |
| (0.0449) | (0.0174) | (0.0127) | (0.0131) | ||
| GD | −0.779 *** | −0.752 *** | XR | 0.0430 *** | 0.0517 *** |
| (0.103) | (0.0691) | (0.0144) | (0.0126) | ||
| ED | 0.105 * | 0.446 *** | Landlocked | −3.179 *** | −3.237 *** |
| (0.0568) | (0.0784) | (0.130) | (0.0844) | ||
| ID | −1.813 *** | −4.646 *** | Agri VA | 0.0105 | −0.00625 |
| (0.519) | (0.571) | (0.00811) | (0.00438) | ||
| FDI | 0.259 *** | 0.246 *** | Constant | 16.13 *** | 13.91 *** |
| (0.0127) | (0.0131) | (1.081) | (0.840) | ||
| Observations | 1.197 | 1.197 | |||
| R-squared | 0.601 | 0.561 |
***, **, and * indicate significance level of parameters at the 1%, 5% and 10%, respectively. Data source: Refer to Table 2.
Table 9.
Robustness test II.
| EX | HT | UmT | MT | LmT | LT |
|---|---|---|---|---|---|
| CD | 0.121 * | −0.0556 | −0.345 *** | −0.121 ** | −0.0323 |
| (0.0691) | (0.0526) | (0.0598) | (0.0566) | (0.0613) | |
| GD | −1.444 *** | −0.669 *** | −0.754 *** | −0.519 *** | −0.850 *** |
| (0.148) | (0.113) | (0.128) | (0.121) | (0.131) | |
| ED | 0.240 *** | 0.110 * | 0.0326 | 0.159 ** | 0.0984 |
| (0.0826) | (0.0628) | (0.0715) | (0.0676) | (0.0732) | |
| ID | −3.674 *** | −1.833 *** | −2.555 *** | −3.649 *** | −1.891 *** |
| (0.759) | (0.577) | (0.656) | (0.622) | (0.673) | |
| FDI | 0.302 *** | 0.259* ** | 0.283 *** | 0.288 *** | 0.313 *** |
| (0.0183) | (0.0139) | (0.0158) | (0.0150) | (0.0162) | |
| XR | −0.0101 | 0.0162 | 0.0145 | 0.00106 | 0.0661 *** |
| (0.0213) | (0.0162) | (0.0184) | (0.0174) | (0.0189) | |
| Landlocked | −3.446 *** | −2.836 *** | −3.511 *** | −3.703 *** | −3.798 *** |
| (0.196) | (0.149) | (0.170) | (0.161) | (0.174) | |
| FTA | 0.696 *** | 0.326 ** | 0.189 | 0.713 *** | 0.867 *** |
| (0.197) | (0.150) | (0.171) | (0.162) | (0.175) | |
| Agri VA | −0.104 *** | −0.00906 | −0.0556 *** | −0.00601 | 0.0624 *** |
| (0.0127) | (0.00966) | (0.0110) | (0.0104) | (0.0113) | |
| contig | −0.500 * | −0.101 | 0.665 ** | 0.639 ** | 0.472 * |
| (0.303) | (0.230) | (0.262) | (0.248) | (0.268) | |
| Constant | 19.12 *** | 13.70 *** | 15.02 *** | 12.49 *** | 13.04 *** |
| (1.556) | (1.183) | (1.346) | (1.274) | (1.379) | |
| Observations | 1197 | 1197 | 1197 | 1197 | 1197 |
| years | 19 | 19 | 19 | 19 | 19 |
| R-squared | 0.578 | 0.539 | 0.609 | 0.595 | 0.575 |
***, **, and * indicate significance level of parameters at the 1%, 5% and 10%, respectively (Data source: Refer to Table 2).
Disclaimer/Publisher’s Note: The statements, opinions and data contained in all publications are solely those of the individual author(s) and contributor(s) and not of MDPI and/or the editor(s). MDPI and/or the editor(s) disclaim responsibility for any injury to people or property resulting from any ideas, methods, instructions or products referred to in the content. |
© 2022 by the authors. Licensee MDPI, Basel, Switzerland. This article is an open access article distributed under the terms and conditions of the Creative Commons Attribution (CC BY) license (https://creativecommons.org/licenses/by/4.0/).
Share and Cite
MDPI and ACS Style
Xing, L.; Yin, X.; Cao, C.; Elahi, E.; Wei, T. The Impact of Multidimensional Distance on Agricultural Exports: Evidence from China Based on the Technological Added Value. Sustainability 2023, 15, 393. https://doi.org/10.3390/su15010393
AMA Style
Xing L, Yin X, Cao C, Elahi E, Wei T. The Impact of Multidimensional Distance on Agricultural Exports: Evidence from China Based on the Technological Added Value. Sustainability. 2023; 15(1):393. https://doi.org/10.3390/su15010393
Chicago/Turabian StyleXing, Lirong, Xiaomiao Yin, Chuanxiang Cao, Ehsan Elahi, and Taoyuan Wei. 2023. "The Impact of Multidimensional Distance on Agricultural Exports: Evidence from China Based on the Technological Added Value" Sustainability 15, no. 1: 393. https://doi.org/10.3390/su15010393
Note that from the first issue of 2016, this journal uses article numbers instead of page numbers. See further details here.