
Grapevine Resistant Cultivars: A Story Review and the Importance on the Related Wine Consumption Inclination


Department of Agricultural, Food, Environmental and Animal Sciences, University of Udine, Via delle Scienze 206, 33100 Udine, Italy
*
Author to whom correspondence should be addressed.
Sustainability 2023, 15(1), 390; https://doi.org/10.3390/su15010390
Submission received: 7 November 2022
/
Revised: 16 December 2022
/
Accepted: 23 December 2022
/
Published: 26 December 2022
(This article belongs to the Special Issue Circular Economy and Sustainability: Practices and Strategies in the Wine Sector)
Abstract
:Pest and disease management in the grapevine sector has become difficult due to several instances (e.g., pathogen resistance, agrochemicals withdrawals). Therefore, viticulture switched to more environmentally friendly practices. On these bases, the most promising tool is the use of a resistant variety of grapes. Luckily, genetic and genomic selection have made great steps in accelerating plant breeding. In recent years, several resistant varieties of grape were created and the wine obtained began to grow. This allowed vine growers and wine makers to drastically reduce the chemical inputs in vineyards. However, this specific wine market faces trouble regarding the consumer attitude towards buying the related crafted wines. In order to make these innovations acceptable, we undertook a literature review of the history and creation methods of the hybrid grapevines. We investigated young wine drinkers across north-east Italy using specific questionaries to better analyse consumer perception of wine from resistant vines and the related environmentally friendly issues to understand if consumers are prone towards this product. Our results clearly indicate that consumer attitude towards this type of beverage pays great attention to the reduction in agrochemicals.
1. Introduction
Thousands of years ago (±10,000 BC), the production of alcoholic beverages first took place [1]. Today, wine is one of the most popular alcoholic drinks, created through the fermentation of Vitis vinifera grapes [2]. Wine is also considered an important element not only for meals, but for a healthy diet and conviviality [3,4]. In this context, the production of Vitis vinifera sp. wine is the most economically relevant perennial fruit crop around the world, grown on 7.34 mil. ha (84.83 mil. t fresh grapes) for wine and table grapes, dry fruits, juice, and other products [5]. The worldwide value amounts to about EUR 77 billion, while in Italy, second only to France, the production value is around EUR 13.2 billion [6]. While the international trade is rising, exports have always seen a growing trend, especially in terms of the in-demand variety (e.g., in Italy: prosecco wine) [7]. However, EU exports didn’t change in recent years, due to transport disruption in countries in the Southern hemisphere and North America [6]. In Italy, wine production (including grape juice) is equal to 48.2 million hectolitres on a vineyard area of approximately 621.9 thousand hectares [8]. As far as Italy is concerned, there has been a significant rise in volume exports, without the accompanying rise in value, similar to what occurred for France.
2. Vitis Vinifera: The Story of Actual Diseases
V. vinifera ssp. vinifera and its wild relatives are the autochthonous species in Europe and the Near East, part of the Eurasian gene pool largely endemic to the Mediterranean basin [9]. The cultivated compartment of Vitis vinifera is highly sensitive to many pests and diseases, introduced from outside the EU [10]. Therefore, it is propagated vegetatively and it is usually grafted onto resistant rootstocks [11]. These are typically resistant to pests and can be adapted in different soils [12]. Moreover, the serious pathogens afflicting grapevine are 1) powdery mildew (PM, Erysiphe necator) resulting in serious quality deficits and downy mildew (DM, Plasmopara viticola) leading to high yield losses [13] Both leading to important economic losses [14]. Grapevine is also facing a number of other diseases which require chemical treatments, including esca, black rot, Flavescence doree, phytoplasmas, etc. [15,16,17,18]. This results in a challenging defensive chemical management. In viticulture, around 67% of all fungicides are used in the agriculture sector worldwide, despite the area designated for grapevine cultivation only accounts for about 3% of the entire agricultural sector [19]. Recently, a race of DM has arisen that is resistant to many of the active substances of fungicides, worsening and complicating plant defence [20]. Nevertheless, the great range of available agro-defensive-chemicals help to ensure the final yield, but not without an enormous number of plant treatments and related problems, including pollution and the rising cost of phytoiatric management [21]. After a long period, the wine-making sector and wine consumer awareness of fungicides have risen [22]. Agrochemical reduction in the wine sector has, therefore, come to an essential social demand in viticulture (organic or not) [23].
3. Driving towards a New Viticulture
The above-mentioned instances changed viticulture and triggered the beginning of grapevine breeding projects [24] in order to achieve a more environmentally friend viticulture. Varietal and cultivation innovations have long contributed to agricultural progress towards greater sustainability [25]. An excellent example can be found in the first hybrid resistant varieties, both direct producers and rootstock, the phylloxera crisis [26] and several other species [27]. Therefore, innovation in grapevine cultivars played an essential role in the history of this plant. Despite this, varietal creation has been poor since World War II [22] and the major innovation only occurred in the past 15 years when varietal innovation became more blatantly “pulled by technological demand” [22]. Furthermore, the success of the diffusion of new varieties relies on three main tasks: (1) professionals need to agree with their relevance, (2) new varieties’ features proposed for further dissemination, and (3) the new perception of the needs of those professionals or their market, which are broadly different 25 years later along with the diffusion of these innovations [28]. Nowadays, the industry is marked by the presence of various resistant grape varieties.
Genetic and Breeding to Improve Cultivars
Regarding breeding, grapevine was showed to be a recalcitrant crop due to its juvenile phase, translating into a long period of breeding [29,30]. The only way to control mildew without using or with only using a drastic reduction in agrochemicals is through genetic improvement. The use of resistance genes (R genes) given by grape resistant genotypes in breeding are the most practical way. Specifically, the resistance of host plants is called “specific or varietal resistance” and is explained in the gene×gene model by Flor (1955) [31]. R genes are used because they are encoded to a particular and important protein involved in plant defence [29]. To date, the major loci such as QTLs (quantitative trait loci) for DM are clustered in the chromosomes 4, 5, 7, 9, 12, 13, 15, 18 and 19. These chromosomes also contain the majority of the similar resistance genes [32]. Many vines in North America have natural resistances and many loci of resistance have been identified in these vines [33] for DM (Rpv: Resistance to Plasmopara Viticola genes). The Rpv10 locus was the first to be mapped for resistance to DM and was introduced by V. amurensis in the commercial varieties of Western Europe [34]. Another locus donated by V. amurensis is the Rpv12, which was fixed in the genome of some varieties either alone or in combination with an additional locus, the Rpv3. However, the Rpv1 was co localised on chromosome 12 together with Ren1 (a resistance gene to powdery mildew). For the plant’s defence, the main locus responsible is the Rpv3. This locus resides in the lower arm of chromosome 18 [32]. The classical selection requires lot of time and is very expensive. However, the use of DNA-based markers linked to traits of interest considerably reduces the breeding costs and the time for creating new varieties [35]. Molecular marker assisted selection (MAS) precisely facilitates the identification of the seedlings that have inherited a desired gene/s, shortly after germination. Recently, considerable progress was also made to generate tools for the MAS in grapes. In fact, a large number of DNA sequence-based markers were developed which, in turn, allowed for the construction of high-density genetic linkage maps [36]. To date, different markers have been developed for R genes to DM in grapes, especially single sequence repeaters (SSRs), which are possible to identify after the DNA extraction and amplification followed by the sequencing [32,37]. Additionally, combining multiple genes that confer the same phenotype is generally termed gene pyramiding. This approach is essential when breeders want to combine several resistance loci to a disease. The resistance conferred by a combination of various R genes is more difficult to overcome by the pathogen than the resistance conferred by single R gene, making it more stable [38,39].
Despite of the fact that conventional and mutational breeding techniques have undertaken a significant role in the development of the desired varieties due to certain existing limitations, new techniques were developed. Genome editing tools (GETs), including clustered, regularly interspaced short palindromic repeats (CRISPR) systems, are revolutionizing genetics and breeding [40]. The protocol of the CRISPR/Cas9 systems technology and its variants are the most reliable and efficient and have been established in many cultivated plants. New GETs, such as the CRISPR/Cas12 and the base editors, were also applied to plants to improve their traits. Recombinases and prime editing tools have the potential to make the edits more precisely and efficiently [41]. However, whether this technology can be used is still be argued by legislators worldwide. At the moment, its use is not allowed.
4. The Wine Industry and the New Cultivars
In European countries, a number of sustainable practices have already been implemented in recent years. Compared to other agricultural activities, the wine industry as an evolving economic activity is inclined to achieve a rich set of tasks through its specific organizational capacities and resources [22]. In this sense, sustainability is often explained applying three dimensions (society, economy, and environment) [42]. These mentioned realities involve all three dimensions of sustainability and integrate the energy dimension and fuelling into a potential circular economy [43]. On this basis, the wine sector has recently experienced a market growth that is different from other agricultural sectors, increasing its cultivated areas. Due to the strong inclination of the wine sector to adopt sustainable strategies, agro-energy districts may also be future steps for viticulture, which, as a cutting-edge enterprise in modern agriculture, is implementing new strategies and opportunities within the sector. In this context, the acceptance of resistant varieties as the most effective tool for the development of environmentally friendly viticulture in Italy is no easy task. [22,44]. The new and recently developed varieties include Chardonnay, Cabernet, and Sangiovese-like. However, the listings still attract the skepticism of the state administration and, in part, the consumer for the use of the term ‘interspecific hybrid’. In principle, this kind of plant was not meant to be grown for wine production. Essentially, it had to be demonstrated that the content of malvidin 3.5-diglucoside and methyl alcohol were lower than European standards, along with the absence of strawberry flavor (see Italian Ministry of Agriculture-viticulture section-guidelines). Finally, during September 2015, 11 new grapevines entered into the Italian catalog [45].
5. Consumers Attitude Importance in Wine Consumption and Proposed Pilot Study
Given the economic situation and consumer attitudes, the resistant variety is an important tool for increasing income. Consumers buy wine on the basis of various distinguishing features, such as the country and region of origin, grape variety, price, and brand [46,47]. Consumer awareness and interest towards sustainability issues is also well documented [48]. In various countries, there is a considerable segment of consumers who have a positive attitude towards sustainable production methods for wine and are willing to pay a premium for such products [49]. In fact, as previous research demonstrated, the technological advancements applied directly into the food domain could receive several levels of consumer approval [50]. However, it was found that consumers positively evaluated wines that were produced from hybrids but did not support wines that were produced from genome-edited hybrids. This result is probably related to the fact that consumers view horticultural hybrid wines as products that can occur in nature [51] and do not involve genetic modifications [52,53]. Additionally, individuals have negative perceptions towards foods they consider unnatural [54]. On the other hand, consumers with different types of information can affect their preference for these wines, corroborating previous studies that demonstrated that positive messages enhance preferences [55,56] while negative messages decrease them [57]. This is also consistent with other findings that show that detailed information on the wines produced with genetic technologies can improve consumer perception [58], thereby increasing their purchases or keeping them at a same level without resistant wines [59]. Regarding vineyard management, it was found that, on average, using the resistant vines can save an average of EUR 680 to 1100 per hectare every year [60].
While fewer acceptance problems are expected for table grapes, sultanas, or rootstocks, more concerns may arise for wine grapes as wine is a cultural product, especially in Europe [61]. Previous research has shown a trend towards agricultural and food policies that consider both ethical practices (e.g., environmentally friendly) and product quality. Foods that are perceived as “sustainable”, “safe”, and “socially responsible” are attractive to consumers [62]. Nevertheless, consumers generally express their environmental concerns and values by buying food that not only satisfies private benefits such as hunger, but also societal benefits such as a reduced environmental impact or other ethical harm [63]. In this context, the cultivation of resistant vines that can reduce the use of agrochemicals is an increasingly interesting production system. However, commercial acceptance depends on the response of the consumers, i.e., their interests, attitudes, and willingness to buy and pay for this food. Understanding consumer behaviour in relation to consumer goods could be improved through more advanced marketing strategies and communication, for example to increase their willingness to pay [64]. A significant number of consumers in different countries had a positive attitude towards these different production methods and were willing to pay a premium for wine with the characteristics of sustainable production. However, in some European countries and in North America, consumer awareness to the broad concept of sustainability in wine appeared to be low on average. In fact, organic and sustainability labels are often perceived as indicators of quality [49].
To investigate whether polarised information influences the acceptance of innovation in plant genetics, the current research was focused on a specific agricultural sector, namely viticulture, where the novel grapevine varieties resistant to major fungal diseases (e.g., DM and PM) have attracted the interest of many practitioners. Consumer awareness of social and environmentally sustainable labels was quite poor in an Italian study [65]. Therefore, a pilot field study was performed in north-east Italy where a questionnaire-based analysis was carried out on a sample of the representative population, with the methodology already viewed as well-working [46,47,59], testing the consumer’s inclination towards wine that is crafted from resistant hybrids and the importance of paying more to ensure the use of agrochemicals.
5.1. Pilot Study
For the agricultural sector, the European Union has set the goal of significantly reducing the use of chemical pesticides (European Commission, 2019). On this front, the most promising tools available to the wine sector are the fungus-resistant grapes (FRG) [50]. The disease-resistant vines found on the market and grown are hybrids between Vitis vinifera and other species of the Vitis genus [66].
In fact, the European Union believes that disease-resistant vines obtained through genetic crossing are an important tool for the sustainability of the wine sector. It eliminates the constraints imposed by the previous European legislation and leaves the relative decisions on the strategies of the adoption and use of these vines to the producers and the derived communication strategies.
The achievable reduction in pesticides in the vineyard using the FRG vines depends on numerous factors, including the characteristics of the resistant vine, pedoclimatic environment, climatic trend of the production year, cultivation techniques, and others. The reduction in pesticides that are attributable to wine also depends on the percentage of the FRG grapes used. The reduction in pesticides that are attributable to a winery or to the reference territory of a consortium of producers also depends on the percentage of the area cultivated with the FRG vines.
For the communication of the FRG vines and wines, the producers can use the support and logo of PIWI International. Until 2021, the logo of this association was only usable for pure FRG wines (PIWI International, 2021). This rule excluded all wines that derived from Vitis vinifera grapes. In other words, after the regulation (EU) 2021/2117, this rule hindered the spread of the FRG vines, excluding them from AOC wines that could potentially make use of at least part of their grapes. In 2022, PIWI International eliminated the aforementioned rule from its statute, replacing it with the statement that the use of the logo will be governed by a series of regulations (PIWI International, 2022).
The reduction in pesticides in the vineyards is difficult to certify. It is less problematic, for example, to certify the quantity of the grapes and/or the FRG vines used in the production of wine. Despite the communication strategies that will be adopted, consumers will still be able to “translate” the information obtained into an approximate measure of the reduction in pesticides in the vineyards. On this basis, we adopted a pilot study regarding the specific FRG wine consumers. The pilot study was adopted as this was the first approach for attempting to understand the following instances: exploring the possibility of using conjoint analysis (CA) to (1) verify the existence of a causal relationship between the reduction in pesticides in the vineyards and consumer preferences; (2) measure the effect of pesticide reductions in vineyards on consumer preferences for wine; (3) explore the effect of information on the maximum reduction in pesticides achievable with FRG vines; and (4) provide information for future research.
5.1.1. Materials and Methods
Conjoint analysis allows for the simulation of markets offering products that do not yet exist. In these simulations, the consumers interviewed express their preferences for different products described by attributes that were deemed relevant to the purposes of the research. For each test participant, the conjoint analysis allowed us to estimate the contribution that each attribute (called partial preference or partial utility) has in determining the total preference (or total utility) for the products being compared.
The preference for the single product was called the total preference and the contribution of the single level was called the partial preference. If the combination of products compared was formulated with an orthogonal plane, we could estimate the main effects and the partial preferences that are independent from the other variables of the experimental plan but not from the other factors. Similarly, to the other consumer experimental methods, the other factors influencing the test results can be grouped into five categories: (a) the type of market and simulated purchase motivation such as supermarket, bar, restaurant, dinner, or aperitif; (b) the product attributes that influence consumer preferences but are not used to describe test products; (c) the internal stimuli of the consumers questioned such as socio-demographic characteristics, beliefs, attitudes, emotional states, etc. (d) the external stimuli controlled by the researcher such as the methods, the product description, and detection (i.e., face-to-face or remote detection, characters and language of the text, images, etc.); and (e) the uncontrolled external stimuli, for examples coming from the environment in which the tests are carried out if this is not completely controlled by the researcher [67,68,69].
For the estimation of the preferences, market simulations were carried out by asking the participants the following question: “You is in the supermarket, and you want to buy a bottle of wine for a dinner with friends. Compare the following products and then express your preferences with a score from 1 to 100 (100 is the highest preference)”. Five market simulations were carried out with university students in northern Italy (Tests A, B, C, D and E). Table 1 shows the product attributes and the levels used to generate the orthogonal planes and describe the wines that contested the preferences of the test participants.
The first three market simulations (Tests A, B and C) evaluated the reactivity of the respondents to the variation in the reduction in pesticides and whether the existence of an anchoring effect attributable to a high pesticide reduction was known to consumers in the simulated market. For the three tests, the same orthogonal plane was used with the same levels for the “wine name” and “price” variables and five different levels for the “pesticide information” attribute. Level 1 provided the absence of the information on pesticide reduction in all the tests and Level 5 provided the maximum reduction in pesticides present in the market simulated by the test: 80% in Test A, 40% in Test B and 20% in Test C. The three simulations also assumed that consumers in one market neither knew the maximum pesticide reductions present in the other markets nor the absolute maximum possible pesticide reduction. The maximum reduction in pesticides in Test A (80%) simulates the information that could be provided to consumers by a wine made exclusively with FRG vines. The maximum reduction in pesticides foreseen by Tests B and C simulate the information that could be provided by wines obtained only in part with FRG vines or by producers who partly have FRG vines and want to communicate their contribution to the sustainability of the company and/or the territory they manage. The intermediate reduction levels simulate the wines that report a lower pesticide reduction than the maximum known to the consumers in the respective market. The test participants were not provided with any information on how the pesticide reduction was achieved.
The fourth market simulation (Test D) aimed to verify the repeatability of the results. For this reason, it used the orthogonal plane from Test C by modifying only the reduction in pesticides of the two intermediate levels (Table 1). This test used different detectors and a different sample of consumers.
The fifth market simulation (Test E) aimed to verify the effect of adding a variable to the experimental plan. For this reason, the variable “certification” with two levels, absent and DOC, was added to the experimental plan of Test A. This test also used different detectors and a different sample of consumers.
The orthogonal planes were generated with the IBM SPSS Statistics 20 conjoint algorithm, a program that was also used to estimate the individual partial preferences of the test participants. All the orthogonal planes consisted of 16 experimental profiles to which five control profiles were added for the validation of the results. The control profiles were included in the survey form at random and, in all market simulations, the two profiles were the same to verify respondent attention during the test.
For the estimation of the individual preference functions, all the variables were considered categorical [70,71].
To evaluate the variation in the preference for a wine that is attributable to a certain level of pesticide reduction in the vineyards, the individual pesticide differential preferences (PDPni) were defined as follows
where PDPni is the pesticide differential preference for the wine of the n-th consumer attributable to the i-th level of pesticide reduction in the vineyards, ppni is the partial preference of the n-th consumer for the i-th level of reduction in pesticides in the vineyards estimated with the CA, and ppna is the partial preference of the n-th consumer for the absence of pesticide reduction in the vineyards estimated with the CA.
PDPni = ppni − ppna
To reduce the number of the internal and external non-experimental stimuli, the tests were administered to samples of homogeneous consumers, i.e., to university students while they were studying in the same universities in the same geographical areas, following a survey of their socio-demographic characteristics (gender, age, and per household capita income) and their familiarity with the product (Table 2). Furthermore, the students with courses involving viticulture and oenology were excluded from the sample. The preference tests were carried out from January–April 2022 in the study rooms of the universities of Venice (Test A, B and C), Padua (Test D), and Udine (Test E) using a paper-based survey form and face-to-face interviews (Table S1). The selection of the respondents consisted of the administration of the survey forms to all students present in the study room at the time of the survey. A total of 910 university students were interviewed, mostly male, under the age of 24, who declared their family income as between EUR 1000 and 3000 per capita, with wine consumption frequencies higher than those of purchase (Table 2).
To consider the undetected internal and external stimuli for each test, an analysis of the clusters was conducted according to the partial preferences for the five levels of the “pesticide information” variable. This approach assumed the hypothesis that if different groups of respondents emerged within the same test, these differences could be attributable to the non-experimental variables that contributed to determining the respondents’ responses. The analyses were completed with the IBM SPSS Statistics 20 Cluster TwoStep algorithm, with the likelihood measurement Schwarz Bayesan grouping criterion (BIC) and the automatic determination of the number of clusters.
The causal relationships between the “reduction in pesticides” information and the differential pesticide preferences for wine were estimated with linear, quadratic, and cubic regression analyses. For the estimates, the “absent” level was assigned the value of zero and the other levels are those shown in Table 1. For the sake of brevity, only the graphical representations of the functions that achieved the highest R-square levels are shown in the results. The comparisons between the average pesticide differential preferences were made with the IBM SPSS statics.20, p level: < 0.05.
5.1.2. Results and Discussion of the Pilot Study
Regarding the “pesticide information”, the absence of this information in all the Level 1 tests achieved the lowest average partial preference. With the increased level of pesticide reduction in the vineyards, the partial average preference increased (Table 3). With regard to the validation of the models, it should be noted that the correlation indices were all high and significant for all the tests. The exception was Kendall’s Tau for the Test E controls, which in any case were considered to be sufficient.
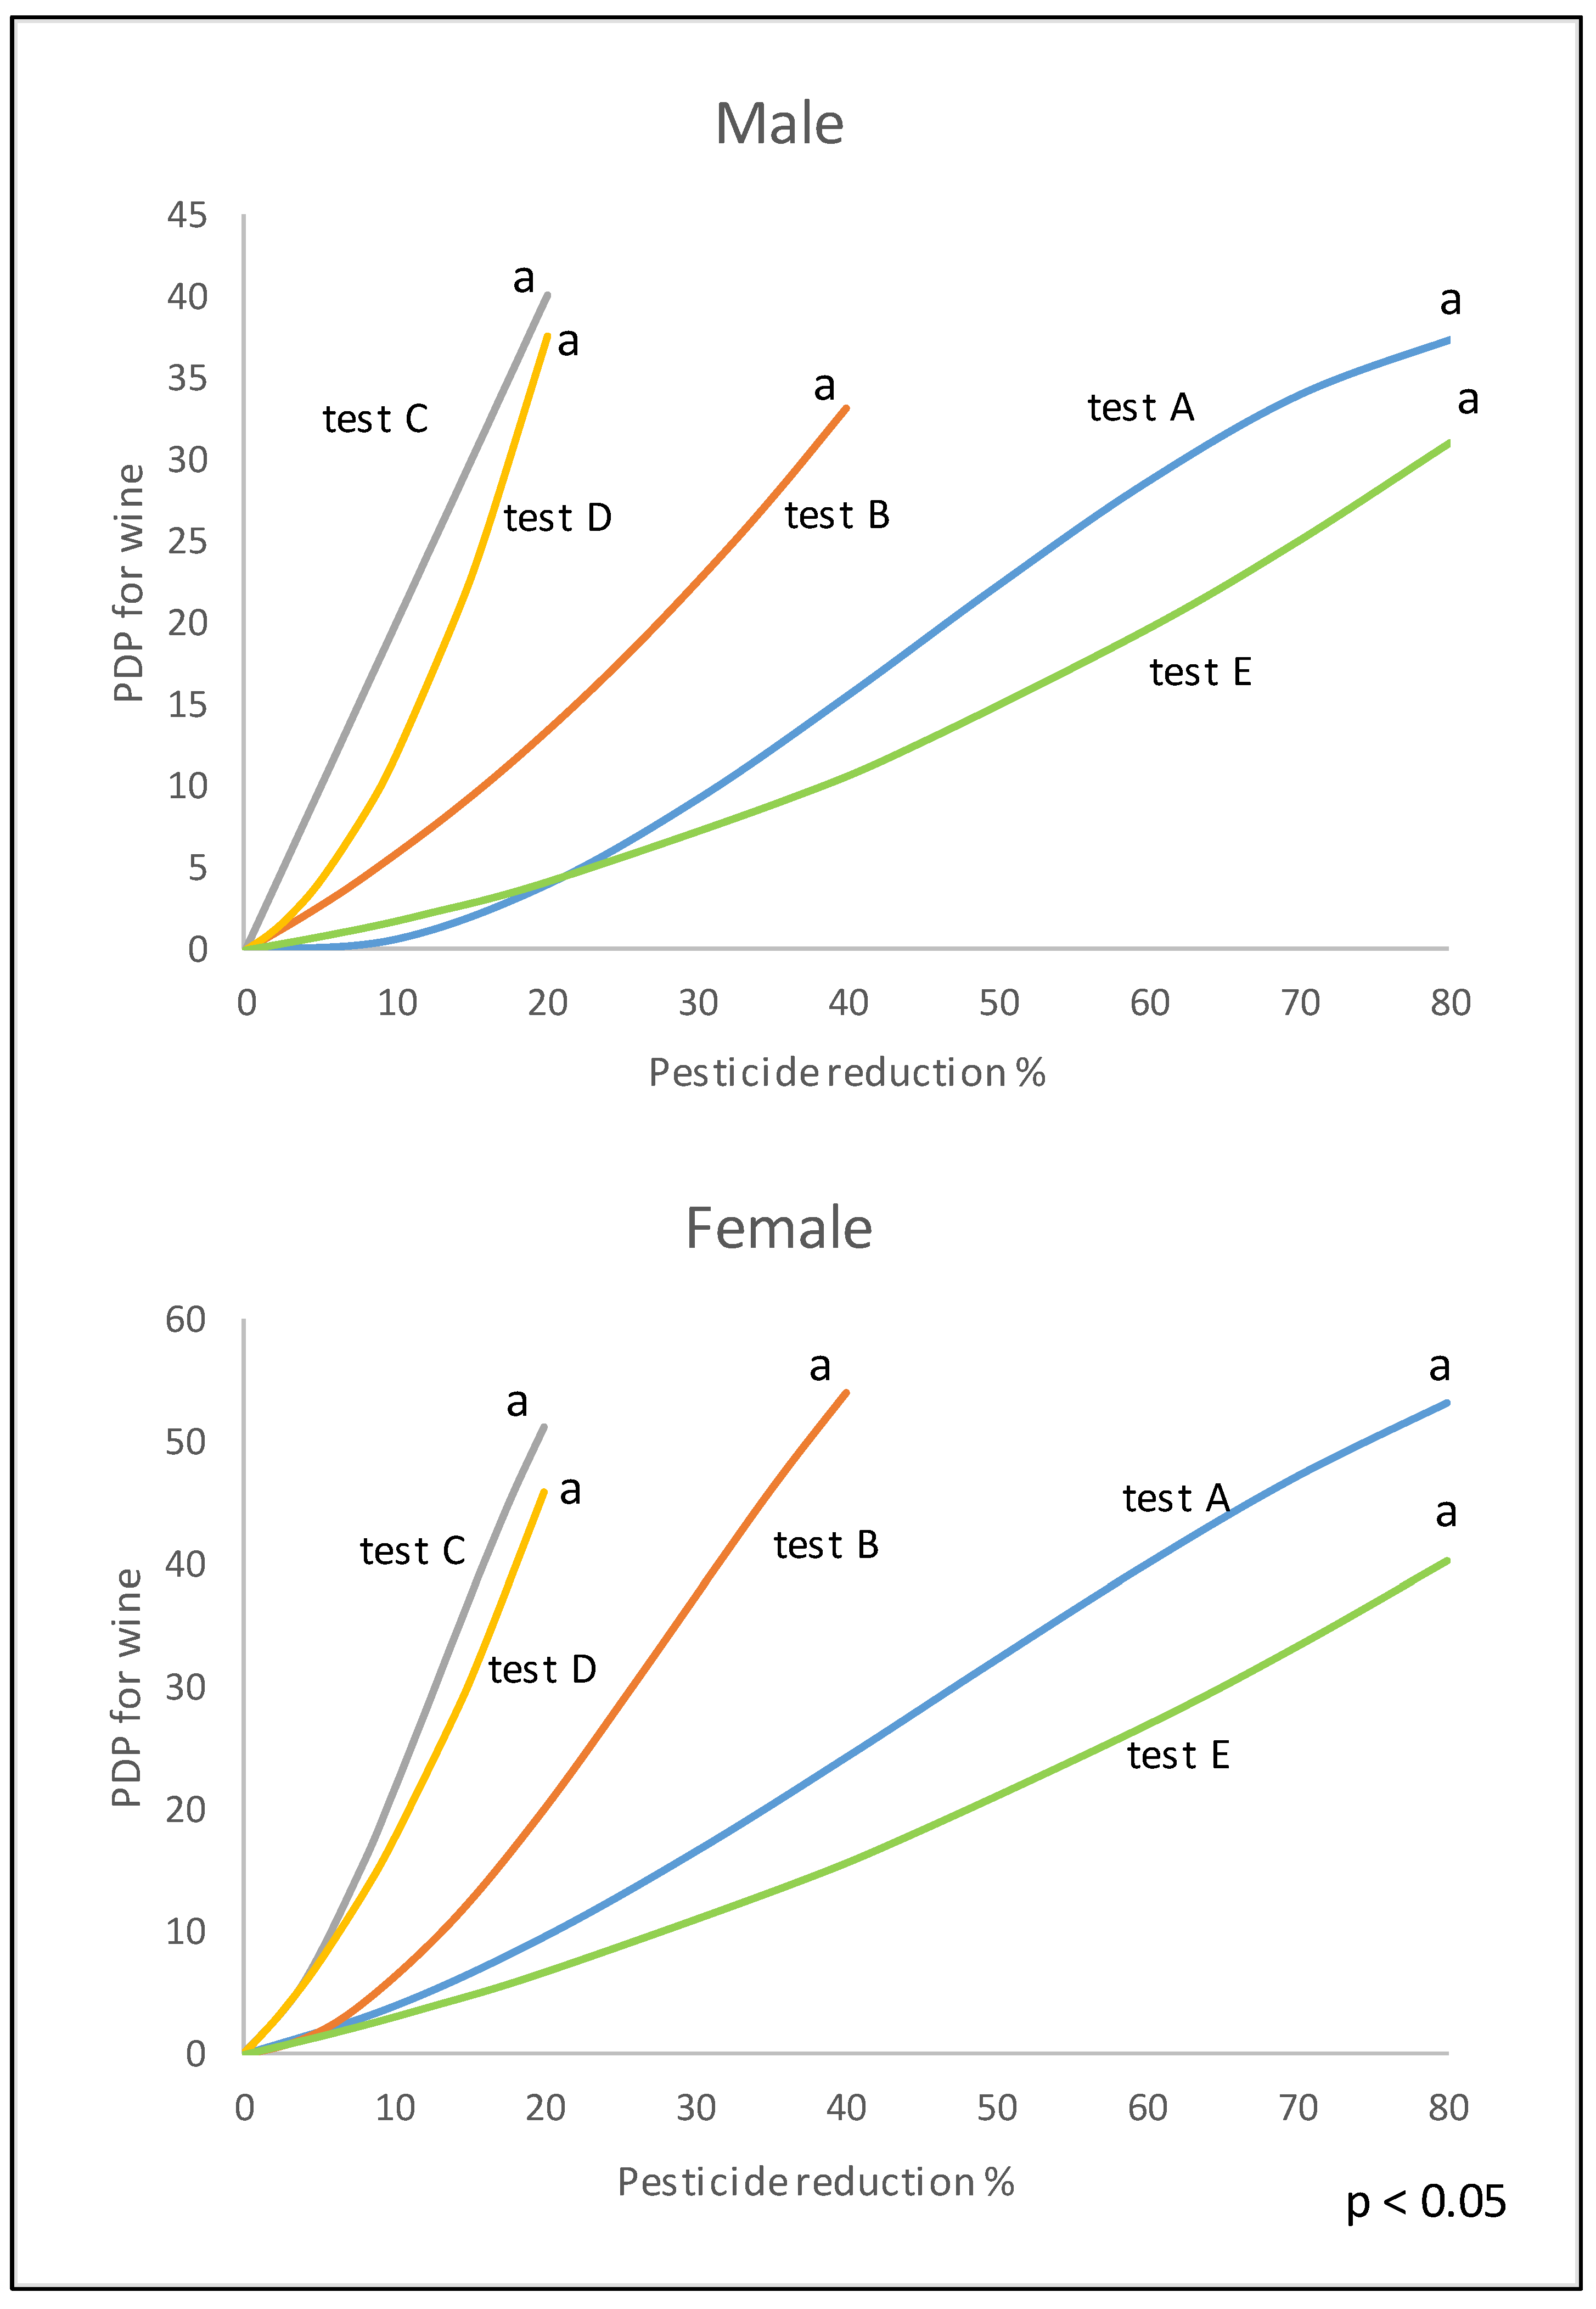
From the analysis of the average pesticide differential preferences for the wine achieved in the five simulated markets (Table 4), the preference for wine increased in all the simulated markets as the level of pesticide reduction increased, reaching the highest level with the maximum pesticide reduction of the test. The maximum PDP was also similar in all markets, i.e., it appears independent of the level of an absolute reduction in pesticides. However, this result did not consider non-experimental variables. The comparisons between the averages showed that, in the samples surveyed, the PDPs were independent of age and household per capita income (p < 0.05) and gender-dependent (Table 5), with higher PDPs for women and, in some tests, correlated negatively with purchases and the consumption of wine (Table 6). Considering that purchases and the consumption of wine were only correlated in some tests, that the correlations were modest, and that the survey was for exploratory purposes only. The causal relationships between the pesticide reduction and wine preferences were estimated on a gender basis and their results are shown in Figure 1.
First, the best forms of the equations of Figure 1 and Figure 2 were reported in the Supplementary Material Tables S1 and S2, where the equation and R2 of each test are properly shown.
Figure 1 shows the graphical representations of the results of the regression analyses between the reduction in pesticides in the vineyards and the differential pesticide preferences for wine for the males and females in the five tests. Regarding the forms of the equations, in one case, the linear equation is represented as it has the same R2 of the other two forms (the males of Test C). In five cases, the quadratic form is reported (males of Test B and males and females of Tests D and E) and in four cases the cubic one (the males and females of Test A, the females of Tests B and C). The maximum difference in R2 between one form of the equation and the other was 0.017 points. The higher R2 was 0.733 and the lower was 0.485. In all the tests for both males and females, the greatest differential pesticide preference for wine was obtained from the maximum level of the pesticide reduction predicted by the test and the differences. The PDPs greater than the five tests were not significant for p < 0.05. Comparing Tests A, B and C with the same gender confirmed the existence of an anchoring effect that is attributable to the maximum level of the pesticide reduction present in the simulated market. In particular, that the maximum preference for wine (1) is obtained with the maximum reduction in pesticides in the vineyards known to consumers and (2) that its value is independent of the absolute size of the pesticide reduction (the average PDPs not any different for p < 0.05). Furthermore, it was observed that the males and females in Test C showed different PDP growth dynamics, linear in one case and quadratic in the other. In general, therefore, it cannot be excluded that, in the same market, the different categories of consumers have different growth dynamics for the PDPs. The same category of consumers, for example the males in Figure 1, could change the dynamics of their reactivity to decrease the pesticides when the market conditions change. The figure shows a linear relationship in test C, a quadratic relationship in test B, and a cubic relationship in test A. However, the preference attributed to the same wine decreased when the maximum known reduction in pesticides increased. Ultimately, the comparison between Tests A, B, and C with the same gender showed that wines that can only be partially obtained with the FRG vines and producers who want to communicate their contribution to the sustainability of their company and/or the territory: (1) can obtain the same preferences of wines exclusively with FRG if consumers do not know the maximum potential of these vines, and (2) the preferences for the same wine decrease when consumers become aware of the possibility of further reducing the use of pesticides.
Considering Test D, Figure 1 shows, the average PDPs for the maximum reduction in pesticides for both males and females, which is not statistically different from those of Test C and not close to the other tests (p < 0.05). The repeatability of the test results would, therefore, be confirmed and the anchoring effect would be attributable to the maximum level of pesticide reduction known to the consumers.
Comparing Tests, A and E, both in the case of males and females, adding an attribute with two levels to the experimental plan did not significantly decrease the maximum PDP for wine, contrary to expectations. This result, however, was influenced by the fact that both the experimental plans focused the attention of the respondents on the reduction in pesticides, attributing a number of levels significantly higher than that of the other variables. Ultimately, the comparison between the two tests, on the one hand, highlights that the method proposed in this work is effective with different experimental plans and wine attributes and, on the other hand, reminds us that the estimated preferences for a “privileged” variable from the experimental plan is always greater than those in the real markets.
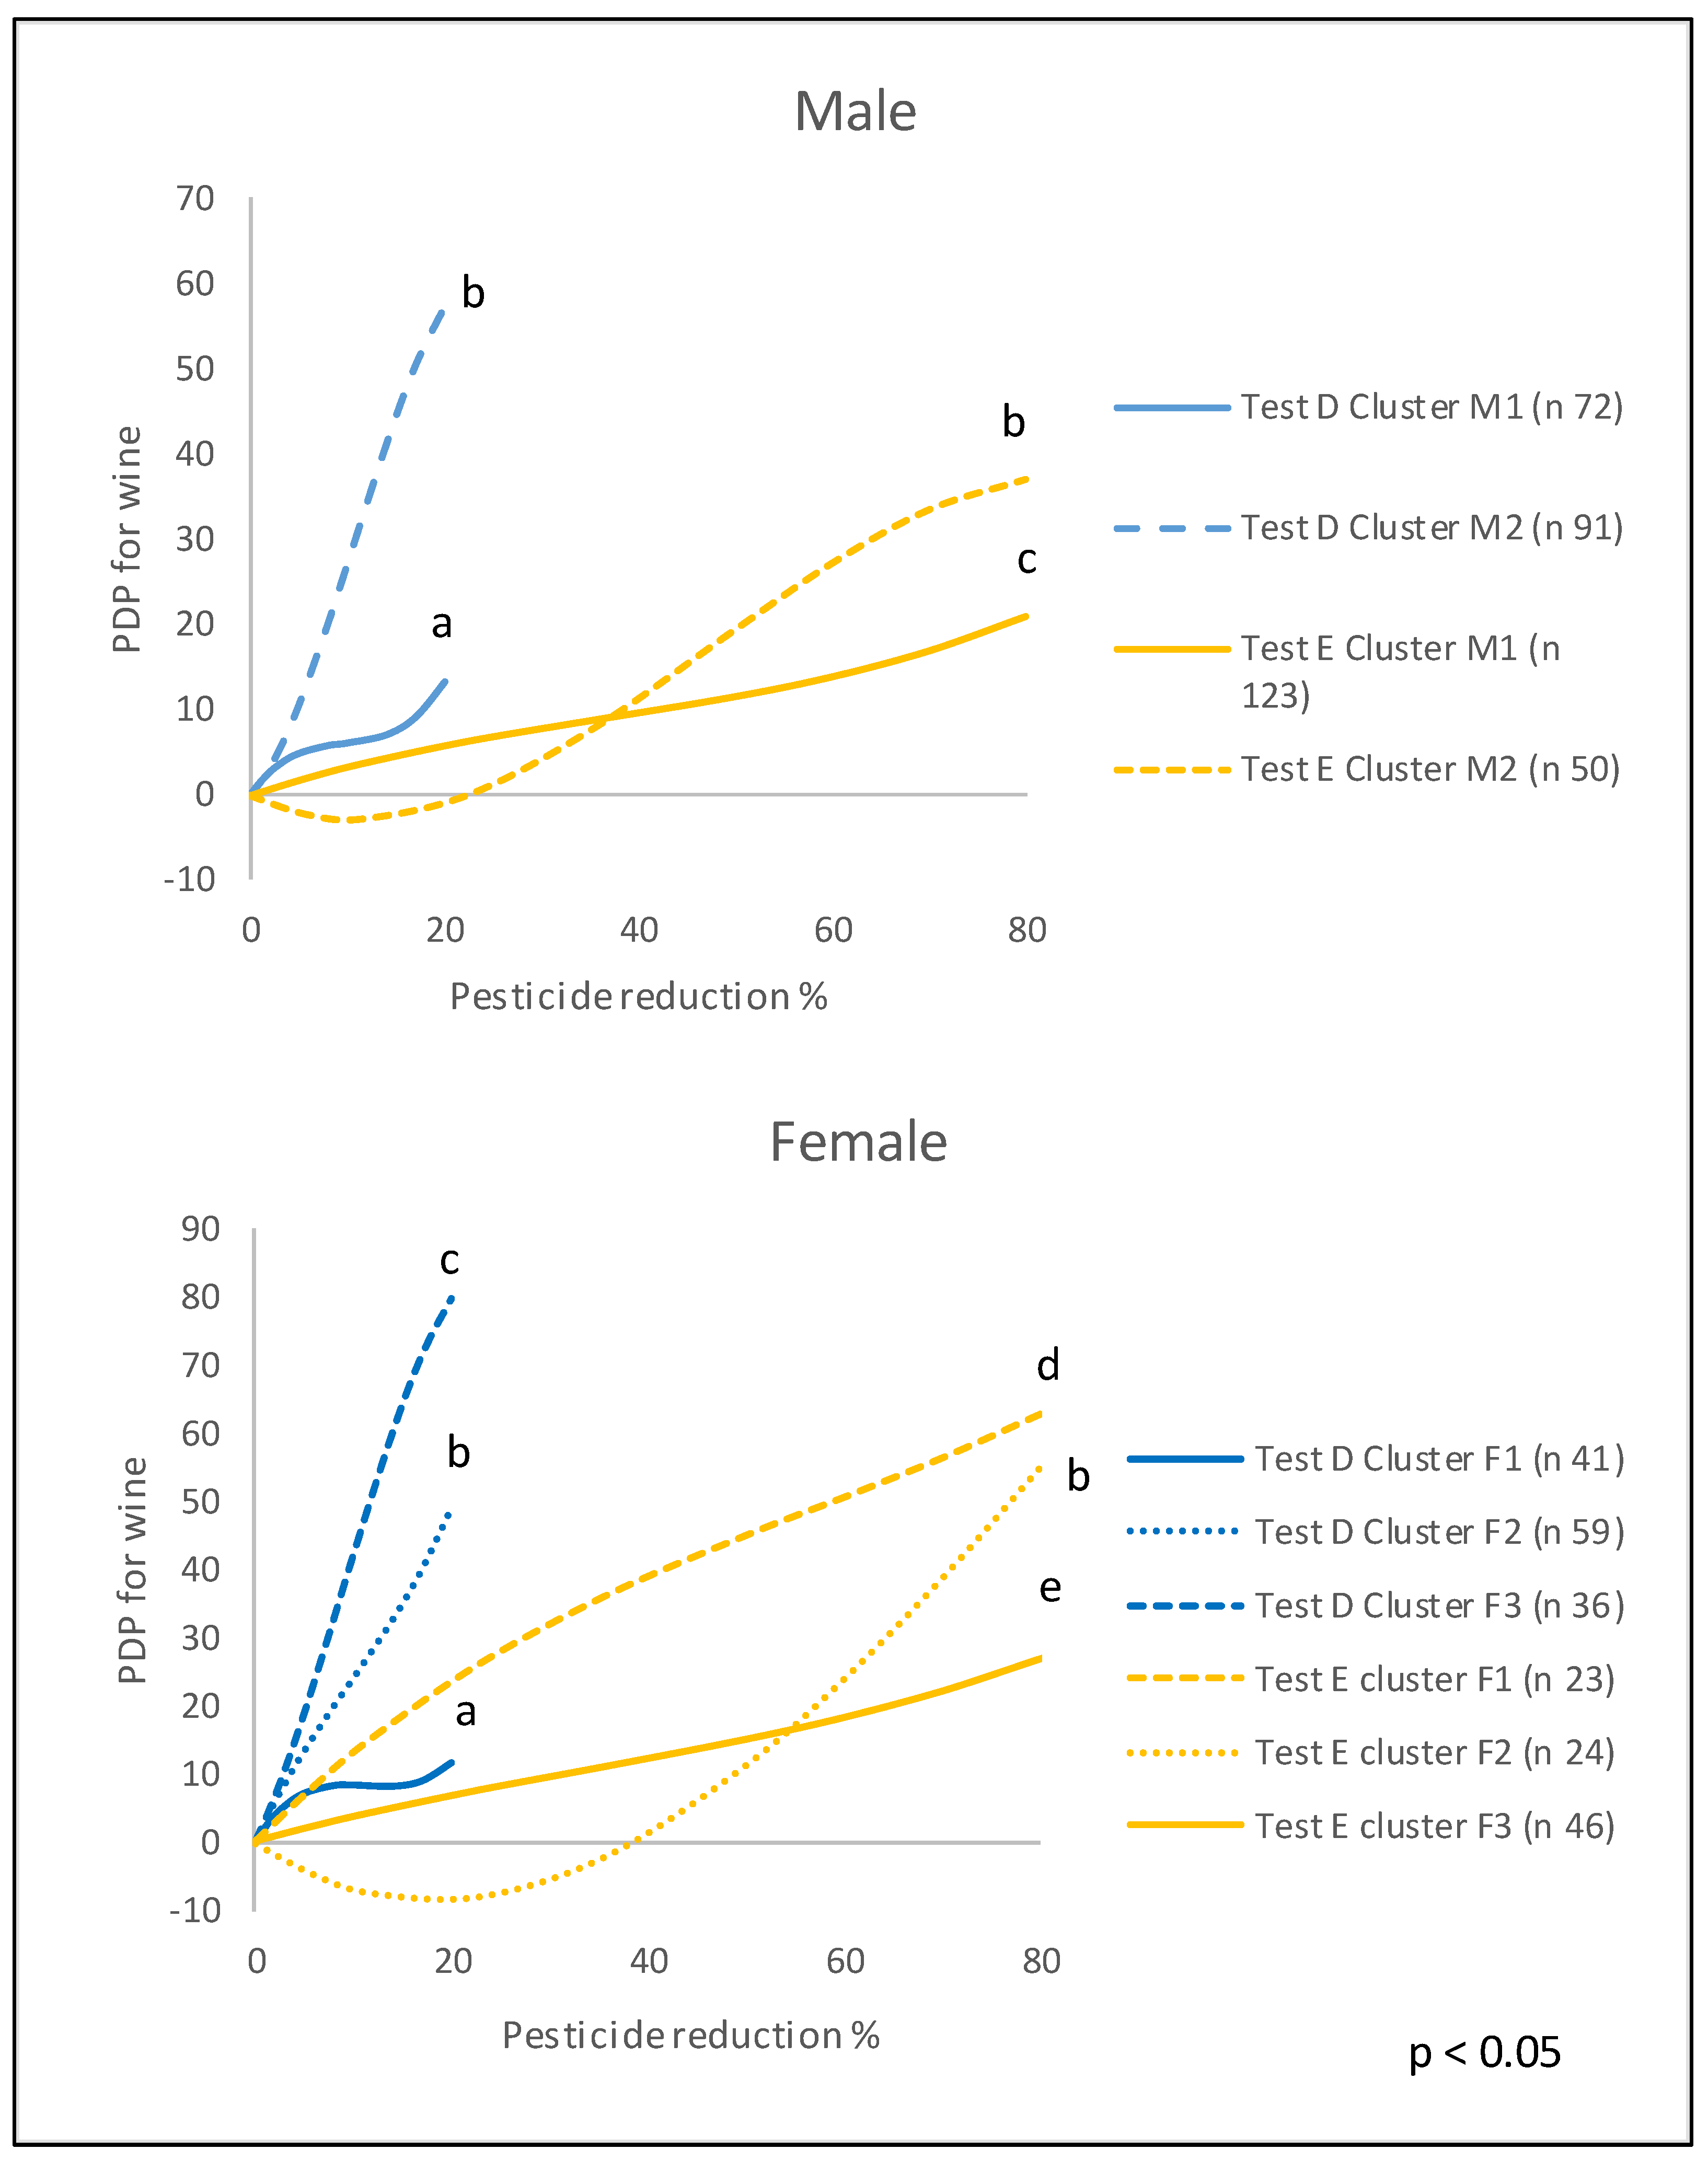
The analysis of the clusters as a function of the partial preferences for the five levels of the “pesticide information” variable was conducted separately for males and females, but only for the tests with the most numerous samples, i.e., Tests D and E (Figure 2). However, the clusters were identified according to the partial preferences for the five levels of the pesticide reduction. In both tests, two clusters were found for males and three for females. Within the same test and the same genus, the clusters had different mean maximum PDMs (p < 0.05) and different PDP variation dynamics. In particular: (1) no clusters emerged, neither indifferent to nor opposed to the reduction in pesticides; (2) all the clusters expressed the maximum PDP in the presence of the maximum pesticide reduction in their test; and (3) the differences between the maximum PDPs of the clusters of the same test were not only significant but also very large. Both the males and females of Test E showed a cluster that expressed negative PDPs for lower pesticide reductions, i.e., lower preferences for wine than those expressed in the absence of information on pesticide reduction. The PDPs for the maximum pesticide reduction known to respondents were independent of the absolute reduction level. With regard to these results, it should be noted that the number of clusters was modest but that some considerations were also made such as the importance of the anchoring effect due to the maximum level of the pesticide reduction known to the consumers remains confirmed. On the other hand, the question remained open as to whether the maximum known reduction level changes, or the maximum PDP remains the same for the same consumers as hypothesised from the results of Figure 1. To answer the question of Point C, which is perhaps the most interesting result of the work, it is necessary to know and detect all the determinants of the consumer reactions to the pesticide reduction [50,59,72]. It was necessary to understand, for example, that some consumers reward modest reductions in pesticides compared to the maximum ones (Clusters M1, F1 and F3 of Test E) while others punish them by attributing lower scores in the absence of pesticide reduction (Cluster M2 and F2 of Test E).
6. Conclusions
Breeding research towards the FRG changed the wine chain and contributed to the suppression of the main diseases, bringing the global wine sector towards unprecedented levels of productivity and quality. Therefore, the innovation in grape varieties has played an essential role in the history of viticulture. The solutions offered by the new hybrid vines, direct carriers, and rootstocks are being seriously considered by winegrowers and consumers to lead viticulture towards sustainability. For this, research tools in certain areas such as molecular biology, molecular markers, and virological tests made considerable progress due to the authorities who considered this as the future of viticulture. Moreover, farmers faced some problems selling the related wines as the final consumers were not ready to change grapes.
In fact, the new variety brought to the market struggled to connect with the consumers. This could have relied on few factors, including poor communication coupled with a poor marketing strategy, and a lack of consumer knowledge for how they work and the benefits that the resistant variety can bring to the whole chain. Effective innovations may result in poor acceptance rates due to information that may jeopardize their diffusion. This is the case for innovation that generates tension based on ideological positions. One example is the acceptance of genetically modified organisms (GMOs), which have been contrasted, particularly in the EU.
While consumers in developed countries increasingly advocate for more sustainable agri-food systems, these demands are not always accompanied by unconditional acceptance of agricultural biotechnology applications, particularly in wine production. Public opinion has strongly influenced the adoption of agricultural biotechnologies in the recent past. Therefore, understanding the drivers and barriers to public perceptions of these advances is of the utmost importance to inform policymakers who are interested in promoting pest management practices. For this reason, we decided to survey people to gather information, especially regarding pesticide reduction.
The consumers interviewed for this work were not provided with any information on the technique or method used to reduce pesticides in vineyards. The results are, therefore, applicable both to wines obtained from the FRG hybrid vines and to wines possibly obtained in the future using genome editing.
The market simulations with the conjoint analysis method allowed us to estimate the causal functions that measure consumer reactions to the changing levels of pesticide reduction in the vineyards.
In particular, despite the fact that the samples of consumers we investigated were homogeneous in terms of age, gender, level of education and activity, we identified the existence of groups with different dynamics and intensity of reactions. In other words, we highlighted that to predict the reactions of the consumers to the changes in pesticide reductions in vineyards or, more simply, to the spread of the FRG vines, one cannot ignore the involved determinants of consumer behaviour. Of course, this study-case had some limitations regarding a limited area and sample size. However, it can translate, to bigger future experiments using our analysing approach, which was the first important attempt to understand consumer attitude towards the FRG resistant wines and the related pesticide reduction.
The research aimed to test the hypothesis that the maximum level of the pesticide reduction present in the market can influence consumer responses. Considering the exploratory characteristics of the research, the results obtained are not conclusive but are stimulating. From what emerged, we can assume that only partially FRG wines could obtain the same competitive advantages as 100% FRG wines, if the latter were not present on the market. This advantage would decrease with the diffusion of the latter wines. In other words, if these results were confirmed by future research, there would be a prerequisite to separate the market for the pure FRG wines from that of other FRG wines, for example with different certifications. If this were to happen, the incentive to produce suitable FRG wines to replace the wines of V. vinifera, the main European wines and the environmental potential of the new vines should be depleted.
Supplementary Materials
The following supporting information can be downloaded at: https://www.mdpi.com/article/10.3390/su15010390/s1, Table S1: Questionaries for the consumers regarding test A; Table S2: Estimates of wine preferences according to the percentage reductions of pesticides in the vineyards.
Author Contributions
Conceptualization, S.S., F.N. and L.I.; methodology, S.S.; software, S.S. and F.N.; validation, S.S., F.N. and L.I.; formal analysis, S.S. and F.N.; investigation, S.S.; resources, L.I. and F.N.; data curation, S.S., F.N. and L.I.; writing—original draft preparation, G.M.; writing—review and editing, G.M., F.N., S.S. and L.I.; visualization, G.M.; supervision, L.I. and F.N.; project administration, S.S., F.N. and L.I. All authors have read and agreed to the published version of the manuscript.
Funding
This research received no external funding.
Institutional Review Board Statement
Not applicable.
Informed Consent Statement
Informed consent was obtained from all the subjects involved in the study.
Data Availability Statement
Not applicable.
Acknowledgments
The authors would like to thank the participants for filling in the questionaries.
Conflicts of Interest
The authors declare no conflict of interest.
References
- Haseeb, S.; Alexander, B.; Baranchuk, A.; Electrophysiology, C. Wine and cardiovascular health: A comprehensive review. Am. Heart Assoc. 2017, 136, 1434–1448. [Google Scholar] [CrossRef] [PubMed]
- Mian, G.; Belfiore, N.; Musetti, R.; Tomasi, D.; Cantone, P.; Lovat, L.; Lupinelli, S.; Iacumin, L.; Celotti, E.; Golinelli, F. Effect of a triacontanol-rich biostimulant on the ripening dynamic and wine must technological parameters in Vitis vinifera cv. ‘Ribolla Gialla’. Plant Physiol. Biochem. 2022, 188, 60–69. [Google Scholar] [CrossRef] [PubMed]
- Fiore, M.; Alaimo, L.S.; Chkhartishvil, N. The amazing bond among wine consumption, health and hedonistic well-being. Br. Food J. 2020, 122, 2707–2723. [Google Scholar] [CrossRef]
- Tomasi, D.; Lonardi, A.; Boscaro, D.; Nardi, T.; Marangon, C.M.; De Rosso, M.; Flamini, R.; Lovat, L.; Mian, G. Effects of Traditional and Modern Post-Harvest Withering Processes on the Composition of the Vitis v. Corvina Grape and the Sensory Profile of Amarone Wines. Molecules 2021, 26, 5198. [Google Scholar] [CrossRef]
- Töpfer, R.; Trapp, O. A cool climate perspective on grapevine breeding: Climate change and sustainability are driving forces for changing varieties in a traditional market. Theor. Appl. Genet. 2022, 135, 3947–3960. [Google Scholar] [CrossRef]
- OIV—OIV 2019 Report on the World Vitivinicultural Situation. Available online: https://www.oiv.int/en/oiv-life/oiv-2019-report-on-the-world-vitivinicultural-situation (accessed on 24 April 2021).
- Pivetta, D.; Rech, S.; Lazzaretto, A. Choice of the Optimal Design and Operation of Multi-Energy Conversion Systems in a Prosecco Wine Cellar. Energies 2020, 13, 6252. [Google Scholar] [CrossRef]
- Tomasi, D.; Marcuzzo, P.; Nardi, T.; Lonardi, A.; Lovat, L.; Flamini, R.; Mian, G. Influence of Soil Chemical Features on Aromatic Profile of V. vinifera cv. Corvina Grapes and Wines: A Study-Case in Valpolicella Area (Italy) in a Calcareous and Non-Calcareous Soil. Agriculture 2022, 12, 1980. [Google Scholar] [CrossRef]
- Magris, G.; Jurman, I.; Fornasiero, A.; Paparelli, E.; Schwope, R.; Marroni, F.; Di Gaspero, G.; Morgante, M. The genomes of 204 Vitis vinifera accessions reveal the origin of European wine grapes. Nat. Commun. 2021, 12, 1–12. [Google Scholar] [CrossRef]
- Feechan, A.; Anderson, C.; Torregrosa, L.; Jermakow, A.; Mestre, P.; Wiedemann-Merdinoglu, S.; Merdinoglu, D.; Walker, A.R.; Cadle-Davidson, L.; Reisch, B.; et al. Genetic dissection of a TIR-NB-LRR locus from the wild North American grapevine species Muscadinia rotundifolia identifies paralogous genes conferring resistance. Wiley Online Libr. 2013, 76, 661–674. [Google Scholar] [CrossRef]
- Mian, G.; Cipriani, G.; Saro, S.; Martini, M.; Ermacora, P. Evaluation of germplasm resources for resistance to kiwifruit vine decline syndrome (KVDS). Acta Hortic. 2022, 125–130. [Google Scholar] [CrossRef]
- Tomasi, D.; Gaiotti, F.; Petoumenou, D.; Lovat, L.; Belfiore, N.; Boscaro, D.; Mian, G. Winter Pruning: Effect on Root Density, Root Distribution and Root/Canopy Ratio in Vitis vinifera cv. Pinot Gris. Agronomy 2020, 10, 1509. [Google Scholar] [CrossRef]
- Pauquet, J.; Bouquet, A.; This, P.; Adam-Blondon, A.F. Establishment of a local map of AFLP markers around the powdery mildew resistance gene Run1 in grapevine and assessment of their usefulness for marker assisted selection. Theor. Appl. Genet. 2001, 103, 1201–1210. [Google Scholar] [CrossRef]
- Mian, G.; Cantone, P.; Golinelli, F. First evidence of the effect of a new biostimulant made by Fabaceae tissue on ripening dynamics and must technological main parameters in Vitis vinifera ‘Ribolla Gialla.’. Acta Hortic. 2022, 1333, 317–322. [Google Scholar] [CrossRef]
- Graniti, A.; Mugnai, L.; Surico, G. Esca of Grapevine: A Disease Complez or a Complex of Diseases. Esca Grapevine 2000, 1000–1005. [Google Scholar]
- Hallenn, F.; Crous, P.W. A review of black foot disease of grapevine. A Rev. Black Foot Dis. Grapevine 2006, 1000–1013. [Google Scholar]
- Ripamonti, M.; Cerone, L.; Abbà, S.; Rossi, M.; Ottati, S.; Palmano, S.; Marzachì, C.; Galetto, L. Silencing of ATP Synthase β Impairs Egg Development in the Leafhopper Scaphoideus titanus, Vector of the Phytoplasma Associated with Grapevine Flavescence Dorée. Int. J. Mol. Sci. 2022, 23, 765. [Google Scholar] [CrossRef]
- Bernardini, C.; Santi, S.; Mian, G.; Levy, A.; Buoso, S.; Suh, J.H.; Wang, Y.; Vincent, C.; van Bel, A.J.E.; Musetti, R. Increased susceptibility to Chrysanthemum Yellows phytoplasma infection in Atcals7ko plants is accompanied by enhanced expression of carbohydrate transporters. Planta 2022, 256, 43. [Google Scholar] [CrossRef]
- Eurostat. The Use of Plant Protection Products in the European Union; Eurostat: Luxembourg, 1992. [Google Scholar]
- Gisi, U.; Waldner, M.; Kraus, N.; Dubuis, P.H.; Sierotzki, H. Inheritance of resistance to carboxylic acid amide (CAA) fungicides in Plasmopara viticola. Plant Pathol. 2007, 56, 199–208. [Google Scholar] [CrossRef]
- Mian, G.; Celotti, E.; Falginella, L.; de Cantão, F.R.O.; Belfiore, N. Effect of manure application timing on roots, canopy and must quality in Vitis vinifera “Merlot”: A case study in Italy, North-East. VITIS J. Grapevine Res. 2022, 61, 87–92. [Google Scholar] [CrossRef]
- Montaigne, E.; Coelho, A.; Zadmehran, S. A Comprehensive Economic Examination and Prospects on Innovation in New Grapevine Varieties Dealing with Global Warming and Fungal Diseases. Sustainability 2021, 13, 13254. [Google Scholar] [CrossRef]
- Occupational Health Risks of Wine Industry Workers | British Columbia Medical Journal. Available online: https://bcmj.org/articles/occupational-health-risks-wine-industry-workers (accessed on 19 June 2022).
- Vezzulli, S.; Dolzani, C.; Migliaro, D.; Banchi, E.; Stedile, T.; Zatelli, A.; Dallaserra, M.; Clementi, S.; Dorigatti, C.; Velasco, R.; et al. The Fondazione Edmund Mach grapevine breeding program for downy and powdery mildew resistances: Toward a green viticulture. Acta Hortic. 2019, 1248, 109–114. [Google Scholar] [CrossRef]
- Falginella, L.; Gaiotti, F.; Belfiore, N.; Mian, G.; Lovat, L.; Tomasi, D. Effect of early cane pruning on yield components, grape composition, carbohydrates storage and phenology in Vitis vinifera L. cv. Merlot. OENO One 2022, 56, 19–28. [Google Scholar] [CrossRef]
- Khan, M.M.; Akram, M.T.; Qadri, R.W.K.; Al-Yahyai, R. Role of grapevine rootstocks in mitigating environmental stresses: A review. J. Agric. Mar. Sci. 2020, 25, 1–12. [Google Scholar] [CrossRef]
- Mian, G.; Cipriani, G.; Saro, S.; Martini, M.; Ermacora, P. Potential of Different Actinidia Genotypes as Resistant Rootstocks for Preventing Kiwifruit Vine Decline Syndrome. Horticulturae 2022, 8, 627. [Google Scholar] [CrossRef]
- Eibach, R.; Töpfer, R. 1—Traditional grapevine breeding techniques. In Grapevine Breeding Programs for the Wine Industry; Reynolds, A., Ed.; Woodhead Publishing Series in Food Science, Technology and Nutrition; Woodhead Publishing: Oxford, UK, 2015; pp. 3–22. ISBN 978-1-78242-075-0. [Google Scholar]
- Bellin, D.; Peressotti, E.; Merdinoglu, D.; Wiedemann-Merdinoglu, S.; Adam-Blondon, A.-F.; Cipriani, G.; Morgante, M.; Testolin, R.; Di Gaspero, G. Resistance to Plasmopara viticola in grapevine ‘Bianca’ is controlled by a major dominant gene causing localised necrosis at the infection site. Theor. Appl. Genet. 2009, 120, 163–176. [Google Scholar] [CrossRef] [Green Version]
- Poltronieri, P.; Marrazzo, M.T.; Cipriani, G. Grapevine: Resistance genes, sRNAs and immunity. In Applied Plant Biotechnology for Improving Resistance to Biotic Stress; Elsevier: Amsterdam, The Netherlands, 2020; pp. 151–179. [Google Scholar]
- Flor, A.H. Host-parasite interactions in flax rust-its genetics and other implications. Phytopathology 1955, 45, 680–685. [Google Scholar]
- Di Gaspero, G.; Cipriani, G.; Marrazzo, M.T.; Andreetta, D.; Castro, M.J.P.; Peterlunger, E.; Testolin, R. Isolation of (AC)n-microsatellites in Vitis vinifera L. and analysis of genetic background in grapevines under marker assisted selection. Mol. Breed. 2005, 15, 11–20. [Google Scholar] [CrossRef]
- Barker, C.L.; Donald, T.; Pauquet, J.; Ratnaparkhe, M.B.; Bouquet, A.; Adam-Blondon, A.-F.; Thomas, M.R.; Dry, I. Genetic and physical mapping of the grapevine powdery mildew resistance gene, Run1, using a bacterial artificial chromosome library. Theor. Appl. Genet. 2005, 111, 370–377. [Google Scholar] [CrossRef]
- Schwander, F.; Eibach, R.; Fechter, I.; Hausmann, L.; Zyprian, E.; Töpfer, R. Rpv10: A new locus from the Asian Vitis gene pool for pyramiding downy mildew resistance loci in grapevine. Theor. Appl. Genet. 2012, 124, 163–176. [Google Scholar] [CrossRef]
- Possamai, T.; Migliaro, D.; Gardiman, M.; Velasco, R.; De Nardi, B. Rpv Mediated Defense Responses in Grapevine Offspring Resistant to Plasmopara viticola. Plants 2020, 9, 781. [Google Scholar] [CrossRef]
- Yepuri, V.; Jalali, S.; Mudunuri, V.; Pothakani, S.; Kancharla, N.; Arockiasamy, S. Genotyping by sequencing-based linkage map construction and identification of quantitative trait loci for yield-related traits and oil content in Jatropha (Jatropha curcas L.). Mol. Biol. Rep. 2022, 49, 4293–4306. [Google Scholar] [CrossRef] [PubMed]
- Foria, S.; Monte, C.; Testolin, R.; Di Gaspero, G.; Cipriani, G. Pyramidizing resistance genes in grape: A breeding program for the selection of elite cultivars. Acta Hortic. 2019, 1248, 549–554. [Google Scholar] [CrossRef]
- Mundt, C.C. Pyramiding for Resistance Durability: Theory and Practice. Phytopathology 2018, 108, 792–802. [Google Scholar] [CrossRef]
- Schneider, C.; Onimus, C.; Prado, E.; Dumas, V.; Wiedemann-Merdinoglu, S.; Dorne, M.A.; Lacombe, M.C.; Piron, M.C.; Umar-Faruk, A.; Duchêne, E.; et al. INRA-ResDur: The French grapevine breeding programme for durable resistance to downy and powdery mildew. Acta Hortic. 2019, 1248, 207–214. [Google Scholar] [CrossRef]
- Son, S.; Park, S.R. Challenges Facing CRISPR/Cas9-Based Genome Editing in Plants. Front. Plant Sci. 2022, 13, 902413. [Google Scholar] [CrossRef] [PubMed]
- Borrelli, V.M.G.; Brambilla, V.; Rogowsky, P.; Marocco, A.; Lanubile, A. The Enhancement of Plant Disease Resistance Using CRISPR/Cas9 Technology. Front. Plant Sci. 2018, 9, 1245. [Google Scholar] [CrossRef]
- Wasan, P. Sustainable Technology in Hospitality Industry. In Managing Sustainability in the Hospitality and Tourism Industry Paradigms and Directions for the Future; Jauhari, V., Ed.; CRC Press: Boca Raton, FL, USA, 2014; pp. 101–135. ISBN 978-1-4822-2356-9. [Google Scholar]
- Manikandan, A.; Muthukumaran, P.; Poorni, S.; Priya, M.; Rajeswari, R.; Kamaraj, M.; Aravind, J. Microbial Approaches for Bioconversion of Agro-Industrial Wastes: A Review. In Strategies and Tools for Pollutant Mitigation: Research Trends in Developing Nations; Aravind, J., Kamaraj, M., Karthikeyan, S., Eds.; Springer International Publishing: Cham, Switzerland, 2022; pp. 151–180. ISBN 978-3-030-98241-6. [Google Scholar]
- Institut Français de la de la Vigne et du Vin Occitanie-Sud-Ouest-Languedoc-Roussillon. Available online: https://www.vignevin-occitanie.com (accessed on 19 June 2022).
- Unione Italiana Vini Report 2019. Available online: https://www.unioneitalianavini.it (accessed on 19 June 2022).
- Borrello, M.; Cembalo, L.; Vecchio, R. Consumers’ acceptance of fungus resistant grapes: Future scenarios in sustainable winemaking. J. Clean. Prod. 2021, 307, 127318. [Google Scholar] [CrossRef]
- Mian, G.; Iseppi, L.; Traversari, G.; Ermacora, P.; Cipriani, G.; Nassivera, F. Consumers Perceptions and Motivations in the Choice of Kiwifruits: A Study-Case in Italy, North-East. QAS 2022, 23, 163–175. [Google Scholar] [CrossRef]
- Sellers-Rubio, R.; Nicolau-Gonzalbez, J.L. Estimating the willingness to pay for a sustainable wine using a Heckit model. Wine Econ. Policy 2016, 5, 96–104. [Google Scholar] [CrossRef]
- Schäufele, I.; Hamm, U. Consumers’ perceptions, preferences and willingness-to-pay for wine with sustainability characteristics: A review. J. Clean. Prod. 2017, 147, 379–394. [Google Scholar] [CrossRef]
- Borrello, M.; Cembalo, L.; Vecchio, R. Role of information in consumers’ preferences for eco-sustainable genetic improvements in plant breeding. PLoS ONE 2021, 16, e0255130. [Google Scholar] [CrossRef] [PubMed]
- Holme, I.B.; Wendt, T.; Holm, P.B. Intragenesis and cisgenesis as alternatives to transgenic crop development. Plant Biotechnol. J. 2013, 11, 395–407. [Google Scholar] [CrossRef] [PubMed]
- Mielby, H.; Sandøe, P.; Lassen, J. Multiple aspects of unnaturalness: Are cisgenic crops perceived as being more natural and more acceptable than transgenic crops? Agric. Hum. Values 2013, 30, 471–480. [Google Scholar] [CrossRef]
- Telem, R.S.; Wani, S.H.; Singh, N.B.; Nandini, R.; Sadhukhan, R.; Bhattacharya, S.; Mandal, N. Cisgenics—A Sustainable Approach for Crop Improvement. Curr. Genom. 2013, 14, 468–476. [Google Scholar] [CrossRef] [Green Version]
- Scott, S.E.; Inbar, Y.; Wirz, C.D.; Brossard, D.; Rozin, P. An Overview of Attitudes toward Genetically Engineered Food. Annu. Rev. Nutr. 2018, 38, 459–479. [Google Scholar] [CrossRef]
- Saliba, A.J.; Moran, C.C. The influence of perceived healthiness on wine consumption patterns. Food Qual. Prefer. 2010, 21, 692–696. [Google Scholar] [CrossRef]
- Mancini, M.C.; Antonioli, F. To What Extent Are Consumers’ Perception and Acceptance of Alternative Meat Production Systems Affected by Information? The Case of Cultured Meat. Animals 2020, 10, 656. [Google Scholar] [CrossRef]
- Marris, C. The Construction of Imaginaries of the Public as a Threat to Synthetic Biology. Sci. Cult. 2015, 24, 83–98. [Google Scholar] [CrossRef] [Green Version]
- Lu, L.; Rahman, I.; Geng-Qing Chi, C. Can knowledge and product identity shift sensory perceptions and patronage intentions? The case of genetically modified wines. Int. J. Hosp. Manag. 2016, 53, 152–160. [Google Scholar] [CrossRef]
- Vecchio, R.; Pomarici, E.; Giampietri, E.; Borrello, M. Consumer acceptance of fungus-resistant grape wines: Evidence from Italy, the UK, and the USA. PLoS ONE 2022, 17, e0267198. [Google Scholar] [CrossRef]
- “Risparmio di 1.100 Euro per Ettaro con le viti Resistenti”. 21 Milioni Di Euro In Tre Anni Per Il Progetto Cloni. Available online: https://www.winemag.it/risparmio-di-1100-euro-per-ettaro-con-le-viti-resistenti (accessed on 20 June 2022).
- Tu, V.H.; Kopp, S.W.; Trang, N.T.; Kontoleon, A.; Yabe, M. UK Consumers’ Preferences for Ethical Attributes of Floating Rice: Implications for Environmentally Friendly Agriculture in Vietnam. Sustainability 2021, 13, 8354. [Google Scholar] [CrossRef]
- Feucht, Y.; Zander, K. Consumers’ Willingness to Pay for Climate-Friendly Food in European Countries. Proc. Food Syst. Dyn. 2017, 360–377. [Google Scholar] [CrossRef]
- Hanley, N.; Wright, R.E.; Alvarez-Farizo, B. Estimating the economic value of improvements in river ecology using choice experiments: An application to the water framework directive. J. Environ. Manag. 2006, 78, 183–193. [Google Scholar] [CrossRef]
- Yang, Y.; Paladino, A. The case of wine: Understanding Chinese gift-giving behavior. Mark. Lett. 2015, 26, 335–361. [Google Scholar] [CrossRef]
- Pomarici, E.; Vecchio, R. Millennial generation attitudes to sustainable wine: An exploratory study on Italian consumers. J. Clean. Prod. 2014, 66, 537–545. [Google Scholar] [CrossRef]
- Teissedre, P.L. Composition of grape and wine from resistant vines varieties. OENO One 2018, 52, 197. [Google Scholar] [CrossRef]
- Furlan, R.; Martone, D. La conjoint analysis per la ricerca sociale e di marketing. 2011. Available online: https://www.torrossa.com/en/resources/an/2652367 (accessed on 20 June 2022).
- Molteni, L.; Troilo, G. Ricerche di Marketing; McGraw-Hill: New York, NY, USA, 2007. [Google Scholar]
- Ryu, J.P.; Shin, J.T.; Kim, J.; Kim, Y.W. Consumer preference for edible insect-containing cookies determined by conjoint analysis: An exploratory study of Korean consumers. Entomol. Res. 2017, 47, 74–83. [Google Scholar] [CrossRef]
- Nesselhauf, L.; Fleuchaus, R.; Theuvsen, L. What about the environment?A choice-based conjoint study about wine from fungus-resistant grape varieties. Int. J. Wine Bus. Res. 2019, 32, 96–121. [Google Scholar] [CrossRef]
- Zito, S.; Caffarra, A.; Richard, Y.; Castel, T.; Bois, B. Climate change and vine protection: The case of mildews management in Burgundy. E3S Web Conf. 2018, 50, 01006. [Google Scholar] [CrossRef] [Green Version]
- Risius, A.; Klann, B.-O.; Meyerding, S.G.H. Choosing a lifestyle? Reflection of consumer extrinsic product preferences and views on important wine characteristics in Germany. Wine Econ. Policy 2019, 8, 141–154. [Google Scholar] [CrossRef]
Figure 1.
Preferences for wine as a function of the percentage in the reduction in pesticides in the vineyards (t tests were carried out only among the average PDPs for five levels of pesticide reductions, p < 0.05). Different lowercase letters next to the curves indicate the different means between the PDPs (p < 0.05).

Figure 2.
Effect of the non-experimental and undetected variables on the PDPs for wine (t-tests done only between the average PDPs for five levels of pesticide reductions, p < 0.05). Different lowercase letters next to the curves indicate the different means between the PDPs (p < 0.05).
Figure 2.
Effect of the non-experimental and undetected variables on the PDPs for wine (t-tests done only between the average PDPs for five levels of pesticide reductions, p < 0.05). Different lowercase letters next to the curves indicate the different means between the PDPs (p < 0.05).


Table 1.
Variables of the orthogonal experimental planes.
| Attributes | Levels |
|---|---|
| Wine name | Prosecco; Ribolla gialla. |
| Certification * | DOC; absent. |
| Price (€/bottle) | 5; 9. |
| Pesticide information ** | Level 1; Level 2; Level 3; Level 4; Level 5. |
| Test A: Level 1 = Absent; Level 2 = 20%; Level 3 = 40%; Level 4 = 60%; Level 5 = 80% | |
| Test B: Level 1 = Absent; Level 2 = 8%; Level 3 = 20%; Level 4 = 32%; Level 5 = 40% | |
| Test C: Level 1 = Absent; Level 2 = 8%; Level 3 = 12%; Level 4 = 16%; Level 5 = 20% | |
| Test D: Level = Absent; Level 2 = 3%; Level 3 = 8%; Level 4 = 14%; Level 5 = 20% | |
| Test E: Level 1= Absent; Level 2 = 12%; Level 3 = 36%; Level 4 = 60%; Level 5 = 80% | |
* Only in test E.; ** “In our vineyards we are able to reduce pesticides by …”.
Table 2.
Consumer sample (undergraduate students, %).
| Test | |||||||
|---|---|---|---|---|---|---|---|
| A (n = 119) | B (n = 106) | C (n = 118) | D (n = 299) | E (n = 268) | Total (n = 910) | ||
| Gender | Male | 52.9 | 59.4 | 40.7 | 54.5 | 65.0 | 56.2 |
| Female | 47.1 | 40.6 | 59.3 | 45.5 | 35.0 | 43.8 | |
| Total | 100.0 | 100.0 | 100.0 | 100.0 | 100.0 | 100.0 | |
| Age | 18–23 | 84.6 | 94.2 | 83.8 | 76.9 | 90.8 | 84.9 |
| 24–26 | 12.0 | 3.9 | 12.8 | 20.4 | 8.8 | 13.0 | |
| 27–30 | 3.4 | 1.9 | 3.4 | 2.7 | 0.4 | 2.1 | |
| Total | 100.0 | 100.0 | 100.0 | 100.0 | 100.0 | 100.0 | |
| Per capita income of the household | <1.000 | 6.7 | 2.8 | 4.2 | 7.4 | 4.6 | 5.6 |
| 1.000–2.000 | 26.1 | 27.4 | 28.8 | 25.8 | 29.5 | 27.4 | |
| 2.000–3.000 | 33.6 | 28.3 | 30.5 | 28.1 | 34.2 | 30.8 | |
| 3.000–4.000 | 16.0 | 19.8 | 16.9 | 16.4 | 18.1 | 17.3 | |
| 4.000–5.000 | 7.6 | 5.7 | 7.6 | 8.7 | 5.1 | 7.1 | |
| >5.000 | 10.1 | 16.0 | 11.9 | 13.7 | 8.4 | 11.8 | |
| Total | 100.0 | 100.0 | 100.0 | 100.0 | 100.0 | 100.0 | |
| Do you buy wine? | 1 Never | 16.8 | 9.4 | 14.4 | 13.0 | 21.6 | 15.8 |
| 2 | 16.8 | 19.8 | 17.8 | 20.1 | 20.5 | 19.5 | |
| 3 | 13.4 | 18.9 | 22.0 | 16.7 | 16.8 | 17.3 | |
| 4 | 20.2 | 20.8 | 20.3 | 14.7 | 15.7 | 17.1 | |
| 5 | 19.3 | 17.0 | 14.4 | 16.4 | 12.7 | 15.5 | |
| 6 | 7.6 | 11.3 | 8.5 | 10.7 | 6.7 | 8.9 | |
| 7 Always | 5.9 | 2.8 | 2.5 | 8.4 | 6.0 | 5.9 | |
| Total | 100.0 | 100.0 | 100.0 | 100.0 | 100.0 | 100.0 | |
| Do you consume wine? | 1 Never | 6.7 | 4.7 | 6.8 | 6.4 | 9.7 | 7.3 |
| 2 | 15.1 | 11.3 | 8.5 | 11.0 | 17.5 | 13.2 | |
| 3 | 13.4 | 11.3 | 11.9 | 13.0 | 16.8 | 13.8 | |
| 4 | 16.0 | 22.6 | 20.3 | 13.4 | 16.0 | 16.5 | |
| 5 | 23.5 | 29.2 | 27.1 | 24.4 | 20.5 | 24.1 | |
| 6 | 17.6 | 17.0 | 16.9 | 17.7 | 13.1 | 16.2 | |
| 7 Always | 7.6 | 3.8 | 8.5 | 14.0 | 6.3 | 9.0 | |
| Total | 100.0 | 100.0 | 100.0 | 100.0 | 100.0 | 100.0 | |
Table 3.
Results of the conjoint analyses (partial preferences). Std.E. = standard error.
| Test | |||||||||||
|---|---|---|---|---|---|---|---|---|---|---|---|
| A (n = 119) | B (n = 106) | C (n = 118) | D (n = 299) | E (n = 268) | |||||||
| Attributes | Levels | Mean | Std.E. | Mean | Std.E. | Mean | Std.E. | Mean | Std.E. | Mean | Std.E. |
| Wine name | Prosecco | 1.26 | 0.43 | 2.85 | 0.46 | 1.09 | 0.47 | −0.65 | 0.44 | 1.33 | 0.32 |
| Ribolla gialla | −1.26 | 0.43 | −2.85 | 0.46 | −1.09 | 0.47 | 0.65 | 0.44 | −1.33 | 0.32 | |
| Certification | DOC | 2.78 | 0.24 | ||||||||
| Absent | −2.78 | 0.24 | |||||||||
| Price (€/bott.) | 5 | 2.80 | 0.43 | 1.82 | 0.46 | 3.18 | 0.47 | 1.48 | 0.44 | 2.25 | 0.39 |
| 9 | −2.80 | 0.43 | −1.82 | 0.46 | -3.18 | 0.47 | −1.48 | 0.44 | −2.25 | 0.39 | |
| Pesticide information | Level 1 | −21.02 | 0.81 | −18.68 | 0.87 | −25.03 | 0.89 | −18.70 | 0.88 | −14.05 | 0.73 |
| Level 2 | −14.56 | 0.81 | −14.09 | 0.87 | −10.40 | 0.89 | −12.25 | 0.69 | −11.14 | 0.57 | |
| Level 3 | −1.08 | 0.81 | −2.77 | 0.87 | 2.28 | 0.89 | −2.47 | 0.50 | −3.38 | 0.41 | |
| Level 4 | 12.83 | 1.05 | 12.59 | 1.13 | 11.07 | 1.15 | 10.55 | 0.70 | 8.36 | 0.51 | |
| Level 5 | 23.83 | 1.05 | 22.95 | 1,13 | 22.08 | 1.15 | 22.87 | 1.06 | 20.21 | 0.78 | |
| Constant | 47.97 | 0.46 | 45.74 | 0.49 | 50.42 | 0.50 | 45.54 | 0.91 | 57.98 | 0.75 | |
| Correlations between the total observed and the estimated preferences | |||||||||||
| Value | Sig. | Value | Sig. | Value | Sig. | Value | Sig. | Value | Sig. | ||
| R of Pearson | 0.997 | 0.000 | 0.996 | 0.000 | 0.996 | 0.000 | 0.998 | 0.000 | 0.993 | 0.000 | |
| Tau of Kendall | 0.983 | 0.000 | 0.983 | 0.000 | 0.967 | 0.000 | 0.967 | 0.000 | 0.950 | 0.000 | |
| Tau of Kendall for checks (controls) | 1.000 | 0.007 | 1.000 | 0.007 | 1.000 | 0.007 | 1.000 | 0.007 | 0.800 | 0.025 | |
Table 4.
The pesticide differential preferences for wine (PDP). Std.E. = standard error.
| Information on the Reduction in Pesticides in Vineyards * | Test | |||||||||
|---|---|---|---|---|---|---|---|---|---|---|
| A (n = 119) | B (n = 106) | C (n= 118) | D (n = 299) | E (n = 268) | ||||||
| Mean | Std.E. | Mean | Std.E. | Mean | Std.E. | Mean | Std.E. | Mean | Std.E. | |
| Level 1 (Absent) | 0.00 | 0.00 | 0.00 | 0.00 | 0.00 | 0.00 | 0.00 | 0.00 | 0.00 | 0.00 |
| Level 2 | 6.45 | 1.49 | 4.59 | 1.37 | 14.64 | 1.34 | 6.45 | 0.82 | 2.92 | 0.83 |
| Level 3 | 19.93 | 1.78 | 15.91 | 2.05 | 27.31 | 1.61 | 16.23 | 1.04 | 10.67 | 0.92 |
| Level 4 | 33.84 | 2.24 | 31.27 | 2.53 | 36.10 | 1.95 | 29.24 | 1.46 | 22.42 | 1.11 |
| Level 5 | 44.85 | 2.59 | 41.63 | 2.94 | 47.11 | 2.67 | 41.56 | 1.77 | 34.27 | 1.33 |
| Test A: Level 1 = Absent; Level 2 = 20%; Level by...3 = 40%; Level 4 = 60%; Level 5 = 80% | ||||||||||
| Test B: Level 1 = Absent; Level 2 = 8%; Level 3 = 20%; Level 4 = 32%; Level 5 = 40% | ||||||||||
| Test C: Level 1 = Absent; Level 2 = 8%; Level 3 = 12%; Level 4 = 16%; Level 5 = 20% | ||||||||||
| Test D: Level 1 = Absent; Level 2 = 3%; Level 3 = 8%; Level 4 = 14%; Level 5 = 20% | ||||||||||
| Test E: Level 1 = Absent; Level 2 = 12%; Level 3 = 36%; Level 4 = 60%; Level 5 = 80% | ||||||||||
* In our vineyards, we can reduce pesticides.
Table 5.
Effect of gender on the pesticide differential preferences for wine (average PDP for Level 5 levels).
Table 5.
Effect of gender on the pesticide differential preferences for wine (average PDP for Level 5 levels).
| Male | Female | |
|---|---|---|
| Test A | 37.42 | 53.20 * |
| Test B | 33.10 | 54.14 * |
| Test C | 40.79 | 51.45 * |
| Test D | 37.87 | 45.99 * |
| Test E | 30.94 | 40.44 * |
* p < 0.05.
Table 6.
Pearson’s correlations between the PDPs for the five levels and familiarity for wine.
| Wine Purchases | Wine Consumption | |
|---|---|---|
| Test A | −0.167 | −0.104 |
| Test B | −0.156 | −0.171 |
| Test C | 0.015 | 0.047 |
| Test D | −0.063 | −0.180 * |
| Test E | −0.141 * | −0.174 * |
* p < 0.05.
Disclaimer/Publisher’s Note: The statements, opinions and data contained in all publications are solely those of the individual author(s) and contributor(s) and not of MDPI and/or the editor(s). MDPI and/or the editor(s) disclaim responsibility for any injury to people or property resulting from any ideas, methods, instructions or products referred to in the content. |
© 2022 by the authors. Licensee MDPI, Basel, Switzerland. This article is an open access article distributed under the terms and conditions of the Creative Commons Attribution (CC BY) license (https://creativecommons.org/licenses/by/4.0/).
Share and Cite
MDPI and ACS Style
Mian, G.; Nassivera, F.; Sillani, S.; Iseppi, L. Grapevine Resistant Cultivars: A Story Review and the Importance on the Related Wine Consumption Inclination. Sustainability 2023, 15, 390. https://doi.org/10.3390/su15010390
AMA Style
Mian G, Nassivera F, Sillani S, Iseppi L. Grapevine Resistant Cultivars: A Story Review and the Importance on the Related Wine Consumption Inclination. Sustainability. 2023; 15(1):390. https://doi.org/10.3390/su15010390
Chicago/Turabian StyleMian, Giovanni, Federico Nassivera, Sandro Sillani, and Luca Iseppi. 2023. "Grapevine Resistant Cultivars: A Story Review and the Importance on the Related Wine Consumption Inclination" Sustainability 15, no. 1: 390. https://doi.org/10.3390/su15010390
Note that from the first issue of 2016, this journal uses article numbers instead of page numbers. See further details here.