
The Effects of China’s Participation in the Comprehensive and Progressive Agreement for Trans-Pacific Partnership (CPTPP): A Quantitative Assessment

1
School of Business and Economics, Dankook University, Yongin 16890, Republic of Korea
2
THEMA, CY Cergy Paris University, 95011 Cergy, France
3
School of Business and Economics, RWTH Aachen University, 52056 Aachen, Germany
Sustainability 2023, 15(1), 344; https://doi.org/10.3390/su15010344
Submission received: 24 November 2022
/
Revised: 16 December 2022
/
Accepted: 22 December 2022
/
Published: 26 December 2022
Abstract
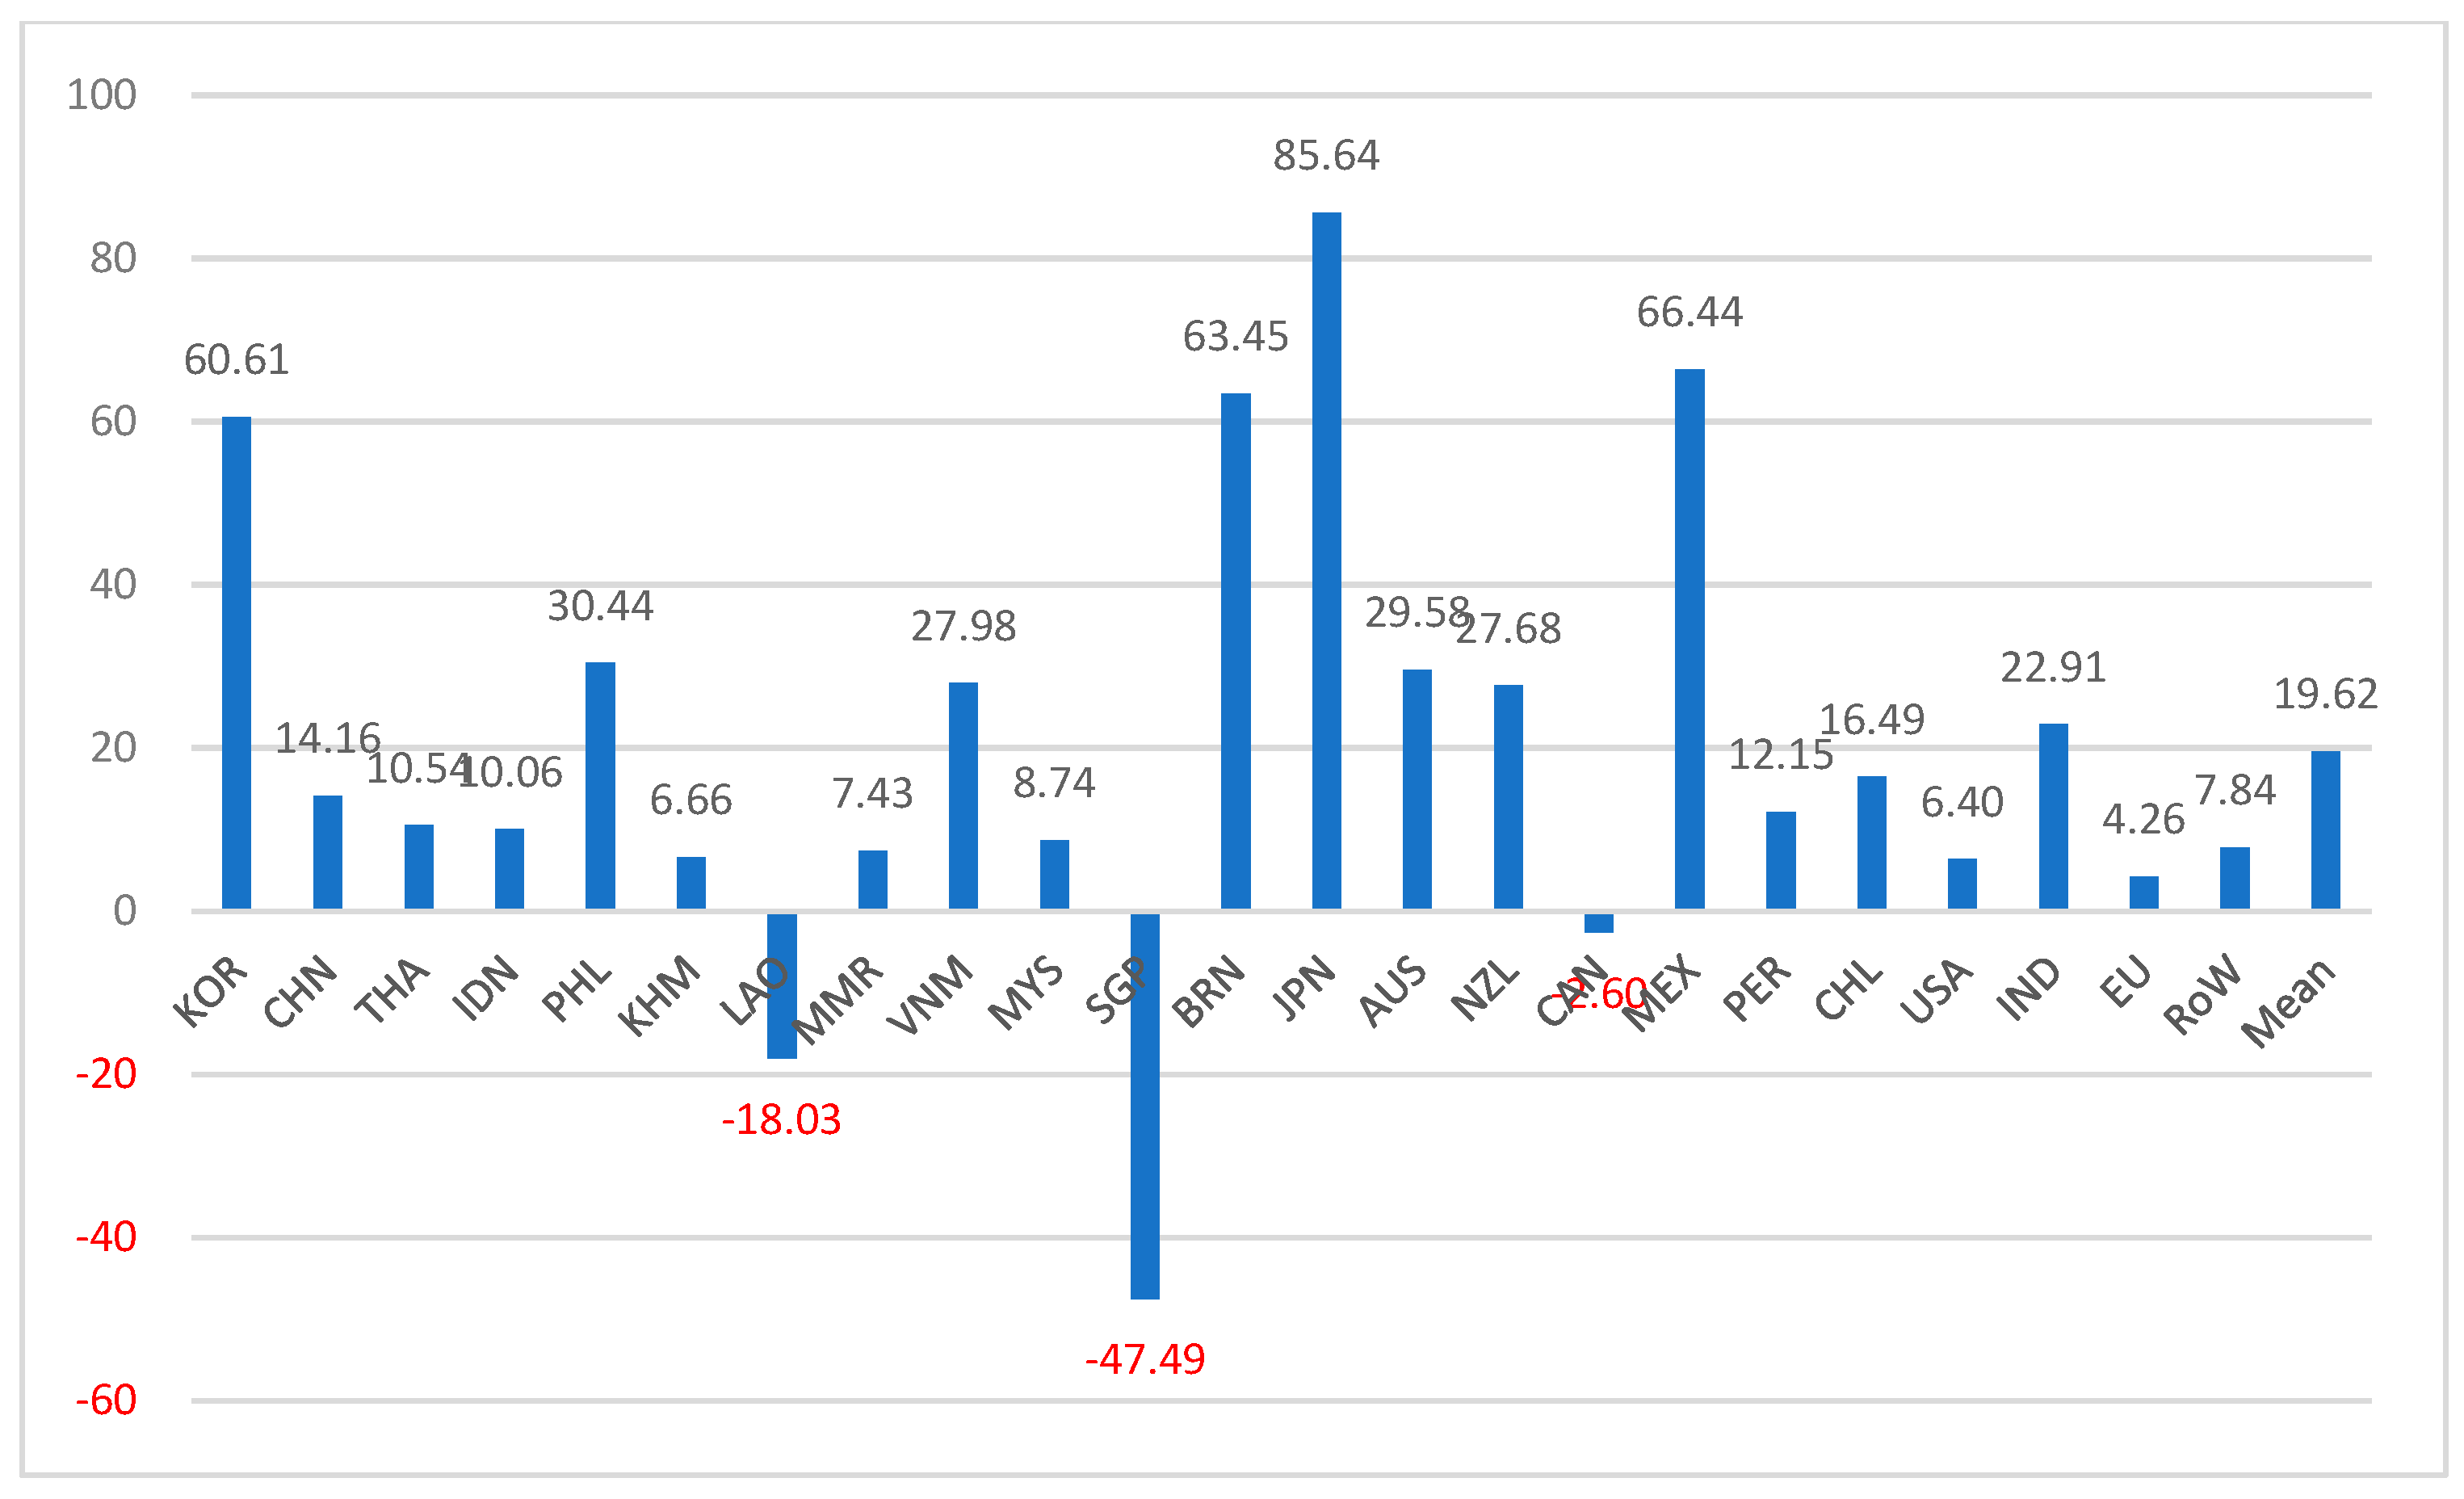
:This paper aims to quantify the effects of China’s participation in the Comprehensive and Progressive Agreement for Trans-Pacific Partnership (CPTPP), in particular by focusing on the possible productivity effects through the endogenous assignment of skills to technologies. In this paper, we develop a large-scale global computable general equilibrium (CGE) model in which firms are heterogeneous in technologies and workers are heterogeneous in individual skill levels so that equilibrium skill–technology assignments are endogenously determined. This study contributes to the literature with the new CGE modeling and application to the recent important issue in international trade. By calibrating the model to 23 countries and regions, we quantify the effects of China’s participation in the CPTPP. Due to the positive real productivity effects and the reallocation of workers, the results show that China’s participation in the CPTPP may generate significantly higher productivity, GDP, and welfare effects compared to previous conventional CGE models based on simplistic representative agent frameworks at a given productivity. Globally, on average, the real productivity of the manufacturing sector, the number of exporting firms, real GDP, and welfare increase by 0.52%, 19.62%, 1.36%, and USD 3.41 billion, respectively.
1. Introduction
As global competition intensifies, many countries have been pursuing regional free trade agreements for economic development and sustainable economic growth. In particular, as today’s globalization process is occurring at a much finer level of disaggregation and increasingly complexifying by including many different countries to form a global supply chain, the regional free trade agreements have also been increasing in size and complexifying in contents (see, e.g., [1,2,3]).
As a part of such a movement, the Comprehensive and Progressive Agreement for Trans-Pacific Partnership (CPTPP) was signed on 8 March 2018, effective 30 December 2018. The CPTPP is a mega-FTA formed among 11 countries in the Trans-Pacific region (Vietnam, Malaysia, Singapore, Brunei, Japan, Australia, New Zealand, Canada, Mexico, Peru, and Chile). As the US withdrew from the initial agreement, the size has been reduced, but the current 11-member states still account for about 13% of world GDP. In particular, with the CPTPP’s intention to expand, currently, several countries are seeking entry to the CPTPP and are in negotiations. Among others, China has also submitted a formal application to join the CPTPP. China has been eagerly pursuing FTAs as a national strategy to achieve economic development and to lead the international trade system by signing a total of 19 FTAs with 26 countries and regions by the end of 2021.
Table 1 shows the bilateral trade in the manufacturing sector between 23 countries and regions, where the 11 countries from (9) to (19) are current member states of the CPTPP (see Table 2 for country code descriptions). We can observe a close trade relationship between CPTPP member countries and China. China is the largest exporter of all member countries except only for Canada and Mexico, for which the US is the first exporter by the implementation of the United States–Mexico–Canada Agreement (USMCA). The portion of import from China accounts for about 26% of the total import of the CPTPP member countries. These countries are also important exporters for China, accounting for almost 30% of the total import of China. Overall, the current 11 CPTPP member countries account for about 15% of the world trade, and this portion increases to about 32% when China is included.
China is not only one of the two biggest economies in the region with the US, but also a core country in the global value chain perspective. After the withdrawal of the US from the Trans-Pacific Partnership (TPP), China is eager to strengthen its influence in the region by participating in the CPTPP. Though it is said that the negotiation would not be easy due to the high standards and high degree of openness of the CPTPP, it would be no doubt that China’s participation in the CPTPP would largely affect the international trading system as well as individual countries. In particular, given the complex and highly disaggregated global supply and value chains in the region, as well as the key role of China in the region’s manufacturing system, how China’s participation in this new Mega-FTA system will affect the global economy through induced productivity effects is of great interest and needs to be studied in depth.
Using CGE approaches, numerous works have tried to assess the economic effects of the Trans-Pacific Partnership agreement, and few recent works have also attempted to assess the possible effects of China’s participation in the CPTPP (see, e.g., [4,5]). Previous evaluations are, however, mostly based on conventional CGE models in which firms and workers are identical in their technology and skill level, which cannot capture important productivity effects coming from the interaction between technology and skill (see [6] and references therein). On the other hand, based on the heterogeneous agent framework, recent trade literature has been highlighting important productivity gains due to the selection effects of globalization: exporting firms are more productive and use higher technologies than domestic competitors (see, e.g., [7,8,9,10,11,12]). Closely related to this literature, recent research in international trade has also highlighted globalization-induced real productivity gains due to the worker-side selection effects (see, e.g., [13,14,15,16,17,18,19]). In such an environment, it should be of great interest to assess how China’s participation in the CPTPP would affect global productivity and quantify the induced effects.
Faced with rising global challenges such as international trade conflicts and disruptions in global supply chains, we require systematic impact evaluations which enable us to study various economic transformations through technological changes and the allocation of workers to different technologies. Many countries have adopted free-trade-oriented strategies and actively pursued FTA negotiations for economic development and growth, and at the core of such policies lie the induced and expected productivity effects. In particular, when assessing the effects of a huge economic integration such as CPTPP, such potential productivity effects, and the resulting various micro and macro performance should be the key question to be addressed and studied in depth.
The aim of this paper is to quantify the effects of China’s participation in the CPTPP using a CGE model incorporating heterogeneous firms and workers. This study extends the previous conventional CGE model by explicitly modeling heterogeneous firms and workers. Firms are heterogeneous in technologies with exporting firms using higher technologies. Furthermore, workers are heterogeneous in individual skill levels so the sorting of workers into different technologies occurs endogenously based on workers’ respective comparative advantages. Thus, in our framework, workers’ productivity reflects both individual skill level and assigned technology, and assignments of skills to different technologies are endogenously determined within the model.
Given this basic setup, we construct a large-scale 23-country/region 3-sector global CGE model and investigate the possible effects of China’s participation in the CPTPP in this framework. In particular, we investigate the effects on real productivity, exporting firms, real GDP, and welfare by comparing two cases: CPTPP11 vs. CPTPP11+China. The considered region is highly related to each other, particularly in the manufacturing system with China as a core country, and the international division of labor is occurring at a highly disaggregated level. Thus, China’s participation in the CPTPP will cause a big impact on the region’s international manufacturing system, and in particular, will induce various country-wide productivity effects through a large reallocation of labor across technologies and tasks. As will be shown later, differently from conventional CGE models based on simplistic representative agent frameworks at a given productivity, our model is capable of capturing such productivity effects through the endogenous assignment of skills to technologies. This study contributes to the literature with the new CGE modeling and application to the recent important issue in international trade of the CPTPP expansion and China’s participation. Given the economic size and the core position in the global manufacturing system, China’s participation in the CPTPP may affect the global economy in both magnitude and direction. Overall, it is shown that China’s participation in the CPTPP generates significantly higher productivity, GDP, and welfare effects, whereas some countries may be affected negatively.
The rest of the paper is organized as follows. In Section 2, we describe briefly the basic theoretical model and explain the endogenous skill–technology assignment mechanism. In Section 3, we describe the data and model calibration for the CGE application. In Section 4, we study the effects of the CPTPP and the expansion of the CPTPP with China’s participation on real productivity, exporting firms, real GDP, and welfare. Section 5 provides a brief discussion and concludes with some concluding remarks.
2. Model Description
Recent theoretical developments in international trade have highlighted various selection effects of trade stemming from heterogenous agents. In many aspects, firms are largely different even within narrowly defined industries. In particular, there is now ample evidence that firms are largely heterogenous in their productivity and used technologies. Many systematic links between firms’ productivity (technology) and their internationalization status have been uncovered. Among others, it is now widely documented that exporting firms are more productive and use higher technologies than non-exporting domestic firms; in other words, more productive firms self-select into export markets and experience technological upgrading. See for example Bernard and Jensen [20] for the US, Bernard and Wagner [21] for Germany, Clerides et al. [11] for Colombia/Mexico/Morocco, Aw et al. [10] for Taiwan/Korea, Sun and Hong [22] for China, and Girma et al. [12] for Ireland. Research on this firm-side heterogeneity and the associated effects are referred to as firm heterogeneity literature in international trade.
Closely related to this literature, recent theoretical advances in international trade also emphasize worker-side heterogeneity. Workers are heterogeneous in their skill (or ability) level and more productive workers self-select into higher technologies (or tasks). Thus, workers’ productivity reflects not only their own skill level but also the technology they are attached to. Such equilibrium skill–technology assignment would generate considerable implications for market structure and economic performance. We incorporate such endogenous assignment of skills to technologies into a large-scale global CGE model. In this section, we describe briefly the new modeling structure.
2.1. Technologies
Firms are free to enter the market and there are two types of firms: exporting and domestic firms. Choosing either type requires a strategy-specific technology : exporting firms employ high-technology , whereas domestic firms employ low-technology . Adopting either technology is associated with technology-specific fixed costs with . With free entry in monopolistic competition, markup revenues exactly cover the fixed costs in equilibrium. By expressing the fixed setup costs in terms of foregone outputs, we have:
where is the elasticity of substitution between varieties, and and are the unit production costs. We will drop the country and industry index when no confusion can arise.
2.2. Skills
Workers are heterogeneous in their individual skill level . Workers’ productivity reflects both individual skill level and assigned technology. Let us denote , , the technology-augmented labor productivity of a worker with skill level . The existence of increasing returns to scale between skill and technology implies that there would be a sectorial skill threshold : workers sort into two different firm types using two different technologies. Workers choose technologies (tasks) based on their comparative advantage, so that higher skilled workers are assigned to high technology whereas lower skilled workers are assigned to low technology. Workers are paid their marginal product and the equilibrium sectorial skill thresholds are endogenously determined in each country. Following no-arbitrage conditions should be satisfied:
where and denote technology-specific efficiency wage rates which will be determined in the labor market.
2.3. Assignment of Skills to Technologies
Conventional CGE models are based on a representative agent framework and international trade is mainly driven by demand-side forces. The conventional Armington framework assumes that firms are identical under perfect competition and goods are differentiated only by region of origin [23]. More recently, the Krugman framework with imperfect competition and increasing returns to scale assumes that goods are differentiated at the firm level, but firms are still identical in technology [24].
Our main departure from previous conventional frameworks is that firms are not homogeneous in their technology and workers are not identical in their skill level, and the assignment of skills to technologies is endogenously determined. Such a new feature may generate new important implications for economic integration, in particular in terms of aggregate productivity and the related effects. A leftward movement of the skill threshold in a sector implies that more workers are allocated to high technology in that sector, which leads to an improvement in average productivity in that sector. Conversely, a rightward movement of the skill threshold in a sector implies an expansion of low technology and a contraction of high technology in that sector. However, following any policy change in the real world where all countries and sectors are highly interdependent, it is a priori not possible to predict how such a change will affect each country and each sector: the variations of will be different country by country, as well as sector by sector, which may yield new important productivity implications that were not captured by conventional models.
2.4. Measurement of Real Productivity
Based on our model specification, real labor productivity can be measured as the technology-augmented efficiency units of labor at a given labor supply and at a given skill distribution:
As explained before, in our framework workers’ productivity reflects both individual skill level and assigned technology: with an equilibrium threshold , workers with are matched with low technology, whereas workers with are matched with high technology. Thus, Equation (4) represents the total technology-augmented efficiency units of labor in the sector, which varies with the equilibrium threshold in each country.
This study incorporates the above features into a large-scale CGE model and investigates the effects in the case of the CPTPP and its expansion with China. A full system of equations for a simple two-country case can be found in Jung [25].
3. Data and Calibration
For a large-scale CGE application, we need first to construct a global social accounting matrix (SAM), which represents all the flows of economic transactions between countries and sectors. It is necessary that we require a comprehensive and huge data set covering all such transactions. In this study, we construct the global SAM for the model using the GTAP 10 Database [26]. Due to its comprehensive coverage, the GTAP database has been used most widely for global multi-country/region CGE models. The most recent GTAP database (version 10) covers 141 countries/regions and 65 sectors and reports various macroeconomic variables including bilateral trade information between all the countries and regions.
Given our objective, countries/regions are aggregated as in Table 2. Currently, two mega-FTAs are ongoing: the CPTPP and the RCEP. The two large multilateral free trade agreements have competitively been pursued in the region, and numerous countries participate in both the CPTPP and the RCEP. Given the possibly close interactions, this study considers all the countries participating in any of the two mega-FTAs. In Table 2, 15 countries (#1–15) are current member countries of the RCEP, whereas 11 countries (#9–19) are current member countries of the CPTPP. A total of 7 countries (Vietnam, Malaysia, Singapore, Brunei, Japan, Australia, and New Zealand) are participating in both the CPTPP and the RCEP. In the current GTAP Database (version 10), the data for Myanmar includes East Timor too. With the very small economic size of East Timor, however, its inclusion would not affect the main results of this study.
Industries have been aggregated into three main sectors: primary, manufacturing, and service. Following conventional practice, perfect competition has been assumed in primary and service sectors, whereas our endogenous skill–technology assignment framework has been applied to the manufacturing sector.
We specify the technology schedules by assuming linear technologies:
and based on empirical evidence (see, e.g., [20]), we set and = 1.18. There is a continuum of skill levels, which is uniformly distributed on a normalized support [0, 1].
All the necessary elasticity information has been taken from the GTAP 10 Database. We calibrate the fixed setup costs , so that initially the shipments of exporting firms are 58% larger than non-exporting domestic firms. We exactly reproduce the initial SAM by calibrating all the other parameters and fixed variables to the data.
4. Results
Given our model construction and calibration, in this section, we investigate the effects of China’s participation in the CPTPP. For comparison purposes, the effects of CPTPP 11 formation are also reported using our endogenous skill–technology assignment framework.
4.1. Effects on Real Productivity
As described before, the main difference between our framework from conventional CGE models is that in our model the skill/technology thresholds () are endogenous. Following trade policy changes, how the thresholds are affected in each country and how such variations affect the overall productivity of each country are of great interest.
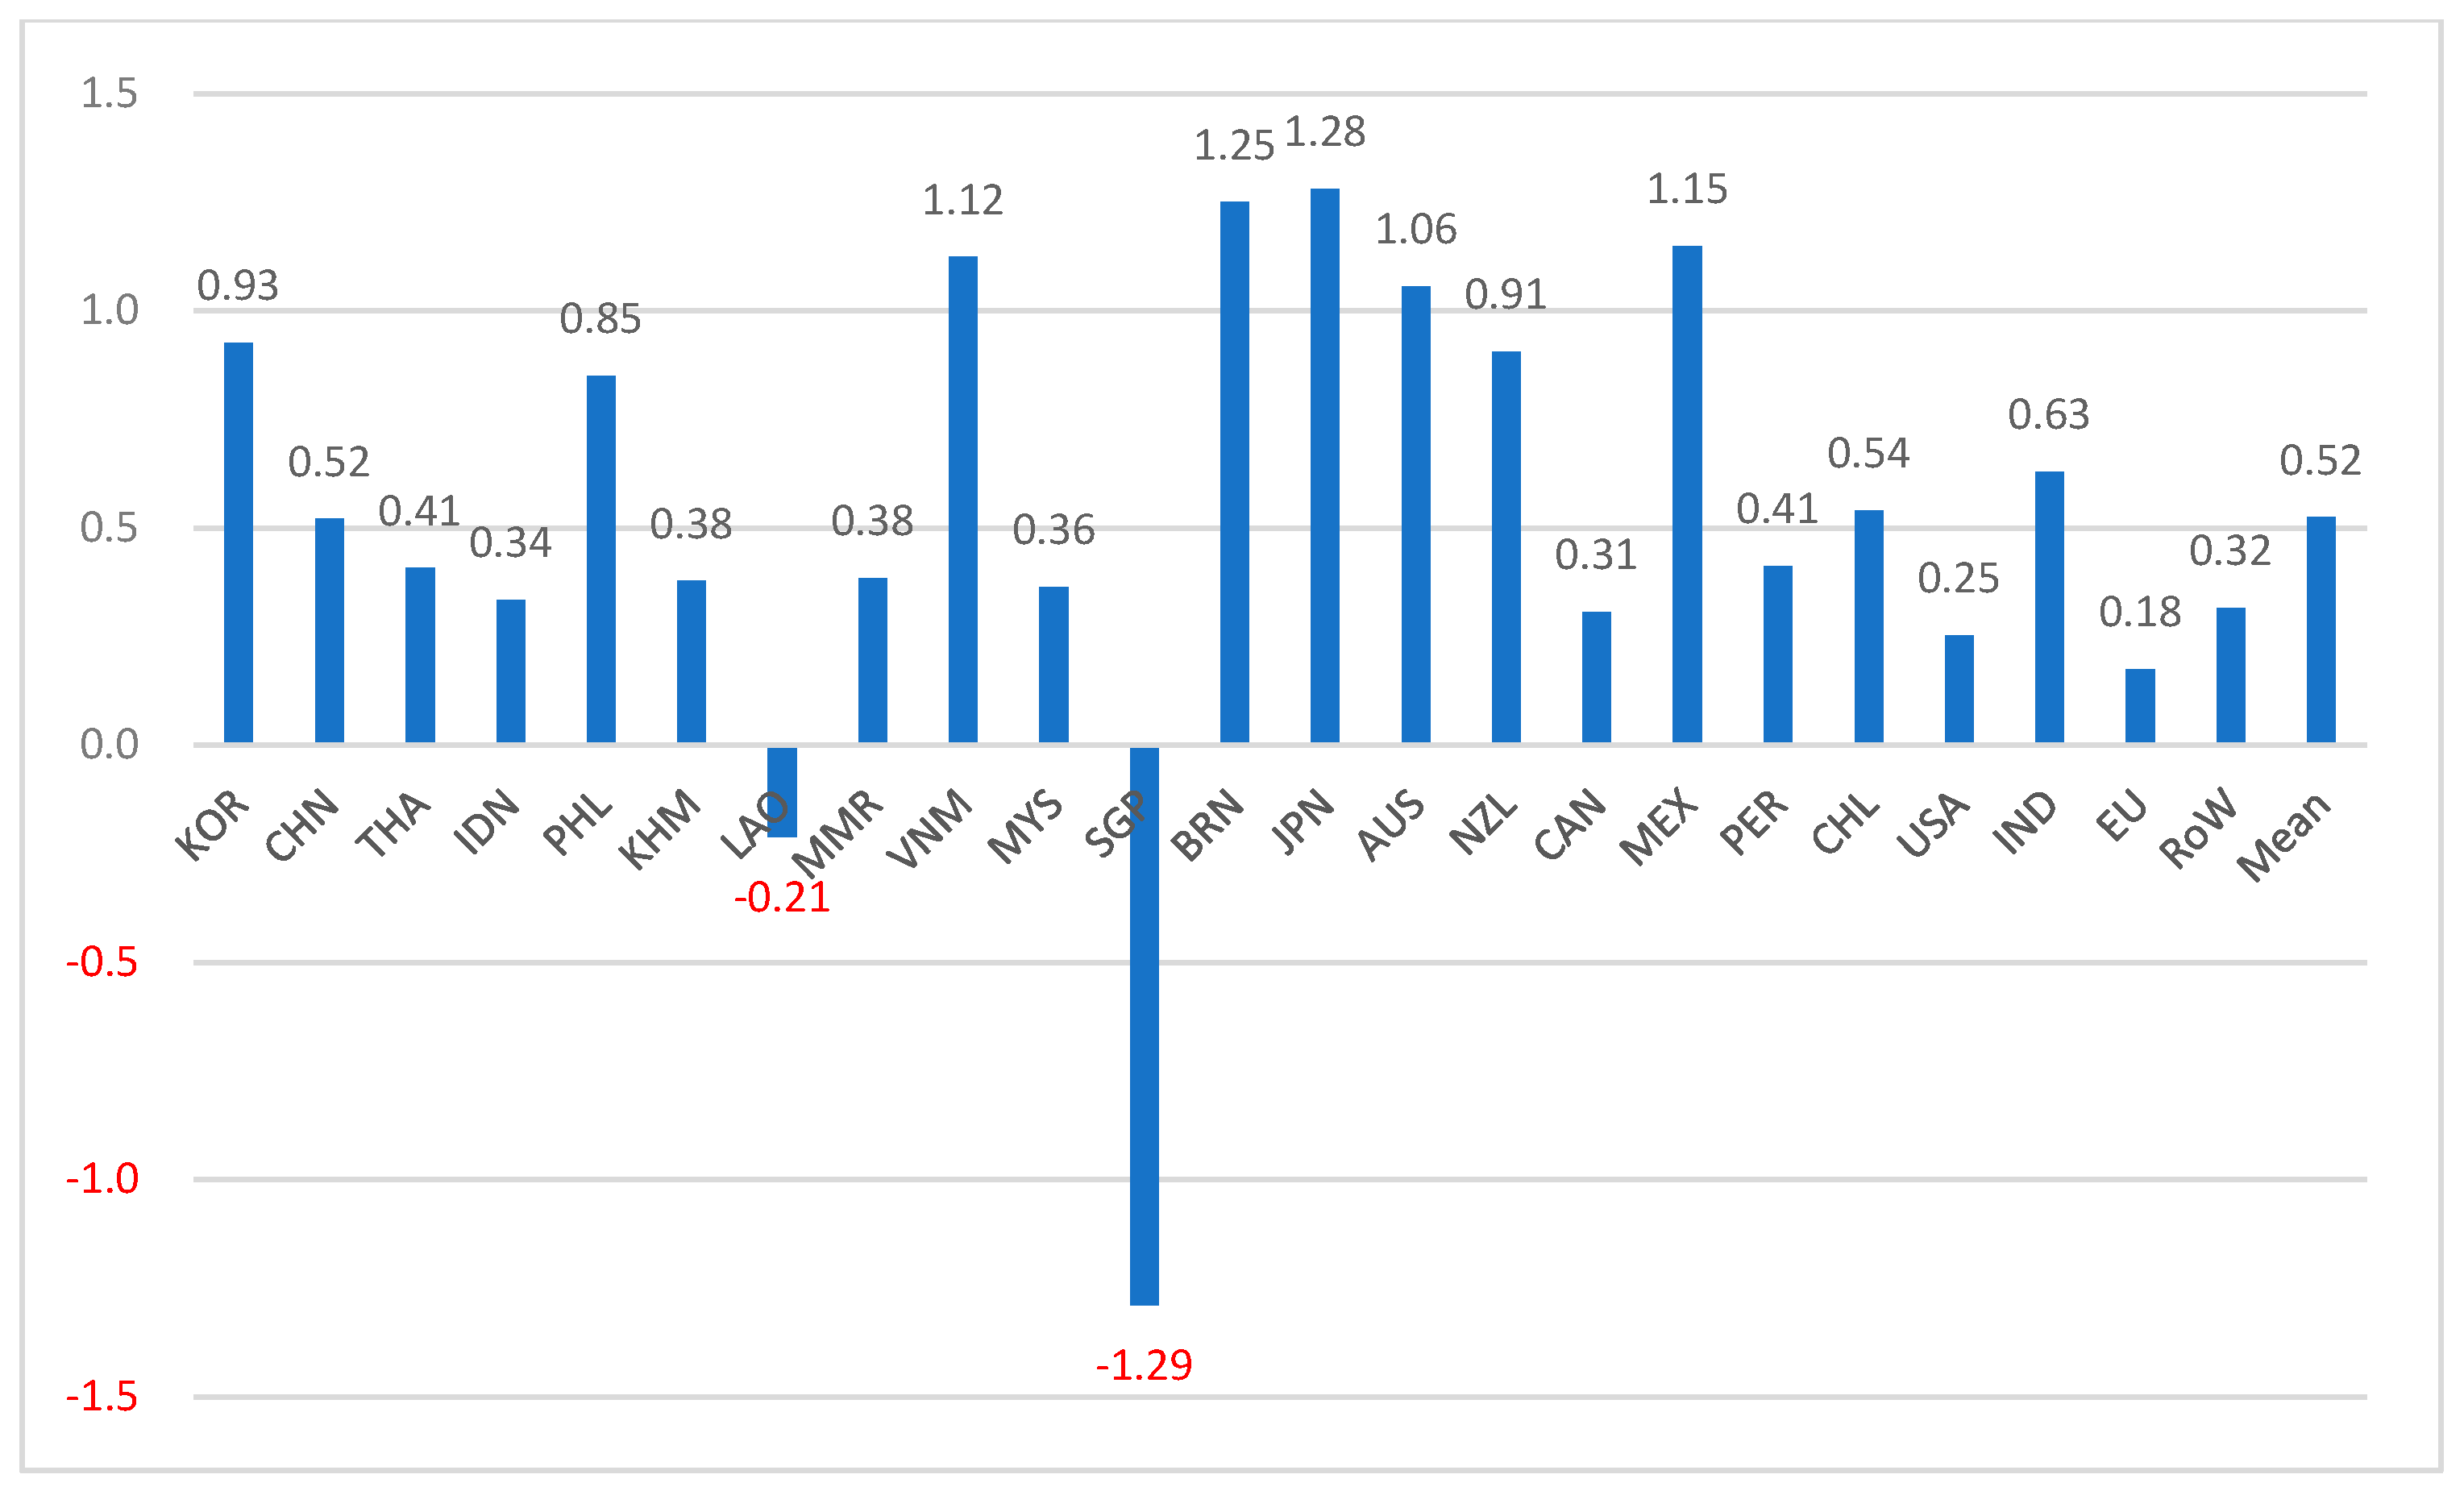
We measure the real productivity using Equation (4). Figure 1 shows first the effects of the CPTPP 11 formation on real productivity, whereas Figure 2 shows the effects when China joins the CPTPP. We can observe first the overall positive impact of China’s participation on global productivity. It is shown that the CPTPP 11 formation increases the global average productivity by 0.14%, whereas it increases by 0.52% when China joins the CPTPP too. Some countries may be affected negatively. In Figure 1, numerous countries/regions are affected negatively. Among them, it is shown that Vietnam and Canada are affected the most negatively, by −0.70% and −0.93%, respectively.
On the other hand, as can be seen in Figure 2, China’s participation in the CPTPP generates in general positive real productivity gains except only for Laos and Singapore. In particular, Singapore’s real productivity measure is shown to decrease by 1.29%. However, it should be noted that the real productivity effects in the manufacturing sector would not necessarily coincide with other macroeconomic effects. Even though the manufacturing sector may be contracted, the country’s GDP may increase if other sectors will be affected more positively. As will be shown soon, it is indeed the case for Laos and Singapore.
4.2. Effects on Exporting Firms
As explained before, one of the main departures of our model from the conventional CGE model in the framework of Armington or Krugman is the incorporation of heterogeneous firms using different technologies. Exporting and domestic firms compete in the national and global markets and the number of each firm type is determined endogenously. A leftward shift of the threshold implies, other things being equal, an expansion of exporting firms using high technology and a contraction of domestic firms using low technology. Thus, in general, changes of the skill/technology thresholds tend to induce similar effects on the number of firm types.
Figure 3 shows the effects of the CPTPP 11 formation on the exporting firms, whereas Figure 4 shows the effects when China joins the CPTPP. Overall, Figure 3 and Figure 4 show similar patterns as shown in Figure 1 and Figure 2. As before, it is shown that Singapore is affected the most negatively in terms of the number of manufacturing exporting firms. However, looking at the other variables more in detail, it is shown that Singapore’s service sector expands considerably so that Singapore transforms into a more service-oriented economy. Though quite similar patterns might be observed, it should, however, be noted that the effects on the total number of each firm type would not necessarily coincide with the changes in . The equilibrium market structure with different firm types will be simultaneously determined by all the intra-industry, inter-industry, and inter-country/region competitions. Such heterogeneous firm and worker links through endogenous technology-skill assignments cannot be captured by conventional CGE models assuming homogeneous firms and workers.
4.3. Effects on Real GDP
We now investigate the effects on real GDP of each country and region. Figure 5 shows the effects of the CPTPP 11 formation on the real GDP, whereas Figure 6 shows the effects when China joins the CPTPP. We can observe as before the overall positive impact of China’s participation on global GDP. It is shown that the CPTPP 11 formation increases the average global GDP by 0.44%, whereas it increases by 1.36% when China joins the CPTPP too. Figure 6 shows that China’s participation in the CPTPP increases significantly GDP of all the countries and regions except for Brunei that faces a slight fall of −0.27%.
In particular, in Figure 6, we can see that the GDP of Laos and Singapore increases significantly, though they were the two countries whose manufacturing sector was shown to have some negative impacts with China’s participation. As mentioned before, the impacts on the manufacturing sector do not necessarily coincide with the general effects on GDP. Laos and Singapore have comparative advantage in the agricultural and service sectors, respectively. In the base data, Laos’ share of primary sector production is 47.3% and Singapore’s share of service sector production reaches 68.1%. China’s participation in the CPTPP strengthens further their comparative advantage so that they realize the most positive GDP effects. Figure 6 shows that Singapore’s GDP increases the most with an increase of 6.10%, and Laos’ GDP increases by 2.48% after Vietnam, whose GDP increases by 5.32%.
4.4. Effects on Welfare
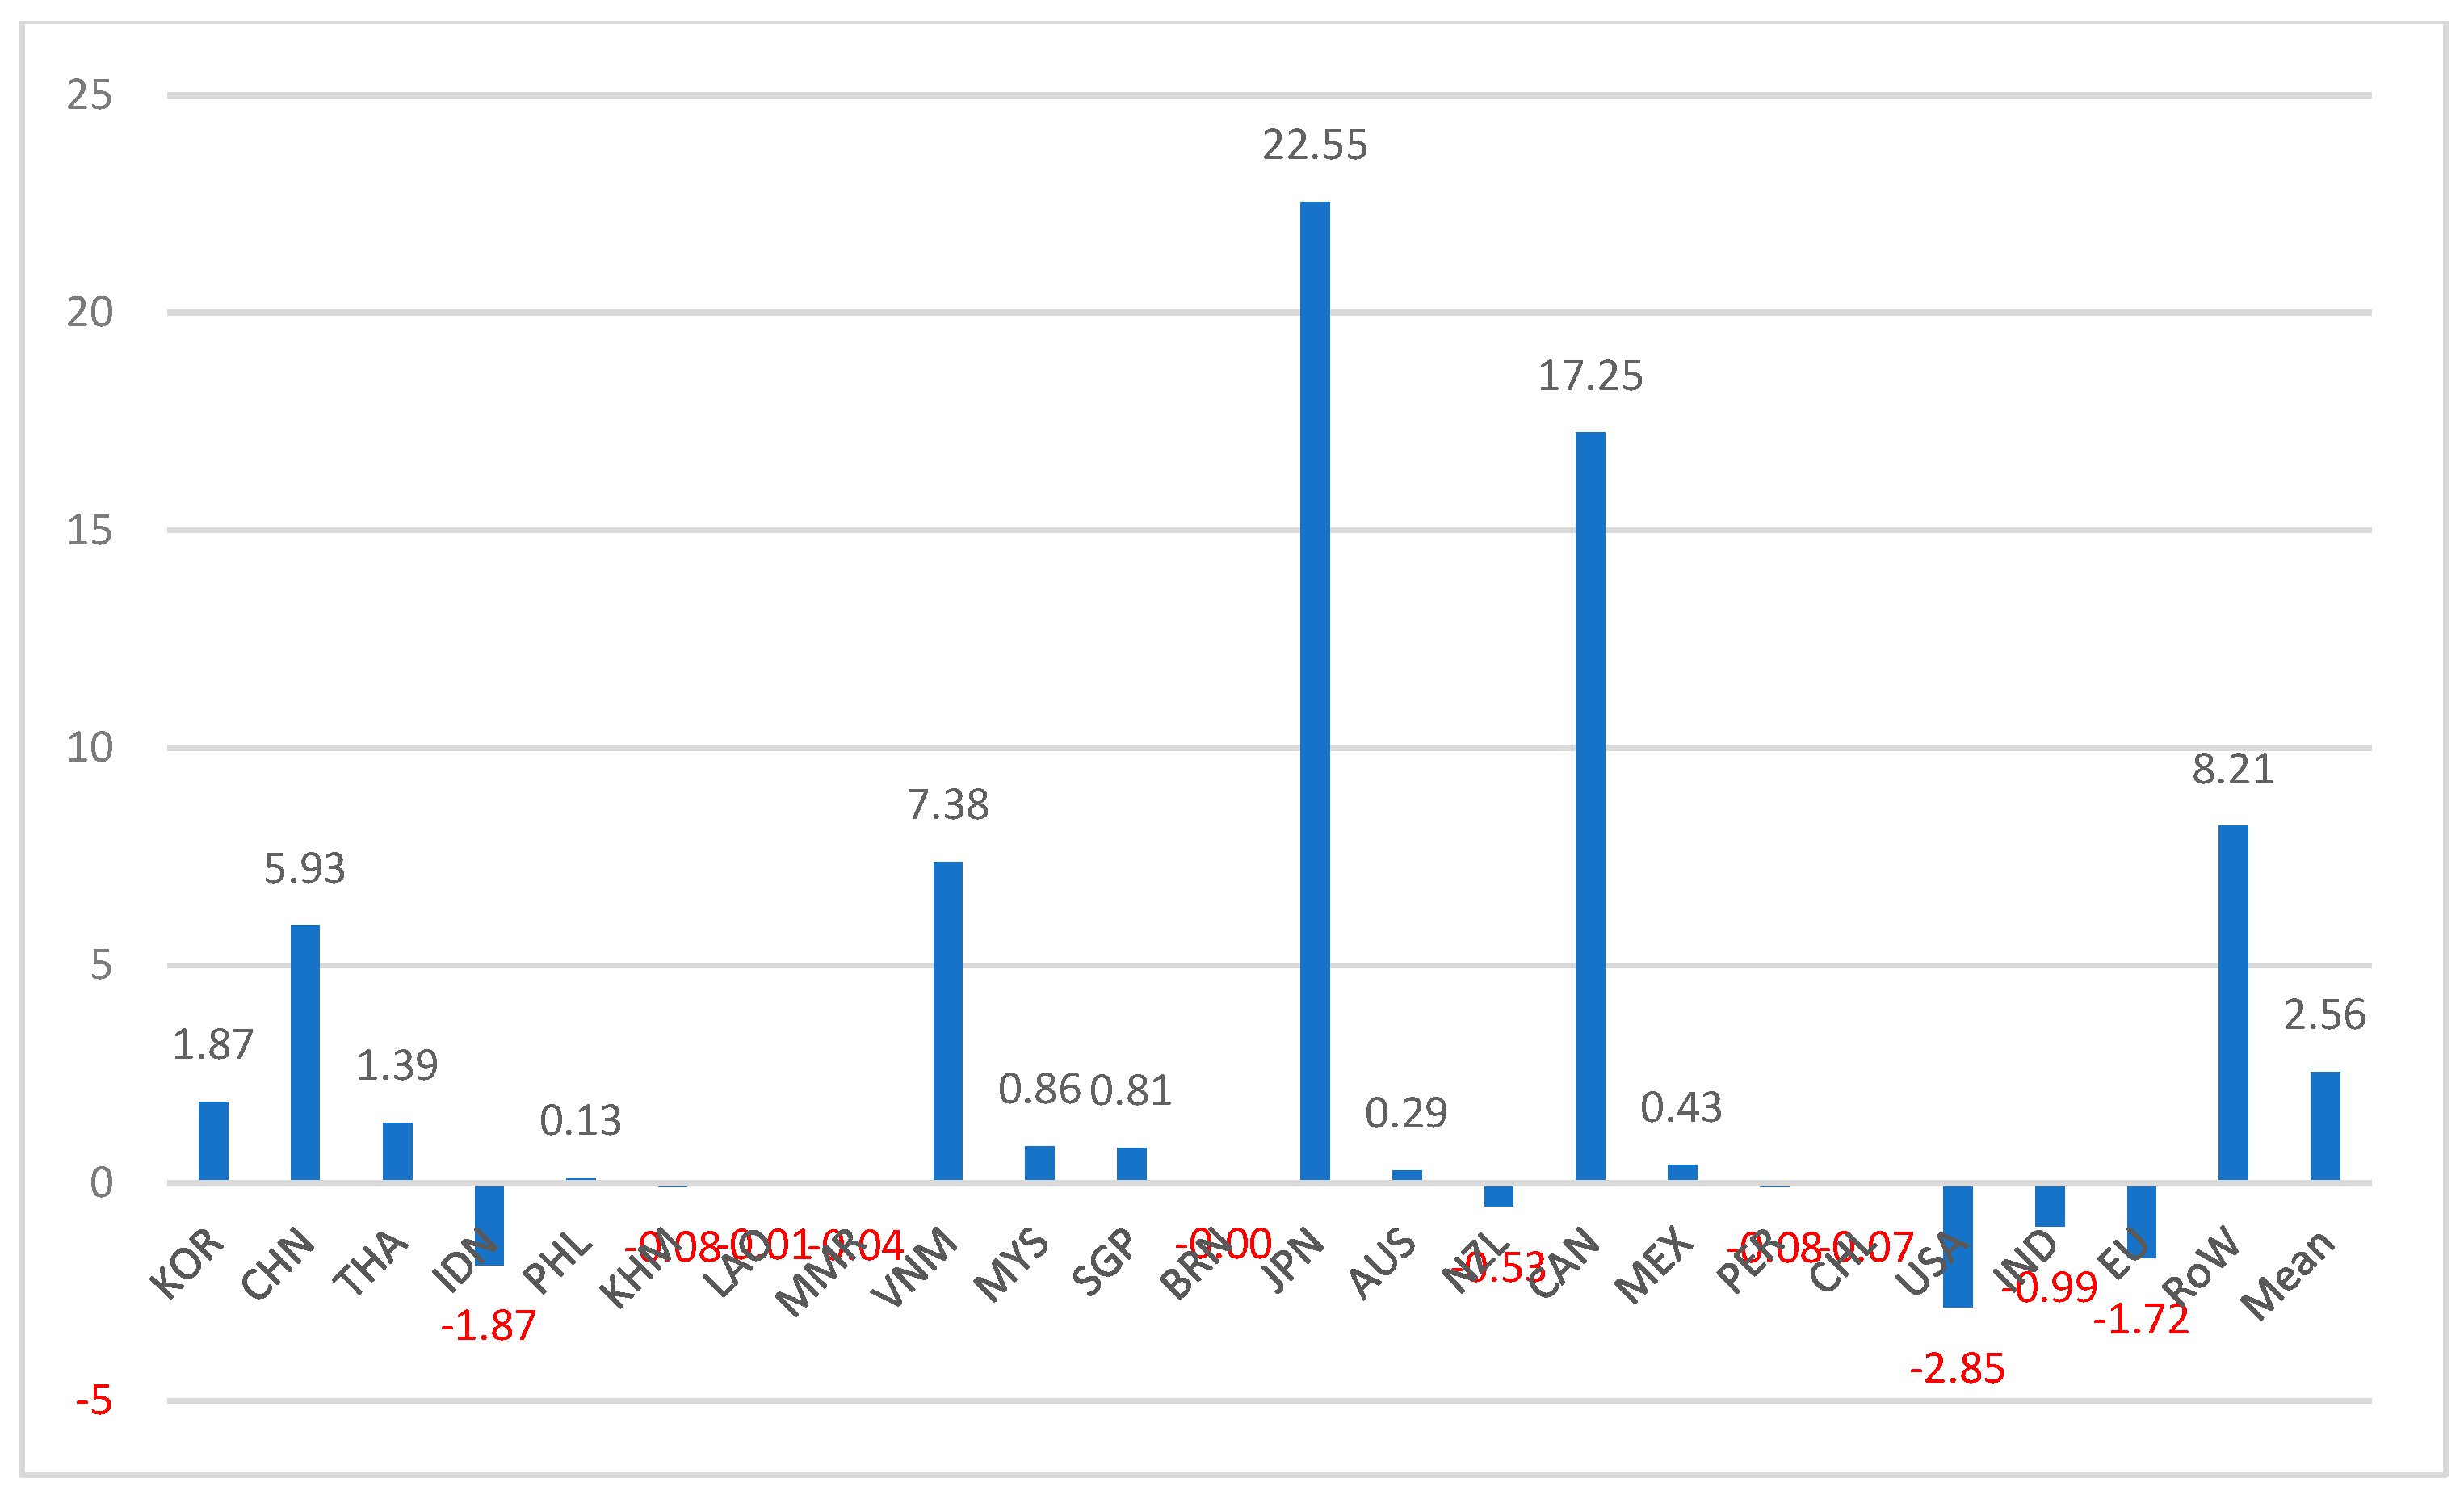
Finally, Figure 7 and Figure 8 report the calculated Equivalent Variation (EV) welfare measures. Figure 7 shows the welfare effects of the CPTPP 11 formation, whereas Figure 8 shows the welfare effects when China joins the CPTPP too. Again, it is shown in general that China’s participation in the CPTPP yields more positive welfare effects. It is shown that the CPTPP 11 formation increases the average consumer welfare by USD 2.56 billion, whereas it increases by USD 3.41 billion when China joins the CPTPP too. Overall, based on the endogenous skill–technology assignment and the induced technology-upgrading mechanisms, our model predicts significantly higher positive effects compared to previous conventional CGE models assuming homogeneous firms and workers without considering the close interactions between skills and technologies.
5. Discussion and Conclusions
As the US withdrew from the initial Trans-Pacific Partnership (TPP) agreement, the current agreement of the Comprehensive and Progressive Agreement for Trans-Pacific Partnership (CPTPP) was signed in 2018 by the remaining 11 countries, which is also known as TPP11 for that reason. On the other hand, the TPP agreement and its negotiations had begun as an expansion of the previous Trans-Pacific Strategic Economic Partnership Agreement (TPSEP) among Brunei, Chile, New Zealand, and Singapore, which had been signed in 2005. Since the current CPTPP agreement has a long history of evolution in an ever-changing environment, though there have been many works studying possible economic effects of this movement, no studies are directly comparable to ours. Not surprisingly, most previous studies in the literature considers the TPP12 including the US. However, as the US officially withdrew from the TPP in 2017, the policy implications obtained from previous studies are already obsolete. Furthermore, it is only very recently that China submitted a formal application to join the CPTPP (on 16 September 2021) to replace the role of the US in the region and to lead the global trade system.
Nevertheless, two recent works were found which consider such an up-to-date environment. Using a CGE model added a monetary structure, Li and Whalley [5] analyze the effects of China’s participation in the CPTPP. They consider both border tariff elimination and trade cost elimination. In the case of border tariff elimination, New Zealand, Peru, and Brunei are affected negatively, with decreases of GDP by 0.45%, 0.42%, and 7.80%, respectively, whereas in terms of utility, Australia, New Zealand, Singapore, and Peru are affected negatively, with decreases by 0.14%, 0.17%, 0.13%, and 0.04%, respectively. On the other hand, in the case of non-tariff trade cost elimination by assuming a decrease of 40%, they report that all member countries gain in GDP except for Brunei, whereas in terms of utility all member countries gain. They conclude that China’s participation in the CPTPP will significantly increase other member countries’ benefits as well as for China. Another recent research by Petri and Plummer [4] leads to a similar conclusion. Using a CGE model based on their previous work [27], they report the likely real income effects by 2030 when China participates in the CPTPP. They conclude that China’s participation in the CPTPP would yield large economic and political benefits for all other member countries as well as for China. In particular, they estimate that global income gains would quadruple from USD 147 billion to USD 632 billion when current CPTPP and Chinese membership in the CPTPP are compared. Though the above two models lead overall to similar global effects, detailed predictions are different quantitatively and even qualitatively in some cases. In terms of the model structure, one obvious difference may lie in the production-side modeling. Whereas Li and Whalley [5] use a representative producer framework, Petri and Plummer [4] adopt firm heterogeneity à la Melitz [7] for some sectors. On the other hand, both models do not consider the worker-side heterogeneity and the assignment of different skills to different technologies. Consequently, previous results do not reflect important productivity effects coming from the technology upgrading mechanism of individual workers and firms.
In this paper, we developed a large-scale 23-country/region 3-sector global CGE model in which firms employ different technologies, and heterogeneous workers in individual skill levels endogenously sort into different technologies (tasks/occupations) based on their individual comparative advantage. Differently from conventional CGE models based on simplifying representative agent frameworks, the endogenous skill–technology assignment framework of this paper has provided important implications for global productivity and the induced effects in the case of the CPTPP’s expansion.
Overall, it was shown that China’s participation in the CPTPP would generate significantly higher productivity, GDP, and welfare effects. In particular, due to the positive real productivity effects and the reallocation of workers, it was shown that China’s participation in the CPTPP would significantly increase the GDP of all the countries and regions considered except for Brunei which might face a slight fall of −0.27%. It is remarkable that even non-member countries and regions may also be positively affected in terms of real productivity and GDP.
In general, our results show significantly higher positive effects compared to previous studies. Such results should be attributed to our new modeling which is firmly rooted in recent theoretical advances in international trade. Firms are heterogeneous in their technologies and workers are heterogeneous in their skill levels. The technology–skill matching is not exogenously determined, but it is a choice variable. Workers choose their occupations and/or technologies based on their comparative advantage, and at the same time, the skill demands of heterogeneous firms are also endogenously determined. Broadly said, globalization induces more efficient firms to expand, whereas inefficient firms are forced to exit from the market, which implies in turn more workers are attached to higher technologies. Such a technology-upgrading mechanism and the resulting productivity and growth effects should be at the center of concern for any policy consideration. The results of this study reveal that such a mechanism may generate important productivity gains which could not be captured by previous models.
Though this study has provided new implications on the productivity effects of economic integration in the case of the CPTPP expansion with China’s participation, several limitations are noteworthy. In terms of the model parameters, the technology gaps between domestic and exporting firms should be crucial for the quantitative results as well as for qualitative implications in some cases. Currently, no unified estimates are available for each sector and each country. More elaborated and disaggregated estimates for the technological parameters would be required for further extension and disaggregation of the model for various policy scenarios. Similarly, in terms of the modeling, further elaboration of the worker-side heterogeneity by incorporating explicitly various skill distributions which are supported empirically would be another promising and valuable research direction. Additionally, in terms of the policy implications, this study focused on tariff elimination, which is obvious and visible during the integration process. However, the reduction in various non-tariff barriers is another important aspect of the free trade agreement. Considering those effects, though by estimations, might reinforce even further the previously highlighted productivity effects. Furthermore, the expansion of the CPTPP seems very likely to continue. Currently, the UK, Taiwan, Ecuador, and Costa Rica have also formalized their request to join the CPTPP. On the other side, to lead the international trade system against China, the US is seeking to form a new economic framework that goes beyond the CPTPP. All such movements will also largely affect the global economy through the skill–technology reassignments. I leave them for future research.
Funding
Part of this work was supported by the Ministry of Education of the Republic of Korea and the National Research Foundation of Korea.
Institutional Review Board Statement
Not applicable.
Informed Consent Statement
Not applicable.
Data Availability Statement
Not applicable.
Conflicts of Interest
The author declares no conflict of interest.
References
- Baldwin, R. Globalization: The great unbundling(s). In Paper for the Finnish Prime Minister’s Office; Economic Council of Finland as part of EU Presidency: Helsinki, Finland, 2006. [Google Scholar]
- Grossman, G.M.; Rossi-Hansberg, E. Trading Tasks: A Simple Theory of Offshoring. Am. Econ. Rev. 2008, 98, 1978–1997. [Google Scholar] [CrossRef] [Green Version]
- Harms, P.; Jung, J.; Lorz, O. Offshoring and Sequential Production Chains: A General Equilibrium Analysis. Can. J. Econ. 2021, 54, 623–647. [Google Scholar] [CrossRef]
- Petri, P.A.; Plummer, M.G. Should China Join the New Trans-Pacific Partnership? China World Econ. 2020, 28, 18–36. [Google Scholar] [CrossRef]
- Li, C.; Whalley, J. Effects of the Comprehensive and Progressive Agreement for Trans-Pacific Partnership. World Econ. 2021, 44, 1312–1337. [Google Scholar] [CrossRef]
- Gilbert, J.; Furusawa, T.; Scollay, R. The economic impact of the Trans-Pacific Partnership: What have we learned from CGE simulation? World Econ. 2018, 41, 831–865. [Google Scholar] [CrossRef] [Green Version]
- Melitz, M.J. The impact of trade on intra-industry reallocations and aggregate industry productivity. Econometrica 2003, 71, 1695–1725. [Google Scholar] [CrossRef] [Green Version]
- Roberts, M.J.; Tybout, J.R. Producer turnover and productivity growth in developing countries. World Bank Res. Obser. 1997, 12, 1–18. [Google Scholar] [CrossRef] [Green Version]
- Bernard, A.B.; Jensen, J.B. Exporting and productivity in the USA. Oxford Rev. Econ. Pol. 2004, 20, 343–357. [Google Scholar] [CrossRef]
- Aw, B.; Chung, S.; Roberts, M. Productivity and turnover in the export market: Micro-level evidence from the republic of Korea and Taiwan (China). World Bank Econ. Rev. 2000, 14, 65–90. [Google Scholar] [CrossRef] [Green Version]
- Clerides, S.; Lach, S.; Tybout, J. Is learning by exporting important? Micro-dynamic evidence from Colombia, Mexico, and Morocco. Q. J. Econ. 1998, 113, 903–947. [Google Scholar] [CrossRef]
- Girma, S.; Gorg, H.; Strobl, E. Exports, international investment, and plant performance: Evidence form a non-parametric test. Econ. Lett. 2004, 83, 317–324. [Google Scholar] [CrossRef] [Green Version]
- Grossman, G.M. The Distribution of talent and the pattern and consequences of international trade. J. Polit. Econ. 2004, 112, 209–239. [Google Scholar] [CrossRef] [Green Version]
- Rossi-Hansberg, E.; Garicano, L.; Antras, P. Offshoring in a Knowledge Economy. Q. J. Econ. 2006, 121, 31–77. [Google Scholar] [CrossRef] [Green Version]
- Costinot, A.; Vogel, J. Matching and inequality in the world economy. J. Polit. Econ. 2010, 118, 747–786. [Google Scholar] [CrossRef]
- Helpman, E.; Itskhoki, O.; Redding, S. Inequality and unemployment in a global economy. Econometrica 2010, 78, 1239–1283. [Google Scholar] [CrossRef] [Green Version]
- Blanchard, E.; Willmann, G. Trade, education, and the shrinking middle class. J. Int. Econ. 2016, 99, 263–278. [Google Scholar] [CrossRef] [Green Version]
- Jung, J. Technology, skill, and growth in a global economy. Econ. Theory 2019, 68, 609–641. [Google Scholar] [CrossRef] [Green Version]
- Jung, J. International Trade and Human Capital Investment with Heterogeneous Firms and Workers: Modeling and Analysis. Mathematics 2021, 9, 1106. [Google Scholar] [CrossRef]
- Bernard, A.; Jensen, B. Exceptional exporter performance: Cause, effect, or both? J. Int. Econ. 1999, 47, 1–25. [Google Scholar] [CrossRef] [Green Version]
- Bernard, A.; Wagner, J. Exports and success in German manufacturing. Weltwirtsch. Arch. 1997, 133, 134–157. [Google Scholar] [CrossRef]
- Sun, X.; Hong, J. Exports, Ownership and Firm Productivity: Evidence from China. World Econ. 2011, 34, 1199–1215. [Google Scholar] [CrossRef]
- Armington, P.S. A theory of demand for products distinguished by place of production. IMF Staff Pap. 1969, 16, 159–178. [Google Scholar] [CrossRef]
- Krugman, P. Scale Economies, Product Differentiation, and the Pattern of Trade. Am. Econ. Rev. 1980, 70, 950–959. Available online: https://www.jstor.org/stable/1805774 (accessed on 23 November 2022).
- Jung, J. Introducing Roy-like worker assignment into computable general equilibrium models. Appl. Econ. Lett. 2020, 27, 503–510. [Google Scholar] [CrossRef]
- Aguiar, A.; Chepeliev, M.; Corong, E.; McDougall, R.; van der Mensbrugghe, D. The GTAP data base: Version 10. J. Glob. Econ. Anal. 2019, 4, 1–27. [Google Scholar] [CrossRef]
- Petri, P.A.; Plummer, M.G.; Zhai, F. The Trans-Pacific Partnership and Asia-Pacific Integration: A Quantitative Assessment; Policy Analyses in International Economics No. 98; Peterson Institute for International Economics: Washington, DC, USA, 2012. [Google Scholar]
Figure 1.
Effects on real productivity (% changes): CPTPP 11.

Figure 2.
Effects on real productivity (% changes): CPTPP 11 + CHN.

Figure 3.
Effects on exporting firms (% changes): CPTPP 11.

Figure 4.
Effects on exporting firms (% changes): CPTPP 11 + CHN.

Figure 5.
Effects on real GDP (% changes): CPTPP 11.

Figure 6.
Effects on real GDP (% changes): CPTPP 11 + CHN.

Figure 7.
Effects on welfare (EV, billions USD): CPTPP 11.

Figure 8.
Effects on welfare (EV, billions USD): CPTPP 11 + CHN.


Table 1.
Bilateral trade (manufacturing, millions USD; exports from row to column).
| (1) | (2) | (3) | (4) | (5) | (6) | (7) | (8) | (9) | (10) | (11) | (12) | (13) | (14) | (15) | (16) | (17) | (18) | (19) | (20) | (21) | (22) | (23) | |
|---|---|---|---|---|---|---|---|---|---|---|---|---|---|---|---|---|---|---|---|---|---|---|---|
| (1) | 0 | 191,611 | 8864 | 12,835 | 9355 | 592 | 149 | 783 | 24,102 | 7582 | 9300 | 306 | 30,785 | 9842 | 2008 | 7118 | 14,099 | 1401 | 2267 | 63,290 | 13,387 | 49,370 | 107,630 |
| (2) | 106,213 | 55,377 | 41,558 | 37,495 | 23,164 | 3935 | 1900 | 9166 | 65,518 | 50,393 | 26,935 | 1597 | 183,634 | 50,153 | 6853 | 61,458 | 79,626 | 8869 | 15,495 | 443,567 | 67,483 | 418,050 | 558,635 |
| (3) | 4714 | 34,941 | 0 | 9482 | 5759 | 4493 | 3291 | 4902 | 7945 | 12,663 | 4500 | 89 | 20,136 | 9972 | 1429 | 2664 | 3523 | 548 | 691 | 23,666 | 6050 | 22,506 | 33,026 |
| (4) | 4395 | 13,221 | 4608 | 0 | 2898 | 386 | 2 | 550 | 2241 | 5841 | 6445 | 90 | 12,257 | 3611 | 517 | 1347 | 1104 | 243 | 210 | 17,598 | 6416 | 16,036 | 23,710 |
| (5) | 1972 | 15,479 | 2617 | 735 | 0 | 4 | 0 | 15 | 661 | 1201 | 2680 | 3 | 8845 | 939 | 52 | 1110 | 629 | 23 | 50 | 8958 | 451 | 7273 | 4714 |
| (6) | 176 | 308 | 474 | 15 | 21 | 0 | 0 | 0 | 304 | 121 | 68 | 0 | 735 | 108 | 5 | 853 | 101 | 9 | 20 | 3187 | 11 | 4319 | 556 |
| (7) | 14 | 447 | 754 | 41 | 0 | 5 | 0 | 0 | 497 | 0 | 6 | 0 | 66 | 1 | 3 | 13 | 0 | 0 | 0 | 26 | 2 | 246 | 38 |
| (8) | 541 | 12,126 | 107 | 52 | 4 | 1 | 0 | 0 | 17 | 82 | 29 | 0 | 780 | 20 | 0 | 9 | 8 | 0 | 1 | 130 | 41 | 456 | 176 |
| (9) | 7135 | 18,802 | 3633 | 2614 | 1652 | 2293 | 382 | 331 | 0 | 2953 | 1406 | 3 | 13,152 | 2192 | 362 | 2754 | 1439 | 208 | 453 | 27,862 | 2851 | 26,211 | 19,897 |
| (10) | 5436 | 53,570 | 11,117 | 7017 | 3414 | 231 | 20 | 613 | 4166 | 0 | 15,903 | 616 | 12,733 | 5094 | 914 | 2321 | 2837 | 124 | 253 | 24,805 | 7644 | 23,214 | 26,505 |
| (11) | 8429 | 36,576 | 7885 | 21,391 | 3477 | 499 | 61 | 1458 | 6469 | 20,693 | 0 | 1063 | 8904 | 8143 | 1135 | 867 | 498 | 21 | 25 | 12,434 | 5869 | 12,805 | 23,198 |
| (12) | 40 | 46 | 27 | 19 | 6 | 0 | 0 | 0 | 9 | 15 | 43 | 0 | 21 | 6 | 0 | 5 | 0 | 0 | 0 | 24 | 6 | 121 | 39 |
| (13) | 53,557 | 221,813 | 36,745 | 16,434 | 9186 | 226 | 132 | 1195 | 13,388 | 16,163 | 11,569 | 122 | 0 | 16,825 | 2905 | 13,247 | 18,816 | 1049 | 2215 | 124,103 | 9249 | 79,260 | 125,385 |
| (14) | 2893 | 12,283 | 2626 | 2359 | 472 | 16 | 22 | 27 | 1122 | 4190 | 1430 | 14 | 5185 | 0 | 4632 | 940 | 212 | 117 | 158 | 6227 | 2602 | 5609 | 16,706 |
| (15) | 895 | 5995 | 591 | 643 | 586 | 1 | 0 | 18 | 416 | 728 | 263 | 1 | 1834 | 5341 | 0 | 358 | 280 | 119 | 105 | 2233 | 120 | 1846 | 6182 |
| (16) | 2420 | 14,046 | 770 | 1416 | 282 | 3 | 10 | 13 | 381 | 634 | 814 | 11 | 4407 | 1455 | 360 | 0 | 7932 | 379 | 659 | 209,768 | 1545 | 26,335 | 17,162 |
| (17) | 1732 | 6725 | 567 | 156 | 130 | 1 | 0 | 8 | 190 | 318 | 1525 | 4 | 2573 | 1484 | 190 | 24,960 | 0 | 1845 | 2155 | 237,158 | 527 | 15,035 | 29,829 |
| (18) | 259 | 2074 | 65 | 32 | 4 | 0 | 0 | 2 | 83 | 5 | 21 | 0 | 535 | 88 | 20 | 2184 | 190 | 0 | 811 | 3926 | 106 | 2357 | 8078 |
| (19) | 2709 | 11,837 | 279 | 199 | 24 | 0 | 0 | 1 | 375 | 137 | 60 | 0 | 2343 | 863 | 77 | 1165 | 1088 | 1188 | 0 | 6737 | 239 | 5871 | 10,141 |
| (20) | 36,411 | 128,211 | 11,855 | 4941 | 6610 | 291 | 14 | 139 | 4486 | 10,327 | 25,990 | 185 | 47,415 | 23,295 | 4708 | 231,409 | 188,891 | 7085 | 13,647 | 0 | 16,502 | 240,259 | 298,350 |
| (21) | 4321 | 15,264 | 3109 | 3445 | 1074 | 142 | 33 | 858 | 3369 | 3693 | 3509 | 22 | 6671 | 2940 | 374 | 3021 | 3354 | 780 | 609 | 38,457 | 0 | 48,891 | 113,821 |
| (22) | 49,695 | 244,382 | 18,254 | 11,496 | 8272 | 301 | 182 | 604 | 7507 | 17,596 | 26,007 | 386 | 66,380 | 37,345 | 6771 | 49,061 | 37,150 | 4052 | 9235 | 356,945 | 37,236 | 2,955,828 | 977,505 |
| (23) | 45,584 | 275,832 | 26,821 | 20,822 | 9824 | 840 | 17 | 495 | 18,684 | 22,656 | 32,242 | 51 | 63,374 | 15,706 | 2076 | 25,028 | 16,976 | 5976 | 7938 | 212,653 | 77,397 | 560,329 | 642,144 |
Note: (1) KOR (2) CHN (3) THA (4) IDN (5) PHL (6) KHM (7) LAO (8) MMR (9) VNM (10) MYS (11) SGP (12) BRN (13) JPN (14) AUS (15) NZL (16) CAN (17) MEX (18) PER (19) CHL (20) USA (21) IND (22) EU (23) RoW. Source: GTAP 10 Data Base, 2014.
Table 2.
Countries and regions.
| # | Code | Description | # | Code | Description | # | Code | Description |
|---|---|---|---|---|---|---|---|---|
| 1 | KOR | Korea | 9 | VNM | Vietnam | 17 | MEX | Mexico |
| 2 | CHN | China | 10 | MYS | Malaysia | 18 | PER | Peru |
| 3 | THA | Thailand | 11 | SGP | Singapore | 19 | CHL | Chile |
| 4 | IDN | Indonesia | 12 | BRN | Brunei | 20 | USA | USA |
| 5 | PHL | Philippines | 13 | JPN | Japan | 21 | IND | India |
| 6 | KHM | Cambodia | 14 | AUS | Australia | 22 | EU | European Union |
| 7 | LAO | Laos | 15 | NZL | New Zealand | 23 | RoW | Rest of World |
| 8 | MMR | Myanmar | 16 | CAN | Canada |
Disclaimer/Publisher’s Note: The statements, opinions and data contained in all publications are solely those of the individual author(s) and contributor(s) and not of MDPI and/or the editor(s). MDPI and/or the editor(s) disclaim responsibility for any injury to people or property resulting from any ideas, methods, instructions or products referred to in the content. |
© 2022 by the author. Licensee MDPI, Basel, Switzerland. This article is an open access article distributed under the terms and conditions of the Creative Commons Attribution (CC BY) license (https://creativecommons.org/licenses/by/4.0/).
Share and Cite
MDPI and ACS Style
Jung, J. The Effects of China’s Participation in the Comprehensive and Progressive Agreement for Trans-Pacific Partnership (CPTPP): A Quantitative Assessment. Sustainability 2023, 15, 344. https://doi.org/10.3390/su15010344
AMA Style
Jung J. The Effects of China’s Participation in the Comprehensive and Progressive Agreement for Trans-Pacific Partnership (CPTPP): A Quantitative Assessment. Sustainability. 2023; 15(1):344. https://doi.org/10.3390/su15010344
Chicago/Turabian StyleJung, Jaewon. 2023. "The Effects of China’s Participation in the Comprehensive and Progressive Agreement for Trans-Pacific Partnership (CPTPP): A Quantitative Assessment" Sustainability 15, no. 1: 344. https://doi.org/10.3390/su15010344
Note that from the first issue of 2016, this journal uses article numbers instead of page numbers. See further details here.