
A Subgroup Method of Projecting Future Vulnerability and Adaptation to Extreme Heat

Environmental and Safety Engineering Department, Ajou University, Suwon 16499, Republic of Korea
Sustainability 2022, 14(24), 16494; https://doi.org/10.3390/su142416494
Submission received: 29 September 2022
/
Revised: 27 November 2022
/
Accepted: 6 December 2022
/
Published: 9 December 2022
(This article belongs to the Section Air, Climate Change and Sustainability)
Abstract
:This study presents a new method, a subgroup method, of predicting future vulnerabilities to high temperatures. In this method, the total population is divided into subgroups based on characteristics such as age. The adaptation trends are extracted for each subgroup, and they are combined based on the demographic structure of the future population to obtain the overall future relative risk of mortality to heat. The subgroup method is better than a simple extrapolation method because it can consider any demographic and socio-economic changes in the population. This study predicts the future temperature-related vulnerability of South Korea until 2100 based on the subgroup method. South Korea is one of the fastest aging countries, where the portion of mortality for older population aged 75 and more in 2005 (center of the baseline period) was 42.9%, whereas the portion becomes 96.5% in 2100, dominating the total mortality. This study found that the older population aged 75 and more can adapt to extreme temperatures like 40 °C 4.5 times slower than the younger population aged under 75. In addition, this study found that the conventional simple extrapolation method assumed a constant demographic structure and overestimated the future adaptation rate by 7.1 times faster than the subgroup method, which considered the demographic change and estimated the overall future vulnerability to extreme heat accordingly. The finding in this study shows that it is very important to consider demographic changes in the future temperature-related vulnerability projection, particularly in a fast-aging country like South Korea.
1. Introduction
Extreme heat has adverse health effects and increases mortality [1,2,3,4]. This heat-attributable mortality is known as one of the major impacts of global warming, and many previous researchers have quantified the impact of the temperature increase under various scenarios (e.g., Representative Concentration Pathway) [5,6,7,8,9,10,11,12,13,14]. For the future temperature-related mortality projection, the majority of the previous studies have assumed a constant temperature–mortality relationship. According to a review paper by Lee et al. (2018) [5], 12 out of 15 papers have ignored future adaptation in their studies. However, due to medical advancements, improvements in housing, and the proliferation of air-conditioning systems, researchers have found historical evidence that there is a substantial attenuation in heat-associated mortality risks [15,16,17,18,19,20,21,22,23,24], and thus, it is highly likely that the future population is even less vulnerable to extreme heat than the present population. Therefore, the assumption of constant vulnerability might cause a systematic overestimation of future heat-attributable mortality.
Adaptation is an area that has not been considerably explored. The rate and extent of adaptation are unknown, and the main drivers and factors of adaptation are also unknown [25]. Additionally, future-vulnerability predictions have neither standard methodology nor popular scenarios, unlike temperature predictions. A literature study reveals that previous studies have predicted future temperature-related vulnerability using two methods. First, researchers have set arbitrary numbers for future adaptation [26,27]. Li et al. (2016) [26] have assumed 5%, 15%, 30%, and 50% reductions in the heat effect and set them as adaptation scenarios to estimate the effects of such adaptations. Second, researchers have extracted the historical adaptation rate and extrapolated it by assuming that it will continue in the future [28,29]. Petkova et al. (2017) [28] have extracted the historical adaptation rate in New York. Afterward, they extrapolated the trend to calculate the future vulnerability. These methods are simple and easily applicable; however, they cannot consider any demographic and socio-economic changes which may occur in the future. Particularly, as older population is known to be more vulnerable to extreme heat than younger population [1,2,30,31,32,33,34,35,36,37,38], the future vulnerability must not be estimated without the proper consideration of the future demographic structure.
This paper presents a novel “subgroup method” to consider the demographic changes of the population in predicting future temperature-related vulnerabilities. In this method, the population of South Korea was divided into younger and older subgroups, and the future vulnerability of the total population was estimated until 2100 based on the adaptation trends of the two subgroups as well as the demographic structure of the future. Since South Korea is one of the fastest aging countries in the world [10], I showed that the adaptation of the older population strongly determined the overall future vulnerability. Lastly, I compared the vulnerability projections between the subgroup method and the simple extrapolation methods to show the importance of considering the demographic changes. To the best of our knowledge, this is the first study to present a method for considering demographic changes in predicting future temperature-related vulnerabilities.
2. Materials and Methods
2.1. Data Collection
The daily average temperature and all-cause mortality data from 15 locations in South Korea between 1995 and 2015 were obtained from the Korea Meteorological Administration (https://data.kma.go.kr/cmmn/main.do [accessed on 5 June 2022]) and Statistics Korea (available for research upon request to the office), respectively. The brief information on the 15 locations is presented in Supplementary Table S1. These study locations correctively had the population of 47.7 million in 2015 and the area of 98,783 km2, which roughly corresponded to the entire country. The population and all-cause mortality data projected up to 2100 was obtained from the United Nations (https://population.un.org/wpp/ [accessed on 14 July 2022]). Since the United Nations (UN) predicted only all-cause mortality, this study used the all-cause mortality from the historical data to match the mortality type with the UN data.
2.2. Time-Varying Distributed Lag Non-Linear Model (DLNM)
To understand how the temperature–mortality relationship changes over time during the study period, the time-varying distributed lag non-linear model (DLNM) was used, as described in a previous study [4,39]. This model can be expressed as follows.
Here, CB is a cross-basis [40] of two-dimensional temperature and a lag model with three internal knots for the temperature at the 10th, 75th, and 95th percentiles of the temperature distribution, with two equally spaced internal knots for 0–10 days of lag [11]. DOW is the day of the week, NS(DOY) is a natural cubic spline model of the day of the year with four degrees of freedom, and NS(date) is a natural cubic spline model of date with two degrees of freedom. DOW, NS(DOY), and NS(date) were used to control for daily, seasonal, and long-term variations, respectively. The last term, CB (date-REF) is the interaction term between CB and date. This interaction term captures the time-varying characteristics of the temperature–mortality relationship [4]. REF is the reference date of the relationship to be extracted. Thus, to assess the relationship of a specific day, the REF should be set to that day.
Based on this time-varying DLNM, the temperature–mortality relationship from 1995 to 2015 in two-year intervals for the 15 locations was predicted. Thereafter, a meta-analysis was performed to obtain the overall pooled relationship for the entire country [41].
2.3. Subgroup Method of Projecting Future Vulnerability
In this study, the total population was divided into two subgroups (aged under 75 and aged 75 and older). I chose to divide it into only two subgroups for the simplicity of the analysis, and the age 75 was chosen since it was close to the median mortality age of the study population. Then, time-varying vulnerability trends were extracted for each subgroup based on the data from the 15 locations in South Korea during 1995–2015. Afterward, the future vulnerability for each subgroup under a “business-as-usual” scenario was predicted by assuming the constant adaptation rate until the relative risk of mortality was 1. Since little is known about the extent of adaptation, no saturation was assumed in this study instead of setting an arbitrary saturation point as previously defined [28]. This prediction method can be expressed as follows.
Here, is the relative risk of mortality due to the exposure of temperature (T) in the year (Y) for the subgroup (S), and is the yearly adaptation rate extracted from the historical data for the S and T.
After obtaining the future vulnerability for each subgroup, the overall future vulnerability was calculated by taking the future-mortality-weighted harmonic mean of the subgroup vulnerabilities. This method can be expressed as follows.
Here, RR(Y,T) is the overall relative risk of mortality due to the exposure of T in the Y, is the mortality of the S in the Y, and n is the total number of subgroups.
3. Results
3.1. Overall Time-Varying Temperature–Mortality Relationship
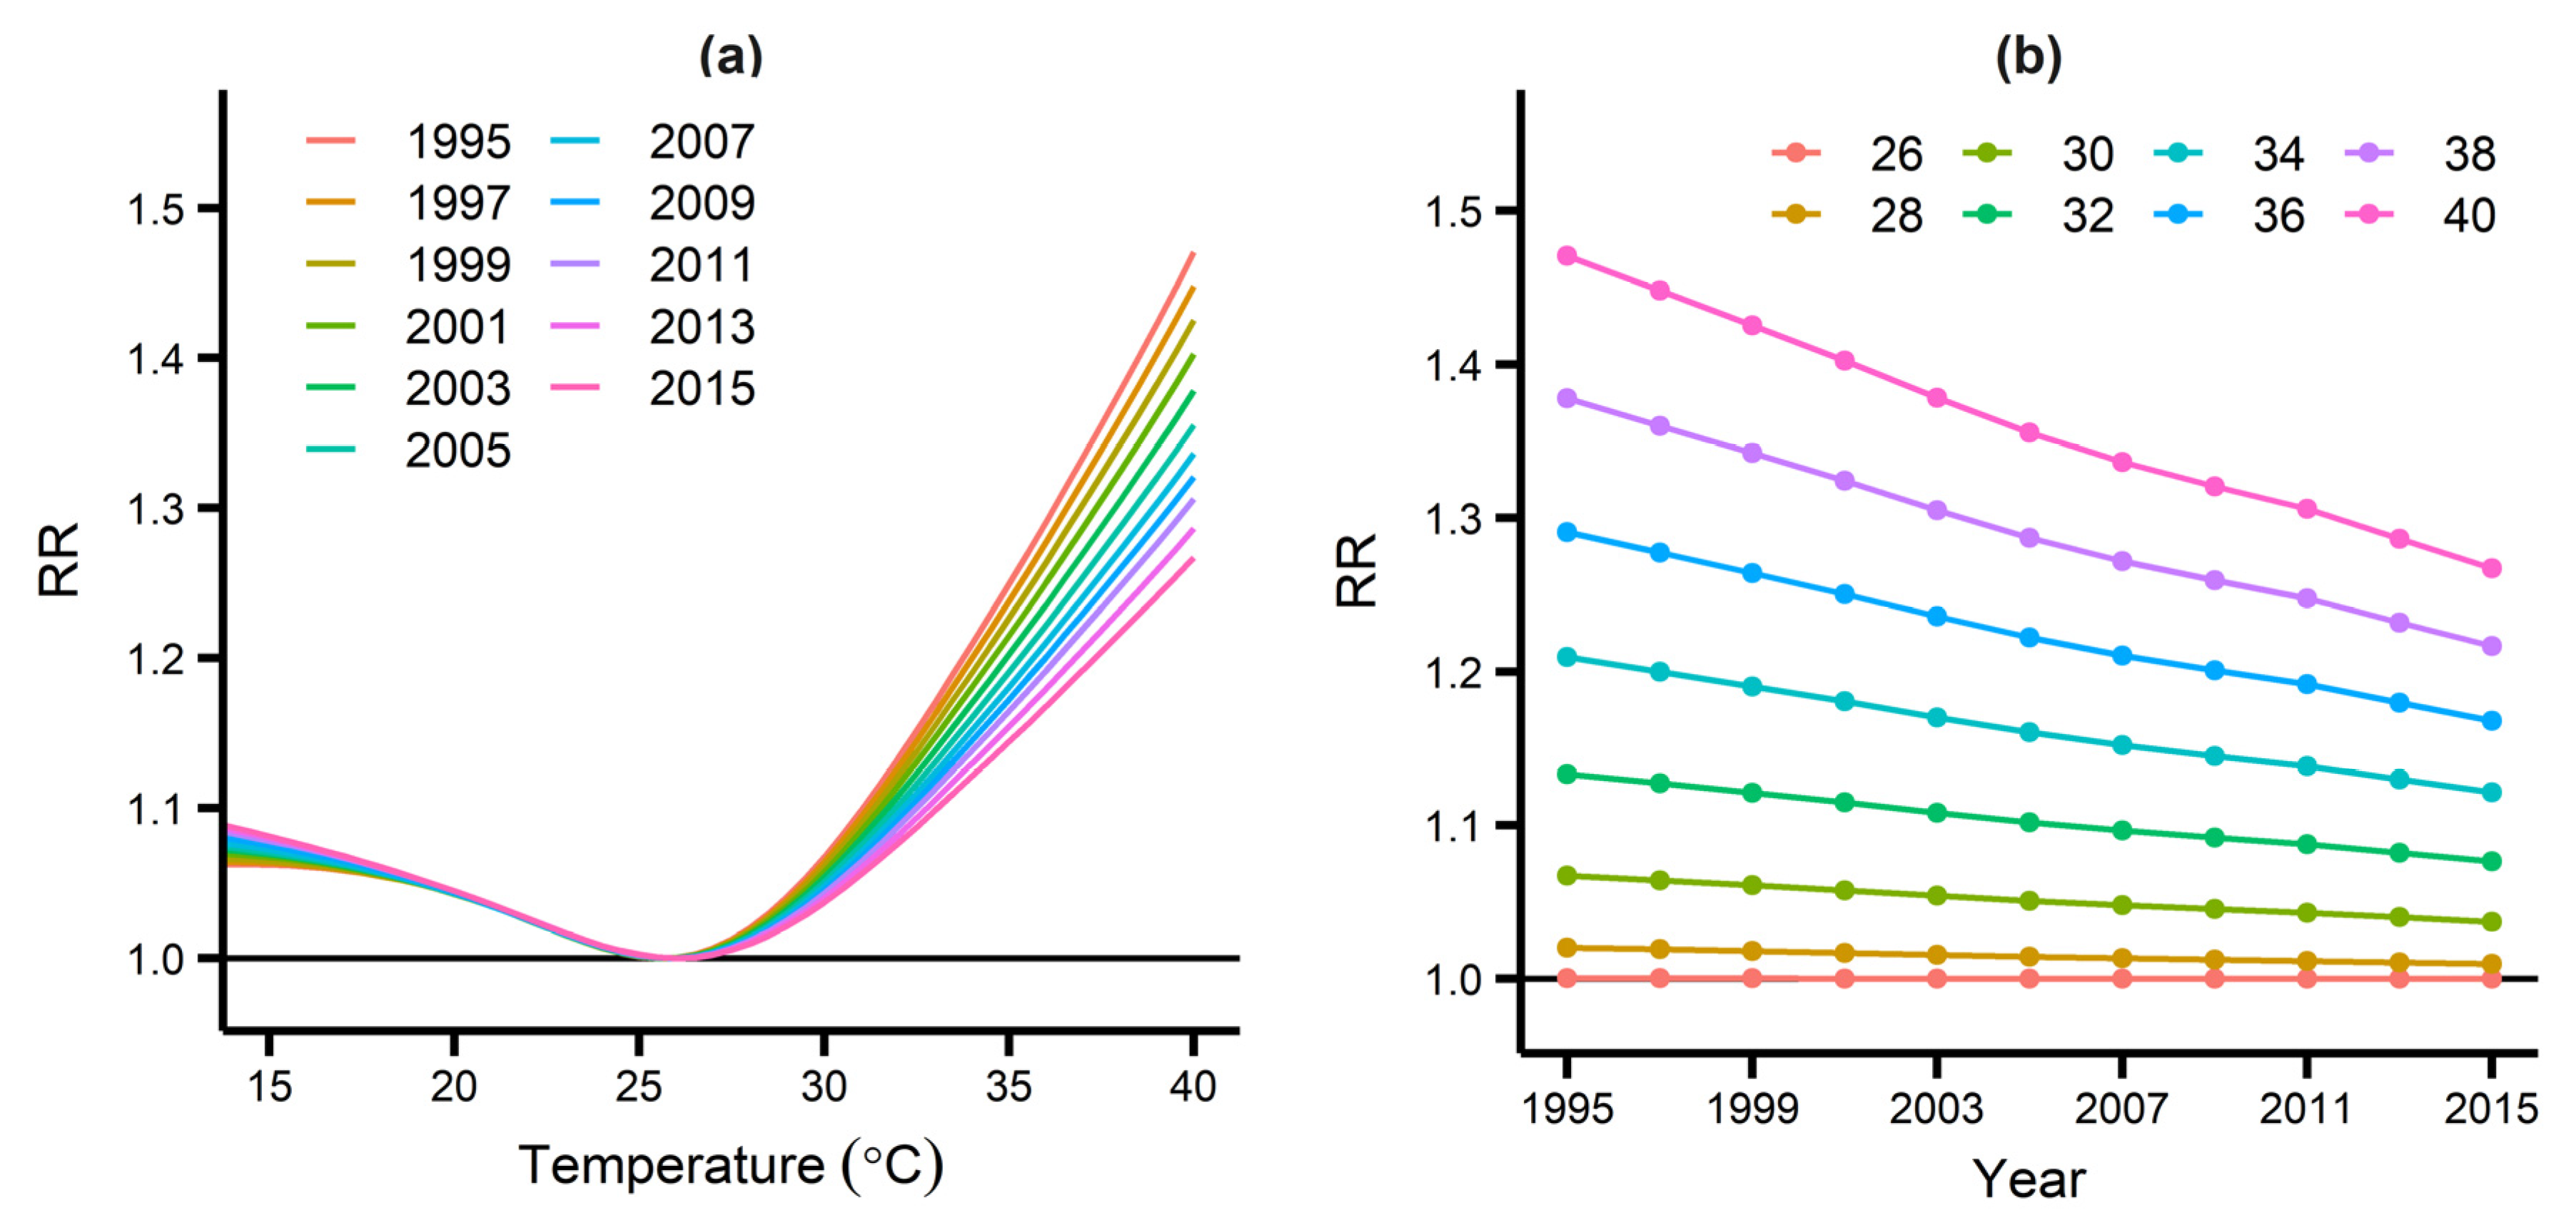
Figure 1a shows how the overall temperature–mortality relationship changed over time in Korea between 1995 and 2015, and Figure 1b shows the relative risk (RR) vs. year for temperatures between 26 °C and 40 °C. It was observed that the RR of heat-related mortality was constantly reduced during the period. The improvement speed was approximately –0.01 of RR per year at 40 °C. This improvement was attributable to the advancements in medical technology, insurance, housing, and air-conditioning systems [15,16,17,18,19,20,21,22,23,24].
Note that the minimum mortality temperature [42], where RR equals 1, did not shift during the adaptation process. This occurred because the minimum mortality temperature physiologically imposed the smallest burden on the human body, and this did not change with the external factors, such as medical advancement and housing improvement.
3.2. Subgroup-Specific Vulnerability Trends
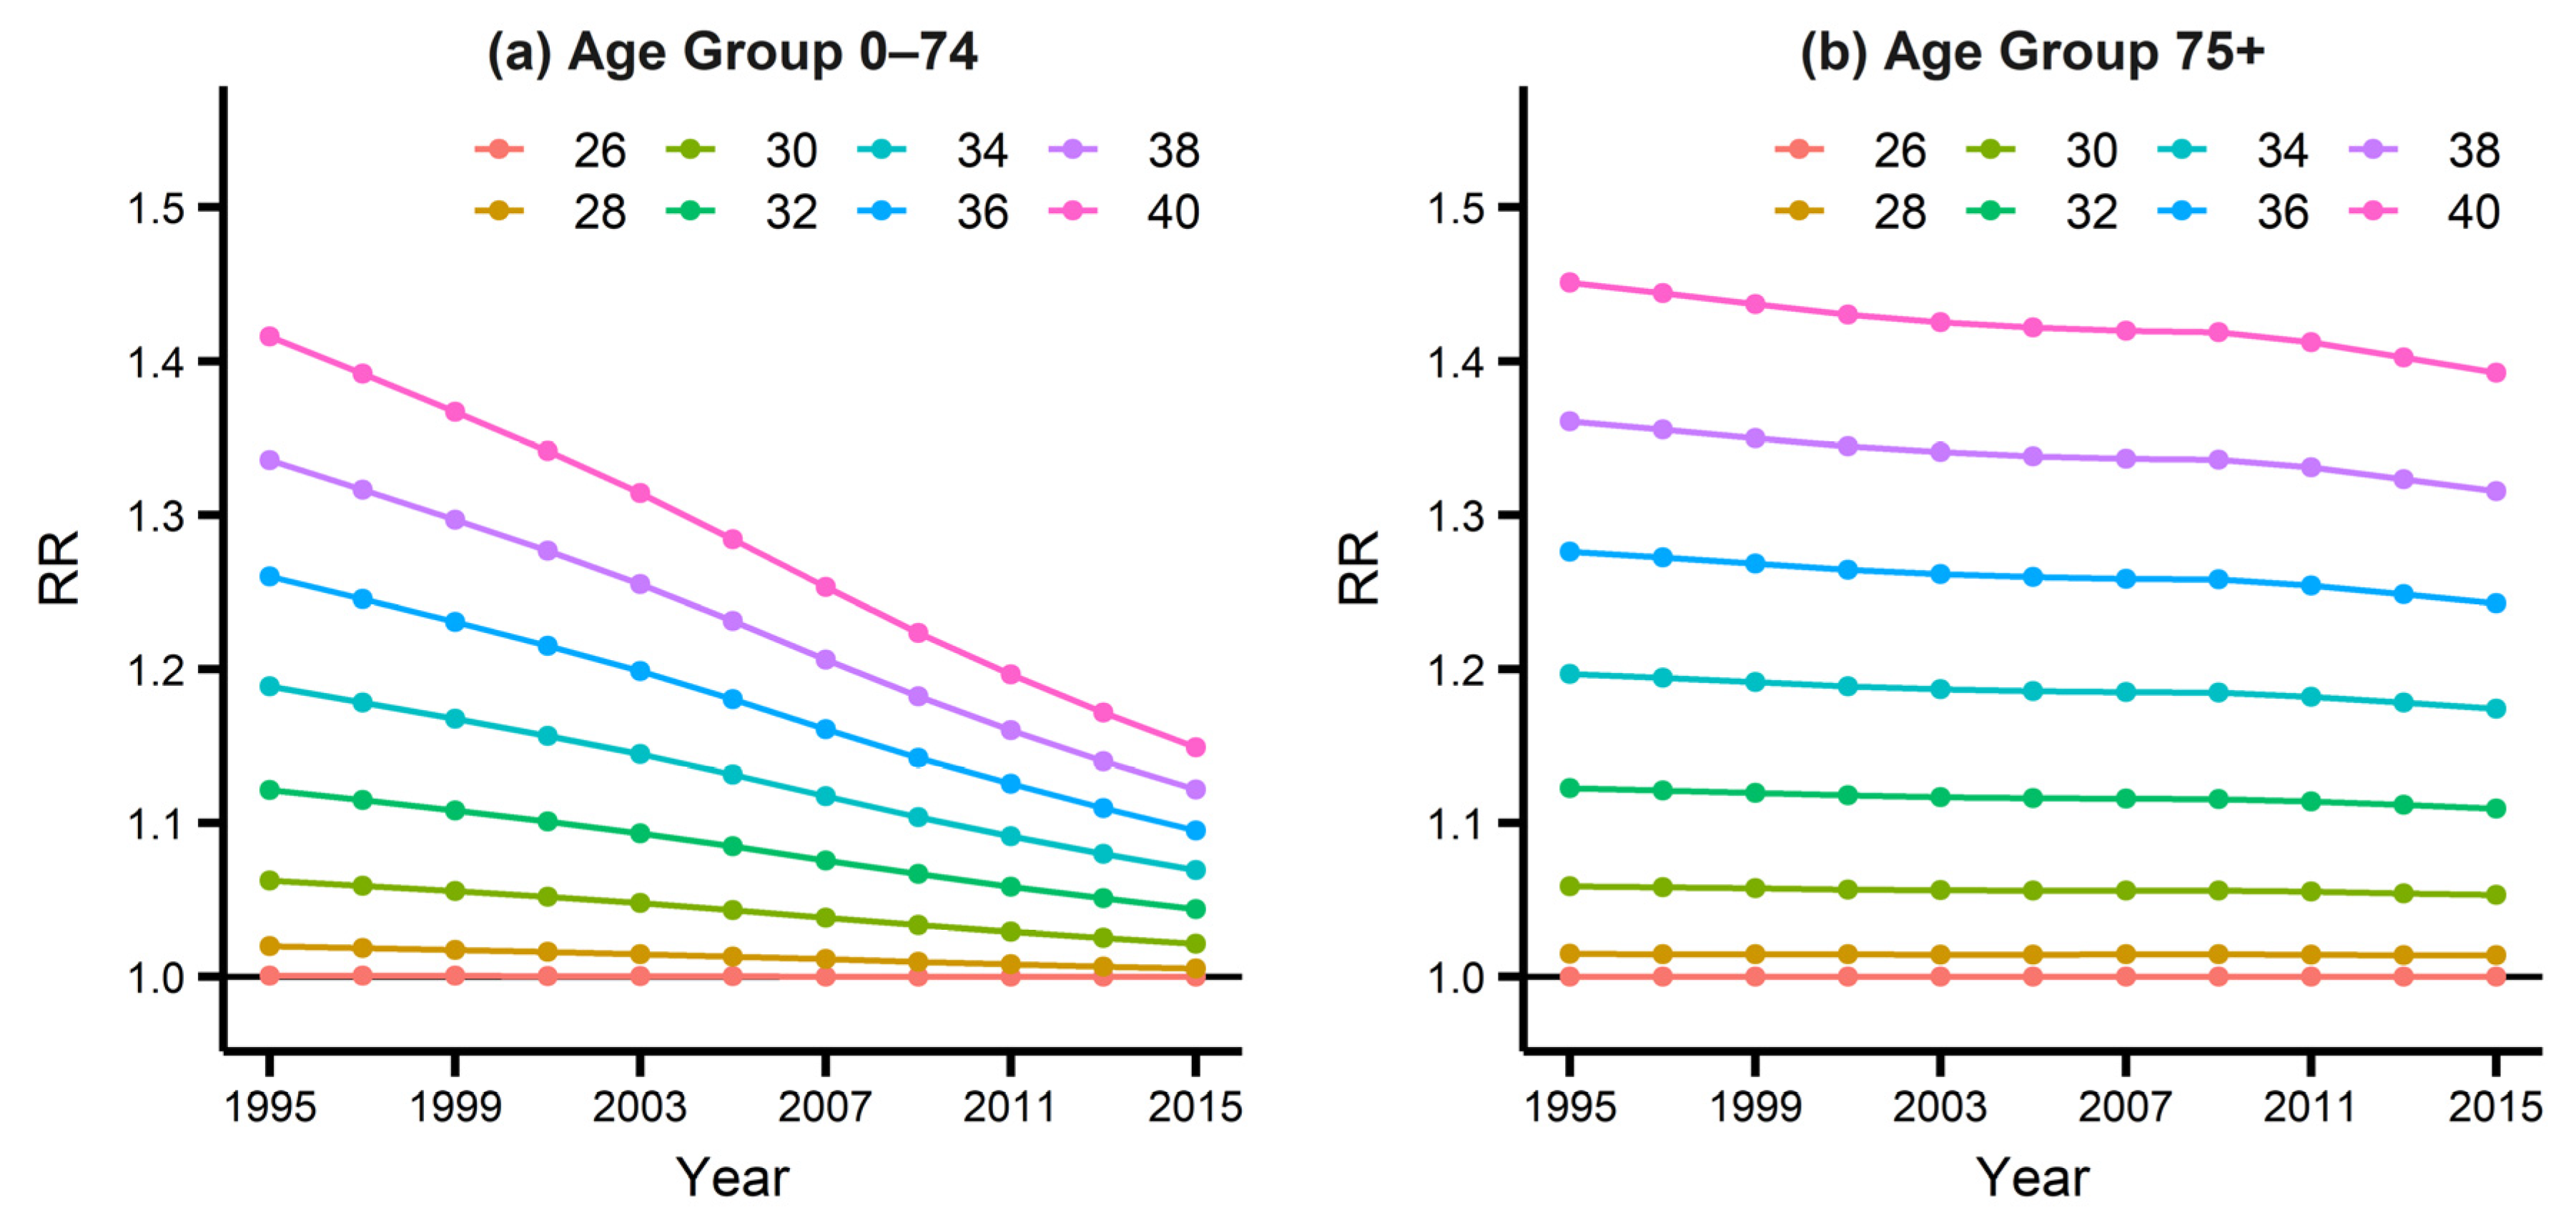
To understand how differently two subgroups (Age Groups 0–74 and 75+) adapt to extreme temperatures, I extracted the time-varying temperature–mortality relationship for each subgroup. Figure 2 compares the time-varying RR of temperature-induced mortality during the baseline period. Note that Age Group 0–74 adapts to the extreme heat at a rate considerably higher than that for Age Group 75+. For example, the RR for Age Group 0–74 was decreased by –0.013 of RR per year at 40 °C. This was 4.5 times faster adaptation rate than that for Age Group 75+ which was –0.0029 of RR per year at 40 °C.
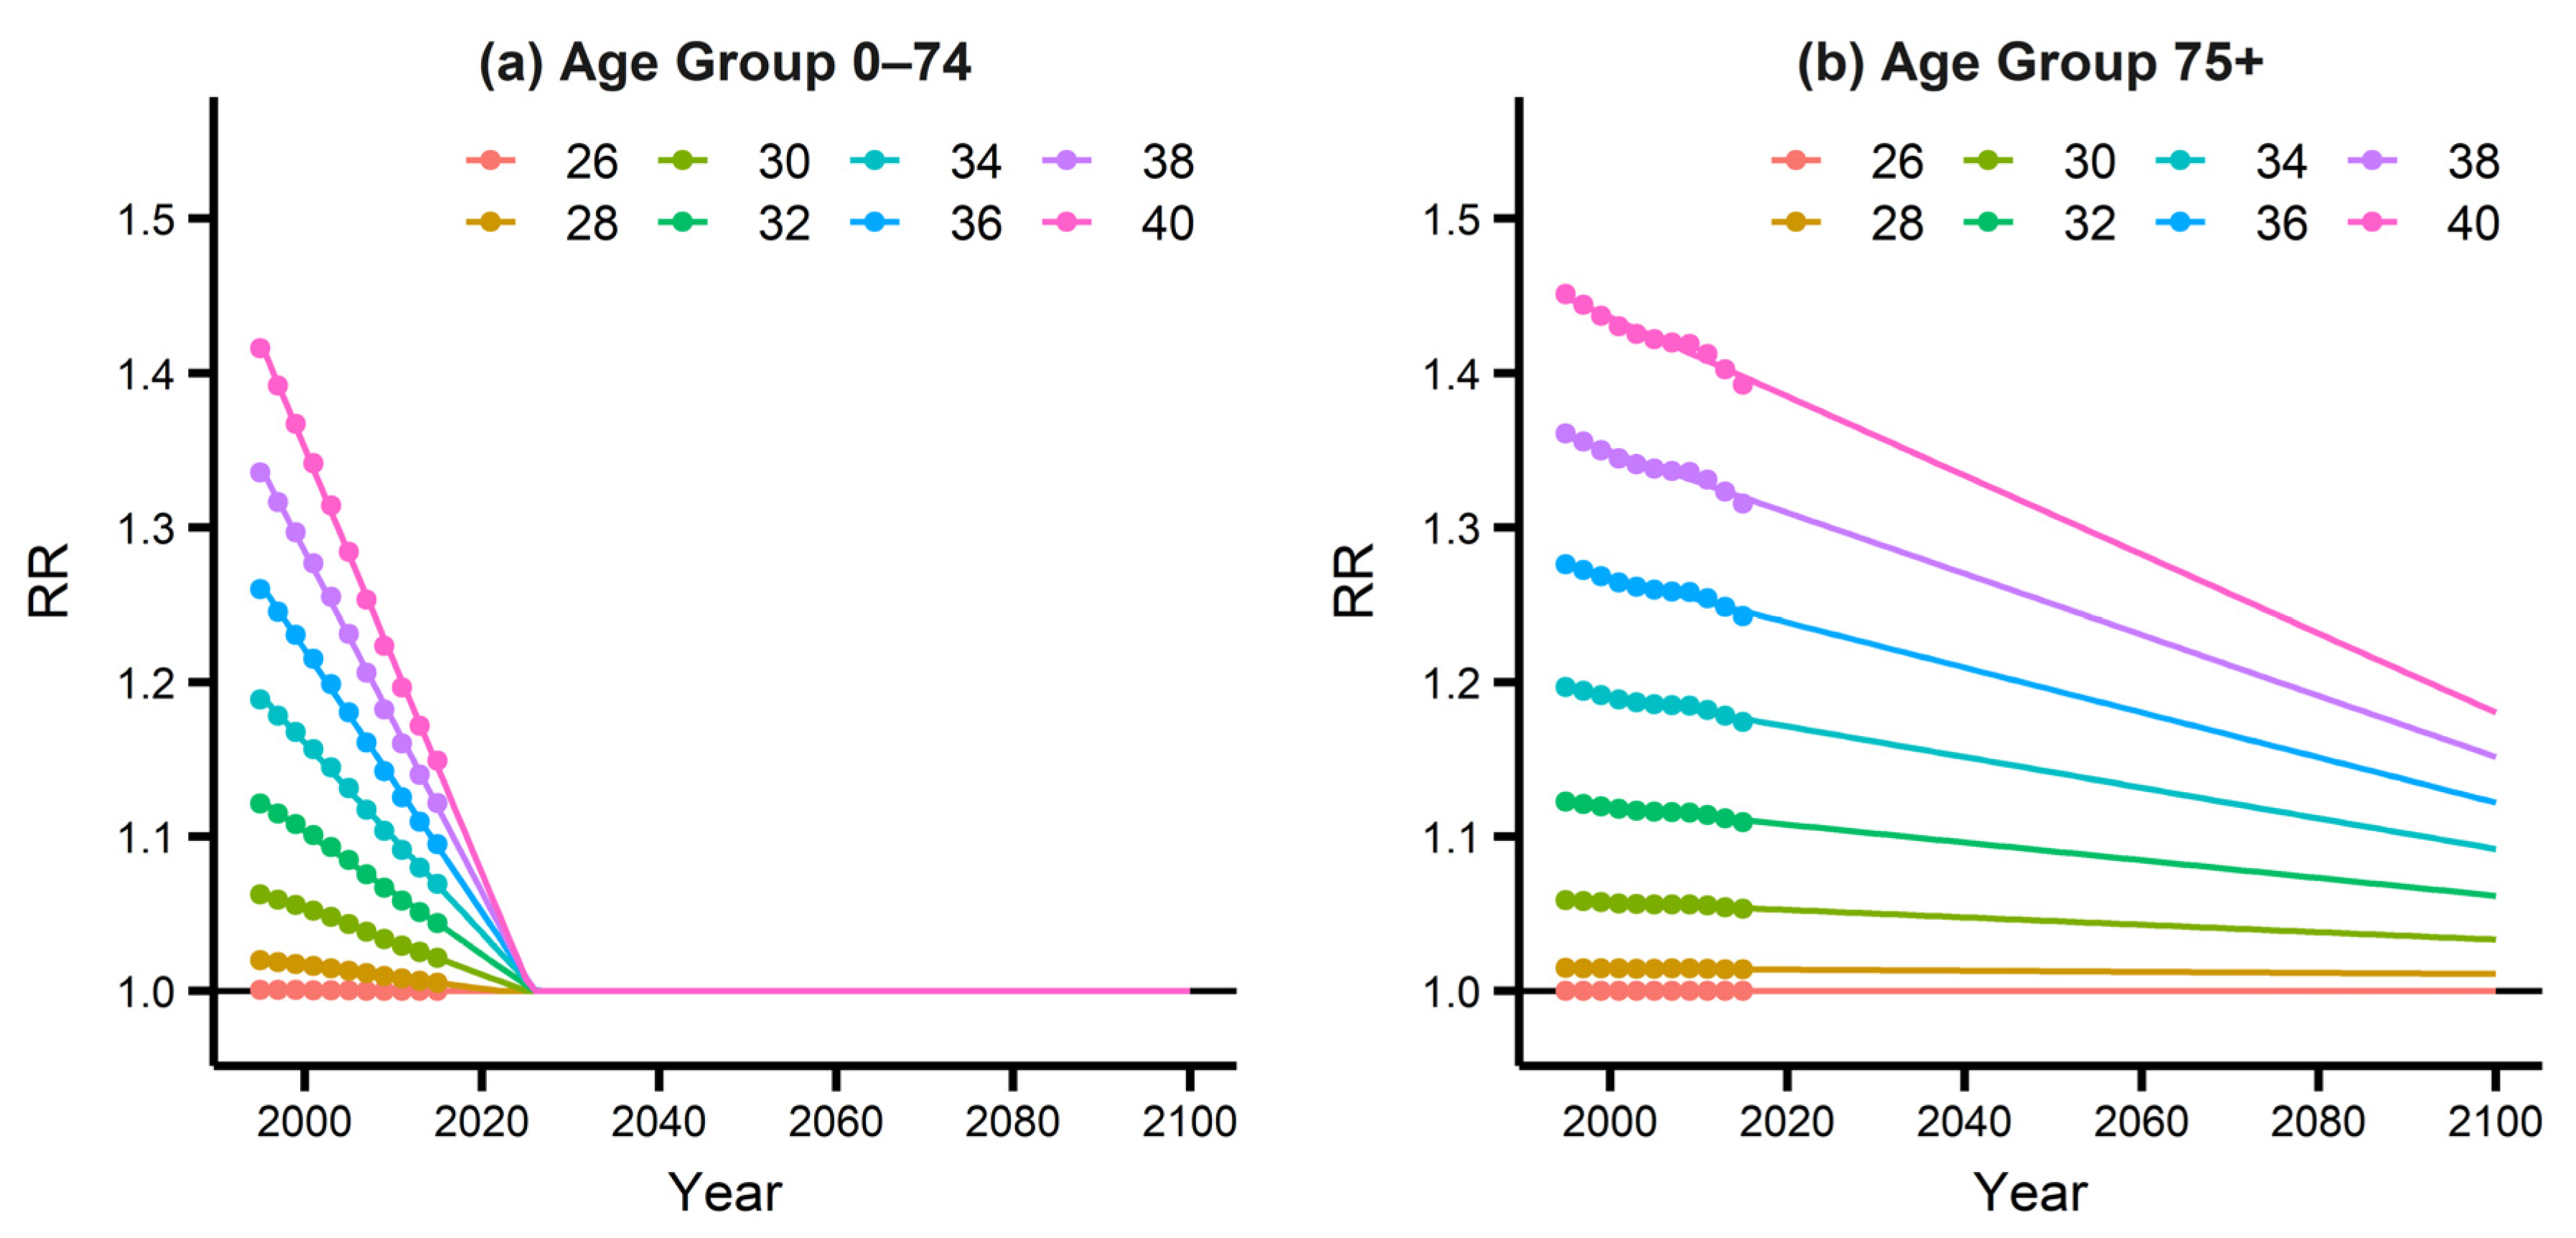
This study performed a linear extrapolation of the yearly RR reduction trends to predict the future vulnerability under a “business-as-usual” scenario for each subgroup. Figure 3 shows the extrapolation result in solid lines with the historical trends in dots. As can be seen, the RR for Age Group 0–74 reduces fast and reaches 1 in 2025, while the RR for Age Group 75+ slowly reduces and does not reach 1 up until 2100.
3.3. Projection of the Overall Future Vulnerability
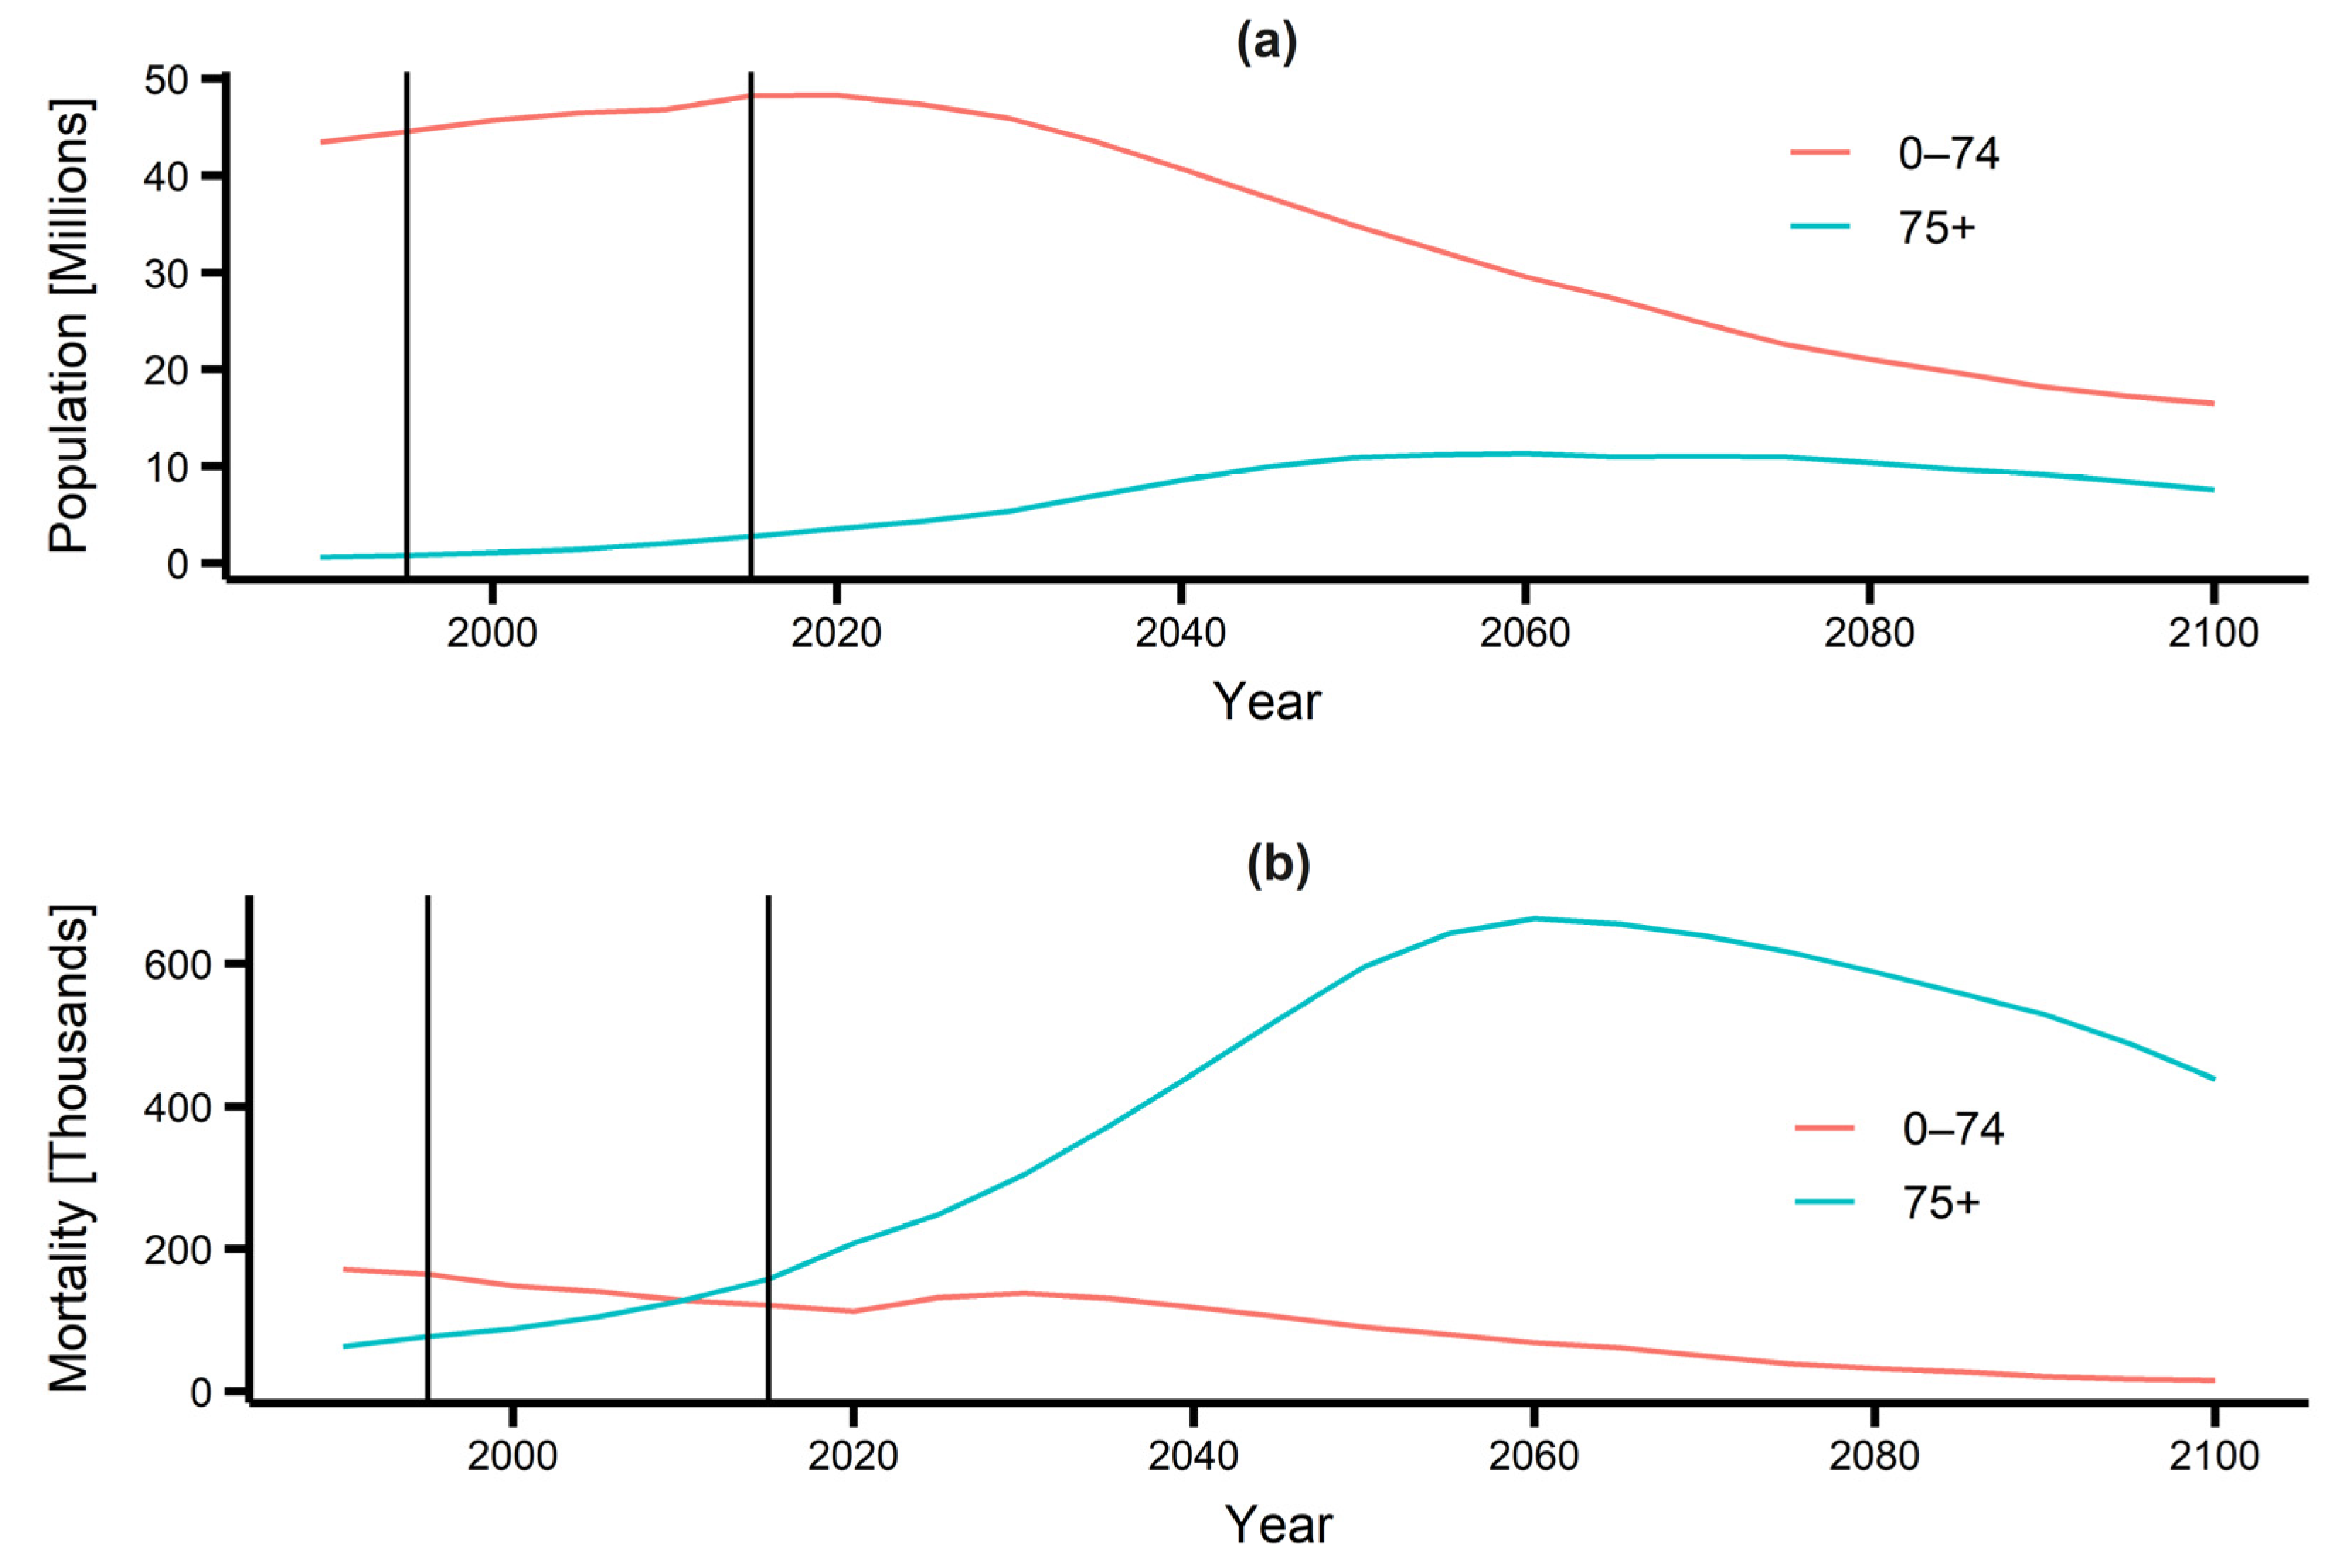
South Korea is known as one of the fastest aging countries in the world [10]. The number of population in Age Group 75+ increases from 1.42 million in 2005 (the center of the baseline period, 1995–2015) to 7.59 million in 2100 (see Figure 4a), and the all-cause mortality in Age Group 75+ increases from 105 thousand in 2005 to 438 thousand in 2100 (see Figure 4b). The portion of all-cause mortality for Age Group 75+ in 2005 was 42.9%, whereas the portion becomes 96.5% in 2100, dominating the total mortality.
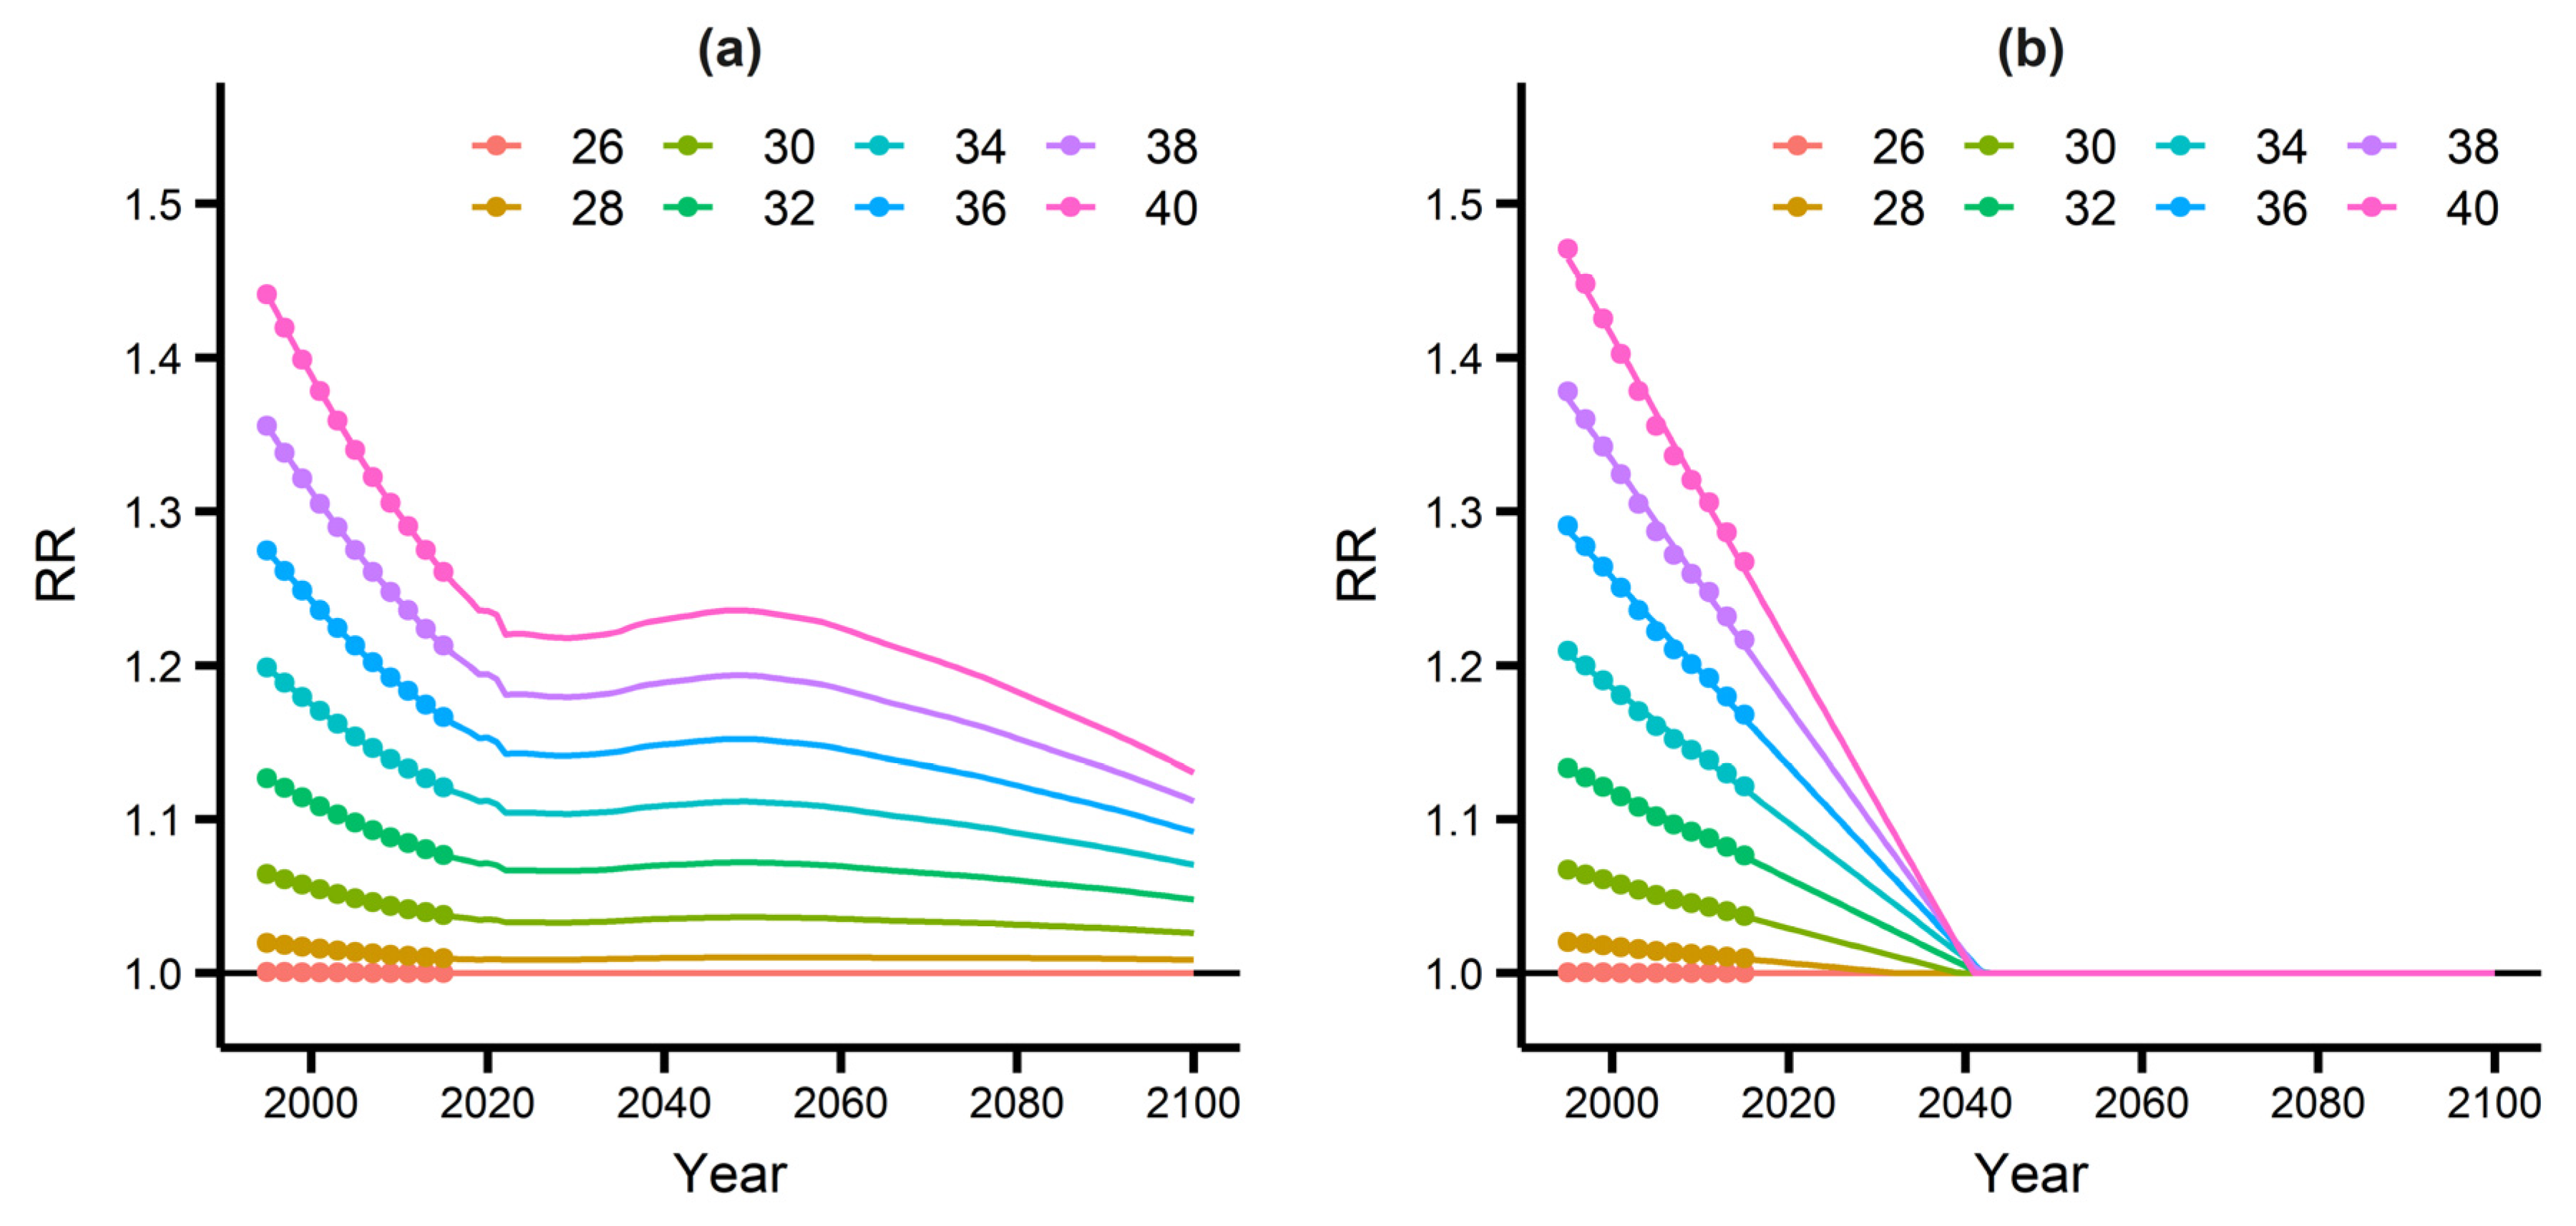
In a fast-aging country like South Korea, it is very important to consider future demographic changes in predicting the overall future vulnerability. Thus, it was predicted by taking the future-mortality-weighted harmonic mean of the subgroup vulnerabilities (see Figure 3), as expressed in Equation (3). Figure 5a shows the future vulnerability projection result based on the subgroup method. Notably, the adaptation speed decreased after 2020 as the older population started to dominate the total mortality.
The RR was decreased at a rate of −0.0014 per year on average at 40 °C from 2020 to 2100 (RRs for 40 °C were 1.24 in 2020 and 1.13 in 2100). This rate was 7.1 times slower than the one without the subgroup analysis (−0.01 per year at 40 °C), as shown in Figure 5b, whose result was obtained by taking the extrapolation from the historical trend of the overall vulnerability.
4. Discussion
In the result section, this study showed that the older population (Age Group 75+) in South Korea adapted to the extreme heat at a rate 4.5 times slower than that of the younger population (Age Group 0–74), and in-turn it showed that the projection based on the conventional extrapolation method overestimated the adaptation rate by not considering the aging of the population in South Korea. Using the subgroup method, the adaptation rate was projected to slow down as the portion of the older population was expected to grow from 42.9% in 2005 to 96.5% in 2100. This is why the subgroup analysis is required for predicting future adaptations to eliminate the effect of such compositional changes.
There are a few limitations of the study. First, there is no knowledge on the extent of the adaptation: whether the adaptation will saturate at a specific point, or continue until the state where the subgroup is completely immune to the extreme heat (the relative risks of 1). Therefore, I choose to assume that complete adaptation is possible. However, there are previous studies that assumed saturation. Petkova et al. (2017) [28] assumed the limit of adaptation to be 20%, 50%, and 80% lower than the historical relative risk and used a sigmoidal function to model the saturation. Until we know how to determine the extent of adaptation, it will be likely to depend on the choice of authors. Second, the temperature was measured by the official stations that are in the central area of the 15 locations. Therefore, there can be a discrepancy between the individual exposure and measured temperature, which may lead to an underestimation of the temperature–mortality relationship.
Adaptation to extreme heat is a largely unexplored area of study, and it is required for various future work. First, it is necessary to extend the subgroup method to increase the number of subgroups defined by various demographic, socio-economic, and environmental factors, such as gender, educational attainment, salary level, marital status, and climatological zone. Currently, it is limited by the data availability of those factors, and as a pre-requisite, a database of those factors should be built for the baseline period as well as the future period. Additionally, a robust method should be developed to extract the temperature–mortality relationship for very small subgroups. Second, it is necessary to explore the drivers of adaptation for each subgroup and understand how they contribute to the rate and extent of adaptation. The knowledge obtained by the future work will make it possible to improve the model for estimating future vulnerability to extreme climate events and build a standardized methodology and scenarios for projecting future adaptation to climate change.
5. Conclusions
This study presented a subgroup method of projecting future vulnerability. Based on the method, the historical adaptation patterns were separately extracted for two age subgroups (0–74 and 75+) in South Korea and combined through the future-mortality-weighted harmonic mean to project the overall future vulnerability on extreme heat until 2100. Additionally, this study demonstrated that simple extrapolation without the subgroup method can underestimate the future vulnerability by 7.1 times in South Korea, a fast-aging country. The finding of the study shows how misleading the result based on the assumption of the constant age structure can be, and it asks colleague researchers to consider the age structure change at the minimum in their future research on the adaptation projection. Further, the methodology presented in this work can be applicable to other countries and populations as well. Because of the importance of future adaptation, more in-depth studies must be conducted to understand and find the measures to help people adapt to extreme heat.
Supplementary Materials
The following supporting information can be downloaded at: https://www.mdpi.com/article/10.3390/su142416494/s1, Table S1: The brief information on 15 study locations during 1995–2015 in South Korea.
Funding
This study was supported by the National Research Foundation of Korea (grant number NRF-2021R1C1C1013350) and by the Korea Ministry of Environment (MOE) for the Graduate School specializing in Climate Change (grant number NRF-2017M1A2A2081253).
Institutional Review Board Statement
Not applicable.
Informed Consent Statement
Not applicable.
Data Availability Statement
The datasets used and/or analyzed during the current study are available from the corresponding author on reasonable request.
Conflicts of Interest
The authors declare no conflict of interest.
References
- Basu, R.; Samet, J.M. Relation between elevated ambient temperature and mortality: A review of the epidemiologic evidence. Epidemiol. Rev. 2002, 24, 190–202. [Google Scholar] [CrossRef] [PubMed]
- Ye, X.; Wolff, R.; Yu, W.; Vaneckova, P.; Pan, X.; Tong, S. Ambient temperature and morbidity: A review of epidemiological evidence. Environ. Health Perspect. 2012, 120, 19–28. [Google Scholar] [CrossRef] [PubMed] [Green Version]
- Gasparrini, A.; Guo, Y.; Hashizume, M.; Lavigne, E.; Zanobetti, A.; Schwartz, J.; Tobias, A.; Tong, S.; Rocklöv, J.; Forsberg, B.; et al. Mortality risk attributable to high and low ambient temperature: A multicountry observational study. Lancet 2015, 386, 369–375. [Google Scholar] [CrossRef]
- Gasparrini, A.; Guo, Y.; Hashizume, M.; Kinney, P.L.; Petkova, E.P.; Lavigne, E.; Zanobetti, A.; Schwartz, J.D.; Tobias, A.; Leone, M.; et al. Temporal Variation in Heat-Mortality Associations: A Multicountry Study. Environ. Health Perspect. 2015, 123, 1200–1207. [Google Scholar] [CrossRef] [PubMed] [Green Version]
- Lee, J.Y.; Choi, H.; Kim, H. Dependence of future mortality changes on global CO2 concentrations: A review. Environ. Int. 2018, 114, 52–59. [Google Scholar] [CrossRef] [PubMed]
- Lee, J.Y.; Kim, H.; Gasparrini, A.; Armstrong, B.; Bell, M.L.; Sera, F.; Lavigne, E.; Abrutzky, R.; Tong, S.; Coelho, M.D.S.Z.S.; et al. Predicted temperature-increase-induced global health burden and its regional variability. Environ. Int. 2019, 131, 105027. [Google Scholar] [CrossRef]
- Gasparrini, A.; Guo, Y.; Sera, F.; Vicedo-Cabrera, A.M.; Huber, V.; Tong, S.; Coelho, M.D.S.Z.S.; Saldiva, P.H.N.; Lavigne, E.; Correa, P.M.; et al. Projections of temperature-related excess mortality under climate change scenarios. Lancet Planet. Health 2017, 1, e360–e367. [Google Scholar] [CrossRef]
- Guo, Y.; Li, S.; Liu, D.L.; Chen, D.; Williams, G.; Tong, S. Projecting future temperature-related mortality in three largest Australian cities. Environ. Pollut. 2016, 208, 66–73. [Google Scholar] [CrossRef]
- Hajat, S.; Vardoulakis, S.; Heaviside, C.; Eggen, B. Climate change effects on human health: Projections of temperature-related mortality for the UK during the 2020s, 2050s and 2080s. J. Epidemiol. Community Health 2014, 68, 641–648. [Google Scholar] [CrossRef] [Green Version]
- Lee, J.Y.; Kim, H. Projection of future temperature-related mortality due to climate and demographic changes. Environ. Int. 2016, 94, 489–494. [Google Scholar] [CrossRef]
- Lee, J.Y.; Röösli, M.; Ragettli, M.S. Estimation of Heat-Attributable Mortality Using the Cross-Validated Best Temperature Metric in Switzerland and South Korea. Int. J. Environ. Res. Public Health 2021, 18, 6413. [Google Scholar] [CrossRef]
- Li, T.; Horton, R.M.; Kinney, P.L. Projections of seasonal patterns in temperature-related deaths for Manhattan, New York. Nat. Clim. Chang. 2013, 3, 717–721. [Google Scholar] [CrossRef] [Green Version]
- Martin, S.L.; Cakmak, S.; Hebbern, C.A.; Avramescu, M.-L.; Tremblay, N. Climate change and future temperature-related mortality in 15 Canadian cities. Int. J. Biometeorol. 2012, 56, 605–619. [Google Scholar] [CrossRef]
- Schwartz, J.D.; Lee, M.; Kinney, P.L.; Yang, S.; Mills, D.; Sarofim, M.C.; Jones, R.; Streeter, R.; St. Juliana, A.; Peers, J.; et al. Projections of temperature-attributable premature deaths in 209 U.S. cities using a cluster-based Poisson approach. Environ. Health 2015, 14, 85. [Google Scholar] [CrossRef] [Green Version]
- Åström, D.O.; Forsberg, B.; Edvinsson, S.; Rocklöv, J. Acute fatal effects of short-lasting extreme temperatures in Stockholm, Sweden: Evidence across a century of change. Epidemiology 2013, 24, 820–829. [Google Scholar] [CrossRef]
- Barreca, A.; Clay, K.; Deschenes, O.; Greenstone, M.; Shapiro, J.S. Adapting to climate change: The remarkable decline in the US temperature-mortality relationship over the twentieth century. J. Polit. Econ. 2016, 124, 105–159. [Google Scholar] [CrossRef] [Green Version]
- Bobb, J.F.; Peng, R.D.; Bell, M.L.; Dominici, F. Heat-related mortality and adaptation to heat in the United States. Environ. Health Perspect. 2014, 122, 811–816. [Google Scholar] [CrossRef]
- Carson, C.; Hajat, S.; Armstrong, B.; Wilkinson, P. Declining vulnerability to temperature-related mortality in London over the 20th century. Am. J. Epidemiol. 2006, 164, 77–84. [Google Scholar] [CrossRef] [Green Version]
- Coates, L. Exploring 167 years of vulnerability: An examination of extreme heat events in Australia 1844–2010. Environ. Sci. Pol. 2014, 42, 33–44. [Google Scholar] [CrossRef] [Green Version]
- Ekamper, P.; van Poppel, F.; van Duin, C.; Garssen, J. 150 years of temperature-related excess mortality in the Netherlands. Demogr. Res. 2009, 21, 385–426. [Google Scholar] [CrossRef]
- Guo, Y.; Barnett, A.G.; Tong, S. High temperatures-related elderly mortality varied greatly from year to year: Important information for heat-warning systems. Sci. Rep. 2012, 2, 830. [Google Scholar] [CrossRef] [PubMed] [Green Version]
- Heo, S.; Lee, E.; Kwon, B.Y.; Lee, S.; Jo, K.H.; Kim, J. Long-term changes in the heat–mortality relationship according to heterogeneous regional climate: A time-series study in South Korea. BMJ Open 2016, 6, e011786. [Google Scholar] [CrossRef] [PubMed] [Green Version]
- Nordio, F.; Zanobetti, A.; Colicino, E.; Kloog, I.; Schwartz, J. Changing patterns of the temperature-mortality association by time and location in the US, and implications for climate change. Environ. Int. 2015, 81, 80–86. [Google Scholar] [CrossRef] [PubMed] [Green Version]
- Petkova, E.P.; Gasparrini, A.; Kinney, P.L. Heat and mortality in New York City since the beginning of the 20th century. Epidemiology 2014, 25, 554–560. [Google Scholar] [CrossRef] [PubMed]
- World Health Organization (WHO). Quantitative Risk Assessment of the Effects of Climate Change on Selected Causes of Death, 2030s and 2050s; Public Health & Environment Department, Health Security & Environment Cluster of World Health Organization: Geneva, Switzerland, 2014. [Google Scholar]
- Li, T.; Horton, R.M.; Bader, D.A.; Zhou, M.; Liang, X.; Ban, J.; Sun, Q.; Kinney, P.L. Aging will amplify the heat-related mortality risk under a changing climate: Projection for the elderly in Beijing, China. Sci. Rep. 2016, 6, 28161. [Google Scholar] [CrossRef] [Green Version]
- Gosling, S.N.; Hondula, D.M.; Bunker, A.; Ibarreta, D.; Liu, J.; Zhang, X.; Sauerborn, R. Adaptation to climate change: A comparative analysis of modelling methods for heat-related mortality. Environ. Health Perspect. 2017, 125, 087008. [Google Scholar] [CrossRef]
- Petkova, E.P.; Vink, J.K.; Horton, R.M.; Gasparrini, A.; Bader, D.A.; Francis, J.D.; Kinney, P.L. Towards more comprehensive projections of urban heat-related mortality: Estimates for New York City under multiple population, adaptation, and climate scenarios. Environ. Health Perspect. 2017, 125, 47–55. [Google Scholar] [CrossRef] [Green Version]
- Lee, J.Y.; Lee, W.S.; Ebi, K.L.; Kim, H. Temperature-Related Summer Mortality Under Multiple Climate, Population, and Adaptation Scenarios. Int. J. Environ. Res. Public Health 2019, 16, 1026. [Google Scholar] [CrossRef] [Green Version]
- Applegate, W.B.; Runyan, J.W.; Brasfield, L.; Williams, M.L.; Konigsberg, C.; Fouche, C. Analysis of the 1980 heat wave in Memphis. J. Am. Geriatr. Soc. 1981, 29, 337–342. [Google Scholar] [CrossRef]
- Macfarlane, A. Daily mortality and environment in English conurbations. II. Deaths during summer hot spells in Greater London. Environ. Res. 1978, 15, 332–341. [Google Scholar] [CrossRef]
- Jones, T.S.; Liang, A.P.; Kilbourne, E.M.; Griffin, M.R.; Patriarca, P.A.; Wassilak, S.G.F.; Mullan, R.J.; Herrick, R.F.; Donnell, H.D., Jr.; Choi, K.; et al. Morbidity and mortality associated with the July 1980 heat wave in St Louis and Kansas City, Mo. JAMA 1982, 247, 3327–3331. [Google Scholar] [CrossRef]
- Saez, M.; Sunyer, J.; Castellsague, J.; Murillo, C.; Antó, J.M. Relationship between weather temperature and mortality: A time series analysis approach in Barcelona. Int. J. Epidemiol. 1995, 24, 576–582. [Google Scholar] [CrossRef]
- Wainwright, S.H.; Buchanan, S.D.; Mainzer, M.; Parrish, R.G.; Sinks, T.H. Cardiovascular mortality—The hidden peril of heat waves. Prehospital Disaster Med. 1999, 14, 222–231. [Google Scholar] [CrossRef]
- Smoyer-Tomic, K.E.; Rainham, D.G. Beating the heat: Development and evaluation of a Canadian hot weather health-response plan. Environ. Health Perspect. 2001, 109, 1241–1248. [Google Scholar] [CrossRef]
- Knowlton, K.; Rotkin-Ellman, M.; King, G.; Margolis, H.G.; Smith, D.; Solomon, G.; Trent, R.; English, P. The 2006 California heat wave: Impacts on hospitalizations and emergency department visits. Environ. Health Perspect. 2009, 117, 61–67. [Google Scholar] [CrossRef]
- Johnson, H.; Kovats, R.S.; McGregor, G.; Stedman, J.; Gibbs, M.; Walton, H.; Cook, L.; Black, E. The impact of the 2003 heat wave on mortality and hospital admissions in England. Health Stat. Q. 2005, 25, 6–11. [Google Scholar] [CrossRef] [Green Version]
- Lin, S.; Luo, M.; Walker, R.J.; Liu, X.; Hwang, S.A.; Chinery, R. Extreme high temperatures and hospital admissions for respiratory and cardiovascular diseases. Epidemiology 2009, 20, 738–746. [Google Scholar] [CrossRef]
- Vicedo-Cabrera, A.M.; Sera, F.; Guo, Y.; Chung, Y.; Arbuthnott, K.; Tong, S.; Tobias, A.; Lavigne, E.; Coelho, M.D.S.Z.S.; Saldiva, P.H.N.; et al. A multi-country analysis on potential adaptive mechanisms to cold and heat in a changing climate. Environ. Int. 2018, 111, 239–246. [Google Scholar] [CrossRef]
- Gasparrini, A.; Armstrong, B.; Kenward, M.G. Distributed lag non-linear models. Stat. Med. 2010, 29, 2224–2234. [Google Scholar] [CrossRef] [Green Version]
- Gasparrini, A.; Armstrong, B.; Kenward, M.G. Multivariate meta-analysis for nonlinear and other multi-parameter associations. Stat. Med. 2012, 31, 3821–3839. [Google Scholar] [CrossRef]
- Tobias, A.; Armstrong, B.; Gasparrini, A. Investigating uncertainty in the minimum mortality temperature methods and application to 52 Spanish cities. Epidemiology 2017, 28, 72–76. [Google Scholar] [CrossRef] [PubMed]
Figure 1.
(a) The overall time-varying temperature–mortality relationship for the 15 locations in South Korea; (b) yearly reduction in the relative risk of mortality due to temperature between 26 °C and 40 °C.
Figure 1.
(a) The overall time-varying temperature–mortality relationship for the 15 locations in South Korea; (b) yearly reduction in the relative risk of mortality due to temperature between 26 °C and 40 °C.

Figure 2.
(a) Time-varying temperature–mortality relationship for Age Group 0–74 and (b) Age Group 75+.
Figure 2.
(a) Time-varying temperature–mortality relationship for Age Group 0–74 and (b) Age Group 75+.

Figure 3.
Linearly extrapolated (solid line) relative risk of mortality due to temperature for the two subgroups: (a) Age Group 0–74 and (b) Age Group 75+.
Figure 3.
Linearly extrapolated (solid line) relative risk of mortality due to temperature for the two subgroups: (a) Age Group 0–74 and (b) Age Group 75+.

Figure 4.
(a) Population and (b) mortality projections for the two age groups in South Korea during 1990–2100; black vertical lines depict the baseline period of 1995–2015.
Figure 4.
(a) Population and (b) mortality projections for the two age groups in South Korea during 1990–2100; black vertical lines depict the baseline period of 1995–2015.

Figure 5.
Future temperature-induced relative risk of mortality in South Korea until 2100, projected based on (a) the subgroup and (b) linear extrapolation methods; dots show the extracted historical time-varying relative risks.
Figure 5.
Future temperature-induced relative risk of mortality in South Korea until 2100, projected based on (a) the subgroup and (b) linear extrapolation methods; dots show the extracted historical time-varying relative risks.

Publisher’s Note: MDPI stays neutral with regard to jurisdictional claims in published maps and institutional affiliations. |
© 2022 by the author. Licensee MDPI, Basel, Switzerland. This article is an open access article distributed under the terms and conditions of the Creative Commons Attribution (CC BY) license (https://creativecommons.org/licenses/by/4.0/).
Share and Cite
MDPI and ACS Style
Lee, J.Y. A Subgroup Method of Projecting Future Vulnerability and Adaptation to Extreme Heat. Sustainability 2022, 14, 16494. https://doi.org/10.3390/su142416494
AMA Style
Lee JY. A Subgroup Method of Projecting Future Vulnerability and Adaptation to Extreme Heat. Sustainability. 2022; 14(24):16494. https://doi.org/10.3390/su142416494
Chicago/Turabian StyleLee, Jae Young. 2022. "A Subgroup Method of Projecting Future Vulnerability and Adaptation to Extreme Heat" Sustainability 14, no. 24: 16494. https://doi.org/10.3390/su142416494
Note that from the first issue of 2016, this journal uses article numbers instead of page numbers. See further details here.