
Expert-Based Modular Simulator for Municipal Waste Processing Technology Design


1
Department of Process Engineering, University of Pannonia, Egyetem Str. 10, H-8200 Veszprém, Hungary
2
Sustainable Solutions Research Laboratory, University of Pannonia, Egyetem Str. 10, H-8200 Veszprém, Hungary
3
ELKH-PE Complex Systems Monitoring Research Group, Egyetem Str. 10, H-8200 Veszprém, Hungary
*
Author to whom correspondence should be addressed.
Sustainability 2022, 14(24), 16403; https://doi.org/10.3390/su142416403
Submission received: 14 November 2022
/
Revised: 29 November 2022
/
Accepted: 4 December 2022
/
Published: 8 December 2022
Abstract
:One of the significant problems in our society is the handling and processing of the vast amount of waste produced by households and industrial processes. Nowadays, packaging material regulations are constantly changing, which can significantly impact the quality of municipal waste, requiring the continuous development and redesign of waste processing plants. Since only a few uncertain measurements (composition, mass, etc.) are available for this task, analysing and redesigning waste processing technologies is challenging. This research aims to develop a modelling and simulation concept that can integrate all the available information and can also handle the uncertainty of the measurements. The proposed modular modelling framework can serve as a basis for designing and redesigning the technologies needed to process ever-changing municipal waste. The most important steps of the framework are as follows: identifying the typical equipment, these are the elements; building models of the elements; determining the characteristic parameters of the equipment; exploring the possible relationships between the elements. For example, the information needed to define the model parameters can be gathered from measurements, industrial experience, and expert knowledge. In many cases, the data obtained represent ranges. The stationary model framework applies efficiency factors and divides the solids into substreams based on expert knowledge. Furthermore, a modular simulator framework was developed to simulate the technological schemes with various connections. The specifications for all widely used waste industrial equipment (shredders, air separators, sieves, magnetic-, eddy current-, optical-, and ballistic separators) were used to construct the developed simulator. This simulator can open new opportunities for the design of waste sorting technological networks. The model was calibrated based on expertise gained from operating the studied technology. The changes in the material parameters can be considered, and the modular simulator can lead to flexible waste sorting technologies capable of adapting to governmental and environmental regulations changes. The main result of the work is that a methodology for designing a modular simulator, model development, and a validation method has been proposed, which provides the possibility to deal with uncertainty. All this is successfully presented through the analysis of an operating waste separation system.
1. Introduction
The circular economy has been in the spotlight in recent years. The importance of waste reduction, elimination, and recycling have a crucial impact on the future economy and the protection of the environment [1]. The new structure of the industrial economy will only work if the various waste streams can be transformed into materials of acceptable purity and in sufficient quantities to be reintroduced and reused in production. Proper sorting is based on an appropriate sorting line. Waste management modelling is a widely researched field today. Many review articles have been written in this area. Only the most recent ones are briefly presented in this paper. A comprehensive overview of the applicability of input–output models in waste management analysis is given in [2]. Artificial-intelligence-based models are also becoming more and more common in this field [3]. The transition to a sustainable circular economy is impossible without the application of up-to-date simulation tools [4].
Notwithstanding the above, a modular and flexible simulator for waste sorting process lines is a research gap. This is supported by the fact that in the case of waste sorting technologies, there are often only a limited number of measuring points in the technology, which means that the data are subject to high uncertainty. Therefore, there is a growing need to develop simulation methods and tools that can support technology development, even with small measurement data, relying on expert knowledge and managing data uncertainty. There are generally applicable modular simulators, e.g., in the field of chemical engineering; however, the raw materials of waste sorting technologies are so diverse that the property estimation methods of these simulators are not applicable or only with limitations [5]. Moreover, the cost of purchasing these simulators is high, which, combined with the fact that even their application is strongly limited, makes them often not worthwhile for industry. In light of this, a simulator is needed that is low-cost, flexible, and only with the complexity that is absolutely necessary for fast and transparent technology development.
Our aim is to develop a modelling framework for waste sorting technologies. The main challenge for waste sorting is the uncertainty of the technological parameters. The most important of these technological parameters are the composition of the waste streams entering the sorting systems and the separation efficiency of the units [6]. A fundamental difficulty of this field is that few measurements (composition, mass, etc.) are performed on production lines. Only a few works on modelling and simulation equipment are used in waste treatment plants. As seen from the examples above, mathematical models are not available for all the equipment included in the technologies. For example, the particle size characteristic was investigated in drum sieves in [7]. In [8], a detailed mathematical model was described for the device of electromagnetic drum separator for waste material. A new approach was presented for the numerical analysis of an eddy current separator to recover non-ferrous metals from wastes in [9]. However, only a few publications dealt with the modelling and simulation of the whole waste treatment plants. The modelling of material recovery was presented from waste incineration bottom ash in [10]. A systematic approach to assessing waste sorting plants was presented in [11]. A predictive modelling approach was proposed for household packaging waste flows in sorting facilities in [6]. The authors found that the separation efficiency of the equipment is a crucial part of the model. The separation efficiencies used were validated by case studies and process experts in this work. Furthermore, it was stated that their uncertainty precluded meaningful validation; therefore, a sensitivity analysis was performed on the estimated separation efficiencies. To this end, the model was run several times with different input separation efficiencies.
We aim to develop a modelling framework that can achieve good results despite uncertain parameters. This requires the involvement of experts who work with these technologies day-to-day. Expert groups were asked to define the separation efficiency of the equipment and validate the model. Still, the two teams of experts were completely independent of each other. Based on the data provided by the experts, it can be seen that the technological parameters are so uncertain that the experts could only define intervals. Since the experts could define no distribution for these intervals, a uniform distribution was chosen as the basis for modelling. Monte Carlo (MC) simulation has been successfully applied to simulation studies of uncertain systems [12]. Since we had to calculate intervals for the most important parameters, we used MC simulation to reduce the uncertainty of the model and the simulation. Of course, the MC simulation also gives distributions as a result of the modelling. To validate the model, the distributions obtained by simulation are compared with those generated for the intervals defined by the experts. The expert distributions are aggregated to do this, resulting in a probability distribution. As a result of the comparison, the distributions for the parameters can be further refined, for example, with importance sampling [13].
The most significant contributions of this work are as follows:
- We have developed a modelling concept that can be successfully applied to describe systems under high uncertainty, caused mainly by the low number of measurements.
- We have developed a modular simulator framework capable of simulating technological schemes with various connections.
- We have proposed a method based on Monte Carlo simulation for using expert knowledge for modelling and model validation.
- The developed simulator can open new opportunities for the design of waste sorting technological networks. The changes in the material parameters can be considered, and the modular simulator can lead to flexible waste sorting technologies capable of adapting to governmental and environmental regulation changes.
Section 2 presents the concept and structure of the modular simulator of the waste sorting technology with the description of the equipment involved in these technologies. In Section 3, the simulation and model validation results are shown through a case study. Finally, in Section 4, the conclusions and further plans are offered.
2. Methodology: Concept and Structure of the Modular Simulator of the Waste Sorting Technology
In this chapter, the steps to build a modular simulator are described in detail. All the technological steps (units-machines) of a waste sorting technology are described as modules and these modules are finally integrated into a model. The flexibility of the designed model could allow the adjustment of different criteria and measurement inputs according to the needs and data from the industry. With this tool, virtual design and scaling could be supported and compliance with existing technologies would be a real possibility.
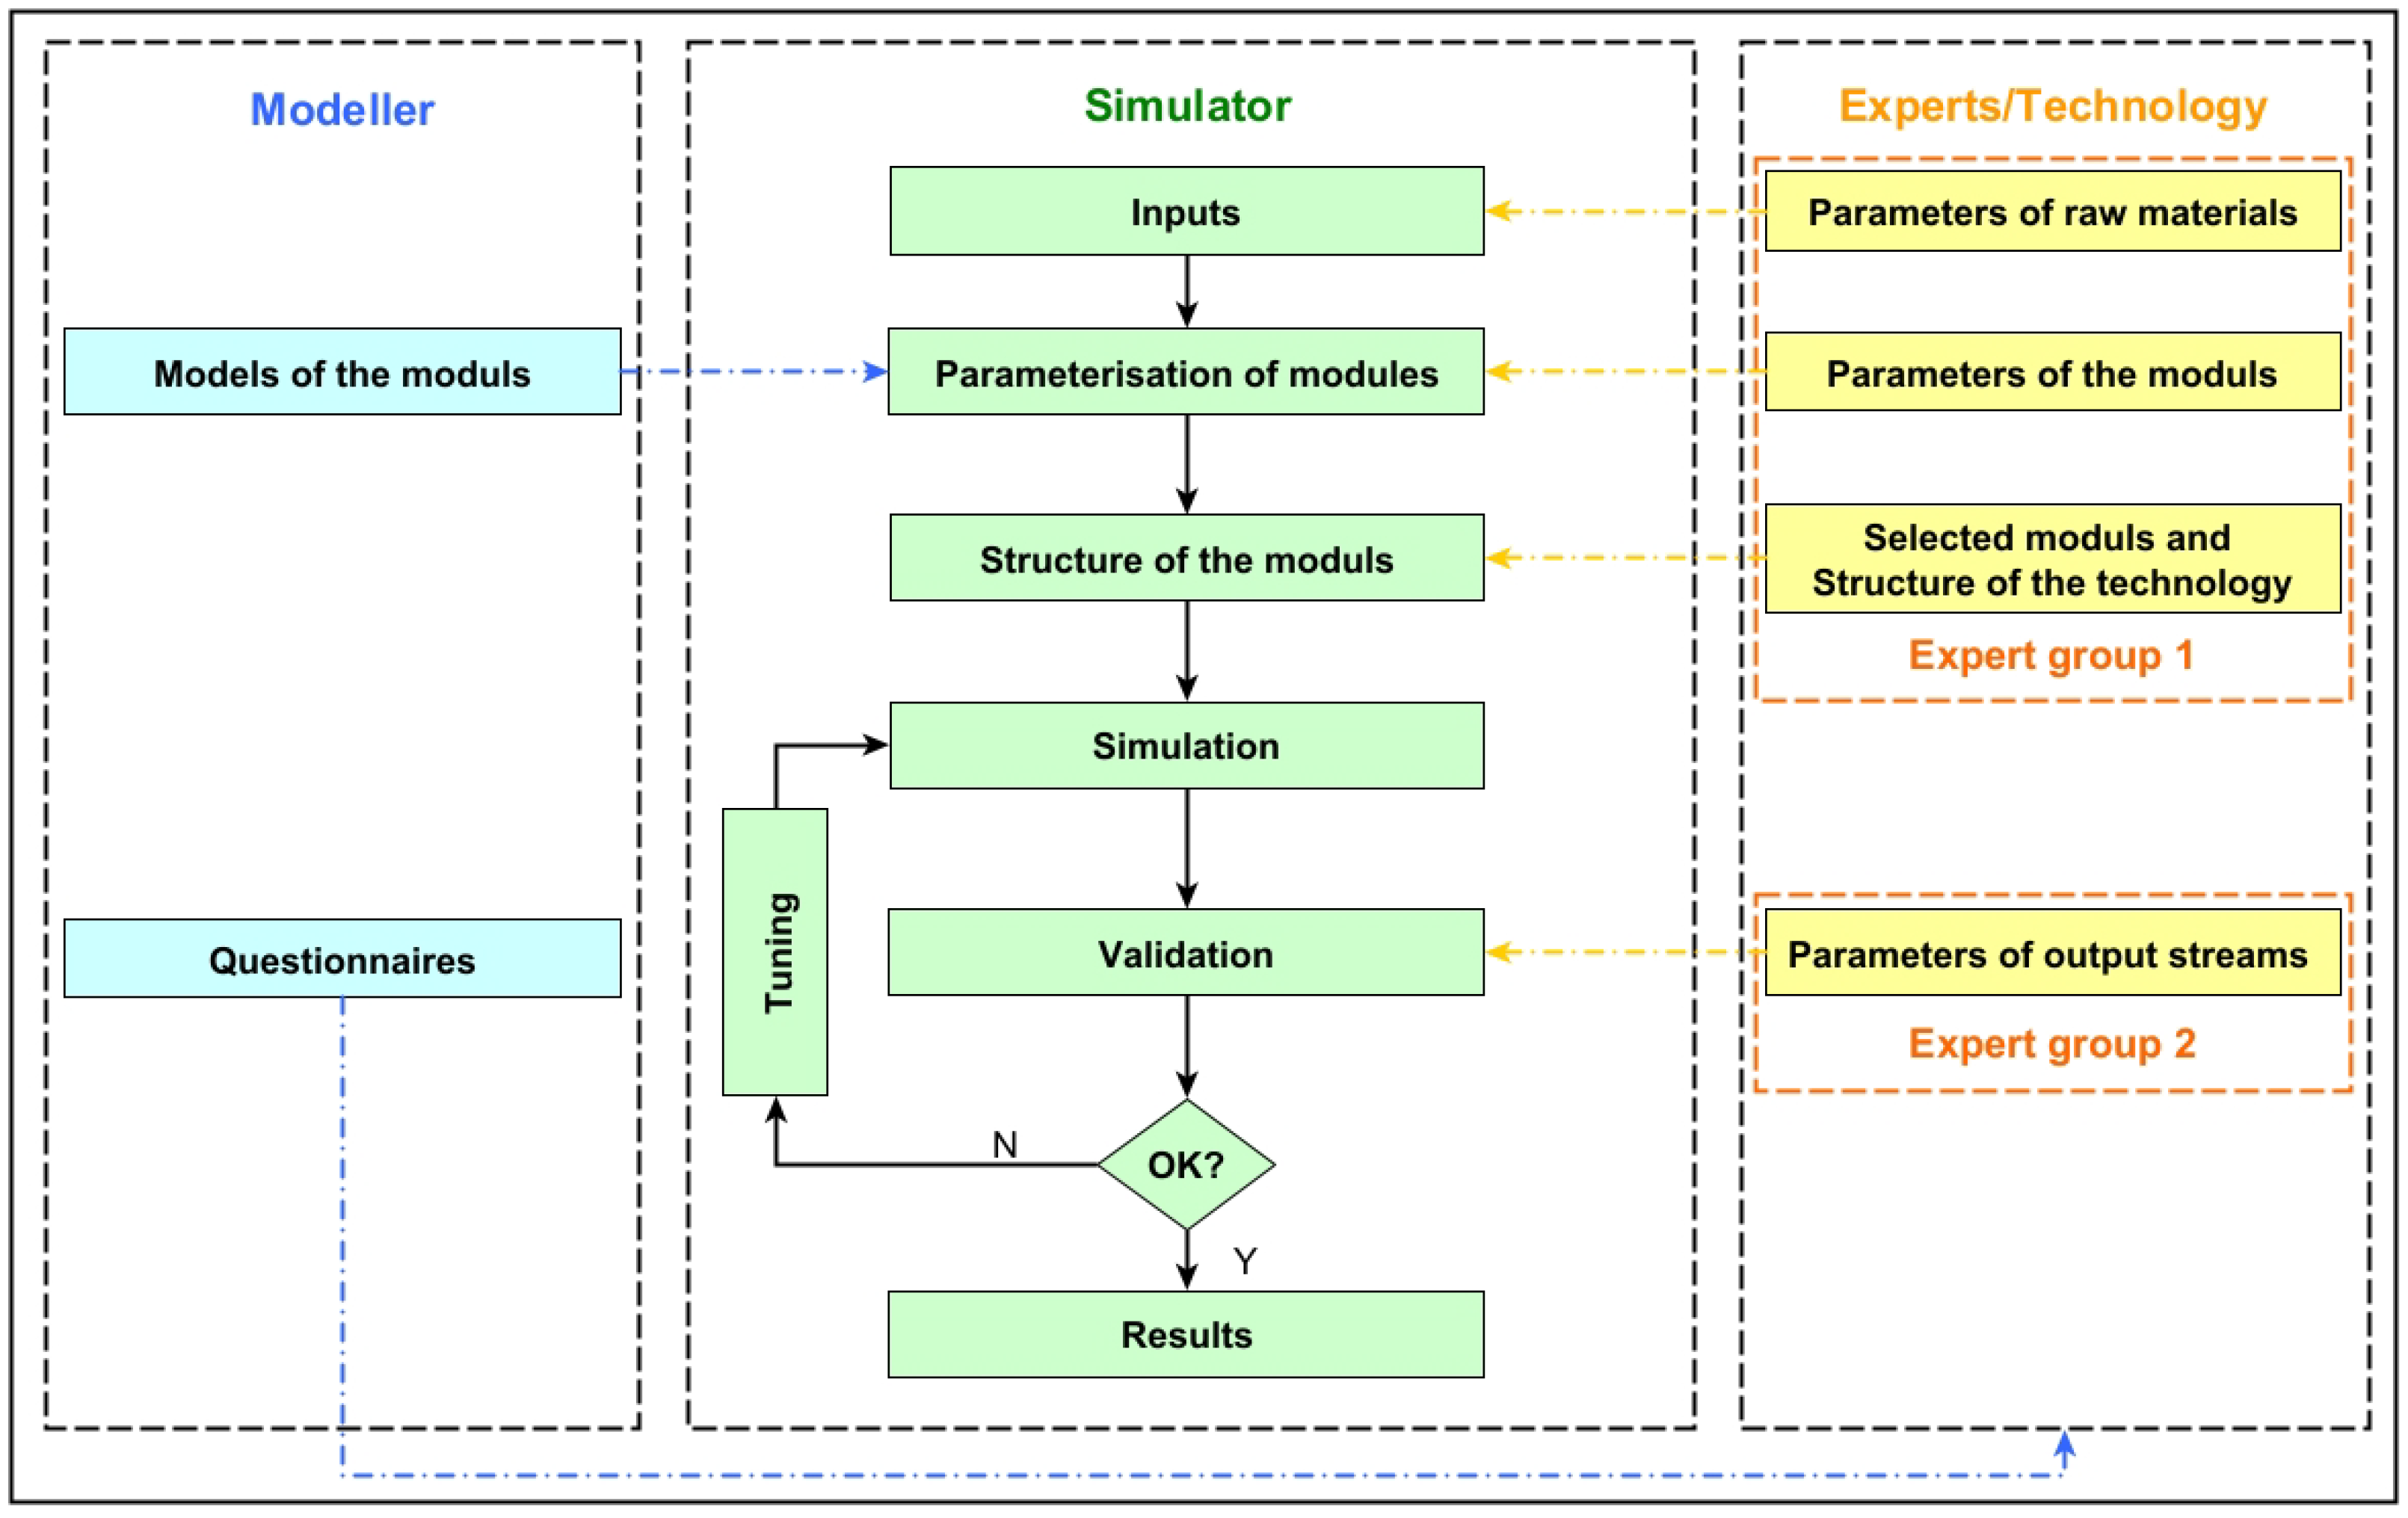
Figure 1 represents the connections in the developed modelling and simulation framework. The information is mainly based on operational experience or expert knowledge; it can be seen in Experts/Technology box. In the Simulator box is the algorithm of simulation. The first step is the definition of the inputs, this information, the parameters of raw materials, the possible types of equipment, the parameters of the pieces of equipment, and the possible structure of pieces of equipment, coming from the technology or experts. These are discussed in detail in Section 2.1. The second step of the simulation is the definition of applied types of equipment; the models and model parameters of the pieces of equipment, and information comes from the modeller (see Modeller box). The applied model is described in detail in Section 2.2. After that, the following step is the generation of the structure of pieces of equipment, which is the definition of a simulated sorting line. Then, it can run the simulation and obtain the parameters of output streams.
A fundamental cornerstone of a good model is the definition of adequate model parameters. Ideally, appropriate measurements are needed to determine these parameters. This is the most difficult task for the technologies presented here, as either no measurements are taken or, even if they are, they may not be appropriate. Therefore, we can rely on operational experience and expert knowledge. It is, therefore, worth thinking about domain logic, which covers the potential operating range. Section 2.3 describes in detail how Monte Carlo simulation can be used to reduce uncertainty due to a lack of measurements. The most critical step during the modelling and simulation is the validation by experts in the developed method. It is crucial to note that the experts who provide the input data for modelling and those who provide the data for validation are ideally independent. In our case study, we worked with two independent (both physically and temporally) groups of experts with this criterion in mind. The applied validation technique is described in detail also in Section 2.3.
2.1. Definition of Modules of the Waste Sorting Technology
The waste treatment technologies consist of well-defined steps, within which the order of equipment may vary depending on the target.
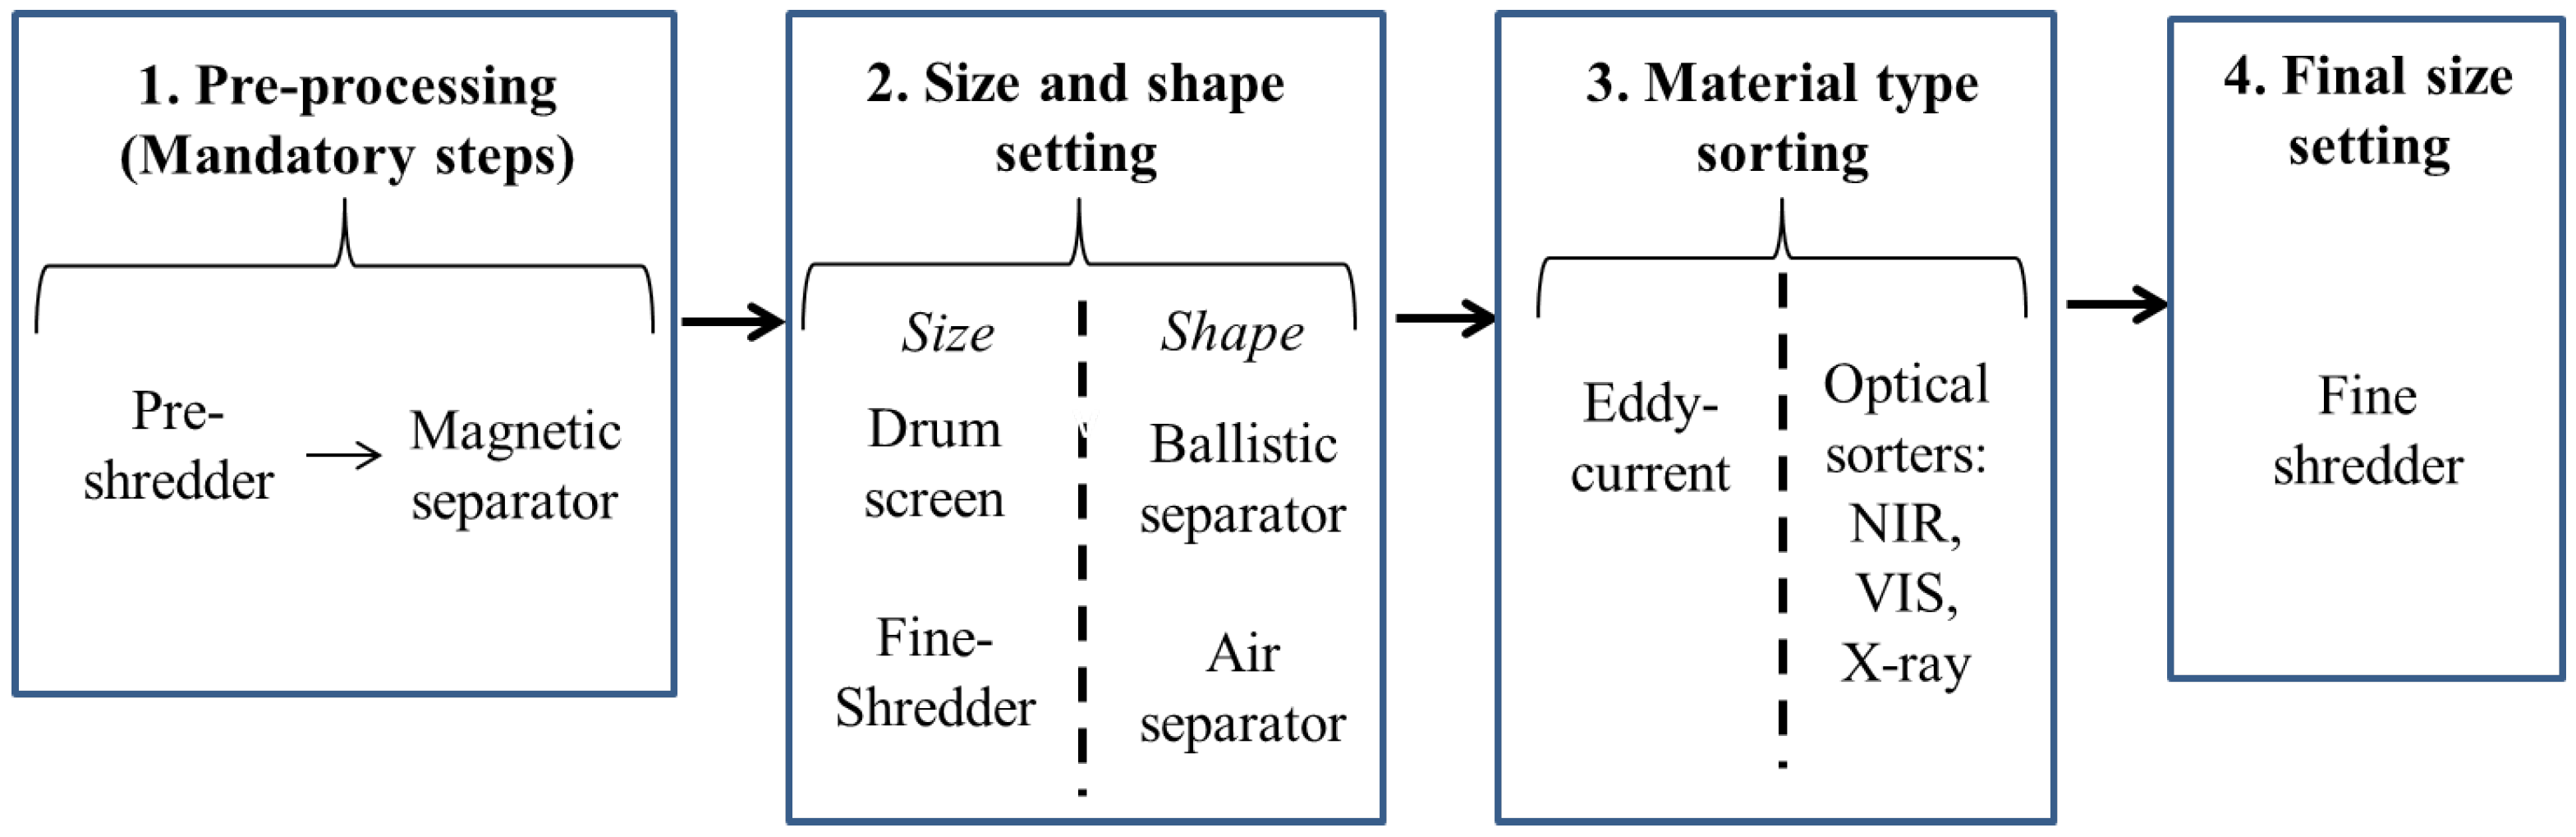
There are four technological steps:
- Pre-processing;
- Size and shape setting;
- Material type sorting;
- Final size setting.
Figure 2 presents the typical technological steps with the typical waste treatment machines applied in waste treatment technologies. The first step is mandatory in all waste treatment technologies. The other steps are arbitrary depending on the final goal of the sorter technology. Pre-processing typically contains a pre-shredder [14] and a magnetic separator [8], whose main task is to protect subsequent machines by achieving the proper particle size and removing iron-containing parts. The order of devices in step one is determined as shown in Figure 2. The second step is the setting of the size and shape. Typical size setting machines are the drum screens [15] and fine shredders [16], while the typical shape setting machines are the ballistic separators [17] and different air separators [18]. The order of the machines in this step is arbitrary according to the goal.
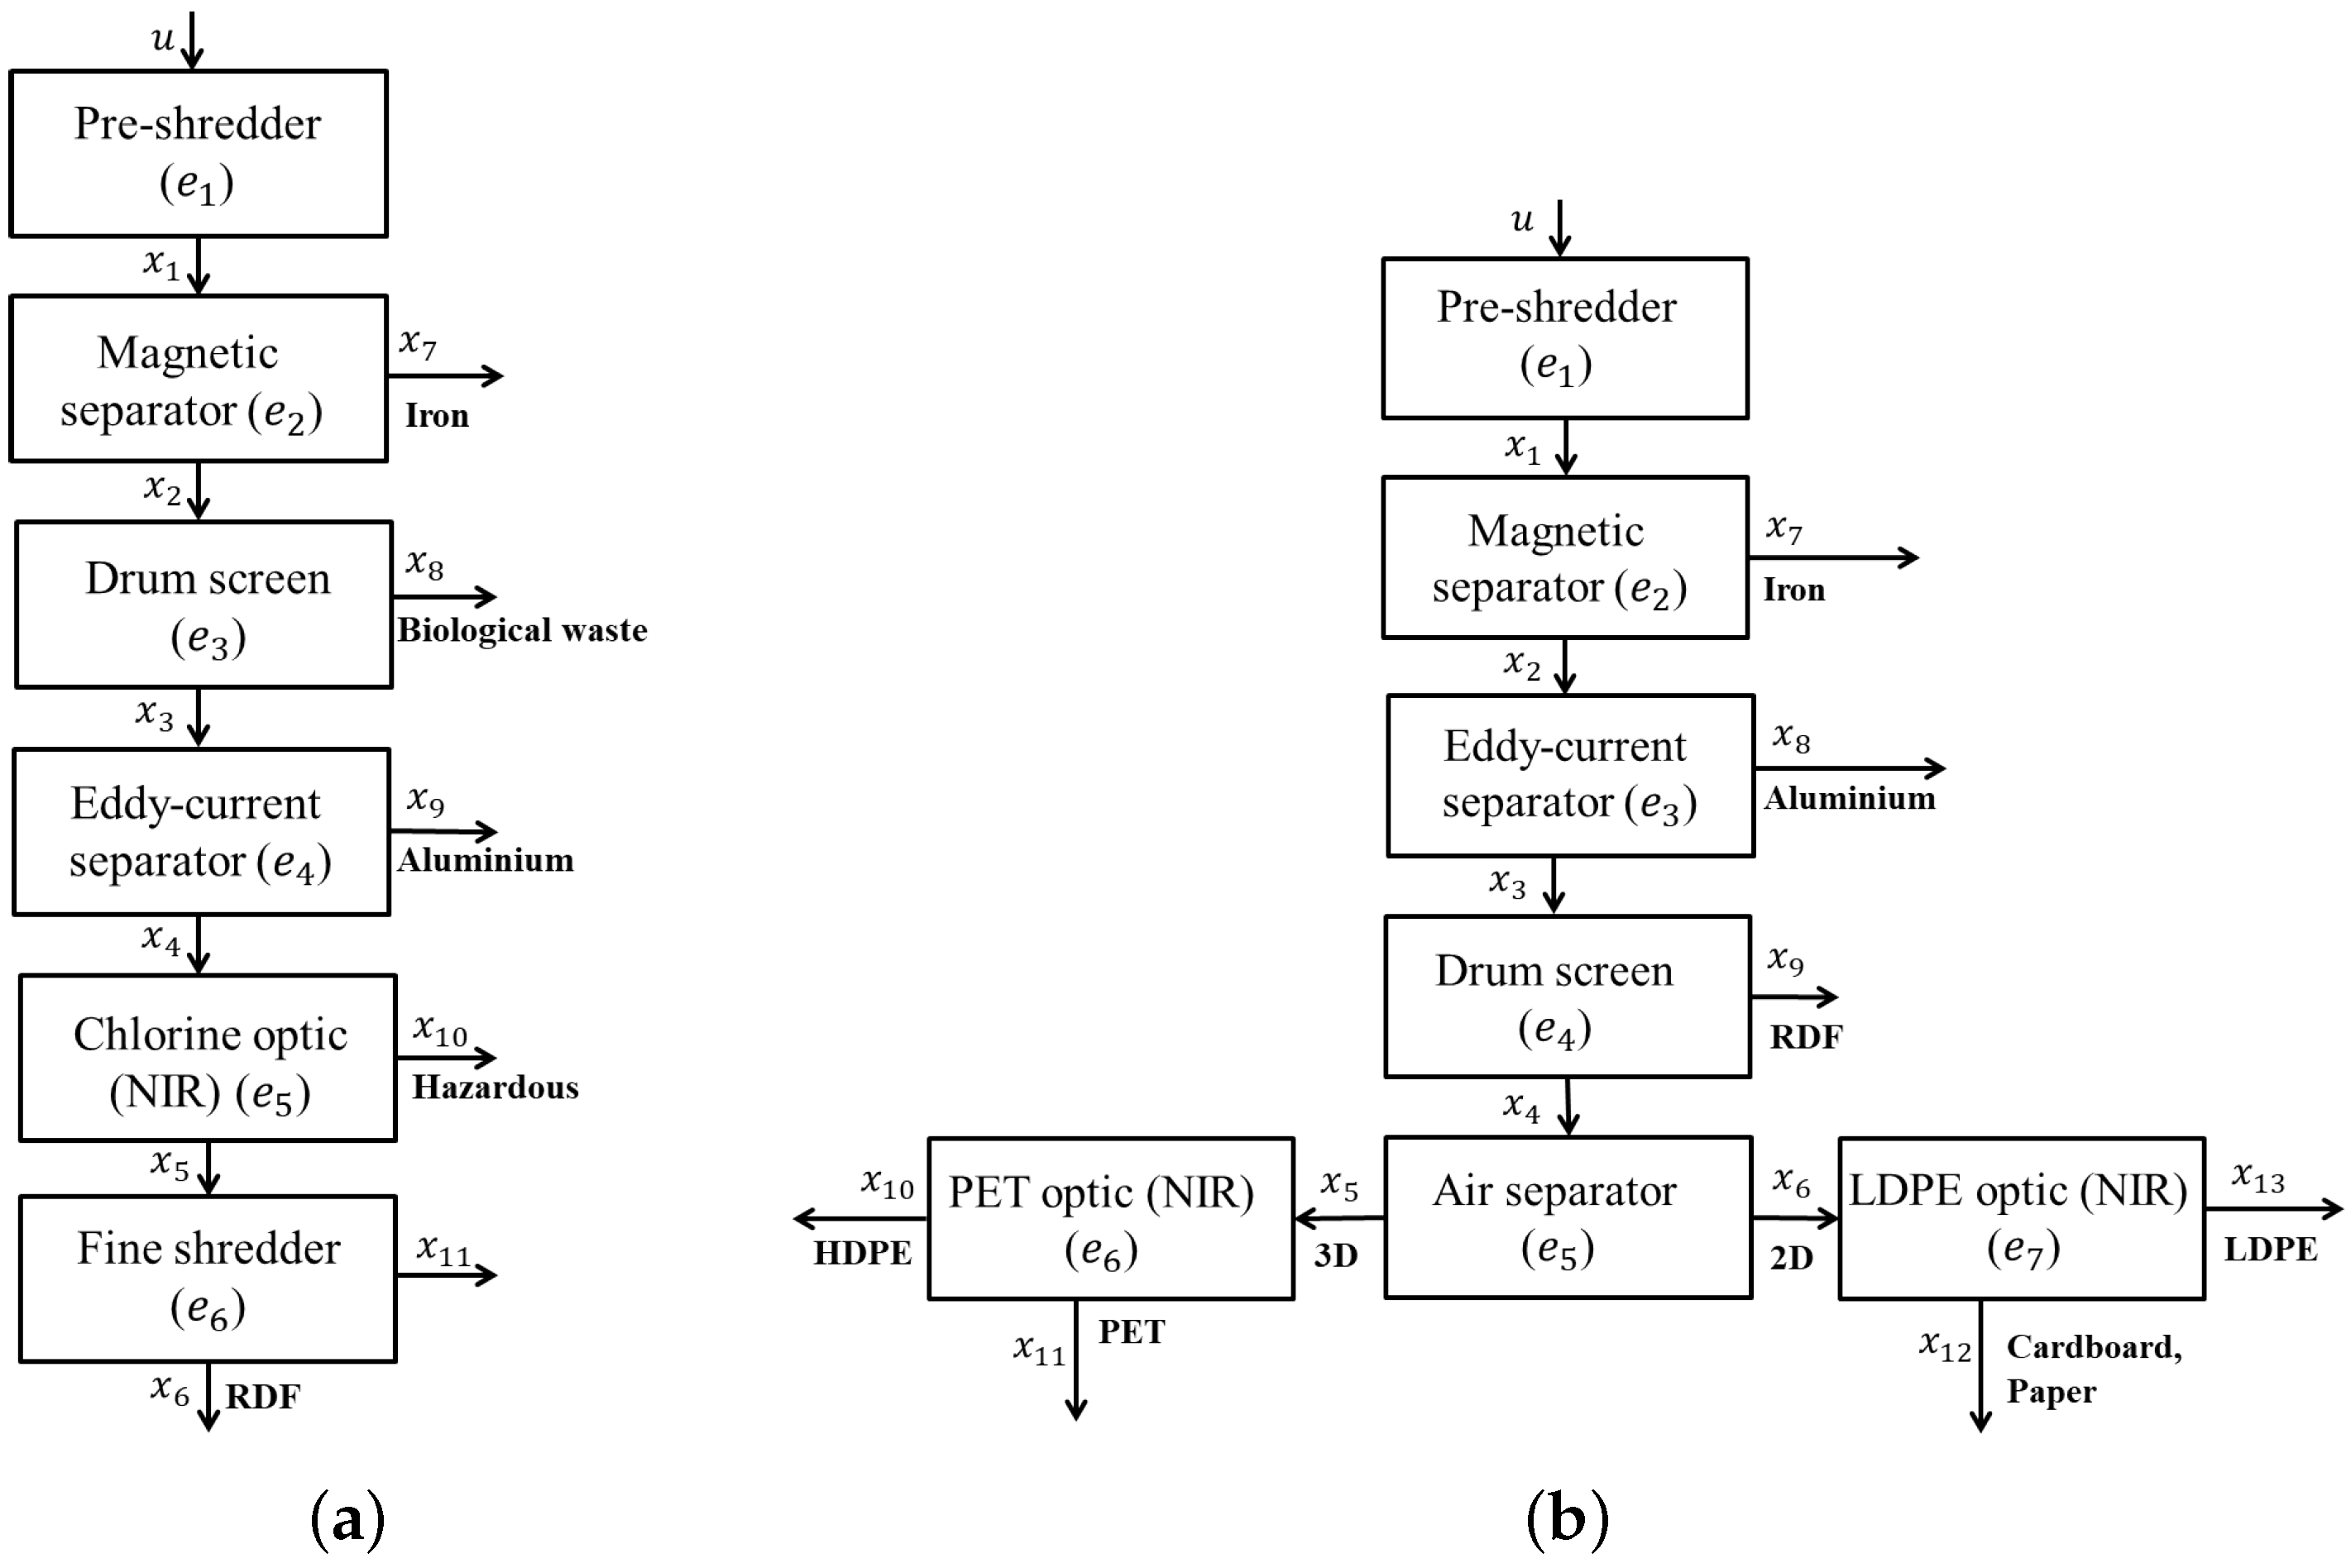
Figure 3 shows two alternative solutions for sorting different waste inputs for different purposes. Figure 3a represents the technological scheme of RDF production from municipal solid waste. In contrast, Figure 3b represents the technological scheme of separating the content of a selective mixed bin without glass. The notations used in the figures are described in detail in Section 2.2. These examples show that the first two units (pre-shredder and magnetic separator) are the same in both technologies. Still, the order of the drum screen and eddy current separator is different. In the third step, the material type is sorted. In this step can be sorted the non-ferrous metals from the material flow with eddy-current [19], and different optical sorters can sort the different kinds of materials. As the above examples (Figure 3a,b) show, the optics used in the two technology lines are suitable for different materials. Optical separators are working in different spectra [20]: (1) Near-Infrared (NIR) separates by material quality (e.g. plastics); (2) Visible range (VIS) is used to separate according to the colour, usually for the same kind of plastic; (3) Roentgen spectrum (X-ray) is used for biodegradables/inert separation. The purpose is to separate materials for recycling or to reduce impurities in the recyclables.
The sorting machines can be characterised according to their efficiency and effectiveness. In developing the model, the equipment were characterised in this way.
2.2. General Model of Modules and the Model of Relationships
The calculation of the mass flow of the components in the waste stream is based on the mass conservation and the separation efficiency of the equipment. Furthermore, we assume that the sorting technology operates in a continuous and steady-state mode during the modelling and simulation. We assume that input waste enters the sorting technology only at one point. In the sorting technologies, there are one output and two output machines. Typical units with one output are the shredders and bag openers. The units with two outputs can be divided into two groups. One group includes units that select by size, for example, drum screens. The other group contains units that separate by material quality, for example, magnetic separators.
In the proposed model approach, a discrete-time state-space model was applied to calculate the mass flows of the components in the technology. The model equations were solved separately for each element.
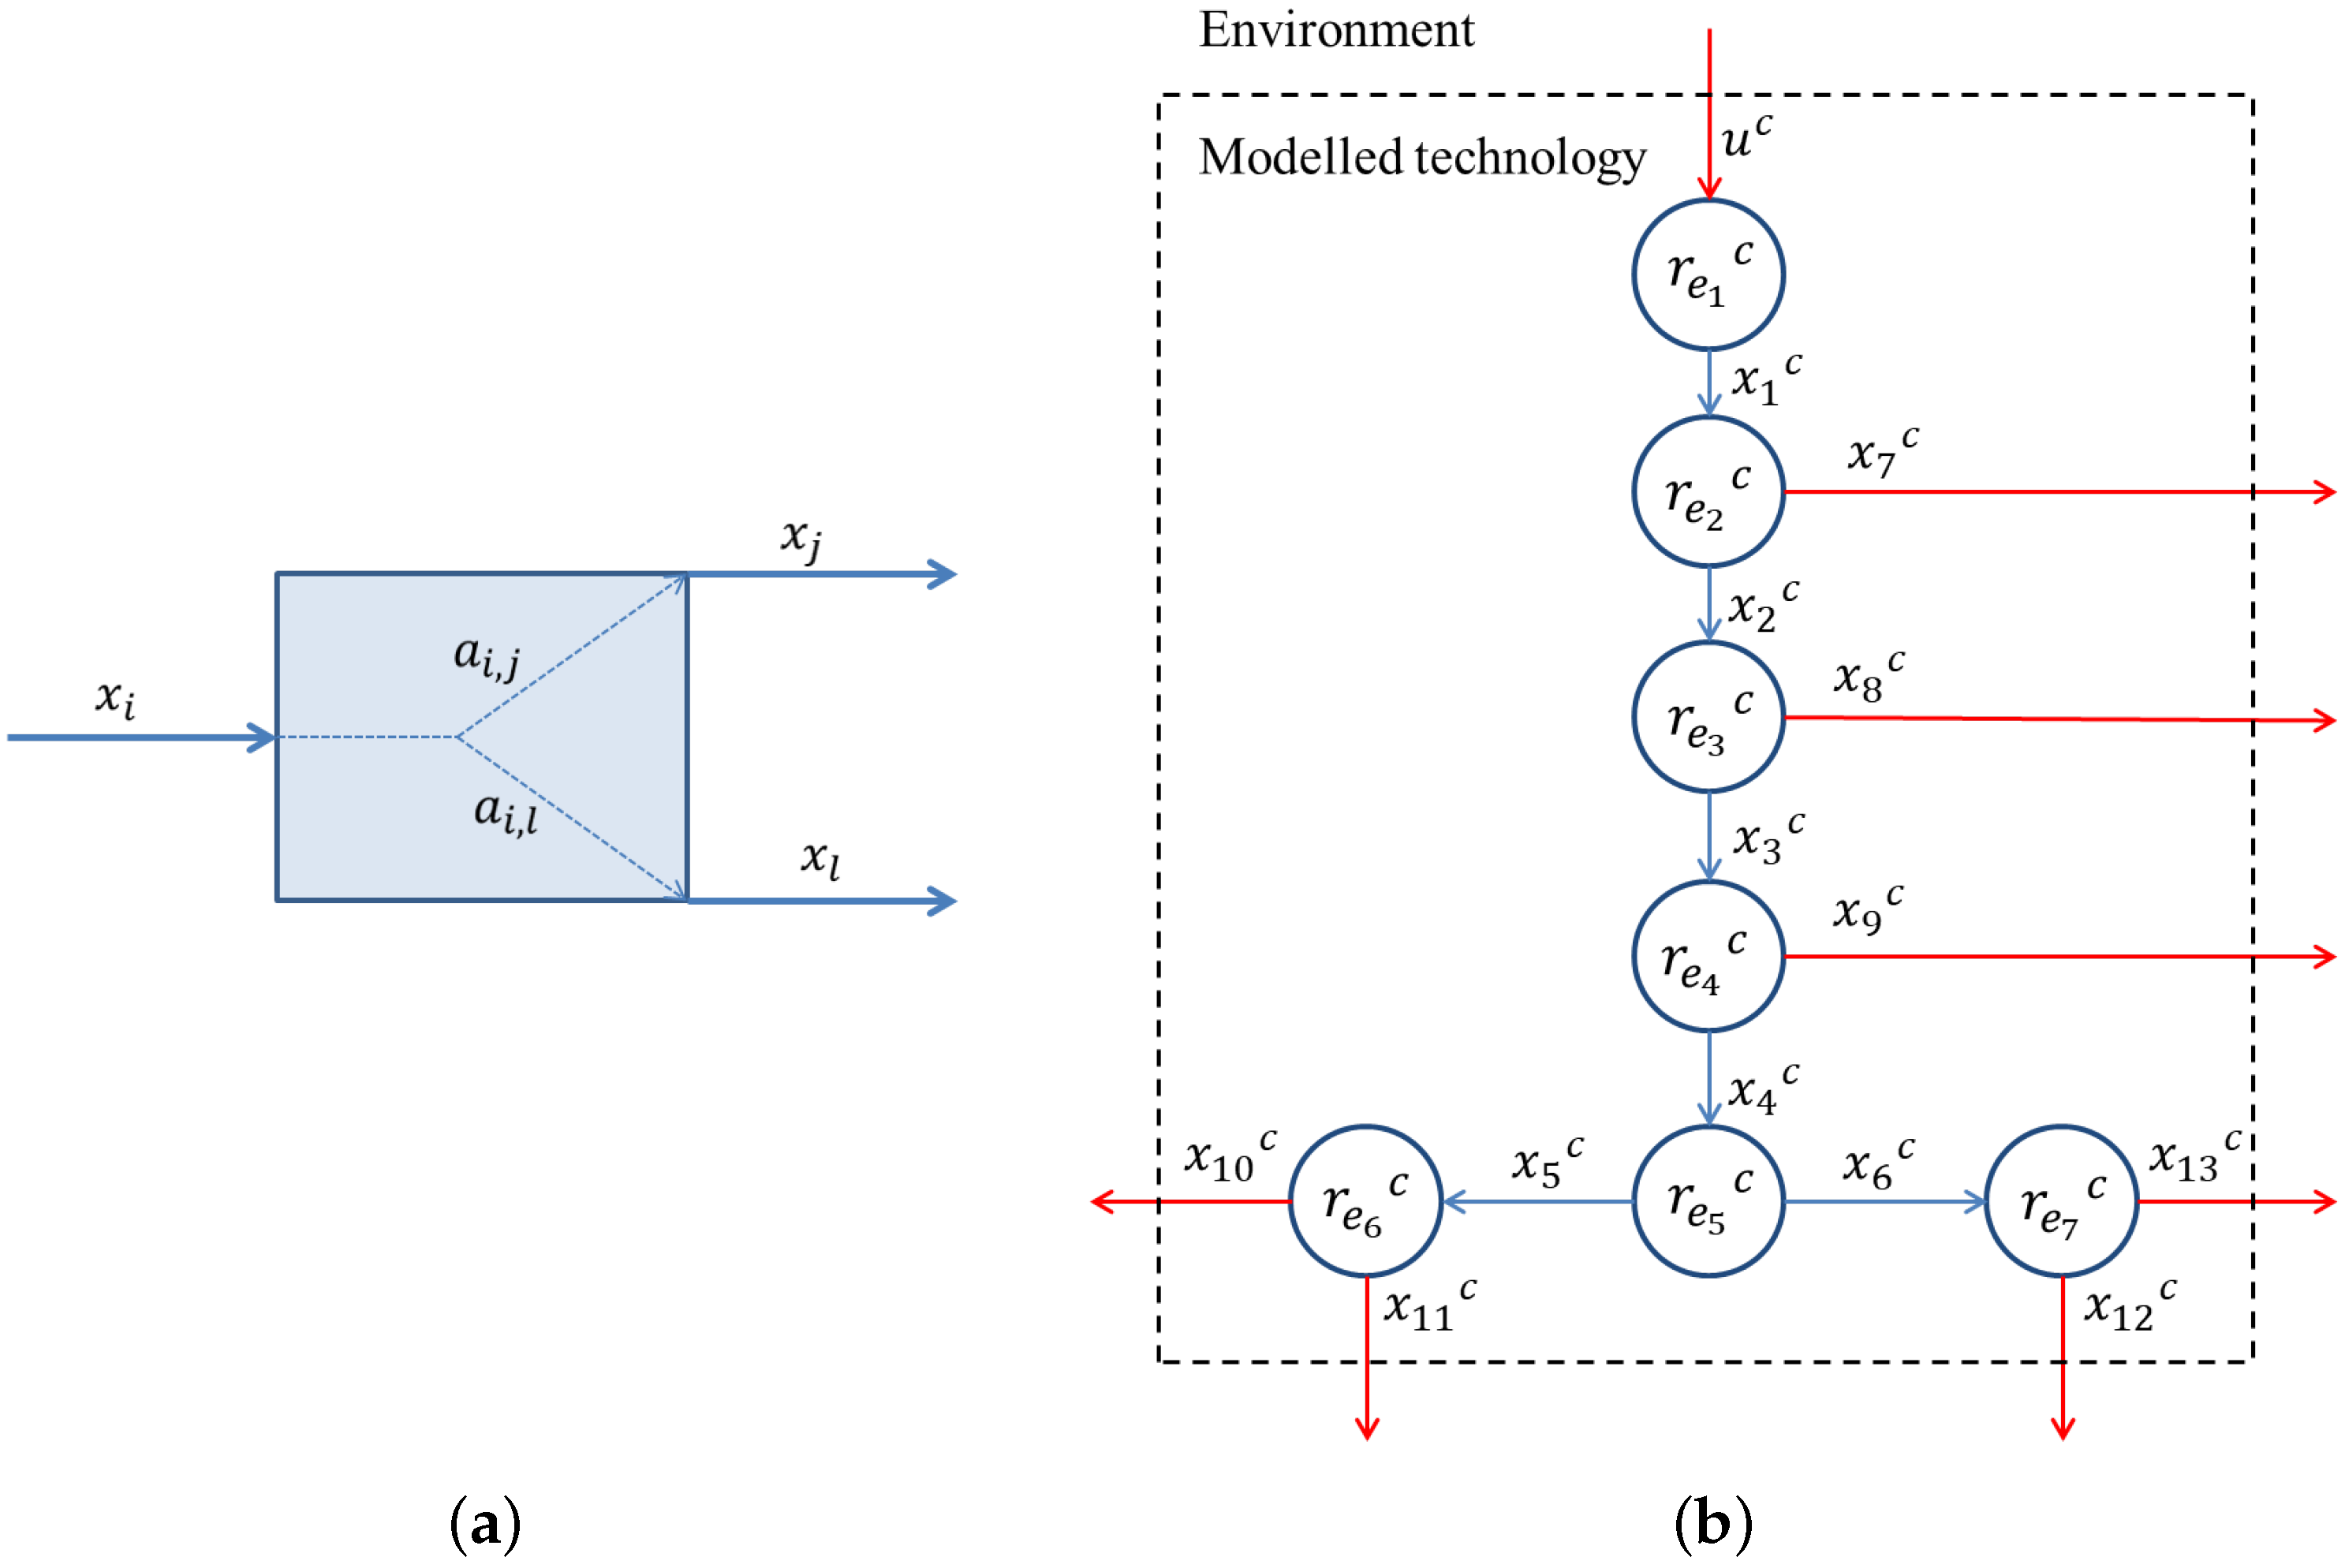
Figure 4a presents the schematic figure of an equipment in waste treatment technology. The applied notations in Figure 4a are the following:
- :
- denotes the mass flow of waste streams connected to the m-th equipment, , where n is the number of technological streams.
- :
- gives the proportion of the mass flow of the components in the inlet stream that goes from the i-th stream to the j-th stream, , where n is the number of technological streams.
Figure 4b shows the relationship of the equipment for the technology shown in Figure 3b. In Figure 4b, red arrows indicate streams leaving the technology, which is directed to the environment or a location not relevant for modelling. Blue arrows represent streams between physical equipment.
The applied notations in Figure 4b are the following:
- :
- denotes the index of equipment, , where N is the number of equipment.
- :
- denotes the separation efficiency of m-th equipment. This efficiency shall be given per equipment and component.
- u:
- denotes the mass flow of inlet waste stream.
- c:
- represents the components in the waste streams, , where C is the number of components.
From the above descriptions, it can be seen that there is a clear relationship between the variables , , and , as given by the following relations: and .
In waste sorting technologies, measurements are typically made at discrete times; therefore, a discrete-time state-space model was applied in the mathematical description. In the model, k and are the discrete times, with time step between them. The applied discrete-time state-space model for the technology is
where
- k:
- represents the discrete time.
- x(k):
- a vector that contains the mass flow of component c in each stream at time k:
- :
- a matrix that contains for component c in each stream (). The columns and rows of the matrix represent the streams. The first column and the first row represent the input stream, i.e., u. The matrix elements are zeros, if the streams are not in connection with each other.
- :
- a vector whose non-negative elements represent the input streams
The structure of matrix for the technology shown in Figure 4b. because the ratio of stream goes further into stream . The ratio of stream goes further into stream according to .
In the next subsection, we will discuss the limitations of the presented model and propose a solution to the problem.
2.3. Monte Carlo Simulation and Expert-Based Model Validation
The model presented above gives a valid result if the definition of the separation efficiency of each piece of equipment () is correct, which is the basis of our model.
Ideally, the definition of model parameters would be based on appropriate measurements. However, in the technologies under investigation, as has been pointed out several times, either no measurements are available or inadequate ones are available in most cases. Therefore, in many cases, we can only rely on operational experience and expert knowledge. We have developed a method to manage the involvement of experts (Figure 1). The following points are crucial for the role of experts in the method: (1) Definition of blocks/modules, formation of equipment groups; (2) collecting information on typical ratios/separation ratios; (3) generation of structures (mapping of existing technology, as appropriate, in the case of existing technologies); (4) definition of input current ranges (in case of existing technologies, inputs of existing technology as appropriate); (5) based on these, asking the experts what they think the output current will be (in case of existing technology, the plant managers will evaluate, even by reviewing the calculated data).
Experts can be asked for the necessary parameters through questionnaires for input and output data. Ensuring independence when requesting input data and output data is critical. It is therefore advisable to work with separate expert groups (in Figure 1, these can be seen as Expert group 1 and Expert group 2) in the modelling and validation phase. In the modelling phase, expert group members commented separately on specific equipment and equipment types. They predicted min-max values of the expected separation ratios based on their inputs and outputs. In the validation phase, another group of experts gave the interval of expected output currents (max-min) based on a given structure.
Another difficulty in working with experts is that there are so little data and uncertain knowledge that, although we had intended to explore a more detailed distribution, the experts felt more confident in defining only the min and max values. So, we transform these intervals into uniform distributions, which become the inputs to MC, which we can use to detect incongruence, etc. We can also aggregate the separate evaluations and create distributions based on that.
Consequently, it is crucial to work with experts with more operational experience. The experts used for validation should preferably be independent of those used for setting the model parameters. Preferably, several independent experts should be involved to better ensure that bias is avoided. The data series used in the validation should be temporally separated from other data series. It would benefit from mixing the experts.
Since experts usually define intervals for each model parameter. The interval can represent uncertainty but it can also represent variabilities, such as different raw materials, different separation efficiencies, or different operating modes [21]. The advantage of this method is that we can immediately see the effect of uncertainty on the output streams in the simulator. This can then be compared, and sensitivity analysis can be carried out on the effect of these parameters. The example presented in Section 3 will highlight this.
In the case study, the boundaries of the separation efficiencies of pieces of equipment reflect the prior knowledge of the experts. These values are assumed to be uniformly distributed within the given intervals, i.e.,
Independent simulations (MC simulation) were run in which the separation efficiencies for each equipment were determined by random number generation on the intervals given by Equation (2). Suppose it is possible to collect data from more experts. In that case, the distributions from each expert with uniform distribution can be aggregated, and the resulting aggregated distribution can be used to generate a random number for the separation efficiencies during the MC simulation. The two-sample Kolmogorov–Smirnov (K-S) test is used to determine the minimum number of MC simulations required to ensure that the resulting distribution is independent of the number of simulations. The two-sample K–S test is one of the most valuable and general nonparametric methods for comparing two samples, as it is sensitive to differences in both the location and shape of the empirical cumulative distribution functions of the two samples. The K-S test was performed by running a large number of runs, and for each of these, the number of elements used for the test was increased continuously. In the first step, we compared the results of 100 runs with 1100 runs and found a significant difference. Then, we compared the results of 1000 runs with the results of 2000 runs, and even here we found a difference. When comparing the results of 3000 runs with 4000 runs, we found identical results. So, we chose the 3000 cycle number for the tests.
An example of this case is presented in Section 3. In a single simulation, the steady-state model is solved, within the generated -s are constant.
The validation of the model is a significant difficulty too, because the waste treatment technologies are not well measured. Therefore, again, we can only rely on experts’ experiences. As in the case of equipment characterisation, experts can define only intervals. Further, assuming a uniform distribution and if aggregating the intervals given by each expert, we obtain a probability distribution of the results:
where F is the aggregated probability density function; z could be the separation efficiencies of the equipment (r) and the mass flows (x); , is the number of experts; and and are the maximum and minimum values of the interval given by i-th expert, respectively. The model validation aims to compare the MC simulation results with these aggregate distributions. This comparison can be performed numerically, and possibly it can be further refined with importance sampling.
In the next section, the technology used in the case study, simulation results, and model validation based on industrial data are presented in detail.
3. Application of the Concept to a Real Hungarian Waste Sorting Technology
We modelled an accurate Hungarian waste processing plant technological scheme in our case study. The Kökény Regional Waste Treatment Centre is a modern, complex waste treatment plant that meets national and European standards. The sorting plant accepts waste from the selective collection of household, public and institutional, and selective waste collected from waste depots.
The composition of the incoming waste stream used for modelling corresponds to the analysis of the waste sorting plant in Kökény. The first step in the analysis was representative sampling, i.e., a defined sample amount. The sample was sorted by hand into defined components, and finally, the weight composition of the feed stock was obtained by weighing the amount of each type of component.
The key parameter for modelling is the definition of the separation efficiencies of the equipment () in the technologies. According to industry experts, industry experiences, and performance specifications from sorting equipment builders, the efficiencies of the sorting machines for the waste components were defined.
The results calculated with the model were also validated by experts in the field of waste sorting. Some experts are involved in equipment design and maintenance, and the others are waste sorting plant managers.
3.1. Technological Information and Expert Knowledge
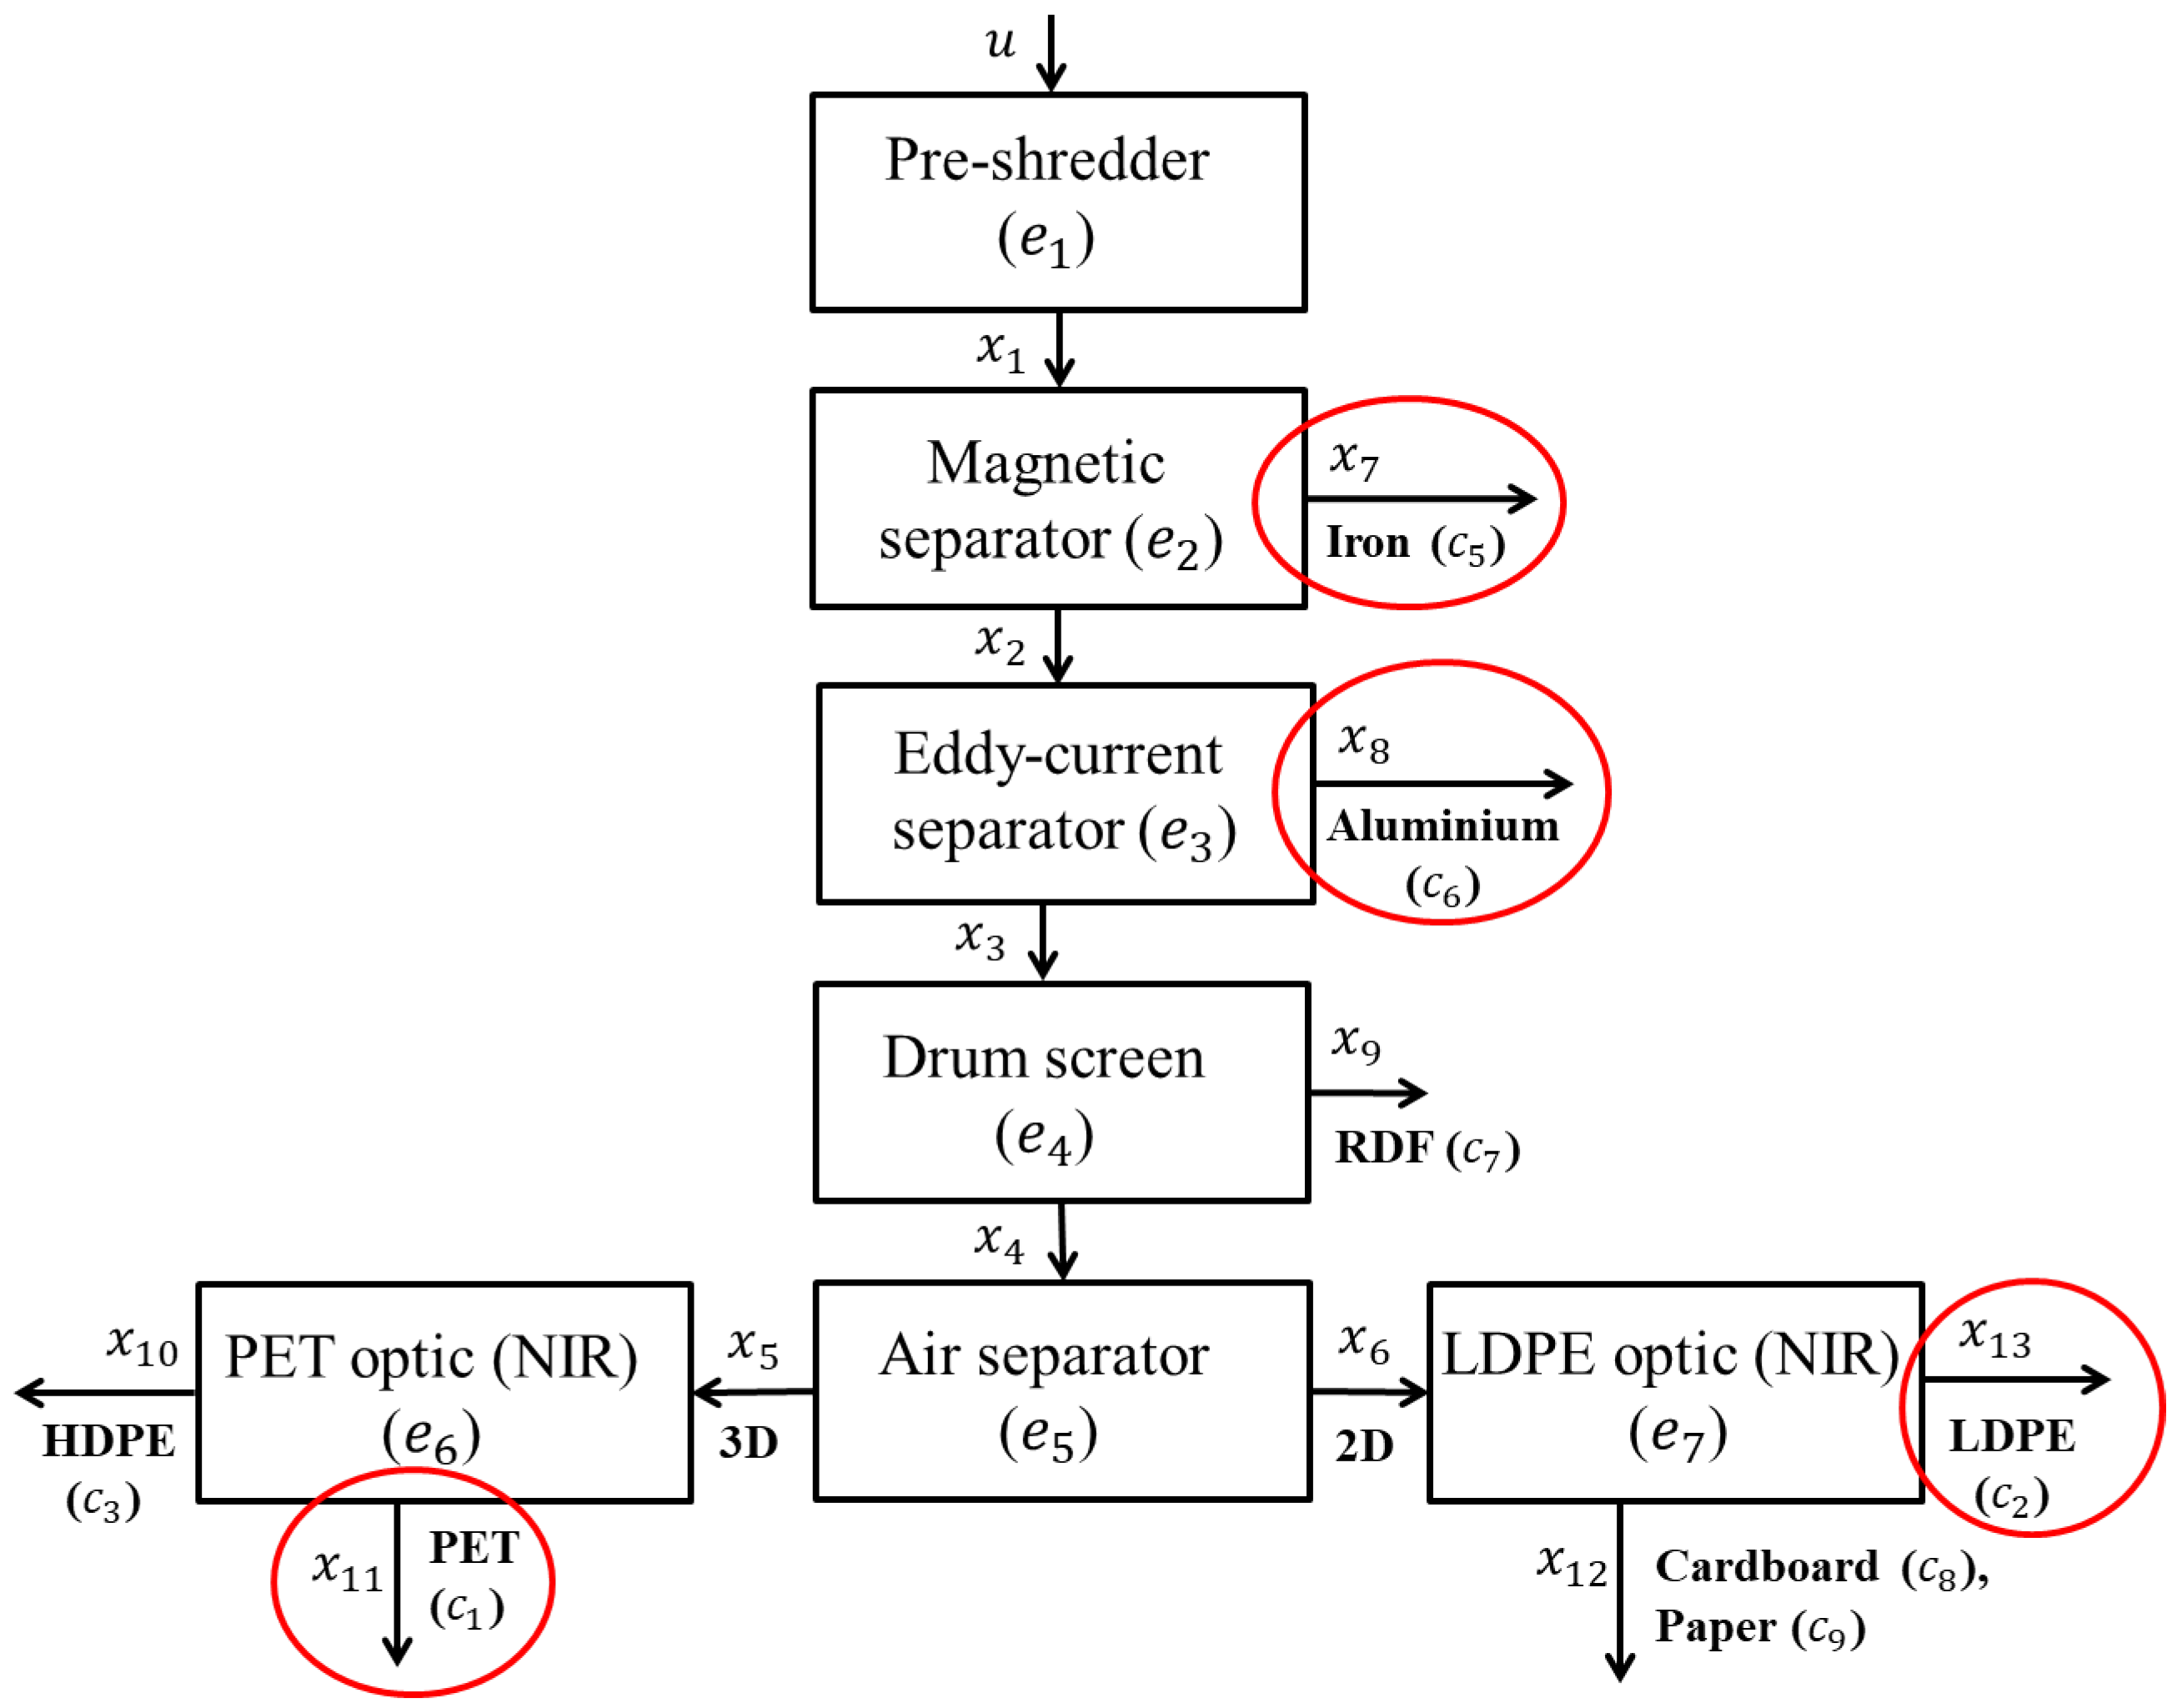
The technological scheme of the modelled waste treatment plant is presented in Figure 3b. The collected waste stream (u) enters into a pre-shredder (). has one output stream (), which differs from u only in size distribution. The second unit is a magnetic separator (). The task of this device is to separate the magnetisable metals. This is very important to protect machines from damage. The magnetic separator has two outputs, and . contains magnetic metals, and includes all other components of . The third unit is an eddy current separator (). In this unit, the non-magnetisable metals are removed. It has two outputs, and . contains non-magnetisable metals. The fourth unit is a drum sieve () with two outputs, and . This equipment separates most of the RDF component in stream . enters a ballistic separator () that separates the typically 2D () and 3D () components. Typically, 2D components are the LDPE, paper, and cardboard, while 3D components are the HDPE and PET. Three-dimensional components can separate from each other with a PET optic (NIR) (). contains PET, while contains HDPE. The other output of the ballistic separator () contains the 2D components. These components can separate with an LDPE optic (NIR) (). One of the outputs of this unit () includes the paper component, and the other output () is the LDPE component.
The input of the aforementioned technology is different kinds of plastics (PET, HDPE, LDPE), metals (iron and aluminium), cardboard, paper, and minimal amounts of hazardous waste, typically chlorine-containing materials. Furthermore, nearly 45% of the selectively collected waste is non-recyclable (RDF). The total mass of the input waste in the case study is 800 kg/h, and the applied weight percentage composition is shown in Table 1.
Data on separation efficiencies were collected from two experts. Table S1 contains the applied intervals of separation efficiencies () for the machines for all waste components according to Exp.1. For each piece of equipment, the ratios in the table represent the ratios for the lower number of streams. For example, for the magnetic separator, the value [0.05,0.08] in the table for iron means that 5–8% of the iron entering the equipment will pass in the stream. The same is true for the other equipment. The data provided by the experts were aggregated by equipment and component. These aggregated distributions were used in the MC simulation to generate random numbers of efficiencies for each unit.
An example of such an aggregate distribution is shown in Figure S1, which shows the uniform and aggregate distributions of the air separator’s separation efficiency on the cardboard component.
3.2. Model Validation
The invited experts—ideally, and this was of course the case in this particular case study—were independent of the experts who provided the parameters for the model and had to provide the amount of the specified components for the specified process streams. In other words, they had to define what percentage of a given component is present in a given stream with its number of the input stream.
In Figure 5, the streams and components for which the validation was performed are circled in red.
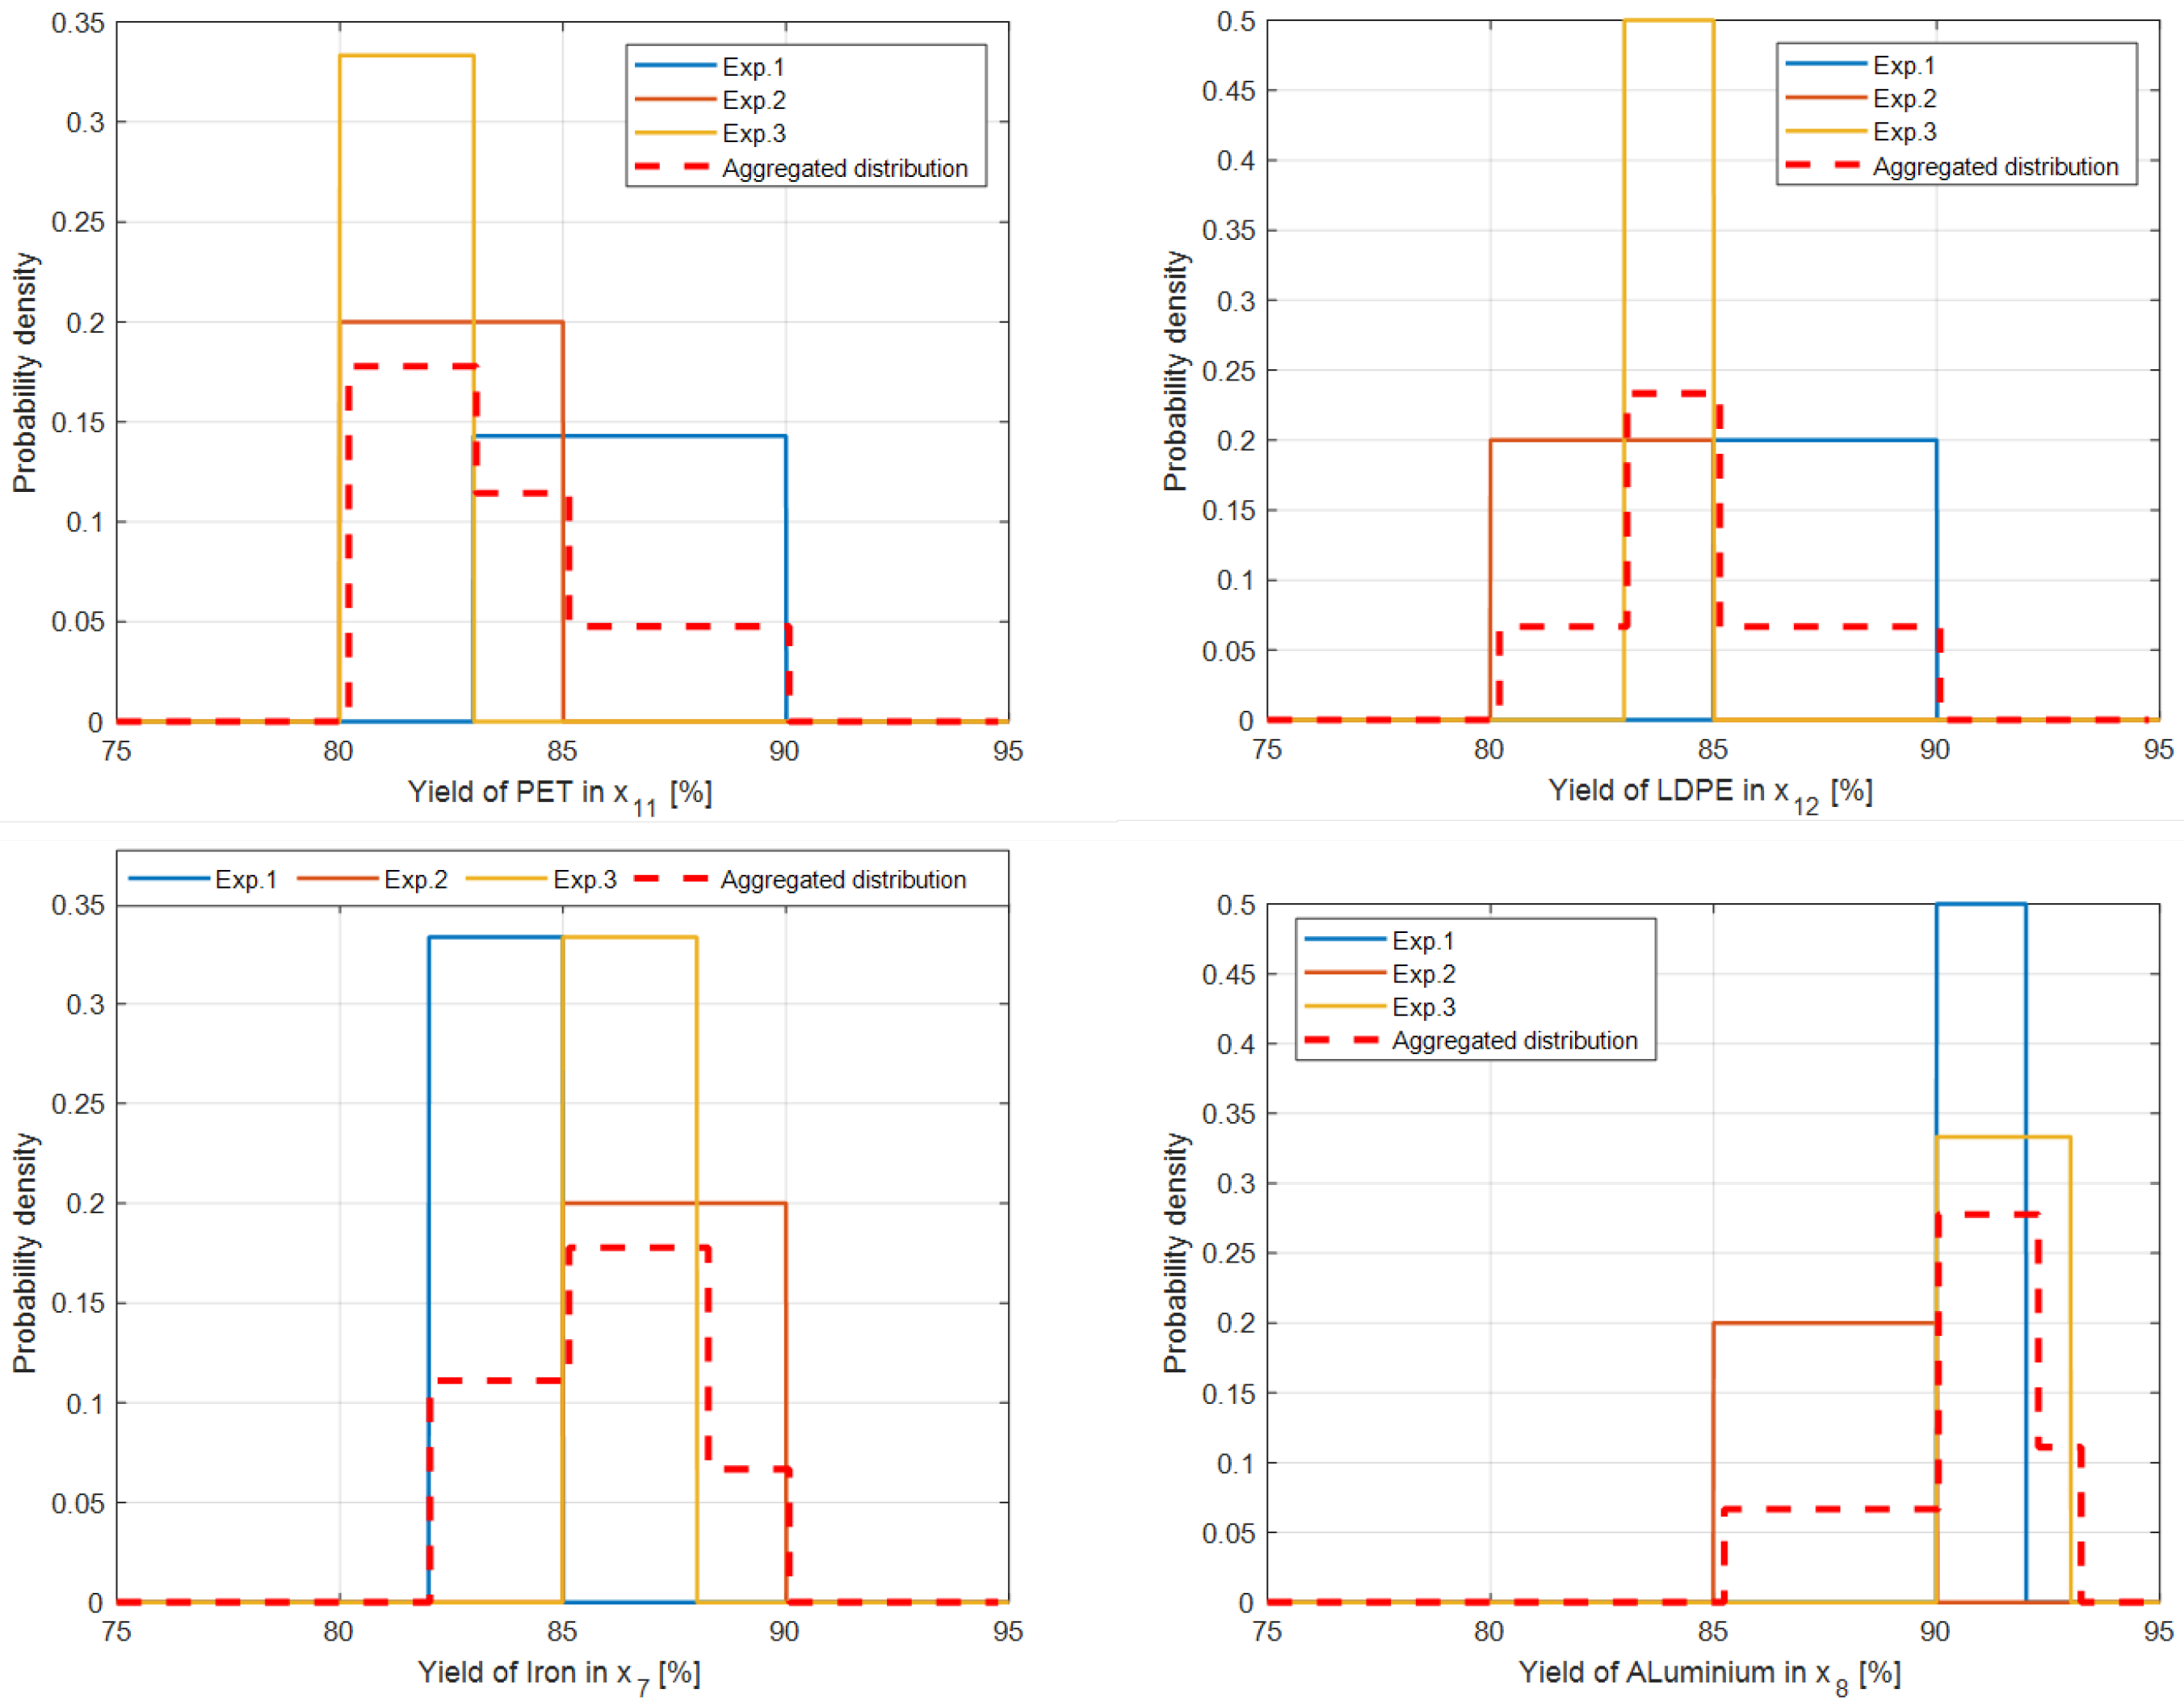
The following questions were asked by the experts: (1) Please define the outlet yield (compared to the inlet in mass percentage) of PET () in the PET-rich stream (). (2) Please define the outlet yield (compared to the inlet in mass percentage) of LDPE () in the LDPE-rich stream (). (3) Please define the outlet yield (compared to the inlet in mass percentage) of Iron () in the Iron-rich stream (). (4) Please define the outlet yield (compared to the inlet in mass percentage) of Aluminium () in the Aluminium-rich stream ().
The answers are given by the experts all contained an interval. Assuming a uniform distribution according to the lower and upper bounds of the intervals given by the experts (Table S2), the distributions shown in Figure 6 are the distributions according to each expert. Aggregating the three distributions, we obtain the distribution indicated by the red dashed line, which can be used later to tune the distribution of the parameters.
3.3. Results and Discussion
Since the simulation input is uncertain, MC simulation was applied. The two-sample Kolmogorov–Smirnov (K-S) test is used to determine the minimum number of MC simulations required to ensure that the resulting distribution is independent of the number of simulations. After running the test, it was found that a minimum of 3000 MC simulations are needed to obtain an independent result.
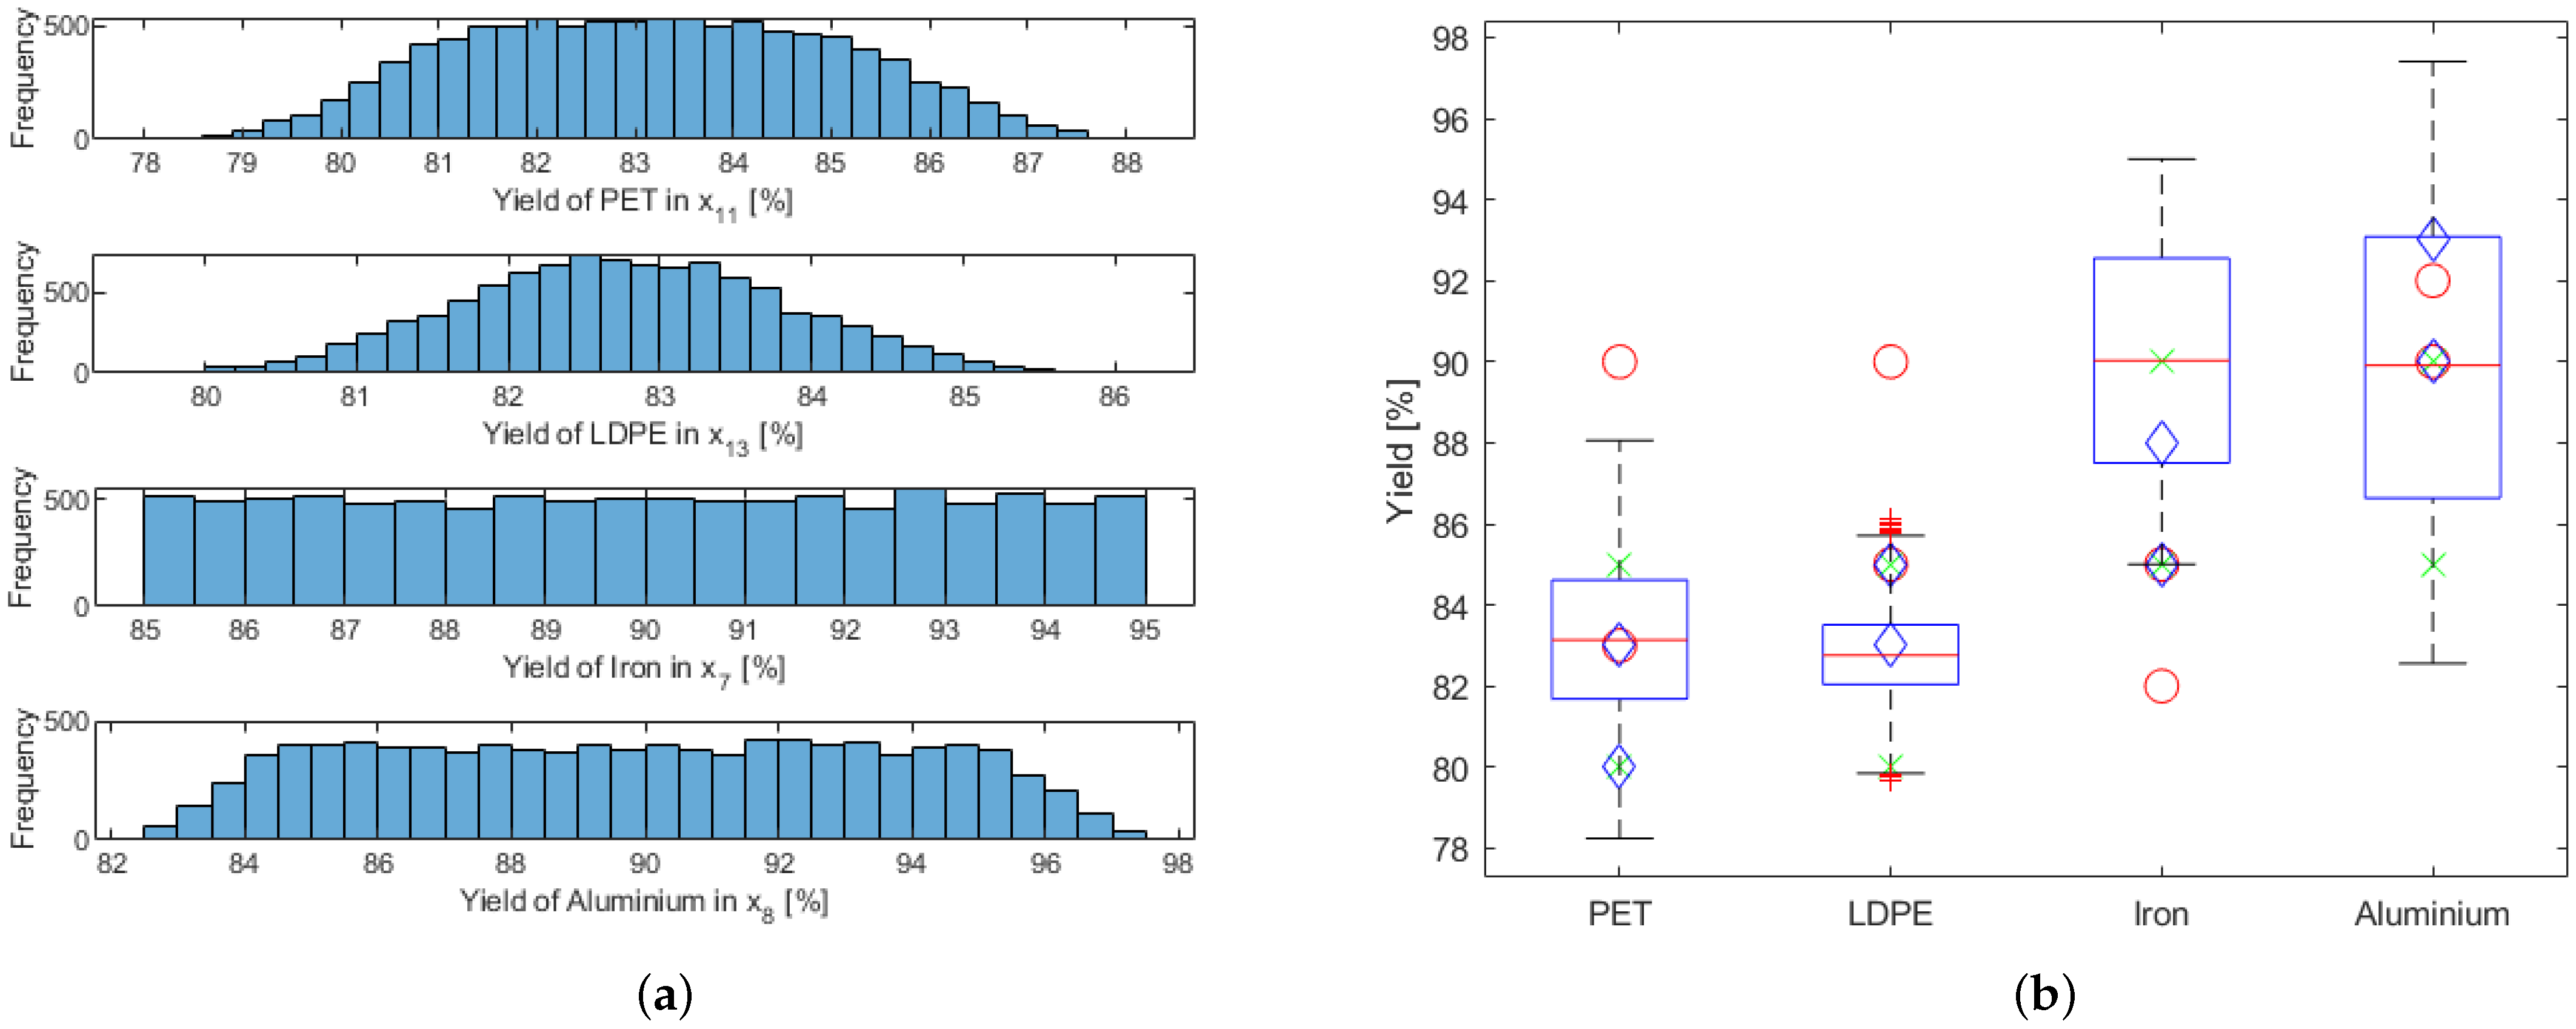
Figure S2 represents the result of the applied K-S test. A total 6000 MC simulations were run, and it was investigated after how many data points the test says the following data points no longer affect the distribution. It can be seen that after 2000 simulation points, the following 1000 simulation points result from a very similar distribution; however, the test still shows that 3000 MC simulations are needed. The Monte Carlo simulation results are normal distributions of component yields in specific technological streams (Figure 7a).
Figure 7a shows that the yields of Iron and Aluminium are not typical normal distributions. This is because these components leave the technology at the beginning of the process; so, the random number generation for the efficiency of the equipment does not have such a significant impact on them. In contrast, the yields of the PET and LDPE components show a typical normal distribution, as these components pass through all the equipment; thus, random number generation has a significant effect on them.
The results presented above are plotted together with the validation intervals given by the experts in Figure 7b. In each box, the middle mark represents the median, and the bottom and top edges of the box represent the 25th and 75th percentiles. The whiskers range up to the most extreme data points, which are not considered outliers, and the outliers are defined separately by the “+” symbol. The red o-marker, green x-marker, and blue diamond-marker represent the maximum and minimum values of the intervals given by Exp.1, Exp.2, and Exp.3, respectively. It can be seen that the median of the simulation results in all cases is in the intervals given by experts.
The above example shows that the method developed works. The essence of the method is to classify the elements in the technologies according to the elementary models described earlier.
4. Conclusions
Our work aimed to develop a simulator similar to the flow-sheeting simulators used in the chemical industry for waste treatment processes. This paper presented a modular simulator capable of simulating flow diagrams with different couplings. The results of this work can be grouped according to theoretical and application-oriented points of view.
From a modelling and theoretical point of view, this paper presented a novel application for integrating operational experience or expert knowledge with modelling. The applicability of the method was demonstrated through the example of a waste sorting technology. The main difficulty of waste treatment technologies is that they have very few measurements; so, the data that can be obtained from them have a high degree of uncertainty. The main parameter used for modelling is the efficiency of the units, which is determined based on expert information. Since the experts could only provide estimates, the data from them were approximated by uniform distribution, the data were aggregated, and these aggregated distributions were used in the simulations. To reduce uncertainty, we used MC simulation with the minimum number of runs defined by the K-S test. Expert data were also used to validate the simulation results. So, the theoretical contribution of the work is creating a flow-sheeting simulator based on intervals by experts. A method was developed for the evaluation of consistency. We applied the K-S test for the evaluation of the parameters of the simulation. After validation of the simulation results, the models in the modular simulator corresponded well to the data provided by the industry experts. The empirical contribution of the work is a simulator that includes all typical waste processing machines. Therefore, it can be applied to input data, such as co-collected and separately collected waste.
From the application point of view, it can be concluded that a method has been developed to analyse and design waste treatment technologies. With the developed tool, changes in waste streams due to changes in production, collection, or future values of different materials can be predicted by modelling the expected inputs, taking into account the required outputs (type, quantity, and quality of other materials), and even taking into account the planned introduction of a deposit scheme in Hungary.
The developed method is also suitable to support management activities, as it supports development projects well and can be considered a predictive analytical tool. It can be used to detect differences, i.e., it is suitable for monitoring by comparing calculated/expected and measured values and for identifying errors based on the comparison of distributions. The simulator developed supports what-if type analysis and is, therefore, suitable for process re-designing. We propose the OODA loop (Observe, Orient, Decide, Act) framework for all of these. Due to its ease of integration, the tool can be easily integrated into decision support systems, where the results can be visualised on dashboards. However, its applicability in this direction requires continuous model maintenance and interpretation of deviations. It will require additional tools and methods. It will be our next research topic, i.e., continuous monitoring based on qualitative models and developing a methodology for tuning model parameters.
The limitations of the study are the following. The clear disadvantage of the method is that it cannot be used as a basis for basic cost optimisation. Still, the advantage is that the model can be easily extended and developed to adapt to different needs. Ideally, measurement data will be available to validate the model. The advantage of this method is that we have also offered a solution for cases where the necessary data for validation are unavailable, namely, when expert knowledge is involved. Of course, it requires the right experts, preferably as many as possible. The disadvantage is that expert knowledge should also be validated. After all, the model is what expert knowledge is. The advantage of the method is that it is suitable for checking and demonstrating the consistency of knowledge. The method developed allows for optimisation tasks, either at the economic or asset level.
In the future, it would be possible to extend the simulator studies to actual industrial applications not yet available, if feasible, so that a more widely applicable tool would be available after further refinement. Our primary focus in the future is on developing solutions to qualify the adequacy of models, ensure fault diagnostics and optimisation applicability, and ensure model adaptivity. For this purpose, using Bayesian models will be important, as they will provide a real framework for model development, i.e., the domains now defined can be sensed as belief functions. We can build a probability model whereby these priors can be continuously updated based on the measurement data and further evaluations. The probabilities of the evaluations and measurements can also be qualified based on these models and, thus, build on this to develop fault diagnostic functions. We also aim to create a comprehensive framework that enables the user to specify as a goal what they want to achieve; for this purpose, several structures could be suitable. The optimal one could be determined from a given function of these structures. If the costs of each selected fraction and the operating costs of each brand were taken into account, it would be economically optimal to choose which is worthwhile under given market conditions. With these applications, a comprehensive investment support program would become available. The developed tool can support decision-making and the development of waste sorting lines tailored to the country based on the waste composition. Modularity ensures widespread operation, which can help society achieve a circular economy.
Supplementary Materials
The following supporting information can be downloaded at: https://www.mdpi.com/article/10.3390/su142416403/s1, Supplementary figures (Figures S1 and S2) and tables (Tables S1 and S2) to this article can be found in a separate file. Table S1: Applied separation ratios (re) of sorting machines for different waste components according to Exp.1; Table S2: The minimum and maximum yield (%) values given by the experts for the given components in the given streams, which were the basis of the validation; Figure S1: Expert-based and aggregated distributions for units, an example for air separator; Figure S2: Determination of the minimum number of MC simulations based on two-sample K-S test.
Author Contributions
Conceptualization and supervision, J.A. and R.K.; writing—original draft preparation, Á.B., A.E., A.S. and J.A.; writing—review and editing, Á.B., A.E., A.S., R.K. and J.A.; funding acquisition, J.A. and R.K. All authors have read and agreed to the published version of the manuscript.
Funding
This research received no external funding.
Institutional Review Board Statement
Not applicable.
Informed Consent Statement
Not applicable.
Data Availability Statement
Not applicable.
Acknowledgments
This work has been implemented by the TKP2021-NKTA-21 project with the support provided by the Ministry of Culture and Innovation of Hungary from the National Research, Development and Innovation Fund, financed under the 2021 Thematic Excellence Programme funding scheme.
Conflicts of Interest
The authors declare no conflict of interest.
References
- Dinu, M.; Pătărlăgeanu, S.R.; Petrariu, R.; Constantin, M.; Potcovaru, A.M. Empowering sustainable consumer behavior in the EU by consolidating the roles of waste recycling and energy productivity. Sustainability 2020, 12, 9794. [Google Scholar] [CrossRef]
- Towa, E.; Zeller, V.; Achten, W.M. Input-output models and waste management analysis: A critical review. J. Clean. Prod. 2020, 249, 119359. [Google Scholar] [CrossRef]
- Abdallah, M.; Talib, M.A.; Feroz, S.; Nasir, Q.; Abdalla, H.; Mahfood, B. Artificial intelligence applications in solid waste management: A systematic research review. Waste Manag. 2020, 109, 231–246. [Google Scholar] [CrossRef] [PubMed]
- Trica, C.L.; Banacu, C.S.; Busu, M. Environmental factors and sustainability of the circular economy model at the European Union level. Sustainability 2019, 11, 1114. [Google Scholar] [CrossRef] [Green Version]
- Straka, M.; Khouri, S.; Rosova, A.; Caganova, D.; Culkova, K. Utilization of computer simulation for waste separation design as a logistics system. Int. J. Simul. Model. 2018, 17, 583–596. [Google Scholar] [CrossRef] [PubMed]
- Kleinhans, K.; Hallemans, M.; Huysveld, S.; Thomassen, G.; Ragaert, K.; Van Geem, K.M.; Roosen, M.; Mys, N.; Dewulf, J.; De Meester, S. Development and application of a predictive modelling approach for household packaging waste flows in sorting facilities. Waste Manag. 2021, 120, 290–302. [Google Scholar] [CrossRef] [PubMed]
- Kratky, L.; Jirout, T. Modelling of particle size characteristics and specific energy demand for mechanical size reduction of wheat straw by knife mill. Biosyst. Eng. 2020, 197, 32–44. [Google Scholar] [CrossRef]
- Dimova, T. Theoretical and Experimental Study of Drum Electromagnetic Separator for Waste Material. In Proceedings of the 2020 21st International Symposium on Electrical Apparatus & Technologies (SIELA), Bourgas, Bulgaria, 3–6 June 2020; pp. 1–4. [Google Scholar]
- Merahi, A.; Hader, A.; Bekaddour Benatia, M.; Medles, K.; Dascalescu, L. A new approach for the numerical analysis of an eddy current separator to recover non-ferrous metals from wastes. Int. J. Environ. Stud. 2020, 77, 749–766. [Google Scholar] [CrossRef]
- Huber, F. Modelling of material recovery from waste incineration bottom ash. Waste Manag. 2020, 105, 61–72. [Google Scholar] [CrossRef] [PubMed]
- Feil, A.; Pretz, T.; Vitz, P.; Thoden van Velzen, E.U. A methodical approach for the assessment of waste sorting plants. Waste Manag. Res. 2017, 35, 147–154. [Google Scholar] [CrossRef] [PubMed]
- Yang, Y.; Yuan, G.; Cai, J.; Wei, S. Forecasting of Disassembly Waste Generation under Uncertainties Using Digital Twinning-Based Hidden Markov Model. Sustainability 2021, 13, 5391. [Google Scholar] [CrossRef]
- Elvira, V.; Martino, L. Advances in importance sampling. arXiv 2021, arXiv:2102.05407. [Google Scholar]
- Pinkel, M.; Deditz, J.; Sarc, R. Study about Plastic Sorting and Recycling. 2019. Available online: https://plastikviden.dk/media/212448/study-about-plastic-sorting-and-recycling.pdf (accessed on 22 September 2022).
- Moon, B.Y.; Kim, K.H.; Kwak, K.H.; Kang, G.J.; Hong, C.H. Dynamic analysis and design of separation screen mechanism in a plant of moisturized wastes. Int. J. Mod. Phys. 2008, 22, 1449–1454. [Google Scholar] [CrossRef]
- David, A.; Joel, O.O. Design and construction of a plastic shredder machine for recycling and management of plastic wastes. Int. J. Sci. Eng. Res. 2018, 9, 1379–1385. [Google Scholar]
- Sigmund, U.; Jones, P.; Machiels, L. Sorting with ballistic separators. In Proceedings of the 4th International Symposium on Enhanced Landfill Mining, Mechelen, Belgium, 5–6 February 2018; pp. 89–94. [Google Scholar]
- Nasrullah, M.; Vainikka, P.; Hannula, J.; Hurme, M.; Kärki, J. Mass, energy and material balances of SRF production process. Part 1: SRF produced from commercial and industrial waste. Waste Manag. 2014, 34, 1398–1407. [Google Scholar] [CrossRef] [PubMed]
- Nagel, J.R. An analytic model for eddy current separation. Miner. Eng. 2018, 127, 277–285. [Google Scholar] [CrossRef] [Green Version]
- Gülcan, E.; Gülsoy, Ö.Y. Evaluation of complex copper ore sorting: Effect of optical filtering on particle recognition. Miner. Eng. 2018, 127, 208–223. [Google Scholar] [CrossRef]
- Bakon, K.; Holczinger, T.; Süle, Z.; Jaskó, S.; Abonyi, J. Scheduling under uncertainty for Industry 4.0 and 5.0. IEEE Access 2022, 10, 74977–75017. [Google Scholar] [CrossRef]
Figure 1.
The connections in the developed modelling and simulation framework.

Figure 2.
Typical technological steps with the typical waste processing machines applied in a waste sorter.
Figure 2.
Typical technological steps with the typical waste processing machines applied in a waste sorter.

Figure 3.
(a) The technological scheme of RDF production from municipal solid waste. (b) The technological scheme of separating the contents of a selective mixed bin without glass.
Figure 3.
(a) The technological scheme of RDF production from municipal solid waste. (b) The technological scheme of separating the contents of a selective mixed bin without glass.

Figure 4.
(a) The schematic figure of an equipment in the waste treatment technology. (b) The schematic diagram of the modelled technology and its environment is based on Figure 3b for component c. Red arrows, streams leaving the technology; blue arrows, streams between physical equipment.
Figure 4.
(a) The schematic figure of an equipment in the waste treatment technology. (b) The schematic diagram of the modelled technology and its environment is based on Figure 3b for component c. Red arrows, streams leaving the technology; blue arrows, streams between physical equipment.

Figure 5.
Technological streams applied during expert-based validation.

Figure 6.
Uniform and aggregated distributions of expert-based validation data.

Figure 7.
(a) Normal distributions of components yields in certain streams after 3000 MC simulation. (b) Expert-based validation of simulation results.
Figure 7.
(a) Normal distributions of components yields in certain streams after 3000 MC simulation. (b) Expert-based validation of simulation results.


Table 1.
Weight percentage composition of the input waste used in the case study.
| Component | Composition of Input (u) (wt%) |
|---|---|
| PET () | 9.6 |
| LDPE () | 3.61 |
| HDPE () | 2.25 |
| Hazardous () | 0.15 |
| Iron () | 2.71 |
| Aluminium () | 0.94 |
| RDF () | 44.51 |
| Cardboard () | 13.33 |
| Paper () | 22.83 |
Publisher’s Note: MDPI stays neutral with regard to jurisdictional claims in published maps and institutional affiliations. |
© 2022 by the authors. Licensee MDPI, Basel, Switzerland. This article is an open access article distributed under the terms and conditions of the Creative Commons Attribution (CC BY) license (https://creativecommons.org/licenses/by/4.0/).
Share and Cite
MDPI and ACS Style
Bárkányi, Á.; Egedy, A.; Sarkady, A.; Kurdi, R.; Abonyi, J. Expert-Based Modular Simulator for Municipal Waste Processing Technology Design. Sustainability 2022, 14, 16403. https://doi.org/10.3390/su142416403
AMA Style
Bárkányi Á, Egedy A, Sarkady A, Kurdi R, Abonyi J. Expert-Based Modular Simulator for Municipal Waste Processing Technology Design. Sustainability. 2022; 14(24):16403. https://doi.org/10.3390/su142416403
Chicago/Turabian StyleBárkányi, Ágnes, Attila Egedy, Attila Sarkady, Róbert Kurdi, and János Abonyi. 2022. "Expert-Based Modular Simulator for Municipal Waste Processing Technology Design" Sustainability 14, no. 24: 16403. https://doi.org/10.3390/su142416403
Note that from the first issue of 2016, this journal uses article numbers instead of page numbers. See further details here.