
Does Uncertainty of Trade Environment Promote Green Technological Innovation? Empirical Evidence from China
Business School, Shandong University of Technology, Zibo 255000, China
*
Authors to whom correspondence should be addressed.
Sustainability 2022, 14(23), 16195; https://doi.org/10.3390/su142316195
Submission received: 9 November 2022
/
Revised: 30 November 2022
/
Accepted: 1 December 2022
/
Published: 4 December 2022
(This article belongs to the Special Issue Adoption of Management Strategies and Technologies for Sustainable Production: A Solution to Reduce Environmental Emissions Volume II)
Abstract
:In recent years, the international environment has changed rapidly, and the uncertainty of the trade environment faced by enterprises has dramatically increased. As a major participant in world trade, the uncertainty of the trade environment has significantly impacted the daily business activities and various behaviors of Chinese manufacturing enterprises. Green technology innovation has also become an important tool for enterprises to enhance their sustainable development ability and improve their ability to cope with changes in the external environment. The change in the trade environment will affect the business development of enterprises. To face the change in the trade environment, enterprises often choose to improve their technology level and increase the added value of their products. In the context of sustainable development, green technology innovation has higher technical strength and is more in line with the requirements of international development, which is strong support for enterprises to cope with the change in the trade environment. However, the current literature is scant on the association between trade uncertainty and green innovation. In this context, this study used the data of Chinese manufacturing listed companies from 2011 to 2020 to empirically analyze the relationship between trade environment uncertainty (UTE) and green technology innovation (GTI) using panel data estimation methods and further explore the related heterogeneity and its impact on sustainable development. The results show that: (1) UTE has a significant positive impact on the GTI of enterprises, and the robustness test verifies these findings. Different kinds of UTE have different effects on enterprise GTI. UTE also has a positive impact on the independent GTI of enterprises. (2) Compared with non-state-owned enterprises, the GTI of state-owned enterprises is more vulnerable to the positive impact of UTE. (3) UTE significantly and negatively impacts enterprises’ business activities and further challenges enterprises’ sustainable development. However, the enterprise’s GTI behavior, especially the substantial GTI, helps mitigate the adverse impact of UTE on the company’s sustainable development. Finally, this paper provides targeted suggestions for enterprises to better cope with UTE and improve their sustainable development capabilities.
1. Introduction
Since joining the WTO in 2001, China’s trade with other countries has become more frequent, the scale of foreign trade has been rising, and the trade volume with countries and economies around the world has shown a gradual growth trend. In 2017, the WTO announced that China’s total trade volume ranked first in the world. After China acceded to the WTO, China suffered fewer tariff barriers. Still, the non-tariff barriers, mainly anti-dumping and countervailing, have become increasingly serious in the international market. The frequent occurrence of non-tariff barriers has aggravated the uncertainty of the trade environment in which enterprises in related industries are located [1]. According to the statistics from China Trade Information Relief Network, as of 2020, China has become the country with the largest trade survey for 20 consecutive years. In 2020, China will suffer 130 trade surveys. The year-on-year growth rate has reached 27.45%. Because of the growing trade protectionism in recent years, the uncertainty of the trade environment presents a new trend of development, which has become one of the main factors hindering the development of the global economy and has also become a hot issue in the field of international trade [2,3,4,5]. This has profoundly affected the survival and development of Chinese enterprises in related industries. On the one hand, UTE will hinder the development of enterprises in the short term; on the other hand, enterprises will take corresponding measures to reduce the adverse impact of UTE [6]. The strengthening of GTI capabilities to improve the added value of products is an important means for enterprises to deal with UTE [7,8].
In the aspect of sustainable innovation orientation, green innovation is different from ordinary enterprise innovation activities [9,10]. It emphasizes the effective integration of green environment sustainable orientation and innovation; that is, enterprises not only focus on the economic effect or economic value under the market logic but also attach importance to improving the sustainable development ability of enterprises in the aspects of innovation orientation, process, and output [11,12,13]. At the National Two Sessions in 2021, the Government Work Report of the Chinese government first proposed the concepts of “carbon peaking” and “carbon neutralization”, which put forward new requirements for the sustainable development ability of enterprises [14,15]. Accordingly, green innovation has also become an important academic topic concerned by researchers in the fields of technological innovation and sustainable development.
Existing research mainly analyzes the impact of UTE on green innovation of Chinese enterprises from single UTE, such as anti-dumping and countervailing. The literature on the impact of overall UTE on GTI of Chinese enterprises is relatively lacking. There is also a lack of comparative analysis and research on the impact of different UTE on GTI; at the same time, previous studies ignore the heterogeneity of UTE’s impact on green innovation of different types of enterprises. This study explored the impact of UTE on green technology innovation of global enterprises and further explored its relationship with the sustainable development of enterprises. It used panel data of Chinese listed manufacturing companies from 2011 to 2020 and used panel analysis to conduct an empirical test. The main contributions are as follows: (1) This paper studies the heterogeneous impact of different UTEs on manufacturing enterprises’ GTI, which enriches the depth of relevant research and provides a reference for enterprises to deal with different UTE; (2) using the new variables of enterprise independent green innovation, this paper discusses the change of enterprise independent green innovation willingness under UTE environment; (3) it further discusses the impact of UTE on enterprises’ sustainable development ability and finds that under the uncertainty of trade environment, enterprises’ green innovation activities are conducive to improving enterprises’ sustainable development ability. The article’s significance is that the research conclusions of this paper not only make incremental contributions to the research in relevant fields but also provide a reference for enterprises on how to carry out green innovation activities and enhance their sustainable development capabilities in today’s international trade environment.
The contents of this study are as follows: Section 1 is the introduction, which introduces the background of the study, the main contributions of this paper, and the main content of the article. Section 2 reviews existing studies on UTE and firm green innovation, pointing out the gaps in existing research and the contribution of this paper. Section 3 compares the theories on the influence of UTE on firm green innovation and presents the paper’s hypotheses. Section 4 lists the econometric models used in the paper and the sources and processing methods of the data used in the empirical evidence. Section 5 is the main part of the empirical study, including data analysis, the main effect test, the robustness test, the heterogeneity test, and the test of UTE’s impact on the sustainable development of enterprises. Section 6 is the conclusion, which summarizes the results of the empirical study and puts forward relevant advice.
2. Literature Review
2.1. UTE and GTI
Regarding the research related to UTE on GTI, the literature stands on the perspective of enterprises to study the impact of UTE such as anti-dumping on enterprises’ GTI. Kao (2005) and Gao (2016), through establishing a bilateral trade model, found that when firms are subjected to anti-dumping investigations, they usually invest more in R&D to improve product competitiveness and thus reduce the negative impact of UTE on their operations [16,17]. Lin (2006), by studying the data of firms listed in China, found that a decrease in tariffs reduces firms’ willingness to innovate, while an increase in tariffs pushes firms to engage in GTI [18]. Liebman (2013) adopted the company data and tariff collection from 1975 to 2005 and established an estimation model of R&D revenue, finding that trade protection measures such as UTE induce sanctioned firms to increase their green innovation efforts and R&D investments [19]. Bravo-Ortega et al. (2014) studied the factory-level data of Chile and examined the relationship between productivity, R&D expenditure, and exports; the study found that external import competition encouraged enterprises to promote innovation activities, and the output of innovation results helped enterprises cope with import and export competition [20]. Bloom et al. (2016) used new panel data from 12 European countries from 1996 to 2007 and found that import competition from China significantly contributed to European firms’ R&D intensity and R&D level [21]. Miyagiwa (2016) found that anti-dumping occurs mainly between developed and developing countries by studying the financial data of relevant companies, and green innovation is the main means for developing countries to respond to anti-dumping investigations from developed countries [22]. Jabbour et al. (2019) studied the anti-dumping data of Europe against China using the PSM model and confirmed that European anti-dumping affected the performance and innovation of Chinese export enterprises, which was not conducive to the export activities of enterprises [23]. Ouyang et al. (2020) investigated the impact of environmental regulation on technological innovation based on provincial panel data of China’s industrial sector from 2005 to 2015. The results show that there is a U-shaped relationship between environmental regulation and technological innovation. Environmental regulation will hinder technological innovation in the short term, but it can promote enterprise technological innovation in the long term [24]. Autor et al. (2021) studied firms’ green innovation behavior when exposed to environmental risks and, after empirical analysis of a sample of 11,417 firms, found that the green innovation behavior of entrepreneurial firms is more likely to be influenced by environmental uncertainty factors [25]. Hui et al. (2021) studied the impact of green technology innovation willingness from the perspective of environmental regulation. After empirical analysis of enterprises from China’s eco-industrial parks, it was found that strict environmental regulations stimulate enterprises’ enthusiasm for green innovation, and regulatory environmental regulations have a more significant impact on green innovation willingness [4]. Li et al. (2021) used provincial panel data at the macro level and fixed-effect panel method to study economic policy uncertainty and green innovation concerns. The study found that environmental regulation is positively related to green innovation, while economic policy uncertainty harms green innovation [26]. Chen et al. (2022) study the data of Chinese A-share listed companies from 2005 to 2019 and found that environmental uncertainty and environmental regulation have both promoted green innovation of enterprises [27].
2.2. Research on the Impact Mechanism of UTE
Through what mechanism does UTE affect firms’ business operations and thus GTI activities? To address this question, foreign scholars Konings et al. (2008) and Hombert et al. (2018) researched the data of R&D-intensive enterprises and found that import competition from China brings about lower firm profitability, but these effects are much smaller for firms with larger R&D stocks [28,29]. Chandra and Long (2013) used data from American companies and established an empirical model. The study found that anti-dumping and countervailing investigations would lead to a decline in the labor productivity of enterprises in the investigated industries, which would have a greater impact on enterprises with higher exports [30]. Sunder et al. (2017), using China’s monthly export data from 2000 to 2006, found by establishing a regression model that the green innovation activities of enterprises subject to anti-dumping investigations were affected by financing constraints and risk bearing, and the impact was heterogeneous for different types of innovation [31]. Handley (2014) studied relevant data from Australia and found that UTE makes it more difficult for enterprises to export, and innovation is an important means to mitigate this negative impact [32]. Crowley (2019) studied the anti-dumping policies of the United States against Chinese enterprises [33]. Meng et al. (2020) studied the impact of anti-dumping on the adjustment of export quality of multi-product enterprises. From 2000 to 2014, China’s enterprises produced highly classified export data at the national level. By establishing a panel data model, he found that after other countries and regions took anti-dumping and countervailing measures against China, enterprises would adjust product quality, including improving the technical added value of products through GTI, to maintain the original competitiveness of their products [34]. He found that the anti-dumping activities of the United States against China will significantly reduce the exports of the relevant products involved in China to the United States, reflecting a negative trade restriction effect, and at the same time will lead to an increase in exports of similar products from other economies to the United States, reflecting a positive trade diversion effect. Xu (2020) studied the impact of government economic policy uncertainty on enterprise innovation and determined the cost of capital transmission channels. It was found that the uncertainty of economic policy increases the capital cost of enterprises, thereby reducing innovation. Research evidence shows that higher economic policy uncertainty not only hinders innovation through traditional investment irreversible channels but also through capital cost channels [35]. Zhao (2021) discussed the impact of extending producer responsibility on enterprise green technology innovation. Through research on relevant enterprises from China, it was found that the extended producer responsibility system has significantly promoted the green technology innovation of enterprises. Extending producer responsibility can promote green technology innovation of enterprises through a government subsidy mechanism [5]. Cui et al. (2021) found that environmental uncertainty further affected the GTI activities of enterprises by influencing their innovation investment by studying the relevant data of Chinese enterprises [36]. Xu and Yang (2021) found that environmental uncertainty has a positive impact on enterprises’ green innovation, which is conducive to enterprises’ ability to improve green innovation [37]. Chen et al. (2022) paid attention to the relationship between enterprise accounting and enterprise GTI. Through the study of relevant data and the establishment of the PLS-SEM model, they found that enterprises’ green innovation and environmental accounting have been affected by environmental uncertainty, including the important path of enterprise environmental accountants affecting GTI [27].
2.3. Research on UTE, GTI, and Sustainable Development Capacity of Enterprises
Most existing studies believe that the uncertainty of the trade environment has an impact on the daily business activities of enterprises. However, in the context of the uncertainty of the trade environment, what is the relationship between the green innovation behavior of enterprises and their sustainable development ability? Most of the existing research points out that the innovation behavior of enterprises will promote the growth of enterprises’ sustainable development ability [38]. Forza (1996) also found that the increase in R&D investment is conducive to the improvement of the production capacity of enterprises through empirical analysis of American manufacturing enterprises, thus improving the operating performance of related enterprises [39]. Deng et al. (1999) found that the R&D activities of enterprises are conducive to improving the ability of sustainable development by analyzing the data related to enterprise innovation and enterprise performance [40]. In recent years, with the concept of sustainable development deeply rooted in the hearts of the people, there has been much research on the impact of green innovation on the sustainable development ability of enterprises. Roper and Tapinos (2016) found by studying the relevant data of British food companies in 2008 that when the uncertainty of the external environment increases, enterprises will choose to carry out green innovation to seek to improve their sustainable development capabilities [13]. Ge et al. (2018) found that green innovation is the driving force for the sustainable development of enterprises. After the empirical analysis of 241 newly established green enterprises in China, it was found that a geographic information system is helpful for enterprises to obtain a sustainable competitive advantage. This result shows that in the process of green innovation, enterprises should choose appropriate methods according to different degrees of environmental uncertainty to enhance their green innovation capabilities [41]. Benedikt (2022) found by studying the relationship between green innovation and profitability in the context of environmental uncertainty that, from the perspective of environmental uncertainty, the level of green product innovation has a positive impact on the sustainable development of enterprises in the long term, but is not conducive to the introduction of new products [8].
2.4. Literature Gap
In summary, existing domestic and foreign research on UTE to enterprise GTI is more diverse; most of it adopts the view that dumping UTE will hinder the innovative activities of enterprises, while a part of the research in recent years holds the idea that UTE such as anti-dumping will force enterprises to innovate. From the perspective of the impact mechanism, domestic and foreign research argues that anti-dumping has an impact on enterprise productivity, import and export, financing, and other activities, which in turn affects the innovative activities of enterprises, and these studies and this paper provide a wealth of theoretical and empirical support. However, most of the existing related studies lack the overall impact effect of UTE and comparative research on the impact effect of different barriers on enterprise GTI. In terms of impact mechanism, most of them introduce non-innovation variables to study the impact mechanism of green innovation, which may affect the robustness of the results. Based on this, the contributions of this study are that we study the utility of overall trade investigation on GTI and classify the influence of different. On this basis, we further introduce the concept of independent green innovation to trace the effect of UTE on enterprise GTI, which is somewhat innovative. In addition, this paper further verified the impact of UTE on enterprises’ sustainable development capability and examined the mediator role of GTI, providing an experience for enterprises to better cope with the impact of UTE and improve their sustainable development capability.
3. Theoretical Analysis and Research Hypothesis
3.1. Mechanisms of UTE’ Influence on Enterprises’ GTI
When the environment changes, the business activities of the enterprise will be affected. Environmental change will have a variety of impacts on corporate behavior [26]. When environmental uncertainty rises, the operation, export, financing, and other activities of enterprises will be hindered to varying degrees, which will adversely affect the green innovation activities of enterprises; in the face of environmental change, enterprises will also increase R&D investment and improve innovation ability to cope with the adverse impact of environmental uncertainty on enterprises and minimize the losses caused by environmental uncertainty. Especially in today’s emphasis on sustainable development and green development, green innovation of enterprises has increasingly become an important help in coping with environmental change.
As an important part of uncertainty, trade uncertainty has a series of adverse effects on listed enterprises. The most intuitive impact of UTE on enterprises is that it will increase the export costs of export enterprises in the target countries and reduce their profitability. On the one hand, UTE will bring targeted tariffs and fines, which will reduce the market competitiveness of Chinese products and affect the income and profits of Chinese export enterprises, thus adversely affecting the sources of green innovation funds for enterprises and making it difficult for some enterprises to bear. This can lead to a “discouraging effect” on green innovation [17]. On the other hand, being subjected to a regional trade case investigation can hurt the income and profits of Chinese exporters. On the other hand, products and enterprises subject to trade investigations in one region or similar products and enterprises in the same industry will be more likely to be subject to trade investigations in other regions. Second, exporters subject to trade investigations may shift their business to countries and regions that are not under investigation or even back to the domestic market, affecting the daily operations of enterprises in the same industry in other markets and domestic markets [42], and to reverse the adverse effects of UTE, increase green innovation, and increase green innovation output, improving enterprise competitiveness and product value-added is thus an important means for enterprises to deal with UTE [43]. Therefore, the willingness and ability to innovate are likely to increase rather than decrease for firms that suffer from UTE, thus creating a “push-back effect” of UTE on GTI [44]. In summary, we propose the following hypothesis:
Hypothesis 1 (H1).
UTE has a positive impact on the GTI of manufacturing enterprises.
The previous analysis concluded that UTE could lead to trade diversion effects, thus causing the enterprises under investigation to shift their original business to other countries and regions or even back to the country, thus increasing competition within the industry. The increase in competition in the same industry will make enterprises reduce the cooperation in technology research and development among themselves, thus preferring independent green innovation in research and development. Meanwhile, the arrival of trade case investigations is often accompanied by technical barriers associated with them, which adversely affects Chinese enterprises’ technological mergers and acquisitions and technological cooperation in the international arena, thus hindering imitative and introductory green innovations of Chinese enterprises. In summary, we propose hypothesis 2:
Hypothesis 2 (H2).
UTE has a positive impact on the independent GTI of manufacturing enterprises.
3.2. Heterogeneous Effects of Different UTE on GTI
3.2.1. Anti-Dumping
Anti-dumping refers to the measures taken by the importing country to resist imports against the dumping of foreign goods in the domestic market. There is price discrimination in the domestic market and damage to the domestic market. Its implementation targets are enterprises and specific industries that produce and export related products. Anti-dumping is one of the most active and widely used UTEs, and its impact mechanism on green innovation of enterprises is very similar to UTE. Anti-dumping mainly aims at relevant enterprises by imposing additional taxes on dumped goods after investigation. On the one hand, anti-dumping will reduce the competitiveness of export enterprises in the target countries and increase the intensity of competition in related industries. On the other hand, affected enterprises urgently need to increase the added value of their products and improve their competitiveness. Under the background of sustainable development, enterprises will increase their green innovation efforts. Therefore, we propose the following hypothesis:
Hypothesis 3 (H3).
Anti-dumping has a positive impact on the GTI of manufacturing enterprises.
3.2.2. Countervailing
Countervailing refers to the trade remedy measures taken by an importing country for imports subsidized by its government to stabilize the domestic economy and protect domestic industries. The object of countervailing investigation is the export subsidy policy formulated by the government. Compared with the object of investigation of anti-dumping, which is a specific enterprise or product, the object of investigation of countervailing is the country’s government being sued, and its implementation is more extensive and lasts longer. Some scholars also found that, compared with other UTE, countervailing policies are more “contagious”: once a country has been subject to countervailing investigations, other regions will also launch the same investigations against the relevant countries. Therefore, firms in industries subject to countervailing investigations will be more willing to innovate and have higher green innovation levels.
Hypothesis 4 (H4).
The countervailing investigation has a positive impact on the substantive GTI of enterprises.
3.2.3. Guarantee Measures
Safeguard measures are emergency import restriction measures taken when there is a surge of imports of a certain imported product in the domestic market, and the relevant industry has suffered serious damage while disrupting the domestic market. Unlike anti-dumping and countervailing activities, safeguard measures target imported products in fair trade. At present, the existing research at home and abroad for safeguard measures on enterprise technology green innovation results is less lacking in relevant theoretical analysis, so no further relevant hypothesis is proposed, and the latter is only for the empirical results of the analysis.
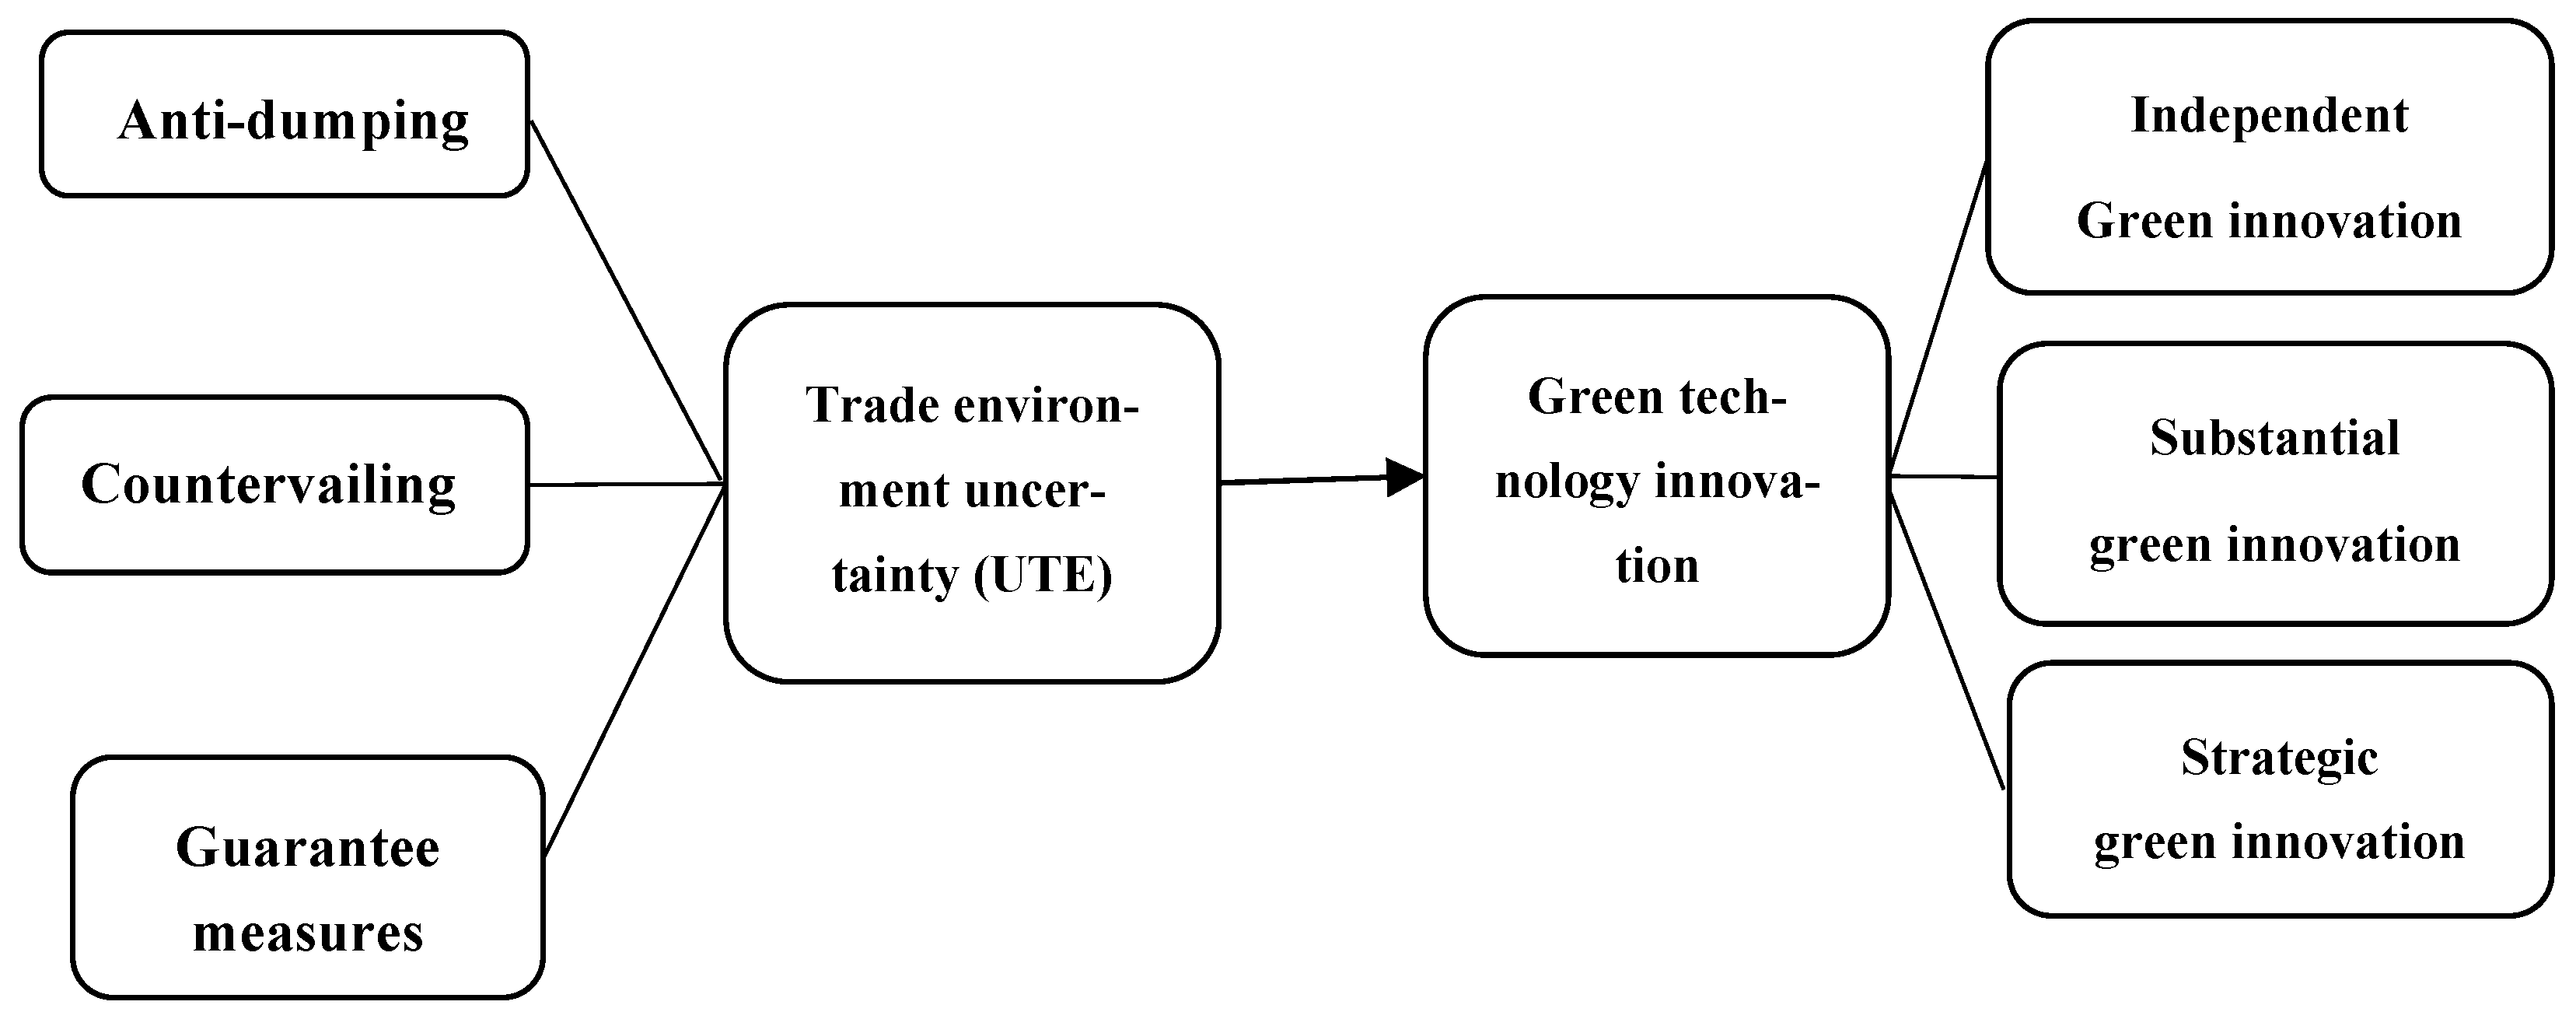
The theoretical framework of this paper is shown in the figure below(see Figure 1).
4. Method and Materials
4.1. Model Design
As the data used are panel data, this paper constructs a static panel econometric model, which controls the individual effect at the industry level and the time effect at the year level to control the impact of other variables that do not change over time and industry changes on enterprise innovation [6].
where is the level of GTI of enterprise i in year t, measured by the number of patent applications. The is the intensity of UTE suffered by industry j in year t, measured by the number of trade investigation suffered by the industry in that year. The are the other control variables, the and are industry fixed effects and year fixed effects, and are random error terms.
To analyze the mediator effect of GTI later, this paper builds models (2) and (3) based on the research of Baron and Kenny (1986) [45]. Model (2) examines the impact of UTE on the sustainable development capability of enterprises, and (3) examines the mediator effect of GTI. Among them are enterprise development capability indicators, and the other indicators have the same meaning as the model (1).
4.2. Description of Main Variables
4.2.1. Explanatory Variables
In previous studies on environmental uncertainty, the environmental uncertainty index measured by text analysis is usually used to measure the uncertainty index. This index uses the frequency of media reports to measure the uncertainty index. However, there is a large deviation in media reports, and the endogeneity between media reports and uncertainty is strong, so the accuracy and objectivity of measuring the UTE are poor. Therefore, this paper uses the number of trade case investigations suffered by the industry in the current period to measure the changes in the trade environment. Specifically, it can be divided into the number of all trade cases investigated (tradfrict), the number of anti-dumping cases (AD), the number of countervailing cases (AS), and the number of safeguard measures cases (SM) suffered in the current period.
4.2.2. Explained Variables
In previous literature, most of the measures of enterprise GTI use enterprise green innovation investment and green innovation personnel as the measurement indicators. Still, this measurement is easily affected by the internal factors of enterprises. In contrast, the number of green patents granted will be affected by factors such as the time limit of patent grants, which cannot embody the green innovation capability of enterprises well. Therefore, this paper refers to the practice of bloom (2016) [21]. The total number of green patents applied by enterprises in the current year is selected as a variable to describe GTI, and the higher the number of patent applications, the higher the green innovation ability of enterprises. To study the impact mechanism of UTE on enterprises’ GTI, the quantity of independent patent applications is introduced, and the higher the number of independent patent applications, the higher the willingness of enterprises to proceed with independent R&D. To further explore the heterogeneous effects of different UTE on enterprise green innovation, consulting the study of Qing Liu et al. (2016), green patents are divided into substantive and strategic green innovation, and the quantity of invention patent applications of enterprises is used to examine the output of substantive green innovation, while the sum of the quantity of utility model green patents and the quantity of appearance green patents is used as a criterion to examine the output of strategic green innovation [46]. To ensure the consistency of data dimensions, the above patent numbers are processed by adding 1 to take the natural logarithm.
4.2.3. Control Variables
According to Schumpeterian theory, enterprise size is an important factor influencing enterprise green innovation, and the larger the enterprise size is, the stronger its green innovation ability and willingness to innovate; this paper introduces two variables to control enterprise size, namely company assets (asset) and the number of employees (staff), and both variables are logarithmically treated [34]. Both variables are logarithmic.
Financial indicators are important criteria to measure the daily operating conditions of enterprises. In this paper, financial indicators such as asset–liability ratio (debt), book-to-market (bm), Tobin’s Q (TobinsQ), share proportion of the largest shareholder (Top1), and fixed assets ratio (fixasset) are cited as control variables [31].
In addition, this paper also controls for the Herfindahl–Hirschman Index (HHI) [47] of the industry to reflect the industry concentration of different industries and firm age (age), which is expressed by the current accounting year minus the year of establishment [18].
The definitions and calculation methods of all variables used in this paper are shown in Table 1.
4.3. Data Source
To research the impact of the uncertainty of the environment on firm green innovation, the following data are used: the number of global trade case investigations against China, the number of green patent applications of listed companies, and the basic data of Chinese listed companies. Among them, the number of trade is from China Trade Information Relief Network, the green patent data are from the CNRDS database, and the data of listed companies are from the CSMAR database. To ensure the research results’ reliability, the above data were processed as follows: (1) Screen the data samples of manufacturing enterprises; (2) remove the sample of S.T. and S.T. * listed companies; (3) exclude the sample with serious data missing; and (4) winsorize all continuous variables in the sample with a 1% tail reduction.
5. Empirical Results and Discussion
5.1. Descriptive Statistics
As shown in Table 2, the average value of trade is 4.1, which indicates that the manufacturing enterprises in China face more serious problems of UTE, among which the average value of anti-dumping is 2.8, which shows that anti-dumping occupies the main part of the UTE. On the quantity of enterprise patent applications, the mean value of total green patents and the maximum value and the number of independent R&D green patents are relatively close, which indicates that enterprises are more inclined to independent R&D. The mean value of substantive green innovation output is higher than strategic green innovation output, which indicates that manufacturing enterprises are more inclined to substantive green innovation methods.
The results in Table 3 are used to reflect the dependence between all control variables. The second column is the variance expansion factor (VIF), and the tolerance in the third column is the reciprocal of the variance expansion factor (VIF). In general, if the variance inflation factor (VIF) is greater than or equal to 10, there is no significant collinearity between variables. From the results listed in the table, the variance expansion factor (VIF) of all independent variables is less than 10. Therefore, it is verified that there is no multicollinearity between the control variable in this paper.
To ensure the rationality of the empirical results in this paper, a cross-sectional dependence test was conducted on the data used in the existing model. The test results are shown in Table 4. It is known that the original assumption is that there is no cross-sectional correlation. If the p-value of the result is greater than 0.05, the original assumption can be accepted. If the p-value of the result is greater than 0.1, the original assumption can be completely accepted; that is, there is no cross-sectional correlation. It can be seen from Table 4 that the regression results of the main independent variables and dependent variables are tested for cross-sectional correlation, respectively, and the p-values of the results are greater than 0.1, so the original hypothesis can be accepted. That is, there is no cross-sectional correlation. (In this paper, the cross-sectional correlation between AS, AD, and SM and independent GTI, substantive GTI, and strategic GTI is also tested, and the result is no different from the full sample, so they are not listed in the table.)
This paper employed the augmented Dickey–Fuller (ADF) test to probe the unit root properties of the study variables, and the results are provided in Table 5 [48]. It can be seen from the results in column 3 that variables strongly reject the null hypothesis that the panel has a unit root at a 1% significance level. The results after taking the first difference also unveil that variables are stationary. Since this study uses company-level data, with a lesser period and more cross-sections, we employed the fixed-effect model to estimate the long-run relationship. After reviewing relevant literature, we found that such panel data studies pay less attention to unit root analysis [25,36]. Following the previous studies of Kim et al. (2018) and Zhao et al. (2021), we used all the variables without taking the first difference for the regression analysis because all the variables are stationary at level [49,50].
5.2. Baseline Regression Results
The general effect of UTE on the GTI of manufacturing firms is shown in Table 6. In column 1, the coefficient of total UTE (trade) to total green patents (grepat) is 0.012, with a significance level of 5%, indicating that UTE has a significant positive impact on the GTI of Chinese listed manufacturing enterprises. H1 has been confirmed that UTE has a positive impact on GTI of manufacturing enterprises. In addition, enterprise assets (assets) and the number of employees (staff) have a significant positive impact on the enterprise’s GTI, while asset–liability ratio (debt), book price earnings ratio (bm), TobinsQ (TobinsQ), the largest shareholder’s share of fixed capital (Top1), and enterprise age (age) have a negative impact on the enterprise’s green innovation.
To further explore the impact of different UTEs on the heterogeneity of GTI, trade is divided into anti-dumping (AD), countervailing (AS), and safeguard measures (SM) for regression analysis. The regression results are shown in columns 2–4. The impact coefficient of anti-dumping (AD) on the total amount of green patents (grepat) is 0.016, with a significance level of 1%, which indicates that AD has a positive impact on the GTI of enterprises. H3 has confirmed that anti-dumping has a positive impact on the GTI of manufacturing enterprises. After the anti-dumping investigation, enterprises in relevant industries generally strengthened their R&D efforts and achieved good results. Anti-subsidy (AS) and safeguard measures (SM) have no significant impact on the total number of green patents, but this paper will further study the impact of different UTE.
For research on the influence of UTE on independent R&D green patents, the independent R&D green innovation patents (indpat) of enterprises are included in equation (1) as a dependent variable for regression analysis. The results are shown in Table 7. In column 1, the impact coefficient of UTE (tradfrict) on independent research and development of green patents (indpat) is 0.014, which is credible at the level of 1%, indicating that UTE has a significant positive impact on independent research and development of Chinese manufacturing enterprises GTI. H2 in this paper has confirmed that under the influence of UTE, enterprises are more willing to make independent green innovation. After distinguishing different types of UTE, we found that both anti-dumping (AD) and countervailing (AS) have a significant positive impact on the independent GTI of enterprises, but safeguard measures (SM) have no significant impact on the number of independent green patents of enterprises.
5.3. Green Innovation Output Classification Test
To further research the influence of different UTE on firms’ GTI and make the findings more specific, we refer to the approach of Qing Liu [46] and classify invention green patents as firms’ substantive green innovation output and utility model green patents and appearance green patents as firms’ strategic green innovation output and also study the impact of different UTE on these two types of green innovation output, respectively.
Table 8 shows the empirical results of UTE on substantive green innovation output. The impact coefficient of UTE (tradfrict) on the output of substantive green innovation is 0.007, which is significant at the 10% significant level, indicating that UTE has a significant positive impact on the substantive green innovation of manufacturing enterprises in general. Anti-dumping has no significant impact on the substantive output of enterprises, while the impact coefficient of countervailing on the substantive green innovation output of enterprises is 0.026, with a significance level of 5%. It can be seen that the influence coefficient and significance are better than the total UTE, which proves hypothesis 4 in this paper.
UTE on firms’ strategic green innovation output is shown in Table 9. Column 1 shows that UTE, in general, has a significant positive impact on firms’ strategic green innovation output; column 2 indicates that anti-dumping barriers also have a significant positive impact on firms’ strategic green innovation output. Columns 3 and 4 show that countervailing and safeguard measures have no significant effect on firms’ strategic green innovation output.
5.4. Robustness Tests
To ensure the reliability of the empirical results, the corresponding robustness tests were carried out. The U.S. policy towards China not only accounts for a large proportion of the world but also represents the attitude of the developed Western countries led by the U.S. towards China, which is highly representative. Therefore, this paper introduces the number of U.S. UTE surveys in China (TradfrictUSA) as a tool variable of the original world UTE in China and tests the main regression results of different green innovation outputs. The results are shown in Table 10, which shows that UTE still has a significant positive impact on enterprises’ GTI in general and has a positive impact on enterprises’ independent R&D GTI and substantive GTI, further confirming the assumptions 1 and 2 of this paper. In addition, China was affected by the financial crisis after 2008, as well as the Sino-U.S. trade frictions lasting 18 and 19 years, which may affect the empirical results of this paper. In this paper, the data from 2008, 2009, 2018, and 2019 years are excluded from the regression test. The results are shown in Table 11, which shows that UTE and anti-dumping still have a significant positive impact on the GTI of enterprises and further confirms assumption 3 of this paper. In a word, the conclusion of this paper is credible.
5.5. Heterogeneity Test
Schumpeterian theory suggests that there is a significant influence relevance between enterprise size and green innovation activities. The larger the size of an enterprise, the stronger its green innovation ability and willingness to innovate. Although this paper adds relevant variables to control for the control variables, the role of enterprise size under the influence of UTE needs to be further tested. The original example is divided into mainboard-listed enterprises and non-mainboard-listed enterprises for classification regression to verify this hypothesis. The mainboard enterprises are larger, and the effect should more strongly influence their green innovation; the outcomes are shown in Table 12, columns 1 to 4 are listed as mainboard-listed enterprises, and columns 5 to 8 are non-mainboard-listed enterprises. The experimental results show that UTE, anti-dumping, and countervailing all have a significant positive impact on the GTI of the mainboard-listed enterprises. For non-mainboard-listed enterprises, UTE does not have a significant effect on enterprise green innovation.
The nature of enterprise equity, is one of the important factors influencing enterprise green innovation, and for verifying the heterogeneity of enterprise green innovation under the influence of UTE for enterprises with different equity natures, the original sample was separated into state-owned enterprises and non-state-owned enterprises, and after conducting categorical regressions, the results obtained are shown in Table 13. Table 13 shows that for state-owned enterprises, the total number of trade barriers, anti-dumping, and countervailing has significant positive effects on the GTI of enterprises. On the other hand, non-state-owned enterprises have not been significantly affected. It is worth noting that the impact coefficient of countervailing in the sample of state-owned enterprises is 0.059, which is significant at the level of 5%. It can be seen that both the significance and the impact coefficient are much better than the full sample regression results because of the particularity of China’s state-owned enterprises. Due to the particularity of the ownership of China’s state-owned enterprises, many foreign governments regard traditional loans (such as loans obtained by state-owned enterprises from state-owned banks) as subsidy projects, which leads to the more significant impact of countervailing on China’s state-owned enterprises’ GTI.
5.6. The Influence of UTE on Enterprise Sustainable Development and the Mediator Effect of GTI
The impact of UTE on GTI has been discussed extensively in the previous section. However, what will be the impact effect of UTE on enterprise sustainable development ability? What is the mediator effect of different types of green innovation output on the effect of UTE? What types of green innovation can help firms to overcome the adverse effects of UTE? This paper will further discuss the relationship between UTE, GTI, and enterprise sustainable development ability further, substantiate the impact mechanism in this paper, and provide empirical evidence for making sound recommendations.
Regarding the research of Reuben et al. (1986), this paper uses the three-step regression method to test the impact mechanism of green innovation. First, the model (2) listed above is used to verify the impact of UTE on the sustainable development ability of enterprises. The impact of UTE on GTI has been reported and analyzed previously, so it will not be repeated. Finally, we use model (3) for regression to observe the mediator effect of GTI.
The regression results of UTE’s impact on the enterprise’s sustainable development capability are shown in Table 14. Because the impact of UTE on enterprise green technology innovation has been reported and discussed in the previous article, no repeated reports will be made in this section. In column 1, the impact coefficient of UTE on the enterprise’s sustainable development ability (roa) is significantly negative, indicating that UTE has a significant negative impact on the sustainable development ability. In column 2, GTI is significantly positive at the 1% significance level, indicating that the enterprise’s GTI activities have reduced the negative impact of UTE on the enterprise’s sustainable development ability to a certain extent, and the comprehensive impact coefficient is 0.036 after calculation. In column 3, the impact coefficient of the enterprise’s substantial GTI is 0.055, which is significant at the 1% significance level, indicating that the enterprise’s substantial GTI also helps to weaken the adverse impact of UTE, and the calculated impact coefficient is 0.034. (4) The impact coefficient of the strategic GTI of enterprises in the column is 0.029, which is significant at the 1% level, indicating that the strategic GTI of enterprises can also mitigate the adverse impact of UTE on the sustainable development of enterprises to a certain extent, and the calculated impact coefficient is 0.018. It can be seen that, compared with the strategic GTI of the enterprise, the substantive GTI of the enterprise is more conducive to mitigating the adverse impact of UTE on the sustainable development of the enterprise.
6. Conclusions and Policy Implication
This paper explores the impact of UTE on GTI based on Chinese manufacturing enterprises. It also examines the heterogeneous effects of UTE on the green innovation of enterprises of different sizes and ownership. Further, it studies the impact of UTE on enterprise performance and the mediator role of green innovation. The findings are as follows: (1) In general, UTE has a significant positive impact on the GTI of manufacturing enterprises. Robustness tests verify our results. (2) After subdividing UTE and patent types, it is found that antidumping barriers have a more significant positive impact on independent GTI and strategic GTI; the positive impact of countervailing on independent GTI and substantive GTI is more obvious. (3) The heterogeneity test shows that UTE has a more significant positive impact on GTI of mainboard enterprises and state-owned enterprises from the perspective of enterprise size and equity nature. (4) Further research shows that improving green innovation capability, especially the substantial GTI, is conducive to mitigating the adverse impact of UTE on the sustainable development capability of enterprises.
The findings of this paper have important policy implications and management suggestions. (1) Chinese enterprises should continuously strengthen the construction of independent green innovation capacity to get rid of the unfavorable situation in which others restrict the core technology. It is found that UTE has a “push-back effect” on enterprise green innovation, which improves the green innovation performance of enterprises. Therefore, with the help of this “push-back effect”, enterprises should further improve their green innovation capability, get rid of external technology dependence, and move towards the road of independent green innovation and creation to contribute to the Made in China 2025 plan and to better prepare for UTE. In addition, UTE also significantly promotes the output of substantive green patents, but enterprises should also pay attention to the green innovation of invention green patents with greater technical content and continuously promote the quality of enterprise green innovation. (2) Enterprises should strengthen cooperation to enhance the technology level of related domestic industries. In terms of the influence mechanism, this paper theoretically analyzes and empirically verifies that under the influence of UTE, the output of enterprises’ independent green innovation is positively affected. Although the theory of this paper has been tested empirically, it may not be a good phenomenon for enterprise green innovation, as enterprises tend to innovate independently rather than jointly, which may cause the “closed-door” of GTI and is not instrumental in the improvement of the overall green innovation level of the industry. In the case of an unfavorable external environment, domestic enterprises should strengthen technical cooperation to improve the overall technical level of the industry and avoid internal competition among domestic enterprises. (3) According to the above empirical conclusions, UTE has a promoting effect on the green innovation behavior of enterprises. The GTI of the enterprise is conducive to strengthening the sustainable development capacity of the enterprise and mitigating the adverse impact of UTE on the enterprise. In this context, the government should increase its support for enterprises’ GTI, give certain financial and tax support and preferential policies to enterprises willing to carry out green innovation, and especially encourage enterprises to carry out substantive green innovation; it should also stimulate enterprises’ green innovation will and innovation motivation and help enterprises get rid of the adverse effects of UTE. Under the background of UTE sanctions, enterprises should strengthen green innovation and get rid of the adverse impact of UTE on the sustainable development of enterprises. Further research shows that UTE hurt the sustainable development ability of enterprises, and substantive green innovation is conducive to weakening this adverse impact. Therefore, with the increasingly serious UTE, enterprises should invest more into substantive green innovation achievements and strengthen green innovation to improve the sustainable development ability of enterprises.
Author Contributions
Conceptualization, W.S., M.Y. and H.Z.; data curation, W.S. and Y.Z.; formal analysis, W.S. and H.Z.; funding acquisition, M.Y.; investigation, M.Y.; methodology, W.S., H.Z. and Y.Z.; resources, W.S. and M.Y.; software, H.Z. and Y.Z.; supervision, M.Y.; visualization, W.S.; writing—original draft, W.S.; writing—review and editing, W.S., M.Y., H.Z. and Y.Z. All authors have read and agreed to the published version of the manuscript.
Funding
This work was supported by the project supported by the National Social Science Foundation of China (19BGL073): “Study on the Impact of Sino-US Trade Friction on Chinese Enterprises’ Cross-border M&A and Countermeasures”.
Institutional Review Board Statement
Not applicable.
Informed Consent Statement
Not applicable.
Data Availability Statement
The data used in this paper are from China Trade Information Relief Network, CSMAR Database and CNRDS Database.
Conflicts of Interest
The authors declare no conflict of interest.
References
- Imbruno, M. Importing under Trade Policy Uncertainty: Evidence from China. J. Comp. Econ. 2019, 47, 806–826. [Google Scholar] [CrossRef]
- Kee, H.L.; Neagu, C.; Nicita, A. Is Protectionism on the Rise? Assessing National Trade Policies during the Crisis of 2008. Rev. Econ. Stat. 2013, 95, 342–346. [Google Scholar] [CrossRef] [Green Version]
- Zhu, Y.; Sun, Z.; Zhang, S.; Wang, X. Economic Policy Uncertainty, Environmental Regulation, and Green Innovation—An Empirical Study Based on Chinese High-Tech Enterprises. Int. J. Environ. Res. Public Health 2021, 18, 9503. [Google Scholar] [CrossRef] [PubMed]
- Peng, H.; Shen, N.; Ying, H.; Wang, Q. Can Environmental Regulation Directly Promote Green Innovation Behavior?—Based on Situation of Industrial Agglomeration. J. Clean. Prod. 2021, 314, 128044. [Google Scholar] [CrossRef]
- Zhao, Y.; Peng, B.; Elahi, E.; Wan, A. Does the Extended Producer Responsibility System Promote the Green Technological Innovation of Enterprises? An Empirical Study Based on the Difference-in-Differences Model. J. Clean. Prod. 2021, 319, 128631. [Google Scholar] [CrossRef]
- Caggese, A. Entrepreneurial Risk, Investment, and Innovation. J. Financ. Econ. 2012, 106, 287–307. [Google Scholar] [CrossRef] [Green Version]
- Hussain, M.; Dogan, E. The Role of Institutional Quality and Environment-Related Technologies in Environmental Degradation for BRICS. J. Clean. Prod. 2021, 304, 127059. [Google Scholar] [CrossRef]
- Wagner, B.; Wagner, M. Linking Levels of Green Innovation with Profitability under Environmental Uncertainty: An Empirical Study. J. Clean. Prod. 2022, 378, 134438. [Google Scholar] [CrossRef]
- Yin, S.; Zhang, N.; Li, B. Improving the Effectiveness of Multi-Agent Cooperation for Green Manufacturing in China: A Theoretical Framework to Measure the Performance of Green Technology Innovation. Int. J. Environ. Res. Public Health 2020, 17, 3211. [Google Scholar] [CrossRef]
- Gong, R.; Wu, Y.Q.; Chen, F.W.; Yan, T.H. Labor Costs, Market Environment and Green Technological Innovation: Evidence from High-Pollution Firms. Int. J. Environ. Res. Public Health 2020, 17, 522. [Google Scholar] [CrossRef]
- Hu, D.; Huang, Y.; Zhong, C. Does Environmental Information Disclosure Affect the Sustainable Development of Enterprises: The Role of Green Innovation. Sustainbility 2021, 13, 11064. [Google Scholar] [CrossRef]
- Palčič, I.; Prester, J. Impact of Advanced Manufacturing Technologies on Green Innovation. Sustainbility 2020, 12, 3499. [Google Scholar] [CrossRef] [Green Version]
- Roper, S.; Tapinos, E. Taking Risks in the Face of Uncertainty: An Exploratory Analysis of Green Innovation. Technol. Forecast. Soc. Chang. 2016, 112, 357–363. [Google Scholar] [CrossRef] [Green Version]
- Fang, J.; Gozgor, G.; Mahalik, M.K.; Padhan, H.; Xu, R. The Impact of Economic Complexity on Energy Demand in OECD Countries. Environ. Sci. Pollut. Res. 2021, 28, 33771–33780. [Google Scholar] [CrossRef]
- Zhang, H.; Sun, X.; Bi, C.; Ahmad, M.; Wang, J. Can Sustainable Development Policy Reduce Carbon Emissions? Empirical Evidence from Resource-Based Cities in China. Sci. Total Environ. 2022, 838, 156341. [Google Scholar] [CrossRef]
- Gao, X.; Miyagiwa, K. Antidumping Protection and R&D Competition. Can. J. Econ. 2005, 38, 211–227. [Google Scholar] [CrossRef]
- Kao, K.F.; Peng, C.H. Anti-Dumping Protection, Price Undertaking and Product Innovation. Int. Rev. Econ. Financ. 2016, 41, 53–64. [Google Scholar] [CrossRef]
- Lin, B.W.; Lee, Y.; Hung, S.C. R&D Intensity and Commercialization Orientation Effects on Financial Performance. J. Bus. Res. 2006, 59, 679–685. [Google Scholar] [CrossRef]
- Liebman, B.H.; Reynolds, K.M. Innovation through Protection: Does Safeguard Protection Increase Investment in Research and Development? South. Econ. J. 2013, 80, 205–225. [Google Scholar] [CrossRef]
- Bravo-Ortega, C.; Benavente, J.M.; González, Á. Innovation, Exports, and Productivity: Learning and Self-Selection in Chile. Emerg. Mark. Financ. Trade 2014, 50, 68–95. [Google Scholar] [CrossRef]
- Bloom, N.; Draca, M.; Van Reenen, J. Trade Induced Technical Change? The Impact of Chinese Imports on Innovation, IT and Productivity. Rev. Econ. Stud. 2016, 83, 87–117. [Google Scholar] [CrossRef] [Green Version]
- Miyagiwa, K.; Song, H.; Vandenbussche, H. Accounting for Stylised Facts about Recent Anti-Dumping: Retaliation and Innovation. World Econ. 2016, 39, 221–235. [Google Scholar] [CrossRef]
- Jabbour, L.; Tao, Z.; Vanino, E.; Zhang, Y. The Good, the Bad and the Ugly: Chinese Imports, European Union Anti-Dumping Measures and Firm Performance. J. Int. Econ. 2019, 117, 1–20. [Google Scholar] [CrossRef]
- Ouyang, X.; Li, Q.; Du, K. How Does Environmental Regulation Promote Technological Innovations in the Industrial Sector? Evidence from Chinese Provincial Panel Data. Energy Policy 2020, 139, 111310. [Google Scholar] [CrossRef]
- Autor, D.H.; Dorn, D.; Hanson, G.H.; Pisano, G.; Shu, P. Foreign Competition and Domestic Innovation: Evidence from U.S. Patents. SSRN Electron. J. 2021, 2, 357–374. [Google Scholar] [CrossRef]
- Li, X.; Hu, Z.; Zhang, Q. Environmental Regulation, Economic Policy Uncertainty, and Green Technology Innovation. Clean Technol. Environ. Policy 2021, 23, 2975–2988. [Google Scholar] [CrossRef]
- Chen, J.; Wang, X.; Shen, W.; Tan, Y.; Matac, L.M.; Samad, S. Environmental Uncertainty, Environmental Regulation and Enterprises’ Green Technological Innovation. Int. J. Environ. Res. Public Health 2022, 19, 9781. [Google Scholar] [CrossRef]
- Konings, J.; Vandenbussche, H. Heterogeneous Responses of Firms to Trade Protection. J. Int. Econ. 2008, 76, 371–383. [Google Scholar] [CrossRef]
- Hombert, J.; Matray, A. Can Innovation Help U.S. Manufacturing Firms Escape Import Competition from China? J. Financ. 2018, 73, 2003–2039. [Google Scholar] [CrossRef]
- Chandra, P.; Long, C. Anti-Dumping Duties and Their Impact on Exporters: Firm Level Evidence from China. World Dev. 2013, 51, 169–186. [Google Scholar] [CrossRef]
- Sunder, J.; Sunder, S.V.; Zhang, J. Pilot CEOs and Corporate Innovation. J. Financ. Econ. 2017, 123, 209–224. [Google Scholar] [CrossRef]
- Handley, K. Exporting under Trade Policy Uncertainty: Theory and Evidence. J. Int. Econ. 2014, 94, 50–66. [Google Scholar] [CrossRef] [Green Version]
- Crowley, M.A.; Meng, N.; Song, H. Policy Shocks and Stock Market Returns: Evidence from Chinese Solar Panels. J. Jpn. Int. Econ. 2019, 51, 148–169. [Google Scholar] [CrossRef] [Green Version]
- Meng, N.; Milner, C.; Song, H. Antidumping and Heterogeneous Quality Adjustment of Multi-Product Firms: Evidence from Chinese Exporters. Econ. Model. 2020, 92, 147–161. [Google Scholar] [CrossRef]
- Xu, Z. Economic Policy Uncertainty, Cost of Capital, and Corporate Innovation. J. Bank. Financ. 2020, 111, 105698. [Google Scholar] [CrossRef]
- Cui, X.; Wang, C.; Liao, J.; Fang, Z.; Cheng, F. Economic Policy Uncertainty Exposure and Corporate Innovation Investment: Evidence from China. Pacific Basin Financ. J. 2021, 67, 101533. [Google Scholar] [CrossRef]
- Xu, Y.; Yang, Z. Economic Policy Uncertainty and Green Innovation Based on the Viewpoint of Resource Endowment. Technol. Anal. Strateg. Manag. 2021, 1–14. [Google Scholar] [CrossRef]
- Hermalin, B.E.; Katz, M.L. Moral Hazard and Verifiability: The Effects of Renegotiation in Agency. Econometrica 2012, 59, 1735–1753. [Google Scholar] [CrossRef] [Green Version]
- Forza, C. Performance from Integrated Pipeline Management: An Empirical Study. Int. J. Phys. Distrib. Logist. Manag. 1996, 26, 36–63. [Google Scholar] [CrossRef]
- Deng, Z.; Lev, B.; Narin, F. Science and Technology as Predictors of Stock Performance. Financ. Anal. J. 1999, 55, 20–32. [Google Scholar] [CrossRef]
- Ge, B.; Yang, Y.; Jiang, D.; Gao, Y.; Du, X.; Zhou, T. An Empirical Study on Green Innovation Strategy and Sustainable Competitive Advantages: Path and Boundary. Sustainability 2018, 10, 3631. [Google Scholar] [CrossRef] [Green Version]
- Crowley, M.; Meng, N.; Song, H. Tariff Scares: Trade Policy Uncertainty and Foreign Market Entry by Chinese Firms. J. Int. Econ. 2018, 114, 96–115. [Google Scholar] [CrossRef] [Green Version]
- Prusa, T.J. The Trade Effects of U.S. Antidumping Actions. World Sci. Stud. Int. Econ. 2021, 77, 21–43. [Google Scholar] [CrossRef]
- Hughes, J.S.; Lenway, S.; Rayburn, J. Stock Price Effects of U.S. Trade Policy Responses to Japanese Trading Practices in Semi- Conductors. Can. J. Econ. 1997, 30, 922–942. [Google Scholar] [CrossRef]
- Baron, R.M.; Kenny, D.A. The Moderator-Mediator Variable Distinction in Social Psychological Research: Conceptual, Strategic, and Statistical Considerations. J. Pers. Soc. Psychol. 1986, 51, 1173. [Google Scholar] [CrossRef]
- Liu, Q.; Qiu, L.D. Intermediate Input Imports and Innovations: Evidence from Chinese Firms’ Patent Filings. J. Int. Econ. 2016, 103, 166–183. [Google Scholar] [CrossRef]
- Kumbhakar, S.C.; Ortega-Argilés, R.; Potters, L.; Vivarelli, M.; Voigt, P. Corporate R&D and Firm Efficiency: Evidence from Europe’s Top R&D Investors. J. Product. Anal. 2012, 37, 125–140. [Google Scholar] [CrossRef] [Green Version]
- Choi, I. Unit Root Tests for Panel Data. J. Int. Money Financ. 2001, 20, 249–272. [Google Scholar] [CrossRef]
- Kim, D.W.; Yu, J.S.; Hassan, M.K. Financial Inclusion and Economic Growth in OIC Countries. Res. Int. Bus. Financ. 2018, 43, 1–14. [Google Scholar] [CrossRef]
- Zhao, J.; Shahbaz, M.; Dong, X.; Dong, K. How Does Financial Risk Affect Global CO2 Emissions? The Role of Technological Innovation. Technol. Forecast. Soc. Chang. 2021, 168, 120751. [Google Scholar] [CrossRef]
Figure 1.
The theoretical framework of the study.


Table 1.
Variable definitions.
| Variable Definition | English Symbols | Calculation Method |
|---|---|---|
| Trade environment uncertainty (UTE) | tradfrict | Total number of trade cases |
| AD | Number of anti-dumping cases | |
| AS | Number of countervailing cases | |
| SM | Number of Safeguards cases | |
| Green technology innovation (GTI) | grepat | Number of green patent |
| indpat | Number of green independent patent | |
| invpat | Number of green invention patent | |
| noinvpat | Number of green utility model patent | |
| Company assets | asset | Total enterprise assets are taken as the logarithm |
| Number of employees | staff | The number of employees in a company is taken as a logarithm |
| Asset-liability ratio | debt | Total liabilities/assets |
| Book-to-market ratio | bm | Total assets/Market value |
| Tobin Q | TobinsQ | Tobin’s Q value |
| Share proportion of the largest shareholder | Top1 | Percentage of shareholding of the largest shareholder |
| Herfindahl–Hirschman Index | HHI | Industry Concentration Index |
| Fixed assets ratio | fixasset | Fixed assets/Total assets |
| Company age | age | Current year—year of business establishment |
Table 2.
Descriptive statistics.
| Variable Name | Symbols | Sample Size | Average Value | Standard Deviation | Minimum Value | Maximum Value |
|---|---|---|---|---|---|---|
| Total trade cases | tradfrict | 15,875 | 4.057 | 5.611 | 0 | 40 |
| Anti-dumping | AD | 15,875 | 2.810 | 3.917 | 0 | 24 |
| Safeguards | AS | 15,875 | 0.561 | 1.135 | 0 | 8 |
| Countervailing | SM | 15,875 | 0.697 | 1.395 | 0 | 8 |
| Green technology innovation | grepat | 15,875 | 2.739 | 1.490 | 0 | 6.562 |
| Independent green innovation patent | indpat | 15,875 | 2.612 | 1.500 | 0 | 6.463 |
| Substantial green innovation output | invpat | 15,875 | 1.425 | 1.242 | 0 | 5.198 |
| Strategic green innovation Output | noinvpat | 15,875 | 1.179 | 0.673 | 0 | 2.493 |
| Company assets | asset | 15,875 | 21.914 | 1.146 | 19.888 | 25.341 |
| Number of employees | staff | 15,875 | 7.679 | 1.122 | 5.338 | 10.814 |
| Asset-liability ratio | debt | 15,875 | 0.389 | 0.200 | 0.049 | 0.909 |
| Book-to-market ratio | bm | 15,875 | 0.596 | 0.227 | 0.134 | 1.112 |
| Tobin Q | TobinsQ | 15,875 | 2.243 | 1.317 | 0.940 | 8.449 |
| Share proportion of the largest shareholder | Top1 | 15,875 | 0.342 | 0.140 | 0.091 | 0.722 |
| Herfindahl–Hirschman Index | HHI | 15,875 | 0.088 | 0.080 | 0 | 0.362 |
| Fixed assets ratio | fixasset | 15,875 | 0.134 | 0.121 | 0 | 0.541 |
| Company age | age | 15,875 | 13.934 | 6.933 | 3 | 28 |
Table 3.
VIF test.
| Variable | VIF | 1/VIF |
|---|---|---|
| asset | 3.73 | 0.27 |
| bm | 3.65 | 0.27 |
| TobinsQ | 3.20 | 0.31 |
| staff | 3.17 | 0.32 |
| age | 1.53 | 0.65 |
| debt | 1.42 | 0.70 |
| HHI | 1.10 | 0.91 |
| fixasset | 1.09 | 0.92 |
| top1 | 1.08 | 0.92 |
| Mean VIF | 2.13 |
Table 4.
Cross-sectional dependence test.
| Explanatory Variables | Explained Variables | Control Variables | CD | p-Value |
|---|---|---|---|---|
| tradfrict | grepat | Yes | 1.60 | 0.11 |
| AS | grepat | Yes | −1.26 | 0.21 |
| AD | grepat | Yes | −0.23 | 0.82 |
| SM | grepat | Yes | −0.23 | 0.11 |
| tradfrict | indpat | Yes | 0.27 | 0.79 |
| tradfrict | invpat | Yes | 1.23 | 0.22 |
| tradfrict | noinvpat | Yes | −1.60 | 0.11 |
Table 5.
Unit root test.
| Variable | I(0) | I(1) | Decision |
|---|---|---|---|
| tradfrict | 45.11 *** | 17.12 *** | I(0) |
| AS | 22.54 *** | 11.13 *** | I(0) |
| AD | 6.83 *** | −2.15 *** | I(0) |
| SM | 25.02 *** | 9.21 *** | I(0) |
| grepat | 42.77 *** | 24.13 *** | I(0) |
| indpat | 30.04 *** | 11.36 *** | I(0) |
| invpat | 28.27 *** | 11.75 *** | I(0) |
| invpat | 28.39 *** | 1.13 *** | I(0) |
| asset | 14.28 *** | 3.43 *** | I(0) |
| staff | 36.40 *** | 13.49 *** | I(0) |
| debt | 42.28 *** | 17.74 *** | I(0) |
| bm | 16.97 *** | 3.34 *** | I(0) |
| TobinsQ | 17.91 *** | 1.91 *** | I(0) |
| top1 | 25.38 *** | 7.68 *** | I(0) |
| HHI | −21.18 *** | −33.26 *** | I(0) |
| fixasset | 117.10 *** | 74.45 *** | I(0) |
| age | 5.80 *** | −2.23 *** | I(0) |
Note: *** is significant at 1% significant level, respectively.
Table 6.
Baseline regression results.
| Variable Name | OLS Benchmark Estimation Results | |||
|---|---|---|---|---|
| (1) | (2) | (3) | (4) | |
| Grepat | Grepat | Grepat | Grepat | |
| tradfrict | 0.012 ** (2.49) | |||
| AD | 0.016 *** (2.61) | |||
| AS | 0.018 (1.44) | |||
| SM | 0.005 (0.44) | |||
| asset | 0.371 *** (21.14) | 0.372 *** (21.13) | 0.372 *** (21.10) | 0.372 *** (21.10) |
| staff | 0.488 *** (30.24) | 0.488 *** (30.24) | 0.488 *** (30.23) | 0.488 *** (30.23) |
| debt | −0.375 *** (−6.51) | −0.375 *** (−6.52) | −0.375 *** (−6.52) | −0.375 *** (−6.52) |
| bm | −0.690 *** (−8.460) | −0.687 *** (−8.42) | −0.687 *** (−8.42) | −0.687 *** (−8.42) |
| TobinsQ | −0.040 *** (−3.16) | −0.040 *** (−3.13) | −0.040 *** (−3.18) | −0.040 *** (−3.18) |
| Top1 | −0.002 ** (−2.52) | −0.002 ** (−2.51) | −0.002 ** (−2.52) | −0.002 ** (−2.52) |
| HHI | −0.331 (−1.48) | −0.325 (−1.46) | −0.311 (−1.39) | −0.311 (−1.39) |
| fixasset | −0.957 *** (−10.94) | −0.956 *** (−10.94) | −0.954 *** (−10.91) | −0.954 *** (−10.91) |
| Age | −0.011 *** (−5.92) | −0.011 *** (−5.93) | −0.011 *** (−5.89) | −0.011 *** (−5.89) |
| Constant | −9.581 *** (−31.61) | −9.580 *** (−31.60) | −9.556 *** (−31.53) | −9.580 *** (−31.60) |
| Industry | Control | Control | Control | Control |
| Year | Control | Control | Control | Control |
| Sample size | 15,875 | 15,875 | 15,875 | 15,875 |
| AJ-R2 | 0.454 | 0.454 | 0.454 | 0.454 |
Note: **, and *** are significant at 5%, and 1% significant level, respectively.
Table 7.
Independent R&D test results.
| Variable Name | Independent R&D Inspection | |||
|---|---|---|---|---|
| (1) | (2) | (3) | (4) | |
| Indpat | Indpat | Indpat | Indpat | |
| tradfrict | 0.014 *** (2.74) | |||
| AD | 0.017 *** (2.62) | |||
| AS | 0.026 ** (2.27) | |||
| SM | 0.007 (0.66) | |||
| asset | 0.337 *** (18.32) | 0.337 *** (18.31) | 0.337 *** (18.29) | 0.337 *** (18.27) |
| staff | 0.474 *** (28.62) | 0.474 *** (28.63) | 0.474 *** (28.60) | 0.474 *** (28.60) |
| debt | −0.286 *** (−4.77) | −0.287 *** (−4.78) | −0.287 *** (−4.78) | −0.287 *** (−4.78) |
| bm | −0.565 *** (−6.60) | −0.562 *** (−6.56) | −0.563 *** (−6.57) | −0.561 *** (−6.55) |
| TobinsQ | −0.029 ** (−2.20) | −0.028 ** (−2.17) | −0.029 ** (−2.23) | −0.029 ** (−2.21) |
| Top1 | −0.002 *** (−3.18) | −0.002 *** (−3.18) | −0.002 *** (−3.18) | −0.002 *** (−3.18) |
| HHI | −0.278 (−1.21) | −0.268 (−1.17) | −0.257 (−1.12) | −0.247 (−1.07) |
| fixasset | −0.802 *** (−8.88) | −0.802 *** (−8.87) | −0.799 *** (−8.84) | −0.799 *** (−8.84) |
| Age | −0.013 *** (−6.93) | −0.013 *** (−6.93) | −0.013 *** (−6.90) | −0.013 *** (−6.88) |
| Constant | −8.902 *** (−27.99) | −8.898 *** (−27.96) | −8.873 *** (−27.90) | −8.874 *** (−27.89) |
| Industry | Control | Control | Control | Control |
| Year | Control | Control | Control | Control |
| Sample size | 15,875 | 15,875 | 15,875 | 15,875 |
| AJ-R2 | 0.417 | 0.417 | 0.417 | 0.417 |
Note: **, and *** are significant at 5%, and 1% significant level, respectively.
Table 8.
Substantial green innovation test results.
| Variable Name | Substantial Green Innovation Test | |||
|---|---|---|---|---|
| (1) | (2) | (3) | (4) | |
| Invpat | Invpat | Invpat | Invpat | |
| tradfrict | 0.007 * (1.73) | |||
| AD | 0.004 (0.74) | |||
| AS | 0.026 ** (2.27) | |||
| SM | 0.012 (1.29) | |||
| asset | 0.506 *** (31.87) | 0.505 *** (31.85) | 0.506 *** (31.87) | 0.505 *** (31.84) |
| staff | 0.221 *** (15.92) | 0.221 *** (15.92) | 0.221 *** (15.92) | 0.221 *** (15.92) |
| debt | −0.435 *** (−8.70) | −0.435 *** (−8.71) | −0.435 *** (−8.71) | −0.435 *** (−8.70) |
| bm | −0.915 *** (−12.34) | −0.913 *** (−12.31) | −0.915 *** (−12.34) | −0.914 *** (−12.33) |
| TobinsQ | −0.037 *** (−3.47) | −0.037 *** (−3.46) | −0.037 *** (−3.50) | −0.037 *** (−3.49) |
| Top1 | −0.002 *** (−3.32) | −0.002 *** (−3.31) | −0.002 *** (−3.32) | −0.002 *** (−3.32) |
| HHI | 0.002 (0.01) | 0.015 (0.08) | 0.006 (0.03) | 0.014 (0.07) |
| fixasset | −0.514 *** (−6.94) | −0.513 *** (−6.92) | −0.513 *** (−6.92) | −0.513 *** (−6.92) |
| Age | −0.012 *** (−7.24) | −0.012 *** (−7.22) | −0.012 *** (−7.23) | −0.012 *** (−7.21) |
| Constant | −11.146 *** (−40.65) | −11.135 *** (−40.60) | −11.132 *** (−40.62) | −11.133 *** (−40.61) |
| Industry | Control | Control | Control | Control |
| Year | Control | Control | Control | Control |
| Sample size | 15,875 | 15,875 | 15,875 | 15,875 |
| AJ-R2 | 0.380 | 0.379 | 0.380 | 0.379 |
Note: *, **, and *** are significant at 10%, 5%, and 1% significant level, respectively.
Table 9.
Results of strategic green innovation test.
| Variable Name | Strategic Green Innovation Test | |||
|---|---|---|---|---|
| (1) | (2) | (3) | (4) | |
| Noinvpat | Noinvpat | Noinvpat | Noinvpat | |
| tradfrict | 0.005 ** (2.46) | |||
| AD | 0.007 ** (2.45) | |||
| AS | 0.002 (0.26) | |||
| SM | 0.005 (1.13) | |||
| asset | 0.066 *** (8.09) | 0.066 *** (8.08) | 0.066 *** (8.05) | 0.066 *** (8.05) |
| staff | 0.234 *** (30.97) | 0.234 *** (30.97) | 0.234 *** (30.95) | 0.234 *** (30.95) |
| debt | −0.146 *** (−5.31) | −0.146 *** (−5.32) | −0.146 *** (−5.32) | −0.146 *** (−5.31) |
| bm | −0.114 *** (−2.93) | −0.113 *** (−2.91) | −0.112 *** (−2.89) | −0.113 *** (−2.91) |
| TobinsQ | −0.010 (−1.60) | −0.010 (−1.57) | −0.010 (−1.60) | −0.010 (−1.61) |
| Top1 | −0.001 (−1.46) | −0.001 (−1.45) | −0.001 (−1.46) | −0.001 (−1.45) |
| HHI | −0.082 (−0.81) | −0.080 (−0.79) | −0.070 (−0.69) | −0.073 (−0.72) |
| fixasset | −0.428 *** (−10.43) | −0.428 *** (−10.42) | −0.426 *** (−10.40) | −0.427 *** (−10.40) |
| Age | −0.001 (−1.25) | −0.001 (−1.25) | −0.001 (−1.21) | −0.001 (−1.21) |
| Constant | −2.423 *** (−17.23) | −2.423 *** (−17.23) | −2.412 *** (−17.16) | −2.414 *** (−17.17) |
| Industry | Control | Control | Control | Control |
| Year | Control | Control | Control | Control |
| Sample size | 15,875 | 15,875 | 15,875 | 15,875 |
| AJ-R2 | 0.394 | 0.394 | 0.394 | 0.394 |
Note: **, and *** are significant at 5%, and 1% significant level, respectively.
Table 10.
Robustness test I.
| Variable Name | Robustness Tests for Variable Substitution | |||
|---|---|---|---|---|
| (1) | (2) | (3) | (4) | |
| Grepat | Indpat | Invpat | Noinvpat | |
| Tradfrict USA | 0.018 * (1.72) | 0.033 * (1.75) | 0.031 *** (2.86) | −0.001 (−0.14) |
| asset | 0.372 *** (21.10) | 0.337 *** (18.28) | 0.506 *** (31.88) | 0.066 *** (8.05) |
| staff | 0.488 *** (30.23) | 0.474 *** (28.61) | 0.221 *** (15.92) | 0.234 *** (30.95) |
| debt | −0.376 *** (−6.53) | −0.288 *** (−4.80) | −0.436 *** (−8.73) | −0.146 *** (−5.32) |
| bm | −0.689 *** (−8.45) | −0.564 *** (−6.57) | −0.918 *** (−12.39) | −0.112 *** (−2.89) |
| TobinsQ | −0.041 *** (−3.20) | −0.029 ** (−2.22) | −0.038 *** (−3.55) | −0.010 (−1.60) |
| Top1 | −0.002 ** (−2.51) | −0.002 *** (−3.18) | −0.002 *** (−3.31) | −0.001 (−1.46) |
| HHI | −0.281 (−1.25) | −0.215 (−0.94) | 0.054 (0.28) | −0.070 (−0.69) |
| fixasset | −0.955 *** (−10.92) | −0.800 *** (−8.86) | −0.514 *** (−6.94) | −0.426 *** (−10.39) |
| Age | −0.011 *** (−5.87) | −0.013 *** (−6.89) | −0.012 *** (−7.20) | −0.001 (−1.21) |
| Constant | −9.554 *** (−31.52) | −8.876 *** (−27.90) | −11.129 *** (−40.61) | −2.411 *** (−17.16) |
| Industry | Control | Control | Control | Control |
| Year | Control | Control | Control | Control |
| Sample size | 15,875 | 15,875 | 15,875 | 15,875 |
| AJ-R2 | 0.454 | 0.417 | 0.380 | 0.394 |
Note: *, **, and *** are significant at 10%, 5%, and 1% significant level, respectively.
Table 11.
Robustness test II.
| Variable Name | Time Sample Robustness Test | |||
|---|---|---|---|---|
| (1) | (2) | (3) | (4) | |
| Grepat | Grepat | Grepat | Grepat | |
| tradfrict | 0.016 *** (2.74) | |||
| AD | 0.018 ** (2.48) | |||
| AS | 0.027 (1.56) | |||
| SM | 0.020 (1.42) | |||
| asset | 0.419 *** (17.51) | 0.418 *** (17.50) | 0.419 *** (17.50) | 0.418 ** (17.46) |
| staff | 0.418 *** (17.89) | 0.418 *** (17.88) | 0.420 *** (17.83) | 0.418 *** (17.85) |
| debt | −0.002 (−0.05) | −0.002 (−0.05) | −0.002 (−0.06) | −0.002 (−0.06) |
| bm | −0.630 *** (−7.93) | −0.630 *** (−7.90) | −0.630 *** (−7.93) | −0.636 *** (−7.87) |
| TobinsQ | 0.009 (1.21) | 0.009 (1.21) | 0.008 (1.16) | 0.008 (1.16) |
| Top1 | −0.002 ** (−2.03) | −0.002 ** (−2.04) | −0.002 ** (−2.05) | −0.002 ** (−2.03) |
| HHI | 0.232 (0.64) | 0.262 (0.72) | 0.313 (0.86) | 0.328 (0.91) |
| fixasset | −0.870 *** (−8.54) | −0.869 *** (−8.52) | −0.862 *** (−8.46) | −0.864 *** (−8.48) |
| Age | −0.018 *** (−7.63) | −0.018 *** (−7.63) | −0.017 *** (−7.60) | −0.017 *** (−7.57) |
| Constant | −10.059 *** (−25.92) | −10.056 *** (−25.91) | −10.080 *** (−25.97) | −10.078 *** (−25.96) |
| Industry | Control | Control | Control | Control |
| Year | Control | Control | Control | Control |
| Sample size | 10,744 | 10,744 | 10,744 | 10,744 |
| AJ-R2 | 0.437 | 0.437 | 0.436 | 0.436 |
Note: **, and *** are significant at 5%, and 1% significant level, respectively.
Table 12.
Heterogeneity test I.
| Variable Name | Test for Firm Size Heterogeneity | |||||||
|---|---|---|---|---|---|---|---|---|
| (1) | (2) | (3) | (4) | (5) | (6) | (7) | (8) | |
| Grepat | Grepat | Grepat | Grepat | Grepat | Grepat | Grepat | Grepat | |
| tradfrict | 0.017 ** (2.25) | 0.008 (1.40) | ||||||
| AD | 0.026 ** (2.48) | 0.009 (1.28) | ||||||
| AS | 0.042 * (1.82) | 0.003 (0.18) | ||||||
| SM | 0.004 (0.22) | 0.008 (0.67) | ||||||
| Control variables | Control | Control | Control | Control | Control | Control | Control | Control |
| Industry | Control | Control | Control | Control | Control | Control | Control | Control |
| Year | Control | Control | Control | Control | Control | Control | Control | Control |
| Sample size | 5066 | 5066 | 5066 | 5066 | 10,454 | 10,454 | 10,454 | 10,454 |
| AJ-R2 | 0.551 | 0.551 | 0.550 | 0.550 | 0.413 | 0.413 | 0.413 | 0.413 |
Note: * and ** are significant at 10%, and 5% significant level, respectively.
Table 13.
Heterogeneity test II.
| Variable Name | Heterogeneity Test of Shareholding Nature | |||||||
|---|---|---|---|---|---|---|---|---|
| (1) | (2) | (3) | (4) | (5) | (6) | (7) | (8) | |
| Grepat | Grepat | Grepat | Grepat | Grepat | Grepat | Grepat | Grepat | |
| tradfrict | 0.021 *** (2.58) | 0.005 (0.86) | ||||||
| AD | 0.031 *** (2.83) | 0.006 (0.85) | ||||||
| AS | 0.059 ** (2.44) | −0.008 (−0.56) | ||||||
| SM | 0.003 (0.14) | 0.012 (0.95) | ||||||
| Control variables | Control | Control | Control | Control | Control | Control | Control | Control |
| Industry | Control | Control | Control | Control | Control | Control | Control | Control |
| Year | Control | Control | Control | Control | Control | Control | Control | Control |
| Sample size | 4311 | 4311 | 4311 | 4311 | 11,209 | 11,209 | 11,209 | 11,209 |
| AJ-R2 | 0.564 | 0.564 | 0.563 | 0.563 | 0.412 | 0.412 | 0.412 | 0.412 |
Note: **, and *** are significant at 5%, and 1% significant level, respectively.
Table 14.
Enterprise sustainable development test.
| Variable Name | Corporate Performance Check | |||
|---|---|---|---|---|
| (1) | (2) | (3) | (4) | |
| Roa | Roa | Roa | Roa | |
| tradfrict | −0.019 *** (−3.56) | −0.020 *** (−3.71) | −0.019 *** (−3.88) | −0.019 *** (−3.63) |
| grepat | 0.055 *** (5.69) | |||
| invpat | 0.081 *** (5.28) | |||
| noinvpat | 0.029 *** (3.12) | |||
| Constant | 10.254 *** (29.05) | 10.833 *** (29.10) | 11.535 *** (19.11) | 11.535 *** (19.11) |
| Control variables | Control | Control | Control | Control |
| Industry | Control | Control | Control | Control |
| Year | Control | Control | Control | Control |
| Sample size | 15,875 | 15,875 | 15,875 | 15,875 |
| AJ-R2 | 0.360 | 0.362 | 0.362 | 0.362 |
Note: *** is significant at 1% significant level, respectively.
Publisher’s Note: MDPI stays neutral with regard to jurisdictional claims in published maps and institutional affiliations. |
© 2022 by the authors. Licensee MDPI, Basel, Switzerland. This article is an open access article distributed under the terms and conditions of the Creative Commons Attribution (CC BY) license (https://creativecommons.org/licenses/by/4.0/).
Share and Cite
MDPI and ACS Style
Sun, W.; Yu, M.; Zhang, H.; Zhang, Y. Does Uncertainty of Trade Environment Promote Green Technological Innovation? Empirical Evidence from China. Sustainability 2022, 14, 16195. https://doi.org/10.3390/su142316195
AMA Style
Sun W, Yu M, Zhang H, Zhang Y. Does Uncertainty of Trade Environment Promote Green Technological Innovation? Empirical Evidence from China. Sustainability. 2022; 14(23):16195. https://doi.org/10.3390/su142316195
Chicago/Turabian StyleSun, Weize, Mingtao Yu, Haotian Zhang, and Yifan Zhang. 2022. "Does Uncertainty of Trade Environment Promote Green Technological Innovation? Empirical Evidence from China" Sustainability 14, no. 23: 16195. https://doi.org/10.3390/su142316195
Note that from the first issue of 2016, this journal uses article numbers instead of page numbers. See further details here.