Article

Automotive Electrification Challenges Shown by Real-World Driving Data and Lifecycle Assessment

1
Mercedes-Benz AG, Bela-Barenyi-Straße, 71059 Sindelfingen, Germany
2
Chair of Electric Mobility and Energy Storage Systems, University of Wuppertal, Rainer-Gruenter-Str. 21, 42119 Wuppertal, Germany
3
Chemical Engineering and Material Science Department, IQS School of Engineering, Universitat Ramon Llull, Via Augusta 390, 08017 Barcelona, Spain
4
Institute for Particle Technology, University of Braunschweig, Volkmaroder Str. 5, 38104 Braunschweig, Germany
*
Authors to whom correspondence should be addressed.
These authors contributed equally to this work.
Sustainability 2022, 14(23), 15972; https://doi.org/10.3390/su142315972
Submission received: 2 November 2022 / Revised: 19 November 2022 / Accepted: 25 November 2022 / Published: 30 November 2022

Abstract

:
Electric mobility is considered a solution to reduce carbon emissions. We expanded a lifecycle assessment with data on technical limitations and driving habits (based on real-world data) in order to identify the environmentally optimal drivetrain for each individual driving behavior with current and projected technologies, focusing on CO2 emissions. By combining all data, an environmentally optimal European drivetrain mix is calculated, which is dominated by fuel-cell electric vehicles (50% in 2020, 47% in 2030), followed by plug-in hybrid-electric vehicles (37%, 40%), battery-electric vehicles (BEV) (5%, 12%), and Diesel vehicles (2%, 1%). Driving behavior defines the most environmental drivetrain and the coexistence of different drivetrains is currently still necessary. Such information is crucial to identify limitations and unmet technological needs for full electrification. If range is not considered a limitation, the environmentally optimal drivetrain mix is dominated by BEVs (71%, 75%), followed by fuel cell electric vehicles (25%, 19%) and plug-in electric vehicles (4%, 6%). This confirms the potential environmental benefits of BEVs for current and future transportation. Developments in battery energy density, charging, and sustainable production, as well as a change in driving behavior, will be crucial to make BEVs the environmentally optimal drivetrain choice.

1. Introduction

The automotive industry is currently facing several profound changes. Electrification in order to reduce greenhouse emissions, driven by government subsidies [1,2], is a major one among them. The assumption that electric vehicles (EVs), i.e., all vehicles with an electric drivetrain, produce less carbon dioxide (CO2) emissions than conventional internal combustion engine vehicles (ICVs) has been questioned by some studies, due to the different steps involved in a vehicle life cycle affecting its CO2 emissions such as production, energy supply, usage, and recycling [3,4,5,6]. Firstly, the extraction method of raw materials needs to be considered. For EVs, the extraction of raw materials is particularly significant [7,8]. Secondly, as in any other energy intensive production process, the efficiency of the processes used in the battery and vehicle production will have an impact on the energy requirements and, therefore, on CO2 emissions. Moreover, the emissions during production will also depend on the energy mix being used. Thirdly, the energy supply technology (i.e., petrol or diesel for ICVs, grid electricity for EVs, and hydrogen for fuel-cell EVs) employed during the vehicle’s usage affects the level of CO2 emissions. Especially for EVs, even though they are characterized by zero direct emissions at a local level, the applied energy mix during energy supply for the vehicle’s usage is a decisive factor for emissions, as these emissions will depend on the type of technology being used for electricity generation (wind, solar, thermal, nuclear, etc.). On the other hand, ICVs will have significant local direct emissions, since the main emission factor is local combustion while driving, rather than energy supply (i.e., the emissions during petrol and diesel fuel production). Fourthly, the high impact of vehicle recycling on the overall CO2 contribution of a vehicle over its whole life cycle is also to be considered.
Life cycle assessment (LCA) is a useful tool to evaluate the environmental impact of a product or system over its whole life cycle, including direct and indirect pollution [4,6,9], and has been standardized in the norm ISO 14040:2006 [10]. Its components are clustered into the following categories: production, energy supply, usage, and end of life (EoL) [4,9]. The emissions during transport stages are considered in each corresponding category. While this standardized method considers impacts on air, water and ground, the present study is only addressing the analysis of CO2 emissions.
From an LCA perspective, EVs pose a number of challenges. Regarding emissions resulting from vehicle production with current technology, raising electrification involves a clear-cut increase in contribution to global warming potential due to battery mass and technical complexity [6]. As previously mentioned, at the energy supply level, CO2 emissions resulting from EVs depend on their energy generation method, whether being generated by renewables, lignite, gas, atoms, or others [11,12].
Findings from the main published LCAs in which advantages and disadvantages of different types of drivetrains have been identified [3,4,5,6] are summarized and compared in Figure 1. Such studies show diverse results regarding the drivetrain types and their carbon footprints. Although studies identified battery electric vehicles (BEVs) as beneficial in CO2 emissions compared to ICVs [13,14], others show only a limited advantage for BEV compared to Diesel ICVs (see Figure 1). Although, other investigations have suggested the carbon footprint for BEVs to be actually inferior than Diesel ICVs [15]. Taking into account such heterogeneous findings, the need for a holistic LCA becomes apparent.
It must be stressed, however, that not all technologies that are beneficial in an LCA will necessarily be beneficial in some specifically real applications. For example, higher CO2 emissions in the production of EVs need to be offset by zero emissions in local driving. When the number of driven kilometers is low, compensation for higher CO2 emissions in production cannot be reached, thus making an EV more harmful for the environment than driving an ICV. For BEVs, studies have shown that the number of kilometers that need to be reached, in order to compensate for higher emissions during production, is between 80,000 km and 100,000 km [16].
Currently existing EVs do not fully satisfy the driving needs of all customers. Due to range limitations, battery electric vehicles might not allow frequent long-distance driving. Instead, ICVs might be used as a second car to meet single long trip needs. However, in such cases, taking into account the CO2 emissions resulting from production and recycling, the use of a single ICV car appears to be environmentally more beneficial than acquiring an additional EV.
Furthermore, there are certain challenges linked to the implementation of EVs in Europe. Macioszek addressed issues associated with EVs in some European countries, such as Poland, in which the demand for EVs is still low [17]. Such issues can be partly improved by energy management strategies for EVs, which improve efficiency and reduce consumption of such vehicles [18]. Nevertheless, development of charging infrastructure as well as the required time to charge a vehicle remain relevant for implementation of EVs [19].
A holistic analysis to take into account not only the LCA, but also user driving behaviors, technical requirements, and the individual applicability to identify the individual environmental benefit of each technology, appears to be needed.
In order to clarify the current debate on EVs’ eco-friendliness, we aimed at using real driving data to analyze the different drivetrain types (Otto, Diesel, plug-in hybrid electric vehicle (PHEV), battery electric vehicle, fuel cell electric vehicle (FCEV), fuel cell plug-in hybrid electric vehicle (FC-PHEV)) from an LCA perspective and select the most favorable drivetrain type for specific customers based on their driving patterns, from an environmental perspective, using both current data and projections for 2030 in Europe.
The aim of the present study was to determine the mix of drivetrain types that would be environmentally optimal, i.e., with the lowest CO2 emissions in Europe (defined as the “environmentally optimal drivetrain mix”) with current technologies by considering driving data, LCA data, and technical limitations. The environmentally optimal drivetrain mix was also calculated if EV driving range was not considered a limitation in order to determine the potential environmental benefits of BEVs.
The content of the present study was presented as follows. In the methods section, firstly, the driving profile database was described. Secondly, the driving parameters and assumptions that were considered to determine the environmentally optimal drivetrain were defined. Thirdly, the CO2 emissions calculations based on the previous criteria for each drivetrain type were shown. Fourthly, the selection process of the most favorable drivetrain type was defined. In the results section, firstly, the statistical parameters of the database were presented. Secondly, the CO2 emissions per vehicle based on the collected LCA data were shown. Thirdly, the environmentally optimal drivetrain mix was presented, both with and without range limitations for BEVs. Fourthly, the results of the sensitivity analysis were included. Finally, in the discussion section, each result is commented and compared with previous literature.

2. Literature Review

A literature search in Web of Science database (last 5 years, date 12 November 2022; keywords: electric vehicles; life cycle assessment; combustion engine; fuel cell electric vehicle; environmental impact; passenger) revealed that no previous study had used LCA data and driving data to determine the environmentally optimal drivetrain. From the 8 studies resulting from this literature search, 7 original papers that investigated the environmental effects of different drivetrains were identified. None of these used driving behavior data as a parameter.
Rosenfeld et al., calculated the global warming potential of different drivetrains, and determined that for FCEVs and BEVs it was up to 50% higher than ICVs during production; however, BEVs and FCEVs had a lower global warming potential (45% and 35% respectively) than ICVs when the entire life cycle was considered [20]. Sacchi et al., estimated via time-adjusted LCA data that BEVs would generate less emissions in most European countries than ICVs in the future [21]. Nordelöf et al. determined via LCA that in some cases, diesel hybrid buses would be preferable than buses using PHEV or BEV drivetrains [22]. Candelaresi et al. compared the environmental performance between different hydrogen-based drivetrain types [23]. A study by Harzendorf et al. introduced a “domestic value added” indicator to a life cycle sustainability assessment and used it to compare BEVs and FCEVs with ICVs; their results showed that BEVs were more advantageous than ICVs from this perspective and that FCEV had the highest potential [24]. Koj et al. compared the use of excess energy in power-to-transport chains that included BEVs, FCEVs, and ICVs, and determined that BEVs showed the lowest environmental effects [25]. Haase et al., conducted a sustainability assessment for BEV, FCEV, and ICV drivetrains in combination with different energy sources, and determined that BEVs with wind power would be the most sustainable option from 2020 to 2050 in Germany, followed by ICVs with synthetic biofuel in 2020 and FCEVs in 2050 [26].

3. Methods: Analysis of the Environmentally Optimal Drivetrain Mix

An analysis of real consumer driving data was used to calculate the theoretical optimal drivetrain mix that minimizes the carbon footprint according to published LCA data, based on the selection of the most environmental favorable powertrain type for each specific driver.
A dataset of 60,000 virtual vehicle (VV) profiles, based on real driving data from Mercedes-Benz vehicles, has been used. This dataset is based on a collection of driving data points that are converted into VV profiles which can be useful for analyzing driving patterns for different types of vehicles. A VV profile is defined by the following parameters: type of model, type of fuel, typical daily range, yearly kilometers, share of electrical range for PHEV, and typical daily amount of kilometers over one year. VV profiles are available for different vehicle segments. To ensure a widely representative sample, S-Class luxury vehicles were excluded from this data set. From the total VV data that are available, a total of 9328 VVs included data from the European region for an entire year. Therefore, our analysis is based on this subset of VVs. Statistical characteristics of the presented data are detailed in the result section.
In the present study, the following segments were considered for separate analyses: compact-size, sport utility vehicles (SUV), and upper mid-size. The following drivetrain types are examined to select the most environmentally favorable one for each individual VV: Otto ICVs, Diesel ICVs, BEVs, PHEVs, FCEVs, and FC-PHEVs [27].
The selection of the most environmentally favorable drivetrain for each individual VV was based on the following driving parameters, assumptions, forced-selection criteria, and LCA calculation:
Driving parameters: (a) long-range requirement (km): the amount of km that an individual VV needs to be able to achieve with one charge based on its longest trip over the year; (b) overall km per year; (c) share of electric drive (%) (only for PHEV): proportion of driving performed with the electric drivetrain, with the rest being performed with internal combustion drivetrain; (d) type of vehicle (compact-size, SUV, and upper mid-size) used to determine the maximal life cycle mileage, i.e., the maximal amount of km that the vehicle will be able to reach in its life cycle (160,000 km for the compact segment, 200,000 km for upper mid-size and 250,000 km for SUV) [28]; (e) typical daily drive (km), which was used to remove outliers from the database.
Assumptions: (a) Due to battery aging, it is assumed that BEV battery’s life is 12 years, since the battery will have lost a significant part of its capacity after this period; this is an acceptable assumption since published data on battery lifespan ranges from 8 to 15 years [29,30,31]. Battery swapping models are complex and currently not foreseen for passenger vehicles (although they could be viable for electric buses in public transportation [32]), so it is assumed the vehicle needs to be scrapped after the 12 years lifetime, even if the maximal life cycle mileage has not been achieved. (b) Therefore, for each data point, LCA calculations are based on the life cycle maximal mileage, if achieved. Otherwise, the amount of km in life cycle is calculated by multiplying the yearly drive (km/year) with 12 (years). (c) To ensure comparability between BEVs and ICVs, for ICVs if the total amount of km is higher than the maximal life cycle mileage for the car segment, the maximal life cycle mileage value is assumed. Otherwise, the real value is kept.
Forced selection criteria: (a) If the long-range requirement cannot be met for an individual VV with the BEV electric range without charging during the trip, BEV is excluded from the selection of the optimal drivetrain. Even though “supercharger hopping” could be a possibility, it is excluded from the present study as it is only relevant for performance vehicles, since the majority of vehicles do not have fast charging capabilities; (b) Climatic conditions can affect the vehicle’s range [33], e.g., range reduction due to low temperature. Therefore, for a BEV to be viable in all conditions, a range reduction due to climatic conditions is set to 35% based on different publications [34,35].
Assumed parameters for each car segment are summarized in Table 1. Consumption data and CO2 emissions data used in the study, as well as their source references are shown in online Supplementary Tables S1 and S2, respectively.
The following formulas are used to calculate the CO2 emissions for each drivetrain type and each VV. Emissions for the Otto engine (EO) are shown in Equation (1). See Abbreviations section to find the abbreviations:
EO = EP + LD × FC × EFS + LD × EDU + EL ,
where EP are the emissions during production in kg CO2/vehicle, LD is the lifecycle distance in km, FC is the fuel consumption in liters/km, EFS are the emissions during fuel supply in kg CO2/liter, EDU are the emissions during driving usage in kg CO2/km, and EL are the emissions during end of life and recycling in kg CO2/vehicle. Emissions for Diesel engine (ED) are shown in Equation (2):
ED = EP + LD × FC × EFS + LD × EDU + EL ,
where abbreviations are the same as in Equation (1). Emissions for BEV (EB) are shown in Equation (3):
EB = EP + LD × EC × EES + EL ,
where EC is the energy consumption during driving in kWh/km, and EES are the emissions required for electricity supply in kg CO2/kWh (based on the corresponding energy mix). Emissions for PHEV (EPH) are shown in Equation (4):
EPH = EP + LD × ( 1 ES ) × FC × EFS + LD × ( 1 ES ) × EDU + LD × ES × EC × EES + EL ,
where ES is the full electric driving share for each PHEV in %. Finally, emissions for FCEV (EF) are shown in Equation (5):
EF = EP + LD × HC × EHS + EL ,
where HC is hydrogen consumption in kg H2/km and EHS is the emissions for hydrogen supply in kg CO2/kg H2.
With these equations, CO2 emissions for each type of drivetrain and each individual VV are calculated based on driven kilometers, and the most beneficial type of drivetrain regarding carbon footprint is identified for each VV. The PHEV fuel consumption and electricity consumption needs to be considered specifically depending on each individual trip profile due to the difference in emissions when driving with the electric motor or the combustion engine. Consumption data by car manufacturers are not precise enough for our estimations because they only provide a standardized value that already combines electric and combustion engine driving. Thus, consumption data from comparable BEV and ICV within the equivalent segment were taken and applied to the specific electric drive share from each individual VV based on real driving use (see Equation (4)).
CO2 emissions resulting from production and EoL are drawn from published emission permits [36,37,38,39,40,41], shown in online Supplementary Table S3. Such data are supplemented with information from a survey by Allgemeiner Deutscher Automobil-Club (ADAC) [42] and the Fraunhofer Institute [43]. Although the industry objective is to reduce CO2 emissions from production, the same data is assumed for 2020 and 2030 projections, since the increase in battery size per vehicle could also result in an increase in CO2 emissions per vehicle, thereby compensating any emissions reduction during production. CO2 emissions generated by the production and supply of electricity, hydrogen and fuel are based on the analyses by Bloomberg [44], the Fraunhofer Institute [43], ADAC [42], and the Federal Office for Motor Vehicles Germany (KBA) [27]. Thus, the European electricity mix is applied. CO2 emissions through energy consumption are based on segment-specific information from the KBA and car manufacturers. All calculations are based on the New European Driving Cycle (NEDC) since only limited data are available from the Worldwide Harmonized Light Vehicles Test Procedure (WLTP).
The selection of the most environmentally favorable drivetrain type for each VV was then repeated using projected values for 2030. However, for this prospective scenario, values for production and EoL were set equal to current ones due to the lack of reliable projections. All the values used and their respective source can be found online in Supplementary Table S3. The projected CO2 emissions in electricity and hydrogen supply in 2030 by Bloomberg [44] and the Fraunhofer Institute [43] were used. Improvements in fuel production are expected to reduce its carbon footprint in the next years. For our analysis we used the reduction projection in CO2 emissions generated by fuel supply expected in 2030 based on the Volkswagen’s Golf LCA [45]. According to an existing investigation, emissions due to fuel consumption are reduced by 1% per year [46]. A similar improvement is assumed to occur in EVs. Regarding assumptions and forced selection criteria, ranges will change due to technical improvement. However, as it is currently unknown whether the range will be increased or battery size will be reduced, provided range is set constant for 2030.
By collecting the calculated drivetrain choice for each driving profile data point, shares of each drivetrain (BEV, Diesel, FCEV, FC-PHEV, PHEV, etc.) in percentages are determined. The available VV data set that was used for the calculations contains amounts of vehicles per segment (compact, mid-size, SUV, etc.) that do not necessarily represent the vehicle segment shares in Europe. This is mainly because the available data set included a large number of vehicles in the compact segment. Therefore, the collected shares of each drivetrain do not fully represent the optimal drivetrain shares in Europe. Thus, in order to optimize comparability, the resulting shares of each vehicle segment were adapted considering known European market percentages of each individual segment (compact: 38%; mid-size: 21%; SUV: 41%) [47]. With that, the environmentally optimal drivetrain mix in Europe is determined, both for 2020 and 2030.
Moreover, several sensitivity analyses were performed to assess the impact of different assumptions such as energy mix, vehicles’ lifetime, and CO2 emissions resulting from production or recycling. The sensitivity analysis for electric range was conducted by re-calculating the market shares with a 10% range increase. For the vehicle lifetime the sensitivity analysis was conducted with a 10% increase. For the CO2 emissions during battery recycling, a generic 700 kg CO2 block of emissions per BEV is included into the calculation. For the CO2 emissions during vehicle production, since they could vary, more or less, depending on the energy mix of the producing country, the sensitivity analysis was conducted considering both a 10% increase and 10% decrease. The assessment of this sensitivity analysis is included in the results section.
The selection of the most environmentally favorable drivetrain type for each VV was also repeated by removing any range limitations for all vehicle types. The forced selection criteria that considered range limitations were removed, and the environmentally optimal drivetrain mix for 2020 and 2030 considering no range limitations was calculated.

4. Results

Data from 9328 VVs (A-class model [compact-size] 7515; GLC model [SUV] 628, E-class model [upper mid-size] 1185) were used for the current estimations. The average long-range requirement is 373 ± 170 km (median: 339 km; range: 40–1453 km). Average distance per year (mean ± SD) is 20,437 ± 14,920 km/year (median: 16,337 km/year; range: 1710–152,120 km/year). The average share of electric drive is 54 ± 15% (median: 54%; range: 16–96%). Average daily drive is 67 ± 59 km (median: 53 m; range: 6–497 km) (see Figure 2).
A summary of CO2 emission estimations for each individual segment and powertrain type as well as the corresponding sources of data is shown online in Supplementary Table S3.
Before considering driving patterns, overall LCA results showed BEVs to have the lowest CO2 emissions level for each individual segment. All other EVs outperformed ICVs too. As expected, in spite of their lower production impact on carbon footprint, ICVs showed the highest overall carbon footprint impact due to their CO2 emissions resulting from usage. This is illustrated in Figure 3 for the largest segment—SUV. Similar findings were observed in all other segments (see online Supplementary Figures S1 and S2).
When considering carbon footprint results combined with real driving patterns, technical requirements, and individual applicability, the drivetrain mix preference appears to be different. Figure 4 shows a scatterplot of all individual VV, based on long distance requirement and distance per trip. In this diagram a color code has been assigned to each VV to show the selected environmentally optimal drivetrain based on the lowest carbon footprint assessed with the aforementioned equations. This illustrates, for example, the driving patterns for which FCEVs are still preferable, from an environmental point of view with currently available technology, are the ones with the combined higher long-distance requirement and highest distance-per-trip driving patterns. Projected results for 2030 are also shown. Results for each individual segment are shown in online Supplementary Figures S3–S8.
Figure 5 displays the share of each type of vehicle as the environmentally preferred option in the whole VV sample (all segments). This reflects the final environmentally optimal drivetrain mix, which was calculated by adapting the results to the European vehicle segment shares.
In the present time analysis (Figure 5a), FCEVs (50%) outperform PHEVs (37%). FC-PHEVs (7%), BEVs (5%), and Diesel (2%) represent also a relatively small, but still relevant, amount of the overall drivetrain mix. In both scenarios, Otto ICVs are not represented as they are only slightly beneficial in their CO2 emissions in production compared to Diesel ICVs. Such small benefit cannot compensate for higher CO2 emissions from fuel consumption.
The projected results for 2030 in the whole series show a reduction in the proportion of VV, preferably requiring ICVs (Figure 5) as shown in the results: FCEVs (40%) shows a 10% reduction, whereas PHEVs (40%) shows a 3% increase. The highest growth is found for BEVs (12%) with a 7% increase, whereas FC-PHEV do not persist in 2030 anymore. Diesel ICVs remain in 1% of VV.
The environmentally optimal drivetrain mix was also calculated by removing any range limitation for all BEVs and FC-PHEVs. The results are shown in Figure 6 and Figure 7. BEVs dominate with 71% in 2020 and 75% in 2030, followed by FCEVs with 25% in 2020 and 19% in 2030. Share of PHEV is minimal with 4% in 2020 and 6% in 2030, and ICVs are not part of the drivetrain mix.
Due to the dependency of the identified energy mix on the assumptions, a sensitivity analysis was performed to evaluate the robustness of our results. Lifetime was a forced-selection criterion when either surpassing the vehicle’s lifetime in mileage or reaching the maximal 12-year lifetime. An increase in lifetime by 10% does not result in any changes in the share of ICVs (0% and 2%), BEVs (5%), and PHEVs (37%), but has a strong noticeable influence in hydrogen vehicles with a 15% shift from FCEV (from 50% to 35%) to FC-PHEV (from 7% to 22%). This redistribution can be explained by the increasing ability of FC-PHEVs to overcome higher emissions in production by the utilization of longer battery driving operations with lower CO2 emissions compared to the FCEV hydrogen-based electric driving.
Since the recycling process of batteries represents a major part of the carbon footprint of EVs, in an additional sensitivity analysis, a block of 700 kg CO2 emissions per BEV is added generically. Even though, in this scenario, emissions due to EoL are almost doubled for mid-sized BEVs and almost quadrupled for compact BEVs, there are only very small changes in their distribution. Additionally, since CO2 emissions due to production are very diverse, another sensitivity analysis included either a 10% increase or a 10% reduction of such CO2 emissions. Only a slight negative impact on the advantage of PHEVs (from 37% to 35%) and FC-PHEVs (from 7% to 3%) was observed, which are compensated by FCEVs (from 50 to 54%) and Diesel ICVs (from 2% to 4%). The distribution of BEVs was unaffected. If used recycled batteries could be re-integrated in the supply chain, i.e., through a circular economy approach, recycling could be considered an opportunity to reduce the carbon footprint for future battery production. However, this is not within the scope of the present study.

5. Discussion

Based on a large series of VV derived from real-world driving patterns in Europe and using published LCA data to assess the CO2 footprint, the study identifies the most environmentally friendly type of drivetrain for 9328 individual VVs defined by current technical limitations, real world driving habits, and other influencing factors. The mix of selected drivetrain types for best environmental results based on current technology and data and projections for 2030 shows PHEVs and FCEV to be the predominant choices. In the current scenario BEVs have only a minor role in the optimal drivetrain mix. Interestingly, projections for 2030 show some increase in their share. Nevertheless, their role is projected to still be minor, which shows a clear need for technology improvements for the full electrification of the automotive sector to be environmentally favorable, particularly regarding batteries allowing higher vehicle range for usual trips and/or fast charging technology and infrastructure to fulfill long distance requirements.
Due to complexity and variability in lifecycle emissions of current and future vehicles, for example due to the diversity of vehicle recycling processes or the many factors that affect vehicle production emissions (e.g., location, type of energy supply, efficiency, etc.), several assumptions were made. Our sensitivity analyses show that the findings are also robust with varying inputs for recycling and production emissions.
Previous studies on LCA results for different types of vehicles [3,4,5] showed an expected overall carbon footprint advantage for BEVs over other drivetrain types. Other studies have also shown that CO2 emissions from BEVs will highly depend on location and timing of charging [48]. This study, based on a large number of VVs, has revealed that when individual driving patterns are considered, non-BEV vehicles continue to be the most environmentally friendly for certain driving patterns both currently and in 2030 projections, as shown in Figure 4. Again, this clearly illustrates the current and predicted technological limitations that need to be solved to allow full electrification.
Carbon footprint is a widely and diversely discussed topic, which is becoming increasingly crucial in the automotive sector, and has driven the development of the different types of drivetrains. In particular, EVs are coming to the forefront. However, in spite of EVs being advantageous due to their zero-emission local drive [3,4,12,49,50,51,52], some environmental drawbacks are found when considering the vehicles’ whole lifecycle. This is mainly due to vehicle production [3,6] and to the electricity and hydrogen generation [15,53].
As shown in our results for 2030, the predominance of BEVs in our projected optimal drivetrain mix will be even more pronounced in the future with the increasing degree of green electricity within the electricity mix. The main reason is that, with greener electricity, the emissions of BEVs during their lifecycle are reduced, and in many more VV BEVs become the best environmental choice, i.e., the share of BEVs in our drivetrain mix is increased. This trend is not yet observable for FCEV. However, as soon as hydrogen provision is solely generated by renewables, FCEVs will outperform BEVs due to the approximation of CO2 emissions in energy supply combined with lower production values. In fact, production of clean hydrogen is one of the main technological challenges for widespread FCEV implementation [54,55]. Furthermore, a reduction of CO2 emissions during BEV production would also impact this analysis.
When considering real user driving behaviors and technical regulations, together with LCA findings, the optimal environmental drivetrain mix of passenger cars in Europe is clearly dominated by FCEVs (50%), followed by PHEVs (37%), FC-PHEVs (7%), and BEVs (5%). Diesel (2%) represents a relatively small amount of the overall drivetrain mix. Both in sole LCA analysis and in the overall holistic analysis, Otto ICVs have no share. Our findings show the increasing potential of EVs, and a significant remaining role is identified for ICVs in the near future.
What clearly stands out in our results is the limited amount of BEV in our optimal drivetrain mix. This shows that limited range appears to be a main driver for the selected environmental drivetrain mix. The low share of BEVs can be explained by the high burden resulting from battery production and limited range abilities. However, this is expected to change in the future. First, the development of battery technologies is expected to provide a clear increase in energy density, the main industry trends being solid-state batteries [56,57] and silicon anodes [58,59]. Such developments would allow the use of smaller batteries per vehicle or reduce the range limitations of present battery technology, both of which could increase the amount of BEVs in our optimal drivetrain mix. Second, battery and vehicle production with energy from renewable sources, as already being targeted by some European companies such as Northvolt [60], Automotive Cell Company [61], or Verkor [62], will also contribute. In the present study, the same CO2 emissions data from vehicle production have been assumed for 2020 and 2030, but with major industrial and infrastructure efforts this could be significantly reduced. Technological efforts on both these areas will be key to increasing the amount of BEVs in the optimal drivetrain mix and to reduce CO2 emissions in the passenger vehicle sector. Furthermore, improvements in vehicle energy efficiency will be key to reduce CO2 emissions during vehicle use [63].
Furthermore, an additional important factor that should be considered is that the driving habits that were used in this study are mostly ICV-based. Such driving habits could be maintained with innovative charging technologies, such as high-power charging [64]. In fact, a study by Zhang et al. showed that fast charging directly reduces range anxiety, i.e., the psychological condition related to needing to find a vehicle charger, when the battery level is low [65]. Another possibility is that driving behavior could change in the future; for example, a BEV driver could plan a longer charging time for its long-distance travel, which would remove the long distance travel limitation, making BEV possibly the environmental drivetrain choice. This could increase the share of BEVs in our drivetrain mix.
In contrast, zero emission long range abilities are the clear advantage of FCEVs. Only in production and energy supply values are FCEVs inferior to ICVs. However, it should be taken into account that FCEV durability, costs, and the required raw materials could be significant limiting factors for FCEV implementation [8], which have not been considered in the present study. PHEVs are evaluated to be a good solution providing electric drive while simultaneously offering long-range abilities. In segments not being operated by FCEVs, as occurs in the compact segment, ICVs are still an important technology for use cases of long-range requirements combined with long average driving range.
The most beneficial use cases for BEVs are characterized by profiles in which mileage requirements can be satisfied by the BEVs maximum range, with the average daily trip distance being at the same time above the electric range of PHEVs. Regarding profiles with average daily trip distance within the PHEV’s electric range, both, BEVs and PHEVs are selected. The fundamental threshold for BEVs outperforming PHEVs or vice versa is defined by lower CO2 emissions in the PHEV production stage. In case of single daily trips being above the PHEV’s electric range, BEVs are able to offset higher emissions in production by the PHEV’s share of combustion drive. The BEV’s best use case supports existing literature, defining BEVs as the most suitable solution for short distances [66,67]. Moreover, the assumption based on this literature regarding BEVs being most beneficial for small vehicles is strengthened by the absence of BEVs in the segment of upper mid-size vehicles and its relatively small share in the SUV segment.
In our study, PHEVs are reasonable for driving profiles of low- to medium-range requirements and small to medium average daily usage, mostly coexisting with BEVs in low-ranges. PHEVs’ CO2 emissions in production are below BEVs and FCEVs, whereas PHEVs also benefit from their lower CO2 emissions by electricity supply compared to hydrogen. However, for use cases of longer single trips or average daily usages above the electric range provided by PHEVs, FCEVs are able to outperform PHEVs. FCEV’s zero emission local drive by hydrogen is advantageous compared to PHEV’s fuel combustion and FCEVs are still able to compensate for higher CO2 emissions in production.
In the absence of FCEVs, for instance in the compact segment, PHEV is the dominant concept in almost all driving profiles. The incorporated combustion engine eliminates range limitations, which is a critical factor for BEVs, whereas electric driving meets the requirement of the zero emissions local drive. However, as the CO2 emissions in production are above Diesel ICVs, PHEVs are outperformed by the combustion engine in profiles having very long average daily trips.
Compared to other EVs, FCEVs are not restricted by any range limitations. This could change in the future if fast charging technologies, such as megawatt charging, were available, and driving efficiency was improved [68], as they would allow long distance travel for BEVs and remove their range limitations. Moreover, CO2 emissions in production only slightly exceed the PHEV and Diesel production values. For these reasons and their local zero emissions, FCEVs dominate almost all use cases of upper mid-size vehicles. However, due to beneficial CO2 emission values from electricity generation compared to hydrogen, use cases met by BEVs electric range abilities are dominated by this technology, as soon as higher CO2 emissions in production are compensated. This is in line with the literature stating FCEVs to be most beneficial for large vehicle segments [66,67].
As indicated by our literature review, Diesel ICVs are environmentally beneficial compared to Otto ICVs from a LCA perspective. In the absence of FCEVs and FC-PHEVs, Diesel ICVs are identified to have lower carbon footprint in use cases of long-range requirements combined with the long-range average trip distance. Their main advantage is their lack of range limitations, outperforming BEVs. Even though PHEVs are also unrestricted in range due to their integrated combustion engine, PHEVs are not able to compensate their higher CO2 emissions in the production compared to Diesel ICVs, with their small share of electric driving within such long-range trip profiles. This is in line with the literature assumption of ICVs being disadvantageous for city driving, since such long-range distance trips are not performed in cities [4]. When including FCEVs and FC-PHEVs, this technology replaces Diesel ICVs since the long-range advantage of Diesel is outperformed by fuel cell vehicles due to their unlimited local zero emission driving.
When looking at the distribution in 2030, an increase in BEV share is noticeable. This can be explained by increasing range abilities due to the improvement of thermal efficiency. The increase in BEV share from 4% to 10% clearly shows that the currently expected developments (in terms of technology, energy mix, etc.) are going in the direction of making electrification the environmentally best transportation solution. However, it also reveals that there are some unmet technological needs—such as driving range, EV production from renewable energy, etc.—for our environmentally optimal drivetrain mix to be fully electric.
PHEVs also benefit from the increase in range abilities that allows a reduction of combustion engine driving. Therefore, unless an additional significant reduction of BEVs emissions is achieved through technological developments, PHEVs will still remain the best environmental drivetrain for many VVs. Moreover, our results for 2030 show that both BEVs and PHEVs benefit from increasing generation of electricity from renewable sources compared to hydrogen-based technology.
If BEVs did not have any range limitations, the environmentally optimal drivetrain mix looks quite different (as shown in Figure 6 and Figure 7). In such a case, BEVs are clearly the most dominant drivetrain. This shows the environmental benefits of BEVs for sustainable transportation. This also confirms the need for technology and infrastructure development, so that most of the driving profiles can go fully electric. Only in 25% of cases would FCEVs be the environmentally optimal drivetrain choice in 2020, and 19% in 2030. PHEVs would be the optimal choice in 4% and 6% of cases for 2020 and 2030, respectively. Such values are much lower than the ones when range limitations were considered. The major presence of BEVs when range limitations are removed from the calculation, confirm the relevance of this drivetrain for current and future transportation, but also underline the needed charging and battery technology development, in order to make BEVs the optimal drivetrain choice.
Some limitations in our analysis need to be discussed. First, only CO2 emissions are considered, but vehicles produce other emissions with environmental impact, such as carbon monoxide, nitrous oxides (NOx), particulate matter, or ultra-fine particulate matter [11,12]. Analysis of the effects of such emissions by each drivetrain could provide more insights regarding the environmentally optimal drivetrain choice. Moreover, not only emissions but also the utilization of critical raw materials such as lithium or cobalt have an influence on the eco-friendliness of EVs [4,69]. Additionally, such battery raw materials are associated with critical social factors, such as artisanal mining of cobalt, which should be addressed, even though they are not necessarily environmental. Second, within this LCA study, no detailed CO2 emissions due to recycling are included. However, this is a very critical influencing factor, especially for EVs containing large batteries. Unfortunately, available data are still scarce. We tried to size its potential impact by means of a sensitivity analysis. Furthermore, recycling could be considered an opportunity to implement circular economy approaches, which could have a positive impact on the LCA of future vehicles.
Third, this study is based on NEDC measurement, due to the novelty of the WLTP. However, it might be of interest to perform these analyses with WLTP data, as this measurement appears to be more realistic. Fourth, as this study only included data from Mercedes-Benz vehicles, the results might differ when using driving profiles from other car manufactures. Fifth, besides the chosen engines, further technologies such as synthetic fuels and gas exist and might have an impact on future projections. In fact, synthetic fuels generated by capturing CO2 and renewable energy sources could provide a new environmentally optimal alternative. Sixth, current driving habits, that are mostly ICV-based were considered; a change in driving behavior with BEVs (e.g., planning more charging time during long-range travel) could affect future projections. Seventh, due to the lack of data, several assumptions had to be made. In spite of having tested their limited impact by means of sensitivity analyses, they still might need to be adjusted or even expanded. Eighth, not only the ecological aspects will decide the future drivetrain mix. Other driving factors such as costs, infrastructure, or politics may have a major influence on the customer’s drivetrain choice.
Our analysis indicates that, if the consumer driving behavior is considered in the buying choice, the sales forecasts and the necessary vehicle types, with their respective battery size, will be affected. Projections in raw material availability and cost will also have a significant impact that will need to be considered, both for BEV [70] and FCEV [8].
In future studies. the potential impact of further criteria such as costs, especially total costs of ownership, should be analyzed. Buying behavior and costs as a primary influential factor should be investigated. Additionally, the translation of the study results to the industry and politics could lead to different actions to facilitate the technological developments required for a faster electrification. If the buying behavior is focused on optimal sustainability, the infrastructure development as well as the offered vehicle choices will be affected.

6. Conclusions

In conclusion, this study identified EVs, and especially BEVs, as the most environmentally friendly drivetrain as opposed to ICVs, when only carbon footprint effects from LCA are considered. However, if user driving behavior and technical requirements are taken into account, a particular mix of different types of drivetrains appears as the environmentally preferable choice. The calculated mix is led by FCEVs, with estimated shares of 50% in 2020 and 47% in 2030, followed by PHEVs (37% and 40% respectively), BEVs (5%, and 12% respectively), and Diesel ICVs (2% and 1% respectively).
The small role of BEVs (5% and 12% respectively) and the persistence of both PHEV and diesel engines as the most environmentally favorable choice in a small but relevant proportion of cases clearly shows the need for technological development of some key areas: electric vehicle range and production emissions. Furthermore, the market shares in 2030 clearly show how BEVs and PHEVs benefit from an increase in generation of electricity from renewable sources.
FCEVs have the largest vehicle share due to the long-range abilities that can be provided by this drivetrain in larger vehicle segments. Due to range limitations, FCEVs can often outperform PHEVs and BEVs as the optimal drivetrain choice. In the compact segment, which cannot be operated by a FCEV, ICVs can become the environmentally optimal choice, when long distances in average daily trips are required that cannot be covered by PHEVs nor BEVs. Nevertheless, FCEV implementation would entail significant challenges such as fueling infrastructure and production of clean hydrogen.
It is important to emphasize that the actual market share will not only be based on environmental parameters, but also strongly depend on differential costs and customer acceptance, in order to be implemented in the real world. Furthermore, driving habits could change in the future, for example the acceptance of longer charging times during long distance travel, which would make BEVs the best environmental choice in many cases.
The limited amount of BEVs is caused by the estimated range limitations and the higher CO2 emissions generated during battery production. Currently ongoing technological developments in battery technologies and investments in charging infrastructure could significantly improve this in the future. In fact, if range is not considered a limitation, the environmentally optimal drivetrain mix is dominated by BEVs (71% and 75% in 2020 and 2030, respectively), and PHEVs (4% and 6% in 2020 and 2030, respectively). This confirms the environmental potential benefits of BEVs for current and future transportation.

Supplementary Materials

The following supporting information can be downloaded at: https://www.mdpi.com/article/10.3390/su142315972/s1, Figure S1: LCA comparison for CO2 emissions: compact segments; Figure S2: LCA comparison for CO2 emissions: mid-size segments; Figure S3: Environmentally optimal drivetrain type for compact segment in 2020; Figure S4: Environmentally optimal drivetrain type for SUV segment in 2020; Figure S5: Environmentally optimal drivetrain type for mid-size segment in 2020; Figure S6: Environmentally optimal drivetrain type for compact segment in 2030; Figure S7: Environmentally optimal drivetrain type for SUV segment in 2030; Figure S8: Environmentally optimal drivetrain type for mid-size segment in 2030; Table S1: EV Consumption data used in the study and their respective sources; Table S2: Estimation of CO2 emissions of fuel supply for ICV; Table S3: LCA data for CO2 emission calculation. Refs. [71,72,73,74,75,76,77,78,79,80,81,82,83,84,85,86,87,88,89,90] are cited in Supplementary Materials.

Author Contributions

Conceptualization, M.N. and A.S.; methodology, M.N.; validation, M.N. and J.M.-P.; data curation, M.N. and A.S.; writing—original draft preparation, M.N. and J.M.-P.; writing—review and editing, M.N., J.M.-P., J.O.P., R.G.-O., A.K. and B.S.; visualization, M.N. and A.S.; supervision, A.K. and B.S. All authors have read and agreed to the published version of the manuscript.

Funding

We acknowledge support from the Open Access Publication Fund of the University of Wuppertal.

Data Availability Statement

The data presented in this study are available on request from the corresponding author. The data are not publicly available due to privacy restrictions.

Acknowledgments

The authors would like to thank Rico Vollrath for his support and critical review of the manuscript. We would also like to thank Mercedes-Benz for the support of this study. Furthermore, the opinions in this article are from their authors and should not be taken as the opinion of Mercedes-Benz AG as an organization. IQS researchers that participated in this study are in the GESPA group (J. Mas-Peiro, J. O. Pou, R. Gonzalez-Olmos) which has been recognized as Consolidated Research Group by the Catalan Government with code 2017-SGR-1016.

Conflicts of Interest

Michael Neidhardt, Jordi Mas-Peiro and Antonia Schneck are employees of Mercedes-Benz AG. The funders had no role in the design of the study or the interpretation of the results. The views presented in this article reflect the opinions of the authors and do not represent the position of Mercedes-Benz AG.

Abbreviations

EOEngine OTTO
EPEmissions during production
LDLifecycle distance
FCFuel consumption
EFSEmissions during fuel supply
EDUEmissions during driving usage
ELEmissions for end of life/recycling
EDEngine Diesel
EBBEV
EESEmissions required for electricity supply
EPHPHEV
EFFCEV

References

  1. Xue, C.; Zhou, H.; Wu, Q.; Wu, X.; Xu, X. Impact of Incentive Policies and Other Socio-Economic Factors on Electric Vehicle Market Share: A Panel Data Analysis from the 20 Countries. Sustainability 2021, 13, 2928. [Google Scholar] [CrossRef]
  2. Zhao, J.; Zeng, D.; Che, L.; Zhou, T.; Hu, J. Research on the profit change of new energy vehicle closed-loop supply chain members based on government subsidies. Environ. Technol. Innov. 2020, 19, 100937. [Google Scholar] [CrossRef]
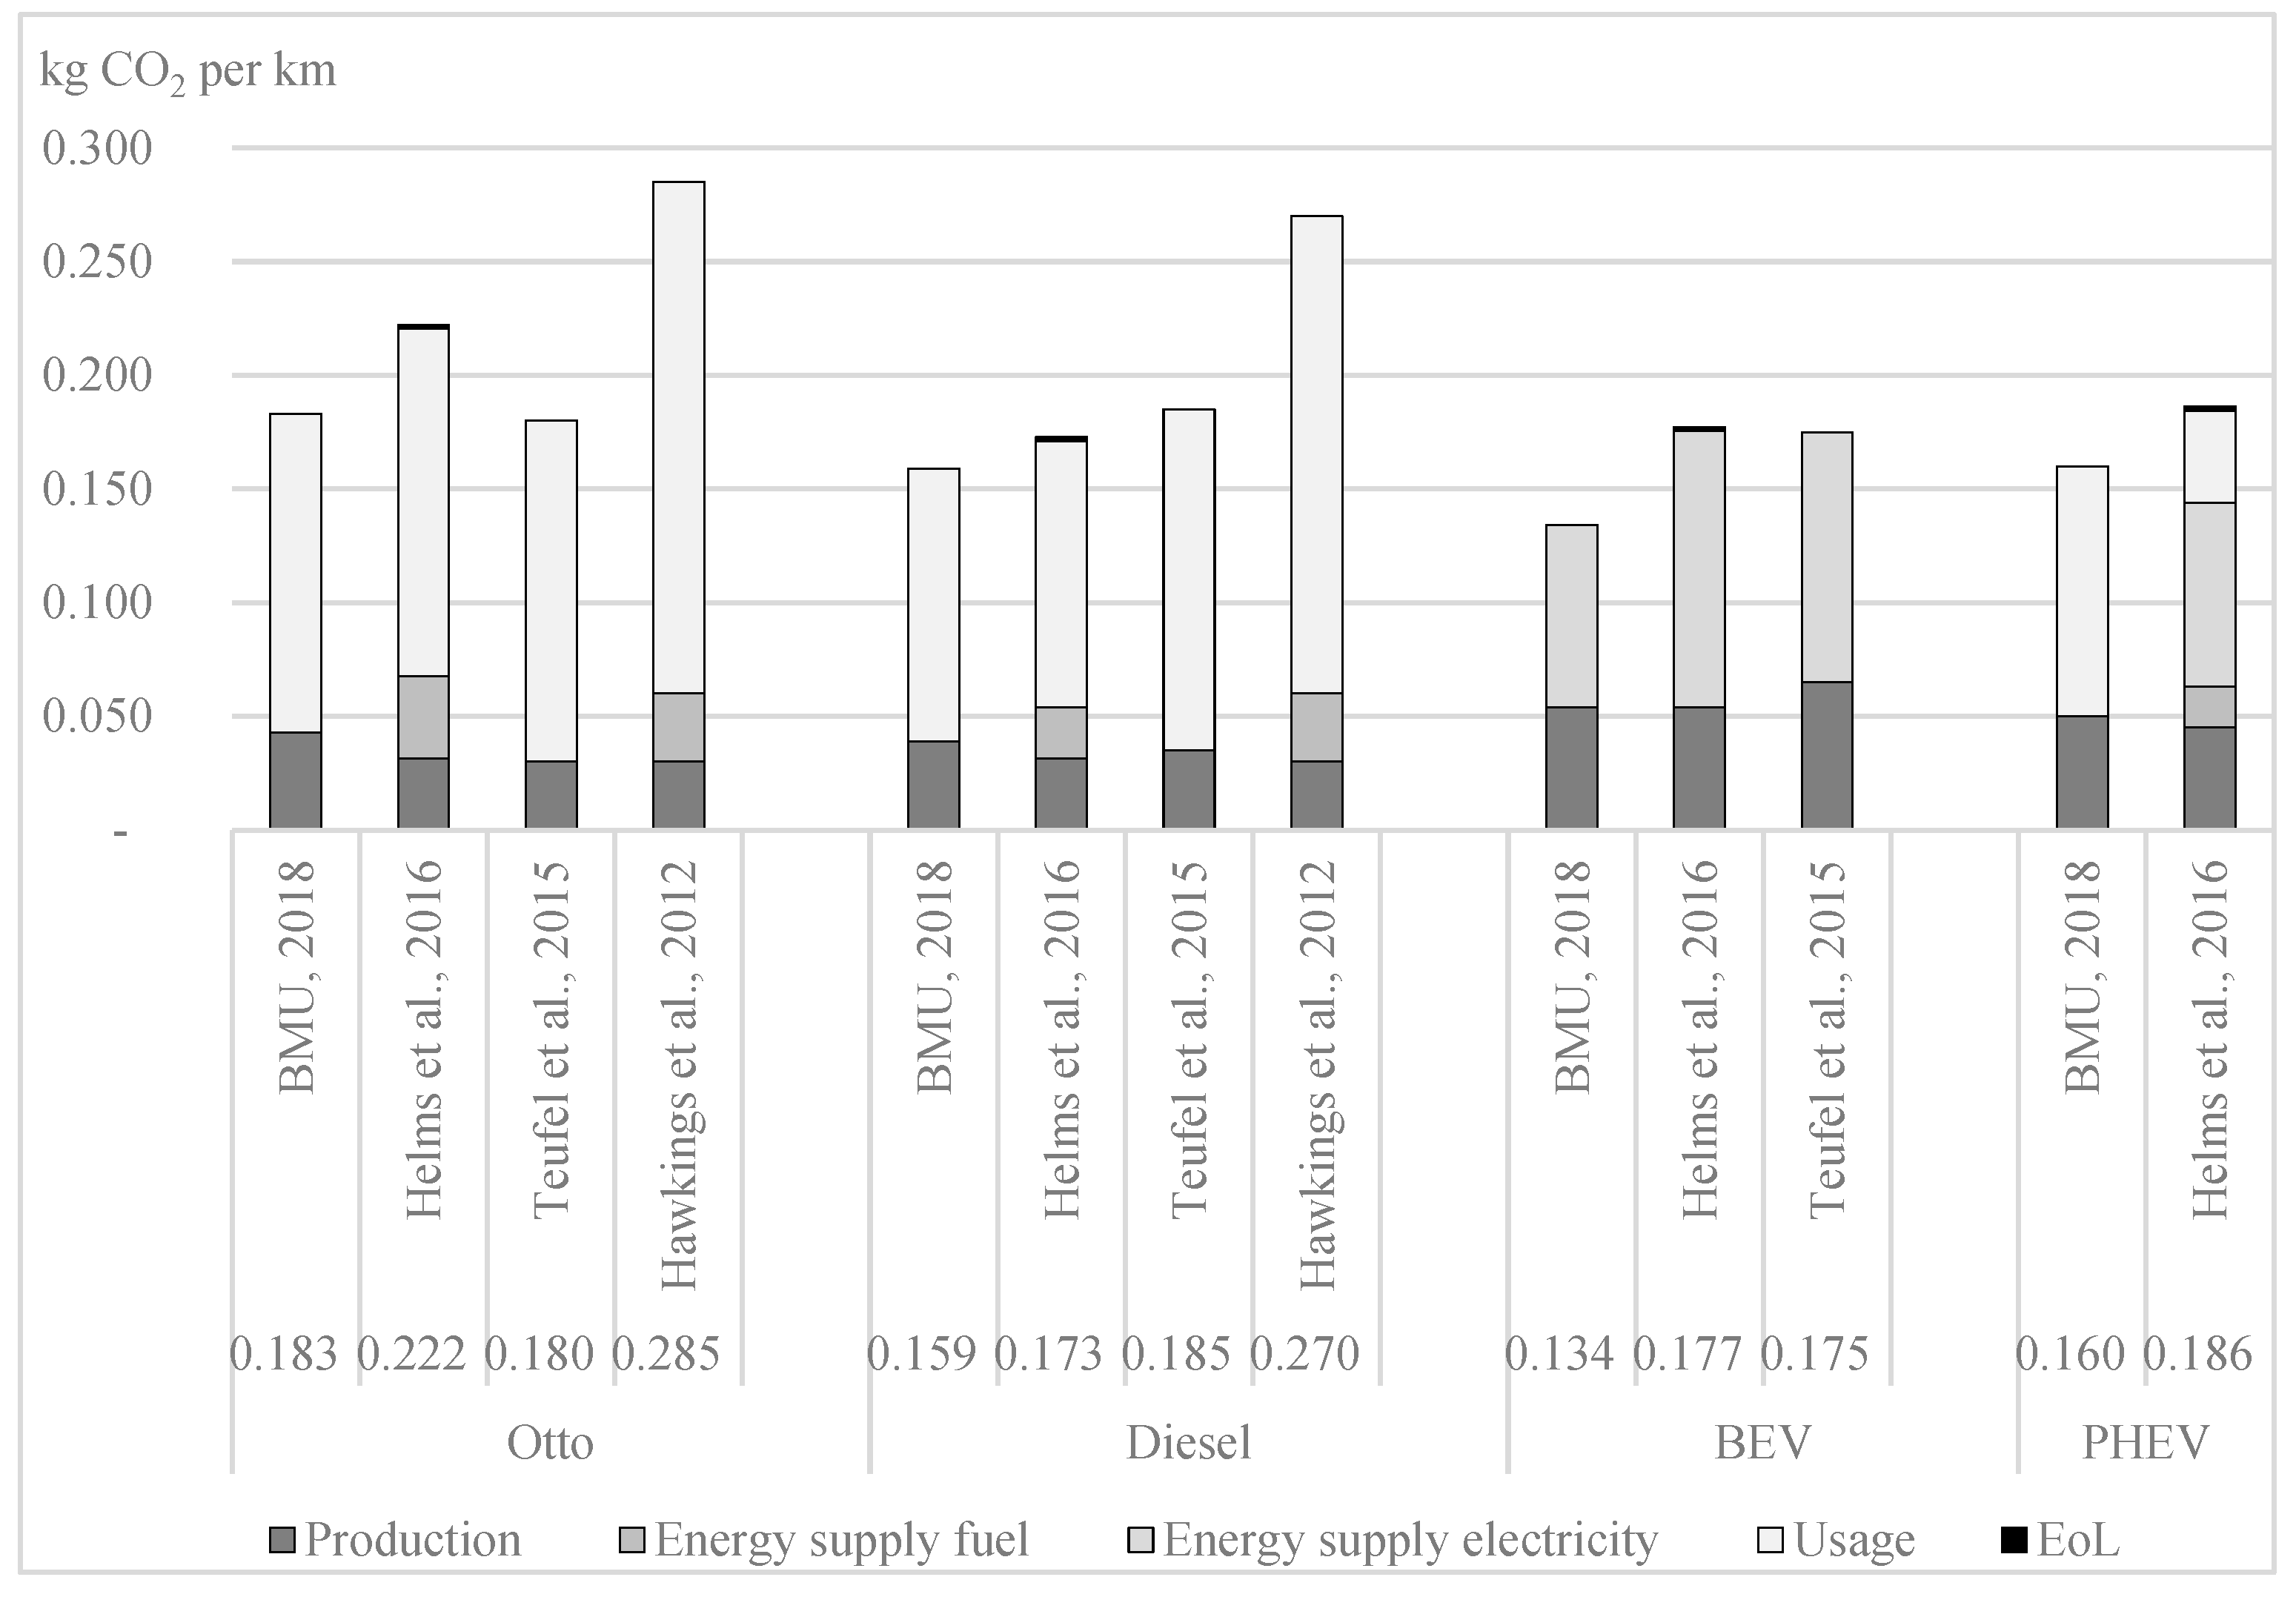
  3. BMU. Wie Umweltfreundlich Sind Elektroautos?: Eine Ganzheitliche Bilanz. 2018. Available online: https://www.bmu.de/fileadmin/Daten_BMU/Pools/Broschueren/elektroautos_bf.pdf (accessed on 3 April 2019).
  4. Helms, H.; Jöhrens, J.; Kämper, C.; Giegrich, J.; Liebich, A. Weiterentwicklung und Vertiefte Analyse der Umweltbilanz von Elektrofahrzeugen. 2016. Available online: https://www.umweltbundesamt.de/sites/default/files/medien/378/publikationen/texte_27_2016_umweltbilanz_von_elektrofahrzeugen.pdf (accessed on 25 December 2021).
  5. Teufel, D.; Arnold, S.; Bauer, P.; Schwarz, T. Ökologische Folgen von Elektroautos: Ist die Staatliche Förderung von Elektro- und Hybridautos Sinnvoll? UPI-Bericht Nr. 79. 2015. Available online: https://www.upi-institut.de/UPI79_Elektroautos.pdf (accessed on 25 December 2021).
  6. Hawkins, T.R.; Gausen, O.M.; Strømman, A.H. Environmental impacts of hybrid and electric vehicles—A review. Int. J. Life Cycle Assess. 2012, 17, 997–1014. [Google Scholar] [CrossRef]
  7. Ortego, A.; Calvo, G.; Valero, A.; Iglesias-Émbil, M.; Valero, A.; Villacampa, M. Assessment of strategic raw materials in the automobile sector. Resour. Conserv. Recycl. 2020, 161, 104968. [Google Scholar] [CrossRef]
  8. Mas-Peiro, J.; Neidhardt, M.; Schmuelling, B.; Pou, J.O.; Gonzalez-Olmos, R. Fuel Cell Electric Vehicles: A Platinum and Other Raw Material Perspective Based on Vehicle Design and Technology Data. SAE Int. J. Sustain. Transp. Energy Environ. Policy 2022, 3, 19–29. [Google Scholar] [CrossRef]
  9. Centre, J.R.; Institute for Environment and Sustainability. Well-to-Wheels Analysis of Future Automotive Fuels and Power Trains in the European Context: Report Version 3c. 2011. Available online: https://data.europa.eu/doi/10.2788/78759 (accessed on 25 December 2021).
  10. International Organization for Standardization. ISO 14040:2006 Environmental Management—Life Cycle Assessment—Principles and Framework, 2nd ed.; ISO/TC 207/SC 5 Life Cycle Assessment, 2006, 13.020.10 Environmental Management 13.020.60 Product Life-Cycles. Available online: https://www.iso.org/standard/37456.html (accessed on 4 December 2021).
  11. Larminie, J.; Lowry, J. Electric Vehicle Technology Explained, 2nd ed.; John Wiley & Sons, Ltd.: Chichester, UK, 2012; ISBN 1118361148. [Google Scholar]
  12. Schreiner, K. Verbrennungsmotor—Kurz und Bündig; Springer Fachmedien Wiesbaden: Wiesbaden, Germany, 2017; ISBN 9783658194260. [Google Scholar]
  13. Bieker, G. A Global Comparison of the Life-Cycle Greenhouse gas Emissions of Combustion Engine and Electric Passenger Cars | International Council on Clean Transportation. 2021. Available online: https://theicct.org/publications/global-LCA-passenger-cars-jul2021 (accessed on 6 January 2022).
  14. Petrauskienė, K.; Galinis, A.; Kliaugaitė, D.; Dvarionienė, J. Comparative Environmental Life Cycle and Cost Assessment of Electric, Hybrid, and Conventional Vehicles in Lithuania. Sustainability 2021, 13, 957. [Google Scholar] [CrossRef]
  15. Buchal, C.; Karl, H.-D.; Sinn, H.-W. Kohlemotoren, Windmotoren und Dieselmotoren: Was zeigt die CO2-Bilanz? ifo Schnelld. 2019, 72, 40–54. [Google Scholar]
  16. Agora Verkehrswende. Klimabilanz von Elektroautos: Einflussfaktoren und Verbesserungspotenzial. 2019. Available online: https://www.agora-verkehrswende.de/fileadmin/Projekte/2018/Klimabilanz_von_Elektroautos/Agora-Verkehrswende_22_Klimabilanz-von-Elektroautos_WEB.pdf (accessed on 19 February 2022).
  17. Macioszek, E. Electric Vehicles—Problems and Issues. In Scientific and Technical Conference Transport Systems Theory and Practice; Springer: Cham, Switzerland, 2020; pp. 169–183. [Google Scholar]
  18. Sun, B.; Gu, T.; Xie, M.; Wang, P.; Gao, S.; Zhang, X. Strategy Design and Performance Analysis of an Electromechanical Flywheel Hybrid Scheme for Electric Vehicles. Sustainability 2022, 14, 11017. [Google Scholar] [CrossRef]
  19. Macioszek, E. E-mobility Infrastructure in the Górnośląsko—Zagłębiowska Metropolis, Poland, and Potential for Development. In Proceedings of the 5th World Congress on New Technologies, Lisbon, Portugal, 18–20 August 2019. [Google Scholar]
  20. Rosenfeld, D.C.; Lindorfer, J.; Fazeni-Fraisl, K. Comparison of advanced fuels—Which technology can win from the life cycle perspective? J. Clean. Prod. 2019, 238, 117879. [Google Scholar] [CrossRef]
  21. Sacchi, R.; Bauer, C.; Cox, B.; Mutel, C. When, where and how can the electrification of passenger cars reduce greenhouse gas emissions? Renew. Sustain. Energy Rev. 2022, 162, 112475. [Google Scholar] [CrossRef]
  22. Nordelöf, A.; Romare, M.; Tivander, J. Life cycle assessment of city buses powered by electricity, hydrogenated vegetable oil or diesel. Transp. Res. Part D Transp. Environ. 2019, 75, 211–222. [Google Scholar] [CrossRef]
  23. Candelaresi, D.; Valente, A.; Iribarren, D.; Dufour, J.; Spazzafumo, G. Comparative life cycle assessment of hydrogen-fuelled passenger cars. Int. J. Hydrogen Energy 2021, 46, 35961–35973. [Google Scholar] [CrossRef]
  24. Harzendorf, F.; Wulf, C.; Haase, M.; Baumann, M.; Ersoy, H.; Zapp, P. Domestic value added as an indicator for sustainability assessment: A case study on alternative drivetrains in the passenger car sector. Clean Technol. Environ. Policy 2022, 24, 3145–3169. [Google Scholar] [CrossRef]
  25. Koj, J.C.; Wulf, C.; Linssen, J.; Schreiber, A.; Zapp, P. Utilisation of excess electricity in different Power-to-Transport chains and their environmental assessment. Transp. Res. Part D Transp. Environ. 2018, 64, 23–35. [Google Scholar] [CrossRef]
  26. Haase, M.; Wulf, C.; Baumann, M.; Ersoy, H.; Koj, J.C.; Harzendorf, F.; Mesa Estrada, L.S. Multi-criteria decision analysis for prospective sustainability assessment of alternative technologies and fuels for individual motorized transport. Clean Technol. Environ. Policy 2022, 24, 3171–3197. [Google Scholar] [CrossRef]
  27. Kraftfahrt-Bundesamt. Fahrzeugzulassungen (FZ): Neuzulassungen von Kraftfahrzeugen nach Umwelt-Merkmalen, Flensburg. 2018. Available online: https://www.kba.de/SharedDocs/Downloads/DE/Statistik/Fahrzeuge/FZ14/fz14_2018_pdf.pdf;jsessionid=5331E57BF5C2F573BD1A571C098001B0.live21321?__blob=publicationFile&v=1 (accessed on 20 September 2020).
  28. HSBC Research Team. Asia EV Battery: Charge! The Race to Be the Liion King Heats up. 2019. Available online: https://www.research.hsbc.com/R/34/TLk9KTp (accessed on 13 June 2019).
  29. European Environment Agency. Electric Vehicles from Life Cycle and Circular Economy Perspectives: TERM 2018: Transport and Environment Reporting Mechanism (TERM) Report; EEA report; European Environment Agency: Luxembourg, 2018. [Google Scholar]
  30. Xu, C.; Dai, Q.; Gaines, L.; Hu, M.; Tukker, A.; Steubing, B. Future material demand for automotive lithium-based batteries. Commun. Mater. 2020, 1, 99. [Google Scholar] [CrossRef]
  31. Choi, W. A Study on State of Charge and State of Health Estimation in Consideration of Lithium-Ion Battery Aging. Sustainability 2020, 12, 10451. [Google Scholar] [CrossRef]
  32. Moon, J.; Kim, Y.J.; Cheong, T.; Song, S.H. Locating Battery Swapping Stations for a Smart e-Bus System. Sustainability 2020, 12, 1142. [Google Scholar] [CrossRef] [Green Version]
  33. Laurikko, J.; Granström, R.; Haakana, A. Realistic estimates of EV range based on extensive laboratory and field tests in Nordic climate conditions. World Electr. Veh. J. 2013, 6, 192–203. [Google Scholar] [CrossRef] [Green Version]
  34. Iora, P.; Tribioli, L. Effect of Ambient Temperature on Electric Vehicles’ Energy Consumption and Range: Model Definition and Sensitivity Analysis Based on Nissan Leaf Data. World Electr. Veh. J. 2019, 10, 2. [Google Scholar] [CrossRef] [Green Version]
  35. Sarrafan, K.; Sutanto, D.; Muttaqi, K.M.; Town, G. Accurate range estimation for an electric vehicle including changing environmental conditions and traction system efficiency. IET Electr. Syst. Transp. 2017, 7, 117–124. [Google Scholar] [CrossRef]
  36. Daimler AG. Umweltzertifikat Mercedes-Benz A-Klasse. 2018. Available online: https://www.daimler.com/dokumente/nachhaltigkeit/produkt/daimler-umweltzertifikat-mb-a-klasse.pdf (accessed on 25 December 2021).
  37. Daimler AG. Environmental Certificate Mercedes-Benz GLC. 2015. Available online: https://www.daimler.com/images/sustainability/produkt/new-enviromentalcertificates/daimler-umweltzertifikat-compact-mb-glc.pdf (accessed on 25 December 2021).
  38. Daimler AG. Environmental Certificate Mercedes-Benz E-Class. 2016. Available online: https://www.daimler.com/documents/sustainability/product/daimler-environmental-certificate-mb-e-class.pdf (accessed on 25 December 2021).
  39. Horn, J. Stromer im Test: Wie gut ist der VW e-UP im Alltag? AUTO BILD. 13 February 2014. Available online: https://www.autobild.de/artikel/vw-e-up-test-4544079.html (accessed on 25 December 2021).
  40. Daimler AG. Umwelt-Zertifikat Mercedes-Benz S-Klasse: Inklusive S 500 Plug-in Hybrid. 2015. Available online: https://www.daimler.com/sustainability/environmental-certificates/ (accessed on 6 June 2019).
  41. Daimler AG. 360° Environmental Check: Mercedes-Benz GLC F-Cell. 2018. Available online: https://www.daimler.com/documents/sustainability/product/daimler-environmental-check-lifecycle-compact-glc-f-cell-en.pdf (accessed on 25 December 2021).
  42. Kroher, T. Elektro, Gas, Benzin, Diesel & Hybrid—Die Ökobilanz unserer Autos. 2019. Available online: https://www.adac.de/der-adac/motorwelt/reportagen-berichte/auto-innovation/studie-oekobilanz-pkw-antriebe-2018/## (accessed on 29 April 2019).
  43. Sternberg, A.; Hank, C.; Hebling, C. Treibhausgas-Emissionen für Batterie- und Brennstoffzellenfahrzeuge mit Reichweiten über 300 km. 2019. Available online: https://www.ise.fraunhofer.de/content/dam/ise/de/documents/news/2019/ISE_Ergebnisse_Studie_Treibhausgasemissionen.pdf (accessed on 25 December 2021).
  44. BloombergNEF. Electric Vehicle Outlook 2019. 2019. Available online: https://legacy-assets.eenews.net/open_files/assets/2019/05/15/document_ew_02.pdf (accessed on 25 December 2021).
  45. Volkswagen AG Newsroom. Klimabilanz von E-Fahrzeugen & Life Cycle Engineering. 2019. Available online: https://uploads.volkswagen-newsroom.com/system/production/uploaded_files/14448/file/da01b16ac9b580a3c8bc190ea2af27db4e0d4546/Klimabilanz_von_E-Fahrzeugen_Life_Cycle_Engineering.pdf?1556110703 (accessed on 29 December 2021).
  46. Tietge, U.; Díaz, S.; Mock, P.; Bandivadekar, A.; Dornoff, J. From Laboratory to Road: A 2018 Update of Official and “Real-World” Fuel Consumption and CO2 Values for Passenger Cars in Europe. 2019. Available online: https://theicct.org/sites/default/files/publications/Lab_to_Road_2018_corrected-jul2021.pdf (accessed on 29 December 2021).
  47. Jato. SUV Become Best Selling Segment in Europe—JATO. Available online: https://www.jato.com/suv-takes-over-as-the-best-selling-segment-in-europe-for-the-first-time/ (accessed on 18 February 2022).
  48. Archsmith, J.; Kendall, A.; Rapson, D. From Cradle to Junkyard: Assessing the Life Cycle Greenhouse Gas Benefits of Electric Vehicles. Res. Transp. Econ. 2015, 52, 72–90. [Google Scholar] [CrossRef] [Green Version]
  49. Ellingsen, L.A.-W.; Majeau-Bettez, G.; Singh, B.; Srivastava, A.K.; Valøen, L.O.; Strømman, A.H. Life Cycle Assessment of a Lithium-Ion Battery Vehicle Pack. J. Ind. Ecol. 2014, 18, 113–124. [Google Scholar] [CrossRef] [Green Version]
  50. Figenbaum, E. Perspectives on Norway’s supercharged electric vehicle policy. Environ. Innov. Soc. Transit. 2017, 25, 14–34. [Google Scholar] [CrossRef] [Green Version]
  51. Holland, S.P.; Mansur, E.T.; Muller, N.Z.; Yates, A.J. Are There Environmental Benefits from Driving Electric Vehicles? The Importance of Local Factors. Am. Econ. Rev. 2016, 106, 3700–3729. [Google Scholar] [CrossRef] [Green Version]
  52. Kampker, A. Elektromobilproduktion, 1st ed.; Springer: Berlin/Heidelberg, Germany, 2014; ISBN 9783642420221. [Google Scholar]
  53. Korthauer, R. Handbuch Lithium-Ionen-Batterien, 1st ed.; Springer: Berlin/Heidelberg, Germany, 2013; ISBN 9783642306532. [Google Scholar]
  54. Tanç, B.; Arat, H.T.; Baltacıoğlu, E.; Aydın, K. Overview of the next quarter century vision of hydrogen fuel cell electric vehicles. Int. J. Hydrogen Energy 2019, 44, 10120–10128. [Google Scholar] [CrossRef]
  55. Bartolozzi, I.; Rizzi, F.; Frey, M. Comparison between hydrogen and electric vehicles by life cycle assessment: A case study in Tuscany, Italy. Appl. Energy 2013, 101, 103–111. [Google Scholar] [CrossRef]
  56. Shen, H.; Yi, E.; Cheng, L.; Amores, M.; Chen, G.; Sofie, S.W.; Doeff, M.M. Solid-state electrolyte considerations for electric vehicle batteries. Sustain. Energy Fuels 2019, 3, 1647–1659. [Google Scholar] [CrossRef]
  57. Ulvestad, A. A Brief Review of Current Lithium Ion Battery Technology and Potential Solid State Battery Technologies. 2018. Available online: https://arxiv.org/pdf/1803.04317 (accessed on 1 November 2022).
  58. Franco Gonzalez, A.; Yang, N.-H.; Liu, R.-S. Silicon Anode Design for Lithium-Ion Batteries: Progress and Perspectives. J. Phys. Chem. C 2017, 121, 27775–27787. [Google Scholar] [CrossRef]
  59. Tidblad, A.A.; Edström, K.; Hernández, G.; de Meatza, I.; Landa-Medrano, I.; Jacas Biendicho, J.; Trilla, L.; Buysse, M.; Ierides, M.; Horno, B.P.; et al. Future Material Developments for Electric Vehicle Battery Cells Answering Growing Demands from an End-User Perspective. Energies 2021, 14, 4223. [Google Scholar] [CrossRef]
  60. Northvolt. Environment | Northvolt. Available online: https://northvolt.com/environment/ (accessed on 4 January 2022).
  61. Automotive Cells Co. |Tackling Climate Change. Available online: https://www.acc-emotion.com/csr/climate (accessed on 4 August 2022).
  62. Verkor. Lithium-Ion Batteries: Ramp up and Accelerate Their Manufacture in Europe. Available online: https://verkor.com/en/drive/ (accessed on 4 January 2022).
  63. Kosai, S.; Nakanishi, M.; Yamasue, E. Vehicle energy efficiency evaluation from well-to-wheel lifecycle perspective. Transp. Res. Part D Transp. Environ. 2018, 65, 355–367. [Google Scholar] [CrossRef]
  64. Khaligh, A.; D’Antonio, M. Global Trends in High-Power On-Board Chargers for Electric Vehicles. IEEE Trans. Veh. Technol. 2019, 68, 3306–3324. [Google Scholar] [CrossRef]
  65. Zhang, B.; Niu, N.; Li, H.; Wang, Z.; He, W. Could fast battery charging effectively mitigate range anxiety in electric vehicle usage? Evidence from large-scale data on travel and charging in Beijing. Transp. Res. Part D Transp. Environ. 2021, 95, 102840. [Google Scholar] [CrossRef]
  66. Tschöke, H. Die Elektrifizierung des Antriebsstrangs: Basiswissen; Springer Fachmedien Wiesbaden: Wiesbaden, Germany, 2015; ISBN 9783658046446. [Google Scholar]
  67. Merker, G.P.; Schwarz, C.; Teichmann, R. Grundlagen Verbrennungsmotoren: Funktionsweise, Simulation, Messtechnik, 5, Vollständig Überarbeitete, Aktualisierte und Erweiterte Auflage; Vieweg+Teubner Verlag: Wiesbaden, Germany, 2011; ISBN 9783834883063. [Google Scholar]
  68. Sayed, K.; Kassem, A.; Saleeb, H.; Alghamdi, A.S.; Abo-Khalil, A.G. Energy-Saving of Battery Electric Vehicle Powertrain and Efficiency Improvement during Different Standard Driving Cycles. Sustainability 2020, 12, 10466. [Google Scholar] [CrossRef]
  69. BMU. Kurzinformationen Elektromobilität Bezüglich Strom- und Ressourcenbedarf. Available online: https://www.bmu.de/fileadmin/Daten_BMU/Download_PDF/Verkehr/emob_strom_ressourcen_bf.pdf (accessed on 29 December 2021).
  70. Neidhardt, M.; Mas-Peiro, J.; Schulz-Moenninghoff, M.; Pou, J.O.; Gonzalez-Olmos, R.; Kwade, A.; Schmuelling, B. Forecasting the Global Battery Material Flow: Analyzing the Break-Even Points at Which Secondary Battery Raw Materials Can Substitute Primary Materials in the Battery Production. Appl. Sci. 2022, 12, 4790. [Google Scholar] [CrossRef]
  71. Hyundai Motor Deutschland GmbH. Hyundai Ioniq Elektro | Technische Daten. 2018. Available online: https://www1.hyundai.news/fileadmin/de/Pressemappen/Ioniq_Elektro/Ioniq_Elektro_2018_3_Technische_Daten.pdf (accessed on 5 March 2020).
  72. Audi AG. Preisliste A3|S3|A3 Sportback|A3 Sportback g-tron|A3 Sportback e-Tron|S3 Sportback. 2017. Available online: https://www.audi.de/dam/nemo/models/misc/pdf/my-2017/preislisten/preisliste_a3_s3_a3-sportback_a3-sportback-g-tron_a3-sportback-e-tron_s3-sportback.pdf (accessed on 5 May 2020).
  73. EV Specifications. 2020 Mercedes-Benz EQC 400 4MATIC—Specifications and Price. Available online: https://www.evspecifications.com/en/model/c7d2a8 (accessed on 5 January 2022).
  74. Tesla Inc. European Union Energy Label. Available online: https://www.tesla.com/en_EU/support/european-union-energy-label (accessed on 5 January 2022).
  75. Auto Motor Sport. Mercedes GLC 350 e im Fahrbericht. 9 December 2015. Available online: https://www.auto-motor-und-sport.de/fahrbericht/mercedes-glc-350-e-fahrbericht/technische-daten/ (accessed on 5 January 2022).
  76. Ultimate Specs. Kia Niro 1.6 GDi PHEV Technical Specs, Dimensions. Available online: https://www.ultimatespecs.com/car-specs/Kia/111441/Kia-Niro-16-GDi-PHEV.html (accessed on 5 January 2022).
  77. Kia Corporation. Explore the Range. Available online: https://www.kia.com/eu/vehicles/kia-range/ (accessed on 5 January 2022).
  78. Motor Sport. Mitsubishi Outlander 2.4 PHEV Motion Auto 4WD. Available online: http://motor.sport.es/tm_ficha.php?id=801857420180901&fecha=20180901&mercado=es&site=sport&impresion=true (accessed on 5 January 2022).
  79. Hyundai Motor Deutschland GmbH. Der Hyundai NEXO: Pressetext. Available online: https://www.hyundai.news/de/modelle/e-modelle/nexo/pressemappe/der-hyundai-nexo-pressetext.html (accessed on 5 January 2022).
  80. Daimler AG. Mercedes-Benz EQ: GLC F-CELL with EQ Power. Available online: https://www.la.mercedes-benz.com/en/passengercars/mercedes-benz-cars/models/e-mobility/project-eq/experience-eq.pi.html/mercedes-benz-cars/models/e-mobility/project-eq/experience-eq/future-of-mobility/f-cell (accessed on 5 January 2022).
  81. EV Compare. Tesla Model X 90D Specs, Price, Photos, Offers and Incentives. Available online: https://evcompare.io/cars/tesla/tesla_model_x_90d/ (accessed on 6 January 2022).
  82. Auto Data. 2018 Mercedes-Benz E-class (W213) E 300 de (306 Hp) Plug-In Hybrid G-TRONIC|Technical Specs, Data, Fuel Consumption, Dimensions. Available online: https://www.auto-data.net/en/mercedes-benz-e-class-w213-e-300-de-306hp-plug-in-hybrid-g-tronic-35192 (accessed on 6 January 2022).
  83. International Fleet World. Road Test: Volvo S90 T8—International Fleet World. Available online: https://internationalfleetworld.com/road-test-volvo-s90-t8/ (accessed on 6 January 2022).
  84. AutoScout24. Volvo S90 T8 Twin Engine AWD. Available online: https://www.autoscout24.com/offers/volvo-s90-t8-twin-engine-awd-inscription-360-standheizu-electric-gasoline-grey-55f0007e-e53f-454b-aa84-b622ded2dd93?source=list_searchresults&cldtidx=16&sort=standard&lastSeenGuidPresent=false&cldtsrc=listPage (accessed on 6 January 2022).
  85. White, A. The Volvo XC90 Has a Wide Range of Common and Inconvenient Problems. 5 April 2020. Available online: https://www.motorbiscuit.com/the-volvo-xc90-has-a-wide-range-of-common-and-inconvenient-problems/ (accessed on 6 January 2022).
  86. FichasMotor. BMW 5 Series Sedan (G30) 530e (252 Cv) Plug-in Hybrid iPerformance Steptronic | FICHA TÉCNICA. FichasMotor. 1 January 2019. Available online: https://fichasmotor.com/bmw/bmw-5-series-sedan-g30-530e-252-cv-plug-in-hybrid-iperformance-steptronic/ (accessed on 6 January 2022).
  87. H2.LIVE. Toyota MIRAI—H2.LIVE. Available online: https://h2.live/en/fuelcell-cars/toyota-mirai/ (accessed on 6 January 2022).
  88. Luo, Y.; Wu, Y.; Li, B.; Mo, T.; Li, Y.; Feng, S.-P.; Qu, J.; Chu, P.K. Development and application of fuel cells in the automobile industry. J. Energy Storage 2021, 42, 103124. [Google Scholar] [CrossRef]
  89. BloombergNEF. New Energy Outlook 2018—Data Viewer. Available online: https://about.bnef.com/new-energy-outlook/ (accessed on 3 March 2019).
  90. ADAC e.V. Ökobilanz Gängiger Antriebstechniken: Konventionelle Antriebe sind Lange Nicht am Ende. 2019. Available online: https://www.adac.de/infotestrat/umwelt-und-innovation/abgas/oekobilanz/default.aspx?ComponentId=317354&SourcePageId=47733## (accessed on 28 June 2019).
Figure 1. Comparison of existing LCA results (in kg CO2 per km) of each drivetrain type [3,4,5,6]. Data derived from graphics.
Sustainability 14 15972 g001
Figure 2. Box plot diagrams of the driving parameters in the 9328 virtual vehicles sample.
Sustainability 14 15972 g002
Figure 3. LCA for CO2 emissions: SUV segment.
Sustainability 14 15972 g003
Figure 4. Environmentally optimal drivetrain type per individual driving pattern 2020 (a) and in 2030 (b).
Sustainability 14 15972 g004
Figure 5. Results of the environmental drivetrain mix analysis for 2020 (a) and 2030 (b).
Sustainability 14 15972 g005
Figure 6. Environmentally optimal drivetrain type per individual driving pattern, considering no range limitations in 2020 (a) and in 2030 (b).
Sustainability 14 15972 g006
Figure 7. Results of the environmental drivetrain mix analysis considering no range limitations in 2020 (a) and 2030 (b).
Sustainability 14 15972 g007
Table 1. Assumed parameters for each vehicle segment type.
Compact SizeSUV SizeUpper-Mid Size
Lifecycle base distance160,000 km [26]200,000 km [27]250,000 km [28]
Lifecycle base period12 years12 years12 years
Driving Range BEV *280 km458 km413 km
Electric range PHEV *50 km50 km52 km
Electric range FC-PHEV *--49 km
Driving Range FCEV *-756 km525 km
* see calculations in online Supplementary Tables S1–S3.
Publisher’s Note: MDPI stays neutral with regard to jurisdictional claims in published maps and institutional affiliations.

