
On the Sustainability of Shared Mobility Since COVID-19: From Socially Structured to Social Bubble Vanpooling

1
Computer Science Department, Dhofar University, Salalah 211, Oman
2
INTENSY-T R&D, Urban North Center, Tunis 1082, Tunisia
3
LARIA Research Unit, National School of Computer Science, Manouba University, Tunis 2010, Tunisia
4
CRISTAL-GRIFT Laboratory, National School of Computer Science, Manouba University, Tunis 2010, Tunisia
*
Author to whom correspondence should be addressed.
†
These authors contributed equally to this work.
Sustainability 2022, 14(23), 15764; https://doi.org/10.3390/su142315764
Submission received: 28 October 2022
/
Revised: 22 November 2022
/
Accepted: 23 November 2022
/
Published: 26 November 2022
(This article belongs to the Section Sustainable Transportation)
Abstract
:Public and shared transportation are among the sectors that have been severely affected by the COVID-19 pandemic, as they were perceived to be risky environments for disease transmission. Given that the end of the pandemic is not certain and in order to anticipate future pandemics, attempts have been made to design public and shared mobility systems that are pandemic resilient, avoiding the social and economic burdens of disrupting transportation services. In this paper, we introduce a new ridesharing form based on a novel concept called social bubble vanpooling (SBV) which tries to provide a trade-off between minimizing the risk of exposure of riders to communicable diseases, minimizing the operational costs of ridesharing operators, and providing public health authorities with full contact-tracing capability in ridesharing-related cases, if needed. We propose a new clustering approach where riders are pooled into social bubbles composed of people who are spatio-temporally connected and have similar vulnerability levels with respect to a communicable diseases. We used individual agent-based simulation experiments based on a data sample collected from a real population of riders, and we compared the performance of the proposed SBV with trip-based and long committed ridesharing models. We found that (1) enforcing contact tracing and quarantine is more effective in controlling the spread of the disease when the bubble-based ridesharing scheme is adopted as a commuting mode and (2) it is possible to sustain transportation services without compromising the efforts to mitigate the spread of the pandemic. The proposed ridesharing model appears to be a viable solution when the mobility of individuals is subject to tight restrictions to stop the spread of a communicable airborne disease (such as COVID-19). The flexibility of the model allows maintaining transportation services with profitable operational costs while upholding the precautionary measures to fight the pandemic.
1. Introduction
Beside its heavy health, social, and economic impacts, the outbreak of the COVID-19 pandemic has dramatically affected public transportation systems in most of the countries around the world [1]. Public transportation means are an example of confined and crowded environments where people spend time during their commuting or traveling activities, and are therefore perceived as risky environments for the transmission of communicable diseases. Because of these concerns, people are avoiding public transport and preferring private transportation modes such as private cars, bikes, and motorbikes to minimize the risk of exposure [2,3]. The situation is not better for shared mobility modes (including carpooling, ride hailing, and bike sharing) [4], and several ride-sharing operators (such as Uber, Lyft, etc.) have seen their services suspended or reduced since the beginning of the COVID-19 outbreak [5,6], while future impacts are still uncertain [7]. The fear of public transport is also a source of severe concern for governments and urban authorities who need to find efficient solutions for the post-COVID-19 era. As a matter of fact, the anti-vaccine movements observed in several countries around the world [8,9] could undermine efforts to establish herd immunity to the new coronavirus and could make the end of the pandemic unlikely to happen in the immediate future [10]. In this context, social distancing currently still seems to be one of the best options to control the spread of the virus. The implementation of social distancing in public transportation is challenging [11], and because governments, transport operators, cities, and urban planners around the world have invested hugely in public and shared transportation modes in recent decades to achieve sustainable and green mobility, it is extremely costly to adopt new transportation forms, at least in the near future. Consequently, the best option currently available seems to be learning to live with the virus by maintaining vital activities, including public transportation services, and taking all possible precautionary measures to minimize the risk of infection. In addition, dissolving people’s fear of public transport seems difficult, especially when new COVID-19 strains or even new, yet unknown, epidemics and pandemics might outbreak at any time. Moreover, public transportation is also a public health matter, and public health authorities have their reasons to worry about the proven role of transportation in spreading infectious diseases among communities and the difficulty of contact tracing transportation-related infection cases [12]. Therefore, policy makers need to determine alternative solutions or efficient accommodations of public and shared transportation systems that offer a reasonable trade-off between reducing the exposure risk of individual commuters to infectious diseases and reducing the risk of disease spread at the community level, including an efficient contact tracing mechanism for commuting-related infections.
An increasing research effort has been made over the last months to call for the establishment of new transportation policies and guidelines that accommodate the challenges of the post-COVID-19 period [13,14,15]. Active travel has been proposed as a suitable post-COVID-19 transportation mode in different countries [16]. It promotes the use of human physical activities, such as walking and cycling, as a sustainable alternative for motorized transportation modes. Nevertheless, active travel is not an accessible solution for many people around the world, either for age reasons (elderly people), weather reasons (rain, extremely hot weather, etc.) or socio-cultural reasons (women and other ethnic minorities in certain parts of the world [17,18]). The concept of responsible transport has been also proposed [14], which promotes the idea of encouraging people to make their transport mode choices taking into consideration both their own and public health interests. It is an answer to the increasing calls for the inclusion of public health considerations in transportation policies in order to make mass and shared transportation a safe choice [19,20,21]. Recently, the pandemic-resilient transportation system paradigm has been introduced [22], listing certain guidelines that are yet to be addressed in order to adapt transportation systems to the requirements of social distancing and infection transmission compliance. Most of these efforts are general guidelines to be implemented as non-pharmaceutic interventions at the shared-vehicle level (wearing masks, disinfecting vehicles, etc.), but no new restructuring measures have been proposed at the level of mass or shared mobility forms themselves to the best of our knowledge.
To address this gap, in this paper we propose a new form of shared mobility, called social bubble vanpooling (SBV), which is a special accommodation of the socially structured vanpooling (SSV) proposed by [23] to meet the challenges of the post-COVID-19 era. SSV was initially designed to suit the cultural and social contexts of Arab and Middle Eastern countries, and consequently, the new SBV concept can be implemented in similar cultural and social contexts. SBV is a form of committed chartered vanpooling where socially connected co-riders living in the same spatio-temporal proximity form social bubbles of riders (between six and eight persons in general) who commute daily together for a long period of time (several months) back and forth between their homes and working activities. Forming social bubbles of riders reduces the contact network during commuting time and minimizes the risk of infection in comparison to traveling every day with different strange riders, as is the case with mass transportation and trip-based ridesharing systems. It also allows for a better achievement of the biological homogeneity mixture property, where groups of riders having similar health conditions and risk factors can be pooled together, such as elderly people, young school students, healthcare sector workers, and other workers. Many recent studies have shown that SARS-CoV-2 is characterized by a heterogeneity of effects across age, gender, and other socio-demographic groups [24,25,26] and called for the importance of not mixing these groups together (for example, not mixing elderly or health worker groups with others). We also believe that SBV allows for better and easier contact tracing between riders when compared to public transportation and trip-based ridesharing systems, which is very useful for epidemic tracing. Indeed, SBV can be implemented as a MaaS (mobility as a service), and every daily trip can be stored with the pick-up and drop-off times of every rider in the pool, allowing for full contact tracing capability.
In this paper, we explore the aforementioned potential benefits of SBV and its use as a sustainable shared mobility form that offers a trade-off between minimizing the risk of exposure of riders to communicable diseases and minimizing the operational costs of ridesharing operators while providing public health authorities with a full contact-tracing capability in ridesharing-related cases, if needed. We use individual agent-based simulation experiments based on a data sample collected from a real population of riders. We study the role of the SBV in the spread of SARS-CoV-2 over the population of riders, and we compare it with both trip-based and long committed ridesharing forms. From a public health policy making perspective, we consider the performance of the SBV under two extreme control actions, (1) no intervention as the worst scenario and (2) full contact-tracing and isolation as the best scenario.
The structure of the paper is organized as follows. In Section 2, we present an overview of the research work related to understanding and controlling the role of public and shared transport in the spread of COVID-19, either as a vector or as an environment of transmission. In Section 3, we present our new SBV shared mobility form as a special accommodation of the SSV framework [23]. In Section 4, we present our agent-based simulation experiments and we discuss the results in Section 5. We conclude in Section 6 by presenting the limitation of the work and stressing the directions of possible future improvements of the proposed solution.
2. Public Transport, Shared Mobility, and the Spread of COVID-19
From an epidemiological perspective, transportation has been studied because it plays two different roles:
- (1)
- as a vector that facilitates the spread of communicable diseases from one place to another (mobility as a vector) [27]. Communicable diseases spread over space when infectious persons move (using transportation modes) from one location to another, where they might infect other persons.
- (2)
- as an environment (transportation means and settings) where people are confined, crowded, and might become infected (mobility as an activity) [28].
Let us mention that in the field of communicable diseases in general, the role of mobility as a vector of spread has been widely recognized [29,30], while its role as an activity of transmission has attracted less attention [31,32], probably because it is more difficult to prove. However, several empirical studies have concluded that it is possible to become infected during commercial flights [33,34] as well as during bus and train trips [35]. Many previous studies have linked the use of public transport to the increased risk of influenza [36,37,38] and influenza-like illnesses [39,40], and several mathematical and simulation models have been proposed to analyze travel-related infections in transportation networks [32,41].
With respect to COVID-19, most of the research works from transportation and epidemiology focused on modeling and analyzing the role of mobility as a vector that accelerates the virus’ spread over space. The role of public transportation modes (such as trains, buses and flights) in the spatial spread of COVID-19 has been empirically proven in several studies [42,43,44,45,46,47]. The role of transportation as an environment for COVID-19 transmission has been attracting an increasing interest over the last two years. Authors in [48] estimated the risk of exposure to COVID-19 of different work activities, and found that the high-risk occupations included car, taxi and van drivers because of frequent contacts with travelers. One of the earliest locally transmitted cases in Taiwan was a taxi driver who took a passenger returning from mainland China. This case led to a family cluster of COVID-19 with four more locally transmitted cases. COVID-19 transmission has been also associated with the use of train lines [49] and air flights [50], and different safety measures are implemented to prevent travel-related COVID-19 infections in mass transportation systems around the world, including social distancing, use of masks and hand hygiene [51,52].
However, the role of shared mobility systems in the spread of COVID-19 has been explored to a limited extent. Certain studies have associated ridesharing trips with a significant increase in COVID-19 infection risk [53], which explains the perception of risk that people have with regard to shared mobility [4,54,55]. The US Department of Transportation funded a research project at the University of South Florida [56] to study the role of ridesharing in the spread of SARS-CoV-2, and the simulation-based experiments showed that in the absence of any intervention measures ride-sharing vehicles can lead to the spread of COVID-19 in metropolitan areas, and this role is proportional to the shared-mobility penetration rate. Nevertheless, the study concluded that the spread can be limited if certain control measures are taken at the ride-sharing level, such as the early isolation of cases, disinfection of vehicles, and/or taking proper precautions and hygiene measures [56]. Similar results were reported by the study in [57], which concluded that wearing masks can considerably reduce the risk of COVID-19 spread in ride-sharing systems. The authors in [58] studied the impact of demand stability on the spread of COVID-19 in the population of carpooling riders in the city of Amsterdam. Considering a total population of 3075 riders, they first simulated the scenario of trip-based pooling with fluctuating demand, in which pools of riders were formed every day for every single trip. For every simulation day, 2000 riders were randomly selected from a total population of 3075 riders and then pooled for every single trip. Consequently, every day riders can be matched in different pools, which increases the contact network. The results showed that infections rapidly spread across the total population. In order to mitigate the situation, the experimental results showed that maintaining a stable daily demand by fixing the matches of co-travelers allows the containment of the virus in small communities and prevention the outbreaks [58]. The authors argued that under strict demand control measures, shared mobility platforms may provide an appealing alternative service between public and private transport modes for pandemic reality. Finally, authors in [59] proposed a mathematical model of viral transmission adapted to ridesharing interactions in order to estimate the probability of infection after a ridesharing trip.
Most of the existing research works have focused on vehicle-level precautionary measures (mask wearing, vehicle disinfection, etc.) to control SARS-CoV-2 spread in shared mobility systems. To the best of our knowledge, none of the existing research works have proposed a pandemic-resilient and sustainable shared mobility form that offers a trade-off between minimizing riders’ risk of exposure, minimizing operators’ operational costs, and providing full contact-tracing capabilities for public health authorities. As a solution to address this gap, in the following sections we present our new shared mobility form, the SBV.
3. From Socially Structured Vanpooling to Social Bubble Vanpooling
Socially structured vanpooling (SSV) is a form of social shared mobility that was initially introduced in [23] to model and accommodate a socio-cultural ridesharing practice commonly used in several Arab and Middle-Eastern countries. In many of these countries, riders form pools of homogeneous socio-demographic groups (typically of the same gender) who are living in the same neighborhood and have social connections, and use the services of minibuses (vans) in order to commute daily between their homes and working places. It is therefore a kind of long-term, home–work shared mobility form where social compatibility between riders is a key factor to satisfy when forming riders’ pools, in order to improve the ridesharing experience. The SSV framework uses a three-step clustering scheme to achieve a pooling that fulfills riders’ preferences to the furthest extent. The first step targets the spatio-temporal constraints of the commuters. Given that each rider has known pick-up and drop-off locations and timings, the first pooling stage addresses the riders’ compatibility with respect to their origin–destination restrictions and the distances that separate them. The second stage focuses on the social constraints and connections. At this level, a fuzzy agglomerative clustering algorithm is carried out to infer sub-pools where the riders are grouped in accordance with their social connections. The third stage of the pooling scheme is the consideration of commuter’s preferences (e.g., price, comfort, etc.). More details about the SSV scheme and what distinguishes it from other ridesharing models can be found in [23].
Results of the work in [23] showed that the SSV scheme improves the social compatibility of riders and leads to a better trade-off between riders’ satisfaction and van operators’ benefits. However, SSV focuses on the social compatibility of riders but does not account for their health risk; therefore, it cannot be efficiently used to provide sustainable service during time of pandemic. For this reason, we decided to switch the focus of the framework from satisfying social compatibility to minimizing riders’ risk exposure to communicable diseases, while still generating benefits for the service operator. The intuitive idea is to replace socially compatible pools of riders in the SSV by pools of social bubbles of riders with homogeneous risk levels with respect to the SARS-CoV-2 virus. Table 1 illustrates the differences between the SSV and the newly proposed social bubbles vanpooling (SBV) scheme. Basically, we relaxed the social connections and other constraints (bus cleanness, driver experience, etc.) and we introduced a new criterion () indicating how vulnerable a rider is to communicable diseases (COVID-19 in this particular case). A different clustering algorithm than the one used in SSV [23] has been proposed to identify the social bubbles of riders. In the next subsections we present the new SBV scheme in detail.
3.1. Social Bubbles of Riders
The concept of social “bubbles” has emerged during the COVID-19 pandemic outbreak as a control measure aiming at limiting the spread of the disease over large communities. The concept initially emerged in the household context [60], with the rationale of creating groups of closely related individuals, e.g., family members or friends who interact freely while socially distancing from the rest of the population. Such bubbles are intended to provide a safety net so that people within the bubble can collaborate on common tasks, socialize, and avoid depression and related anxieties that might become more prevalent when isolating alone or in a much smaller groups [61,62]. The concept of bubbles has been then replicated in other contexts, such as schools [63,64] (bubbles are groups of students, most commonly year groups, prevented from mixing with other bubbles, and often contained in one part of the school), universities [65], and workplaces [66].
In this paper, we propose to adapt the intuitive idea of social bubbles to propose a sustainable pandemic-resilient shared mobility scheme. By dividing the community of riders into small socially cohesive groups that do not mix with others, it is possible to avoid unnecessary self-isolation by totally or partially isolating only the bubbles whose members are infected, which maintains the sustainability of the ridesharing service by avoiding its total disruption. For this purpose, we adapted the socially structured vanpooling paradigm [23] to a pandemic-resilient context by replacing the three-step socially compatible pooling of riders with a two-step social bubble pooling algorithm composed of (1) a spatio-temporal pooling phase and (2) a social bubble pooling phase. It is worth mentioning that similarly to the SSV [23], the proposed SBV framework is to be implemented as a mobility as a service platform where riders register, specify their service criteria (Table 1), and the platform will accordingly assign them a pool and a van for a monthly membership. The presentation of the platform is out of the scope of this paper and will be the topic of a separate publication.
3.2. Spatio-Temporal Pooling Phase
The objective of the first phase of the proposed pooling scheme is to put forward the geographical features of the prospective commuters as well as ensuring that their time constraints for pick-up and drop-off are upheld. The riders’ locations and temporal constraints are considered for clustering at this stage. The commuters constraints pertaining to origin/destination as well as their pick-up and drop-off time windows are used to create pools of compatible riders. Each rider is assumed to have a known location given by GPS coordinates and for pick-up and drop-off locations, respectively. Similarly, pick-up and drop-off time windows associated with each rider are denoted by and , respectively. The clustering method proposed at this first phase operates in a multi-pass fashion. Initially, a cluster is created for each commuter. Afterwards, each iteration aims to merge clusters with compatible pick-up constraints. The merging procedure is outlined as follows:
- For each pair of clusters and , compute
- Two clusters and are merged if:where is the maximum duration required to travel from a location in cluster to a location in cluster .
Initially, we consider as many clusters as riders. singletons are merged iteratively to construct larger sets of riders grouped based on their pick-up and drop-off locations. For the sake of simplification, and without loss of generality, in this paper we measure the distance between commuters using Euclidean distance. However, when the algorithm is implemented in the mobility as a service platform, a more accurate distance calculation scheme will be derived using an estimation of the travel time [67]. We roughly estimate the inter-cluster trip duration in an incremental manner alongside the spatial merging procedure. With as the average speed in the route between the clusters and , the estimated trip duration is approximated using the following formula:
where is the roughly estimated average speed in the route from rider ’s location to rider ’s location and refers to the Euclidean distance between and .
From the initial singleton clusters, the merging procedure operates in an iterative fashion to construct larger clusters that are hierarchically derived. The iterative procedure terminates when the pick-up and drop-off time windows are not compatible.
3.3. Social Bubble Pooling Phase
We introduce the concept of rider bubbles as a particular type of cohesive communities from both spatio-temporal and social perspectives. The underlying social ties that can be either strong (e.g., siblings), weak (e.g., classmates), or latent (e.g., connected via some social network platforms) are explicitly represented and used to infer the so-called rider bubbles through an agglomerative approach. Within the same group of riders with compatible spatio-temporal attributes, bubble identification is achieved in two steps. The first step focuses on direct social ties, and the second step addresses the latent and hidden affinities based on riders’ social profiles (age, health vulnerability, etc.). The objective of this procedure is to identify socially cohesive groups with similar health vulnerability levels. Initially each commuter is assigned a unique label.
The strength of the social connection between two commuters, depicted by a dyadic relationship, is modeled by a weighted directed edge tying two nodes. Let us denote by the weight of the social connection linking an individual i to an individual j. Examples of such connections include the following:
- Commuter i is a relative of commuter j ().
- Commuter i works with commuter j ().
- Commuter i follows commuter j on social networks ().
- Commuter i has blocked j on social networks ().
- Commuter i has expressly declined a ride share with j ().
where refer to the assigned weights of the weak, strong, and latent social relationships, respectively. The total weight of social affinity between i and j is then given by:
To measure the health risk similarity between riders belonging to the same bubble, we use the following measure:
where refers to the rider’s health risk vulnerability (Table 1), and is a weight representing the importance of the health risk factor. can be adjusted to depict different levels of pandemic severity.
Similarly, to measure the similarity between the riders based on their age, we use the following ratio:
Remark 1.
The ridesharing model proposed in this study supersedes the socially structured model presented in [23], where the preferences (such as comfort, social preferences, etc.) are conspicuous. To extend the SBV model to the SSV one, we set and we consider the social preferences using as a measure representing the degree of similarity of riders i and j with respect to a given preference (see Table 1). The affinity is defined as follows:
where refers to the rider’s preferences (Table 1).
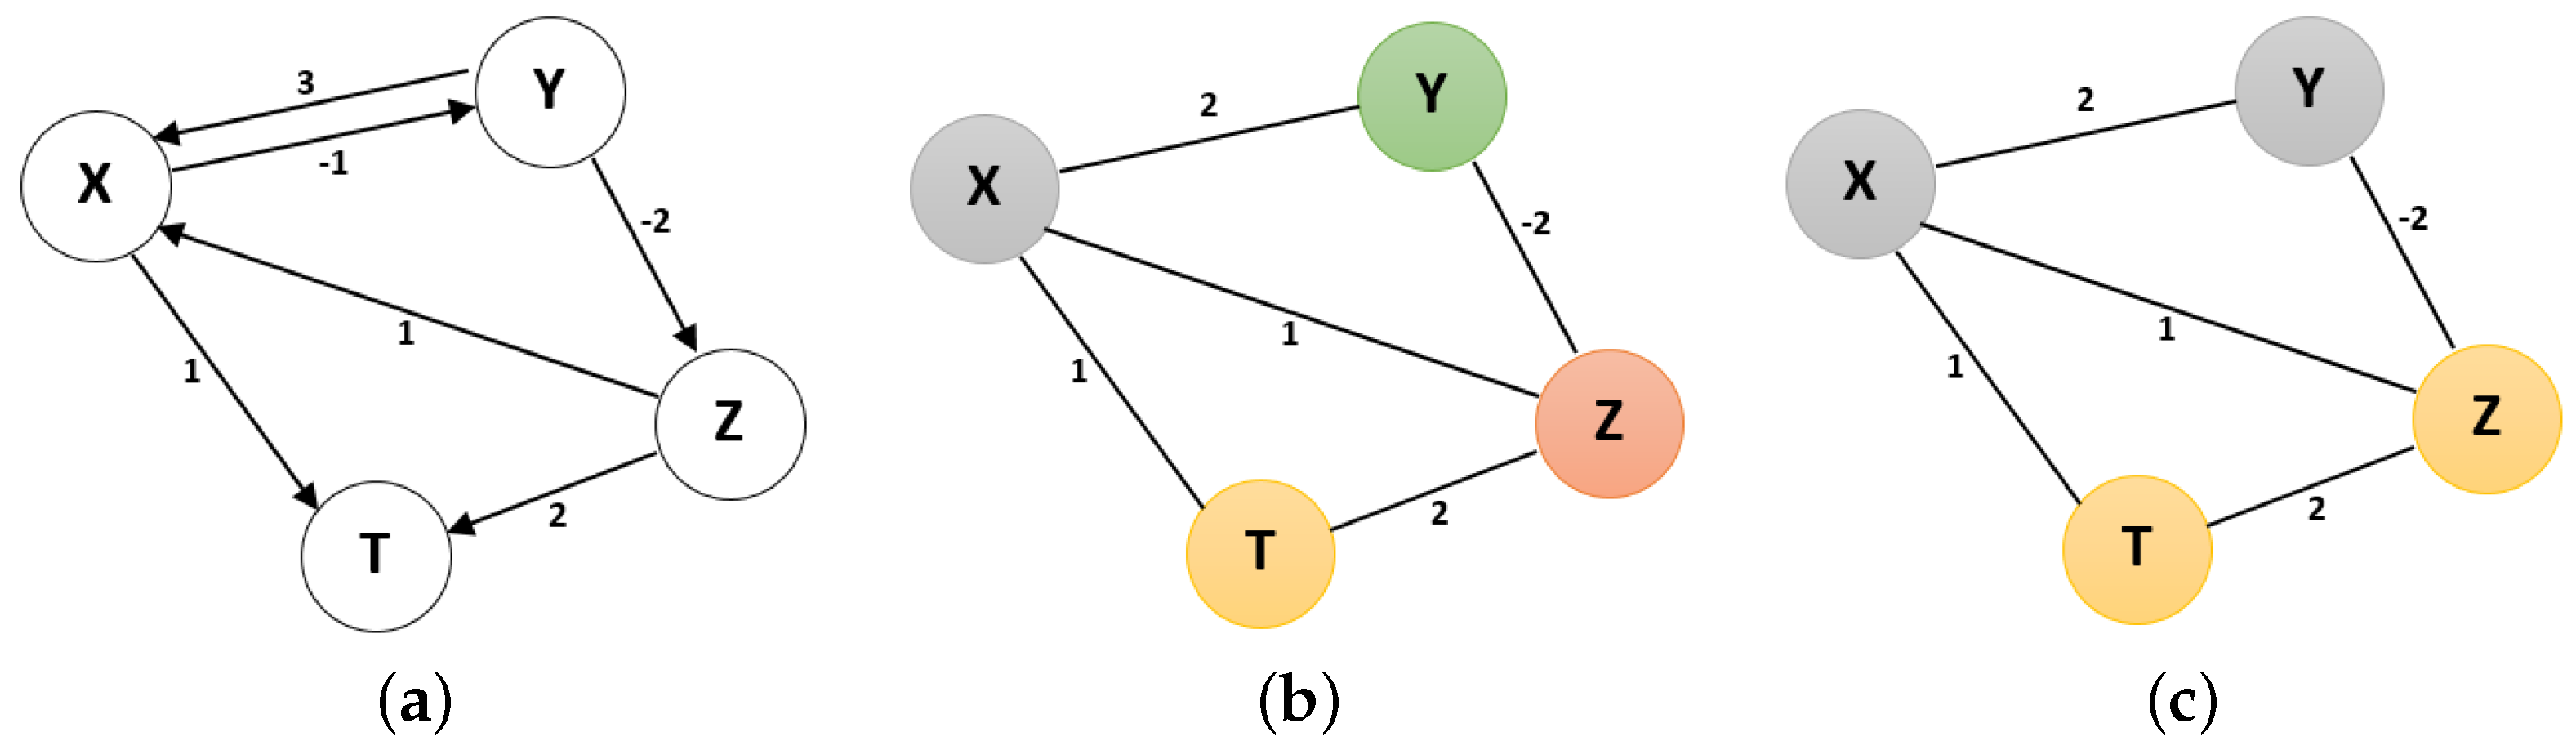
Figure 1 illustrates an example of the weighted label propagation scheme with four nodes. Figure 1a shows the initial network and the directed dyadic relationships between these nodes. Edges’ weights represent the connection strength (or weakness) linking a node i to a node j. Edges with null weights are discarded and they correspond to both “no connection” and “neutral connection”. Figure 1b shows the undirected counterpart of the network where the are calculated from individual and each node is assigned with a unique label pertaining to a different bubble. Figure 1c shows the result of the weighted label propagation procedure. The node Z has three direct links with the other nodes and the highest weight is the edge . Hence, T and Z belong to the same bubble (and similarly, X and Y belong to the same bubble).
3.4. Operating Cost of Pandemic-Resilient Pooling
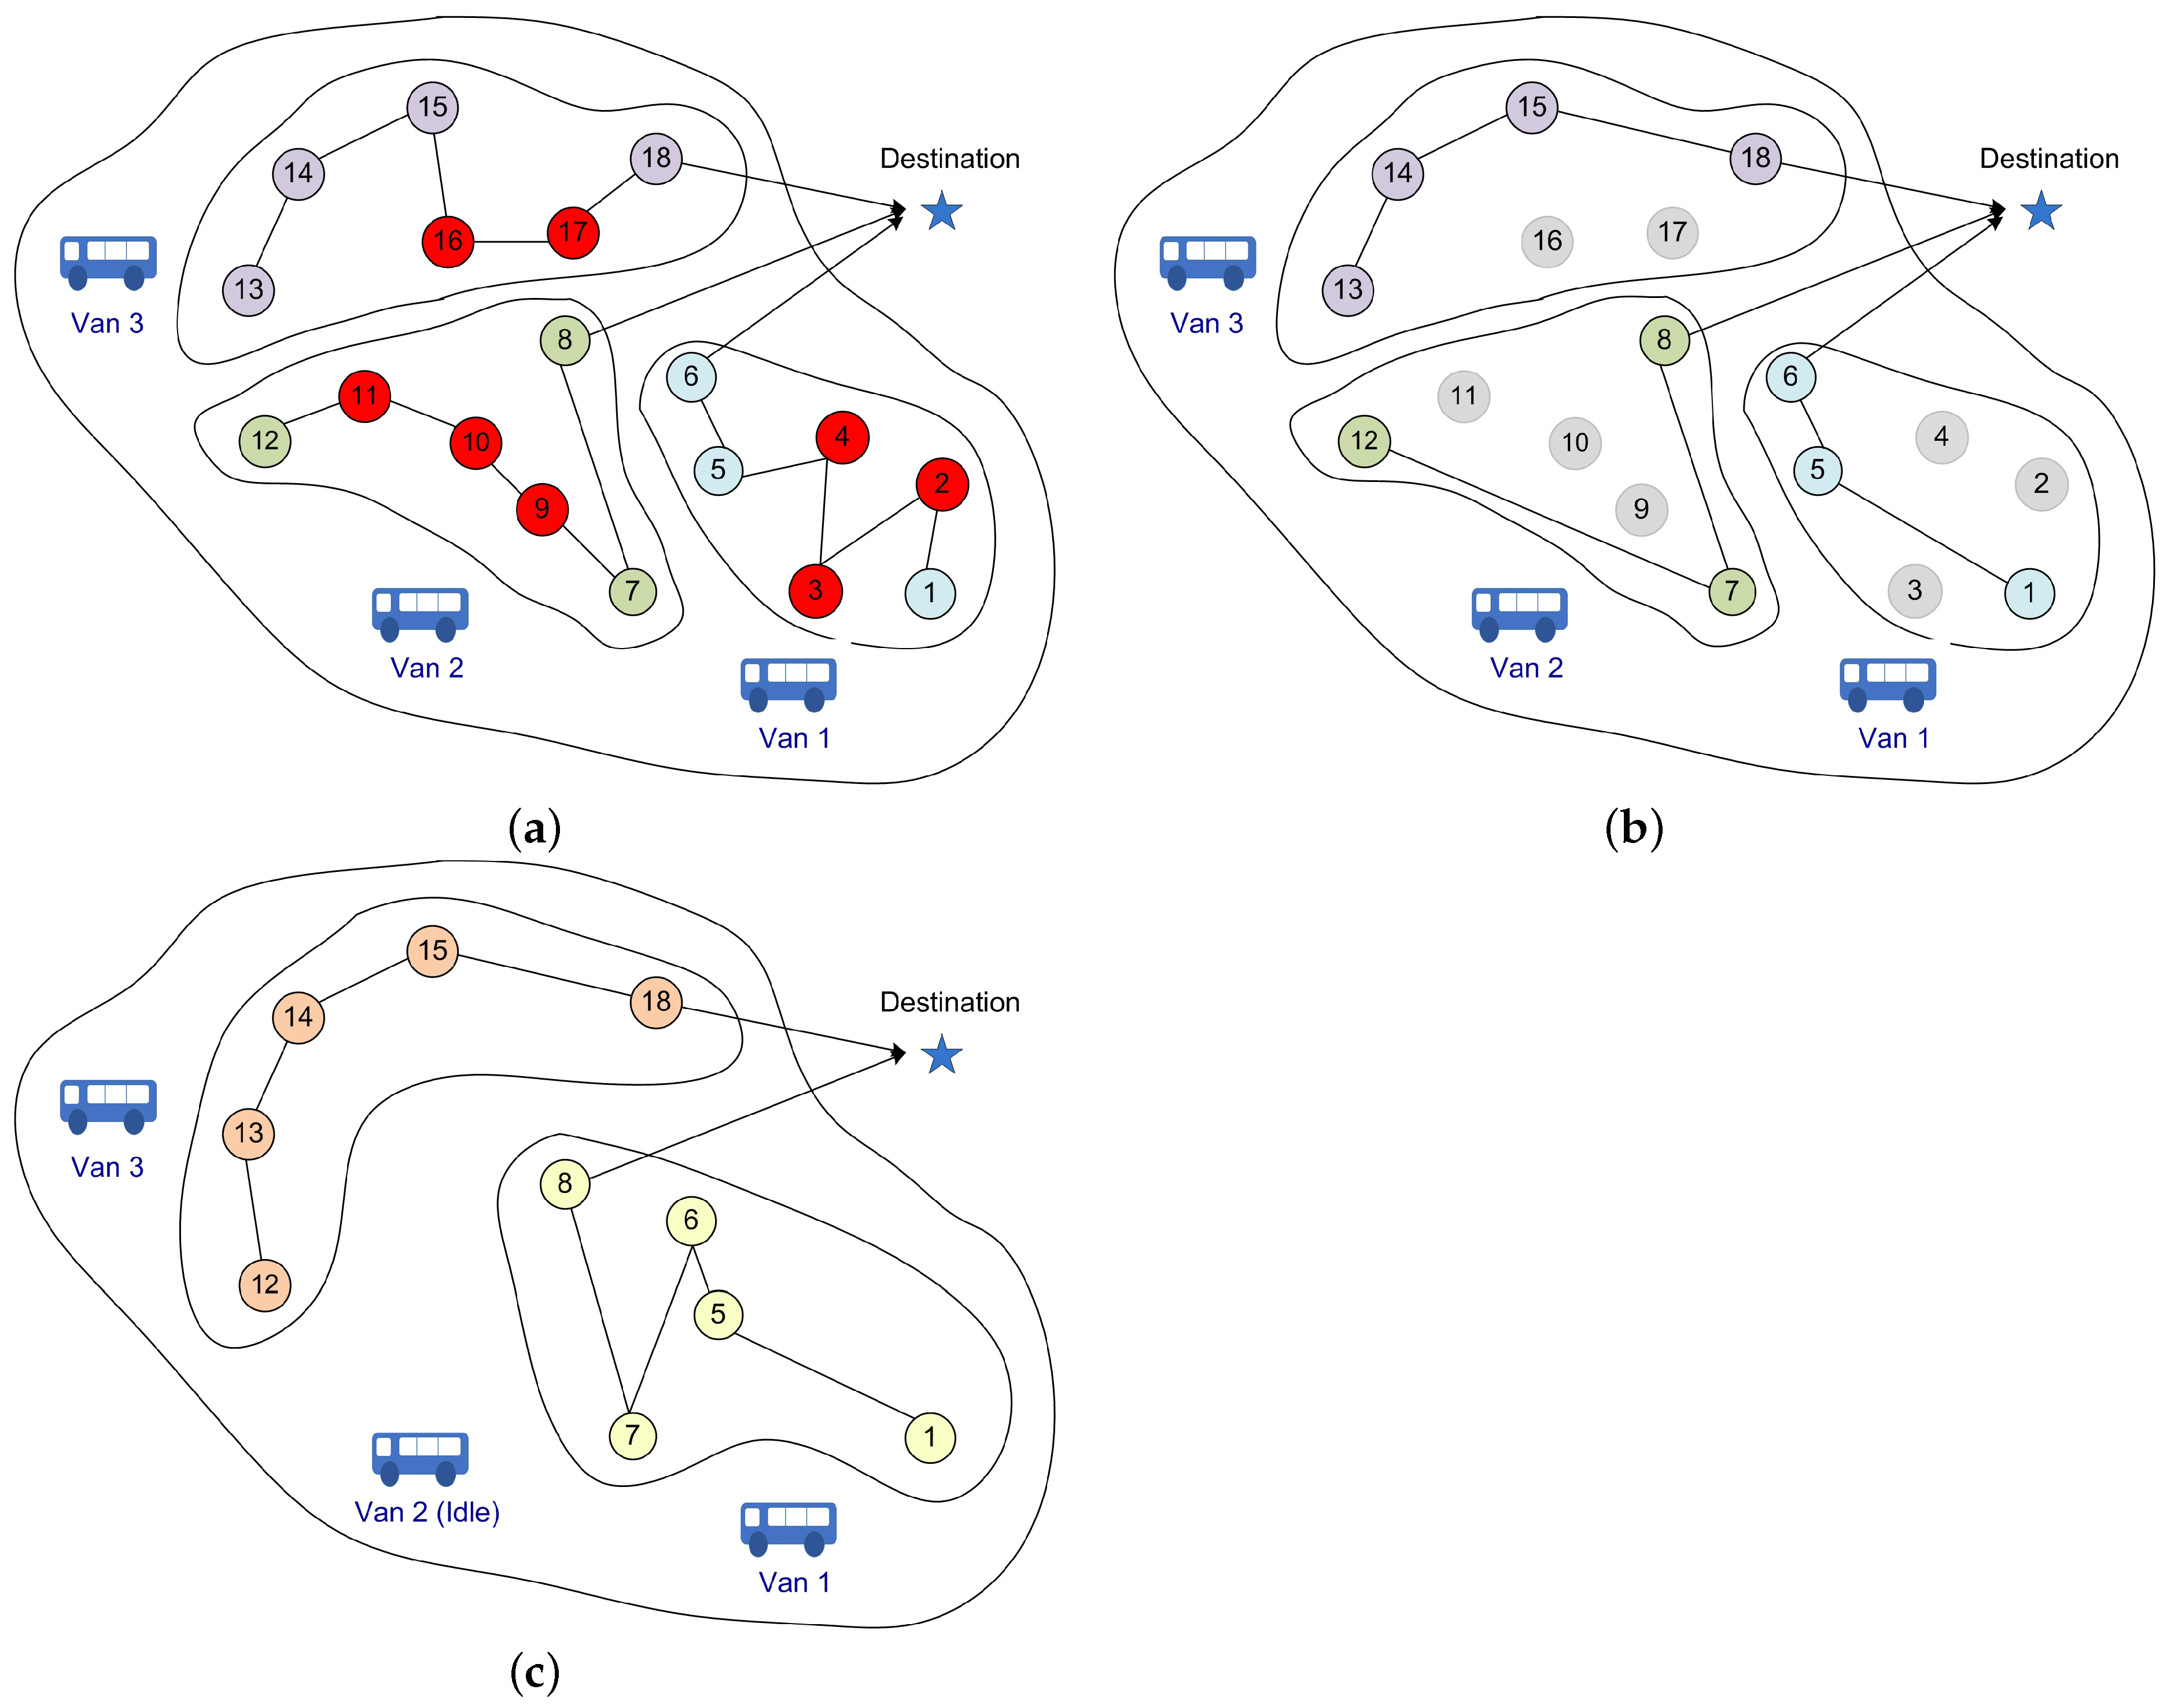
The proposed ridesharing system relies on long-term commitment between commuters and service providers. Therefore, one of the main challenges that needs to be dealt with is the high probability of service suspension due to the infection of riders. In the case that a subgroup of commuters has been isolated after being infected or after a confirmed contact with an infected subject, the service provider needs to adapt their operational scheme accordingly. Because the number of riders is relatively low, the absence of some riders could have a substantial impact on the operational costs and even impel the bus drivers to temporarily suspend the service until the number of riders has reached a certain threshold that covers the operating costs. From the service provider’s perspective, this uncertainty is prone to impact the profit and therefore can impede the sustainability of the service. To illustrate this situation, let us consider a socially cohesive group of 18 riders with compatible spatial, temporal and social profiles and three vans dedicated to respond to their requirements (Figure 2a). When infected riders are confined and therefore do not need the service of their corresponding drivers, the three vans will be operating for four, three, and three riders (Figure 2b). In this situation it would be more judicious from a profit standpoint to cease the operations of van 2 and reassign the remaining riders to the vans 1 and 3.
To cope with the underlying uncertainty and provide a sustainable service in the long run, we use a stochastic modeling that takes into account the possibility of having a subset of riders belonging to the same pool being isolated for a certain period of time. We assume that each individual belonging to a given bubble has a probability of getting infected and hence isolated. is defined by the incidence of the disease. Figure 2c shows an example of the updating method used to reassign riders from overlapping bubbles to the available vans.
Let us assume that the total number of riders belonging to a given bubble is n. The estimation of the operating cost relies on the expected number of riders m requiring the service among n. To estimate this expectancy, we calculate the probability that on a given day, r riders are present among the n riders in the bubble. can be computed in a polynomial time using the following recursive definition [67]:
where n is the total number of riders belonging to the same bubble.
Without loss of generality, let us assume that a rider i is the first rider to be picked up in the predefined tour of the van. Let us also assume that j is the last rider to be picked up before the van’s capacity has been reached. The expected cost (travel time) required to reach these two riders i and j from and to the original departure point (depot) are, respectively, and . The expected distance between i and j is . Therefore, the expected cost of picking up the riders is then given by:
where is the probability that the van’s capacity Q has been reached at rider i’s location. can be computed in a polynomial time using the following:
When all riders have the same probability of being isolated and restrained from using the ridesharing service, the probability is given by the following expression:
It is worth mentioning that the flexible scheme applies only to bubbles with the same group of riders having similar health vulnerability levels. If the riders’ requirements are not met, a trip-based mode can be used to satisfy the mobility needs. This aspect is out of the scope of this study.
Remark 2.
The cost of not being flexible:
Under the rigid strategy, i.e., when the allocated vans do not update their routes according to the availability of the riders, the expectancy of the operating costs is given by the following formula:
We can show that is greater than , which suggests that using a flexible scheme reduces the operating costs and therefore contributes to the sustainability of the service. It is worth mentioning that the main objective of deriving Equations (7)–(12) is to show that under the stochastic modeling of the ridesharing problem, it is still possible to infer an analytic expression of the cost function. However, the study of the proposed ridesharing scheme from a profitability standpoint is not conducted in this paper and will be further explored in future works.
Infection incidence: the probability can be calculated using a disease spread model whenever contact tracing is implemented. Otherwise, we estimate an overall probability of infection incidence p, such that . p is merely calculated based on the number of susceptible people in the population of interest.
4. Simulation-Based Experiments
Simulations have played a crucial role in supporting policy makers planning and making better decisions in order to reduce the impact of communicable diseases, and COVID-19 is not an exception [68]. The modeling environment provides the opportunity to play out different scenarios in silico rather than experimenting on the real population and, in developing the models, often helps to engender a much better understanding of the system as a whole [68]. We implemented an agent-based simulation model in order to evaluate the potential role of the proposed SBV in limiting the spread of COVID-19 across a given population compared to traditional shared mobility transport modes where co-riders can randomly mix. Specifically, we analyzed the dynamics of COVID-19’s spread over a population of riders using three shared mobility models. The first model is the trip-based shared mobility model, where the pooling of riders is performed for every single trip based on their spatio-temporal compatibility only. Therefore, each rider can share a van with different co-riders at every trip, which increases the size of the contact network. The second model is the long-term committed vanpooling model, where pools are formed once based on the spatio-temporal compatibility criteria only (without social bubbles), and then the same co-riders are sharing vans at daily basis for a long period of time. The third shared mobility form is the SBV that we presented with its two-step clustering scheme. These three shared mobility forms have been used to simulate two scenarios, where initial COVID-19 infectious cases are introduced in the same population of riders, and an individual agent-based model along with an epidemiological model have been used to simulate the evolution of the disease across the riders population. In the following, we detail the simulation models as well as the experiments set-ups.
4.1. Epidemiological Model
Initial works on the modeling of COVID-19 spread used variations of the classic mathematical SEIR-type compartmental models [69] (such as SEIR [70], SIRD [71], and SEIIR [72] models) and estimated their parameters based on other coronavirus family viruses such as SARS-CoV and MERS-CoV. As more data about the SARS-CoV-2 virus have become available, an increasing number of works have extended the classical SEIR-type compartmental models with specific SARS-CoV-2 characteristics, mainly the differentiation between symptomatic (mild, medium, and severe) and asymptomatic infectious compartments [73,74,75].
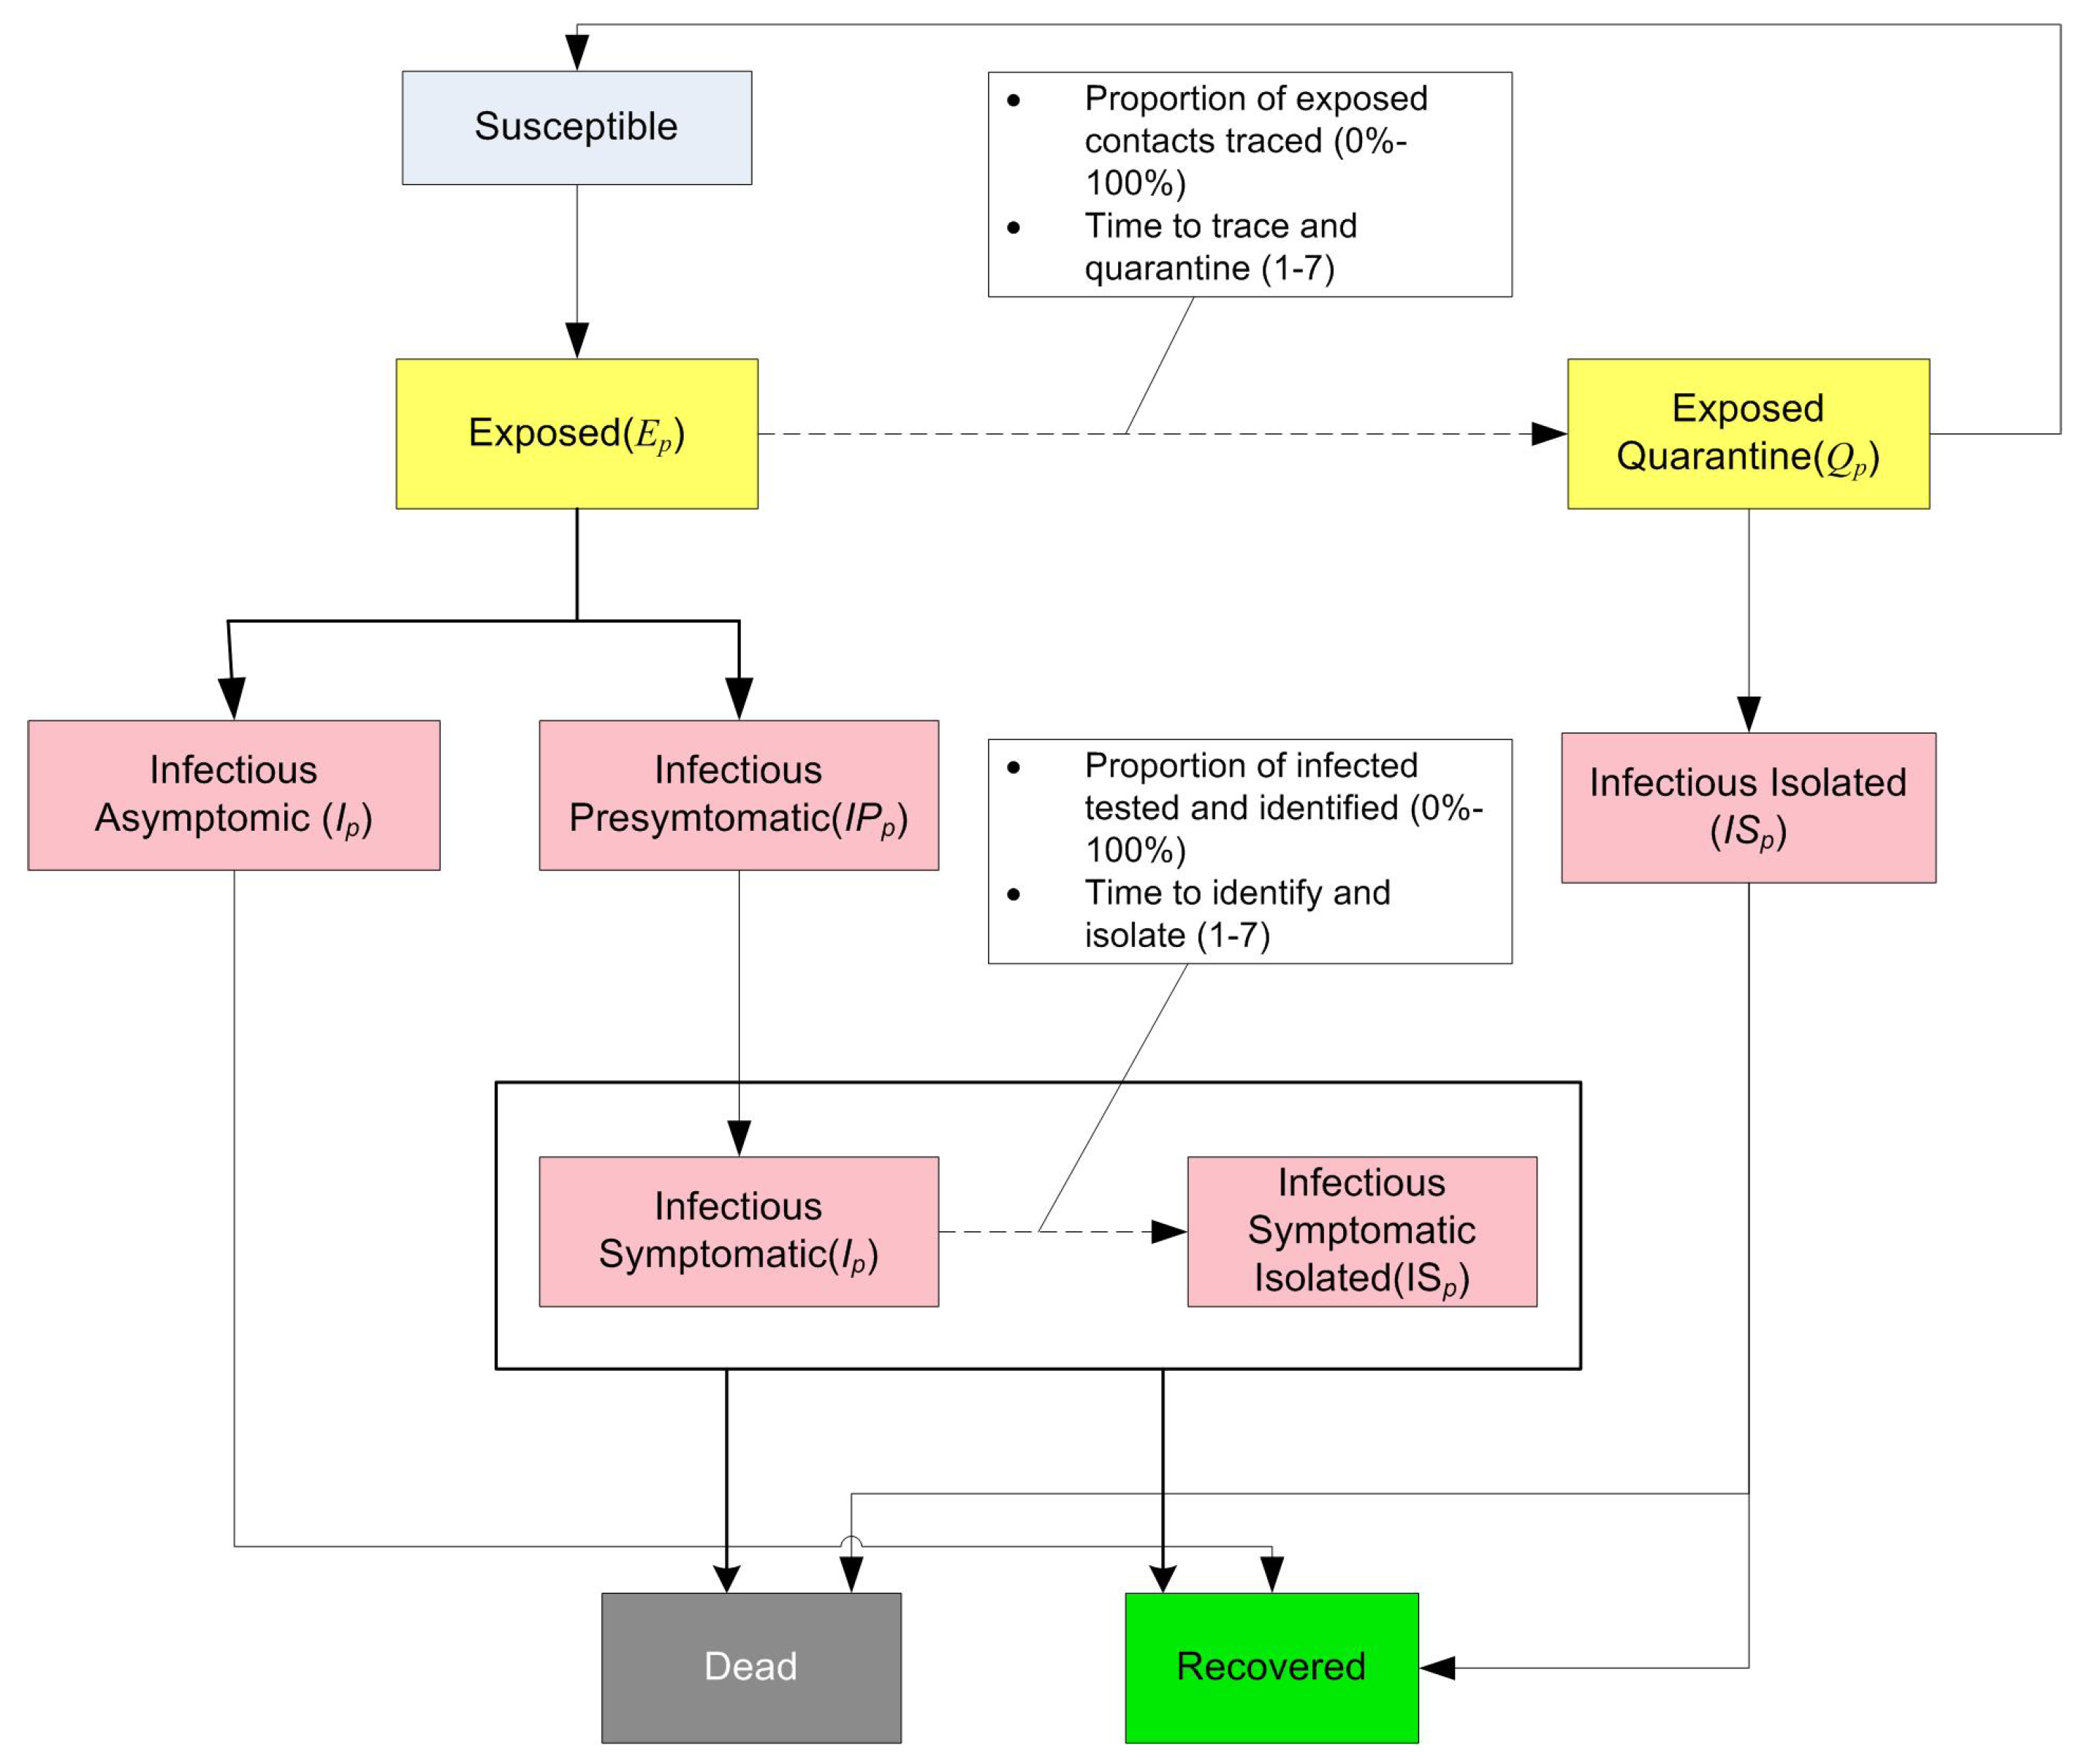
In this study, we use the epidemiological model illustrated in Figure 3, which has been adapted from the SARS-CoV-2 models proposed in [73,75]. Initially, we suppose that all riders are susceptible. When a susceptible person is in contact with an infectious one, they initially become exposed. In order to reflect contact tracing and quarantine interventions, exposed commuters who are traced move to the exposed quarantine compartment according to the percentage and the delay of tracing [75]. After the incubation period is over, exposed commuters can be either asymptomatic or pre-symptomatic infectious. Asymptomatic infectious commuters continue to daily commute and may infect other co-riders. After a certain period (), pre-symptomatic infectious commuters will develop symptoms and become symptomatic (for the sake of simplification, we do not differentiate between mild, medium, and severe symptoms). Symptomatic commuters can be isolated depending on the percentage and delay of tests (Figure 3). For example, if the public authorities impose a full testing policy, all symptomatic commuters will be isolated. The model can also be used to simulate the case of commuters who develop mild symptoms but do not comply to self-isolation and continue commuting (and spreading the disease). Infectious commuters can either recover or die according to the national recovery and death rates, respectively. Exposed commuters who are put into quarantine after a contact tracing intervention can be either infectious and isolated (in which case they cannot commute anymore) or susceptible and resume their commuting activities. We suppose that all commuters who become infectious after the quarantine period are isolated and consequently cannot resume commuting before they recover. For this reason, we do not differentiate between asymptomatic and symptomatic states for infectious isolated individuals. Recovered individuals can resume their commuting activities in the simulation [76].
Let us summarize how the epidemiological model will affect the vanpooling activity:
- During any day of the simulation, commuters can be either susceptible, exposed, recovered, asymptomatic infectious, pre-symptomatic infectious, or symptomatic infectious (to reflect the case of travelers who develop mild symptoms and not tested but still commute and do not comply to self-isolation instructions).
- Commuters who are asymptomatic infectious, pre-symptomatic infectious, and symptomatic infectious spread the disease over susceptible commuters with different transmission levels.
- Isolated or quarantined commuters temporarily cannot travel until they are recovered (or test negative after the quarantine period in which case they become susceptible), which means that pools with isolated or quarantined commuters may need to be updated to find new commuters (according to the flexible re-pooling scheme presented in Section 3.4).
- Recovered commuters need to resume their travel activity and need to either join their initial pools or join a new pool.
- Deceased commuters are permanently removed and their initial pools may need to be updated.
- The same model applies for drivers who can be infectious/become infected. In the simulation we assume that isolated or quarantined drivers will be replaced by new ones, which means that buses are still available for commuting.
- In case the driver or a member of a pool tests positive, the driver and all the pool members are quarantined and the bus may be used for a different pool of commuters.
4.2. Agent-Based Model and Activity Patterns
Based on evidence that airborne diseases can be transmitted during brief and intense contacts in public transportation means (such as school buses, trains, etc.) [35], and more recently on evidences that COVID-19 was transmitted through contacts in shared taxis and vans [48,59], we assume that the SARS-CoV-2 can be transmitted through social contact during vanpooling.
Agent and multi-agent based simulations have been widely used to model and analyze the spread of infectious diseases across urban areas at a micro level, where individual agents behave, move, and interact with each other, and consequently diffuse the disease across spatial populations [77]. In this paper, we use an individual agent-based simulation approach [78], where the simulation runs at a daily basis for either a period determined by the user or until there are no more infected individuals in the simulation. During every working day of the simulation, commuters use vanpooling to travel back and forth between home and the location of their main activity (e.g., work, school, university, etc.) according to the home–vanpooling–main activity–vanpooling–home pattern. We assume that commuters can also become infected at home (randomly) and at their main activity place (based on the activity model presented in [77]). With respect to the vanpooling activity, for every simulation day t and every van trip j, the interactions between susceptible and infectious (asymptomatic, pre-symptomatic, or symptomatic) result in the transmission of the disease from the latter to the former according to the infection probability which is calculated based on the transmission and contact rates of that van trip j at day t. During weekend days, commuters do not use vanpooling services and new infections can happen only at home. At each timestep t the simulator determines the probability of infection of every individual i based on the infection level of its mixing context which is the trip of the van .
Given that in this paper we focus on ridesharing-related infections, in the following we only detail the calculation of the infection probability in the vanpooling mixing context. Suppose that we have a total number of vans. Let us define the mixing context as the van j making the trip k at day t. The mixing context is composed of the list of commuters and the driver sharing (driving) the trip of the van j at day t.
To calculate the probability of a susceptible individual (either a commuter or a driver) i becoming infected while making a trip k within a van j at time t, we use the following probability adapted from [76]:
where is the probability that the individual x who is a co-rider/driver in the same trip of van j infects i. In other words, the probability of i becoming infected increases with the number of infectious co-riders/driver in the same mixing context.
is defined in [76] as follows:
where denotes the time when individual x become infected, is the probability of transmission from individual x to i, g is a scaling factor used to vary the contagiousness of simulated scenarios, and is a function that characterizes the infectivity of the infectious individual x over time (by assuming that infectivity decreases with time).
The probability of transmission is calculated as follows [79]:
where is the infection rate and is supposed to be known (see Table 2).
The simulation runs according to the following algorithm:
- Initialize the population of commuters and vans;
- Identify the list of pools and assign commuters to vans according to the SBV algorithm defined in Section 3.4;
- Determine the initial number and location of initially infected commuters
- For every simulation day t:
- (a)
- If working day, then:
- -
- Make the trip of every van j from home to the main activity location (work, school, university, etc.);
- -
- Calculate the probability of infection of every individual i in every van j making the trip from home to the main activity location;
- -
- Calculate the probability of infection of every individual in the main activity context;
- -
- Make the trip of every van j from the main activity location to home;
- -
- Calculate the probability of infection of every individual i making the trip of every van j from home to the main activity location;
- (b)
- Calculate the probability of infection of every individual at home;
- (c)
- Apply the epidemiological model and change the states of commuters/drivers;
- (d)
- Apply the intervention model (quarantine after contact tracing and/or testing), if any;
- (e)
- Reconstruct or update pools and reassign commuters to vans (flexible reassignment), if needed;
- Update the infection incidence probability p using , where I is the number of reported infected cases and T is the size of the total population;
- Stop simulation at the end-of simulation period or if there are no more infected individuals.
4.3. Experimental Setup
We used an agent-based simulation model combined with the previously presented epidemiological model to simulate the spread of COVID-19 over a population of riders. Table 2 illustrates the list of epidemiological parameters used in the simulation. The simulation was conducted on the city of Salalah, Sultanate of Oman (Figure 4) with a population of 5000 riders and a set of 70 vans. The population of riders consists of female students of Dhofar University and was generated using data collected from a sample of 500 students using committed vanpooling to commute daily between their home and the university due to the scarcity of public transportation means [23]. Consequently, there is only one main activity location in the simulation, which is the university, and all riders frequent the same university where they can mix. The simulations were implemented using the GAMA platform [80].

Table 2.
Parameters of the transmission model.
| Parameter | Meaning | Value | Reference |
|---|---|---|---|
| Probability that a susceptible individual i traveling in the trip of the van on day t be infected | Calculated in the simulation | [76] | |
| Exposure (latent) period (in days) | 2.5 | [81] | |
| Pre-symptomatic infectious period (in days) | 1 | [81] | |
| Infectious period (in days) | 6 | [81] | |
| Isolation period (in days) | 15 | National policy of Oman | |
| Quarantine period (in days) | 14 | National policy of Oman | |
| Infection rate of COVID-19 | 2.5 | Ministry of Health, Oman | |
| Death rate | 0.0107 | Ministry of Health, Oman | |
| Recovery rate | 0.9252 | Ministry of Health, Oman |
The objective of the experiments is evaluation of the viability of the proposed ridesharing mode and its role in reducing the spread of the pandemic while ensuring a minimum level of sustainability. For this reason, we consider two scenarios corresponding to two different extreme pandemic mitigation policies: (1) no intervention as the worst case and (2) full contact tracing and quarantine as the best case.
Scenario 1: No Intervention
In this scenario, 10 infected commuters are introduced in the population on the first day of the simulation. No quarantine intervention is conducted. Therefore, if a subject is infected without showing symptoms, then he/she is not compelled for self-isolation and he/she may use the commuting service carrying the virus and is therefore prone to spreading the disease to the co-riders.
Scenario 2: Contact Tracing and Quarantine
Similarly to scenario 1, in this scenario 10 infected commuters are introduced in the population on the first day of the simulation (at the same locations). A full contact-tracing campaign is simulated by marking all riders who contacted infected cases and resulting in their quarantine in a period between 1 and 2 days of infection (to simulate the delay that authorities might take in reality to quarantine traced cases, as illustrated in Figure 3). When the framework is implemented as a platform, a dedicated contact-tracing algorithm can be implemented taking into consideration the structure of the data collected for every trip. Contact-tracing algorithms are out the scope of this paper and further details can be found in [82].
For both scenarios, we simulated the dynamics of the spread of COVID-19 over the total population of riders considering three ridesharing schemes:
- Trip-based vanpooling, where pools of riders are formed for every trip.
- Long-term committed vanpooling (pools are formed of the same riders during the period of service) without social bubbles, i.e., pools are formed using only the spatio-temporal clustering step.
- Social bubble based vanpooling proposed in this paper.
5. Results and Discussion
5.1. Scenario 1
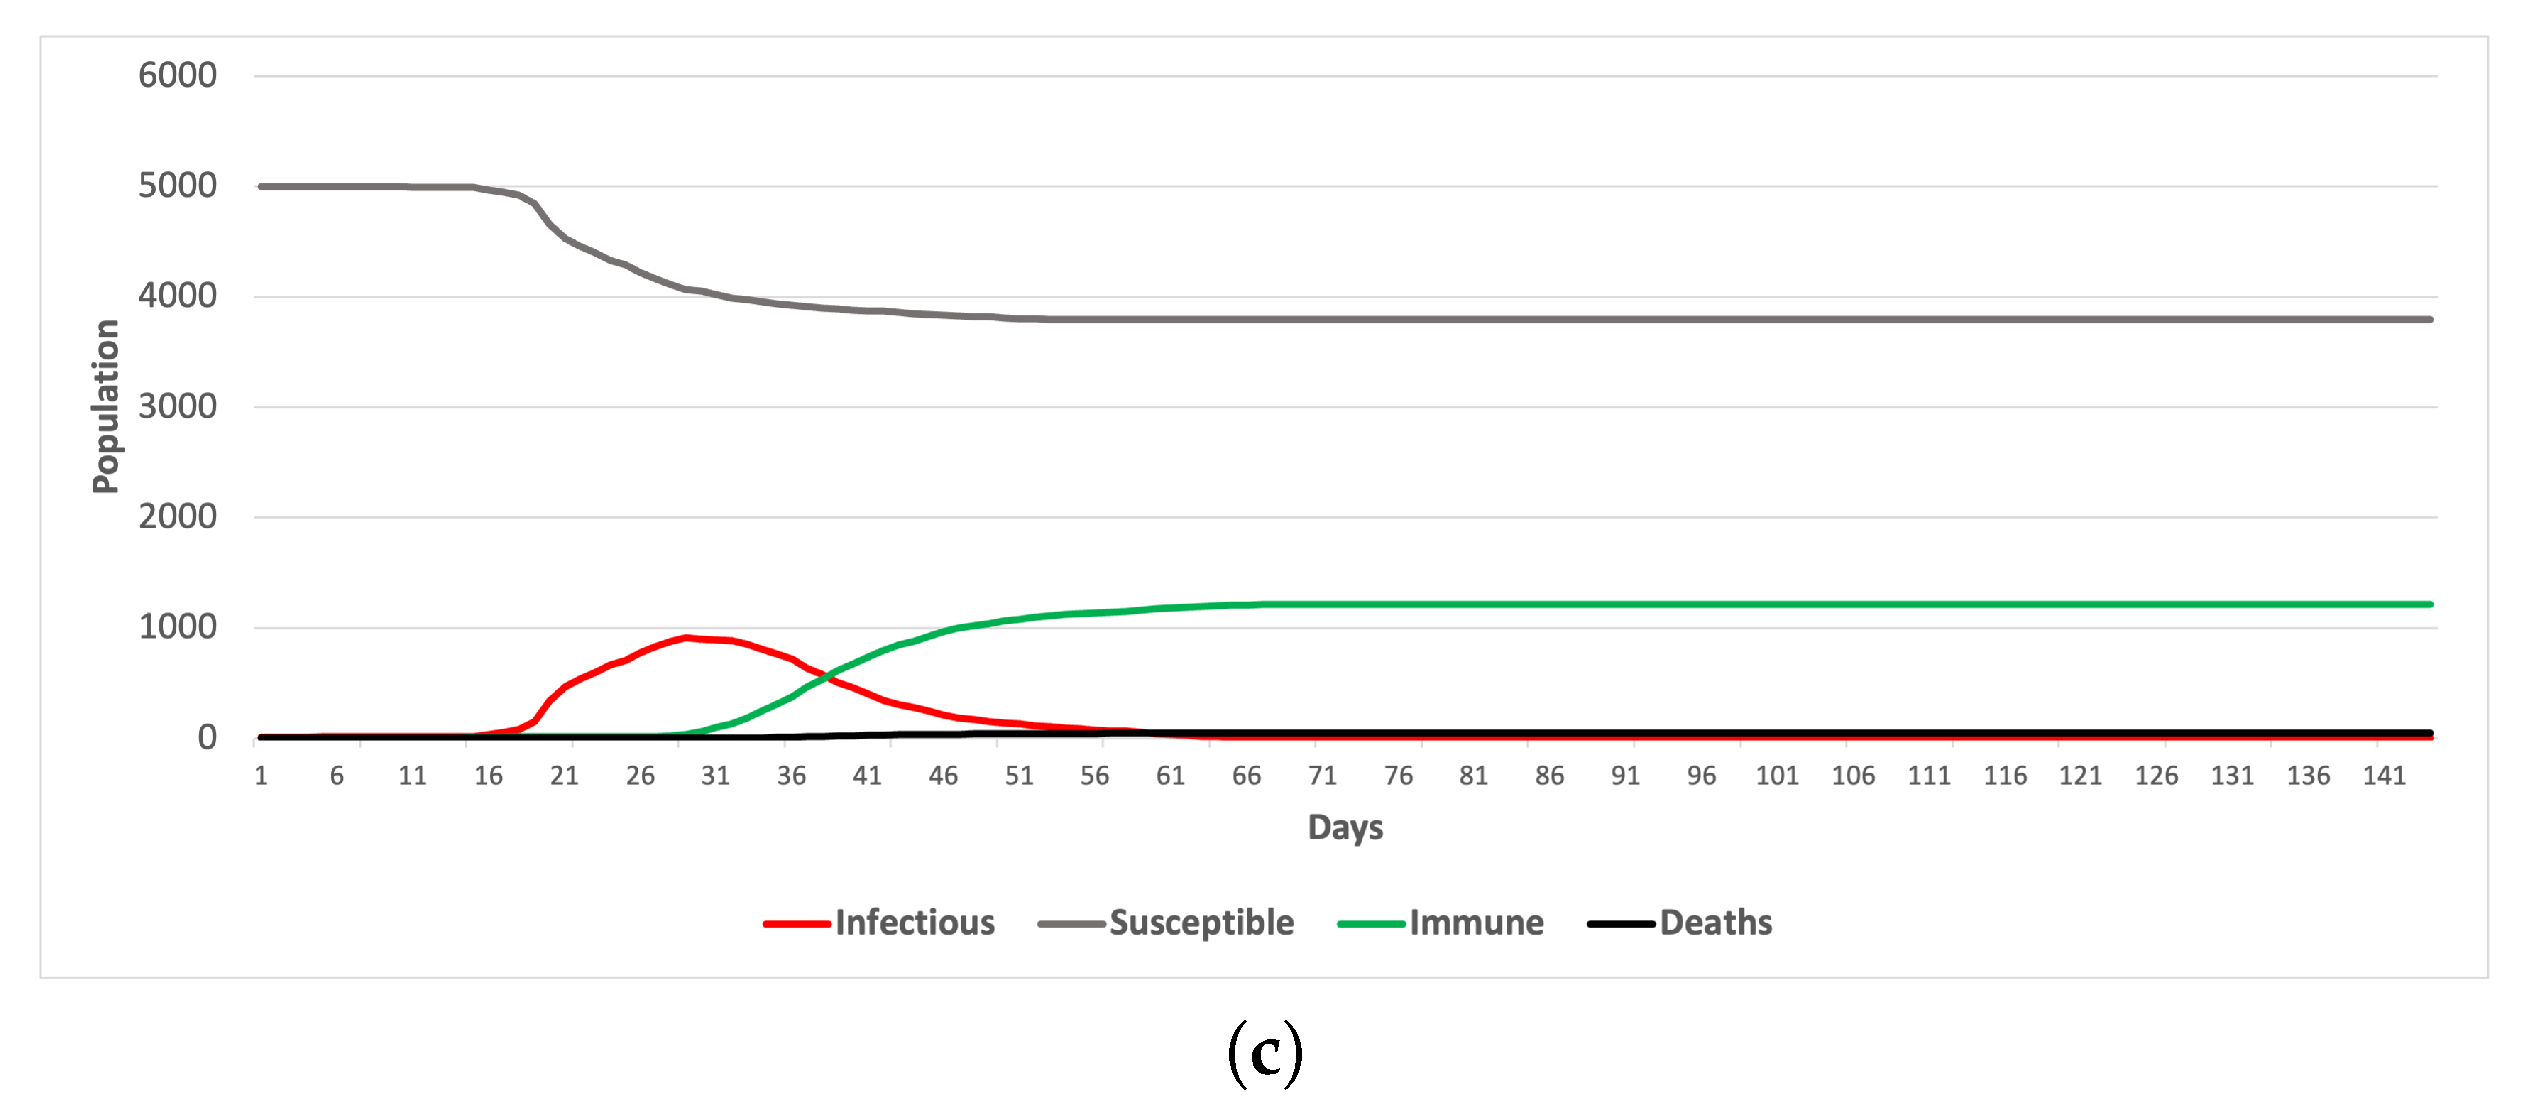
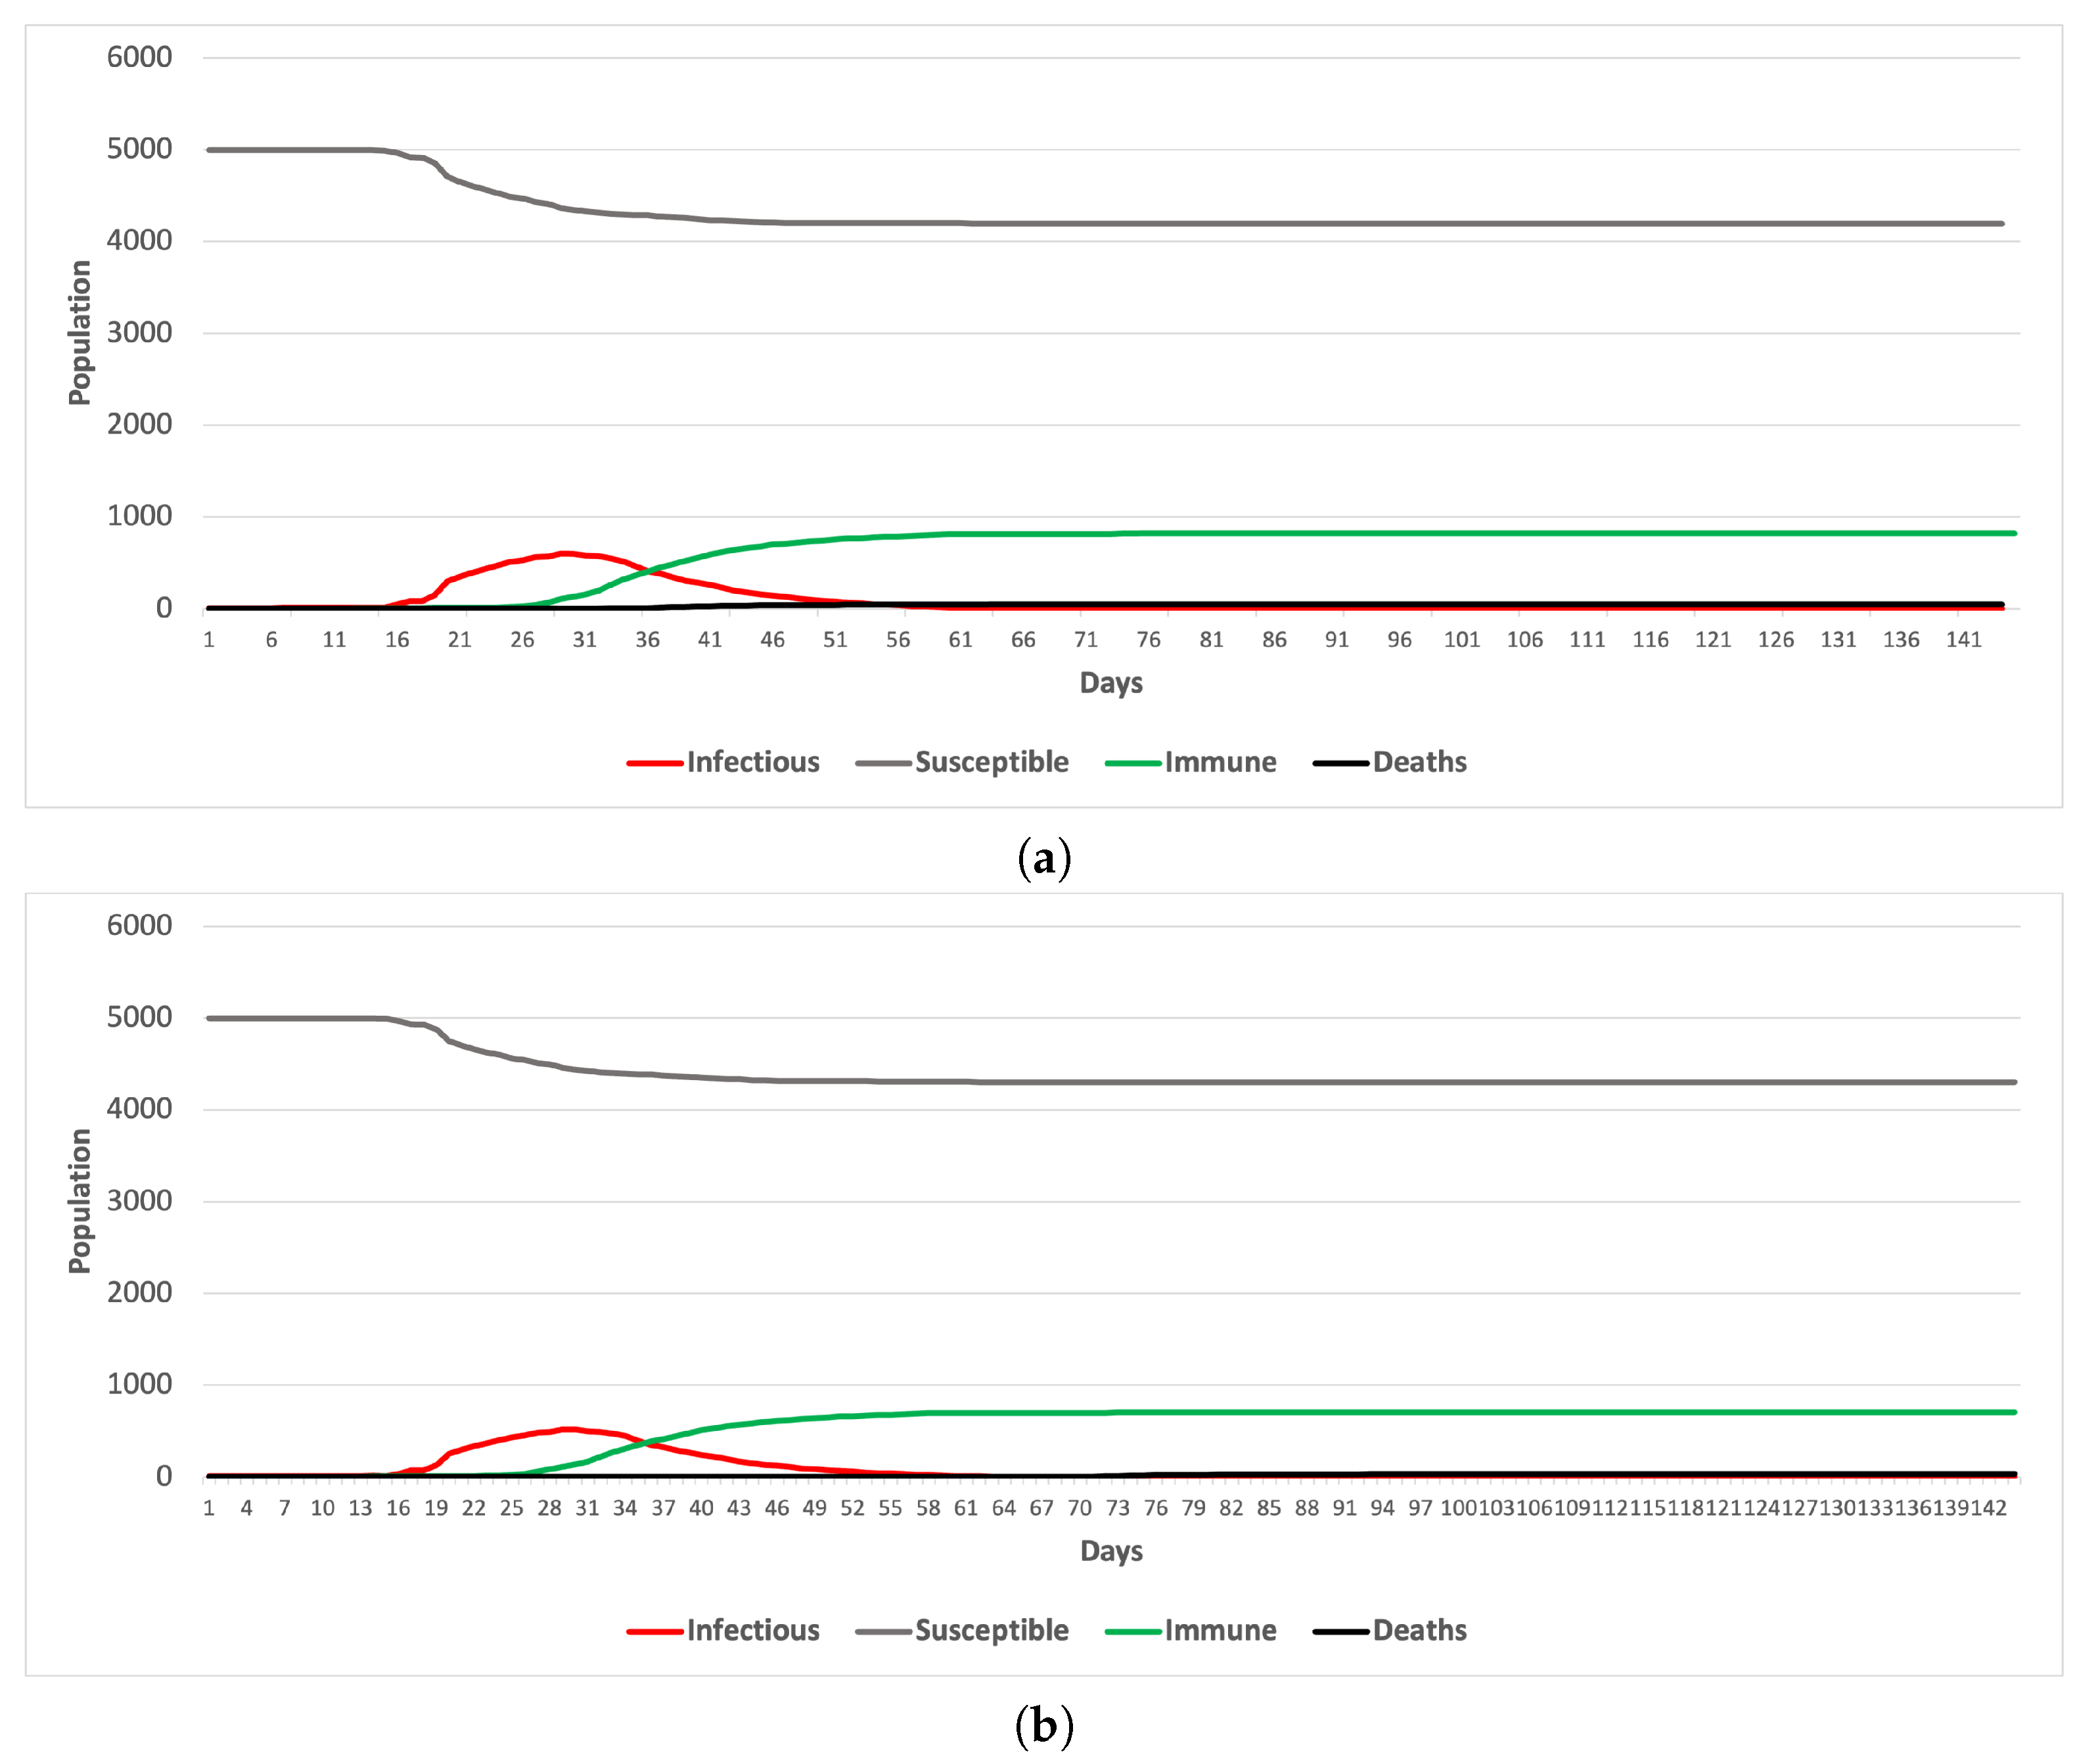
The results of the first set of experiments (no intervention) are depicted in Figure 5. We notice that the impact of the disease spread is reduced in the case where long-term and SBV schemes are implemented compared to the trip-based configuration, where the peak as well as the number of infected riders are significantly higher. Despite the absence of measures and restrictions to control the disease, the use of the SBV mode appears to be fairly effective at limiting the spread of the epidemic, and the transmissibility of the virus has been reduced ( for trip-based vs. for bubble-based ridesharing). While the contagiousness of the disease remains substantially high, we observe a decrease in the number of infected subjects. This observation can be explained by the fact that infected subjects are less likely to spread the disease while commuting to individuals that they do not share the same bubble with.
5.2. Scenario 2
When precautionary measures are in place, i.e., contact tracing and quarantine, the efficacy of bubble-based vanpooling versus its trip-based and committed counterparts is more perceptible (Figure 6).
The bubble-based ridesharing mode has significantly reduced the number of cumulative infected cases as well as the susceptible population compared to the trip-based and the long-term committed ridesharing forms. Unlike scenario 1, the spread of the disease using bubble-based pooling appears to be under control by combining the tracing and isolation measures with a ridesharing scheme based on socially cohesive groups. For instance, the ratio decreased from 1.44 with trip-based ridesharing to 1.09 with the proposed bubble-based scheme. A drop of 35% may suggest the following claims:
- Enforcing contact tracing and quarantine is more effective in controlling the spread of the disease when the bubble-based ridesharing scheme is adopted as a commuting mode.
- It is possible to sustain the transportation service without compromising the efforts to mitigate the spread of the pandemic.
6. Conclusions and Future Work
In this paper, we presented a new pandemic-resilient ridesharing framework based on the emerging concept of social bubbles, called social bubble vanpooling (SBV). SBV aims to ensure the sustainability of the transportation service of a ridesharing operator without compromising the efforts undertaken by health authorities to mitigate the spread of the disease. The idea is to exploit the social connections binding the riders to create socially cohesive groups so that the commuters do not need to interact with individuals outside their residential neighborhoods during their commuting activity, in addition to their daily activities (e.g., working, studying, shopping, etc.). From this perspective, the proposed ridesharing model appears to be a viable solution when the mobility of individuals is subject to tight restrictions to stop the spread of a communicable airborne disease (such as COVID-19). The flexibility of the model allows maintaining the transportation service while upholding the precautionary measures to fight the pandemic. The operating costs have also been taken into account by inferring an approximation of these costs and devising a flexible scheme to avoid unnecessary financial burdens. An experimental study was conducted in silico and has shown that the proposed ridesharing model can significantly help countering the spread of COVID-19 specially when contact tracing and quarantine measures are in place.
The current work presents some limitations. First, the study was conducted based on a limited population in terms of size and diversity. Most of the data was collected from university students. The construction of social bubbles would be more challenging for a larger population with different heterogeneous social groups. The complexity of the clustering phase as well as the routing procedures would be significantly increased due to the increased spatio-temporal and social constraints. Secondly, we limited our study to the clustering phase and operational mode with a single mode of transportation (vans) without focusing on the inherent routing problem nor on the integration with other means of transportation.
To address these limitations, this study will be further developed in three main directions. The first direction is the investigation of the scalability of the SBV in the context of large and heterogeneous populations of riders (i.e., children, youth, adults, and elderly), with different activity patterns (i.e., entertaining, schooling, and working activities). The second direction consists of integrating the SBV with other forms of shared modes (particularly, shared taxis) in order to build a shared mobility as a service (S-MaaS) concept. The third direction consists of exploring the applicability of the SBV in different contexts where riders’ social compatibility is important.
Author Contributions
Conceptualization, H.H. and Z.B.; methodology, H.H.; software, Z.B.; validation, H.H., Z.B. and L.H.; formal analysis, H.H., Z.B. and L.H.; writing—original draft preparation, H.H., Z.B. and L.H.; visualization, Z.B.; supervision, H.H.; project administration, H.H.; funding acquisition, H.H. and Z.B. All authors have read and agreed to the published version of the manuscript.
Funding
This work was partially funded by TRC of Oman, grant number BFP/RGP/ICT/21/235.
Institutional Review Board Statement
Not applicable.
Informed Consent Statement
Not applicable.
Data Availability Statement
Data used in this work are confidential.
Conflicts of Interest
The authors declare no conflict of interest.
References
- Zhang, J.; Hayashi, Y.; Frank, L.D. COVID-19 and transport: Findings from a world-wide expert survey. Transp. Policy 2021, 103, 68–85. [Google Scholar] [CrossRef] [PubMed]
- Aloi, A.; Alonso, B.; Benavente, J.; Cordera, R.; Echániz, E.; González, F.; Ladisa, C.; Lezama-Romanelli, R.; López-Parra, Á.; Mazzei, V.; et al. Effects of the COVID-19 Lockdown on Urban Mobility: Empirical Evidence from the City of Santander (Spain). Sustainability 2020, 12, 3870. [Google Scholar] [CrossRef]
- Honey-Rosés, J.; Anguelovski, I.; Chireh, V.K.; Daher, C.; Konijnendijk van den Bosch, C.; Litt, J.S.; Mawani, V.; McCall, M.K.; Orellana, A.; Oscilowicz, E.; et al. The impact of COVID-19 on public space: An early review of the emerging questions: Design, Perceptions and Inequities. Cities Health 2020, 5, S263–S279. [Google Scholar] [CrossRef]
- Rahimi, E.; Shabanpour, R.; Shamshiripour, A.; Mohammadian, A.K. Perceived risk of using shared mobility services during the COVID-19 pandemic. Transp. Res. Part F Traffic Psychol. Behav. 2021, 81, 271–281. [Google Scholar] [CrossRef]
- Morshed, S.A.; Khan, S.S.; Tanvir, R.B.; Nur, S. Impact of COVID-19 pandemic on ride-hailing services based on large-scale Twitter data analysis. J. Urban Manag. 2021, 10, 155–165. [Google Scholar] [CrossRef]
- Du, J.; Rakha, H.A. Covid-19 impact on ride-hailing: The chicago case study. Transp. Find. 2020, 17838. [Google Scholar] [CrossRef]
- De Palma, A.; Vosough, S. Long, medium, and short-term effects of COVID-19 on mobility and lifestyle. In THEMA (THéorie Economique, Modélisation et Applications); Technical Report; Université de Cergy-Pontoise: Cergy, France, 2021. [Google Scholar]
- Hyland, P.; Vallières, F.; Shevlin, M.; Bentall, R.P.; McKay, R.; Hartman, T.K.; McBride, O.; Murphy, J. Resistance to COVID-19 vaccination has increased in Ireland and the United Kingdom during the pandemic. Public Health 2021, 195, 54–56. [Google Scholar] [CrossRef] [PubMed]
- Edwards, B.; Biddle, N.; Gray, M.; Sollis, K. COVID-19 vaccine hesitancy and resistance: Correlates in a nationally representative longitudinal survey of the Australian population. PLoS ONE 2021, 16, e0248892. [Google Scholar] [CrossRef]
- Ball, P. Anti-vaccine movement might undermine pandemic efforts. Nature 2020, 581, 251. [Google Scholar] [CrossRef]
- Hörcher, D.; Singh, R.; Graham, D.J. Social distancing in public transport: Mobilising new technologies for demand management under the Covid-19 crisis. Transportation 2021, 49, 735–764. [Google Scholar] [CrossRef]
- Edelson, P.J.; Phypers, M. TB transmission on public transportation: A review of published studies and recommendations for contact tracing. Travel Med. Infect. Dis. 2011, 9, 27–31. [Google Scholar] [CrossRef] [PubMed]
- Gutiérrez, A.; Miravet, D.; Domènech, A. COVID-19 and urban public transport services: Emerging challenges and research agenda. Cities Health 2020, 5, S177–S180. [Google Scholar] [CrossRef]
- Budd, L.; Ison, S. Responsible Transport: A post-COVID agenda for transport policy and practice. Transp. Res. Interdiscip. Perspect. 2020, 6, 100151. [Google Scholar] [CrossRef]
- Shokouhyar, S.; Shokoohyar, S.; Sobhani, A.; Gorizi, A.J. Shared Mobility in Post-COVID Era: New Challenges and Opportunities. Sustain. Cities Soc. 2021, 67, 102714. [Google Scholar] [CrossRef]
- Koehl, A. Urban transport and COVID-19: Challenges and prospects in low-and middle-income countries. Cities Health 2020, 5, S185–S190. [Google Scholar] [CrossRef]
- Prati, G. Gender equality and women’s participation in transport cycling. J. Transp. Geogr. 2018, 66, 369–375. [Google Scholar] [CrossRef]
- Goodman, A.; Aldred, R. Inequalities in utility and leisure cycling in England, and variation by local cycling prevalence. Transp. Res. Part F Traffic Psychol. Behav. 2018, 56, 381–391. [Google Scholar] [CrossRef] [Green Version]
- Tirachini, A.; Cats, O. COVID-19 and Public Transportation: Current Assessment, Prospects, and Research Needs. J. Public Transp. 2020, 22. [Google Scholar] [CrossRef]
- Zhang, J. Transport policymaking that accounts for COVID-19 and future public health threats: A PASS approach. Transp. Policy 2020, 99, 405–418. [Google Scholar] [CrossRef]
- Gkiotsalitis, K.; Cats, O. Public transport planning adaption under the COVID-19 pandemic crisis: Literature review of research needs and directions. Transp. Rev. 2020, 41, 374–392. [Google Scholar] [CrossRef]
- Vlacic, L.B. A Pandemic-Resilient Transportation System Paradigm [Editor’s Column]. IEEE Intell. Transp. Syst. Mag. 2021, 13, 3–4. [Google Scholar] [CrossRef]
- Haddad, H.; Bouyahia, Z.; Jabeur, N.; Yasar, A.U.H. Socially Structured Vanpooling: A Case Study in Salalah, Oman. IEEE Intell. Transp. Syst. Mag. 2022, 14, 242–252. [Google Scholar] [CrossRef]
- Sannigrahi, S.; Pilla, F.; Basu, B.; Basu, A.S.; Molter, A. Examining the association between socio-demographic composition and COVID-19 fatalities in the European region using spatial regression approach. Sustain. Cities Soc. 2020, 62, 102418. [Google Scholar] [CrossRef]
- Almagro, M.; Orane-Hutchinson, A. JUE Insight: The determinants of the differential exposure to COVID-19 in New York city and their evolution over time. J. Urban Econ. 2020, 127, 103293. [Google Scholar] [CrossRef]
- Pijls, B.G.; Jolani, S.; Atherley, A.; Derckx, R.T.; Dijkstra, J.I.; Franssen, G.H.; Hendriks, S.; Richters, A.; Venemans-Jellema, A.; Zalpuri, S.; et al. Demographic risk factors for COVID-19 infection, severity, ICU admission and death: A meta-analysis of 59 studies. BMJ Open 2021, 11, e044640. [Google Scholar] [CrossRef]
- Merler, S.; Ajelli, M. The role of population heterogeneity and human mobility in the spread of pandemic influenza. Proc. R. Soc. B Biol. Sci. 2010, 277, 557–565. [Google Scholar] [CrossRef] [Green Version]
- Browne, A.; St-Onge Ahmad, S.; Beck, C.R.; Nguyen-Van-Tam, J.S. The roles of transportation and transportation hubs in the propagation of influenza and coronaviruses: A systematic review. J. Travel Med. 2016, 23, tav002. [Google Scholar] [CrossRef] [Green Version]
- Tizzoni, M.; Bajardi, P.; Decuyper, A.; Kon Kam King, G.; Schneider, C.M.; Blondel, V.; Smoreda, Z.; González, M.C.; Colizza, V. On the use of human mobility proxies for modeling epidemics. PLoS Comput. Biol. 2014, 10, e1003716. [Google Scholar] [CrossRef] [Green Version]
- Findlater, A.; Bogoch, I.I. Human mobility and the global spread of infectious diseases: A focus on air travel. Trends Parasitol. 2018, 34, 772–783. [Google Scholar] [CrossRef]
- Goscé, L.; Johansson, A. Analysing the link between public transport use and airborne transmission: Mobility and contagion in the London underground. Environ. Health 2018, 17, 84. [Google Scholar] [CrossRef]
- Nakata, Y.; Röst, G. Global analysis for spread of infectious diseases via transportation networks. J. Math. Biol. 2015, 70, 1411–1456. [Google Scholar] [CrossRef] [Green Version]
- Olsen, S.J.; Chang, H.L.; Cheung, T.Y.Y.; Tang, A.F.Y.; Fisk, T.L.; Ooi, S.P.L.; Kuo, H.W.; Jiang, D.D.S.; Chen, K.T.; Lando, J.; et al. Transmission of the severe acute respiratory syndrome on aircraft. N. Engl. J. Med. 2003, 349, 2416–2422. [Google Scholar] [CrossRef]
- Mangili, A.; Gendreau, M.A. Transmission of infectious diseases during commercial air travel. Lancet 2005, 365, 989–996. [Google Scholar] [CrossRef]
- Mohr, O.; Askar, M.; Schink, S.; Eckmanns, T.; Krause, G.; Poggensee, G. Evidence for airborne infectious disease transmission in public ground transport—A literature review. Eurosurveillance 2012, 17, 20255. [Google Scholar] [CrossRef]
- Lapidus, N.; De Lamballerie, X.; Salez, N.; Setbon, M.; Delabre, R.M.; Ferrari, P.; Moyen, N.; Gougeon, M.L.; Vely, F.; Leruez-Ville, M.; et al. Factors associated with post-seasonal serological titer and risk factors for infection with the pandemic A/H1N1 virus in the French general population. PLoS ONE 2013, 8, e60127. [Google Scholar] [CrossRef] [Green Version]
- Lim, W.Y.; Chen, C.H.; Ma, Y.; Chen, M.I.; Lee, V.J.; Cook, A.R.; Tan, L.W.; Tabo Jr, N.F.; Barr, I.; Cui, L.; et al. Risk factors for pandemic (H1N1) 2009 seroconversion among adults, Singapore, 2009. Emerg. Infect. Dis. 2011, 17, 1455. [Google Scholar] [CrossRef]
- Goh, E.H.; Jiang, L.; Hsu, J.P.; Tan, L.W.L.; Lim, W.Y.; Phoon, M.C.; Leo, Y.S.; Barr, I.G.; Chow, V.T.K.; Lee, V.J.; et al. Epidemiology and relative severity of influenza subtypes in Singapore in the post-pandemic period from 2009 to 2010. Clin. Infect. Dis. 2017, 65, 1905–1913. [Google Scholar] [CrossRef] [Green Version]
- Guerrisi, C.; Ecollan, M.; Souty, C.; Rossignol, L.; Turbelin, C.; Debin, M.; Goronflot, T.; Boëlle, P.Y.; Hanslik, T.; Colizza, V.; et al. Factors associated with influenza-like-illness: A crowdsourced cohort study from 2012/13 to 2017/18. BMC Public Health 2019, 19, 879. [Google Scholar] [CrossRef] [Green Version]
- Troko, J.; Myles, P.; Gibson, J.; Hashim, A.; Enstone, J.; Kingdon, S.; Packham, C.; Amin, S.; Hayward, A.; Van-Tam, J.N. Is public transport a risk factor for acute respiratory infection? BMC Infect. Dis. 2011, 11, 16. [Google Scholar] [CrossRef] [Green Version]
- Xu, F.; McCluskey, C.C.; Cressman, R. Spatial spread of an epidemic through public transportation systems with a hub. Math. Biosci. 2013, 246, 164–175. [Google Scholar] [CrossRef]
- Zhang, Y.; Zhang, A.; Wang, J. Exploring the roles of high-speed train, air and coach services in the spread of COVID-19 in China. Transp. Policy 2020, 94, 34–42. [Google Scholar] [CrossRef]
- Fang, H.; Wang, L.; Yang, Y. Human mobility restrictions and the spread of the novel coronavirus (2019-ncov) in China. J. Public Econ. 2020, 191, 104272. [Google Scholar] [CrossRef]
- Zheng, R.; Xu, Y.; Wang, W.; Ning, G.; Bi, Y. Spatial transmission of COVID-19 via public and private transportation in China. Travel Med. Infect. Dis. 2020, 34, 101626. [Google Scholar] [CrossRef]
- Kraemer, M.U.; Yang, C.H.; Gutierrez, B.; Wu, C.H.; Klein, B.; Pigott, D.M.; Du Plessis, L.; Faria, N.R.; Li, R.; Hanage, W.P.; et al. The effect of human mobility and control measures on the COVID-19 epidemic in China. Science 2020, 368, 493–497. [Google Scholar] [CrossRef] [Green Version]
- Bilgin, N.M. Tracking COVID-19 Spread in Italy with Mobility Data. 2020. Available online: https://ssrn.com/abstract=3585921 (accessed on 22 November 2022).
- Kuo, P.F.; Chiu, C.S. Airline transportation and arrival time of international disease spread: A case study of Covid-19. PLoS ONE 2021, 16, e0256398. [Google Scholar] [CrossRef]
- Lan, F.Y.; Wei, C.F.; Hsu, Y.T.; Christiani, D.C.; Kales, S.N. Work-related COVID-19 transmission in six Asian countries/areas: A follow-up study. PLoS ONE 2020, 15, e0233588. [Google Scholar] [CrossRef]
- Harris, J.E. The Subways Seeded the Massive Coronavirus Epidemic in New York City; Technical Report; National Bureau of Economic Research: Cambridge, MA, USA, 2020. [Google Scholar]
- Toyokawa, T.; Shimada, T.; Hayamizu, T.; Sekizuka, T.; Zukeyama, Y.; Yasuda, M.; Nakamura, Y.; Okano, S.; Kudaka, J.; Kakita, T.; et al. Transmission of SARS-CoV-2 during a 2-h domestic flight to Okinawa, Japan, March 2020. Influenza Other Respir. Viruses 2021, 16, 63–71. [Google Scholar] [CrossRef]
- Musselwhite, C.; Avineri, E.; Susilo, Y. Editorial JTH 16—The Coronavirus Disease COVID-19 and implications for transport and health. J. Transp. Health 2020, 16, 100853. [Google Scholar] [CrossRef]
- Johansson, M.A.; Wolford, H.; Paul, P.; Diaz, P.S.; Chen, T.H.; Brown, C.M.; Cetron, M.S.; Alvarado-Ramy, F. Reducing travel-related SARS-CoV-2 transmission with layered mitigation measures: Symptom monitoring, quarantine, and testing. BMC Med. 2021, 19, 94. [Google Scholar] [CrossRef]
- Speaker, S.L.; Doherty, C.M.; Pfoh, E.; Dunn, A.; Hair, B.; Daboul, L.; Shaker, V.; Rothberg, M. Social behaviors associated with a positive COVID-19 test result. Cureus 2021, 13, e13064. [Google Scholar] [CrossRef]
- Ozbilen, B.; Slagle, K.M.; Akar, G. Perceived risk of infection while traveling during the COVID-19 pandemic: Insights from Columbus, OH. Transp. Res. Interdiscip. Perspect. 2021, 10, 100326. [Google Scholar] [CrossRef] [PubMed]
- Mojumder, M.N.; Ahmed, M.A.; Sadri, A.M. Identifying ridesharing risk, response, and challenges in the emergence of novel coronavirus using interactions in uber drivers forum. Front. Built Environ. 2021, 7, 619283. [Google Scholar] [CrossRef]
- Paudel, D.; Melendez, K.A.; Chacreton, D.; Das, T.K.; Reina Ortiz, M.; Kwon, C. Measuring the Impact of the Large-Scale Adoption of Ridesharing on the Spread of Infectious Diseases; Technical Report; Department of Industrial and Management Systems Engineering, University of South Florida: Tampa, FL, USA, 2021. [Google Scholar]
- Wong, H.J.Y.; Deng, Z.; Yu, H.; Huang, J.; Leung, C.; Miao, C. A Testbed for Studying COVID-19 Spreading in Ride-Sharing Systems. In Proceedings of the Twenty-Ninth International Joint Conference on Artificial Intelligence (IJCAI-20) Demonstrations Track, Yokohama, Japan, 11–17 July 2020; pp. 5294–5296. [Google Scholar]
- Kucharski, R.; Cats, O.; Sienkiewicz, J. Modelling virus spreading in ride-pooling networks. Sci. Rep. 2021, 11, 7201. [Google Scholar] [CrossRef] [PubMed]
- Safranek, C.W.; Scheinker, D. A computer modeling method to analyze rideshare data for the surveillance of novel strains of SARS-CoV-2. Ann. Epidemiol. 2022, 76, 136–142. [Google Scholar] [CrossRef]
- Danon, L.; Lacasa, L.; Brooks-Pollock, E. Household bubbles and COVID-19 transmission: Insights from percolation theory. Philos. Trans. R. Soc. B 2021, 376, 20200284. [Google Scholar] [CrossRef]
- Connor, C. Computing for Numeracy: How Safe is Your COVID-19 Social Bubble? Numer. Adv. Educ. Quant. Lit. 2021, 14, 1–14. [Google Scholar] [CrossRef]
- Leng, T.; White, C.; Hilton, J.; Kucharski, A.; Pellis, L.; Stage, H.; Davies, N.G.; Keeling, M.J.; Flasche, S. The effectiveness of social bubbles as part of a Covid-19 lockdown exit strategy, a modelling study. Wellcome Open Res. 2020, 5, 213. [Google Scholar] [CrossRef]
- Lorenc, A.; Kesten, J.M.; Kidger, J.; Langford, R.; Horwood, J. Reducing COVID-19 risk in schools: A qualitative examination of secondary school staff and family views and concerns in the South West of England. BMJ Paediatr. Open 2021, 5, e000987. [Google Scholar] [CrossRef]
- Ismail, S.A.; Saliba, V.; Bernal, J.L.; Ramsay, M.E.; Ladhani, S.N. SARS-CoV-2 infection and transmission in educational settings: A prospective, cross-sectional analysis of infection clusters and outbreaks in England. Lancet Infect. Dis. 2021, 21, 344–353. [Google Scholar] [CrossRef]
- Dix, A. Impact of a small number of large bubbles on Covid-19 transmission within universities. arXiv 2020, arXiv:2008.08147. [Google Scholar]
- Shaw, J.; Day, T.; Malik, N.; Barber, N.; Wickenheiser, H.; Fisman, D.N.; Bogoch, I.; Brownstein, J.I.; Williamson, T. Working in a bubble: How can businesses reopen while limiting the risk of COVID-19 outbreaks? CMAJ 2020, 192, E1362–E1366. [Google Scholar] [CrossRef] [PubMed]
- Bouyahia, Z.; Haddad, H.; Jabeur, N.; Nait-Sidi-Moh, A. Optimization of Chartered Buses Routes Under Uncertainties Using Probabilistic Vehicle Routing Problem Modeling. In Proceedings of the 9th International Conference on Ambient Systems, Networks and Technologies (ANT 2018), Porto, Portugal, 8–11 May 2018. [Google Scholar]
- Currie, C.S.; Fowler, J.W.; Kotiadis, K.; Monks, T.; Onggo, B.S.; Robertson, D.A.; Tako, A.A. How simulation modelling can help reduce the impact of COVID-19. J. Simul. 2020, 14, 83–97. [Google Scholar] [CrossRef] [Green Version]
- Cintra, P.; Citeli, M.; Fontinele, F. Mathematical Models for Describing and Predicting the COVID-19 Pandemic Crisis. arXiv 2020, arXiv:2006.02507. [Google Scholar]
- Hou, C.; Chen, J.; Zhou, Y.; Hua, L.; Yuan, J.; He, S.; Guo, Y.; Zhang, S.; Jia, Q.; Zhao, C.; et al. The effectiveness of quarantine of Wuhan city against the Corona Virus Disease 2019 (COVID-19): A well-mixed SEIR model analysis. J. Med Virol. 2020, 92, 841–848. [Google Scholar] [CrossRef] [PubMed] [Green Version]
- Sen, D.; Sen, D. Use of a modified SIRD model to analyze COVID-19 data. Ind. Eng. Chem. Res. 2021, 60, 4251–4260. [Google Scholar] [CrossRef]
- Danon, L.; Brooks-Pollock, E.; Bailey, M.; Keeling, M. A spatial model of COVID-19 transmission in England and Wales: Early spread, peak timing and the impact of seasonality. Philos. Trans. R. Soc. B 2021, 376, 20200272. [Google Scholar] [CrossRef]
- Tuite, A.R.; Fisman, D.N.; Greer, A.L. Mathematical modelling of COVID-19 transmission and mitigation strategies in the population of Ontario, Canada. CMAJ 2020, 192, E497–E505. [Google Scholar] [CrossRef] [Green Version]
- Giordano, G.; Blanchini, F.; Bruno, R.; Colaneri, P.; Di Filippo, A.; Di Matteo, A.; Colaneri, M. Modelling the COVID-19 epidemic and implementation of population-wide interventions in Italy. Nat. Med. 2020, 26, 855–860. [Google Scholar] [CrossRef]
- Ogden, N.H.; Fazil, A.; Arino, J.; Berthiaume, P.; Fisman, D.N.; Greer, A.L.; Ludwig, A.; Ng, V.; Tuite, A.R.; Turgeon, P.; et al. Modelling scenarios of the epidemic of COVID-19 in Canada. Can. Commun. Dis. Rep. 2020, 46, 198. [Google Scholar] [CrossRef]
- Chang, S.L.; Harding, N.; Zachreson, C.; Cliff, O.M.; Prokopenko, M. Modelling transmission and control of the COVID-19 pandemic in Australia. Nat. Commun. 2020, 11, 5710. [Google Scholar] [CrossRef]
- Haddad, H.; Moulin, B.; Thériault, M. An Integrated Approach for Communicable Disease Geosimulation Based on Epidemiological, Human Mobility and Public Intervention Models. In Analyzing and Modeling Spatial and Temporal Dynamics of Infectious Diseases; John Wiley & Sons, Inc.: Hoboken, NJ, USA, 2015; pp. 403–442. [Google Scholar]
- Perez, L.; Dragicevic, S. An agent-based approach for modeling dynamics of contagious disease spread. Int. J. Health Geogr. 2009, 8, 50. [Google Scholar] [CrossRef] [Green Version]
- Cliff, O.M.; Harding, N.; Piraveenan, M.; Erten, E.Y.; Gambhir, M.; Prokopenko, M. Investigating spatiotemporal dynamics and synchrony of influenza epidemics in Australia: An agent-based modelling approach. Simul. Model. Pract. Theory 2018, 87, 412–431. [Google Scholar] [CrossRef]
- Taillandier, P.; Gaudou, B.; Grignard, A.; Huynh, Q.N.; Marilleau, N.; Caillou, P.; Philippon, D.; Drogoul, A. Building, composing and experimenting complex spatial models with the GAMA platform. Geoinformatica 2019, 23, 299–322. [Google Scholar] [CrossRef] [Green Version]
- Bi, Q.; Wu, Y.; Mei, S.; Ye, C.; Zou, X.; Zhang, Z.; Liu, X.; Wei, L.; Truelove, S.A.; Zhang, T.; et al. Epidemiology and transmission of COVID-19 in 391 cases and 1286 of their close contacts in Shenzhen, China: A retrospective cohort study. Lancet Infect. Dis. 2020, 20, 911–919. [Google Scholar] [CrossRef]
- Chen, T.; Zhang, Y.; Qian, X.; Li, J. A knowledge graph-based method for epidemic contact tracing in public transportation. Transp. Res. Part Emerg. Technol. 2022, 137, 103587. [Google Scholar] [CrossRef]
Figure 1.
An example of weighted label propagation in a small network of four commuters. From the initial weights of the directed edges in (a), the different are calculated (b) and used to propagate the initial labels and create two socially cohesive groups in (c).
Figure 1.
An example of weighted label propagation in a small network of four commuters. From the initial weights of the directed edges in (a), the different are calculated (b) and used to propagate the initial labels and create two socially cohesive groups in (c).

Figure 2.
Example of ridesharing service disruption caused by the infection and isolation of some riders (highlighted in red) with 3 vans and 18 riders (a). The operating scheme uses a rigid bubble decomposition (b) and using flexible reassignment (c).
Figure 2.
Example of ridesharing service disruption caused by the infection and isolation of some riders (highlighted in red) with 3 vans and 18 riders (a). The operating scheme uses a rigid bubble decomposition (b) and using flexible reassignment (c).


Figure 4.
Snapshot of the simulation representing social bonds referring to the social bubbles.

Figure 5.
Epidemiological spread in scenario 1 using trip-based ridesharing () (a), long-term committed ridesharing () (b), and social bubble vanpooling (SBV) (bubble-based ridesharing ()) (c).
Figure 5.
Epidemiological spread in scenario 1 using trip-based ridesharing () (a), long-term committed ridesharing () (b), and social bubble vanpooling (SBV) (bubble-based ridesharing ()) (c).


Figure 6.
Epidemiological spread in scenario 2 using trip-based ridesharing () (a), long-term committed ridesharing () (b), and social bubble vanpooling (bubble-based ridesharing ()) (c).
Figure 6.
Epidemiological spread in scenario 2 using trip-based ridesharing () (a), long-term committed ridesharing () (b), and social bubble vanpooling (bubble-based ridesharing ()) (c).


Table 1.
Comparison between the constraints in socially structured vanpooling (SSV) [23] and social bubble vanpooling (SBV).
Table 1.
Comparison between the constraints in socially structured vanpooling (SSV) [23] and social bubble vanpooling (SBV).
| Symbol | Meaning | SSV | SBV |
|---|---|---|---|
| Rider i’s origin (home) geographic location (longitude, latitude) | ✓ | ✓ | |
| Rider i’s activity destination geographic location (longitude, latitude) | ✓ | ✓ | |
| = [, ] | Start and end dates of the service period of the rider i | ✓ | ✓ |
| Rider i’s earliest time interval to start the trip | ✓ | ✓ | |
| Rider i’s latest time interval to start the trip | ✓ | ✓ | |
| Travel time window of rider i from home to the activity’s destination location | ✓ | ✓ | |
| Travel time window of rider i from the activity location to home | ✓ | ✓ | |
| = ({day}, , ) | Rider i’s slots, where every slot is defined by a set of days and travel time windows | ✓ | ✓ |
| Rider i’s budget range | ✓ | ✓ | |
| Rider i’s age | ✓ | ✓ | |
| Rider i’s health risk level with respect to communicable diseases, value , 1 = very low risk level, 2 = low risk level, 3 = medium risk level, 4 = high risk level, and 5 = very high risk level | ✗ | ✓ | |
| Rider i’s social preferences: , where j is the rider in the same spatial cluster as i, | ✓ | ✗ | |
| Rider i’s safety value , 1 = not important, 5 = extremely important | ✓ | ✗ | |
| Rider i’s comfort value , 1 = not important, 5 = extremely important | ✓ | ✗ | |
| Rider i’s value for driver experience , 1 = not important, 5 = extremely important | ✓ | ✗ | |
| Rider i’s value for van cleanness , 1 = not important, 5 = extremely important | ✓ | ✗ |
Publisher’s Note: MDPI stays neutral with regard to jurisdictional claims in published maps and institutional affiliations. |
© 2022 by the authors. Licensee MDPI, Basel, Switzerland. This article is an open access article distributed under the terms and conditions of the Creative Commons Attribution (CC BY) license (https://creativecommons.org/licenses/by/4.0/).
Share and Cite
MDPI and ACS Style
Haddad, H.; Bouyahia, Z.; Horchani, L. On the Sustainability of Shared Mobility Since COVID-19: From Socially Structured to Social Bubble Vanpooling. Sustainability 2022, 14, 15764. https://doi.org/10.3390/su142315764
AMA Style
Haddad H, Bouyahia Z, Horchani L. On the Sustainability of Shared Mobility Since COVID-19: From Socially Structured to Social Bubble Vanpooling. Sustainability. 2022; 14(23):15764. https://doi.org/10.3390/su142315764
Chicago/Turabian StyleHaddad, Hedi, Zied Bouyahia, and Leila Horchani. 2022. "On the Sustainability of Shared Mobility Since COVID-19: From Socially Structured to Social Bubble Vanpooling" Sustainability 14, no. 23: 15764. https://doi.org/10.3390/su142315764
Note that from the first issue of 2016, this journal uses article numbers instead of page numbers. See further details here.