1. Introduction
Businesses have to follow technological developments in order to be leaders in their own sectors. One of the technological developments is the increase in services provided over the internet. Especially in the food industry, online ordering system applications have increased. In these systems, speed, quality, taste points, etc., which affect customer preferences, are used. These scores are simple indices calculated as averages. By calculating the indices in more detail, many advantages can be obtained in increasing the service quality of the enterprise. The motivation of this study is designing a large-scale service performance index model with latent and measurement variables in order to measure service quality and effect of revenue management on service quality and customer satisfaction. Revenue management is the method and system required to make demand management decisions. What is meant by the expression of demand management decisions: forecasting demand and demand characteristics, and using price and capacity to manage demand [
1]. In short, revenue management is selling the right product to the right customer, at the right price and at the right time [
2]. Revenue management practices are applied in various industries. Gür [
3] examined revenue management practices within the scope of five basic dimensions. The presence of revenue management applications in a business provides different advantages for different customer groups.
Because of the importance of revenue management and customer perception in service sectors, in this study, perceived e-service quality, satisfaction and word of mouth dimensions were evaluated in mobile applications on ordering food. Since there are campaigns in the food industry, the relationship between customer perception and revenue management practices has been evaluated. Revenue management practices in the food ordering industry, such as “discounts when you order a meal for two” or “privileges for contracted credit card or mobile line users” are used.
In this study, in order to determine the effect of revenue management on e-service quality, satisfaction and word of mouth, and for developing the index; structural equation modeling method is used. When the models in the literature for the development of an index are examined, it is seen that there are basically three different approaches. The first and most preferred one is Structural Equation Modeling (SEM). The second method is the estimation of the global and partial index by linear programming. The third approach uses artificial intelligence methods [
4]. SEM is a practical approach that allows multiple regressions quickly, without the need to examine the relationships between dimensions one by one, by performing many regressions at the same time [
5]. General information about the dimensions used in the model is as follows: service quality can be defined as “the ability of the business to meet and exceed customer expectations”. What matters in service quality is the quality perceived by the customer [
6]. E-service can be defined as a process performed as a result of the interaction between the customer and the website supported by the technological infrastructure of the enterprise, without direct influence of the service personnel [
7]. E-service quality is defined as customers’ evaluations or judgments of the quality and excellence of e-service offered by businesses [
8]. Parasurman et al. [
9] developed the four-dimensional E-S-Qual scale and the three-dimensional E-Recs-Qual scale to measure e-service quality. E-S-Qual scale, which includes efficiency, compatibility, performing and security dimensions was used to measure e-service quality and E-RecS-Qual scale, which includes responsiveness, amends and touch dimensions was used to measure e-compensatory service quality. Çatı and Baydaş [
10] define customer satisfaction as “customer judgment on expected and actual service performances”. Customer satisfaction prolongs the time for customers to receive service from the business and increases the benefit they get during this time. [
11] Customer satisfaction is the cornerstone of quality management. The most important criterion in measuring service quality is satisfaction [
12]. Cronin and Taylor [
13] investigated the effect of service quality, satisfaction and repurchase intention on each other. Another dimension used in this study is word of mouth. Lam and Mizerski [
14] defined word of mouth as “the form of communication which the old customer offers non-commercial messages about a brand, good or service to the new customer”. The impact of mobile services in the service sector is investigated in the studies of [
15,
16]. E-service quality received via mobile applications was investigated in the study of Teslim [
17]. E-S-Qual scale was used to measure e-service quality and E-RecS-Qual scale was used to measure e-compensatory service quality. E-S-Qual and E-Recs-Qual is a model for e-service quality measurement developed by Parasuraman et al. [
9]. Zeithaml [
18] was inspired by the Servqual scale and focused only on behaviors during purchase, not taken into account before purchase. Parasuraman et al. [
9] updated the E-S-Qual scale to measure internet service quality. Parasurman et al. [
9] developed a new scale, E-RecS-Qual, in order to evaluate the problems encountered during shopping, after the study of the E-S-Qual scale.
In this study, for calculating service performance index, revenue management and service quality dimensions are used in an integrated manner. Being integrated means that it includes a revenue management and a service quality model as well as satisfaction, word of mouth and their relational analysis. As a result of the study, revenue management significantly and positively affects perceived e-service quality, customer satisfaction and word of mouth with the service they receive from the food ordering application. The contribution of this study to the literature is important at this point. In addition, index values for service performance can be used for continuous improvement studies.
The paper is organized as follows:
Section 2 describes the model and methods used in the study. In
Section 3, results are conducted. Discussions are presented in
Section 4, and in
Section 5, the conclusion is presented.
2. Materials and Methods
In this study, a service performance index model is developed. The effect of revenue management on service quality, satisfaction and word of mouth is analyzed. Related literature is presented in
Table 1.
A model was developed for the service performance index estimation, and in the first stage of the model, a conceptual model was created in which the measurement variables and hidden variables were explained.
Performance evaluation is necessary to improve customer perception. Indexes are one of the best methods for performance evaluation. Dede and Sezer [
39] used an index model to calculate quality.
The solution of the model created in the second stage was carried out using Linear Structural Relations (LISREL). Structural relations and weights of measurement variables (priority coefficients) are determined in the model that reduces estimation errors. In the last stage, the index scores were calculated with the outputs of the structural equation model. The application of the model was carried out in the food order industry. The application model includes revenue management, e-service quality, satisfaction and word of mouth dimensions. In addition, a comparison index study was carried out, taking into account the revenue management campaigns applied in the food order industry.
The aim was to determine the relationship between these dimensions with the structural equation model. Confirmatory factor analysis and structural equation modeling were established to analyze the relationships. With the data obtained from the structural equation model, a service performance index was created to list the customers’ perception about the performance of the food order application. The purpose of the study, models and hypotheses, questionnaire and some statistical analyses are mentioned below.
2.1. Purpose and Scope of the Research
The purpose of this research was to create a service performance index for food order application. In addition, it was to determine whether the revenue management affects the e-service quality, satisfaction, and word of mouth. In addition, service performance indexes of customers were compared according to the frequency of use of revenue management applications. Within the scope of the research, a questionnaire was applied to 384 participants who use e-services related to food ordering. The period of conducting the survey was one week. The procedure of participants’ selection was not restricted. It was broadened by applying to people from all kinds of organizations with all socio-demographic profiles of all ages so that the results were homogeneous.
In this context, participants’ perceptions of benefiting from revenue management practices, perceived e-service quality, general satisfaction and word of mouth for food order application were investigated. Some of the reasons for investigating these dimensions are that revenue management practices have become very popular in recent years and their relationship with customer perception has not been studied much.
2.2. Research Model and Hypotheses
The study of Uslu [
31] and the study of Choi at al [
32] examined the customer perceptions of selling products sold at different times to different customers at different prices. Revenue management applications involve selling at different prices at different times depending on the amount of demand or selling similar products in economy or business class by dividing the market into segments. In such applications, customers have different perceptions. Companies also implement revenue management practices by organizing campaigns and promotions. Contracted credit card and mobile line privileges can also affect customer perception. In this study, it was aimed to investigate the effects of revenue management practices on service quality, customer satisfaction and word of mouth customer perceptions. Therefore, the following three hypotheses have been established.
The research model is shown in
Figure 1 and the research hypotheses of the study are formed as follows:
H1. Revenue management significantly and positively affects their perceived e-service quality regarding the service they receive from the food ordering application.
H2. Revenue management significantly and positively affects their overall satisfaction with the service they receive from the food ordering application.
H3. Revenue management significantly and positively affects their word of mouth with the service they receive from the food ordering application.
Figure 1.
Research Model.
Figure 1.
Research Model.
The seven dimensions belonging to E-S-Qual and E-Recs-Qual scales developed by Parasuraman [
9] were evaluated under the title of e-service quality in
Figure 1.
In the first part of the questionnaire used in the study, there are questions about demographic data. In the second part, there are scales to measure the participants’ use of revenue management applications, their satisfaction, perceived e-service quality and word of mouth, which are expected to give answers in the range of “1 = Strongly Disagree”, “5 = Strongly Agree”. The questionnaire is shown in
Appendix A. In this study, the scales used in previous studies were adapted and used.
The revenue management application scale is derived from the study of Uslu [
31] for airlines and the work of Choi et al. [
32] on movie theaters. The revenue management scale was transformed into a new scale by supporting them with questions suitable for food ordering. Its validity and reliability were determined by performing explanatory factor analysis. The validity of the scale adapted for the food industry is tested and given in the
Section 3. The satisfaction scale in the study of Taylor and Baker [
40], the word of mouth scale in the study of Gremler and Gwinner [
41] and the service quality scale in the work of Parasuraman et al. [
9] were used.
While performing SEM, first of all, a measurement model is created. The measurement model, also known as confirmatory factor analysis, evaluates the suitability of the questionnaire questions to the dimensions. After the necessary improvements are made by looking at the goodness of fit values in the model, the relations between the dimensions can be examined by applying the structural model [
42,
43].
SEM solution can be achieved with maximum likelihood and partial least squares algorithms. Which method will be chosen for the solution is decided as follows:
- ➢
If the data set is continuous and normally distributed, the maximum likelihood method must be chosen.
- ➢
If the data set is ordinal or categorical, weighted partial least squares method must be chosen.
LISREL 8.80 statistical package program was used to evaluate the structural equation modeling in the study [
44].
3. Results
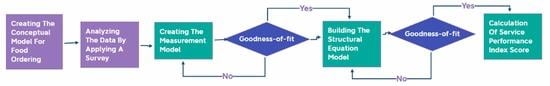
In this study, the relationship between revenue management, perceived e-service quality, general customer satisfaction and word of mouth was examined with structural equation modeling. In addition, a service performance index was created from the results obtained from the structural equation modeling. The results of the index and statistical analysis techniques used in the research are given in this section. The steps of calculating the food ordering performance index were created by adapting the index calculation steps in Bekmezci [
45]’s study. The steps: applying a survey, then building the measurement model and structural equation model, and finally creating the index according to the results of the model.
After the hypotheses regarding the conceptual model of the research were established, the testing phase started. Structural Equation Model (SEM) was used for this purpose. After the first version of the model was run, necessary improvements were made, and the model was finalized.
3.1. Descriptive Statistics
As shown in
Appendix B, a total of 45% of the participants are between the ages of 18–22. The monthly income of 37% of the participants is in the range of 5001–10,000 TL. Additionally, 45% of the participants place an order once in 3 months.
3.2. Normality, Reliability and Validity Test Results
George and Mallery [
46] stated that “A kurtosis value of ±1.0 would be considered excellent for most psychometric purposes, but a value between ±2.0 is in many cases also acceptable, depending on the particular application”. As shown in
Table 2 and
Appendix B, the skewness and kurtosis values of the variables related to physical evidence, social benefit, satisfaction and ambiance are between +2 and −2, and the data are normally distributed.
Murphy and Davidshofer [
47] stated that Cronbach’s Alpha coefficient between 0.80 and 1.00 is “highly reliable”, a range of 0.60–0.79 is “reliable”, a range of 0.40–0.59 is “low reliability” and less than 0.40 indicates that it is “not reliable”. The results of the reliability analysis performed are shown in
Table 3. Cronbach’s Alpha coefficient was 0.979 for all expressions. Thus, it is “highly reliable” with 0.979.
Pre-validated scales developed by Parasuraman et al. [
9] for e-service quality, developed by Taylor and Baker [
40] for satisfaction, and developed by Gremler and Gwinner [
41] for word of mouth were used. For revenue management, a factor consisting of five statements was developed. Explanatory factor analysis was performed to determine the validity. Values are presented in
Table 4. All statements were gathered under a single factor. It has been verified by Principal Component Analysis, one of the Extraction Methods, that five expressions form one dimension.
3.3. Confirmatory Factor Analysis (CFA)
“Confirmatory factor analysis” (CFA), also called measurement model, is as shown in
Figure 2 and
Appendix C. CFA is used to test the relationships between observed variables and the structure or structures that are supposed to be measured through these observed variables [
48].
CFA is used to determine to what extent latent variables are explained by observable variables [
44].
As a result of CFA, the model’s goodness of fit values are analyzed. In order to establish SEM, the criteria listed below must be within a certain value range [
49].
Goodness of fit values:
Chi-Square/df ≤ 5
RMSEA (“RootMeanSquareError of Approximation”) ≤ 0.08
CFI (“Comparative Fit Index”) = 0.95–1.00
NFI (“Normed Fit Index”), NNFI (“Non-Normed Fit Index”) = 0.90–1.00
SRMR (“Standardized Root Mean Square Residual”) ≤ 0.10
p-value < 0.05
The goodness of fit values are as follows:
“Chi-Square/df” = 2634.50/989 = 2.66
“RootMeanSquareError of Approximation” (RMSEA) = 0.066
“Comparative Fit Index” (CFI) = 0.99
“Normed Fit Index” (NFI) = 0.98
“Non-Normed Fit Index” (NNFI) = 0.98
“Standardized Root Mean Square Residual” (SRMR) = 0.050
“p value” = 0.00000
As can be seen, since all the values are within the range, the structural equation model can be applied.
3.4. Structural Equation Model (SEM)
After the measurement model was created, the structural model was created and the relationship of the dimensions with each other was determined as shown in
Figure 3 and
Appendix C. Since the
p-value was 0.00, it was understood that there was a significant relationship between the dimensions. In CFA, it is determined whether each dimension creates a factor or not. In SEM, the effects of latent variables on each other are investigated. More correlation relationships are established and more regression equations are formed. Therefore, the RMSEA of the SEM models are larger than the RMSEA of the CFA model.
When looking at the effects of variables on each other in Structural Equation Modeling, it can be said that there is a “small” effect if the path coefficients are in the range of 0.00–0.10, “medium” if the path coefficients are in the range of 0.10–0.50, and “high” if the path coefficients are greater than 0.50 [
50].
When the findings are examined, it is seen in
Table 5 that revenue management has a ‘significant, positive and high-level effect’ on e-service quality, satisfaction and word of mouth (β > 0.50;
p < 0.001). According to these results, the H1, H2 and H3 hypotheses were accepted.
3.5. Calculating the Service Performance Index
The service performance index was calculated with the coefficient values obtained from the structural equation model.
The loading factors from each measurement variable to the latent variable show the ability of that measurement variable to represent that dimension. For this reason, loading factors are used as weights. The weight and average of each measurement variable are multiplied and divided by the sum of the weights, and the index is calculated as a weighted average.
The formula used to calculate the index and the charts for these calculations are shown below.
(Service Performance Index Formula).
The service performance index values prepared for the e-service quality, satisfaction, word of mouth and revenue management dimensions are as shown in
Table 6.
According to the Turkish Customer Satisfaction Index (TMME) model of the Turkish Quality Association, the score values calculated for each dimension are unacceptable in the 0–54 value range, very weak in the 55–59 value range, low in the 60–64 value range, moderate in the 65–74 value range, good in the 75–79 value range, very good in the 80–84 value range, and extraordinary customer satisfaction in the 85–100 value range [
51,
52].
According to the service performance index results obtained in the study, as seen in
Table 6 and
Figure 4, the e-service quality was calculated as very good with 80.645, the satisfaction was calculated as very good with 82.938, the word of mouth was calculated as very good with 81.510 and the revenue management was calculated as good with 77.415.
While ordering food by mobile application, customers benefit from some discounts and campaigns. It has been observed that there is a difference between the customers who always use these applications and those who never use them. Comparison results are as follows.
In
Table 7, five different revenue management applications are mentioned and an index comparison of the customers who benefit the least and the customers who benefit the most is given.
When the relationships between revenue management and customer satisfaction were examined, the following findings were obtained. As can be clearly seen from the aforementioned findings, activities or areas of attraction in revenue management have significant effects on customer satisfaction. Regarding these effects, five different revenue management applications are mentioned and an index value comparison (out of five) of the customers who benefit the least and the customers who benefit the most is given.
RM 1: First revenue management application: “I prefer the menus that include drinks, potatoes and desserts with the meal”.
RM 1-1: The index value for the satisfaction dimension of the people who use it at the 1 level, that is, who answered “never” in the survey, is 68,337.
RM 1-5: The index value for the satisfaction dimension of the people who use it at the 5 level, that is, who answered “always” in the survey, is 92,806.
This means that the people who always benefit from revenue management campaigns are more satisfied than the people who never buy drinks and sides with the meal.
RM 2: The second revenue management application: “I benefit from double menu campaigns”.
RM 2-1: The index value for the satisfaction dimension of the people who use it at the 1 level, that is, who answered “never” in the survey, is 67,007.
RM 2-5: The index value for the satisfaction dimension of the people who use it at the 5 level, that is, who answered “always” in the survey, is 92,154.
This means that the people who always benefit from revenue management campaigns are more satisfied than the people who never buy two meals with a friend.
RM 3: Third revenue management application: “As I shop, I collect points and buy a new menu with these points.”
RM 3-1: The index value for the satisfaction dimension of the people who use it at the 1 level, that is, who answered “never” in the survey, is 67,471.
RM 3-5: The index value for the satisfaction dimension of the people who use it at the 5 level, that is, who answered “always” in the survey, is 93,557.
This means that the people who always benefit from revenue management campaigns are more satisfied than the people who never buy meals for free.
RM 4: Fourth revenue management application: “I get a discounted menu with mobile line privileges”.
RM 4-1: The index value for the satisfaction dimension of the people who use it at the 1 level, that is, who answered “never” in the survey, is 70,874.
RM 4-5: The index value for the satisfaction dimension of the people who use it at the 5 level, that is, who answered “always” in the survey, is 94,410.
This means that the people who always benefit from revenue management campaigns are more satisfied than the people who never get discounts with mobile line privileges.
RM 5: The fifth revenue management application: “I collect points by paying with a contracted credit card”.
RM 5-1: The index value for the satisfaction dimension of the people who use it at the 1 level, that is, who answered “never” in the survey, is 72,274.
RM 5-5: The index value for the satisfaction dimension of the people who use it at the 5 level, that is, who answered “always” in the survey, is 93,443.
This means that the people who always benefit from revenue management campaigns are more satisfied than the people who never buy free meals via contracted credit cards.
As it can be understood from this, the indexes of customers who benefit from revenue management applications a lot are higher than those of customers who benefit less from revenue management applications. This is true for each application and the dimensions of e-service quality, satisfaction and word of mouth.
4. Discussion
The present study clearly explored that revenue management practices have an impact on customer perception. This is consistent with the previous study findings [
31,
32]. Based on the results of the analysis, it is seen that customer perception factors, which are e-service quality, satisfaction and word of mouth, are affected by the frequency of using revenue management campaigns. While Uslu [
31] found a relationship between revenue management and customer perception in the airline industry, and Choi et al. [
32] did so in the cinema industry, this study found a relationship between revenue management and customer perception in the food industry. From this result, it is understood that as customers buy discounted foods, they are more satisfied and recommend more.
The present research clearly highlights key drivers of food revenue management. Ordering sides with the meal, choosing double or triple meals with friends to get a discount, collecting points to use in other orders and taking advantage of mobile line or contracted credit card privileges are the factors mentioned.
In this study, in accordance with H1, e-service quality in the food sector was examined with similar methods with Teslim [
17]. E-S-Qual scale which includes efficiency, compatibility, performing and security dimensions was used to measure e-service quality, and E-RecS-Qual scale which includes responsiveness, amends and touch dimensions, was used to measure e-compensatory service quality [
17]. According to the results of the analysis, when the relationship between revenue management and e-service quality was examined, hypothesis one was confirmed.
In this study, in accordance with H2, similarly to Uslu [
31], a satisfaction measurement was made that measured meeting the expectations and being happy about the service received by the customers. Then, the relationship between revenue management and satisfaction was investigated and hypothesis two was confirmed.
In this study, in accordance with H3 Word of mouth measurement was made by adapting from the study of Gremler and Gwinner [
41], which was carried out regarding the customers’ recommending and encouraging the people around them to receive the same service. According to the results of examining the relationship between revenue management and word of mouth, hypothesis three was accepted.
In addition, the comparison was made according to the frequency of customers benefiting from revenue management campaigns and discounts. The findings reveal that people who always benefit from revenue management campaigns are more satisfied than the people who never get discounts via revenue management applications.
There are some points related to the customer perception dimensions used in this research. In this study, e-service quality, satisfaction and word of mouth perceptions were examined. In future studies, the research might be replicated with different customer perception dimensions and the effect of revenue management on these dimensions could be examined. Suggested dimensions include: loyalty, willingness to pay, trust, fairness and perceived price value.
In terms of building an index, future research could investigate other approaches mentioned in the introduction, which are that linear programming and artificial intelligence methods could be used instead of structural equation modeling. Fuzzy logic is also another approach for developing indexes.
Further research on separate applications is needed to better understand different customer groups. More research into customers who shop frequently and occasionally could increase our knowledge of the differences examined by making separate evaluations. These differences can be used to create different campaigns. For example, discounts may be available for customers who shop frequently. Discount rates can be determined according to the loyalty level of the customers. In addition, marketing operations of the company can be shaped according to different types of customers.
5. Conclusions
Creating a service performance index was the main purpose of the study. In order to create a service performance index, conceptual models were designed and analyzed with structural equation modeling. The service performance index was created with the standardized regression coefficients obtained from the structural equation modeling of the effects of the dimensions in the model to each other.
According to the service performance index results obtained in the study, the e-service quality was calculated as very good with 80.645, the satisfaction was calculated as very good with 82.938, the word of mouth was calculated as very good with 81.510 and the revenue management was calculated as good with 77.415. According to these results, the revenue management dimension’s value was good, while the customer perceptions’ values were very good. For this reason, revenue management applications need to be developed first.
According to the service performance index calculations, the index value of people who always benefit from revenue management applications and campaigns is higher than those who never use them. This conclusion was reached by additional analysis for customers in different categories who follow different revenue management strategies. When the index values of the customers who do not use and who always use it are compared, it is seen that the service performance index values of the customers who use these applications are higher.
While creating the index, it has been attempted to find answers to the questions of the effect of revenue management on e-service quality, satisfaction and word of mouth in the structural equation modeling. As a result of the research carried out in this study, the relationship between revenue management and e-service quality, satisfaction, word of mouth was found to be statistically significant.
It has been concluded that the revenue management applications and campaigns have a significant, positive and high-level effect on e-service quality, satisfaction and word of mouth.
Author Contributions
Conceptualization, K.İ.Ö. and S.E.; Data curation, K.İ.Ö. and S.T.; Formal analysis, K.İ.Ö. and S.E.; Investigation, K.İ.Ö. and A.A.; Methodology, K.İ.Ö. and A.A.; Project administration, A.A. and S.E.; Resources, K.İ.Ö. and S.T.; Software, K.İ.Ö. and A.A.; Supervision, A.A. and S.E.; Validation, K.İ.Ö. and S.E.; Visualization, K.İ.Ö. and S.E.; Writing—original draft, K.İ.Ö.; Writing—review and editing, K.İ.Ö. and S.E. All authors have read and agreed to the published version of the manuscript.
Funding
This research received no external funding.
Institutional Review Board Statement
The study was conducted according to the guidelines of the Declaration of Helsinki, and approved by the Ethics Committee of YOZGAT BOZOK UNIVERSITY (protocol code 35/17 and date of approval 28 July 2022).
Informed Consent Statement
Informed consent was obtained from all subjects involved in the study.
Data Availability Statement
Not applicable.
Conflicts of Interest
The authors declare no conflict of interest. The funders had no role in the design of the study; in the collection, analyses, or interpretation of data; in the writing of the manuscript, or in the decision to publish the results.
Appendix A. Survey Questions
Appendix A.1. Expressions of the Dimensions of the E-S-Qual Scale
Efficiency
Food ordering site/application allows me to find what I need easily.
It is easy to go anywhere within the food ordering site/application.
The food ordering site/application allows me to complete my transactions quickly.
The information on the food ordering site/app is well organized.
Loading pages on the food ordering site/application is fast.
The food ordering site/application is easy to use.
The food ordering site/app allows me to get it quickly.
The food ordering site/application is well organized.
Compatibility
- 9
Food ordering site/app can always be used for business.
- 10
The food ordering site/application opens and works immediately.
- 11
Food ordering site/application does not crash.
- 12
After entering order information, the pages do not freeze.
Performing
- 13
The food ordering site/application delivers orders when promised.
- 14
This site makes products available for delivery within the appropriate time frame.
- 15
The food ordering site/application delivers the product I ordered quickly.
- 16
Sends the ordered products.
- 17
The products claimed by the food ordering site/application are in stock.
- 18
The offers of the food ordering site/application are correct.
- 19
Makes firm promises about the delivery of the products.
Security
- 20
The food ordering site/application protects information about my web-shopping behavior.
- 21
The food ordering site/application does not share my personal information with other sites.
- 22
Food ordering site/application protects information about my credit card.
Appendix A.2. Expressions of the Dimensions of the E-RecS-Qual Scale
Responsiveness
It gives me suitable options to return the products.
The food ordering site/application manages the process for returned products well.
The food ordering site/application offers a meaningful guarantee.
It tells me what to do when my transaction is not processed.
Solves problems promptly.
Amends
- 6
The food ordering site/application compensates for the problems it creates.
- 7
If the product I ordered does not arrive on time, it compensates for its error.
- 8
He takes the products that I want to return from my home or workplace.
Touch
- 9
The food ordering site/application gives me a phone number to reach the company.
- 10
The food ordering site/application has online customer representatives.
- 11
If there is a problem, it offers the opportunity to talk to a live person.
Appendix A.3. Expressions of the Satisfaction Scale
Satisfaction
I think I did the right thing by using the food ordering site/app.
I believe using the food ordering site/app is a satisfying experience.
I am very happy with my decision to use the food ordering site/application.
My choice to use the food ordering site/application was logical.
The food ordering site/app did a good job meeting my expectations.
Appendix A.4. Expressions of the Word of Mouth Scale
Word of Mouth
I recommend this food ordering site/app when someone asks me for advice.
If there is a conversation about the food ordering site/application, I recommend this food ordering site/application.
I recommend this food ordering site/app to my friends, relatives and family.
I encourage my friends, relatives and family to use this food ordering site/app.
Appendix A.5. Expressions of the Revenue Management Scale
Revenue Management
I prefer the menus that include drinks, potatoes and desserts with the meal.
I benefit from double menu campaigns.
As I shop, I collect points and buy a new menu with these points.
I get a discounted menu with mobile line privileges.
I collect points by paying with a contracted credit card.
Appendix B. Descriptive Statistics
Table A1.
Descriptive Statistics of Dimensions.
Table A1.
Descriptive Statistics of Dimensions.
| Descriptives |
|---|
| | Statistic | Std. Error |
|---|
| E | Mean | 4.1995 | 0.03893 |
| Skewness | −1.152 | 0.125 |
| Kurtosis | 1.919 | 0.248 |
| C | Mean | 3.9740 | 0.04469 |
| Skewness | −0.723 | 0.125 |
| Kurtosis | 0.272 | 0.248 |
| P | Mean | 4.1150 | 0.04249 |
| Skewness | −0.884 | 0.125 |
| Kurtosis | 0.375 | 0.248 |
| SE | Mean | 3.8628 | 0.05404 |
| Skewness | −0.699 | 0.125 |
| Kurtosis | −0.204 | 0.248 |
| R | Mean | 3.9479 | 0.04972 |
| Skewness | −0.752 | 0.125 |
| Kurtosis | 0.020 | 0.248 |
| A | Mean | 3.8342 | 0.05428 |
| Skewness | −0.635 | 0.125 |
| Kurtosis | −0.296 | 0.248 |
| T | Mean | 4.0139 | 0.04820 |
| Skewness | −0.812 | 0.125 |
| Kurtosis | 0.272 | 0.248 |
| SA | Mean | 4.1469 | 0.04377 |
| Skewness | −0.981 | 0.125 |
| Kurtosis | 0.874 | 0.248 |
| W | Mean | 4.0755 | 0.04699 |
| Skewness | −0.997 | 0.125 |
| Kurtosis | 0.918 | 0.248 |
| RM | Mean | 3.8698 | 0.05275 |
| Skewness | −0.661 | 0.125 |
| Kurtosis | −0.391 | 0.248 |
Table A2.
Cross Table of Gender.
Table A2.
Cross Table of Gender.
| Income and Gender Crosstabulation |
|---|
| | Gender | Total |
|---|
| Man | Woman |
|---|
| Income | 10,001–20,000 | Count | 48 | 44 | 92 |
| % of Total | 12.5% | 11.5% | 24.0% |
| 20,001–30,000 | Count | 14 | 11 | 25 |
| % of Total | 3.6% | 2.9% | 6.5% |
| 30,001 and more | Count | 0 | 6 | 6 |
| % of Total | 0.0% | 1.6% | 1.6% |
| 5000 and less | Count | 30 | 87 | 117 |
| % of Total | 7.8% | 22.7% | 30.5% |
| 5001–10,000 | Count | 57 | 87 | 144 |
| % of Total | 14.8% | 22.7% | 37.5% |
| Total | Count | 149 | 235 | 384 |
| % of Total | 38.8% | 61.2% | 100.0% |
Table A3.
Cross Table of Age.
Table A3.
Cross Table of Age.
| Income and Age Crosstabulation |
|---|
| | Age | Total |
|---|
| 18 | 18–22 | 23–30 | 31–40 | 41–60 | 61 and up |
|---|
| Income | 10,001–20,000 | Count | 2 | 14 | 22 | 32 | 20 | 2 | 92 |
| % of Total | 0.5% | 3.6% | 5.7% | 8.3% | 5.2% | 0.5% | 24.0% |
| 20,001–30,000 | Count | 0 | 9 | 2 | 6 | 8 | 0 | 25 |
| % of Total | 0.0% | 2.3% | 0.5% | 1.6% | 2.1% | 0.0% | 6.5% |
| 30,001 and more | Count | 0 | 1 | 0 | 2 | 3 | 0 | 6 |
| % of Total | 0.0% | 0.3% | 0.0% | 0.5% | 0.8% | 0.0% | 1.6% |
| 5000 and less | Count | 9 | 80 | 21 | 5 | 2 | 0 | 117 |
| % of Total | 2.3% | 20.8% | 5.5% | 1.3% | 0.5% | 0.0% | 30.5% |
| 5001–10,000 | Count | 9 | 70 | 37 | 15 | 12 | 1 | 144 |
| % of Total | 2.3% | 18.2% | 9.6% | 3.9% | 3.1% | 0.3% | 37.5% |
| Total | Count | 20 | 174 | 82 | 60 | 45 | 3 | 384 |
| % of Total | 5.2% | 45.3% | 21.4% | 15.6% | 11.7% | 0.8% | 100.0% |
Table A4.
Cross Table of Order Frequency.
Table A4.
Cross Table of Order Frequency.
| Income and Orderfrequency Crosstabulation |
|---|
| | Orderfrequency | Total |
|---|
| Once in 3 Months | 1–2 in a Month | 1–2 in a Week |
|---|
| Income | 10,001–20,000 | Count | 27 | 49 | 16 | 92 |
| % of Total | 7.0% | 12.8% | 4.2% | 24.0% |
| 20,000–30,000 | Count | 5 | 11 | 9 | 25 |
| % of Total | 1.3% | 2.9% | 2.3% | 6.5% |
| 30,001 and more | Count | 0 | 3 | 3 | 6 |
| % of Total | 0.0% | 0.8% | 0.8% | 1.6% |
| 5000 and less | Count | 77 | 35 | 5 | 117 |
| % of Total | 20.1% | 9.1% | 1.3% | 30.5% |
| 5001–10,000 | Count | 65 | 48 | 31 | 144 |
| % of Total | 16.9% | 12.5% | 8.1% | 37.5% |
| Total | Count | 174 | 146 | 64 | 384 |
| % of Total | 45.3% | 38.0% | 16.7% | 100.0% |
Appendix C. Lisrel Outputs
Figure A1.
Confirmatory Factor Analysis.
Figure A1.
Confirmatory Factor Analysis.
Figure A2.
Structurel Equation of Revenue Management.
Figure A2.
Structurel Equation of Revenue Management.
References
- Talluri, T.K.; Van Ryzin, G.J. The Theory and Practice of Revenue Management; Kluwer Academic Publishers: New York, NY, USA, 2005. [Google Scholar]
- Erdem, M. Sivil Havacılık Sektöründe Gelir Yönetimi: Türk Hava Yolları Anonim Ortaklığı Uygulaması. Master’s Thesis, İstanbul University, İstanbul, Turkey, 2010. [Google Scholar]
- Gür, Ç. Gelir Yönetimi Uygulamaları: Ankaradaki Otel İşletmelerinde Bir Araştırma. Master’s Thesis, Düzce University, Düzce, Turkey, 2014. [Google Scholar]
- Aktepe, A. Müşteri Memnuniyet Endeks Hesaplaması İçin Model Önerisi: Bir Yerel Yönetim Uygulaması. Ph.D. Thesis, Gazi University, Ankara, Turkey, 2015. [Google Scholar]
- Yener, H. Personel Performansına Etki Eden Faktörlerin Yapısal Eşitlik Modeli (Yem) ile İncelenmesi ve Bir Uygulama. Ph.D. Thesis, Gazi University, Ankara, Turkey, 2007. [Google Scholar]
- Torlak, Ö. Hizmet Kalitesini İyileştirmede Belediye Hizmet Kullanıcılarının Şikayet Sürecinin Düzenlenmesi. In Proceedings of the Kamu Yönetiminde Kalite 1, Ulusal Kongresi, Ankara, Turkey, 26–27 May 1998; Todaie-Türkiye Ve Orta Doğu Amme İdaresi Enstitüsü: Ankara, Turkey, 1998. [Google Scholar]
- Özer, N. E-hizmet Kalitesinin E-müşteri Bağlılığına Etkisi: Anadolu Üniversitesi öğretim Elemanları üzerine bir Araştırma. Master’s Thesis, Anadolu University, Eskişehir, Turkey, 2011. [Google Scholar]
- Santos, J. E-service quality: A model of virtual service quality dimensions. J. Serv. Theory Pract. 2003, 1, 233–246. [Google Scholar] [CrossRef]
- Parasuraman, A.; Zeithaml, V.A.; Malhotra, A. ES-QUAL a multiple-item scale for assessing electronic service quality. J. Serv. Res. 2005, 7, 213–233. [Google Scholar] [CrossRef] [Green Version]
- Çatı, K.; Baydaş, A.A. Hizmet Pazarlaması ve Hizmet Kalitesi; Asil Yayın Dağıtım: İstanbul, Turkey, 2008. [Google Scholar]
- Gerson, R.F. Müşteri Tatmininde Süreklilik (Çev: T. Savaşer); Rota Yayınları: İstanbul, Turkey, 1997. [Google Scholar]
- Sözen, S. Kamuda Hizmet Kalitesi: Kolluk Hizmetleri Örneği. Polis Bilim. Derg. 2005, 7, 1–15. [Google Scholar]
- Cronin, J.J.; Taylor, S.A. Measuring service quality: A reexamination and extension. J. Mark. 1992, 56, 55–68. [Google Scholar] [CrossRef]
- Lam, D.; Mizerski, D. The Effects of Locus of Control on Word-of Mouth Communication. J. Mark. Commun. 2005, 11, 215–228. [Google Scholar] [CrossRef]
- Daniali, S.M.; Sergey, E.B.; Marzieh, Z.; Kalinina, O.V.; Kulibanova, V.V.; Teor, T.R.; Ilyina, İ.A.; Alekseeva, N.S.; Lisin, A.; Moiseev, N.; et al. Exploring UTAUT Model in Mobile 4.5G Service: Moderating Social–Economic Effects of Gender and Awareness. Soc. Sci. 2022, 11, 187. [Google Scholar] [CrossRef]
- Tan, F.B.; Chou, J.P.C. The Relationship between Mobile Service Quality, Perceived Technology Compatibility, and Users’ Perceived Playfulness in the Context of Mobile Information and Entertainment Services. Int. J. Hum. Comput. Interact. 2008, 24, 649–671. [Google Scholar] [CrossRef]
- Teslim, S. E-Hizmet Kalitesinin Ölçümü: Bir Yemek Siparişi Sitesinde Uygulanması. Master’s Thesis, Kırıkkale University, Kırıkkale, Turkey, 2019. [Google Scholar]
- Zeithaml, V.A. Service excellence in electronic channels. Manag. Serv. Qual. Int. J. 2002, 12, 362–375. [Google Scholar] [CrossRef]
- Ibrahim, A.N.H.; Borhan, M.N.; Osman, M.H.; Khairuddin, F.H.; Zakaria, N.M. An Empirical Study of Passengers’ Perceived Satisfaction with Monorail Service Quality: Case of Kuala Lumpur, Malaysia. Sustainability 2022, 14, 6496. [Google Scholar] [CrossRef]
- Szymanski, D.M.; Hise, R.T. E-Satisfaction: An Initial Examination. J. Retail. 2000, 76, 309–322. [Google Scholar] [CrossRef]
- Khan, M.A.; Alhumoudi, H.A. Performance of E-Banking and the Mediating Effect of Customer Satisfaction: A Structural Equation Model Approach. Sustainability 2022, 14, 7224. [Google Scholar] [CrossRef]
- Kitsios, F.; Stefanakakis, S.; Kamariotou, M.; Dermentzoglou, L. E-service Evaluation: User satisfaction measurement and implications in health sector. Comput. Stand. Interfaces 2019, 63, 16–26. [Google Scholar] [CrossRef]
- Siskos, Y.; Grigoroudis, E.; Zopounidis, C.; Saurais, O. Measuring customer satisfaction using a collective preference disaggregation model. J. Glob. Optim. 1998, 12, 175–195. [Google Scholar] [CrossRef]
- Awasthi, A.K.; Shrivastava, A. Services Cape Elements in Leisure Service Settings: A Study of Movie Theatres and Restaurants. Int. J. Hosp. Tour. Syst. 2014, 7, 69–73. [Google Scholar]
- Kang, J.-W.; Namkung, Y. Measuring the Service Quality of Fresh Food Delivery Platforms: Development and Validation of the “Food PlatQual” Scale. Sustainability 2022, 14, 5940. [Google Scholar] [CrossRef]
- Koay, K.Y.; Henry, C.; Yi, C. A model of online food delivery service quality, customer satisfaction, and customer loyalty: A combination of PLS-SEM and NCA approaches. Br. Food J. 2022; ahead-of-print. [Google Scholar] [CrossRef]
- Zheng, Q.; Zeng, H.; Xiu, X.; Chen, Q. Pull the Emotional Trigger or the Rational String? A Multi-Group Analysis of Organic Food Consumption. Foods 2022, 11, 1375. [Google Scholar] [CrossRef]
- Marklinder, I.; Eskhult, G.; Ahlgren, R.; Blücher, A.; Börjesson, S.-M.E.; Moazzami, M.; Schelin, J.; Danielsson-Tham, M.-L. A Structural Equation Model Demonstrating the Relationship between Food Safety Background, Knowledge, Attitudes and Behaviour among Swedish Students. Foods 2022, 11, 1595. [Google Scholar] [CrossRef]
- Mielmann, A.; Le Roux, N.; Taljaard, I. The Impact of Mood, Familiarity, Acceptability, Sensory Characteristics and Attitude on Consumers’ Emotional Responses to Chocolates. Foods 2022, 11, 1621. [Google Scholar] [CrossRef]
- Unurlu, Ç. Otel İşletmelerinin Odalar Bölümünde Gelir Yönetimi: İstanbuldaki Beş Yıldızlı Otellerde Bir Uygulama. Master’s Thesis, Trakya University, Edirne, Turkey, 2010. [Google Scholar]
- Uslu, T. Havayolu Taşımacılığında Gelir Yönetimi Uygulamaları Hakkında Müşteri Algısı Üzerine Bir Araştırma. Ph.D. Thesis, Gebze Teknik Üniversitesi, Gebze, Turkey, 2018. [Google Scholar]
- Choi, C.; Jeong, M.; Mattila, A. Revenue Management in the context of movie theaters: Is it fair? J. Reveue Pricing Manag. 2015, 14, 72–83. [Google Scholar] [CrossRef]
- Mohsin, A. How empowerment influences revenue management and service quality: The case of a New Zealand hotel. Home Int. J. Revenue Manag. 2008, 2, 92–106. [Google Scholar] [CrossRef]
- Matsuoka, K. Effects of revenue management on perceived value, customer satisfaction, and customer loyalty. J. Bus. Res. 2002, 148, 131–148. [Google Scholar] [CrossRef]
- Güderoğlu, M. Konaklama İşletmelerinde Gelir Yönetimi Uygulamalarının Müşteri Algısı (Konya İlinde Bir Araştırma). Master’s Thesis, Necmettin Erbakan University, Konya, Turkey, 2017. [Google Scholar]
- Lastner, M.M.; Fennell, P.; Folse, J.A.G.; Rice, D.H.; Porter, M.D. I guess that is fair: How the efforts of other customers influence buyer price fairness perceptions. Psychol. Mark. 2019, 36, 700–715. [Google Scholar] [CrossRef]
- Abrate, G.; Viglia, G.; García, J.S.; Forgas-Coll, S. Price Competition within and between Airlines and High-Speed Trains: The Case of the Milan—Rome Route. Tour. Econ. 2016, 22, 311–323. [Google Scholar] [CrossRef] [Green Version]
- Viglia, G.; De Canio, F.; Stoppani, A.; Invernizzi, A.C.; Cerutti, S. Adopting revenue management strategies and data sharing to cope with crises. J. Bus. Res. 2021, 137, 336–344. [Google Scholar] [CrossRef]
- Dede, Ö.T.; Sezer, M. The application of Canadian water quality index (CWQI) model for the assessment of water quality of Aksu creek. J. Fac. Eng. Archit. Gazi Univ. 2017, 32, 909–917. [Google Scholar] [CrossRef] [Green Version]
- Taylor, S.A.; Baker, T.L. An assessment of the relationship between service quality and customer satisfaction in the formation of consumers’ purchase intentions. J. Retail. 1994, 70, 163–178. [Google Scholar] [CrossRef]
- Gremler, D.D.; Gwinner, K.P. Customer-employee rapport in service relationships. J. Serv. Res. 2000, 3, 82–104. [Google Scholar] [CrossRef] [Green Version]
- Eroğlu, E. Toplam Kalite Yönetimi Uygulamalarının Yapısal Eşitlik Modeli ile Analizi. Ph.D. Thesis, İstanbul University, İstanbul, Turkey, 2003. [Google Scholar]
- Anderson, J.C.; Gerbing, D.W. Structural Equation Modeling in Practice: A Review and Recommended Two-Step Approach. Psychol. Bull. 1988, 103, 411–423. [Google Scholar] [CrossRef]
- Jöreskog, K.G.; Sörbom, D. LISREL 8 User’s Reference Guide, 2nd ed.; Scientific Software International: Chicago, IL, USA, 1996. [Google Scholar]
- Bekmezci, E.N. Sağlık Sektöründe Yapısal Eşitlik Modellemesi İle Hasta Memnuniyet Ölçüm Modeli Tasarımı Ve Bir Uygulama. Master’s Thesis, Kırıkkale University, Kırıkkale, Turkey, 2021. [Google Scholar]
- George, D.; Mallery, P. SPSS for Windows Step by Step: A Simple Guide and Reference, 6th ed.; Pearson: Boston, MA, USA, 2005. [Google Scholar]
- Murphy, K.R.; Davidshofer, C.O. Psychological Testing: Principles and Applications, 6th ed.; Pearson: Boston, NJ, USA, 2004. [Google Scholar]
- Wetson, R.; Gore, P.A., Jr. A brief guide to structural equation model. Couns. Psychol. 2006, 34, 719–751. [Google Scholar] [CrossRef]
- Meydan, C.H.; Şeşen, H. Yapısal Eşitlik Modellemesi AMOS Uygulamaları, 1st ed.; Detay Yayıncılık: Ankara, Turkey, 2011. [Google Scholar]
- Kurtoğlu, R.; Ozboluk, T. Üniversite Öğrencilerinin Emoji Kullanımları ve Emoji Kullanan Markalara Karşı Tutumları Üzerine Bir Araştırma. Bus. Econ. Res. J. 2018, 9, 697–713. [Google Scholar] [CrossRef]
- TMME. Turkish Customer Satisfaction Index. Available online: https://www.kalder.org/tmme (accessed on 5 May 2022).
- Çelikel, B. Müşteri Memnuniyet Endeksinin Yapısal Eşitlik Modellemesi ile Tahmini ve Banyo Mobilyası Sektöründe Bir Uygulama. Master’s Thesis, Kırıkkale University, Kırıkkale, Turkey, 2018. [Google Scholar]
| Publisher’s Note: MDPI stays neutral with regard to jurisdictional claims in published maps and institutional affiliations. |
© 2022 by the authors. Licensee MDPI, Basel, Switzerland. This article is an open access article distributed under the terms and conditions of the Creative Commons Attribution (CC BY) license (https://creativecommons.org/licenses/by/4.0/).


