Article

Long-Term Effects of COVID-19, and Its Impact on Business, Employees, and CO2 Emissions, a Study Using Arc-GIS Survey 123 and Arc-GIS Mapping

1
Ecotoxicology Department, ERA Environmental Consulting, Inc., Saint-Laurent, QC H4S 2A1, Canada
2
Sustainability Department, Paul Smiths College, Paul Smiths, NY 12970, USA
*
Authors to whom correspondence should be addressed.
Sustainability 2022, 14(20), 13689; https://doi.org/10.3390/su142013689
Submission received: 30 August 2022 / Revised: 9 October 2022 / Accepted: 18 October 2022 / Published: 21 October 2022
(This article belongs to the Collection Impact of COVID-19 on the Environment, Energy and Economics)

Abstract

:
Further investigation is needed to study the impacts of the COVID-19 lockdown and subsequent lifestyle changes. The global pandemic caused a high degree of uncertainty, leading to extreme anxiety. These feelings were also compounded by the sudden changes in lifestyle at home, within families, work, studies, and recreation. With the end of the lockdown approaching in most regions of the world, many of these lifestyle changes, including work-from-home, might remain for a good percentage of the workforce. The primary objective of this research is to explore employees’ work-from-home model and its impact on commute time, job satisfaction, and carbon footprint. Quantitative variables include data from North America and Global country-specific carbon dioxide (CO2) emissions, and quantitative data, including employee satisfaction, commute time, miles traveled, and more, was collected using ArcGIS Survey123. This research focus on CO2 emissions data, comparing 2019 data (March to May) as a baseline to 2020, 2021, and 2022 (March to May) as the target year. The hypothesis is that the work-from-home order had a significant impact on short-term CO2 reductions and could have potential long-term impacts due to many corporations’ adoption of the “work-from-home” model. The data collected regarding CO2 were analyzed using ArcGIS Pro and Geostatistical Interpolation. This study also explored the potential impacts of this adoption on employee job satisfaction and CO2 emissions reductions based on surveyed employees. Another objective of this research is to look at the relationship between the COVID-19 lockdown with the work-from-home model and the reduction in air emissions, namely CO2.

1. Introduction

According to the World Health Organization [1], COVID-19 has caused 5,027,183 deaths globally (2021). This tragedy has taught us many things about humanity and its capacity for adaptation, resilience, and ingenuity. We are survivors, and we can learn from this tragedy and bring about changes that might benefit humans and the environment in the future. One major change is the “work-from-home” [2] model which could impact CO2 emissions long term.
During the COVID-19 pandemic, the decreases in air pollution were widely documented in many scientific articles [3]. There are valuable lessons that can be learned by examining the global lifestyle changes and how these changes can affect our world. The outcomes of these changes can help achieve some of the sustainable climate change goals set forth by the Paris Climate Change Accord and the 2021 United Nations Climate Change Conference COP26 [4].
A common theme reflected in the reviewed literature was the reduction in air pollution at the beginning of the pandemic (March 2020). Several countries worldwide imposed mobility restrictions as a strategy to mitigate the spread of COVID-19 [5]. This resulted in a significant decrease in daily commutes to work, air travel, and factories, with adjustments made to production or complete shutdowns [6,7].
There were many positive environmental impacts during the COVID-19 lockdown, such as the reduction in air pollutant emissions (PM2.5, PM10, PM, NO2, O3, CO, and SO2) globally [8]. This was reported by the US EPA AIRS, National Air Pollution Surveillance (NAPS) Program, Global Environmental Multiscale–Modelling Air-quality and Chemistry (GEM-MACH), and the Global Atmosphere Watch Station Information System (G.A.W.S.I.S.) [8]. The data were mainly collected during the lockdown period (22nd March to 2nd May 2020) and were compared to previous years (2010 to 2019) during the same period.
Based on the literature, a more significant decrease in global CO2 was observed during the lockdown than during previous economic downturns and World War II [3]. There was an abrupt 8.8% decrease in global CO2 emissions (−1551 Mt CO2) during the lockdown compared to the same period in 2019 [3].
Another study was conducted using cell phone mobility data to track the public’s commutes (miles vehicles traveled from February to April 2020) in the United States. By mid-April 2020, there was a 40% decrease in vehicle travel in the United States, mainly due to the lockdown measures [9]. There was also a 6% reduction in utility use during this period [9]. It was estimated that CO2 emissions from mobile sources showed a reduction of 35.4 metric tons attributed to social distancing rules. It was noted that social distancing rules were not applied evenly across the United States [3]. Global emissions aggregated the different timings of effects in different regions (7-day running mean) [3].
Literature research was conducted to acquire information regarding global and country specific CO2 emissions [3]. The Carbon Monitor website [10] was found to offer global CO2 data for several countries (China, USA., India, EU, UK, and Japan,) and various sectors (domestic aviation, ground transport, industry, international aviation, power, and residential).
The 2019 and 2020 ground transportation data were used in the data analysis. The carbon monitor data were compiled from joint research with researchers from the California Institute of Technology, Harvard University, Laboratoire des Sciences du Climat et de l’Environnement, near Paris in France, University of California (Irvine), Tsinghua University, and the Institute of Geographic Sciences and Natural Resources Research of the Chinese Academy of Sciences [10].
ArcGIS is a geographic information system that integrates multi-operations on geographic data, including display, edit, query, index, statistics, report, spatial analysis, and advanced charting for creating maps. ArcGIS provides surface interpolation to create or predict surfaces from sample data. ArcGIS was used to assess air-quality changes in heavily polluted cities in China during the COVID-19 pandemic [11].
Another aspect of the pandemic has been the impact on social and mental health. Isolation at home has led to lifestyle changes that presumably had both positive and negative effects. Changes occurred in the work–family interaction during the pandemic [12]. It was interesting to see the survey results on people’s opinions on the prospect of working from home or return-to-work options. The U.S. government mandated in May 2020 through the Occupational Safety and Health Administration (O.S.H.A.) (United States Department of Labor; 5th November 2021) that companies with 100 or more employees be fully vaccinated, or testing would be required for the non-vaccinated. The lockdown has made the “work-from-home” [1] the new normal, but are employers seeing a reduction in productivity from their employees? Many companies are working on strategies to help their employees transition back to work. One of the big questions regarding the social aspect is who can continue to work from home [13].
The premise of this research was to tie in data regarding changes in lifestyle due to the pandemic and how this is linked to reductions in CO2 emissions. What have individuals and companies learned from these major changes? Are there lessons to be learned that can be used on the road to more sustainable climate change goals for the future? We asked many questions in our survey to see how people really feel about the changes to their lifestyle that occurred because of COVID-19.
The research objective is to demonstrate the relationship between the COVID-19 lockdown and its impact on employees and the environment, specifically CO2 emission reductions (Figure 1).
According to Alifuddin (2021) [14], the COVID-19 stay-at-home regulations forced employers and employees to experiment with a work-from-home model for employees. These regulations brought “greater change in the world of work and boosted the experimentation of work-from-home arrangements worldwide” [14]. In the future, this experiment’s results will shape the concept of a ‘new norm’ related to conventional working arrangements [14].
The first objective of the research is focused on the CO2 emissions data collected during the lockdown, comparing 2019 data, as a baseline, to 2020 as the target year. The second objective is to analyze the answers to the survey, and to collect quantitative data related to the “work-from-home” aspect of the lockdown. The key questions to be answered relate to how the pandemic has affected people’s lives. Besides the significant reduction in CO2 emissions observed worldwide [3], there have been other possible changes in the way people have adapted to the compulsory and voluntary measures provided by various governments [15].
Sector-specific effects of the COVID-19 pandemic on CO2 emissions globally, shown in Figure 2a as the 7-day running mean of daily differences between 1st January and 30th June of 2019 and 2020, and Figure 2b the cumulative decline by sectors in each of China, India, U.S., and EU27 and UK in the first half year of 2020 [3].
Another main goal of this research is to explore possible changes in employees’ work lifestyles that could continue, and their long-term impact on the CO2 and overall greenhouse gas (GHG) emissions worldwide. The initial quantitative work was conducted using global CO2 emissions data analysis from mobile sources (Carbonmonitor.org, 2021). Further quantitative work could be eventually evaluated at the country level, for example, looking at individual states in the United States [16].
This research focused on two aspects: First, the CO2 emissions data collected during the lockdown, comparing January to May 2019 data, as a baseline, to 2020, 2021, and 2022 as target years. Second, to analyze the answers to the survey to collect quantitative data related to the “Work from home” aspect of the lockdown. The key question is how the pandemic has affected people’s lives. Besides a significant reduction in CO2 emissions observed worldwide [3], there have been other possible changes in the way people have adapted to the compulsory and voluntary measures provided by various governments [15]. ArcGIS was selected to present both the CO2 transportation emissions data and the work-from-home survey questions. The main goal of this research is to explore other possible changes in people’s way of life that continued beyond mandatory lockdown periods and their long-term impact on CO2 and overall GHG emissions worldwide using the ArcGIS 123 results and the mathematical model developed to analyze the results and the ArcGIS statistical interpolation of data.
This research aims to measure employees’ work at home options, commute and their impact on job satisfaction, carbon footprint, and air pollution reduction. The measured variables were quantitative (built on data from global/Country specific CO2 emission recorded) and quantitative, based on a survey conducted by thousands of employees. The effects of the COVID-19 lockdown and subsequent lifestyle changes need further investigation. Population lifestyle changes, mainly the “work from home” model, have had a significant impact. At the height of the pandemic, people experienced a cloud of uncertainty before going to bed each night. This cloud was probably due to the anxiety created by the pandemic and the mixed messages from governments worldwide. With the release of the vaccines and life slowly returning to semi-normal, this cloud effect has started to diminish; however, even with the end of the lockdown in most regions of the world, many of these lifestyle changes have remained, including work-from-home for a good percentage of the workforce.
The assumption is that, once lockdown ends, emissions will recover to previous levels, if not higher. Important take-aways are the longer-term effects of the pandemic on transportation emissions. First, there may be a legacy decrease in activity if more individuals continue to work from home. Second, there may be modal changes due to urban commuters wanting to avoid mass transit.

2. Literature Review

2.1. Environmental Impact

Several of the articles presented in the literature discuss the positive impacts of the COVID-19 lockdown, such as reducing air pollutants (PM2.5, PM10, PM, NO2, O3, CO, and SO2) globally [8]. Many results were examined using various databases, such as the US EPA AIRS, National Air Pollution Surveillance (NAPS) Program, Global Environmental Multiscale–Modelling Air-quality and Chemistry (GEM-MACH), and the Global Atmosphere Watch Station Information System (GAWSIS) [8]. The data in this study were mainly collected during the lockdown period (22nd March to 2nd May 2020) and compared to previous years (2010 to 2019) during the same period [8]. Another article had an exciting GIS component, since it provides a data analysis of air quality in four of Canada’s largest cities (Toronto, Montreal, Vancouver, and Calgary) due to the COVID-19 lockdown measures [8]. Data for the lockdown period from 22nd March to 2nd May 2020 were compared to the same period in previous years (2010 to 2019). Maps were created by Environment and Climate Change Canada for locations of National Air Pollution Surveillance (NAPS) Program monitoring stations at these four cities for nitrous oxide (NO2), ozone (O3), and particulate matter <2.5 microns in diameter (PM2.5). The Global Environmental Multiscale–Modelling Air-quality and Chemistry (GEM-MACH) model was used to quantify the impact of isolation (lockdown) on air emissions [8]. GIS was used to create a geospatial map of the Census Metropolitan Areas for the four major Canadian cities considered in this study. Additional maps were created, representing mean hourly concentrations of NO2, O3, and PM2.5 during the lockdown period predicted by GEM-MACH for the business-as-usual (BAU) and COVID-19 scenarios [8].
Several countries worldwide imposed mobility restrictions to mitigate the spread of COVID-19 [5]. This common theme was reflected in the literature data, and was mainly formed around the global changes caused by “work-from-home” requirements. This resulted in a significant decrease in daily commutes to work, air travel, and factory adjustments to production or complete shutdown [6].
During the lockdown, a decrease in global CO2 was observed, which was even more significant than during previous economic downturns and World War II. There was an abrupt 8.8% decrease in global CO2 emissions (−1551 metric tons CO2) during the lockdown compared to the same period in 2019 [3]. Another study was conducted using cell phone mobility data to track the public’s commutes (miles vehicles traveled from February to April 2020) in the United States and, by mid-April 2020, there was a 40% decrease in vehicle travel in the United States, mainly due to the lockdown measures [9]. There was also a 6% utility use reduction during this same period [9]. It was estimated that CO2 emissions from mobile sources showed a reduction of 35.4 metric tons, attributed to social distancing rules. It was noted that social distancing rules were not applied evenly across the United States [3].
The COVID-19 pandemic is impacting human activities, and energy use and carbon dioxide (CO2) emissions. The study presented by Liu (2020) [3] highlights the relationship between CO2 emission reductions and lockdown severity across the globe. Near-real-time activity data present daily estimates of country-level CO2 emissions for different sectors. The international research initiative Carbon Monitor [10] was used to present daily, sector-specific, country-level CO2 emissions data from 1st January 2019 to 30th June 2020 [3]. The depth of these data acts as a comparison point against yearly major events and holidays. The first half of 2020 shows an 8.8% decrease in global CO2 emissions compared with 2019 values. Human activities impacted by the pandemic affected global energy consumption and the associated CO2 emissions, but the specific details are unavailable [3]. The Carbon Monitor CO2 data were represented on a country-by-country basis, which could be geographically presented on a world map using Arc-GIS [10].
Through its monitoring stations, the US EPA observed widespread reductions in NO2 and CO during the first phase of lockdown (15th March–25th April 2020) [6]. A reduction of 49% for NO2 and 37% CO was observed during the lockdown versus historical data of the same period from 2017 to 2019. There were also reductions in PM2.5 and PM10 in the Northeast and California/Nevada metropolises. The changes in lifestyle, such as “work from home,” contributed to emission reductions through lower transportation and utility demands [6].
Rume (2020) [17] found that the environmental effects of COVID-19 were significant improvements in air quality, a reduction in greenhouse gases (GHGs), and reduction in less water and noise pollution. In places such as New York City, a 50% reduction in air pollution was observed during lockdown measures. A reduction in water pollution directly resulted from factories cutting production or completely shutting down. In Germany, air travel was slashed by 90%, car traffic by more than 50%, and trains by less than 25%, contributing to the global reduction in noise pollution [17].
The Science of The Total Environment also discusses the reduction in CO2 observed in 23 European Union (EU) countries during the first six months of 2020 [7]. The major sectors that contributed to a 93.7% reduction in CO2 emissions were Manufacturing, Wholesale, Retail Trade, Transport, Accommodation, and Food Service. The EU countries with the most significant changes in CO2 with the comparison of CO2 emissions based on the same period of the previous year (2019) were Spain, Italy, and France, accounting for a net drop of 106,600 thousand tons of emissions [7]. It was assumed that the imposed restrictions (lockdown) were the main driver of this dramatic emissions reduction. Based on this research, it was estimated that 195,600 thousand tons of CO2 emissions were avoided during the first six months of 2020 [7]. The removal of CO2 emissions is a valuable lesson on how changes in how business is conducted can achieve significant results. These data can be used in conjunction with other parameters to help develop future policies regarding air quality and climate change.

2.2. Social Impacts

Alifuddin’s (2021) [14] research provides an opportunity to reflect on the quality of the available jobs and work experience in the future. The authors present their findings through ten different themes on the work-from-home model [14]. These are discussed to “better highlight the direction of this trend” [14]. These themes, ranging from “wellbeing,” “employment relations,” and “work productivity,” provide valuable context to deepen the understanding of the employer and employee’s work-from-home experience [14].
Since the onset of COVID-19, the work-from-home model ushered in changes to the concept of a workplace [18]. This inevitably changed the frequency of commutes or whether employees commute at all [18]. This brings us to explore the links between “commute time and work-family conflict”, as well as adding knowledge to other areas such as: “work domain (work schedule control), family domain (childcare hours), and the overall life domain (life/job satisfaction)” [18]. In the new era of work, life satisfaction and flexibility are becoming more commonplace demands with younger generations [18]. As commutes will be a focal topic in this paper, deepening the understanding and implications of commuting on employees will help to provide a fuller understanding of what factors influence workers choosing one place of work over another and what this means for employers, employees, and the changing face of ‘work’ moving forward [18].
The prevalence of work-from-home positions in our paper may appear more abundant than they are. This is because the “ability to telework is correlated with income”. In low-income countries, “only one in every 26 jobs can be done at home” as compared with “one in three” in high-income countries [13]. As this model continues to exist in our society, understanding the criteria behind what qualifies as a ‘work-from-home’ position is an essential foundation to communicating its influence on employee job satisfaction [13].
Another application of Arc-GIS was the utilization of the Arc-GIS survey 123 in the collection of questionnaire data, as was found in the research: does tourism cause stress [19] Upon further investigation it was realized that Arc-GIS survey 123 could be applied the data collection on the social aspect of the work from home model.

3. Methodology

3.1. CO2 Data Collection

The Environmental Sustainability aspect of the data collection strategy:
The initial process of retrieving global CO2 air emissions data was conducting a literature search of peer-reviewed sources. Once the selected articles were reviewed, possible CO2 data sources were investigated by checking the references cited in these scientific articles. The carbon monitoring database [10] from one of the leading air pollution articles cited was selected to download the global CO2 data that were then used in the ArcGIS mapping program.
The quantitative analysis was built on an ArcGIS component looking at the impact of COVID-19 on CO2. The ArcGIS component helped to provide a geostatistical analysis of the data and was used to provide an overall perspective of what had been learned during the global pandemic [8]. This method was selected as it can provide valuable insight into pathways to global sustainability.
The collection and processing with performed in several steps:
Step 1.
The 2019 and 2020 daily ground transportation data (China, USA, India, EU, UK, and Japan) were exported from the carbonmonitor.org website as a CSV file and then converted to an Excel spreadsheet (.xls).
Step 2.
The daily data for several countries (2190 records per year) from 2019 to 2020 (total of 4380 records) were combined in Microsoft Excel as monthly data, but this second attempt to import the data into ArcGIS Online failed because the dataset was still too large.
Step 3.
The carbon monitoring CO2 data were then manipulated and formatted to monthly consolidate data into a manageable size (24 records) and format in Microsoft Excel for 2019 and 2020. This data were then successfully imported into ArcGIS Online on a world map as two separate layers, 2019 and 2020. Attempts were made to further analyze these data on the world map, but it was discovered that ArcGIS Online has limited data analysis and management functionality compared to ArcGIS pro.
Step 4.
The next step was to import these data into the ArcGIS Pro desktop program. Several attempts to import the consolidated data from Excel to ArcGIS pro failed to recognize the country names and dates. Through trial and error, it was discovered that the projects or Layers created and saved in ArcGIS online are visible and importable as layers in ArcGIS Pro. This method was utilized to bring the data compiled in excel into ArcGIS Pro. The ArcGIS Pro program now had the 2019 and 2020 CO2 data by specific country, which were then used for further analysis.

3.2. Social Sustainability Data Collection

The sampling method utilized to collect data on the social aspects was a quantitative analysis built on ArcGIS Survey123. Best practices were applied to ensure that the survey questions were clear and relatively simple to complete to help achieve a higher completion rate. Special attention was given to reducing the number of questions so as not to overwhelm the participants.
Survey purpose: to acquire information about how they feel working remotely. A compilation of these data will help employers know more about the employee’s point of view on the work-from-home model. The benefits and shortcomings of the working-from-the-home model need to be explored to help us help employers make the right decisions for their employees.
Questions prepared for the survey were built considering the aspects listed below.
  • Positive impacts of COVID-19 on the workforce:
    1.1.1.
    Reduction in air emission from lack of commute to work.
    1.1.2.
    Time savings.
    1.1.3.
    Mental health improvement.
    1.1.4.
    Job Experience improvement.
  • Negative Impacts of COVID-19 on the workforce:
    1.2.1.
    Costs associated with updating systems for how employees access information from home.
    1.2.2.
    Higher turnover for employees because employees can find work anywhere in the world
    1.2.3.
    Work–life balance struggles
The first series of questions related to the topic was proposed to internal and external stakeholders using the positive and negative impacts listed above to prepare a comprehensive survey. The next few weeks of review and communication with both sets of stakeholders and many revisions resulted in 21 comprehensive questions before publishing the survey to the stakeholders.
The data collection timeline was from 14th February to 16th March 2022.
The ArcGIS Survey 123 was used to rollout different phases as part of the sampling strategy. The procedure for gathering data was as follows (Figure 3):
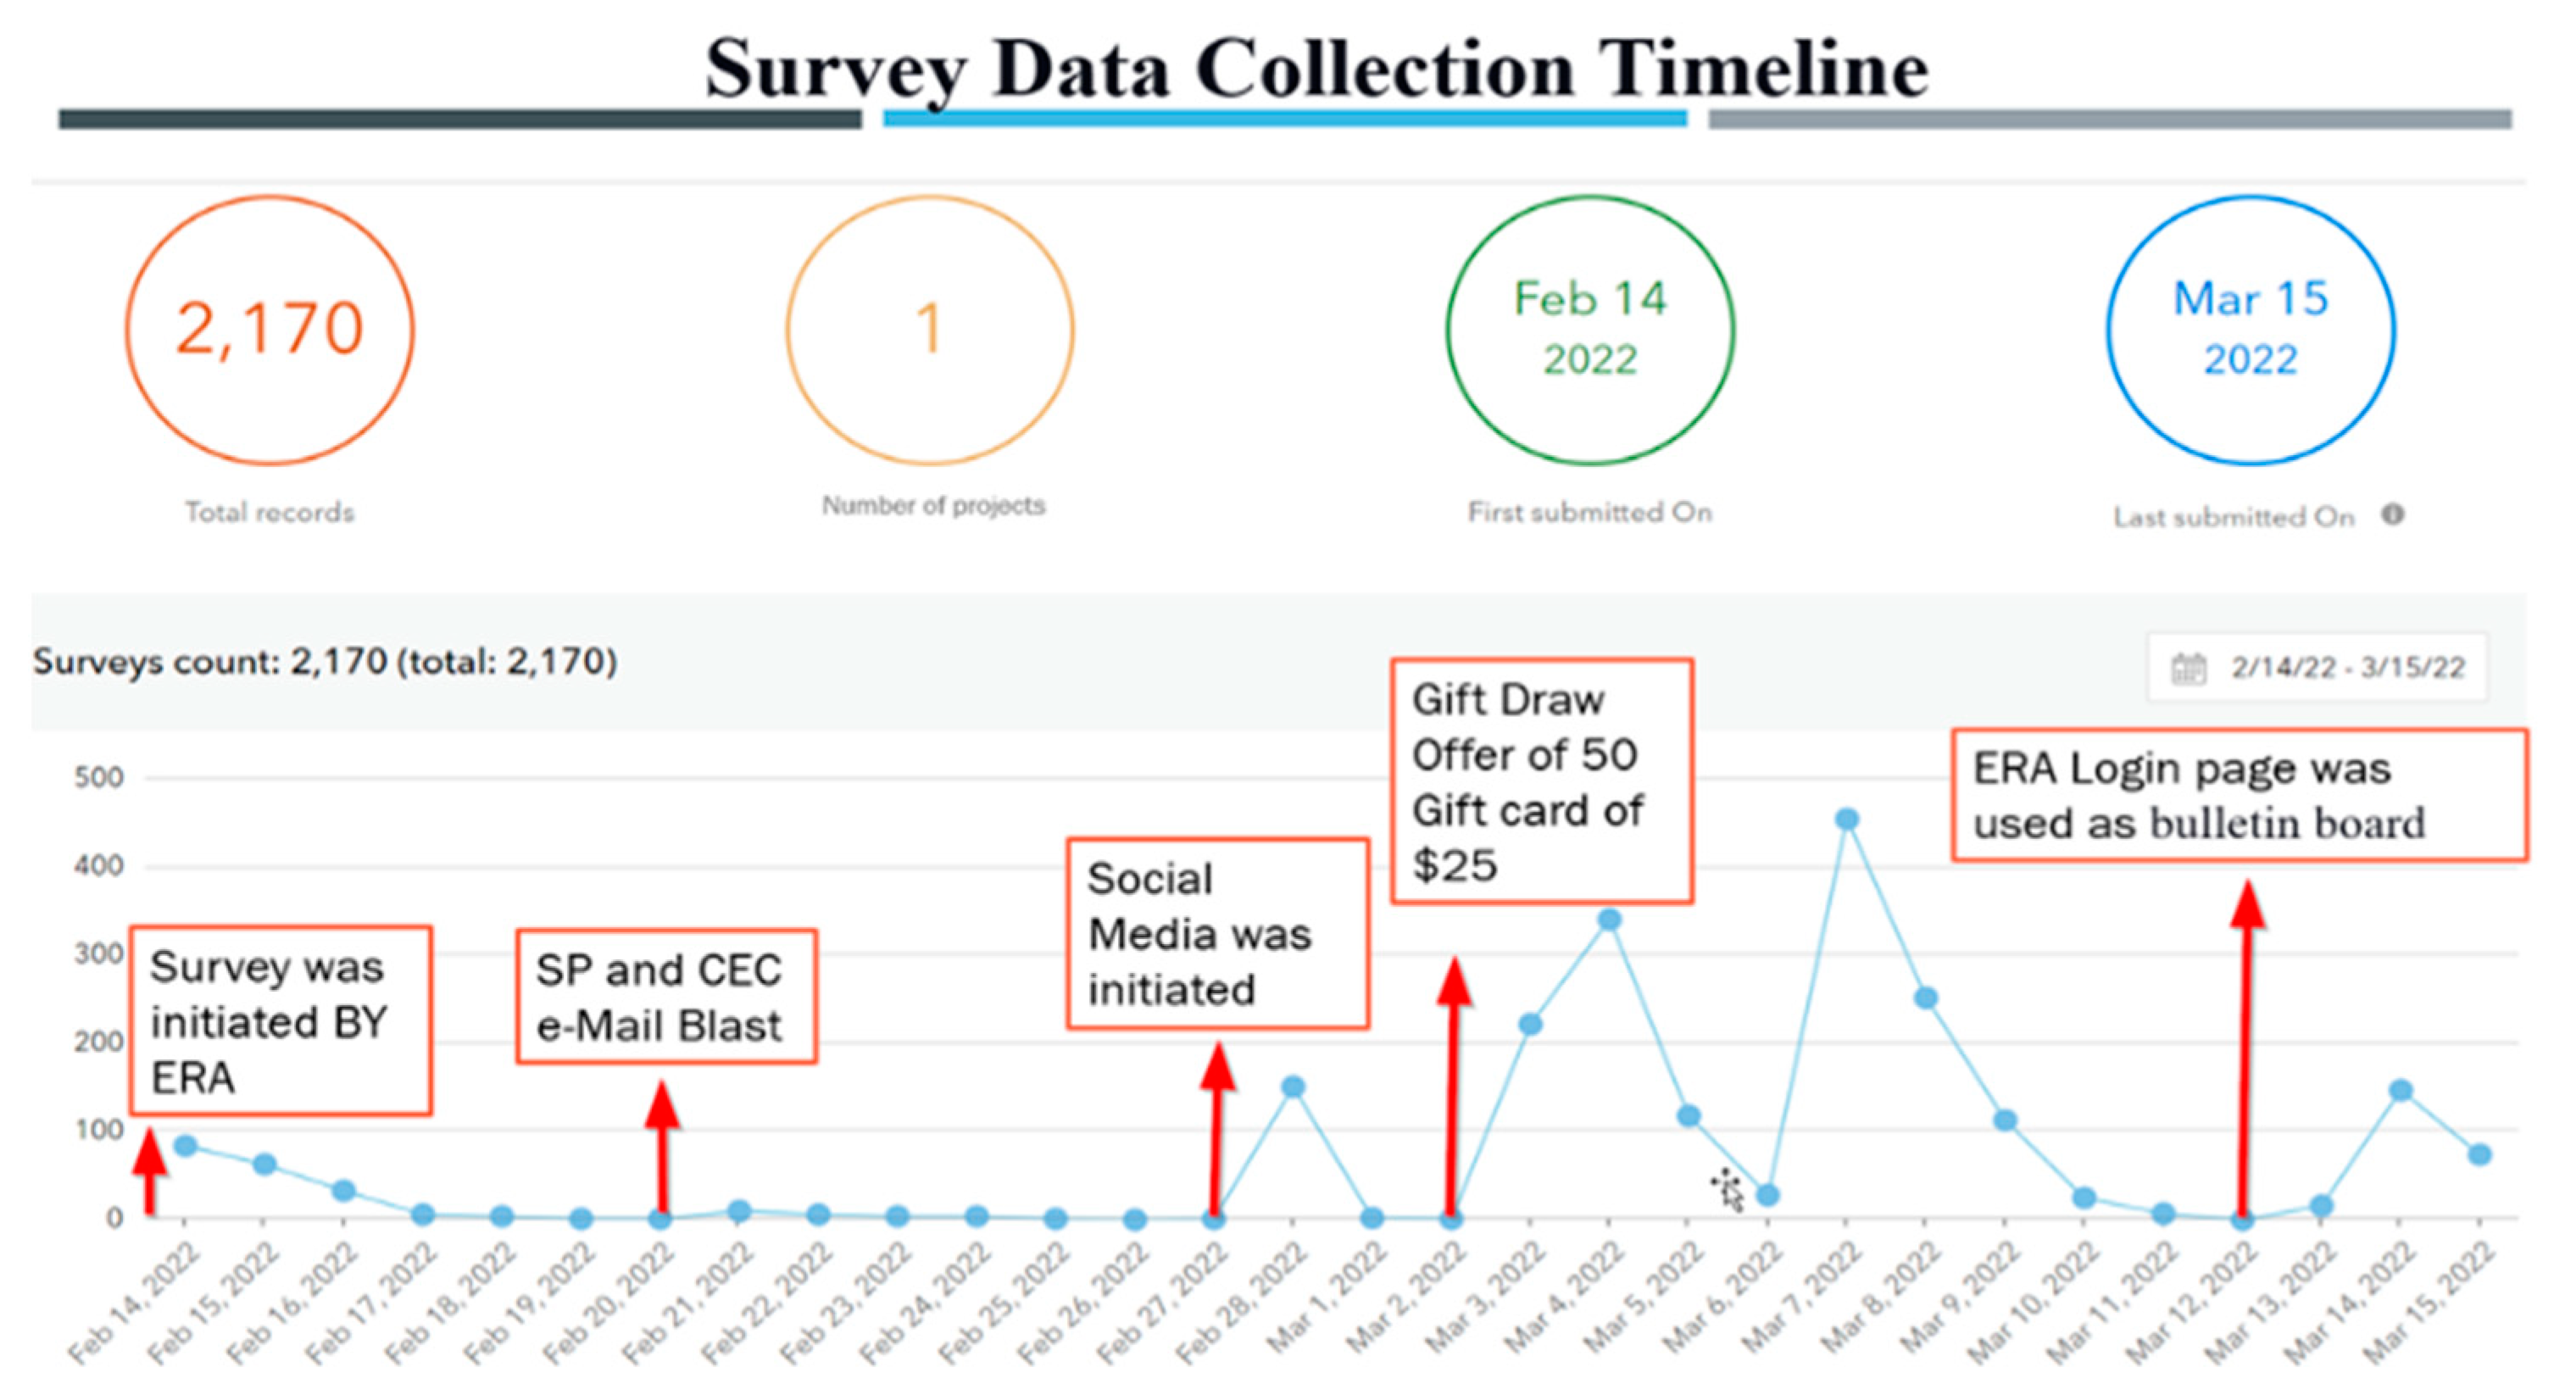
  • The first group was ERA Environmental Consulting, Inc. employees and client base; an e-mail blast was sent to over 21,000 qualified potential participants. At the start of the survey launch, 14th February 2022, only about 80 respondents completed the survey.
  • The second group was member companies of the Suppliers Partnership for Environment (SP) and the Commission for Environmental Cooperation (CEC). The e-mail blast results within two weeks of the survey start date were less than 150 survey respondents.
  • A change in strategy was made to reach a broader target audience around 27th February 2022, via social media such as Facebook, LinkedIn, Twitter, and Instagram. Within a day of addition, 150 responses were collected.
  • A new strategy to acquire more respondents increased target audience participation. The survey target audience was offered a draw for 50 gift cards of USD 25, which could go to the winner or the charity of their choice.
  • A final attempt to increase respondents was made using ERA’s software portal login page, turned into a bulletin board, to notify ERA clients about the survey. We assumed that, due to heightened security around e-mails with links, ERA clients’ results were affected due to a lack of trust in the original e-mail.
Using the prize strategy in combination with social media significantly increased the survey respondents to around 2170. The results of the survey count are graphed in chronological order below (Figure 3).
6.
Data collected from the above survey were used to build the mathematical model presented in the results section. The mathematical model was built using logical deductions such as percent of participants who desire to continue working from home and the distance they would typically travel if they had to commute monthly to work. Considering their modes of transportation and assuming tailpipe emissions factor provided by EPA [20] mathematical model was built to project the amount of CO2 that could be saved if a given percentage of the workforce continues the work-from-home model.

4. Results

4.1. Data Analysis-ArcGIS

Based on extensive literature research and the information acquired regarding global CO2 emissions [3], and after studying several datasets from multiple publications, the Carbon Monitor website (carbonmonitor.org) was selected as the best primary source of data for CO2 emissions data. CarbonMonitor.org [10] is an international initiative providing regularly updated, science-based estimates of daily CO2 emissions. The data revealed a drop and re-increase in emissions during the COVID-19 pandemic [10]. Carbon Monitor provides daily CO2 by sector (ground transportation, power, domestic aviation, industry, international aviation, and Residential).
The Carbon Monitor website offers global CO2 data for several countries (China, USA, India, EU, UK, and Japan). Based on the 2019 and 2020 Carbon Monitor data and using ArcGIS Pro, we built the “Carbon Monitor 2019–2020 CO2 Emissions Ground Transportation data by Country” see Figure 4. The graph and data clearly show an at least ~40% drop in the United States just in ground transportation of CO2 emissions between 2019 and 2020. The data also show a drop in CO2 ground transportation emissions globally (China, USA, India, EU, UK, and Japan). This agrees with studies on CO2 emissions found in the literature [3].

4.2. Daily CO2 Emissions

Daily CO2 data for ground transportation form Carbon Monitor were used to analyze the impact of COVID-19 on CO2 emissions from January to May. The year 2019 was used as base year and impact of CO2 emissions was studied for the years 2020, 2021 and 2022. Initial analysis revealed a distinct decrease of over 470 million tons of CO2 Emissions resulting from ground transportation in 2020 compared to base year 2019 between January to May due to COVID-19 lockdown (Figure 5).
Country-specific ground transportation CO2 emissions show that countries such as China and India have maintained some of the CO2 emission reductions due to COVID-19, whereas countries like the United States, EU27 and the UK are showing increasing trends (Figure 6).
Further analysis of the data shows noticeable decrease in CO2 emissions from ground transportation from March to May from 2019 to 2020 worldwide; this impact resulted in a 21.4% decrease, but by 2021, the % change decreased to 5.6% and, by 2022, there is slight increase of 0.4%. See Figure 7 for a percent change analyses for individual countries and worldwide.

4.3. Data Analysis-ArcGIS Survey 123 Results

In ArcGIS Survey 123, 2157 results were analyzed out of the 2170 collected responses due to 13 bad data results. When survey participants where asked if “At any time between the start of the pandemic and now, have you ever worked from home?”, 93% of participants responded “yes”. This question was followed by question 2.
“Thinking back to before the COVID-19 pandemic: In a typical month, how often did you work from home?” Over 41% (Figure 8) of participants responded that, prior to the pandemic, they almost never worked from home.
Response to question 3. “Since the start of the pandemic and now, in general how satisfied are you with working from home?” Over 66% of participants said they were satisfied working from home; only 15% responded that they were unsatisfied (Figure 9).
Next, in questions 4 and 5, the participants were asked, “Suppose working from home is currently a viable option. How likely do you think you would choose this option?” 73% of participants said they were Likely, Very Likely, or Somewhat Likely (Figure 10) to choose work from home.
“Suppose a flexible or hybrid workplace schedule, for example, working 2 days a week at the office and 3 days a week from home, is currently a viable work option. How likely do you think you would choose this option?” 71% of participants said they were Likely, Very Likely, or Somewhat Likely (Figure 11) to choose to work from home.

4.4. Transportation Data Analysis

The next set of questions regarded participants’ modes of transportation since the start of the pandemic, “what forms of transportation do you use to travel to work most often?” participants said they use private vehicles, public, and walk/cycle/Rrdeshare 65%, 27%, 8% of the time, respectively (Figure 12).
Of those that used public transportation, 41% used the bus, versus 36% that used the Subway or Metro (Figure 13).
Of those that used private vehicles, 28% used small/compact cars, 40% used medium/small SUV cars, 12% used large vehicles, and only 13% of respondents used electric or hybrid cars (Figure 14).
The location of survey participants was collected using the ArcGIS location pin on the map of the globe shown below; the map reveals that even though the majority of results came from North America, there was an adequate number of participants worldwide to allow for the results of the survey to count as a global survey (Figure 15).
CO2 emissions data were quantified in miles, based on the question Q7 results, collected from survey participants answering question “Thinking to before the pandemic: about how many miles or kilometers did you commute to and from work in a typical month? ___ miles ___ km”.
Mathematical model built to quantify the CO2 emissions saved per month per person working from home (Table 1):
EPA Carbon Dioxide (CO2) average emission rate from tailpipe per one mile traveled = 404 g [20] (Figure 16).
The number of people who answered yes to Q4 (Suppose working from home is currently a viable option. How likely do you think you would choose this option?) = 770 out of 1703 Respondents = 45% of respondents (Figure 17).
Theorem 1.
  • TM = Total Commute Distance for all respondents (Miles)
  • AY = Number of people that answered yes to (Question 1: At any time between the start of thepandemic and now have you ever worked from home)
  • MAM = Monthly average miles per person’s commute
  • MAM = TM/AY
    M A M = 172,512 1972 = 87.48   Miles
  • AMR = 404 g/miles EPA (CO2) average emission rate from tailpipe grams per one mile traveled
  • CR = 0.002204620 lbs./gram
  • ES = lbs./month CO2 emissions saved per month per person working from home
  • ES = MAM × AMR × CR
    ES = 87.48 miles × 404 gram/miles × 0.00220462 lbs/gram
    = 77.92 lbs/Month CO2 Emissons saved per month per person
Based on the analysis of the Q18 and Q20, regarding survey participants’ education level and age group, it can be concluded that 45% of the results obtained from Q4, where participants were asked “Suppose working from home is currently a viable option. How likely do you think you would choose this option?” were skewed due to the demographic of survey respondents; 56.19% of survey respondents had education at university level and were more likely to be working in desk jobs that would have an option to work from home, for example, the IT field or consultants versus manufacturing or services (Table 2, Figure 18).
The result of the survey shows a bias toward advanced degreed individuals; to correct for this bias, we selected to apply a correction factor based on 56.19% of the results of the survey participants with an advanced degree. The World Development Indicators (databank—world bank, 2022) [19] for labor force with advanced education by country supports our findings. For example, based on world bank data in 2021, 71.6% of total working-age of United States population have an advanced education. It should also be noted that, in 2021, 64.8% of the USA population were of working-age. Taking these three factors into consideration, the results of the analysis below show that over 1.89 million metric tons of CO2 emission were saved per month in United States.
Total number of survey participants with advanced degree: Bachelor, Master, or Doctorate Degrees = 56.19% (Table 2).
Theorem 2.
  • P = 332,000,000 population of USA in 2021 (Google, 2022) [19]
  • %PW = 64.8% population of USA of working-age
  • %SPY = 45% of survey participants said yes to continue work from home
  • %AEP = 56.19 % of survey participants with advanced degree of Bachelor, Master, or Doctorate Degrees
  • CF = 0.000446429 (metric tons)/lbs.
  • TES = Total metric tons/month CO2 emissions saved based on number of people working from home
  • ES = lbs./Month CO2 emissions saved per month per person working from home
  • NWFH = Potential number of US residents wanting to continue working from home
  • NWFH = P × %PW × %SPY × %AEP
    NWFH = 54,398,213 People
  • TES = NWFH × ES × CF
    TES = 1,892,069 Metric tons/Month CO2 Emissons Saved per month USA Only

4.5. Social Data Analysis

An analysis of the social aspects of the survey data was not conclusive. Results for questions 8 through 15, revealing that “Relationships with Family and Co-workers,” “Job satisfaction, Productivity, promotion opportunity, and career growth,” and finally, participants “Physical and Mental Health” of survey participants showed that from ~51% to 70% were majorly impacted, impacted, minorly impacted, and somewhat impacted versus from ~30% to 49% being neutral, unimpacted, minorly, and somewhat unimpacted by the COVID-19 pandemic (Figure 19).
Grouped by Percent of Survey Respondents Impacted vs. Unimpacted.

5. Discussion

This research aimed to measure employees’ work-at-home options, commutes, and their impact on their job satisfaction and carbon footprint reduction. The measured variables were both quantitative (built on ArcGIS Survey 123, evaluating research questions) and quantitative (built on data from global/country-specific CO2 emissions recorded for 2019, 2020, 2021, and 2022).
Quantitative data collection using ArcGIS Survey 123 was conducted in collaboration with two non-profit environmental groups, Suppliers Partnership for Environment organization (SP), The Commission for Environmental Cooperation (CEC), and with an environmental consulting firm, ERA Environmental Software Solutions (ERA). These collaborators helped to distribute surveys to their memberships and employees. These three groups represent the environmental interests of multi-stakeholders (government, industry, academia, consultants, and environmental groups) in the United States, Canada, and Mexico.
The decreases in air pollution have been widely documented [3], but the other impacts of people’s lifestyle changes have not been explored. There are valuable lessons that can be learned by examining the lifestyle changes that were made globally and how these could impact our world going forward. The outcomes of these changes could possibly helpto achieve sustainable climate change goals.
There are several gaps that exist in the data that were reviewed from the literature. These are parameters such as commute time, distance traveled, type of vehicle driven, use of public transportation, job satisfaction, impact on family life, impact on mental health, employee rights to decide, and other related topics. The work-from-home scenario has also led to many people looking for alternative employment. Over three years into the pandemic, it is very hard to retain and/or find employees. Job satisfaction is even more important than ever for employers to understand. Businesses that operate in the US and Canada are seeing many employees “jumping ship” to work for other companies in record numbers. There is, of course, a huge impact on family life as adults try to work at home with children attending school via Zoom meetings. This has been a huge challenge for many families with smaller homes and young children. These dramatic changes have also led to mental health issues as families try to find a work/family balance. This had been especially difficult during the lockdown period.
This research explored the tie-in of data from changes in lifestyle due to the pandemic and how this could be linked to the reduction in CO2 emissions. Are there lessons to be learned that can be used on the road to more sustainable climate change goals for the future? Our survey asked many questions to see how people felt about the changes to their lifestyles that occurred due to COVID-19.
The survey results were fundamental in understanding the possible negative or positive impacts of the work-from-home model. Based on the survey responses; 93% of the respondents had worked from home at the start and during the pandemic in comparison to only ~41% of respondents that had almost never worked from home in a typical month prior to the pandemic. In addition, only ~66% of the survey group were satisfied with working from home. The survey data showed that ~73% of respondents would choose the “work from home option” and ~71% would also like a flexible or hybrid workplace schedule, working two days a week at the office and three days a week from home.
Of the surveyed group, it was observed that 64% of respondents used a private vehicle to travel to work, of which ~42% were mid-size vehicles or a small SUV. For those using public transportation, ~70% were using the bus and ~21% the train. The average commute to work by the respondents was ~2956 km (~1837 miles) per month. COVID-19 impacted the relationship with the family for about ~69%, whereas ~15% were not impacted. Similarly, the impact on the relationship with co-workers was impacted for ~71%, and only ~13% were not impacted.
Job satisfaction was impacted for ~78% and unimpacted for ~11%. COVID-19 pandemic impacted job productivity for ~67% and only ~14% responded that pandemic had no effect on their productivity. About ~51% of respondents assumed their promotion opportunities would be impacted and only ~13% thought they were unimpacted. As for career growth, ~64% felt they would be impacted whereas ~15% said they would not be impacted.
With regards to physical health, ~41% respondents would be impacted versus ~16% unimpacted. A total of ~69% of respondents answered that their mental health was impacted versus only ~13% that were unimpacted.
The data collected from the survey were also indicative of large savings of CO2 per person per month, with an average commute distance of ~87.48 miles per month. The CO2 savings from one person would be ~77.92 lbs. of CO2/month. Considering the working population (~65%, ages 16–65), the combined impact of individuals wanting to continue working from home and their education level, and the number of people living on earth (7,874,000,000) [19] that are given the opportunity to work from home, the emission savings could be 538,487,394 metric tons (Table 3) of CO2 annually (see Table 4 for some country-specific data) with the adoption of the “Work-From-Home “model.
It is important to note that annual global CO2 emissions in 2021 were 36,300,000,000 tons [19]; the CO2 savings worldwide were ~1.48% annually. Table 4, displaying a summary of the results, supports the hypothesis of the “Work-From-Home” model and the potential long-term impacts on CO2 reductions due to many corporations’ adoption of Work-From-Home model.

ArcGIS Data Discussions

As part of our research project, we wanted to see if the changes brought about during the pandemic, such as “Work-From-Home,” would continue to affect CO2 emissions post-pandemic and beyond. Using ArcGIS Pro, a prediction analysis was performed for China, USA, India, EU, UK, France, Germany, Italy, Spain, Russia, Japan, and Brazil. The map provides a visual representation of how CO2 emissions could look going forward. Based on ArcGIS Pro, the prediction, looking at the dark brown colors near North America, suggests that we might be looking at higher pollution levels than the rest of the world (Figure 20).
In addition, a predicted error analysis was performed using ArcGIS Pro to explore the validity of the global CO2 emissions in the future (Figure 21). The map below is a visual representation that shows the uncertainty related to the predicted values presented in the previous map (Figure 21).
The predicted error is higher in North America than in the rest of the world. We suspect that this is due to there being only one significant data point in North America. However, the cluster of data from Europe improve the prediction results and reduces the prediction error near these data clusters.

6. Conclusions

The summary of results from this study suggests that there are a significant number of professionals that are interested to continuing to use the Work-From-Home work model. The study also concludes that if employers allow for the continuation of the Work-From-Home work model, there will be potential CO2 emissions reduction of ~1.48% annually.
It was also noted that most of the air pollutant data presented in the literature were from the US, Canada, Europe, and parts of Asia. Data from around the globe, including Mexico, Africa, South America, and Russia, should also be compiled for during the lockdown period and evaluated for the period in previous years.
Other identified gaps have included some of the “negative” consequences of the global pandemic, such as the generation of the increase in medical waste, haphazard use and disposal of disinfectants, masks, and gloves and the burden of untreated wastes being released into the environment.
Based on these study findings, we, as co-CEOs of ERA Environmental Consulting, Inc. (ERA), have concluded that the ERA team should permanently adopt the work-from-home model that was initiated due to the lockdown measures in March 2020. Interestingly enough, this model was collectively welcomed by our team of professionals, including environmental scientists, researchers, software programmers, information technology (IT), administration/human resources, analysts, and marketing. This has been a very successful model in increasing staff safety during the ongoing pandemic, reducing anxiety, increasing work/life balance, decreasing transportation source emissions, and increasing employee satisfaction.

Author Contributions

Conceptualization, V.G., S.S. and N.D.; methodology, V.G. and S.S.; software, V.G. and S.S.; formal analysis, V.G., S.S. and N.D.; writing—Original draft preparation, V.G. and S.S.; supervision, N.D.; project administration, V.G., S.S. and N.D. All authors have read and agreed to the published version of the manuscript.

Funding

This research received no external funding.

Institutional Review Board Statement

Not applicable.

Informed Consent Statement

Not applicable.

Data Availability Statement

All data generated or analyzed during this study are included in this published article.

Acknowledgments

We would like to thank my Academic Mentor, Deborah Naybor of Paul Smith’s College, for her tireless efforts and guidance and her contribution to the analysis of survey data. We also would like to thank our community collaborators, Erin Manitou, and Laura Weinkam of ERA Environmental Software solutions, for helpful feedback on this project. In addition, we would also like to thank The Suppliers Partnership for Environment organization (SP), The Commission for Environmental Cooperation (CEC), and ERA Environmental Software solutions (ERA) for their contribution to the project by sending the project Survey to all its member companies. This project would not have been possible without everyone’s guidance and assistance.

Conflicts of Interest

The authors declare no conflict of interest.

References

  1. World Health Organization. Available online: https://www.who.int/ (accessed on 20 April 2022).
  2. Suresh, M.; Gopakumar, K. Multi-grade fuzzy assessment framework for software professionals in work-from-home mode during and post-COVID-19 era. Future Bus. J. 2021, 7, 10. [Google Scholar] [CrossRef]
  3. Liu, Z.; Ciais, P.; Deng, Z.; Lei, R.; Davis, S.J.; Feng, S.; Zheng, B.; Cui, D.; Dou, X.; Zhu, B.; et al. Near-real-time monitoring of Global CO2 emissions reveals the effects of the covid-19 pandemic. Nat. Commun. 2020, 11, 5172. Available online: https://www.nature.com/articles/s41467-020-18922-7 (accessed on 2 May 2022). [CrossRef] [PubMed]
  4. In Proceedings of the Climate Change Conference COP26, Glasgow, 2021. Available online: https://ukcop26.org/ (accessed on 20 April 2022).
  5. Schlosser, F.; Maier, B.F.; Jack, O.; Hinrichs, D.; Zachariae, A.; Brockmann, D. COVID-19 lockdown induces disease-mitigating structural changes in Mobility Networks. Proc. Natl. Acad. Sci. USA 2020, 117, 32883–32890. [Google Scholar] [CrossRef] [PubMed]
  6. Chen, L.-W.A.; Chien, L.-C.; Li, Y.; Lin, G. Nonuniform impacts of COVID-19 lockdown on air quality over the United States. Sci. Total Environ. 2020, 745, 141105. Available online: https://www.sciencedirect.com/science/article/abs/pii/S0048969720346349 (accessed on 28 April 2022). [CrossRef] [PubMed]
  7. Andreoni, V. Estimating the European CO2 emissions change due to COVID-19 restrictions. Sci. Total Environ. 2021, 769, 145115. Available online: https://www.sciencedirect.com/science/article/abs/pii/S0048969721001819 (accessed on 21 April 2022). [CrossRef] [PubMed]
  8. Mashayekhi, R.; Pavlovic, R.; Racine, J.; Moran, M.D.; Manseau, P.M.; Duhamel, A.; Katal, A.; Miville, J.; Niemi, D.; Peng, S.J.; et al. Isolating the impact of covid-19 lockdown measures on Urban Air Quality in Canada. Air Qual. Atmos. Health 2021, 14, 1549–1570. [Google Scholar] [CrossRef] [PubMed]
  9. Cicala, S.; Holland, S.P.; Mansur, E.T.; Muller, N.Z.; Yates, A.J. Expected health effects of reduced air pollution from COVID-19 social distancing. Atmosphere 2021, 12, 951. [Google Scholar] [CrossRef]
  10. carbonmonitor.org. 2021. Available online: www.carbonmonitor.org (accessed on 19 May 2022).
  11. Does Tourism Really Cause Stress? A Natural Experiment Utilizing ArcGIS Survey123. Taylor & Francis. Available online: https://www.tandfonline.com/doi/abs/10.1080/13683500.2019.1702001 (accessed on 8 October 2022).
  12. Vaziri, H.; Casper, W.J.; Wayne, J.H.; Matthews, R.A. Changes to the work–family interface during the COVID-19 pandemic: Examining predictors and implications using latent transition analysis. J. Appl. Psychol. 2020, 105, 1073. [Google Scholar] [CrossRef] [PubMed]
  13. Garrote Sanchez, D.; Gomez Parra, N.; Ozden, C.; Rijkers, B.; Viollaz, M.; Winkler, H. Who on Earth can work from home? World Bank Res. Obs. 2021, 36, 67–100. [Google Scholar] [CrossRef]
  14. Alifuddin, N.A.; Ibrahim, D. Studies on the impact of work from home during COVID-19 pandemic: A systematic literature review. J. Komun. Borneo (JKoB) 2021, 9, 60–80. [Google Scholar] [CrossRef]
  15. Karatayev, V.A.; Anand, M.; Bauch, C.T. Local lockdowns outperform global lockdown on the far side of the COVID-19 epidemic curve. Proc. Natl. Acad. Sci. USA 2020, 117, 24575–24580. [Google Scholar] [CrossRef] [PubMed]
  16. Ritchie, H.; Roser, M.; Rosado, P. CO2 and greenhouse gas emissions. Our World in Data. 2020. Available online: https://ourworldindata.org/co2-emissions?utm_source=coast%20reporter&utm_campaign=coast%20reporter%3A%20outbound&utm_medium=referral (accessed on 19 May 2022).
  17. Rume, T.; Islam, S.M.D.-U. Environmental effects of COVID-19 pandemic and potential strategies of Sustainability. In Heliyon; 2020. Available online: https://www.ncbi.nlm.nih.gov/pmc/articles/PMC7498239/ (accessed on 19 May 2022).
  18. Bai, B.; Gopalan, N.; Beutell, N.; Ren, F. Impact of Absolute and Relative Commute Time on Work–Family Conflict: Work Schedule Control, Child Care Hours, and Life Satisfaction. J. Fam. Econ. Issues 2021, 42, 586–600. [Google Scholar] [CrossRef] [PubMed]
  19. World Development Indicators|Databank—World Bank. Available online: https://databank.worldbank.org/reports.aspx?source=2&series=SL.TLF.ACTI.ZS&country (accessed on 27 August 2022).
  20. EPA. Greenhouse Gas Emissions from a Typical Passenger Vehicle. 2022. Available online: https://www.epa.gov/greenvehicles/greenhouse-gas-emissions-typical-passenger-vehicle (accessed on 27 August 2022).
Figure 1. Visual presentation of How did COVID-19 Impact Employees, and Environment. Pre, During, and Post Lockdown.
Sustainability 14 13689 g001
Figure 2. Sectoral effects of COVID-19 on CO2 emissions [3].
Sustainability 14 13689 g002
Figure 3. Arc GIS Survey 123 Counts and Timeline (14th February to 16th March 2022).
Sustainability 14 13689 g003
Figure 4. Carbon Monitor 2019–2020 CO2 Emissions Ground Transportation data by Country.
Sustainability 14 13689 g004
Figure 5. Worldwide Ground Transportation CO2 Emissions for January to May of 2019–2022.
Sustainability 14 13689 g005
Figure 6. Total Ground Transportation CO2 Emissions from January to May of 2019–2022.
Sustainability 14 13689 g006
Figure 7. Ground Transportation CO2 Emissions Percent Change by country and worldwide from January to May of 2019–2022.
Sustainability 14 13689 g007
Figure 8. Percent respondent by answer group, Q2 of Ssrvey.
Sustainability 14 13689 g008
Figure 9. Percent respondent by answer group, Q3 of survey.
Sustainability 14 13689 g009
Figure 10. Percent respondent by answer group, Q4 of survey.
Sustainability 14 13689 g010
Figure 11. Percent respondent by answer group, Q5 of survey.
Sustainability 14 13689 g011
Figure 12. Percent respondent by transportation group, Q6 of survey.
Sustainability 14 13689 g012
Figure 13. Percent respondent by transportation group, Q6a of survey.
Sustainability 14 13689 g013
Figure 14. Percent respondent by transportation group, Q6b of survey.
Sustainability 14 13689 g014
Figure 15. Global Map display of Survey Respondents Q7.
Sustainability 14 13689 g015
Figure 16. EPA Greenhouse Gas Emissions from a Typical Passenger Vehicle, 2022 [20].
Sustainability 14 13689 g016
Figure 17. Count of respondents by answer group, Q4 of survey.
Sustainability 14 13689 g017
Figure 18. Percent survey participants demographics analysis based on age range and education level, Q18 and 20 of survey.
Sustainability 14 13689 g018
Figure 19. Q8 to Q15 answers were analyzed individually; each question’s data were grouped by percent of survey respondents that were impacted vs. unimpacted.
Sustainability 14 13689 g019
Figure 20. Carbon Monitor 2019–2020 CO2 emissions from ground transportation data by country-predicted analysis.
Sustainability 14 13689 g020
Figure 21. Carbon Monitor 2019–2020 CO2 emissions from ground transportation data by country predicted error analysis.
Sustainability 14 13689 g021
Table 1. Average monthly miles saved per person.
Sum of Q7. Enter Your Monthly Commute DistanceMiles
199,163.2 (km)123,754.24
153,877.41 (miles)153,877.41
Grand Total172,512.25
# of Survey Respondents1972
Monthly miles average per person saved87.48
Table 2. Survey participants’ demographics’ analysis based on age range and education level.
Q20. What Is Your Highest Level of Education?Q18. What Is Your Age RANGE?
Age Groups18 to 29 Years30 to 39 Years40 to 49 Years50 to 59 Years60 to 69 Years70 Years and OlderGrand Total
Doctorate degree0.00%1.54%0.53%0.47%0.36%0.18%3.08%
Master’s degree2.67%6.52%2.67%2.07%1.24%0.30%15.47%
Bachelor’s Degree7.47%18.49%7.35%2.61%1.36%0.36%37.64%
Certificate or Associate’s Degree2.55%5.04%3.02%0.95%0.30%0.24%12.09%
Some college no degree4.09%13.28%1.24%0.95%0.47%0.00%20.04%
Some graduate school no degree0.95%1.66%1.24%0.59%0.36%0.12%4.92%
High school diploma or equivale2.07%2.61%0.83%0.06%0.18%0.00%5.75%
Did not complete high school diploma0.59%0.30%0.06%0.06%0.00%0.00%1.01%
Grand Total20.39%49.44%16.95%7.77%4.27%1.19%100.00%
Table 3. Annual Potential tons [Imperial] of CO2 Emission Savings If Predicted Population Continues the Working-From-Home model.
Country NamePopulation in 2021Percent Population Working Age (16–65) in 2021 (~65%)Percent Survey Respondents Interested to Continue Work from Home after COVID-19 (~45%)Percent Survey Respondents with Advanced Education Interested to Continue Work from Home after COVID-19 (~56%)Monthly Potential tons [Imperial] of CO2 Emission Saving If Predicted Population Continues Working-From-Home ModelAnnual Potential tons [Imperial] of CO2 Emission Saving If Predicted Population Continues Working-From-Home Model
World7,874,000,0005,102,352,0002,296,058,4001,290,155,21544,873,950538,487,394
China1,444,000,000935,712,000421,070,400236,599,4588,229,36098,752,324
USA332,000,000215,136,00096,811,20054,398,2131,892,06922,704,828
India1,393,000,000902,664,000406,198,800228,243,1067,938,71195,264,534
EU & UK515,000,000333,720,000150,174,00084,382,7712,934,98735,219,838
Japan126,000,00081,648,00036,741,60020,645,105718,0748,616,893
Table 4. Estimated overall annual percent CO2 emission savings from work-from-home model in 2021, worldwide and in selected countries.
NameAnnual Potential tons [Imperial] of CO2 Emission Saving Working Population Continue Working-From-Home ModelCO2 Emissions from Ground Transportation in 2021 (Carbon
Monitor.Org)
Estimated Annual Percent CO2 Emissions Saving from Ground Transportation in 2021Total CO2 Emissions in 2021 (Google, 2022)Estimated overall Annual Percent CO2 Emissions Saving from in 2021 Area
World538,487,3946,306,933,8008.54%36,300,000,000 1.48%
China98,752,324907,484,07010.88%11,900,000,000 0.83%
USA22,704,8281,592,589,0201.43%4,460,000,000 0.51%
India95,264,534268,914,04035.43%2,880,000,000 3.31%
EU & UK35,219,838885,175,1103.98%2,824,500,000 1.25%
Japan8,616,893172,089,5955.01%1,149,000,000 0.75%
Publisher’s Note: MDPI stays neutral with regard to jurisdictional claims in published maps and institutional affiliations.

