
The Impact of Carbon Emissions Trading Pilot Policy on Industrial Structure Upgrading

1
North-China Company, Sinopec Chemical Commercial Holding Company Limited, Beijing 100029, China
2
School of Economics and Resource Management, Beijing Normal University, Beijing 100875, China
3
School of Business, Beijing Technology and Business University, Beijing 102488, China
4
School of Economics and Management, Fuzhou University, Fuzhou 350108, China
5
School of Economics and Management, Tongji University, Shanghai 200092, China
*
Authors to whom correspondence should be addressed.
†
These authors contributed equally to this work.
Sustainability 2022, 14(17), 10818; https://doi.org/10.3390/su141710818
Submission received: 18 July 2022
/
Revised: 22 August 2022
/
Accepted: 23 August 2022
/
Published: 30 August 2022
(This article belongs to the Special Issue The Impact of Carbon Emission Control on Economic Costs and Human Health in China)
Abstract
:Using the carbon emissions trading pilot policy implemented since 2011 as a quasi-natural experiment, this paper constructs a multi-period DID model based on panel data of 280 prefecture-level cities from 2006–2019 to explore the impact of the carbon emissions trading pilot policy on industrial structure upgrading and conducts a heterogeneity test and mechanism test. This study finds that the carbon emissions trading pilot policy significantly promotes the upgrading of industrial structures, especially for larger cities and non-resource-based cities. Further exploration of the impact mechanism shows that the carbon emissions trading pilot policy promotes industrial structure upgrading mainly through green innovation. The findings of the study have significant implications for the construction of a high-quality, modernized economic system in China.
1. Introduction
In recent years, rapid global industrialization has led to an increasing demand for fossil energy in various countries. With the massive use of fossil fuels in modern society, greenhouse gas emissions, such as carbon dioxide, are accumulating, and the problem of ecological damage is becoming increasingly serious, most notably in the form of global warming, which is a matter of fundamental interest to every country. In 2021, global CO2 emissions reached a record high of 363 tons, indicating an urgent need to reduce CO2 emissions (Figure 1). To comprehensively address the problems caused by warming, countries around the world have started to intervene in total CO2 emissions using administrative methods. In December 1997, the Kyoto Protocol was signed, which specified the types of polluting gases that signatory countries needed to reduce their emissions and set the market mechanism as a new path for the issue of greenhouse gas emission reduction. The Kyoto Protocol also divided carbon trading into three specific forms: emissions trading, the Clean Development Mechanism, and Joint Implementation. In November 2016, 178 countries signed the Paris Agreement, which gave further impetus to the operation of green development mechanisms in the international community [1].
The carbon emissions trading mechanism gives pollutants a certain economic value by clarifying their property rights so that the property rights of pollutants can be freely traded among different market players, thus encouraging each player to adjust the industrial structure and achieve technological innovation [2]. Therefore, the carbon emissions trading mechanism is conducive to improving the utilization rate of production factors, guiding the transfer of capital, technology, manpower, and other factors from inefficient and high-polluting industries to high-efficiency and low-polluting industries, and ultimately realizing the optimal allocation of the industrial structure [3]. To achieve the emission reduction commitments of the Kyoto Protocol, developed countries and regions have established regional emission reduction mechanisms for controlling greenhouse gas emissions. The EU first launched a carbon emissions trading system in 2005, which was the earliest, largest, and most widely covered carbon market in the world. In 2019, EU carbon emissions trading amounted to 168,966 million euros, accounting for 87.2% of the world’s total. After the successful establishment of the carbon emissions trading system in the EU, the United States, Japan, South Korea, and Kazakhstan followed the EU’s example and established carbon trading markets. As shown in Figure 2, the scale of the global carbon emissions trading market has expanded over the past five years. In 2021, the global CO2 emissions trading market grew by 163.98% and has reached €760 billion.
Since the reform and opening up, China’s economic development has always maintained a high growth rate, but rapid economic growth cannot be separated from the consumption of large amounts of fossil energy, which has led China to become the world’s highest carbon dioxide emissions [4]. From 2016 to 2020, China’s total CO2 emissions continued to grow, rising from 9.14 billion tons to 9.9 billion tons (Figure 3). In this context, as a signatory of the Kyoto Protocol and the Paris Agreement, China is actively responding to the global call for carbon emission reduction and advocating green, energy-saving, and efficient development methods. In 2011, China promulgated the Notice of Carbon Emissions Trading Pilot Work, which clearly indicated that China would start the carbon emissions trading pilot work in Beijing, Tianjin, Shanghai, Chongqing, Hubei, Guangdong, and Shenzhen, one after another from 2013, which also marked the official start of the carbon trading market pilot work in China. China is the country that launched carbon emissions trading after the EU, the US, Japan, South Korea, and Kazakhstan, showing that the institutionalization of energy savings and emission reduction in China has achieved international synchronization.
By 2022, China will have carried out carbon emissions trading pilot projects for more than 10 years. In the context of promoting the overall goal of “carbon peaking” and “carbon neutrality,” carbon emissions trading pilot work, a market-based environmental regulation tool, has become an important grip for emission reduction targets. Has the implementation of this policy been effective in promoting green and sustainable development in China? Furthermore, as the national carbon emissions trading system continues to advance, can China’s implementation of the carbon emissions trading pilot policy promote the upgrading of China’s industrial structure, thereby achieving the win-win goal of economic development and environmental protection? If the pilot policy can promote industrial structure upgrading, what is its mechanism of action? Does this facilitation effect vary heterogeneously by city size, geographic location, and urban resource endowment? These issues deserve to be studied in depth, although there are important practical implications for China to continue to promote a green cycle path and high-quality economic development.
2. Literature Review
2.1. Policy Effectiveness of Carbon Emissions Trading Pilots
Carbon emissions trading was first proposed by Hass and Dales [5]. Hass and Dales argue that the traditional environmental management tools of government intervention do not provide any incentive for enterprises to take measures to protect the environment, so the state should create a market where pollution is allocated to other enterprises under government control, and where the emission rights can be transferred between enterprises. Since 2013, carbon emissions trading markets in China’s provinces and cities have started to operate one after another. As shown in Table 1, Shenzhen became the first pilot city for carbon emissions trading in China in June 2013. From November 2013 to September 2016, seven provinces and cities—Beijing, Shanghai, Guangdong, Tianjin, Hubei, Chongqing, and Fujian—launched carbon emissions trading markets, forming a regional carbon emissions trading market with Chinese characteristics. Although China’s carbon emissions trading has a small number of pilots in the pilot phase, it covers only a smaller amount of carbon emissions than the EU carbon trading system, spanning the eastern, central, and western regions. Because of the differences in economic structure characteristics, population size, and resource endowment among provinces and cities, China’s carbon emissions trading pilot policy provides a multi-level reference experience for the establishment of a national unified carbon market.
Existing studies on carbon trading have focused on the effects of carbon emission reduction, technological progress, enterprise performance, and economic growth. In terms of carbon emission reduction, most scholars believe that carbon emissions trading, as a market-oriented low-carbon policy, can effectively constrain micro enterprises and other carbon emitters to use cleaner and low-carbon energy, upgrade production equipment, reduce production energy consumption, and improve production efficiency to reduce carbon emissions in the manufacturing and construction industries, thereby reducing total social carbon emissions [6,7].
In terms of technological progress, the implementation of the carbon emissions trading pilot policy has increased the cost of pollution control and system compliance for polluting and inefficient enterprises, forcing them to carry out green technological innovation activities to increase output while reducing energy consumption and carbon emissions [8]. At the same time, the government often implements supporting policies, such as tax breaks or green subsidies, for enterprises that adopt green technology research and development to stimulate their research and development activities, while carbon emissions trading is in progress, so carbon emissions trading can effectively promote technological innovation [9].
In terms of firm performance, the findings of the established studies are not uniform. Some scholars believe that environmental regulatory instruments, such as carbon emissions trading, may have a negative impact on enterprise development, mainly because carbon emissions trading will strictly allocate quotas and put enterprises under heavy pressure to reduce emissions. At this time, enterprises are forced to invest a large amount of available capital in green technology upgrades, which will increase their production costs, affect their normal production and operation activities, and ultimately harm their investment efficiency [10]. Contrary to this category, some scholars believe that the implementation of carbon emissions trading pilot policies can improve the profitability of enterprises, which is mainly based on Porter’s theory and information display theory [11,12]. Porter’s theory argues that market-incentivized environmental regulation, as an external pressure, can force firms to upgrade their technology to improve profitability and promote investment efficiency. Information display theory also suggests that carbon emissions trading pilot policies can reduce information asymmetry and principal-agent problems among firms through external influences, and reduce the policy burden on firms.
Similar to the findings of carbon trading on firm performance, the findings of established studies on the relationship between carbon trading and economic development are inconsistent. Some scholars believe that the implementation of the carbon emissions trading pilot policy can improve the quality of economic development through technological innovation, industrial structure transformation and upgrading, and the synergistic effect of related environmental policies [13,14]. When energy savings and emission reduction targets are reached, carbon emissions trading can effectively allocate resources and improve production efficiency through market mechanisms, which in turn can drive the growth of environmental total factor productivity, reduce the cost of emission reduction in the economic system, and ultimately effectively promote high-quality economic development. Conversely, some scholars argue that carbon emissions trading pilot policies are ineffective in improving carbon emissions and environmental pollution control, and inhibit normal economic production activities [15]. Kim and Lim examined carbon emissions from the power sector in Korea and found that the implementation of a carbon trading system in Korea would place an excessive carbon price burden on both direct and indirect greenhouse gas emissions from the power sector, inhibiting economic efficiency [16].
2.2. Research on the Influence Factors of Industrial Structure Upgrading
Industrial structure refers to the division status and proportional relationship of production factors among various industrial sectors of the national economy. The industrial structure is usually divided into primary, secondary, and tertiary sectors according to the “three industrial classifications”. The primary sector includes agriculture, animal husbandry, forestry, and fishing; the secondary sector includes extractive industries, manufacturing, and construction; and the tertiary sector includes three levels: the distribution sector, the sector for improving the level of science and culture and the quality of the population, and the production and living services sector [17]. Regarding the connotation of industrial structure upgrading, the current academic consensus is to divide industrial optimization and upgrading into two dimensions: industrial structure rationalization and industrial structure heightening [18]. Rationalization of industrial structure refers to the enhancement of coordination ability and the improvement of association levels between industries, which can reflect the degree of coordination between industries and the efficiency of the effective use of resources. Among them, coordination ability refers to the complementarity between industries. Industries with complementarity can form a convergence effect between them and bring into play the structural effect between industries, thus promoting the development of industrial structures in the direction of rationalization [19]. Industrial restructuring refers to the process in which changes in production technology lead to a gradual decrease in industries that are more dependent on labor and a gradual increase in industries that are supported by capital and technology [20]. The heightened industrial structure generally consists of three aspects: (1) In the overall industrial structure, the proportion of primary industries gradually evolves to the proportion of secondary and tertiary industries. (2) The proportion of labor-intensive industries in the industrial structure gradually decreases, while the proportion of capital- and technology-intensive industries gradually increases. (3) The share of industries manufacturing primary products in the industrial structure is gradually decreasing, while the share of industries manufacturing intermediate and final products is gradually increasing.
Existing studies have mainly examined the factors influencing industrial structure upgrading in terms of both internal and external factors. The main internal factors include aspects such as human capital and technological progress, and external factors include aspects such as market environment and international trade. In terms of human capital, the large size and relatively poor quality of China’s labor force are the main reasons that hinder the optimization of China’s industrial structure. After the appropriate transformation of traditional backward industrial technology, human capital will accelerate technological progress and technology absorption, while its scale effect and heightening will significantly promote upgrading of the industrial structure [21,22]. In terms of technological progress, existing studies suggest that technological upgrading can drive the evolution of industrial structures to a higher level by promoting the development of new industries. Azadegan and Wanger, through an empirical study of 353 manufacturing firms, found that industrial upgrading and restructuring and firm technological innovation are mutually reinforcing relationships, a view similarly supported by Zhou and Wang [23,24]. In terms of the market environment, Krugman found that market size has a significant role in promoting industrial restructuring, and the effect of market segmentation on industrial upgrading has an “inverted U-shaped” relationship [25]. Market structure, financing constraints, and technological progress are the main mechanisms through which the market environment affects industrial structure upgrading [26]. In terms of international trade, existing studies have concluded that international trade development can promote the upgrading of the domestic industrial structure [27]. Tianlan and Yang showed that newly industrialized countries have a highly significant two-way causal relationship between foreign trade and industrial growth, and that export-led economic development strategies can promote industrial structural upgrading [28].
2.3. Research on the Relationship between Environmental Regulation and Industrial Structure Upgrading
Currently, there is no consistent conclusion from existing studies on whether environmental regulations can significantly contribute to industrial structural upgrading. Some scholars believe that environmental regulation policies have a certain promotional effect on the upgrading of industrial structures. Market structure, scientific and technological innovation, and foreign investment introduction are the main paths of influence. Markusen et al. argued that market structure is an endogenous factor in environmental regulatory policies and that changes in environmental policies can have a large impact on market structure and thus promote the upgrading of industrial structure [29]. Liu conducted a study by constructing a theoretical model and found that the differential impact of environmental regulation on polluting and clean industries leads to changes in the industrial structure and drives the upgrading of the industrial structure [30]. Domazficky and Weber’s study similarly confirmed the idea that environmental regulation has a positive facilitative effect on enterprises’ innovative behavior and ultimately promotes industrial structural upgrading [31]. In addition, environmental regulations will make the residents’ awareness of environmental protection gradually increase, and society keeps progressing. In this context, the advantages of less polluting technology-based foreign enterprises in market competition will be gradually highlighted, and the demand for environmentally friendly products will increase, driving the development of related industries. That is, environmental regulation will attract the entry of environmentally friendly foreign enterprises through public monitoring channels, leading to the upgrading of the regional industrial structure [32].
Some scholars, on the other hand, argue that environmental regulation policies can inhibit industrial structural upgrading. According to the “cost compliance theory,” strict environmental regulation policies will lead to increased production costs and lower production efficiency and will cause a large amount of capital to be taken up by non-production, which will inhibit the upgrading of industrial structure [33]. However, does this mean that the implementation of a more relaxed environmental regulation policy will necessarily promote the upgrading of the industrial structure? Song and Bi showed that low-intensity environmental regulation can cause enterprises to lack the incentive to initiate independent innovation to reduce environmental costs, and even if enterprises initiate additional R&D investment, the effectiveness of the investment obtained has a lag, which can crowd out other resources of the enterprises [34]. Therefore, at a lower intensity of environmental regulation, environmental regulation policies do not necessarily promote industrial structural upgrading. In addition, environmental regulation will make the industrial structure of a region with a weak industrial structure tend to be more irrational. Fan and Liu showed that environmental regulation forces polluting enterprises to move to the western regions of China, which, while it will lead to an advanced industrial structure in regions with stronger environmental regulation, it will also aggravate the irrational industrial structure for regions with weaker industrial structures and deviate even more from the development toward an advanced industrial structure [35].
A review of the existing studies shows that there are many research results on the policy effects of carbon emissions trading pilots, the influencing factors of industrial structure upgrading, and the relationship between environmental regulation and industrial structure upgrading. However, the following issues still need further clarification: (1) Although existing studies have extensively examined the impact of environmental regulations on industrial structural upgrading, they still lack an examination of the impact of market-oriented low-carbon policies and industrial structural upgrading. (2) Most of the literature is based on provincial-level data to study the impact of environmental regulations on the upgrading of industrial structure, but there are few studies at the municipal level that explore the impact of environmental regulations on the upgrading of industrial structure, especially the lack of studies on the impact of carbon emissions trading pilot policies on the upgrading of industrial structure. Most of the existing studies on the measurement of industrial structure upgrading use a single indicator, such as industrial structure heightening or industrial structure rationalization, as the explanatory variable, which is slightly lacking in explanatory strength. Based on this, this paper takes the data of 280 prefecture-level cities in China from 2006–2019 as the research sample, measures industrial structure upgrading with two dimensions of industrial structure heightening and industrial structure rationalization, and uses a multi-period DID model to study the impact of carbon emissions trading pilot policies on industrial structure upgrading and to test heterogeneity. A mediating effects model is also used to test the influence mechanism of the pilot carbon emissions trading policy on industrial structure upgrading to enrich the research on related aspects.
3. Theoretical Analysis and Research Hypotheses
3.1. The Direct Impact of Carbon Emissions Trading Pilot Policy on Industrial Structure Upgrading
According to Porter’s hypothesis, although environmental regulations will increase the costs of firms in the short run, in the long run dynamically, environmental regulations will stimulate firms to improve technological innovation, increase their productivity, reduce pollutant emissions, and continuously improve product quality, thus offsetting the increase in production costs caused by environmental protection [36]. The carbon emissions trading pilot policy is mainly based on the property rights approach of Coase’s theorem. It gives economic value to the resources and environment by clarifying the property rights boundary of pollutants, creating a market environment for free trade, giving full play to the role and function of the market in economic development, and finally realizing the optimal allocation of resources by means of the market [37]. At the enterprise level, the carbon emissions trading pilot policy, as an environmental regulation tool, can prompt enterprises to continuously improve their technological innovation and resource utilization efficiency in the long-term process of economic development. Enterprises internalize the cost of carbon emissions into their own production costs by upgrading and eliminating outdated production capacity through technological transformation to save production costs and increase revenue. At the industrial level, after the implementation of the carbon emissions trading pilot policy, the adjustment of the corresponding production behavior of enterprises will promote the upgrading of the industrial structure from high energy consumption and low value-added to low energy consumption and high value-added, while accelerating the transfer from labor-intensive industries to capital- and technology-intensive industries. This process will promote the upgrading of the industrial structure. Based on the above analysis, this study proposes the following hypothesis:
H1.
The implementation of the carbon emissions trading pilot policy will significantly promote the upgrading of the industrial structure.
3.2. The Mechanism of the Effect of Carbon Emissions Trading Pilot Policy on Industrial Structure Upgrading
3.2.1. Carbon Emission Trading Pilot Policy Influences Industrial Structure Upgrade through Consumption Upgrade
In consumer economics, consumption upgrading usually refers to upgrading the consumption structure. An important manifestation of consumption upgrading is that consumers pay more attention to service consumption demand while increasing their demand for goods [38]. The implementation of the carbon emissions trading pilot policy has created a good environment for low-carbon emission reduction, which is conducive to active public participation in a low-carbon lifestyle. In a low-carbon environment, consumers’ preference for public transportation and the purchase of green and low-carbon products has increased, gradually forming green consumption habits. This provides a clear signal to produce green products [39]. To maximize profits, manufacturers will provide corresponding green lifestyle products, which will lead to a corresponding adjustment of product production plans and structures within the industry, promoting the greening process of the industry, and thus promoting the green upgrading of the industrial structure. In addition, the scale effect of green consumption brings new opportunities for the development of green industry, and capital further flows into green industry, which will promote the investment and production of green industry. With the multiplier effect of investment, the share of green industries increases, and the industrial structure is upgraded. Based on the above analysis, this study proposes the following hypothesis:
H2a.
The carbon emissions trading pilot policy will influence the upgrade of the industrial structure through a consumption upgrade.
3.2.2. Carbon Emissions Trading Pilot Policy Influences Industrial Structure Upgrade through Green Innovation
As a market incentive environmental regulation policy, the fundamental purpose of implementing the carbon emissions trading pilot policy is to reduce carbon emissions and promote the green and sustainable development of the whole society. Green innovation is one of the basic ways to achieve this purpose. Currently, studies have focused on the impact of the carbon emissions trading pilot policy on green innovation from two perspectives: “enterprise” and “region”. From the perspective of enterprises, the carbon emissions trading pilot policy encourages green innovation through “cost constraint” and “technology incentive” [40]. The “cost constraint” refers to the market pricing of enterprises’ carbon emissions after the implementation of the carbon emissions trading pilot policy to eliminate the negative externalities of enterprises and thus achieve the effect of green innovation. “Technology incentives” refer to the effect of implementing a carbon emissions trading pilot policy to reduce environmental externalities and thus increase the expected benefits of green technology innovation activities by enterprises. In terms of regional perspectives, existing studies suggest that a carbon emissions trading pilot policy can promote regional green innovation. Innovation input, capital factor allocation, and technological progress are the main mechanisms of action [41]. Therefore, it can be argued that carbon emissions trading pilot policies promote green innovation, both from an “enterprise” and “region” perspective. Based on endogenous growth theory, innovation can improve the basic quality of workers and improve the management system of enterprises, thus promoting the upgrading of the industrial structure. Based on the above analysis, this study proposes the following hypothesis:
H2b.
The carbon emissions trading pilot policy will influence industrial structure upgrades through green innovation.
3.2.3. Carbon Emissions Trading Pilot Policy Influences Industrial Structure Upgrade through Logistics Development
The rapid development of the modern logistics industry is accompanied by huge consumption of energy, and the high pollution and other phenomena in the process of logistics development are mostly due to the unsound environmental regulation system, lax government supervision, and ineffective policy implementation. Focusing on controlling the total carbon emissions of the logistics industry is conducive to changing the status quo of high carbon emissions in China. The implementation of the carbon emissions trading pilot policy will stimulate carbon emission reduction in the supply chain, significantly improve the green total factor productivity of the logistics industry by means of technological upgrading, reduce logistics costs, improve supply chain performance, and promote logistics development [42]. Further exploring the impact of logistics development on upgrading industrial structure, existing studies have concluded that logistics development can promote industrial structure upgrading mainly through three dimensions: innovation-driven, intelligent logistics, and logistics talent development. In terms of innovation-driven, Zhang took the prefecture-level cities under Fujian Province as the research object and found that the improvement of the regional logistics development level can drive the growth of innovation environment elements, which in turn drives the structural upgrade of secondary and tertiary industries [43]. In terms of intelligent logistics, the prosperity of the digital economy has created opportunities for the development of intelligent logistics. Jiang and Zhang argued that the development of the digital economy will increase the degree of integration of logistics and digital technology, as well as the degree of innovation in the logistics industry itself, reducing the resource consumption of the logistics industry itself [44]. This can ultimately improve the scale of development of the industry and increase industrial performance. In terms of logistics talent development, with the development of the logistics industry, senior logistics talents with rich experience and a global strategic vision can be fully cultivated and emerge continuously. This will benefit the development of integrated logistics, including logistics finance, logistics consulting, and supply chain optimization required for the development of industrial clusters, thus promoting the upgrading of the industrial structure [45]. Based on the above analysis, this study proposes the following hypothesis:
H2c.
The carbon emissions trading pilot policy will influence industrial structure upgrades through logistics development.
The above influence mechanisms and assumptions are detailed in Figure 4.
4. Materials and Methods
4.1. Model Construction
4.1.1. Baseline Model Setting
To study the impact of the carbon emissions trading pilot policy on industrial structure upgrading, this study treats the carbon emissions trading pilot policy as a quasi-natural experiment and uses a multi-period DID (Difference in Difference) model to explore the impact of the carbon emissions trading pilot policy on industrial structure upgrading. DID is an econometric method used to analyze the causal relationship between variables, allowing for a valid assessment of policy effects and avoiding certain endogeneity problems in the model [46]. The baseline model for this study is set as follows:
where represents the high industrial structure of the city in year ; represents the rationalization of the industrial structure of the city in year . is the product of treat and time, treat is the individual dummy variable, time is the time dummy variable, represents a series of control variables, represents urban fixed effects, represents time fixed effects, is the random error term.
4.1.2. Mechanism Test Model Setting
To test the previous hypotheses H2a–H2c, this study draws on Baron and Kenny to construct the following model for mechanism testing [47]:
When (1) the core explanatory variable has a significant effect on the explanatory variable . (2) The core explanatory variable has a significant effect on the mediating variable . (3) The core explanatory variable and the mediating variable have significant effects on the explanatory variable , it can be concluded that the core explanatory variable finally significantly affects the explanatory variable through the path of significantly affecting the mediating variable .
4.2. Variable Selection
In this paper, panel data from 280 prefecture-level cities from 2006–2019 are selected for empirical testing. The research data are obtained from the China Statistical Yearbook, China Environmental Statistical Yearbook, and China Urban Statistical Yearbook. Among them, Shenzhen, Tianjin, Shanghai, Guangdong, Beijing, Hubei, and Chongqing cities and Fujian Province opened their carbon emissions trading markets in 2013, 2014, and 2016. The study is subdivided to the prefecture-level city level, and the average interpolation method is used for some of the missing data, resulting in 3640 sample data collected from 280 prefecture-level cities from 2006–2019 (see Table 2). The data processing software for this paper is Excel and Stata 16.0.
4.2.1. Variable Selection
The study mainly draws on Gao et al. and Dai et al. and uses two dimensions of industrial structure heightening and industrial structure rationalization to measure industrial structure upgrading [48,49]. Industrial structure heightening refers to the process of gradually changing the center of gravity of the industrial structure from primary industry to secondary industry and tertiary industry, and its distinctive feature is the continuous decrease in the proportion of primary industry. The study uses the ratio between the output value of the tertiary sector and the output value of the secondary sector to measure the level of industrial structure heightening. Industrial structure rationalization refers to the process of rationalizing the allocation of production factors by adjusting the unreasonable industrial structure to improve economic efficiency and thus promote the coordinated development of each industry. The study uses the industrial structure Thayer index to measure the level of rationalization of industrial structure. The Thiel index can reflect the output value structure of the three major industries and the employment structure of people. Its calculation formula is as follows:
where denotes the industry, represents the output value, is the number of employed people, and denotes the productivity level per unit of output value. According to classical economic theory, when the productivity level of each industry tends to be the same, the economy reaches equilibrium. Therefore, the more the Thiel index tends to zero, the more the economy tends to be in equilibrium, the more the various sectors of the national economy tend to develop in a coordinated manner, and the closer the industrial structure is to rationalization.
4.2.2. Explanatory Variables
The core explanatory variable in this paper is whether the city is a pilot city for carbon emissions trading, i.e., the dummy variable in this paper, which is expressed as = ×. is a regional dummy variable. A value of 1 indicates that the city is a pilot city for carbon trading, while a value of 0 indicates that the city is not a pilot city for carbon trading. is a time dummy variable that takes the value of 0 before the year of policy implementation and 1 after the year of implementation. China promulgated relevant documents on the carbon emissions trading pilot policy in 2011, and the carbon emissions trading pilot policy in Shenzhen was officially launched in June 2013, so the time virtual of Shenzhen was taken at the beginning of 2013. Beijing, Tianjin, Shanghai, and Guangdong Province successively launched their carbon emissions trading pilot policies in the second half of 2013, and the time dummy variables for these four provinces and cities are taken as 1 in 2014 and thereafter because of the lag in the implementation of the policies starting at the end of the year. For Hubei and Chongqing provinces, the time dummy variable is also taken to be 1 in 2014 and beyond. Fujian province is the last batch of provinces and cities to implement the carbon emissions trading pilot policy, and the policy implementation year is 2016, so its time dummy variable is taken as 1 after 2016.
4.2.3. Control Variables
To explore the net impact of the carbon emissions trading pilot policy on the optimization of industrial structure, it is necessary to control for a series of other factors that may affect the upgrading of industrial structure. The control variables in this paper are selected as follows.
(1) Level of economic development (gdp): The gross regional product is used to measure the level of regional economic development. (2) Government fiscal expenditures (gov): Local general public budget expenditures are used to measure regional government fiscal expenditures. (3) Foreign investment level (fdi): The number of foreign-invested enterprises above the scale of the city is used to measure the level of foreign investment in the region. (4) Science and technology expenditure (rd1): measured using the ratio of science and technology expenditure to the regional GDP. (5) Population development rate (urb): The natural population growth rate is used to measure the regional population development rate. (6) Degree of openness to the outside world (open): the ratio of the number of foreign-invested enterprises above the scale to the number of domestic-invested enterprises above the scale is used to measure the degree of openness of the region. (7) Infrastructure development (c_road): The city’s road passenger volume is used to measure the level of regional infrastructure development. (8) Fixed asset investment (tz): The ratio of completed real estate development investment to regional GDP is used to measure regional fixed asset investment. (9) Human capital stock (rlzb): The ratio of the number of general undergraduate students to the city’s total population at the end of the year is used to reflect the level of human capital in the city.
4.2.4. Mechanism Variables
In conjunction with the previous analysis, the mechanism variables of this paper are selected as follows: (1) Consumption upgrade (rjxfp): the expansion of the consumer demand of the residents promotes the continuous expansion of the market scale, and the producers continuously adjust the production scale and product type according to the changes in the consumer’s consumption tendency, thus promoting the adjustment of the industrial structure. The study uses the total retail sales of consumer goods per capita of residents to express. (2) Green innovation (czfq1): Green innovation is a collective term for technological innovation that promotes environmental protection, energy conservation, and emission reduction, and it can promote the upgrading of industrial structure by transforming old industries and creating new ones. The study uses the number of green patents per capita in prefecture-level cities to measure the degree of green innovation of enterprises. (3) Logistics development (huoyun): The modern logistics industry is one of the comprehensive and pillar industries of the national economy, and the development of the logistics industry has a strong industrial correlation and driving effect. The study uses road freight volume to measure logistics development.
5. Results
5.1. Parallel Trend Test
The prerequisite assumption to be satisfied using the DID model is that the experimental and control groups must have the same trend of change before being subjected to the treatment, i.e., a parallel trend test is required before using the DID model. The multi-period DID model differs from the traditional DID model in that it is not possible to use a fixed time as a critical point because the time of policy implementation is not unique. Referring to Beck et al. [50], this paper divides the time axis into 7 periods before and 4 periods after the policy implementation, takes the policy implementation period as the critical point, and tests whether it is consistent with the parallel trend by averaging the treatment effects of the periods before and after the policy implementation. The results are shown in Figure 5. The results in Figure 5 show that the regression coefficient of before1–before7 is not significant and fluctuates around 0 before the policy is implemented. After the implementation of the policy, the coefficients of after1–after4 show a decreasing pattern, and the coefficient value of before4 is significantly negative, while its confidence interval does not contain 0. This indicates that the model established in the study passes the parallel trend test and that there is a lag in the effect of the policy.
5.2. Baseline Analysis
Table 3 reports the basic regression results for the impact of the carbon emissions trading pilot policy on upgrading industrial structure. Columns (1) and (3) are the results of the regressions of the carbon emissions trading pilot policy on the rationalization of industrial structure and the heightening of industrial structure, respectively, without adding any control variables. Columns (2) and (4) are the regression results of the carbon trading pilot policy on industrial structure rationalization and industrial structure heightening, respectively, after adding the control variables.
Columns (1) and (2) in Table 3 report the impact of the carbon emissions trading pilot policy on the rationalization of industrial structure. The regression results from columns (1) and (2) show that the estimated coefficient of the core explanatory variable is −0.1463 and is significantly negative at the 1% level when no control variables are included. After adding a series of control variables, the estimated coefficient of changes to −0.0747, and the absolute value of the coefficient decreases but remains significantly positive at the 1% level. It can be found that the coefficient value of is significantly negative at the 1% level with or without the inclusion of control variables, which indicates that the implementation of the carbon emissions trading pilot policy significantly promotes the rationalization of industrial structure.
Columns (3) and (4) in Table 3 report the impact of the carbon emissions trading pilot policy on the heightening of the industrial structure. The regression results in columns (3) and (4) show that the estimated coefficient of the core explanatory variable is 0.1634 and is significantly positive at the 5% level when no control variables are included. With the addition of a series of control variables, the estimated coefficient and significance of are reduced but still significantly positive at the 10% level, with a coefficient value of 0.0178. It can be found that the coefficient value of is significantly positive with or without the inclusion of control variables, which indicates that the implementation of the carbon emissions trading pilot policy significantly promotes the level of urban industrial structure heightening.
5.3. Robustness Tests
To ensure the reliability of the regression results, this paper uses the following four methods to test the robustness of the carbon emissions trading pilot policy on industrial structure upgrading: excluding the possible interference of other policies, excluding the interference of outliers, the PSM-DID method, and the placebo test. Due to the limited space of the article, only the regression results with industrial structure rationalization as the explanatory variable are presented, and the robustness test results of carbon emissions trading pilot on industrial structure heightening are prepared.
5.3.1. Excluding the Possible Interference of Other Policies
The sample period of this study is 2006–2019, during which the Chinese government also introduced the pilot policies of “smart city” and “innovative city,” which can significantly improve the innovation capacity of cities and thus promote the upgrading of industrial structure. To exclude the potential interference of these policies on the results of this paper, the dummy variables of “smart city” and “innovative city” pilot policies are included in the model and regressed separately. The results are shown in columns (1) and (2) of Table 4. The absolute value of the coefficient of , although slightly lower, is still significantly negative at the 1% level, indicating that the results of this study are robust.
5.3.2. Excluding the Interference of Outliers
In order to exclude outliers from the sample, the study uses tailoring and regression at the 2% level. As shown by the regression results in column (3) in Table 4, the value of the term coefficient is −0.095, and the absolute value of the coefficient has increased and is still significantly negative at the 1% level. This indicates that after excluding outliers, the effect of policy implementation on industrial structure upgrading still exists, and the results of this study are robust.
5.3.3. PSM-DID Method
Although DID can isolate the net effect of low-carbon pilot city policies on upgrading the industrial structure, errors in the sample selection process are inevitable. To avoid the effect of randomness on the model results, the study introduces propensity score matching (PSM) methods. According to Equations (1) and (7), the control variables are used as covariates, and whether it is a pilot city for carbon emissions trading is used as an explanatory variable for logit regression. After propensity score matching values are obtained, the city with the closest propensity score match is used as the control group. The results of the equilibrium test prove that there are no significant systematic differences between the covariates of the two groups after matching, and the study is suitable for the PSM-DID method. Column (4) in Table 4 shows the regression results of the DID model after propensity score matching, and it can be found that the regression coefficients of are all significant and close to those of the multi-period DID model, indicating that the results of this study are robust.
5.3.4. Placebo Test
Considering that there may be other unobservable factors affecting the industrial structure upgrade that lead to significant differences between the experimental and control groups, a placebo test is used in this study to exclude potential confounding by such factors. This is done as follows: randomize the treatment group, randomly sample the treatment group variables a certain number of times and regress them 1000 times, and observe whether the kernel density plots of the randomized coefficients or observations are concentrated around 0 and whether they deviate significantly from their true values. Figure 6 shows that the coefficient shows a normal distribution around 0 after 1000 randomly selected samples of data, proving that the study passed the placebo test and that the study findings are reliable.
5.4. Heterogeneity Tests
5.4.1. City Scale Heterogeneity
There are large differences in population size among different cities in China, which may lead to differences in the degree of factor occupation and economic development levels among cities. Consequently, the promotional effect of carbon emissions trading pilot policies on industrial structure upgrading varies. In this study, according to the national city size classification standard, the sample is divided into four subsamples of small and medium-sized cities, Type I large cities, Type II large cities, and mega cities for the heterogeneity analysis of city size with reference to the Notice on Adjustment of City Size Classification Standard issued by the State Council in 2014. The regression results are shown in Table 5.
Columns (1)–(4) of Table 5 mainly report the impact of the implementation of the carbon emissions trading pilot policy on the rationalization of the industrial structure under four city sizes. Based on the results in Table 5, it is clear that the carbon emissions trading pilot policy has a significant positive contribution to the rationalization of the industrial structure of Type I and Type II large cities, while the contribution to small- and medium-sized cities and mega cities is not significant. Columns (5)–(8) in Table 5 report the impact of the carbon emissions trading pilot policy on the heightened industrial structure for the four city sizes. The results show that the carbon emissions trading pilot policy has a significant positive contribution to the heightened industrial structure of Type I large cities, while the contribution of other sized cities is not significant. This may be because the larger the city, the more obvious the agglomeration effect. The lower pollution control cost per unit and high revenue from environmental regulation in agglomeration areas, the more attractive it is for industrial agglomeration. This can promote technological innovation and industrial structure upgrading, so the impact of carbon emissions trading pilot policy on industrial structure upgrading in large cities is more significant. For mega-cities with a resident population of more than 5 million, the environmental pollution and other “urban diseases” that accompany population clustering can lead to inefficient urban governance. At the same time, the regional coordination mechanism and cross-regional governance mechanism between mega-cities and neighboring cities have not been fully established, which restricts technology diffusion and resource sharing between regions, resulting in the carbon emissions trading pilot policy being hindered in promoting industrial structure upgrading.
5.4.2. Urban Geographic Heterogeneity
China’s vast territory and the development of large differences between regions, resulting in the stage of economic development and industrial structure layout, show obvious regional differences. Based on the combined geographic location and economic development level, the study divides the cities in the sample into eastern, central, and western cities to explore urban geographic heterogeneity. Columns (1) to (3) in Table 6 show the regression results of the impact of carbon emissions trading pilot policies on the level of the industrial structure rationalization in east, central, and west cities, respectively. It can be found that the coefficient of is significantly positive at the 10% level, with a coefficient value of 0.087 in the eastern city subsample, which indicates that the pilot policy has a suppressive effect on industrial structure rationalization in the eastern region. In the subsample of central cities, the coefficient of is significantly negative at the 1% level, with a coefficient value of −0.138, which indicates that the pilot policy has promoted the industrial structure of central cities to rationalize their development. The coefficient of is positive and insignificant in the subsample of western cities, indicating that the pilot policy of the carbon emissions trading has no significant impact on the rational development of the industrial structure in the western region. At the same time, the demand for environmental management is stronger in the eastern region, and pollution-intensive industries usually choose to move to areas with lax environmental policies when they are under the pressure of high environmental protection costs, which increases the replacement cost of factors and is not conducive to the optimal allocation of resources between industries, thus inhibiting the rationalization level of the industrial structure in the eastern region. In contrast, the central region is densely populated, rich in natural resources, well-developed infrastructure, and low labor costs, which attracts industries from the eastern region to shift; thus, the carbon emissions trading pilot policy significantly promotes the rationalization of industrial structure in the central region.
5.4.3. Urban Resource Endowment Heterogeneity
Resource-based cities are cities with mining and processing of natural resources, such as minerals, as their leading industry, and their own industrial structure is very different from that of non-resource-based cities. Therefore, the impact of carbon emissions trading pilot policies on upgrading industrial structure may differ in cities with different resource endowments. This study explores resource endowment heterogeneity by dividing the sample into a resource-based city subsample and a non-resource-based city subsample based on the National Sustainable Development Plan for Resource-based Cities (2013–2020). The regression results are shown in Table 7. Columns (1) and (2) in Table 7 report the regression results of the pilot policy on industrial structure rationalization. It can be seen that the effects of the carbon emissions trading pilot policy on both resource-based and non-resource-based cities are significantly negative at the 5% level, with coefficient values of −0.1023 and −0.0596, respectively, indicating that the environmental regulation policy can significantly promote the rational allocation of production factors within industries in resource-based and non-resource-based cities, and the coordinated development among industries and sectors of the national economy within the region.
Columns (3) and (4) in Table 7 report the results of the pilot policy on the heightening of the industrial structure. It can be found that the policy coefficient of the pilot policy for resource-based cities is not significant, and the policy coefficient for non-resource-based cities is significantly positive at the 5% level, with a coefficient value of 0.0207. This shows that the pilot policy has a significant promotional effect on the development of highly structured industries, and the promotional effect on resource-based cities is not obvious.
5.5. Mechanism Tests
Based on the previous hypotheses H2a to H2c, the study further tests whether the carbon emissions trading pilot policy will have an impact on the industrial structure through three paths: promoting consumption upgrading, green innovation, and logistics development. Table 8 reports the results of the mechanism test of the carbon emissions trading pilot policy on the rationalization of industrial structure. In terms of consumption upgrading, the results from column (1) show that the regression coefficient of the pilot policy on consumption upgrading, although positive, is not significant, so we further conduct a Sobel test, and the test results are presented in Table 9. A z-value of 1.674 and a p-value of 0.094 can be found, which indicates that the Sobel test has passed, and the implementation of the pilot policy significantly and positively promotes consumption upgrading. We further include the consumption upgrade variable and run the regression, and the results are presented in column (2). The coefficient of the core explanatory variable is significantly negative at the same time as the coefficient of consumption upgrading, proving that consumption upgrading is the mechanism by which the carbon emissions trading pilot policy affects the rationalization of industrial structure.
In terms of green innovation, the results of column (3) in Table 8 show that the coefficient of the pilot policy is significantly positive at the 1% level, with a coefficient value of 0.277, indicating that the implementation of the pilot policy can significantly promote green innovation. The results in column (4) show that the coefficient of the core explanatory variable is significantly negative at the 1% level at the same time as the coefficient of the consumption upgrade, indicating that green innovation is the mechanism by which the carbon emissions trading pilot policy affects the development of the industrial structure in the direction of rationalization.
In terms of logistics development, the results of columns (5) and (6) in Table 8 show that the coefficient of the pilot policy is significantly positive at the 1% level, with a coefficient value of 0.180, which indicates that the implementation of the pilot policy can significantly promote logistics development. The results in column (4) show that the coefficient of the core explanatory variable is simultaneously and significantly negative at least at the 5% level with the coefficient of the consumption upgrade, indicating that logistics development is the mechanism by which the carbon emissions trading pilot policy influences the industrial structure toward rationalization.
Table 10 reports the results of the mechanism test of the carbon emissions trading pilot policy on the heightening of the industrial structure. In terms of consumption upgrading, the results in columns (1) and (2) show that the coefficients of the policy variable , although positive, are not significant, so consumption upgrading is not a mechanism by which pilot policy influences the development of a heightened industrial structure.
In terms of green innovation, the results of columns (3) and (4) in Table 10 show that the coefficient of the pilot policy is significantly positive at the 1% level, with a coefficient value of 0.277, indicating that the implementation of the pilot policy can significantly promote green innovation. The results in column (4) show that the coefficients of the core explanatory variables and green innovation are both significantly positive at the 10% level, indicating that green innovation plays a partial mediating effect in the development of a carbon trading pilot policies, affecting the industrial structure in the direction of heightening.
In terms of logistics development, according to the results of columns (5) and (6) in Table 10, while the coefficient of pilot policy in column (5) is significantly positive at the 1% level, the coefficients of pilot policy as well as logistics development in column (6) are not significant. This suggests that although the carbon emissions trading pilot policy can significantly promote logistics development, logistics development is not the mechanism by which the pilot policy influences the development of a highly structured industry.
6. Discussion
The results in Table 3 show that the positive promotion effect of carbon emissions trading pilot policy on industrial structure upgrading is proved both based on the perspective of the industrial organization rationalization and industrial structure heightening, which also verifies hypothesis H1 of this paper. This may be because the carbon emissions trading policy serves as a turning point for entities to bridge the energy-efficiency gap. It encourages enterprises to upgrade through technological transformation in order to achieve energy savings and emission reduction by means of market incentives, helping them to improve the energy efficiency gap of their facilities, thereby facilitating the shift of technology and capital to low-carbon development areas and promoting the industrial structure upgrading toward low energy consumption and high value-added, thus promoting a highly developed industrial structure [51]. At the same time, technological innovation and institutional improvement caused by environmental regulation policy have led to the reasonable distribution of factors among industries and the coordinated development among industries, which in turn has promoted the rationalization of the industrial structure.
The results in Table 5 may be because the larger the city, the more pronounced the agglomeration effect. The lower pollution control cost per unit and high revenue from environmental regulation in agglomeration areas, the more attractive it is for industrial agglomeration. This can promote technological innovation and industrial structure upgrading, so the impact of carbon emissions trading pilot policy on industrial structure upgrading in large cities is more significant. For megacities with a resident population of more than 5 million, the environmental pollution and other “urban diseases” that accompany population clustering can lead to inefficient urban governance. At the same time, the regional coordination mechanism and cross-regional governance mechanism between mega-cities and neighboring cities have not been fully established, which restricts technology diffusion and resource sharing between regions, resulting in the carbon emissions trading pilot policy being hindered in promoting industrial structure upgrading.
The results in Table 6 may be due to the earlier economic start in the eastern part of China. Relying on regional advantages and preferential policies, the process of economic development has been smoother, and there is no need to sacrifice the environment excessively because of economic development. Meanwhile, for the western region, its weak economic foundation and late start of development have led to the lack of characteristic dominant industries, so the low level of repeated construction has led to the convergence of the industrial structure in the western region and the low correlation between enterprises, and the implementation of the carbon emissions trading pilot policy has not had a significant impact on the rational development of the industrial structure in the western region.
The results in Table 7 may be due to resource-based cities being prone to the “resource curse” phenomenon compared with non-resource-based cities, and the resource-dependent path makes it more difficult to promote the upgrading of leading industries to tertiary industries in resource-based cities, so the pilot policy cannot play the expected role of promotion.
The results in Table 8 may be due to the following reasons: (1) In terms of the consumer upgrade path, the possible reason is that the scale effect under green consumption can bring more development opportunities to the industry and promote the investment and production of the industry, so the resource factors are reasonably allocated and the industries get coordinated development through mutual cooperation; thus, the carbon emissions trading pilot policy drives the rationalization of industrial structure through consumption upgrading. (2) In terms of green innovation, the possible reason is that the implementation of the carbon emissions trading pilot policy will not have a negative impact on the economic performance of enterprises [52]. Under the incentive of carbon emissions trading pilot policy, industrial enterprises have combined the specific processes of pollution emission management and cost savings to obtain more benefits, thus promoting the rationalization of industrial structure. (3) In terms of logistics development, the possible reason is that due to the fact that the pilot policy of carbon emissions trading stipulates carbon emission quotas for each enterprise upstream and downstream of the logistics industry chain, thus promoting logistics enterprises to improve resource utilization efficiency, strengthen the adoption of new energy materials and the development of new technologies, and also promote the development of other industries related to the logistics industry, such as the development of artificial intelligence and other new industries as well as the coordination, which can better improve the efficiency of resource allocation and thus significantly promote the rationalization of industrial structure.
The results in Table 10 may be due to the following reasons: (1) In terms of the consumer upgrade path, the reason may be because although the carbon emissions trading pilot policy has promoted consumption upgrading in China as a whole, the economic development level and income level in the central and western regions are still low, and labor mo-bility to higher levels is still weak, so that consumption upgrading cannot influence the development of a heightened industrial structure. Combined with the results of the previous analysis, hypothesis H2a partially holds. (2) In terms of green innovation, this may be due to the fact that the specialization and socialization of industrial production will be promoted by the carbon emissions trading pilot policy, which in turn will lead to the transformation of each region from labor-intensive and polluting industries to green industries and promote the transformation of the industrial structure to a high level. Combined with the results of the previous analysis, hypothesis H2b is fully valid. (3) In terms of logistics development, this may be because the development of the logistics industry needs a large amount of labor, and although the development of the artificial intelligence industry can promote the transformation of the logistics industry to a high degree, the infrastructure in the central and western regions is more backward, the lack of financial and technological support, the logistics sharing platform is not perfect, and the allocation of logistics networks and regional economic resources is unreasonable. Therefore, promoting the development of the artificial intelligence logistics industry in the central and western regions temporarily faces greater obstacles. The development of the logistics industry in the central and western regions still needs a large amount of labor force as support, and logistics development does not promote the development of industrial structure in the direction of heightened. Combined with the results of the previous analysis, hypothesis H2c partially holds.
7. Conclusions
This study analyzes the data of 280 prefecture-level cities in China from 2006–2019 by constructing a multi-period DID model and a mechanism test model to study the impact of the carbon emissions trading pilot policy on industrial structure upgrading. The following conclusions are obtained.
First, the implementation of the carbon emissions trading pilot policy significantly promotes the rationalization of industrial structure and the development of a high industrial structure. The empirical study shows that the carbon emissions trading pilot policy can effectively promote rationalization, as well as the heightened development of industrial structure, which proves hypothesis H1. Meanwhile, this study verifies the robustness of the empirical results through four robustness tests: excluding possible interference from other policies, the reduced tail method, propensity score matching, and the placebo test.
Second, there are significant heterogeneous characteristics of the impact of carbon emissions trading pilot policies on upgrading the industrial structure. The rationalization and highly developed industrial structure of carbon emissions trading pilot policies are heterogeneous in three aspects: city size, geographical location, and nature resource endowment. The carbon emissions trading pilot policy has a significant promotion effect on the highly structured industrial structure of Type I large cities, and the promotion effect on other sized cities is not obvious. In terms of geographical location, the pilot policy significantly inhibits the rationalization of industrial structure in the eastern region, significantly promotes the rationalization and heightened development of industrial structure in the central region, and does not have a significant effect on the western region. In terms of resource endowment, the carbon emissions trading pilot policy makes a significant contribution to the rationalization of industrial structure development in both resource-based cities and non-resource-based cities, and the impact on the highly developed industrial structure in non-resource-based cities is more significant.
Third, there are multiple paths of action for the carbon emissions trading pilot policy on upgrading industrial structures. The carbon emissions trading pilot policy can promote the rationalization of industrial structure through three paths: consumption upgrading, green innovation, and logistics development. In terms of industrial structure heightening, carbon emissions trading pilot policy can only promote industrial structure heightening development through the green development path, while upgrading consumption and logistics development fail to form the path of the pilot policy’s effect on industrial structure.
Author Contributions
Z.Z. and S.Z. conceptualized the study; Z.Z. and S.Z. was responsible for data curation; Z.Z., S.Z., S.W. and C.Y. provided model; Z.Z and C.Y. were responsible for formal analysis; Z.Z. and S.Z. prepared the original draft; Z.Z. and T.W. reviewed and edited the manuscript. All authors have read and agreed to the published version of the manuscript.
Funding
This work was supported by the National Social Science Foundation of China (Grand No. 19FJYB043) and supported by the Project of Innovation Strategy Research Program of Fujian Province (Grand No. 2021R0019).
Institutional Review Board Statement
Not Applicable.
Data Availability Statement
The processed data required to reproduce these findings cannot be shared at this time as the data also form part of an ongoing study.
Acknowledgments
Sincere thanks to the reviewers for their work.
Conflicts of Interest
The authors declare no conflict of interest.
References
- Preston, B.J. The Influence of the Paris Agreement on Climate Litigation: Legal Obligations and Norms (Part I). J. Environ. Law 2020, 33, 1–32. [Google Scholar]
- Feng, T.T.; Gong, X.L.; Yang, Y.S. Carbon Emission Trading Market in China: Operation Mechanism and Development Path. Ekoloji 2019, 28, 3417–3427. [Google Scholar]
- Lv, M.; Bai, M. Evaluation of China’s carbon emission trading policy from corporate innovation. Financ. Res. Lett. 2020, 39, 101565. [Google Scholar]
- Zhang, P.; He, J.; Hong, X.; Zhang, W.; Qin, C.; Pang, B.; Li, Y.; Liu, Y. Carbon sources/sinks analysis of land use changes in China based on data envelopment analysis. J. Clean. Prod. 2018, 204, 702–711. [Google Scholar]
- Hass, J.E.; Dales, J.H. Pollution, Property & Prices. Adm. Sci. Q. 1969, 14, 306. [Google Scholar]
- Hu, Y.; Ren, S.; Wang, Y.; Chen, X. Can carbon emission trading scheme achieve energy conservation and emission reduction? Evidence from the industrial sector in China. Energy Econ. 2020, 85, 104590. [Google Scholar]
- Jun, S.H.; Kim, J.Y.; Oh, H. Evaluating the impact of the KETS on GHG reduction in the first phase. Environ. Econ. Policy Stud. 2021, 23, 613–638. [Google Scholar]
- Gray, W.B.; Shadbegian, R.J. Plant vintage, technology, and environmental regulation. J. Environ. Econ. Manag. 2003, 46, 384–402. [Google Scholar]
- Rogge, K.S.; Schneider, M.; Hoffmann, V.H. The innovation impact of EU emission trading: Findings of company case studies in the German power sector. Ecol. Econ. 2011, 70, 513–523. [Google Scholar]
- Yang, L.; Li, F.; Zhang, X. Chinese companies’ awareness and perceptions of the Emissions Trading Scheme (ETS): Evidence from a national survey in China. Energy Policy 2016, 98, 254–265. [Google Scholar]
- Calel, R.; Antoine, D. Environmental Policy and Directed Technological Change: Evidence from the European Carbon Market. Rev. Econ. Stat. 2012, 98, 551–574. [Google Scholar]
- Adam, B.J.; Karen, P. Environmental Regulation and Innovation: A Panel Data Study. Rev. Econ. Stat. 1997, 79, 610–619. [Google Scholar]
- Li, X.; Hu, Z.; Cao, J. The impact of carbon market pilots on air pollution: Evidence from China. Environ. Sci. Pollut. Res. 2021, 28, 62274–62291. [Google Scholar]
- Ai, H.; Hu, S.; Li, K.; Shao, S. Environmental regulation, total factor productivity, and enterprise duration: Evidence from China. Bus. Strategy Environ. 2020, 29, 2284–2296. [Google Scholar]
- Martin, R.M.; Muûls, L.B.; Laure, U.J.; Wagner, U.J. Industry Compensation under Relocation Risk: A Firm-Level Analysis of the EU Emissions Trading Scheme. Am. Econ. Rev. 2014, 104, 2482–2508. [Google Scholar]
- Kim, Y.; Lim, J. Treatment of indirect emissions from the power sector in Korean emissions trading system. Environ. Econ. Policy Stud. 2021, 23, 581–592. [Google Scholar]
- Cheng, Z.; Li, L.; Liu, J.; China Institute of Manufacturing Development. Industrial structure, technical progress and carbon intensity in China’s provinces. Renew. Sustain. Energy Rev. 2018, 81, 2935–3946. [Google Scholar]
- Zheng, R.; Gan, C.; Yu, D. The Industrial Structure and Institutional Effects of Economic Growth in China’s Transition Period: An Analysis Based on a Stochastic Frontier Model. China Ind. Econ. 2010, 2, 58–67. [Google Scholar]
- Shi, L. Changes of Industrial Structure and Economic Growth in Coastal Regions of China: A Threshold Panel Model Based Study. J. Coast. Res. 2020, 107, 278. [Google Scholar]
- Zhu, B.; Zhang, M.; Zhou, Y.; Wang, P.; Sheng, J.; He, K.; Wei, Y.-M.; Xie, R. Exploring the effect of industrial structure adjustment on interprovincial green development efficiency in China: A novel integrated approach. Energy Policy 2019, 134, 110946. [Google Scholar]
- Benhabib, J.; Spiegel, M.M. The Role of Human Capital in Economic Development Evidence from Aggregate Cross-country Data. J. Monet. Econ. 1994, 34, 143–173. [Google Scholar]
- Li, M.; Sun, J.J.; Zhang, T.T. A Study on the Impact of Heightened Human Capital Structure on Industrial Structure Upgrading—Based on Provincial Panel Data In China. J. Ind. Technol. Econ. 2020, 39, 72–77. [Google Scholar]
- Azadegan, A.; Wagner, S.M. Industrial Upgrading, Exploitative Innovations and Explorative Innovations. Int. J. Prod. Econ. 2011, 130, 54–65. [Google Scholar]
- Zhou, S.L.; Wang, W.G. Science Technology Innovation and Industrial Structure Upgrading. J. Manag. World 2001, 5, 70–78. [Google Scholar]
- Krugman, P. Scale Economies, Product Differentiation, and the Pattern of Trade. J. Public Adm. Res. Theory 2008, 18, 321–344. [Google Scholar]
- Liu, G.; Fang, H.; Gong, X.; Wang, F. Inclusive finance, industrial structure upgrading and farmers’ income: Empirical analysis based on provincial panel data in China. PLoS ONE 2021, 16, e0258860. [Google Scholar]
- Wang, S.L.; Chen, F.W.; Liao, B.; Zhang, C. Foreign Trade, FDI and the Upgrading of Regional Industrial Structure in China: Based on Spatial Econometric Model. Sustainability 2020, 12, 815. [Google Scholar]
- Tianlan, F.U.; Yang, C. Market reorientation and industrial upgrading trajectories: Evidence from the export-oriented furniture industry in the Pearl River Delta. Geogr. Res. 2018, 37, 1460–1474. [Google Scholar]
- Markusen, J.R.; Morey, E.R.; Olewiler, N.D. Environmental Policy when Market Structure and Plant Locations Are Endogenous. J. Environ. Econ. Manag. 1993, 24, 69–86. [Google Scholar]
- Liu, W.; Tong, J.; Yue, X. How Does Environmental Regulation Affect Industrial Transformation? A Study Based on the Methodology of Policy Simulation. Math. Probl. Eng. 2016, 2016, 2405624. [Google Scholar]
- Domazlicky, B.R.; Weber, W.L. Does Environmental Protection Lead to Slower Productivity Growth in the Chemical Industry? Environ. Resour. Econ. 2004, 28, 301–324. [Google Scholar]
- Yang, K.; Wang, C.; Wen, Y.; Mao, X. The Threshold Effect of Two-way FDI on Environmental Pollution Under Environmental Regulation. J. Environ. Account. Manag. 2018, 6, 115–124. [Google Scholar] [CrossRef]
- Arik, L.; Taylor, M.S. Unmasking the Pollution Haven Effect. Int. Econ. Rev. 2008, 49, 223–254. [Google Scholar]
- Song, D.Y.; Bi, D.J. The Impact of Technological Innovation on Industrial Structure Upgrading under Environmental Regulation—An Empirical Analysis Based on Panel Data of Central Cities along Yangtze River. Econ. Surv. 2022, 39, 79–87. [Google Scholar]
- Fan, Y.B.; Liu, X.G. Study on industrial structure effect of environmental regulation based on spatial substitution. China Popul. Resour. Environ. 2017, 27, 30–38. [Google Scholar]
- Mohr, R.D. Technical Change, External Economies, and the Porter Hypothesis. J. Environ. Econ. Manag. 2002, 43, 158–168. [Google Scholar] [CrossRef]
- Lai, L.; Lorne, F.; Davies, S. A reflection on the trading of pollution rights via land use exchanges and controls: Coase Theorems, Coase’s land use parable, and Schumpeterian innovations. Prog. Plan. 2018, 137, 100427. [Google Scholar]
- Li, X.F.; Li, L. Migration patterns and migrant workers’ consumption. China Agric. Econ. Rev. 2021, 13, 781–798. [Google Scholar]
- Feng, W.; Wang, L.; Gao, C. The Influence of Social Crowding on Consumers’ Preference for Green Products. Front. Psychol. 2022, 13, 832869. [Google Scholar]
- Cian, E.D.; Tavoni, M. Do technology externalities justify restrictions on emission permit trading? Resour. Energy Econ. 2012, 34, 624–646. [Google Scholar] [CrossRef]
- Zhang, W.; Li, G.; Guo, F. Does carbon emissions trading promote green technology innovation in China? Appl. Energy 2022, 315, 119012. [Google Scholar] [CrossRef]
- Wang, M.; Zhao, L.; Herty, M. Modelling carbon trading and refrigerated logistics services within a fresh food supply chain under carbon cap-and-trade regulation. Int. J. Prod. Res. 2018, 56, 4207–4225. [Google Scholar] [CrossRef]
- Zhang, X.S. Research on the Impact of Innovation Drive on Industrial Structure Upgrading—An Empirical Study Based on Inter-Municipal Data in Fujian Province. Technol. Ventur. Mon. 2020, 33, 24–30. [Google Scholar]
- Jiang, S.L.; Zhang, Z. Digital Economy Development and Industrial Upgrading in Logistics Industry—A Test Based on Innovation Mechanism. Bus. Econ. Res. 2020, 22, 84–87. [Google Scholar]
- Zhou, Q.; Zhong, S.; Shi, T.; Zhang, X. Environmental regulation and haze pollution: Neighbor-companion or neighbor-beggar? Energy Policy 2021, 151, 112183. [Google Scholar] [CrossRef]
- Wolff, H. Keep your clunker in the suburb: Low-emission zones and adoption of green vehicles. Econ. J. 2014, 124, 481–512. [Google Scholar] [CrossRef]
- Baron, R.M.; Kenny, D.A. The moderator-mediator variable distinction in social psychological research: Conceptual, strategic, and statistical considerations. J. Personal. Soc. Psychol. 1999, 51, 1173. [Google Scholar] [CrossRef]
- Gao, L.; Tian, Q.; Meng, F. The impact of green finance on industrial reasonability in China: Empirical research based on the spatial panel Durbin model. Environ. Sci. Pollut. Res. 2022. [Google Scholar] [CrossRef]
- Dai, S.; Zhang, W.; Wang, Y.; Wang, G. Examining the Impact of Regional Development Policy on Industrial Structure Upgrading: Quasi-Experimental Evidence from China. Int. J. Environ. Res. Public Health 2022, 19, 5042. [Google Scholar] [CrossRef]
- Beck, T.; Levkov, R.L. Big Bad Banks? The Winnersand Losers from Bank Deregulation in the United States. J. Financ. 2010, 65, 1637–1667. [Google Scholar] [CrossRef] [Green Version]
- Taisuke, S.; Toshi, H.A. Do regional emission trading schemes lead to carbon leakage within firms? Evidence from Japan. Energy Econ. 2021, 104, 105664. [Google Scholar]
- Tatsuya, A.; Toshi, H.A. Causal effects of the Tokyo emissions trading scheme on energy consumption and economic performance. Energy Policy 2022, 168, 113151. [Google Scholar]
Figure 1.
Global CO2 Emissions Statistics 2015–2021.

Figure 2.
Global Carbon Emissions Trading Market Size and Growth Rate 2017–2021.

Figure 3.
CO2 emissions statistics of major countries in the world, 2015–2020.

Figure 4.
Impact mechanism.

Figure 5.
Parallel trent test.

Figure 6.
Placebo test.


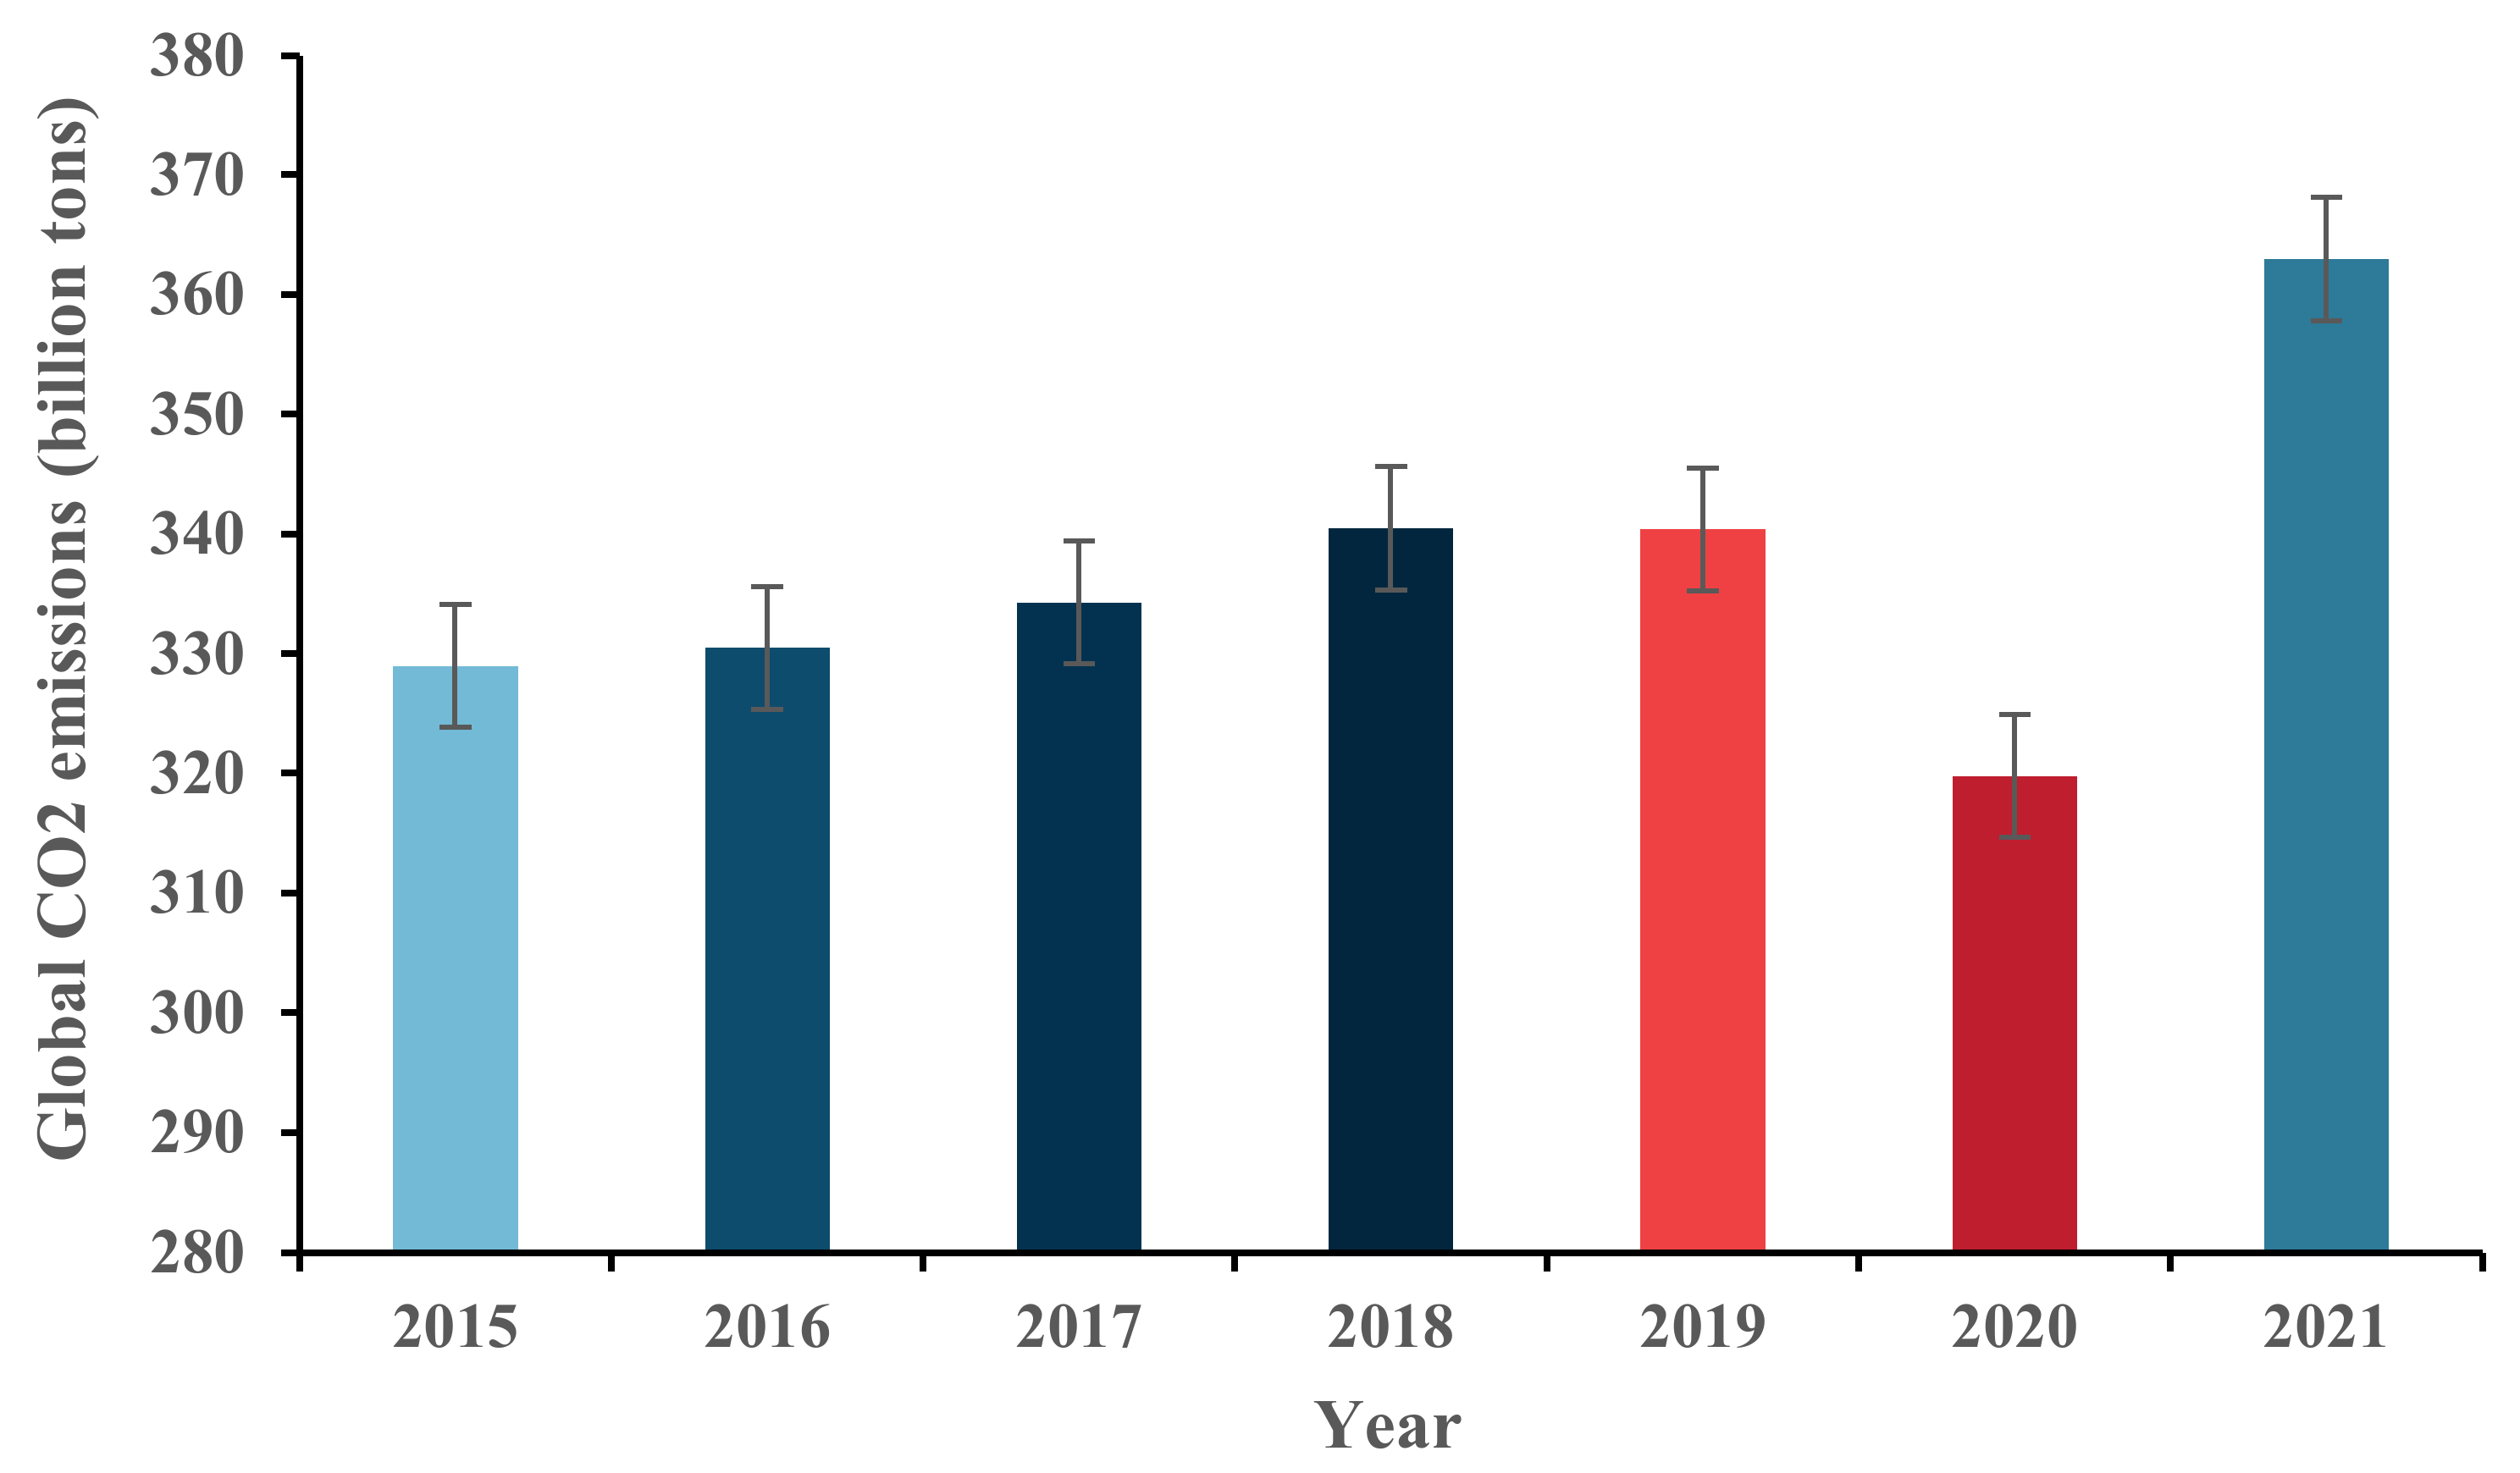
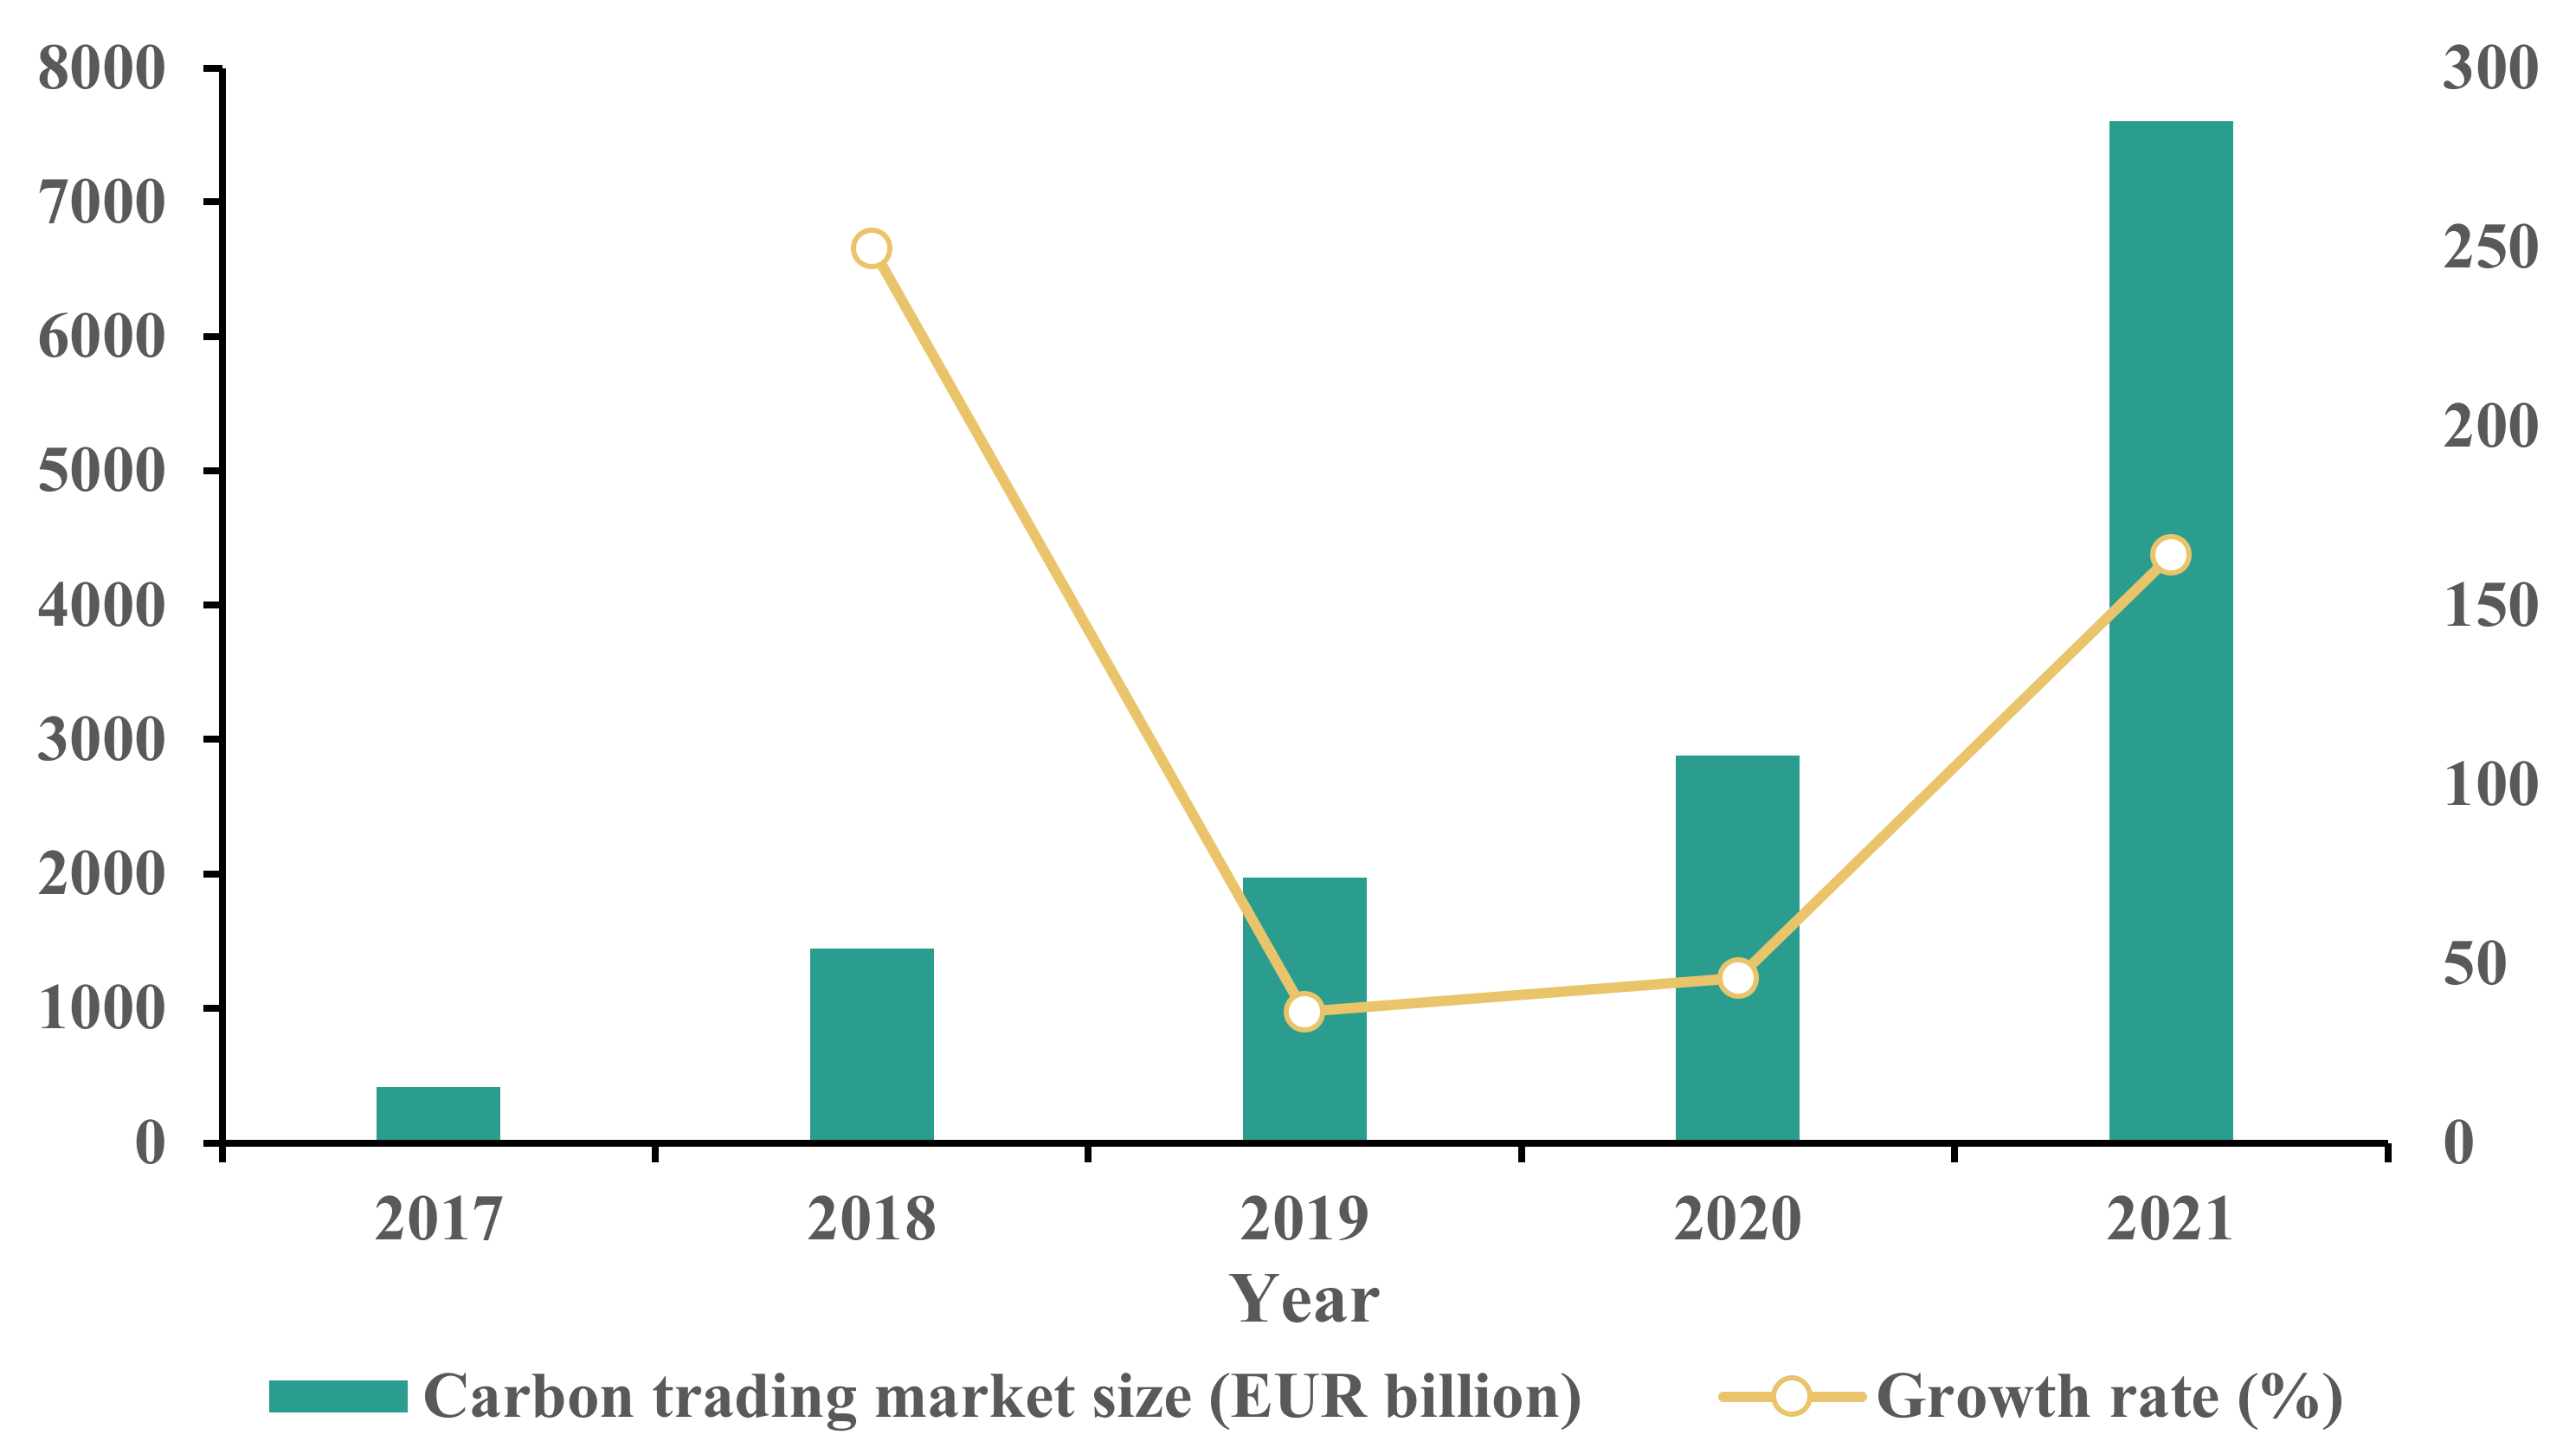
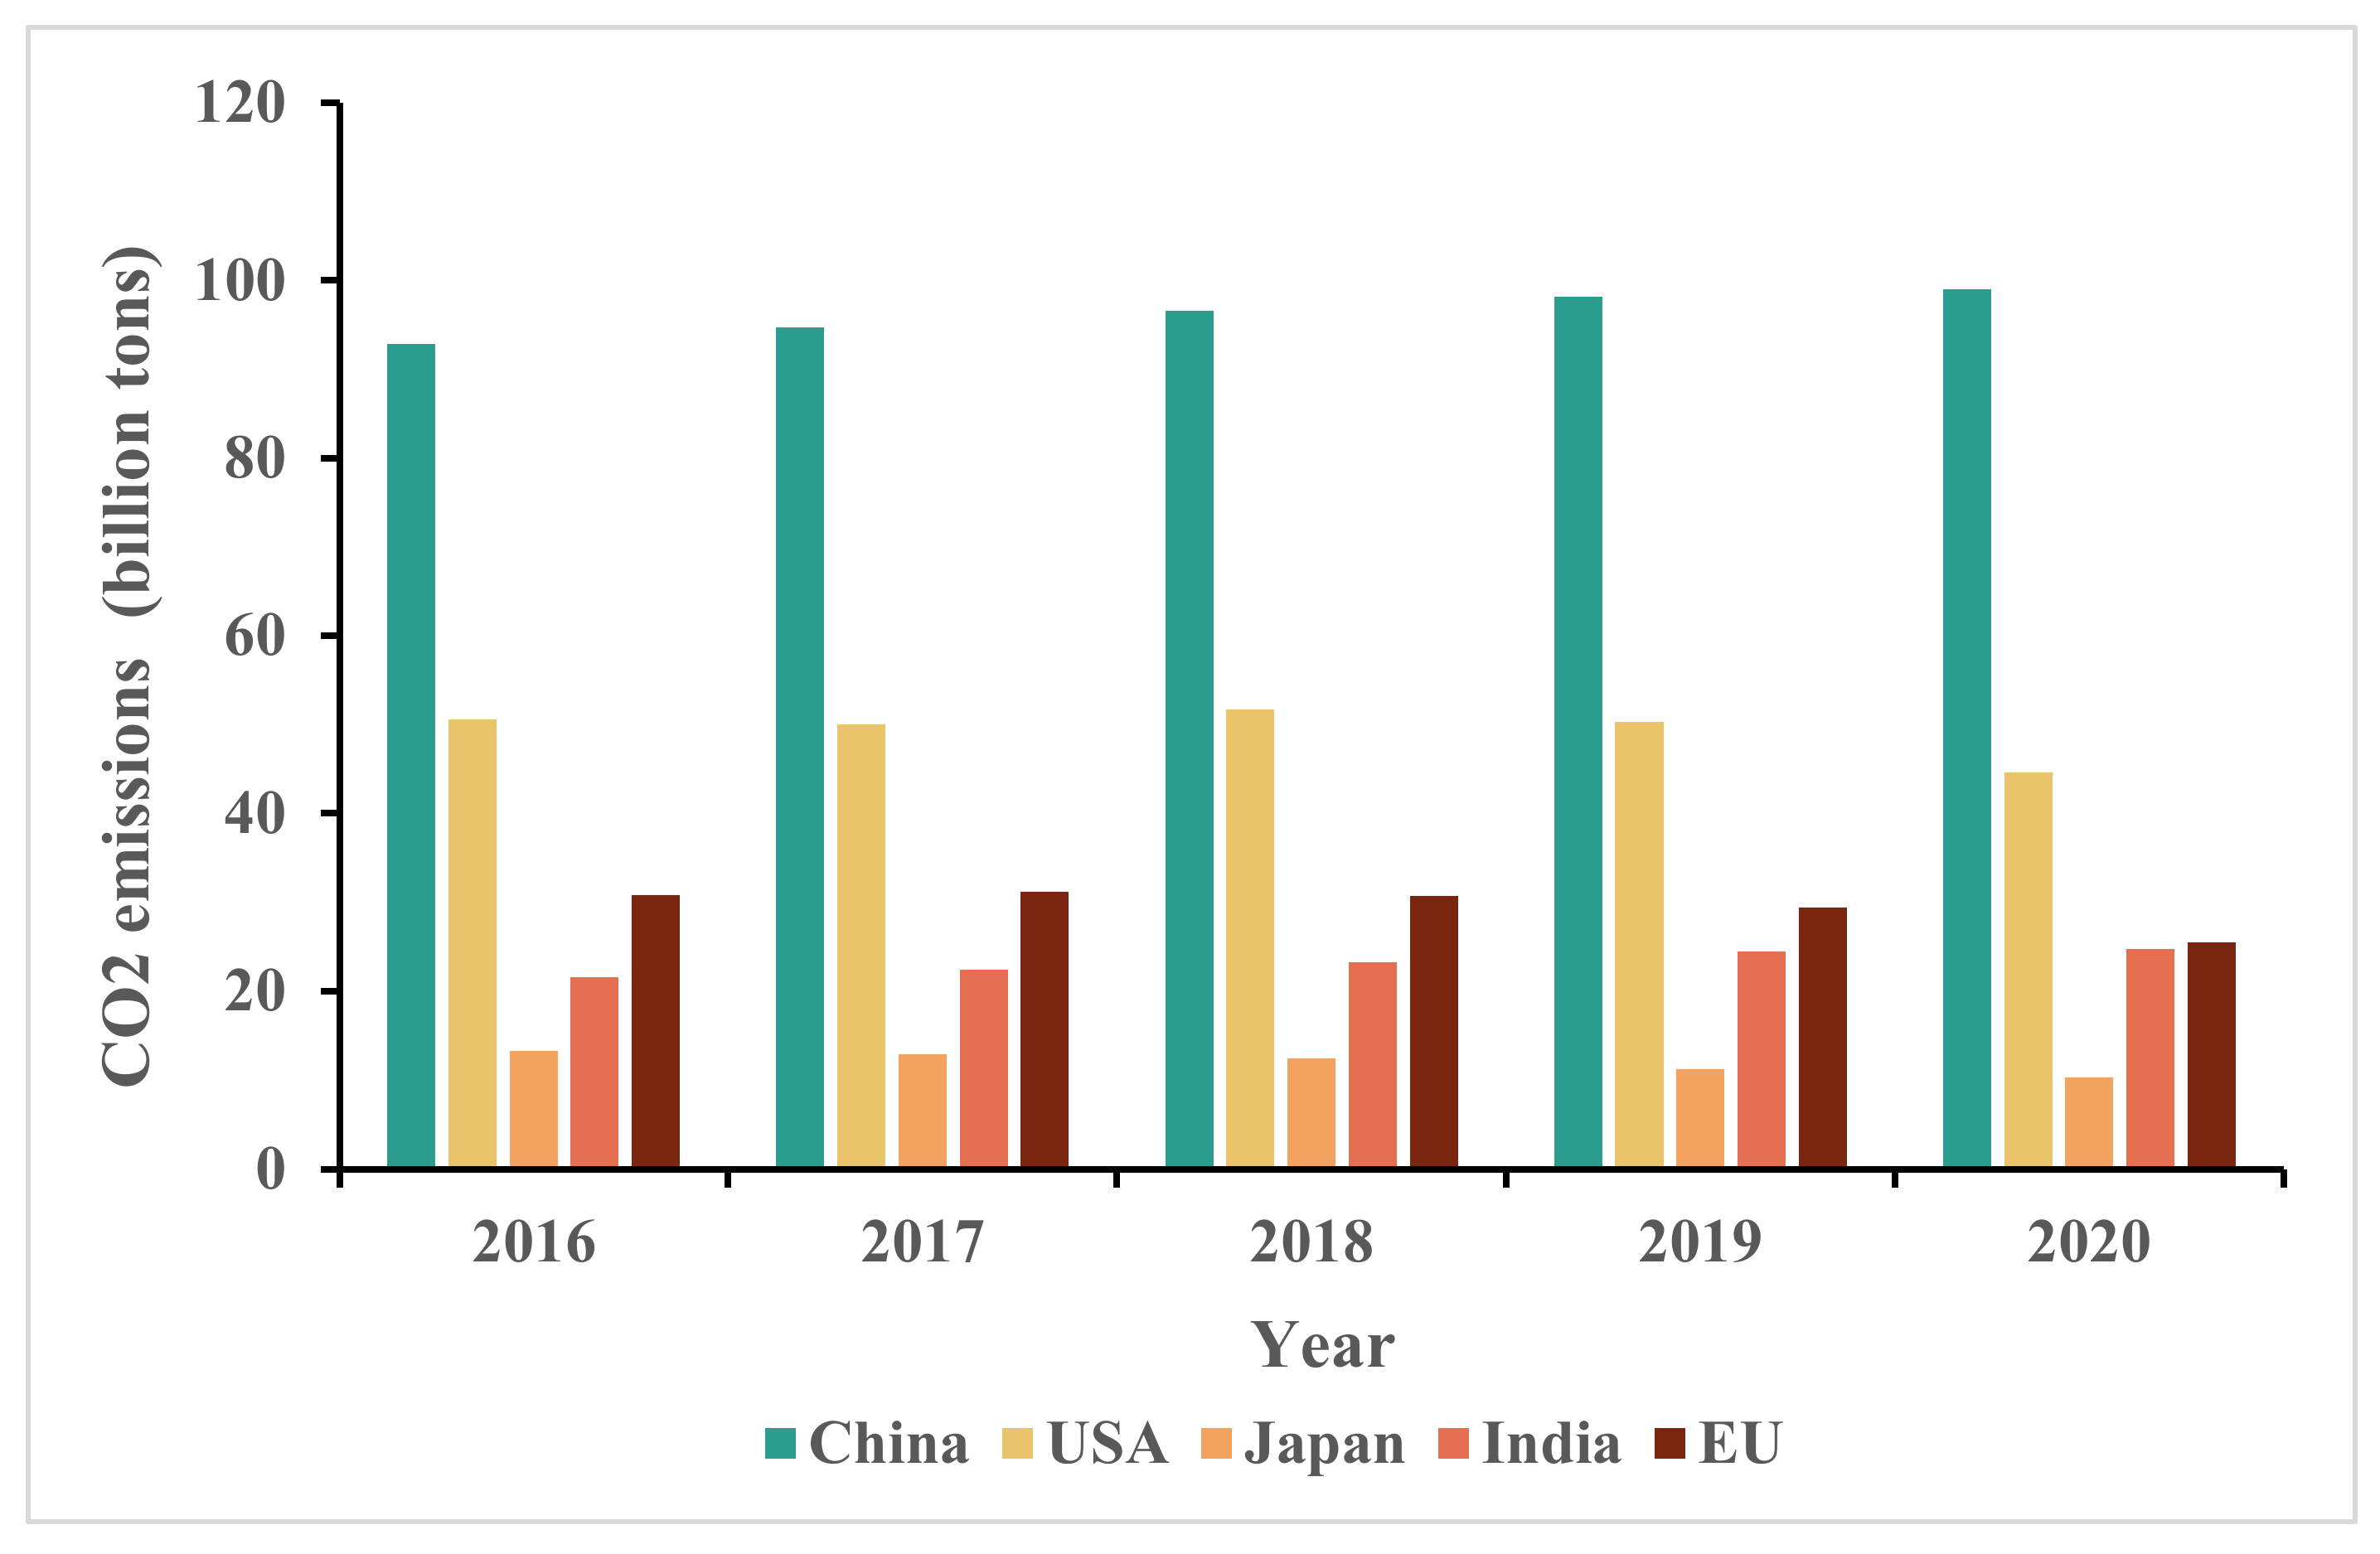
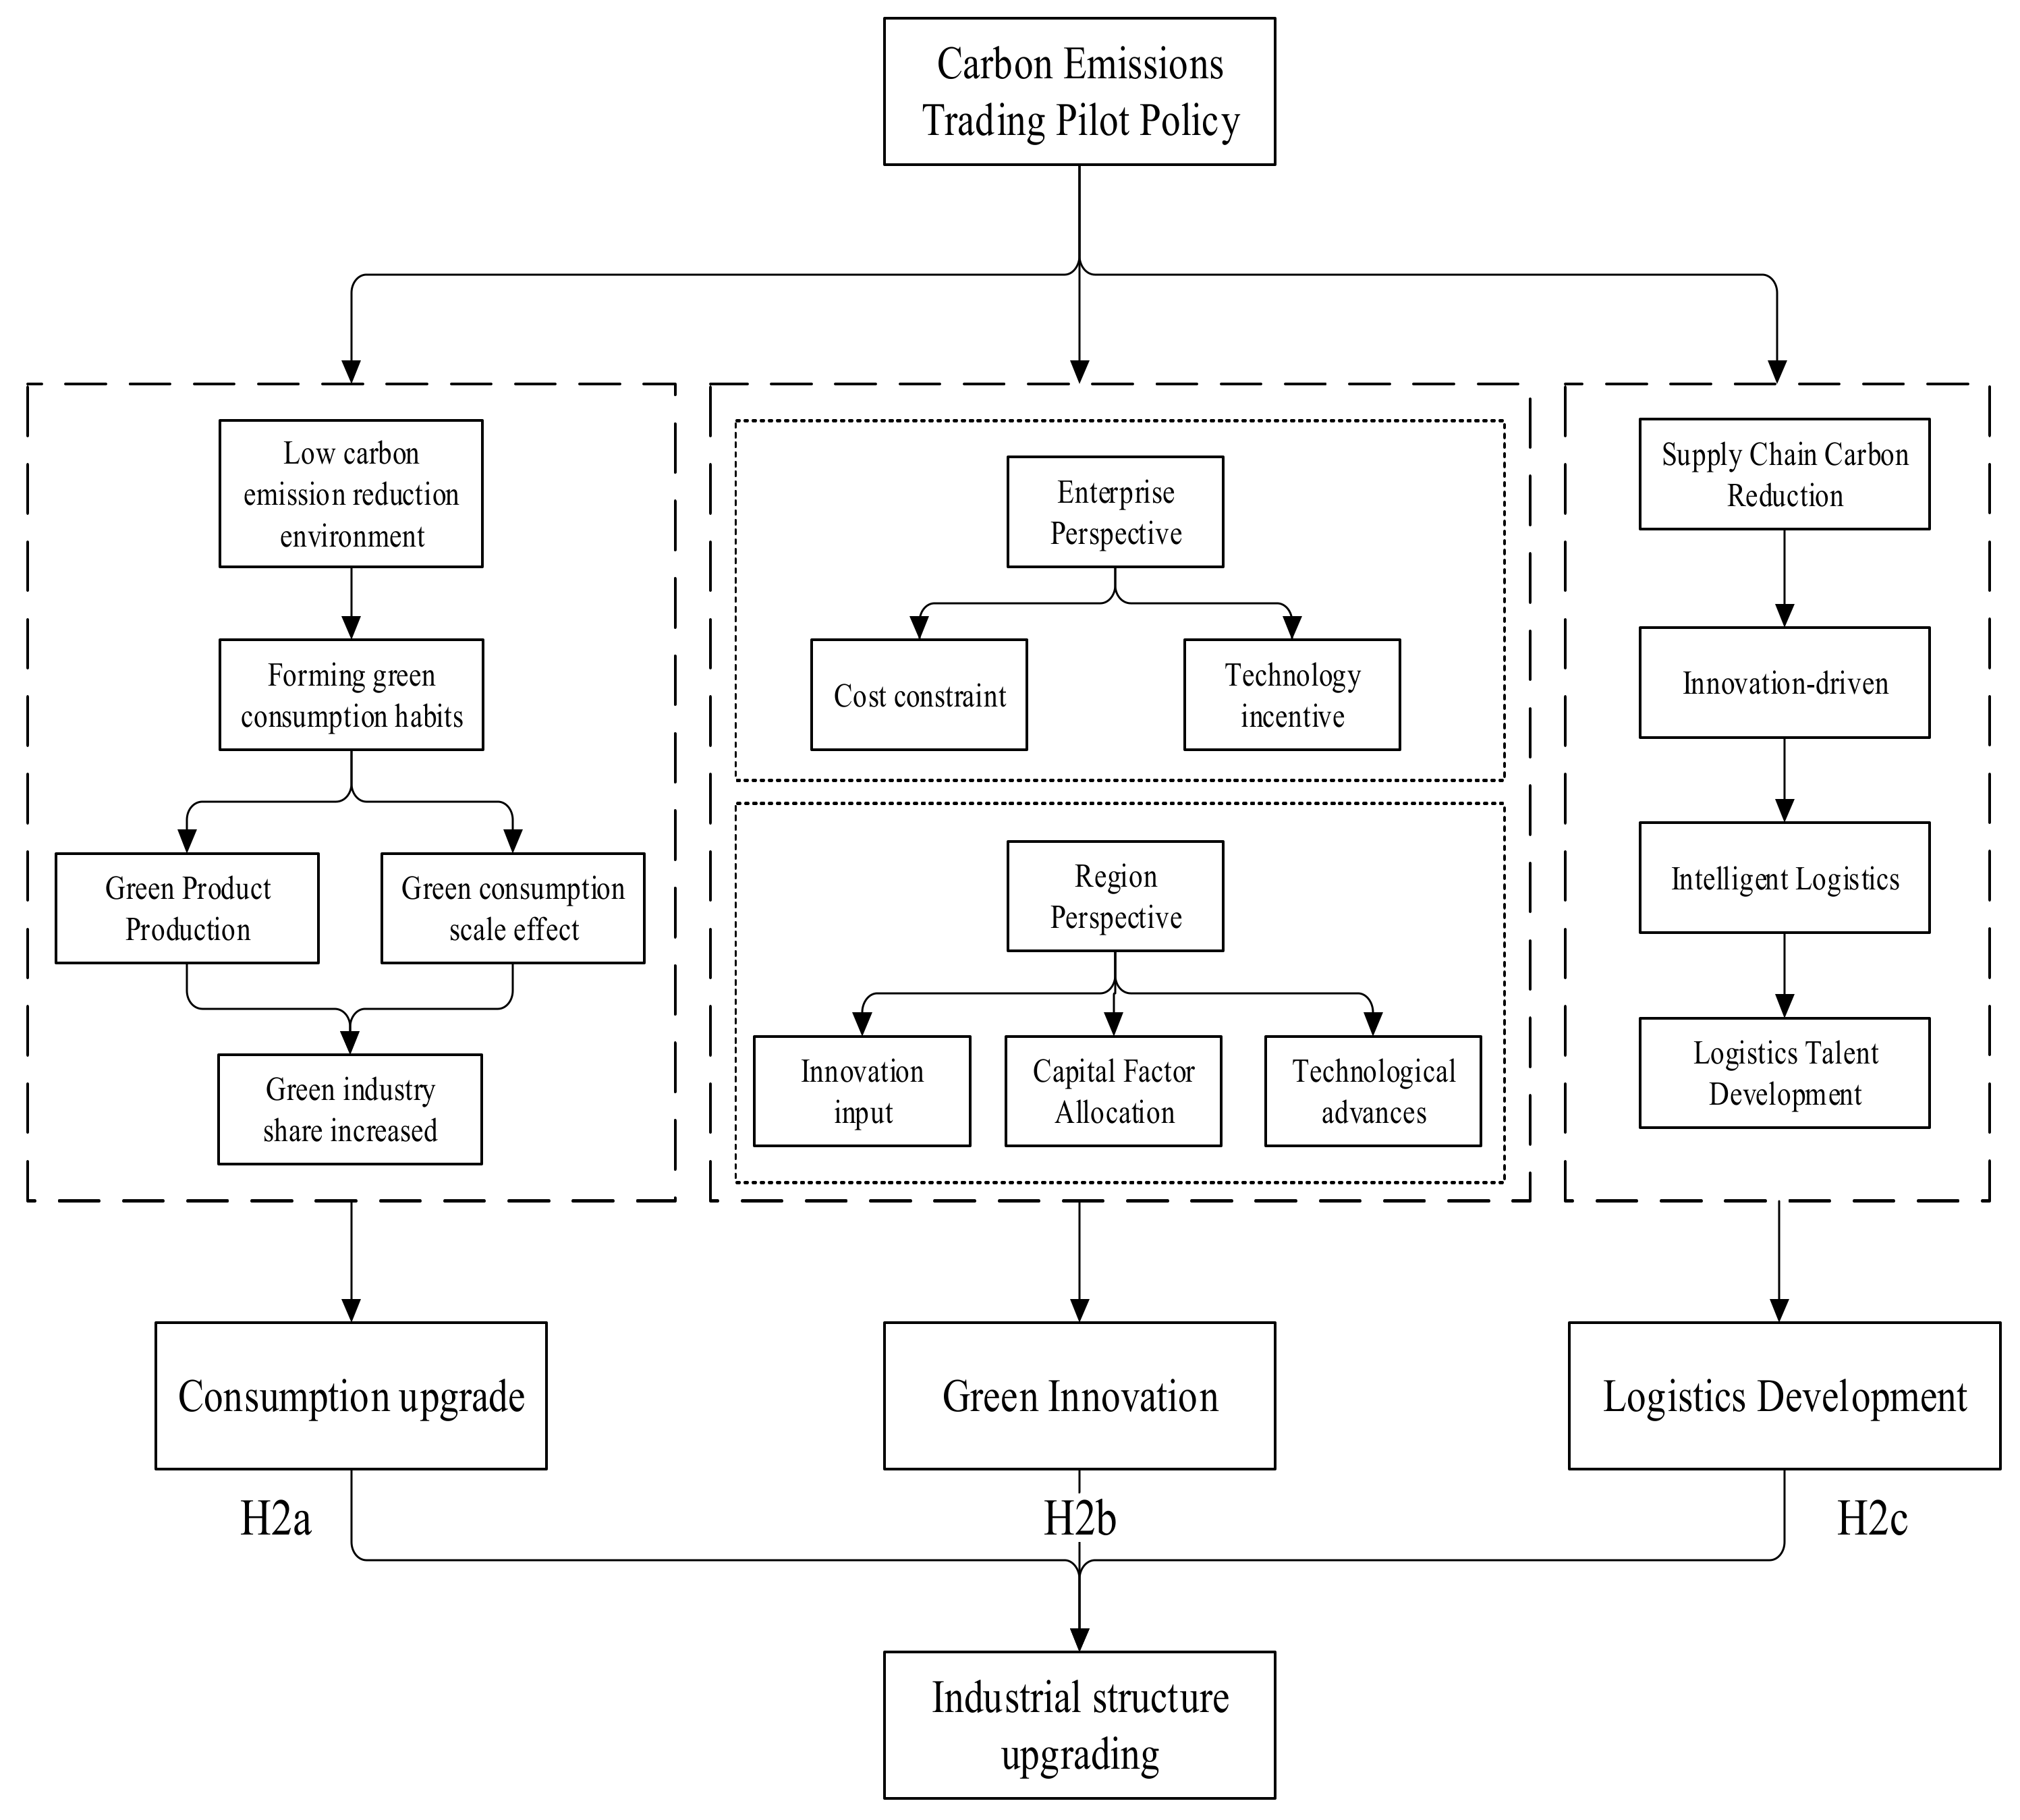
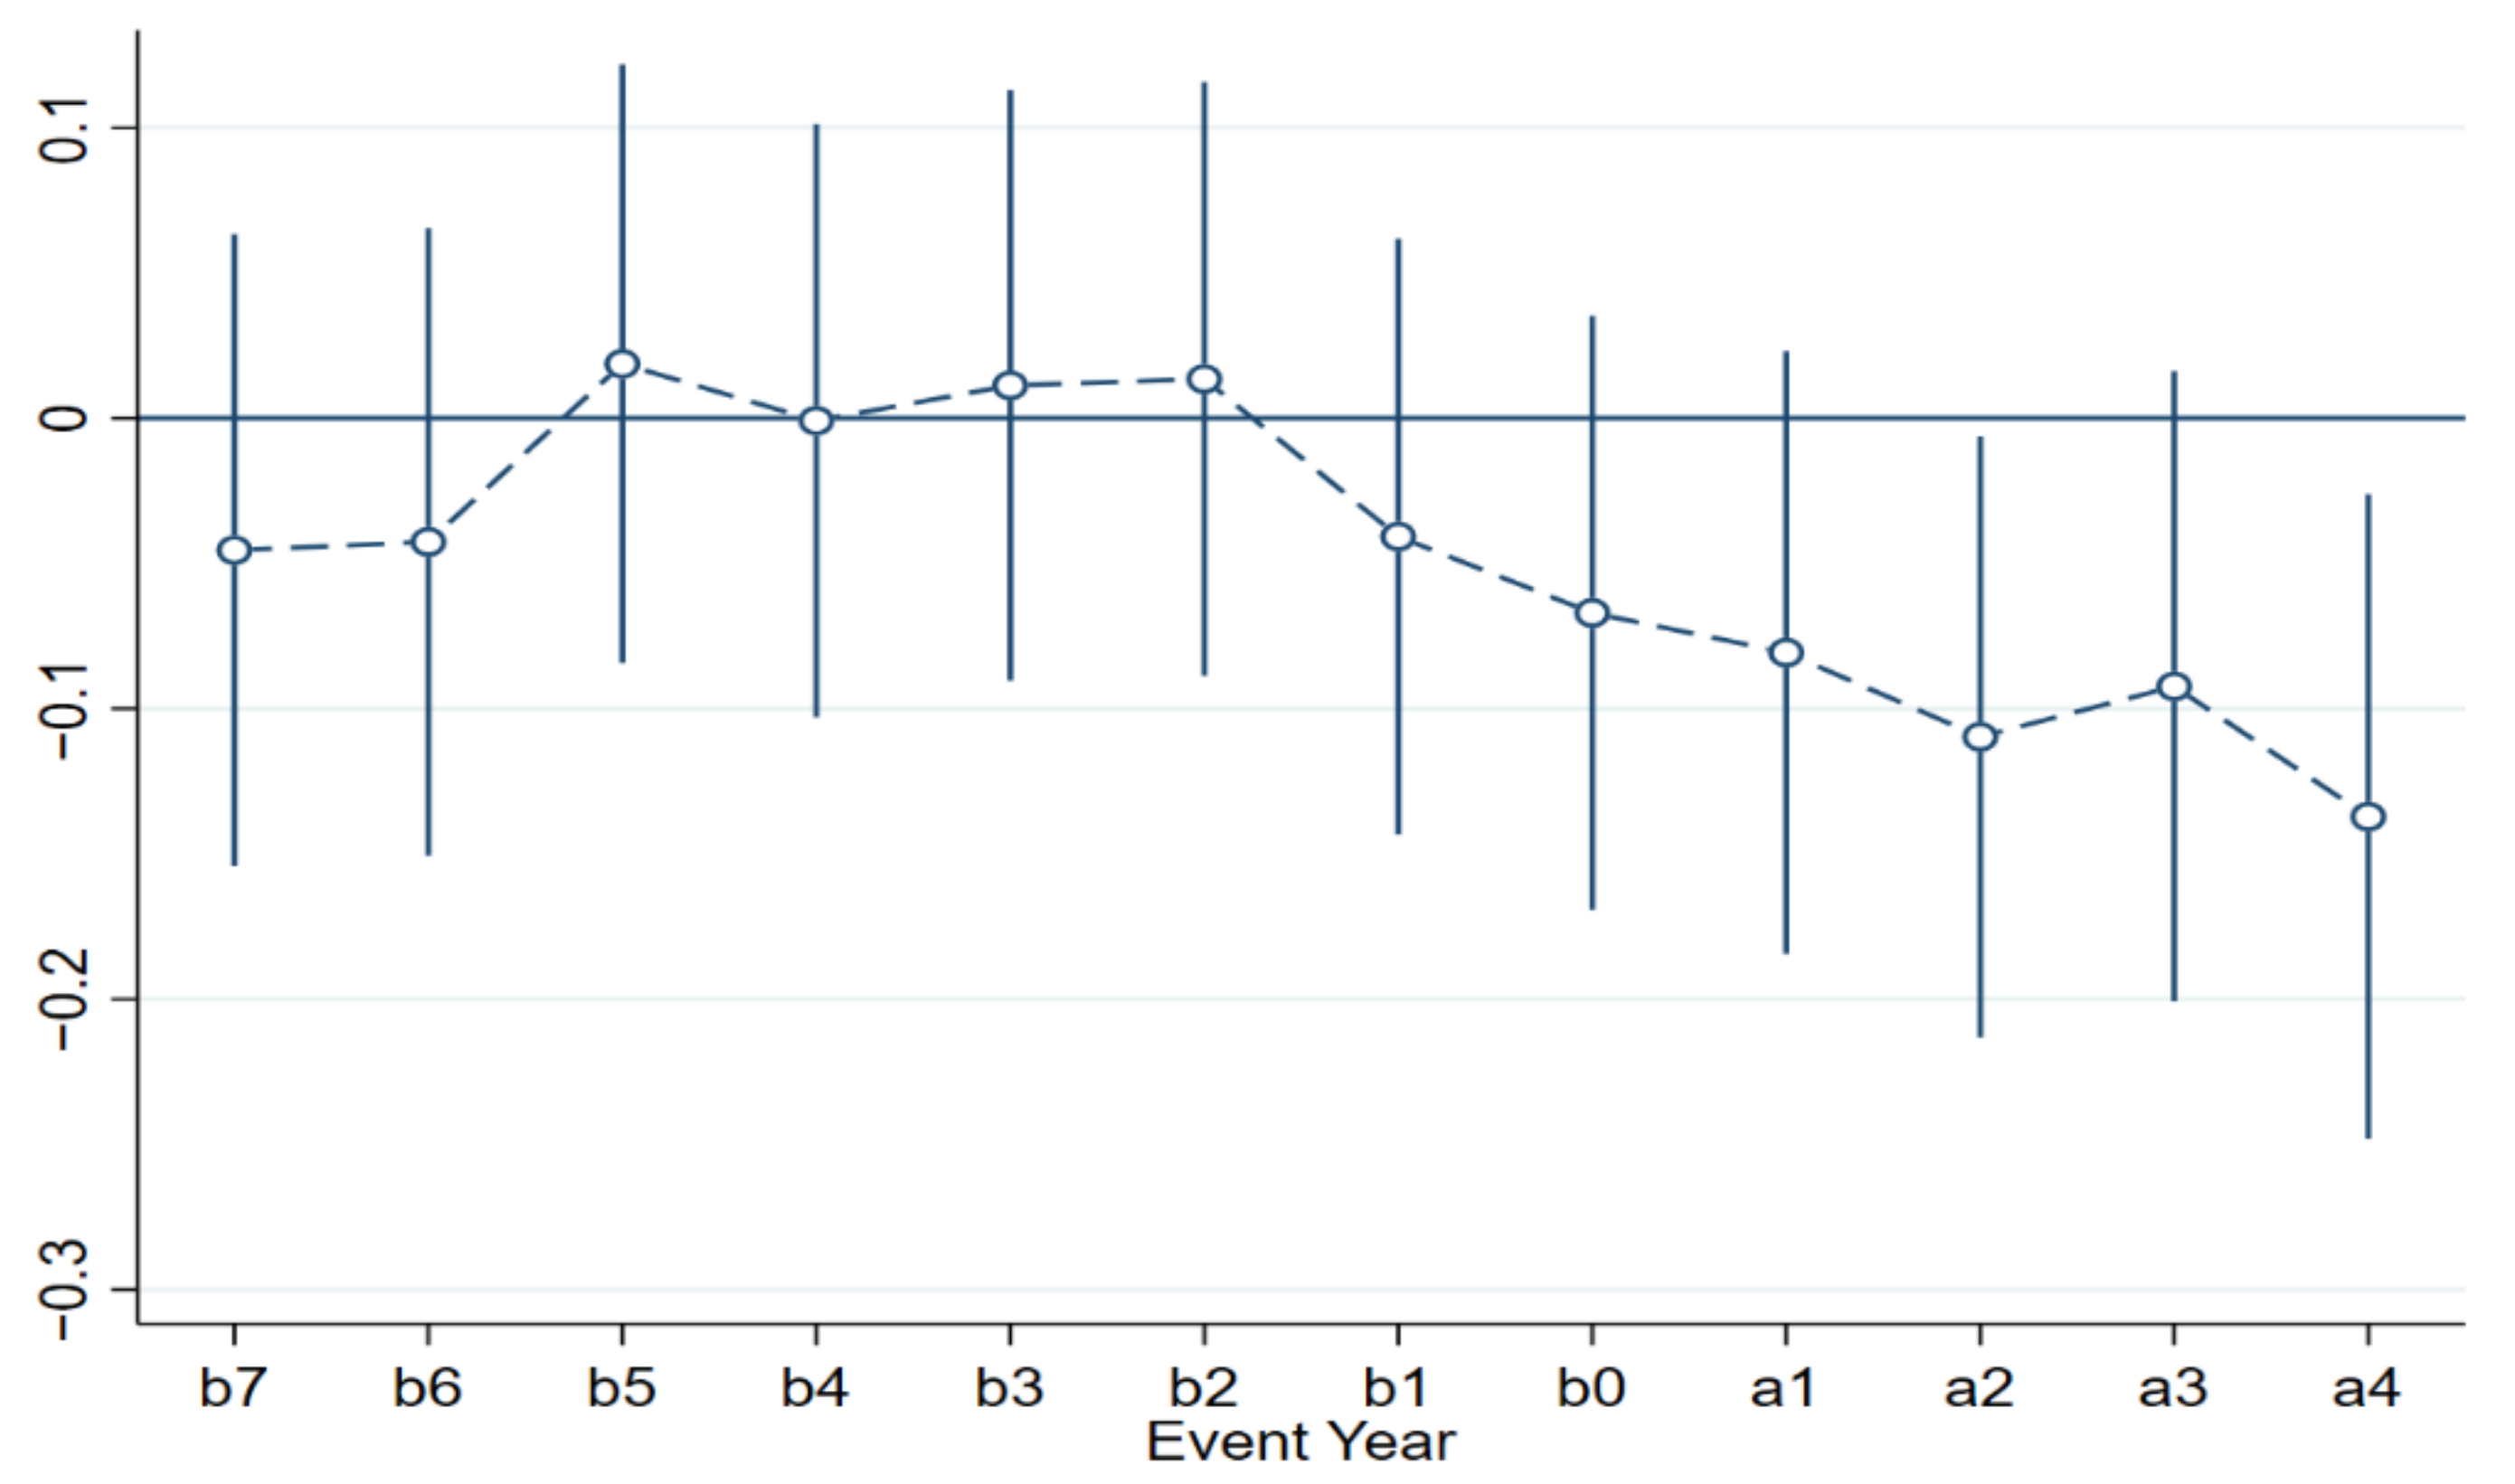
Table 1.
Overall situation of China’s carbon emissions trading pilot.
| Pilot Cities | Start-Up Time | Quota Allocation Method |
|---|---|---|
| Shenzhen | June 2013 | Free allocation + benchmarking (water, electricity and gas); free allocation + historical emissions method (other sectors); auction (at least 3%, not sector specific) |
| Beijing | November 2013 | Free allocation + benchmarking method (power sector, new entrants, heat, cement lines); free allocation + historical emissions method/historical intensity method (other sectors); auction (a small portion of carbon allowances, not industry specific) |
| Shanghai | November 2013 | Free allocation + benchmarking method (thermal power production); Free allocation + historical emissions method (airports, commercial, some industrial); Free allocation + historical intensity method (some industrial, aviation, ports, shipping and water suppliers); Auction (a small percentage of carbon allowances, not industry specific) |
| Guangdong | December 2013 | Free/auction allocation + benchmarking/historical emissions method (different methods used for certain industrial processes in covered industries; electricity free at 95%, aviation at 100%, other at 97%) |
| Tianjin | December 2013 | Free allocation + historical intensity method (thermal power, paper and construction materials); free allocation + historical emissions method (other industries); occasional auctions (a small percentage of carbon allowances, not industry-specific) |
| Hubei | February 2014 | Free allocation + benchmarking method (electricity, cement); free allocation + historical emission method (other industries) |
| Chongqing | June 2014 | Free allocation + historical emission method |
| Fujian | September 2016 | Free allocation + benchmarking method (power, cement, aluminum and other industries); free allocation + historical emissions method (other industries); auction (only auctioned once, for market price regulation). |
Table 2.
Descriptive statistics.
| Variables | Sample Size | Mean | Std, | Min | Max |
|---|---|---|---|---|---|
| P_industry | 3460 | 0.33 | 3.47 | 0.00 | 206.93 |
| H_industry | 3460 | 1.02 | 0.60 | 0.10 | 5.63 |
| gdp | 3460 | 18,900,000 | 28,500,000 | 349,527 | 327,000,000 |
| gov | 3460 | 2,795,229 | 5,140,478 | 24,375 | 83,500,000 |
| fdi | 3460 | 119.42 | 353.64 | 1.00 | 4773.00 |
| rd1 | 3460 | 0.03 | 0.04 | 0.00 | 0.79 |
| urb | 3460 | 5.96 | 5.18 | −16.77 | 46.83 |
| open | 3460 | 0.06 | 0.09 | 0.00 | 0.80 |
| c_road | 3460 | 8381.76 | 14,290.84 | 56.00 | 286,557 |
| tz | 3460 | 0.11 | 0.09 | 0.00 | 1.27 |
| rlzb | 3460 | 175.53 | 236.99 | 1.89 | 3502.18 |
Table 3.
Baseline regression results.
| Variables | Rationalization of Industrial Structure | Heightening of Industrial Structure | ||
|---|---|---|---|---|
| (1) | (2) | (3) | (4) | |
| Treat_time | −0.1463 *** | −0.0747 *** | 0.1634 ** | 0.0178 * |
| (−5.72) | (−3.01) | (2.62) | (1.72) | |
| lngdp | −0.4013 *** | −0.0391 *** | ||
| (−11.24) | (−2.63) | |||
| lngov | 0.0050 | 0.0098 | ||
| (0.21) | (1.00) | |||
| lnfdi | −0.0390 ** | −0.0035 | ||
| (−2.28) | (−0.50) | |||
| rd1 | −1.9340 *** | −0.2158 | ||
| (−5.67) | (−1.52) | |||
| urb | −0.0001 | −0.0003 | ||
| (−0.06) | (−0.67) | |||
| open | 0.4014 ** | −0.0305 | ||
| (2.20) | (−0.40) | |||
| lnc_road | 0.0147 | −0.0068 | ||
| (1.44) | (−1.60) | |||
| tz | −0.1087 | −0.0784 ** | ||
| (−1.24) | (−2.14) | |||
| rlzb | 0.0003 *** | −0.0000 | ||
| (5.12) | (−0.34) | |||
| _cons | 0.9487 *** | 7.0439 *** | 0.4580 *** | 0.8177 *** |
| (60.54) | (13.34) | (4.83) | (3.72) | |
| time fixed | Yes | Yes | Yes | Yes |
| city fixed | Yes | Yes | Yes | Yes |
| N | 3460 | 3460 | 3460 | 3460 |
| R2 | 0.2827 | 0.3090 | 0.0042 | 0.0242 |
Notes: ***, **, * indicate significant at the 1%, 5%, and 10% levels, respectively, with t-values in parentheses.
Table 4.
Robustness test results.
| Variables | Smart City | Innovative City | Tail Reduction Method | PSM-DID |
|---|---|---|---|---|
| (1) | (2) | (3) | (4) | |
| Treat_time | −0.0689 *** | −0.0688 *** | −0.0950 *** | −0.0690 ** |
| (−2.83) | (−2.82) | (−3.92) | (−2.83) | |
| _cons | 7.6840 *** | 7.6762 *** | 8.4437 *** | 7.699 *** |
| (13.90) | (13.79) | (16.26) | (14.28) | |
| smart | 0.0296 | |||
| (0.12) | ||||
| innovative | 0.0262 | |||
| (0.11) | ||||
| time fixed | Yes | Yes | Yes | Yes |
| city fixed | Yes | Yes | Yes | Yes |
| control | Yes | Yes | Yes | Yes |
| N | 3460 | 3460 | 3460 | 3460 |
| R2 | 0.3091 | 0.3091 | 0.3297 | 0.3091 |
Notes: *** and**indicate significant at the 1% and 5%levels, respectively, with t-values in parentheses.
Table 5.
Results of the city-scale heterogeneity test.
| Variables | Rationalization of Industrial Structure | Heightening of Industrial Structure | ||||||
|---|---|---|---|---|---|---|---|---|
| Small and Medium-Sized Cities | Type II Large Cities | Type I Large Cities | Mega Cities | Small and Medium-Sized Cities | Type II Large Cities | Type I Large Cities | Mega Cities | |
| (1) | (2) | (3) | (4) | (5) | (6) | (7) | (8) | |
| Treat_time | −0.1618 | −0.2851 *** | −0.0726 * | 0.0450 | 0.0091 | 0.0389 | 0.0341 ** | −0.0048 |
| (−1.18) | (−4.90) | (−1.76) | (1.33) | (0.27) | (1.15) | (2.37) | (−0.40) | |
| _cons | 7.8928 *** | 7.0358 *** | 12.6970 *** | 5.3049 *** | 0.3773 | 1.3340 ** | 1.1626 *** | 0.7508 ** |
| (4.38) | (6.21) | (12.33) | (6.22) | (0.86) | (2.01) | (3.25) | (2.46) | |
| time fixed | Yes | Yes | Yes | Yes | Yes | Yes | Yes | Yes |
| city fixed | Yes | Yes | Yes | Yes | Yes | Yes | Yes | Yes |
| control | Yes | Yes | Yes | Yes | Yes | Yes | Yes | Yes |
| N | 278 | 807 | 879 | 1204 | 278 | 809 | 880 | 1207 |
| R2 | 0.4806 | 0.3109 | 0.3949 | 0.3316 | 0.1319 | 0.0362 | 0.0948 | 0.0363 |
Notes: ***, **, * indicate significant at the 1%, 5%, and 10% levels, respectively, with t-values in parentheses.
Table 6.
Results of the city geographic location heterogeneity test.
| Variables | Rationalization of Industrial Structure | Heightening of Industrial Structure | ||||
|---|---|---|---|---|---|---|
| Eastern Cities | Central Cities | Western Cities | Eastern Cities | Central Cities | Western Cities | |
| (1) | (2) | (3) | (4) | (5) | (6) | |
| Treat_time | 0.0869 * | −0.1380 *** | 0.1688 | −0.0384 | 0.0447 *** | −0.0417 |
| (1.69) | (−4.35) | (1.19) | (−1.42) | (4.60) | (−0.60) | |
| time fixed | Yes | Yes | Yes | Yes | Yes | Yes |
| city fixed | Yes | Yes | Yes | Yes | Yes | Yes |
| control | Yes | Yes | Yes | Yes | Yes | Yes |
| N | 1101 | 1414 | 653 | 1103 | 1418 | 653 |
| R2 | 0.3593 | 0.3581 | 0.2966 | 0.0854 | 0.0691 | 0.0555 |
Notes: ***, * indicate significant at the 1% and 10% levels, respectively, with t-values in parentheses.
Table 7.
Results of the urban resource endowment heterogeneity test.
| Rationalization of Industrial Structure | Heightening of Industrial Structure | |||
|---|---|---|---|---|
| Variables | Resource-Based Cities | Non-Resource-Based Cities | Resource-Based Cities | Non-Resource-Based Cities |
| (1) | (2) | (3) | (4) | |
| Treat_time | −0.1023 ** | −0.0596 ** | −0.0011 | 0.0207 ** |
| (−1.97) | (−2.07) | (−0.04) | (2.10) | |
| time fixed | Yes | Yes | Yes | Yes |
| city fixed | Yes | Yes | Yes | Yes |
| control | Yes | Yes | Yes | Yes |
| _cons | 8.2320 *** | 6.8596 *** | 0.9738 ** | 0.9631 *** |
| (10.69) | (8.88) | (2.30) | (3.64) | |
| N | 1273 | 1895 | 1276 | 1898 |
| R2 | 0.4098 | 0.2566 | 0.0294 | 0.0317 |
Notes: *** and**indicate significant at the 1% and 5%, levels, respectively, with t-values in parentheses.
Table 8.
Industrial structure rationalization mechanism test results.
| Consumption Upgrade | Green Innovation | Logistics Develpment | ||||
|---|---|---|---|---|---|---|
| Variables | Lnrjxfp | P_Industry | Rg_ino | P_Industry | Lnhuoyun | P_Industry |
| (1) | (2) | (3) | (4) | (5) | (6) | |
| Treat_time | 0.0097 | −0.0681 *** | 0.2769 *** | −0.1020 *** | 0.1798 *** | −0.0574 ** |
| (0.47) | (−2.80) | (5.57) | (−4.09) | (4.92) | (−2.35) | |
| lnrjxfp | −0.0619 *** | |||||
| (−2.80) | ||||||
| czfq1 | −0.2937 *** | |||||
| (−3.38) | ||||||
| lnhuoyun | −0.0637 *** | |||||
| (−5.15) | ||||||
| _cons | 6.9770 *** | 8.1709 *** | 8.1709 *** | −7.9083 *** | 1.1983 | 7.7767 *** |
| (15.36) | (14.58) | (14.58) | (−6.89) | (1.48) | (14.49) | |
| N | 3460 | 3460 | 3460 | 3460 | 3460 | 3460 |
| R2 | 0.8733 | 0.3111 | 0.3111 | 0.3069 | 0.5313 | 0.3154 |
Notes: *** and ** indicate significant at the 1% and 5% levels, respectively, with t-values in parentheses.
Table 9.
Sobel test results.
| Coef | Std Err | Z | P > Z | |
|---|---|---|---|---|
| Sobel | 0.012799 | 0.007646 | 1.674 | 0.094143 |
Table 10.
Industrial structure heightening mechanism test results.
| Consumption Upgrade | Green Innovation | Logistics Develpment | ||||
|---|---|---|---|---|---|---|
| Variables | Lnrjxfp | P_Industry | Rg_ino | Lnrjxfp | P_Industry | Rg_ino |
| (1) | (2) | (3) | (4) | (5) | (6) | |
| Treat_time | 0.0097 | 0.0163 | 0.2769 *** | 0.0206 * | 0.1798 *** | 0.0155 |
| (0.47) | (1.58) | (5.57) | (1.93) | (4.92) | (1.50) | |
| lnrjxfp | −0.0088 | |||||
| (−0.93) | ||||||
| czfq1 | 0.0039 * | |||||
| (1.95) | ||||||
| lnhuoyun | 0.0036 | |||||
| (0.67) | ||||||
| _cons | 6.9770 *** | 0.9734 *** | −7.9083 *** | 1.0099 *** | 1.1983 | 0.9061 *** |
| (15.36) | (4.08) | (−6.89) | (4.10) | (1.48) | (3.95) | |
| 3460 | 3460 | 3460 | 3460 | 3460 | 3460 | |
| N | 0.8733 | 0.0241 | 0.3069 | 0.0265 | 0.5313 | 0.0240 |
Notes: *** and * indicate significant at the 1% and 10% levels, respectively, with t-values in parentheses.
Publisher’s Note: MDPI stays neutral with regard to jurisdictional claims in published maps and institutional affiliations. |
© 2022 by the authors. Licensee MDPI, Basel, Switzerland. This article is an open access article distributed under the terms and conditions of the Creative Commons Attribution (CC BY) license (https://creativecommons.org/licenses/by/4.0/).
Share and Cite
MDPI and ACS Style
Zhao, Z.; Zhou, S.; Wang, S.; Ye, C.; Wu, T. The Impact of Carbon Emissions Trading Pilot Policy on Industrial Structure Upgrading. Sustainability 2022, 14, 10818. https://doi.org/10.3390/su141710818
AMA Style
Zhao Z, Zhou S, Wang S, Ye C, Wu T. The Impact of Carbon Emissions Trading Pilot Policy on Industrial Structure Upgrading. Sustainability. 2022; 14(17):10818. https://doi.org/10.3390/su141710818
Chicago/Turabian StyleZhao, Zhaoyang, Shuning Zhou, Siying Wang, Chong Ye, and Tuolei Wu. 2022. "The Impact of Carbon Emissions Trading Pilot Policy on Industrial Structure Upgrading" Sustainability 14, no. 17: 10818. https://doi.org/10.3390/su141710818
Note that from the first issue of 2016, this journal uses article numbers instead of page numbers. See further details here.