
FLOW-3D Model Development for the Analysis of the Flow Characteristics of Downstream Hydraulic Structures


1
Advanced Structures and Seismic Safety Research Division, Korea Atomic Energy Research Institute, Daejeon 34057, Korea
2
Korea Water Resources Corporation (K-Water), Daejeon 34350, Korea
3
Department of Civil Engineering, Kyungpook National University, Daegu 41566, Korea
*
Author to whom correspondence should be addressed.
Sustainability 2022, 14(17), 10493; https://doi.org/10.3390/su141710493
Submission received: 26 July 2022
/
Revised: 18 August 2022
/
Accepted: 19 August 2022
/
Published: 23 August 2022
(This article belongs to the Special Issue River Flood Indicators for Sustainability: Field Studies, Trends and Modeling)
Abstract
:Hydraulic structures installed in rivers inevitably create a water level difference between upstream and downstream regions. The potential energy due to this difference in water level is converted into kinetic energy, causing high-velocity flow and hydraulic jumps in the river. As a result, problems such as scouring and sloping downstream may occur around the hydraulic structures. In this study, a FLOW-3D model was constructed to perform a numerical analysis of the Changnyeong-Haman weir in the Republic of Korea. The constructed model was verified based on surface velocity measurements from a field gate operation experiment. In the simulation results, the flow discharge differed from the measured value by 9–15 m3/s, from which the accuracy was evaluated to be 82–87%. The flow velocity was evaluated with an accuracy of 92% from a difference of 0.01 to 0.16 m/s. Following this verification, a flow analysis of the hydraulic structures was performed according to boundary conditions and operation conditions for numerous scenarios. Since 2018, the Changnyeong-Haman weir gate has been fully opened due to the implementation of Korea’s eco-environmental policy; therefore, in this study, the actual gate operation history data prior to 2018 was applied and evaluated. The evaluation conditions were a 50% open gate condition and the flow discharge of two cases with a large difference in water level. As a result of the analysis, the actual operating conditions showed that the velocity and the Froude number were lower than the optimal conditions, confirming that the selected design was appropriate. It was also found that in the bed protection section, the average flow velocity was high when the water level difference was large, whereas the bottom velocity was high when the gate opening was large. Ultimately, through the reviewed status survey data in this study, the downstream flow characteristics of hydraulic structures along with adequacy verification techniques, optimal design techniques such as procedures for design, and important considerations were derived. Based on the current results, the constructed FLOW-3D-based model can be applied to creating or updating flow analysis guidelines for future repair and reinforcement measures as well as hydraulic structure design.
1. Introduction
About 34,000 small weirs (National Fisheries Information System) are installed in small–medium streams in the Republic of Korea (ROK) for agriculture and water-friendly use. Most of these are structures such as fixed weirs or turning types and have flow characteristics of general weirs that consider only upstream and downstream water level conditions. In 2012, 16 large weirs with various types of water gates were installed in the ROK. Unlike small-scale weirs of the past, the large weirs have various flow patterns depending on the upstream and downstream water levels and gate operating conditions. In particular, emergency operation situations, in which a water gate is opened quickly in a situation with a large water level difference between the upstream and downstream regions, show strong flow characteristics similar to the spillway discharge of a dam. As a result, scouring of the downstream riverbed and deformation of the dissipator can occur, raising the issue of the safety of such structures.
In cases outside the ROK, Wanoschek et al. (1989) investigated the phenomenon of hydraulic jumps in trapezoidal channels [1], and Bohr et al. (1993) studied the qualitative calculation of hydraulic jump length [2]. Additionally, Chanson & Brattberg (2000) studied the energy dissipation caused by the magnitude of the hydraulic jump phenomenon [3]. In a study on the downstream flow characteristics according to weir installation, Dhamotharan et al. (1981) analyzed the relationship between the water depth change and turbulence coefficient through a one-dimensional model [4]. Ziegler and Nisbet (1995) conducted a study to verify 30 years of actual data and SEDZL modeling results of the Watts Bar reservoir in the US [5]. Olsen (1999) simulated the Kaligandaki Reservoir flow velocity and river bottom variation using a three-dimensional (3D) model and verified it by comparison with the experimental results of a hydraulic model [6]. Saad and Fattouth (2017) analyzed the hydrodynamic characteristics of the flow over weirs with circular openings [7], and Bagheri et al. (2018) analyzed the hydraulic characteristics of flow through streamlined weirs [8]. Hussain et al. (2020) extended the optimal homotopy asymptotic method with the use of Daftardar–Jeffery polynomials to a Hirota–Satsuma coupled system of Korteweg–de Vries equations [9]. Arifeen et al. (2021) studied a numerical scheme based on the Haar wavelet for solutions of higher-order linear and nonlinear boundary value problems [10]. Sharafati et al. (2021) reported an analysis of the scour depth of hydraulic structures in which computational models and empirical formulas were applied [11]. In Khan et al. (2021), an investigation of mass and thermal energy transfer of a 3D Carreau fluid moving through a permeable and stretching (shrinking) sheet was undertaken considering the effects of thermal radiation, cross-diffusion, and Hall current [12]. Khan et al. (2021) also investigated a mixed convective Casson fluid flow passing a yawed cylinder with heat transfer [13]. Ullah et al. (2021) studied the impacts produced by various physical parameters of interest on the temperature profile and the velocity components [14]. Aamir et al. (2022) analyzed the effect of a rough, rigid apron on scouring downstream of a sluice gate [15]. Aghazadeh Gharebagh et al. (2022) carried out an experimental investigation of the floor scour rate under flood conditions [16]. Laishram et al. (2022) experimentally compared the hydraulic jump characteristics and energy dissipation between sluice gates and radial gates [17]. Varaki et al. (2022) analyzed the effect of the apron length on the local scouring downstream of a grade control structure with a labyrinth platform [18]. Furthermore, Rizk et al. (2022) investigated the heat transfer characteristics during a hybrid nanofluid’s (GO + ZnO + H2O) 3D incompressible unsteady motion between two parallel plates in the presence of an applied varying magnetic field [19].
In hydraulic model experiments in the ROK, Kim (2004) studied the hydraulic characteristics of river flow according to the shape of underwater structures [20]. Lee et al. (2005) experimentally determined the particle size of floor protection stone material by supplementing the experimental conditions based on the experimental results of Escarameia and May [21]. In addition, Choi et al. (2008) analyzed changes in the flow of a river according to the installation of a movable weir equipped with a bottom water discharge device [22]. Jung (2011) presented the protection works for fixed and movable weirs through a study on the selection of river bed protection according to the installation of beams, and calculated the sedimentation length and changes in the river bed according to the beam structure [23]. Kim et al. (2005) developed a two-dimensional numerical analysis model to identify the flow characteristics according to the installation of hydraulic structures and conducted a hydraulic impact analysis around the Singok underwater weir in the Han River of the ROK [24]. Moreover, Kim et al. (2005) applied a 3D numerical model to hydraulically analyze the amount of air inflow in the fluid following the installation of stepped weirs [25]. As for the impact analysis of river scouring through a numerical model, Jeong et al. (2011) analyzed the scour characteristics of a river through a 3D numerical model [26]. In addition, Son et al. (2015) applied the CCHE2D model and conducted a study on flow characteristics and river bed fluctuations considering the effect of a bottom protection layer [27].
In the current study, the downstream flow characteristics of a mid-sized weir with large water gates are investigated by developing a FLOW-3D model. The applicability of the model is first verified through a calibration of the numerical model with field test results. The flow characteristics of the downstream hydraulic structures according to various upstream and downstream water levels and sluice gate operating conditions are then investigated. The ultimate aim is to identify the worst-case flow conditions so that the developed model can be employed in the design of hydraulic structures in the future.
2. Study Methods
FLOW-3D, a three-dimensional computational fluid dynamics (CFD) program, was first selected for its high-precision numerical analysis. An analysis model was then constructed for the Changnyeong-Haman weir section of the Nakdong River in the ROK. After that, the results of a gate discharge experiment were reviewed, and 3D flow analysis was performed applying the same upstream and downstream water level and gate operating conditions to prove the applicability of the analysis model. Based on the verified flow analysis model, various boundary conditions and sluice gate operating conditions were then applied to analyze the flow characteristics downstream of the hydraulic structure. Subsequently, the optimal design conditions were selected by calculating the management water level of a flood with the largest difference between the upstream and downstream water levels and the planned frequency (100-year frequency) with a large flow rate. Flow analysis was performed for four cases varying the degree and number of weir sluice gate openings. Then, by reviewing the operation performance of the gates of the Changnyeong-Haman weir from 2013 to 2018, two additional cases were selected for analysis in which the gates were opened more than 50% in a situation with the largest water level difference. As a result, the condition that generates the largest flow velocity in the energy dissipator section was selected as the optimal design condition.
3. 3D Flow Analysis Model Construction and Calibration
3.1. Study Target Channel
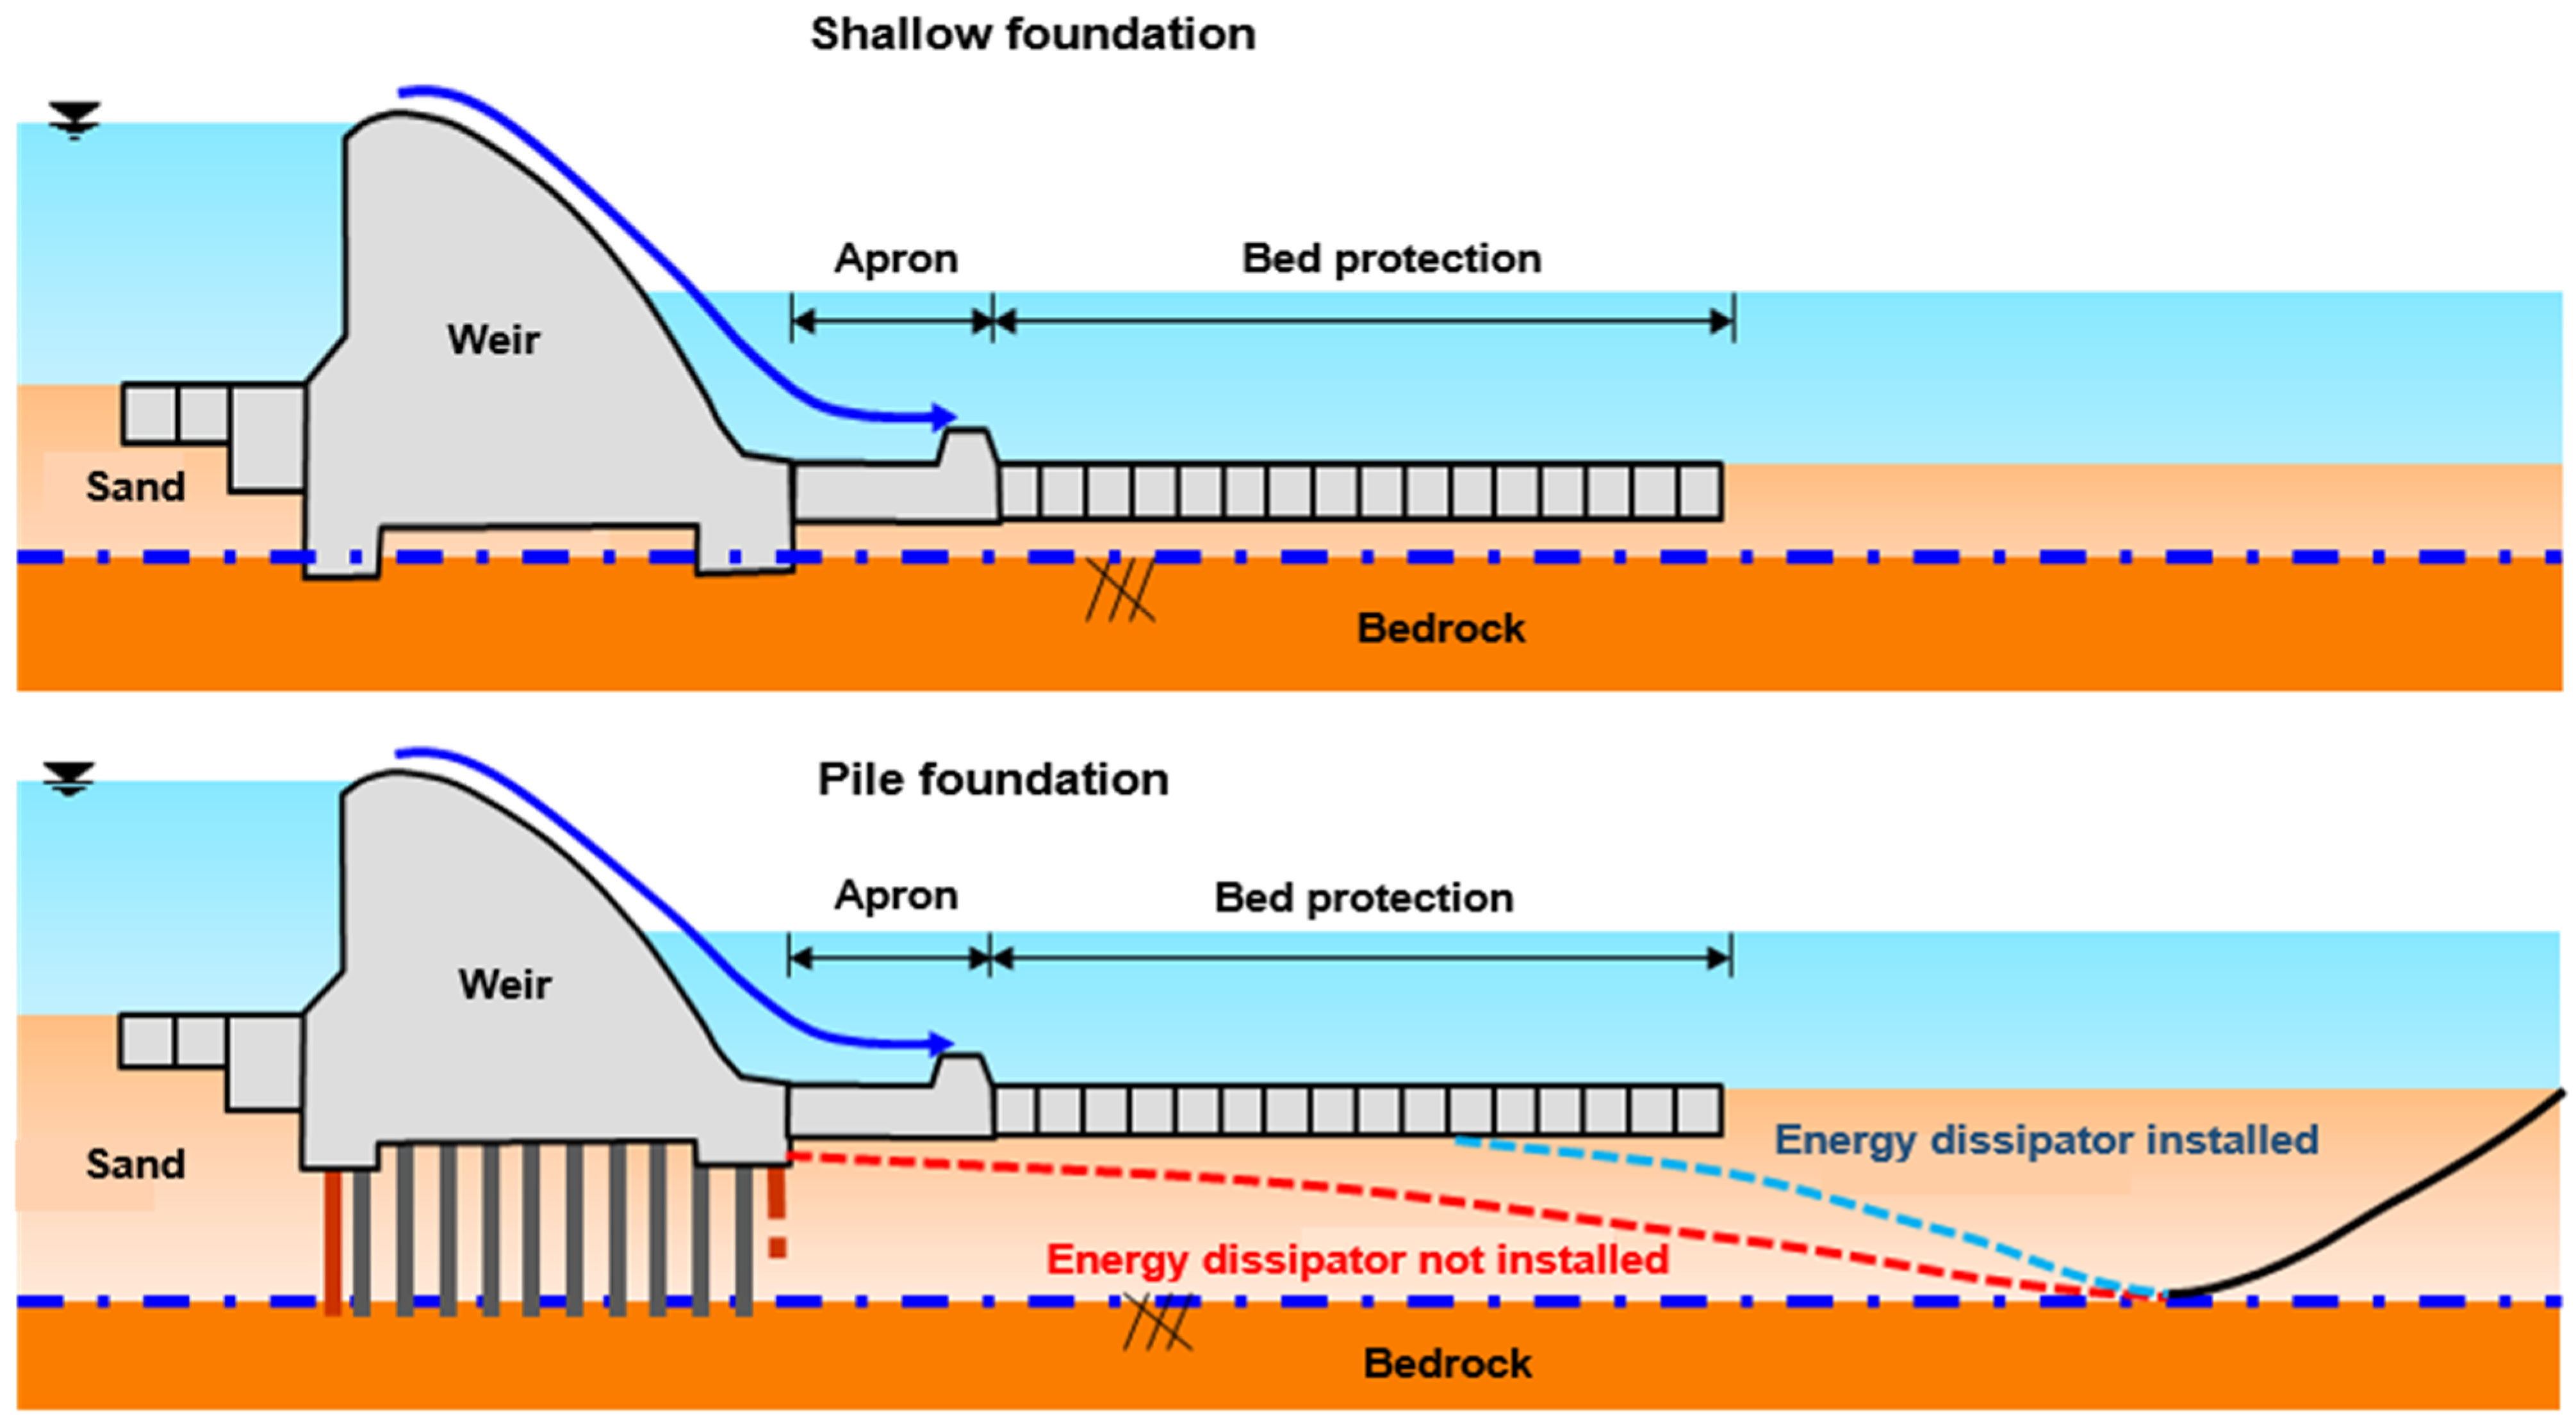
As shown in Figure 1, the hydraulic structures can be divided into shallow foundation type and pile foundation type according to the depth to the bedrock at the site. In the case of the shallow foundation type where the structure sits on the bedrock, the effect of downstream river bottom erosion on the stability of the structure is limited even if no energy dissipator is installed. However, in the case of the pile foundation with a deep soil depth, erosion of the riverbed will likely affect the structure’s safety, and therefore it is essential to design and manage the energy dissipator. In this study, the Changnyeong-Haman weir as a pile foundation type with the deepest soil depth was selected as the study target. Below, we review the downstream flow characteristics and verify the adequacy of the energy dissipator.
3.2. Modeling
The FLOW-3D model is based on unsteady-state simulation, with continuity equations, 3D momentum conservation equations (Navier–Stokes equations), and energy equations employed to simulate the flow phenomena of incompressible and compressible fluid flows. Five techniques can be applied to the analysis of fluid turbulence: the mixed length model, the turbulence energy model, the model, the renormalized group theory model, and the large eddy simulation model. Moreover, FLOW-3D has better calculation times and boundary expressions than other programs in calculating free surfaces based on the finite difference method. In addition, for accurate flow analysis, turbulence must also be analyzed. There are Direct Numerical Simulation (DNS), Large Eddy Simulation (LES), and Reynolds-averaged Navier-Stokes (RANS) simulations for analyzing turbulence problems. In this study, the LES model with high accuracy was applied. LES applies a spatial average within the grid instead of the time average of the Navier-Stokes equation. Moreover, the flow up to the size that can be expressed by the filter is directly calculated, and the flow smaller than that is statistically processed. Furthermore, LES can simulate realistic turbulence compared to other models.
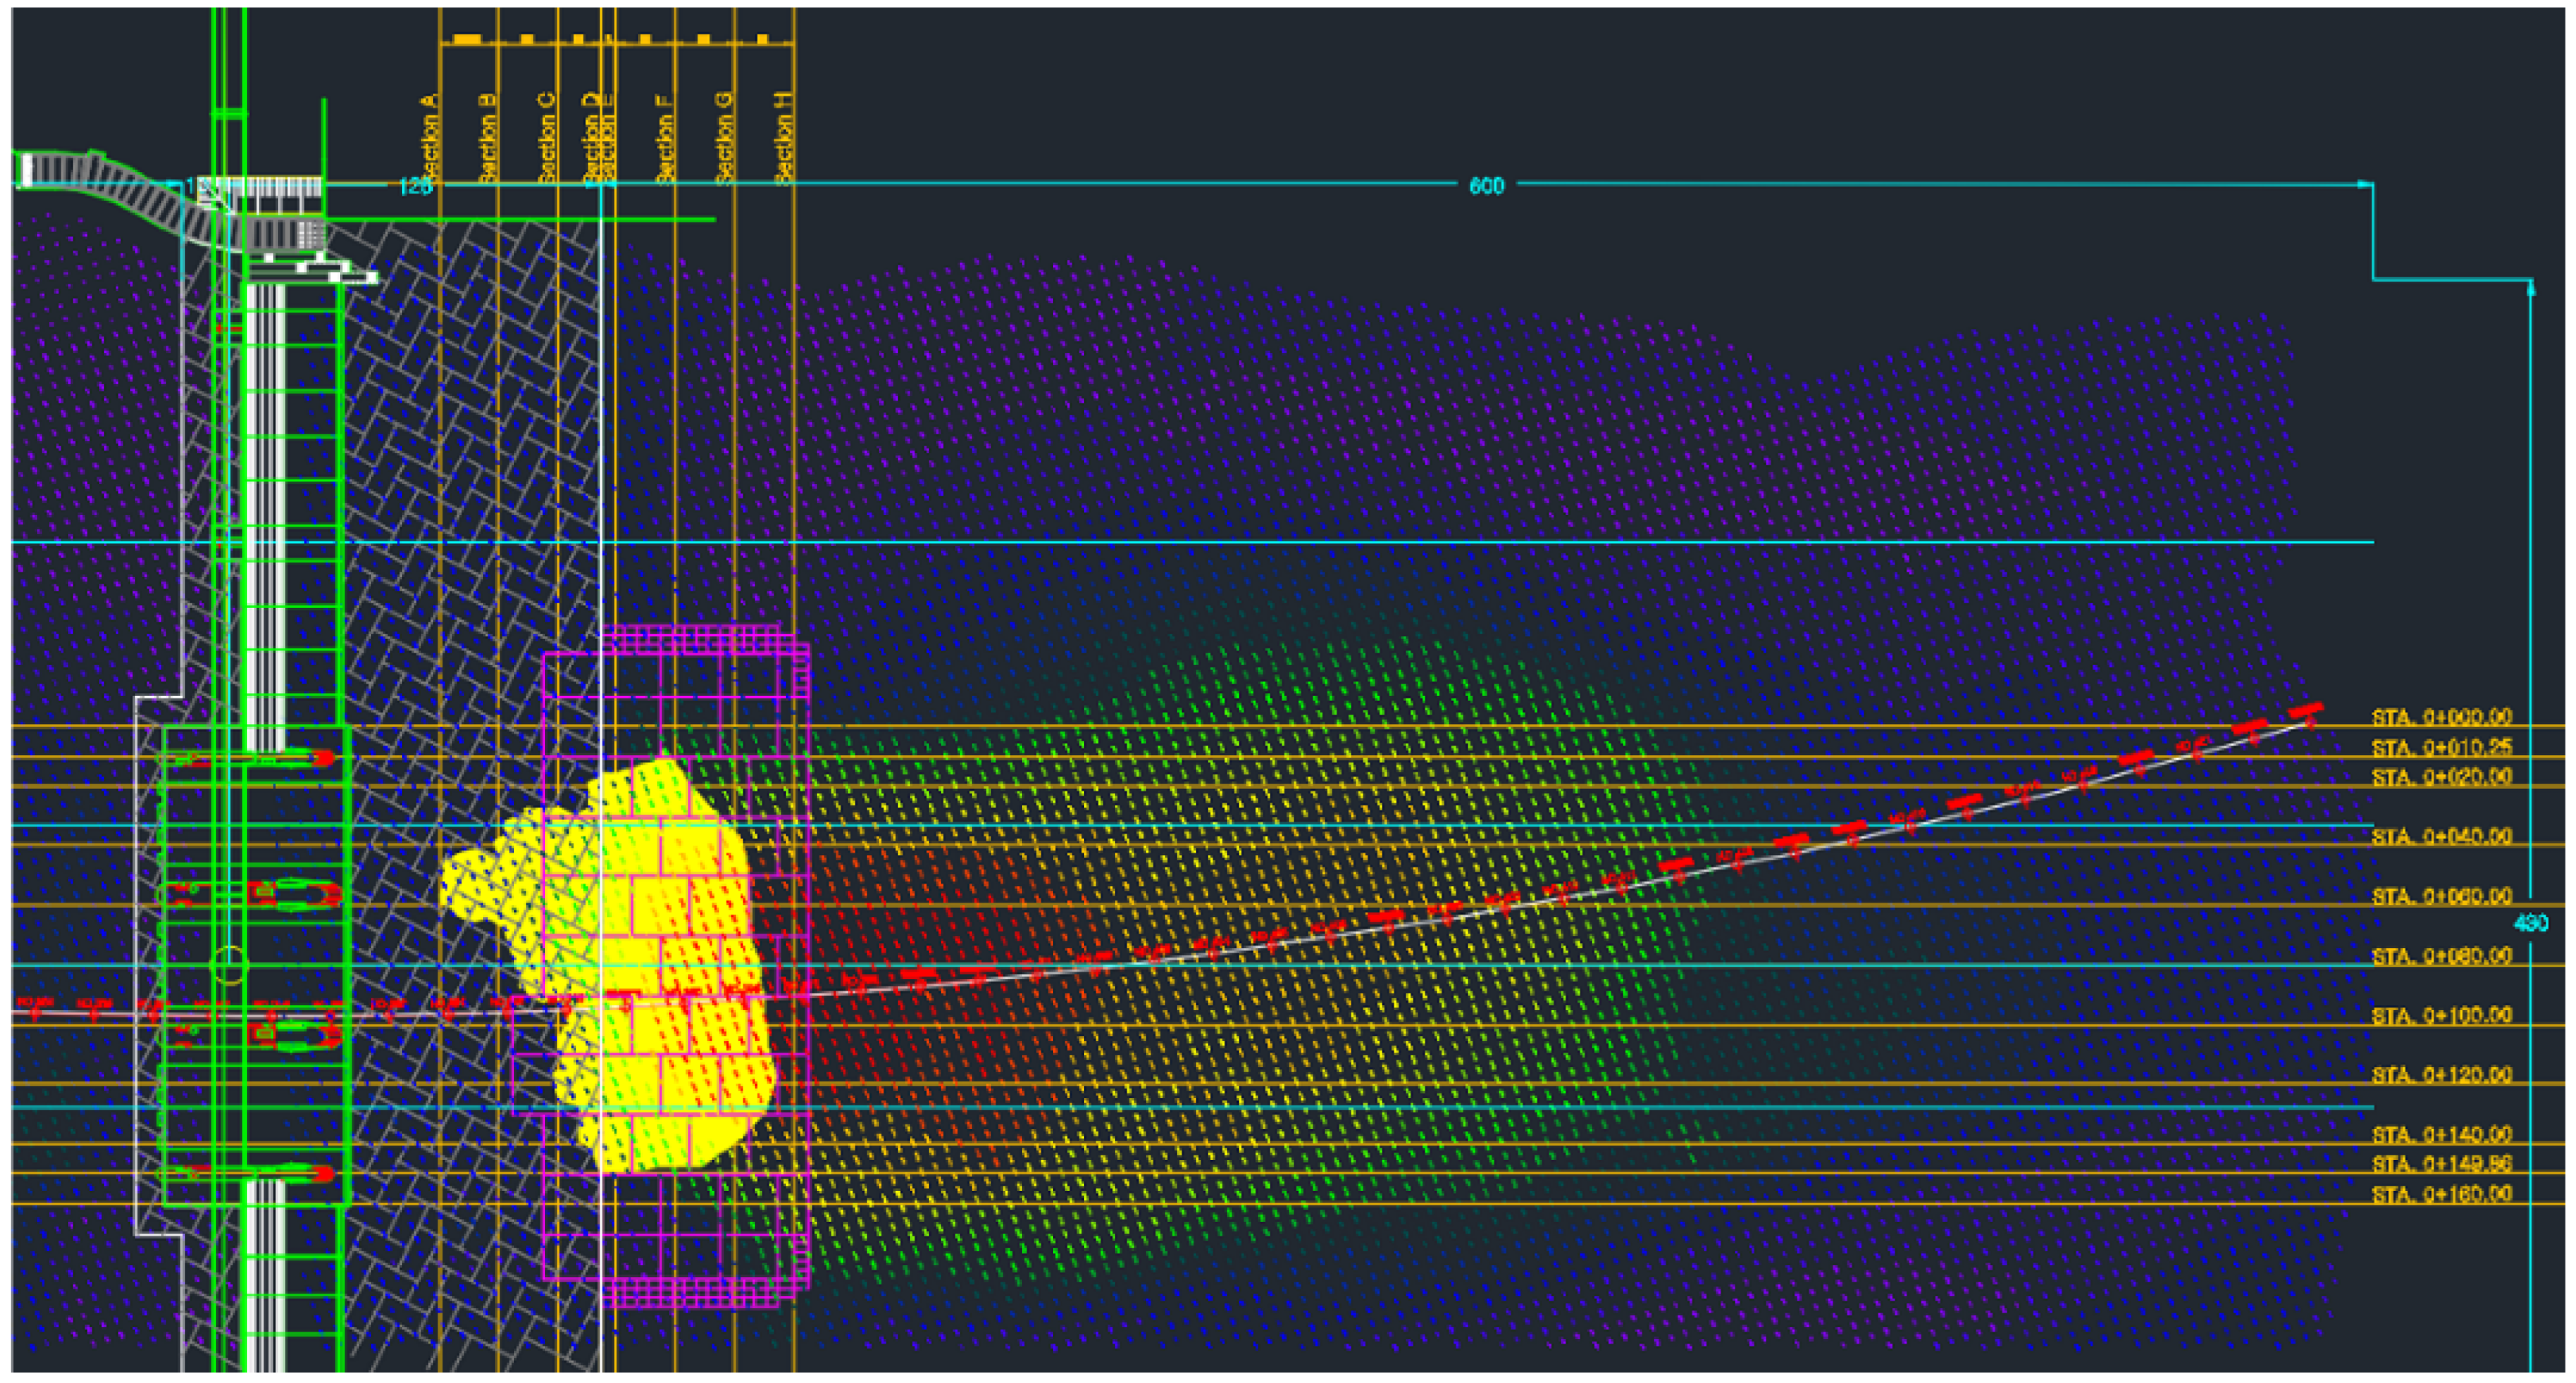
For the modeling, this study used the results of a water depth survey (Figure 2) conducted in June 2015 when the modification of the rubble ground of the Changnyeong-Haman weir was completed. Table 1 shows the model construction’s X, Y, and Z analysis ranges.
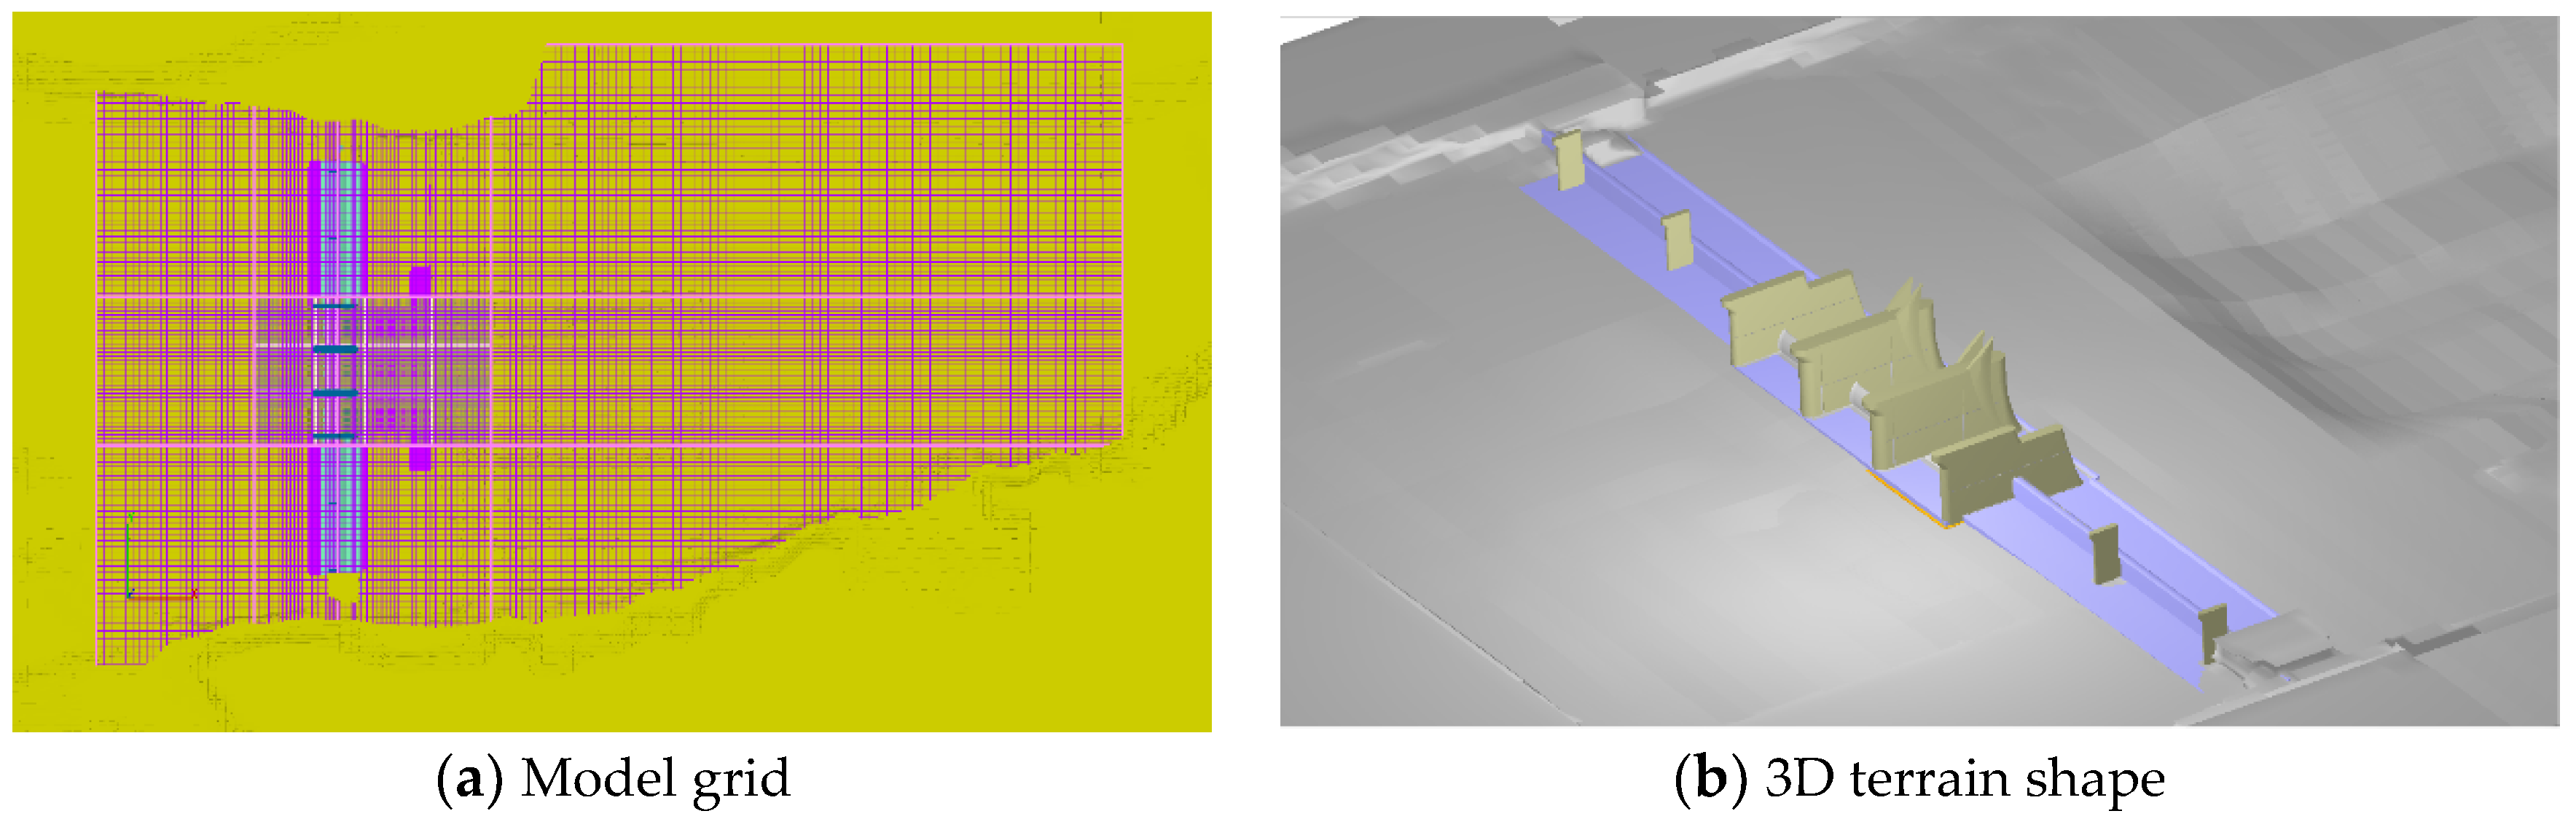
In consideration of the purpose of this study, the grid size of the model was densely constructed with an average of X 0.25 m × Y 0.5 m × Z 0.25 m for the weir structure and energy dissipator section. The upstream and downstream sections with large fluctuations in flow due to the discharge from the movable weir consisted of an average of X 1.47 m × Y 2.45 m × Z 0.36 m. The remaining sections were divided into an average of X 7.1 m × Y 6.7 m × Z 1.15 m, for a combined total of 1,540,800 grids. Table 2 and Figure 3 show the model grid details and the 3D shape around the structure, respectively. For the roughness, the criteria of French (1985) were applied, with values of 0.055 for the channel and bed protection, and 0.003 for the concrete structures applied [28].
3.3. Field Discharge Experiment
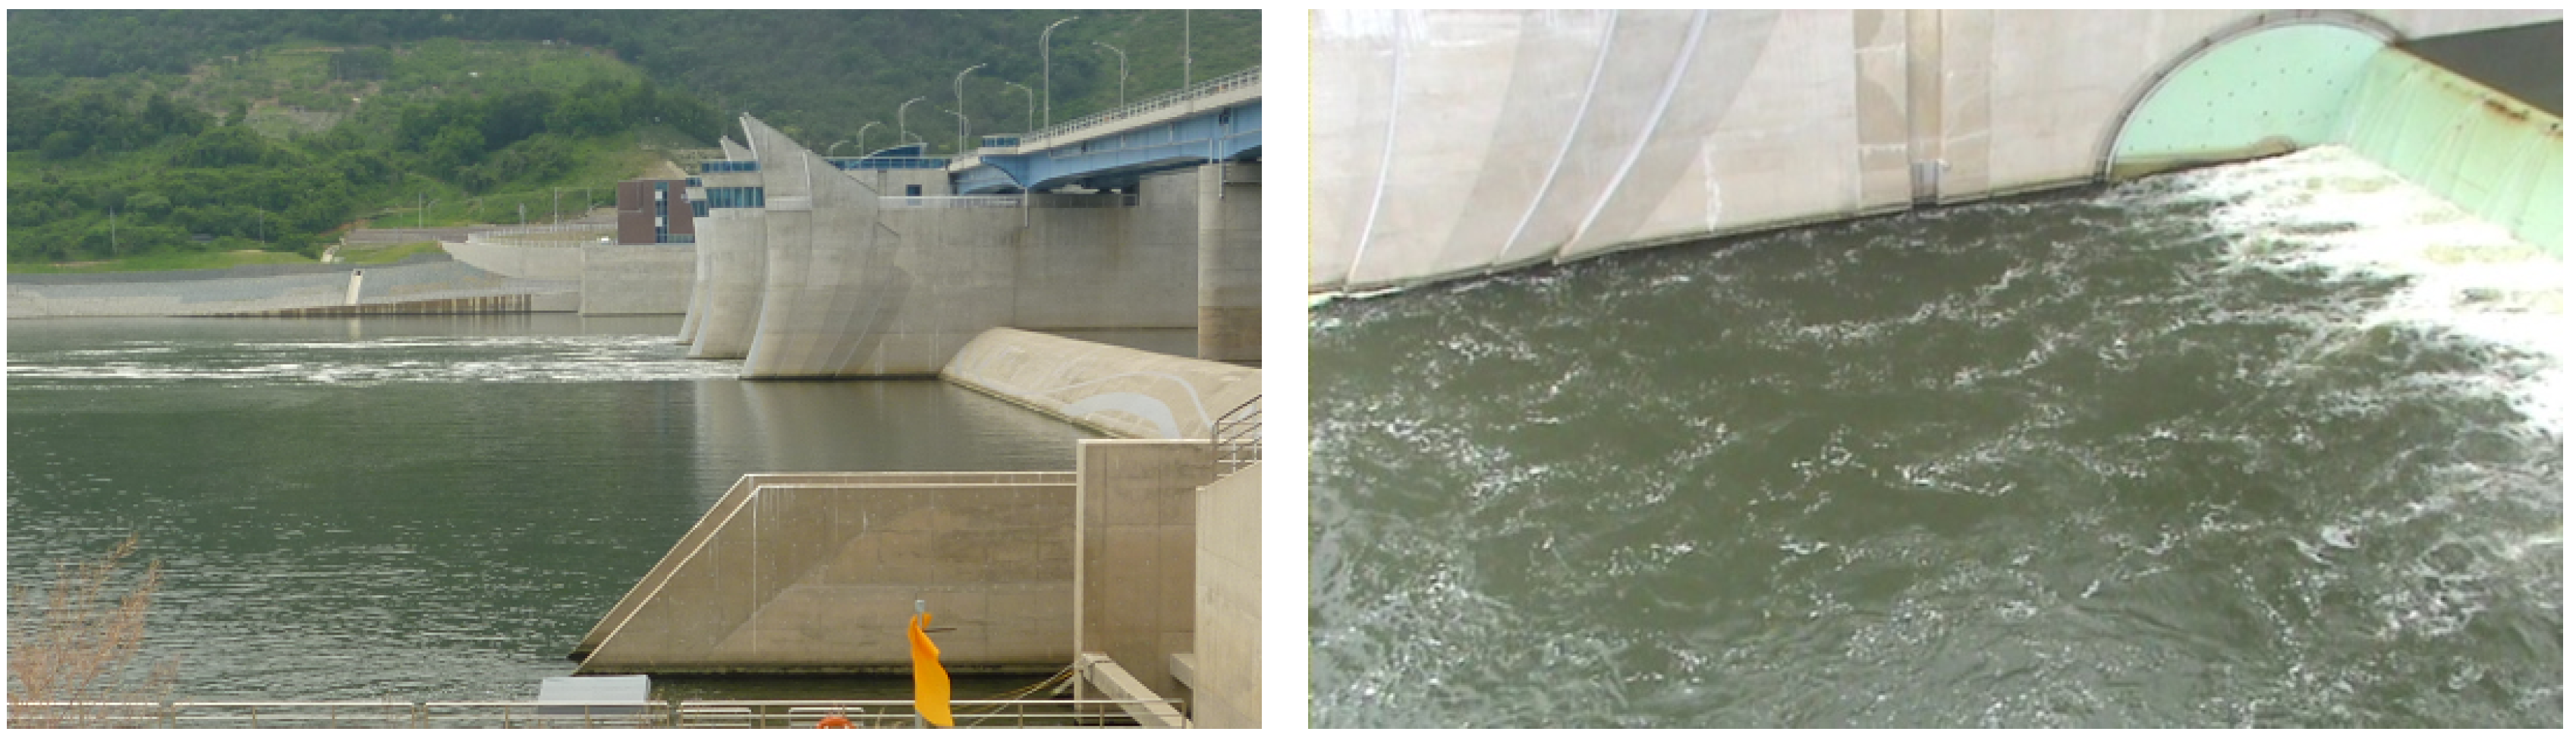
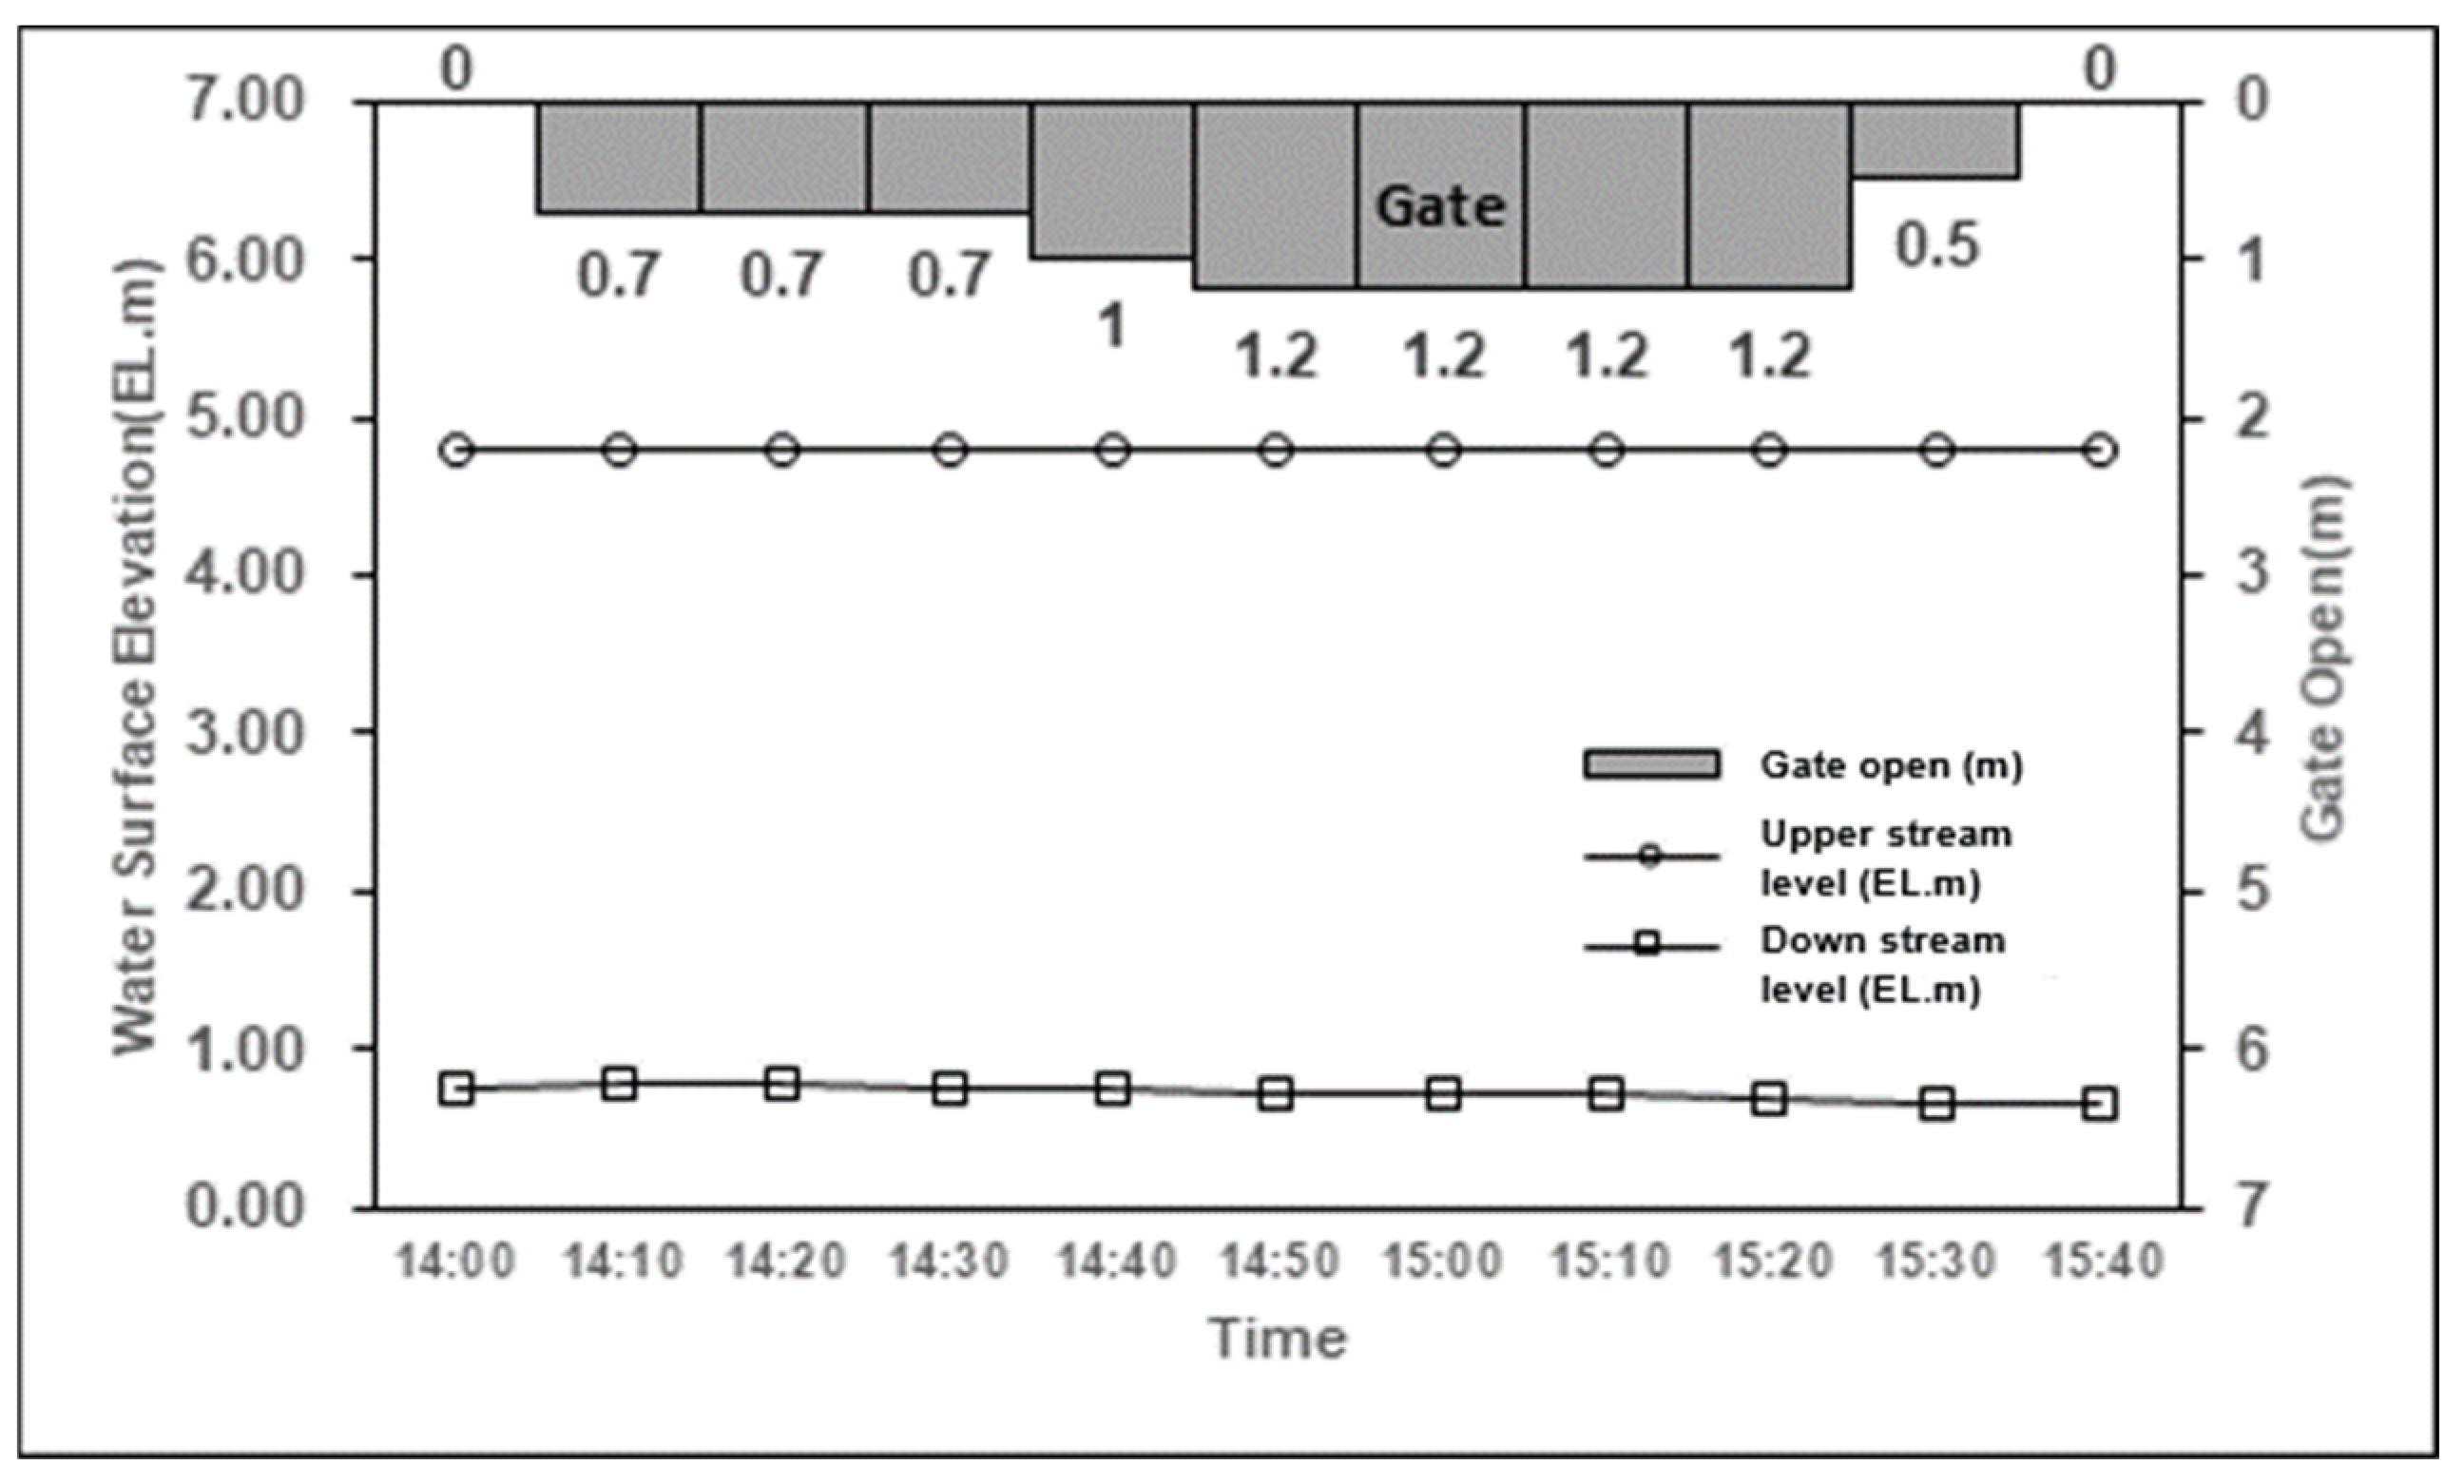
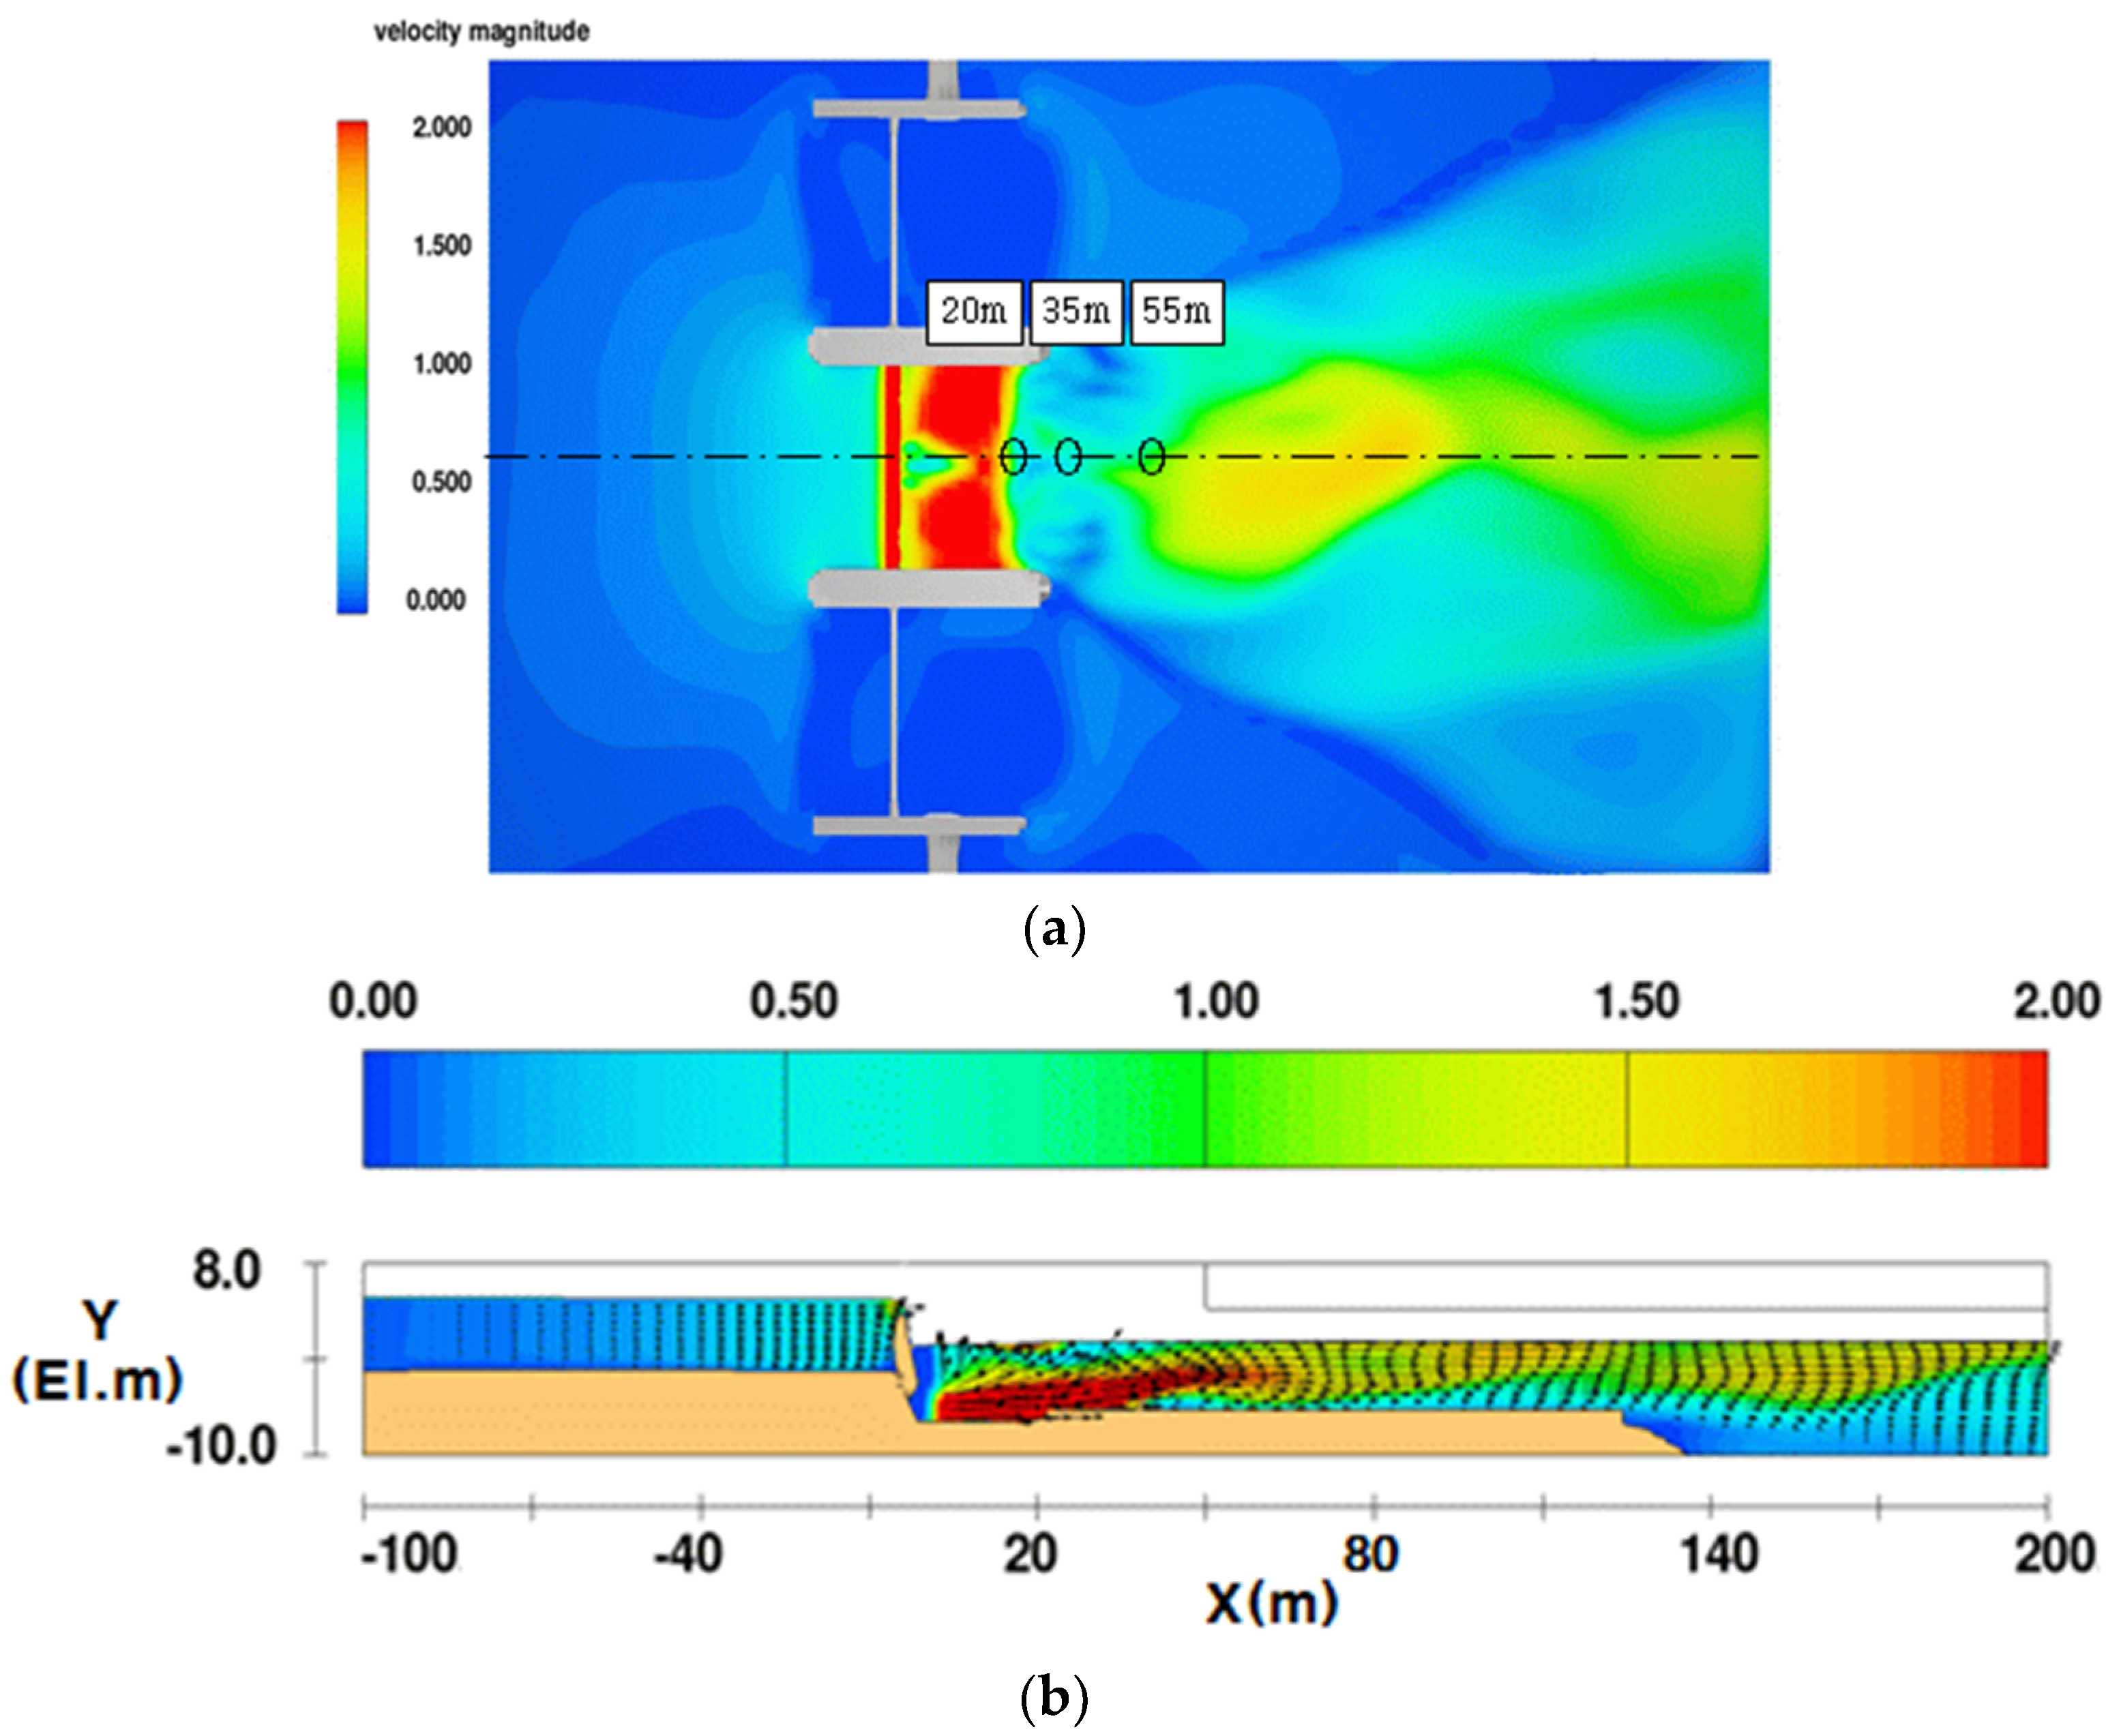
In this study, data from a gate discharge experiment conducted in the field were used to verify the adequacy of the developed 3D model. For the field gate discharge experiment shown in Figure 4, the movable weir maintenance gate No. 2, where the flow is concentrated during discharge, was selected as the target section. A microwave water surface current meter was installed on the weir bridge, and the surface velocity was measured at points about 20 m, 35 m, and 55 m downstream when the gate was opened 9% (0.7 m, Case 1) and 15% (1.2 m, Case 2). The results are shown in Figure 5.
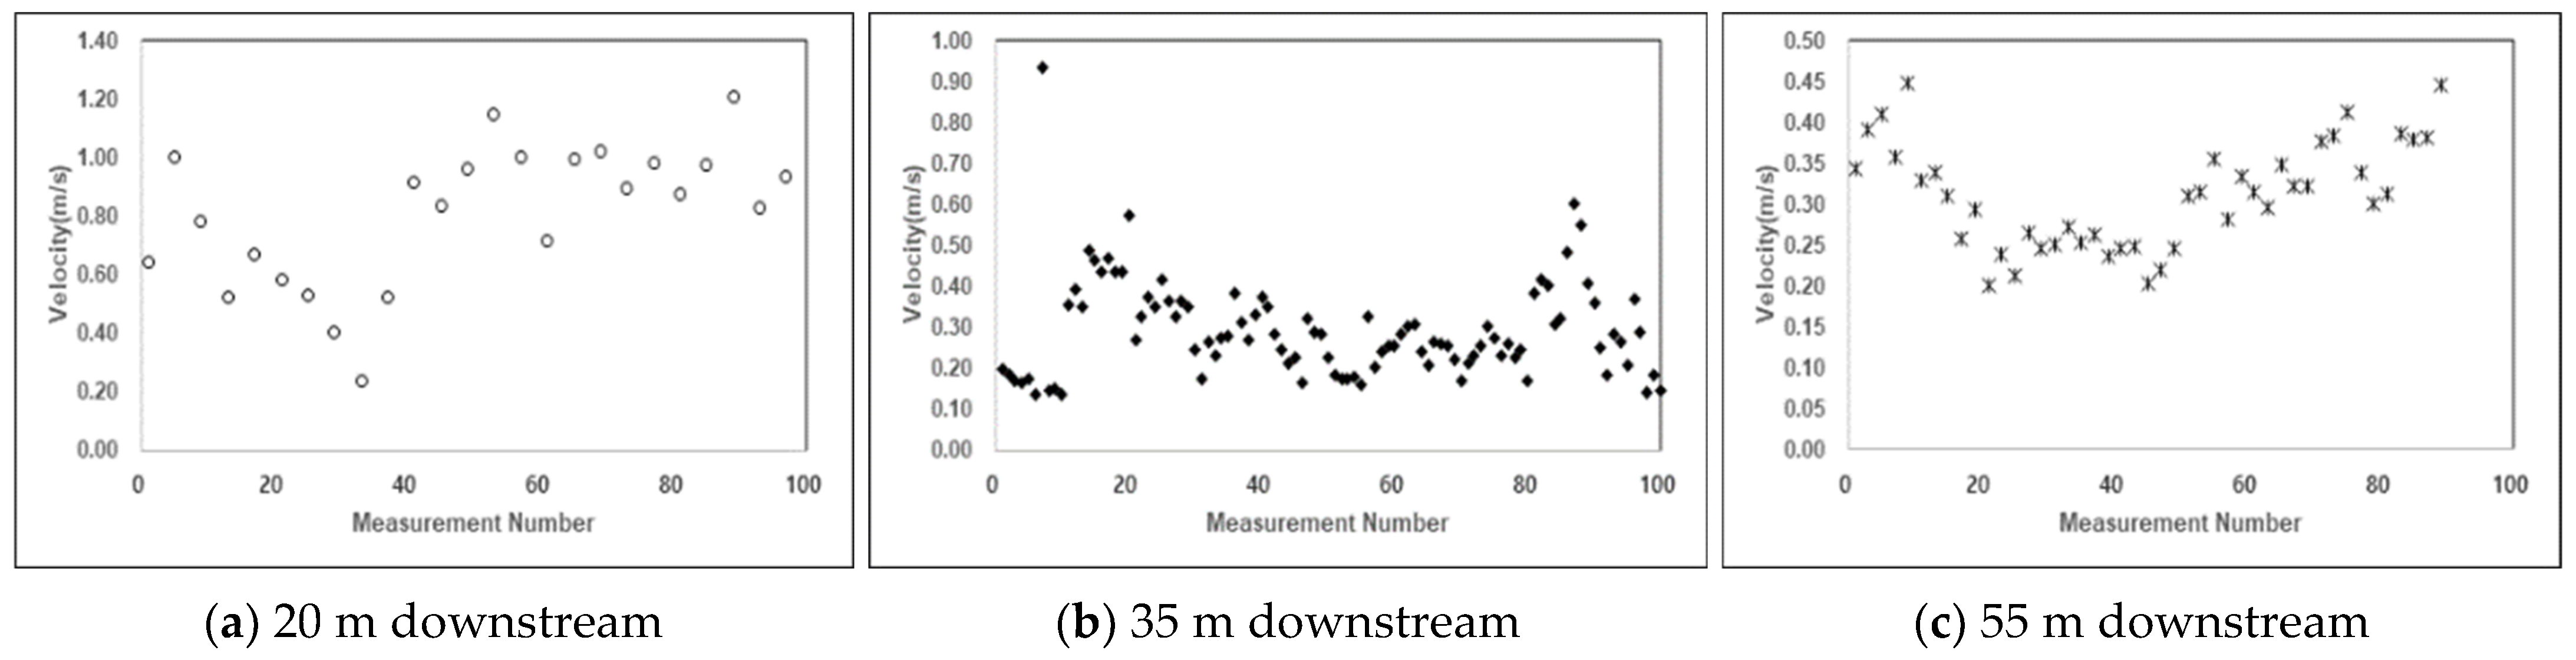
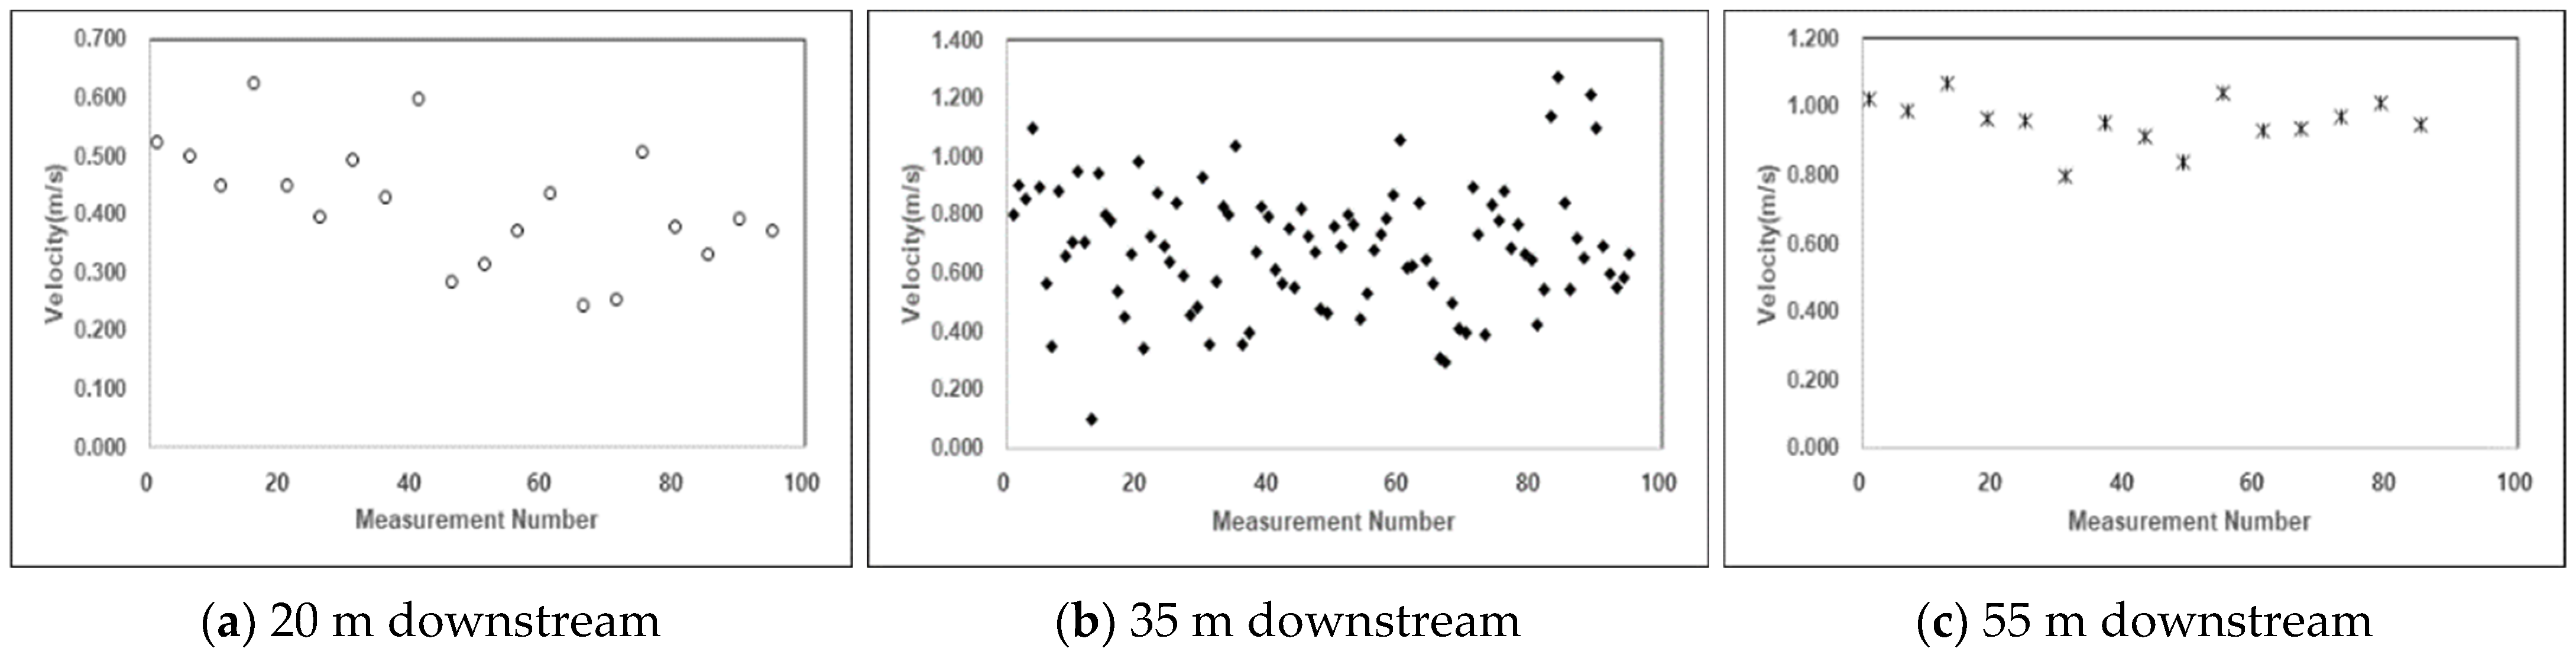
As a result of the experiment, when the sluice gate was opened 0.7 m (9%), the flow velocity was measured to be a minimum of 0.135 m/s, a maximum of 1.206 m/s, and an average of 0.29–0.81 m/s. When the gate was opened 1.2 m (15%), the flow velocity was measured to be a minimum of 0.100 m/s, a maximum of 1.272 m/s, and on average, 0.42 to 0.96 m/s. The experimental results are shown in Figure 6 and Figure 7 and Table 3. In the Figure 6 and Figure 7, it shows the data measuring the velocity at each downstream point according to the gate opening.
3.4. Calibration of the Model
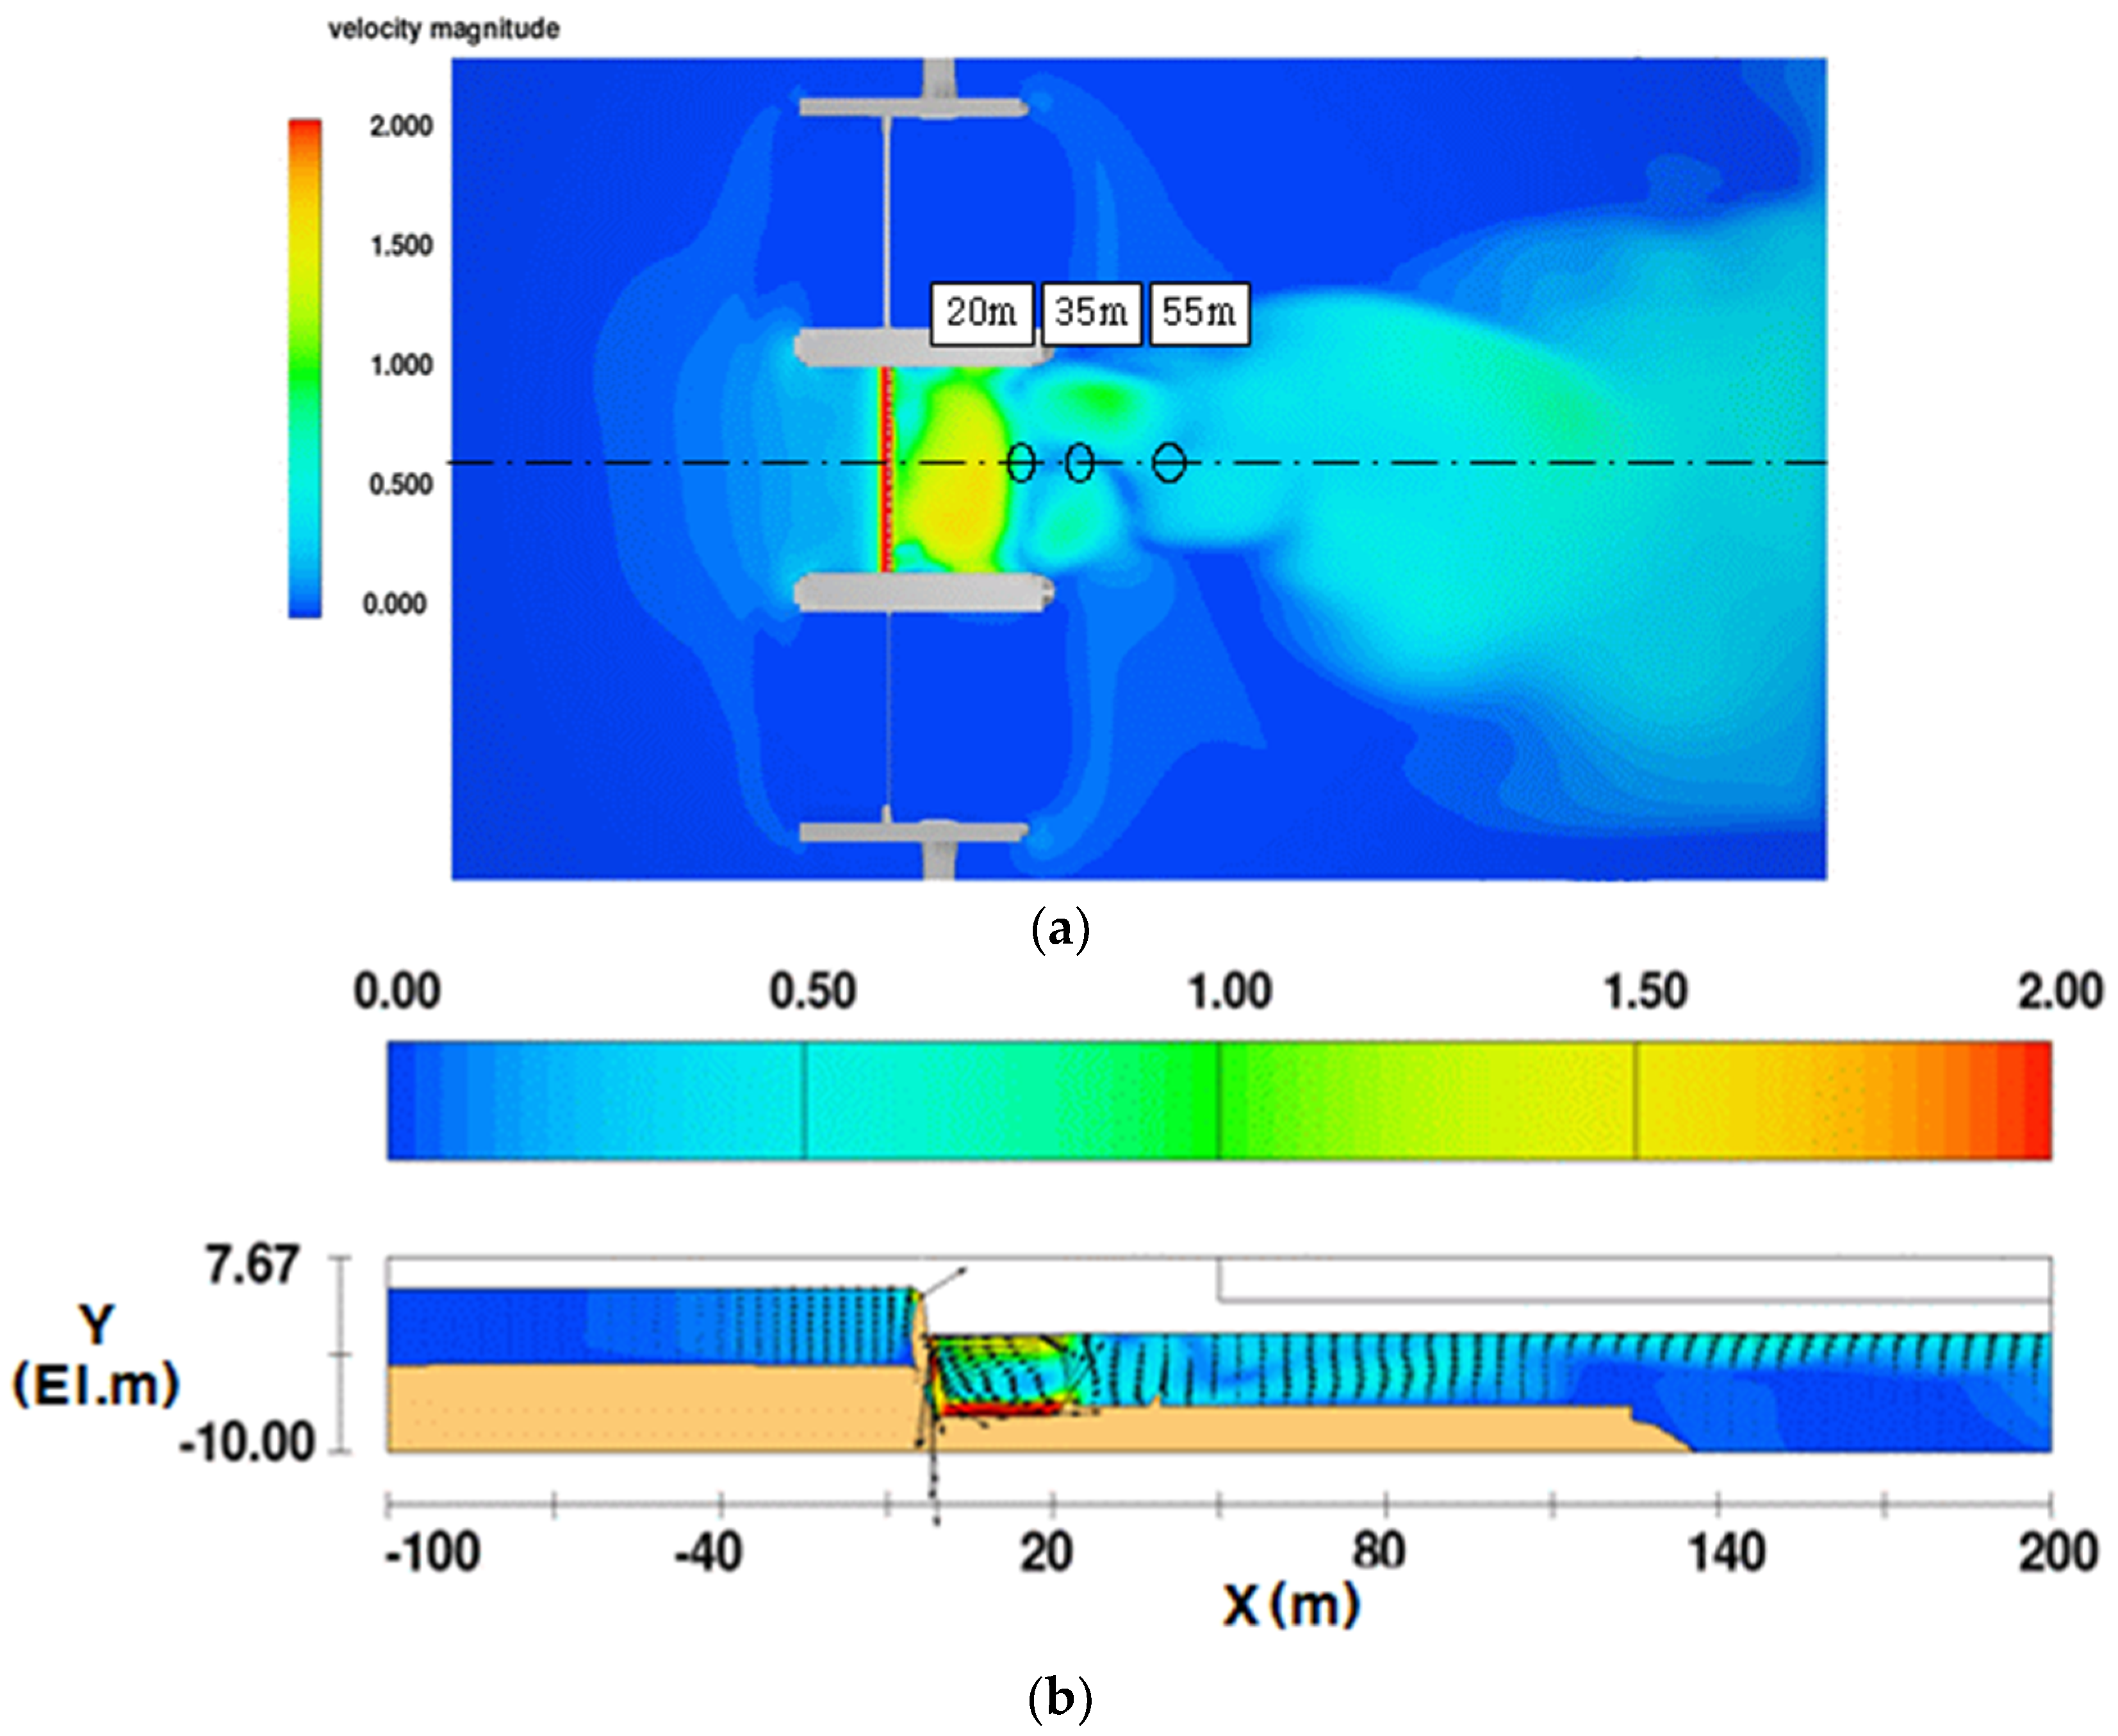
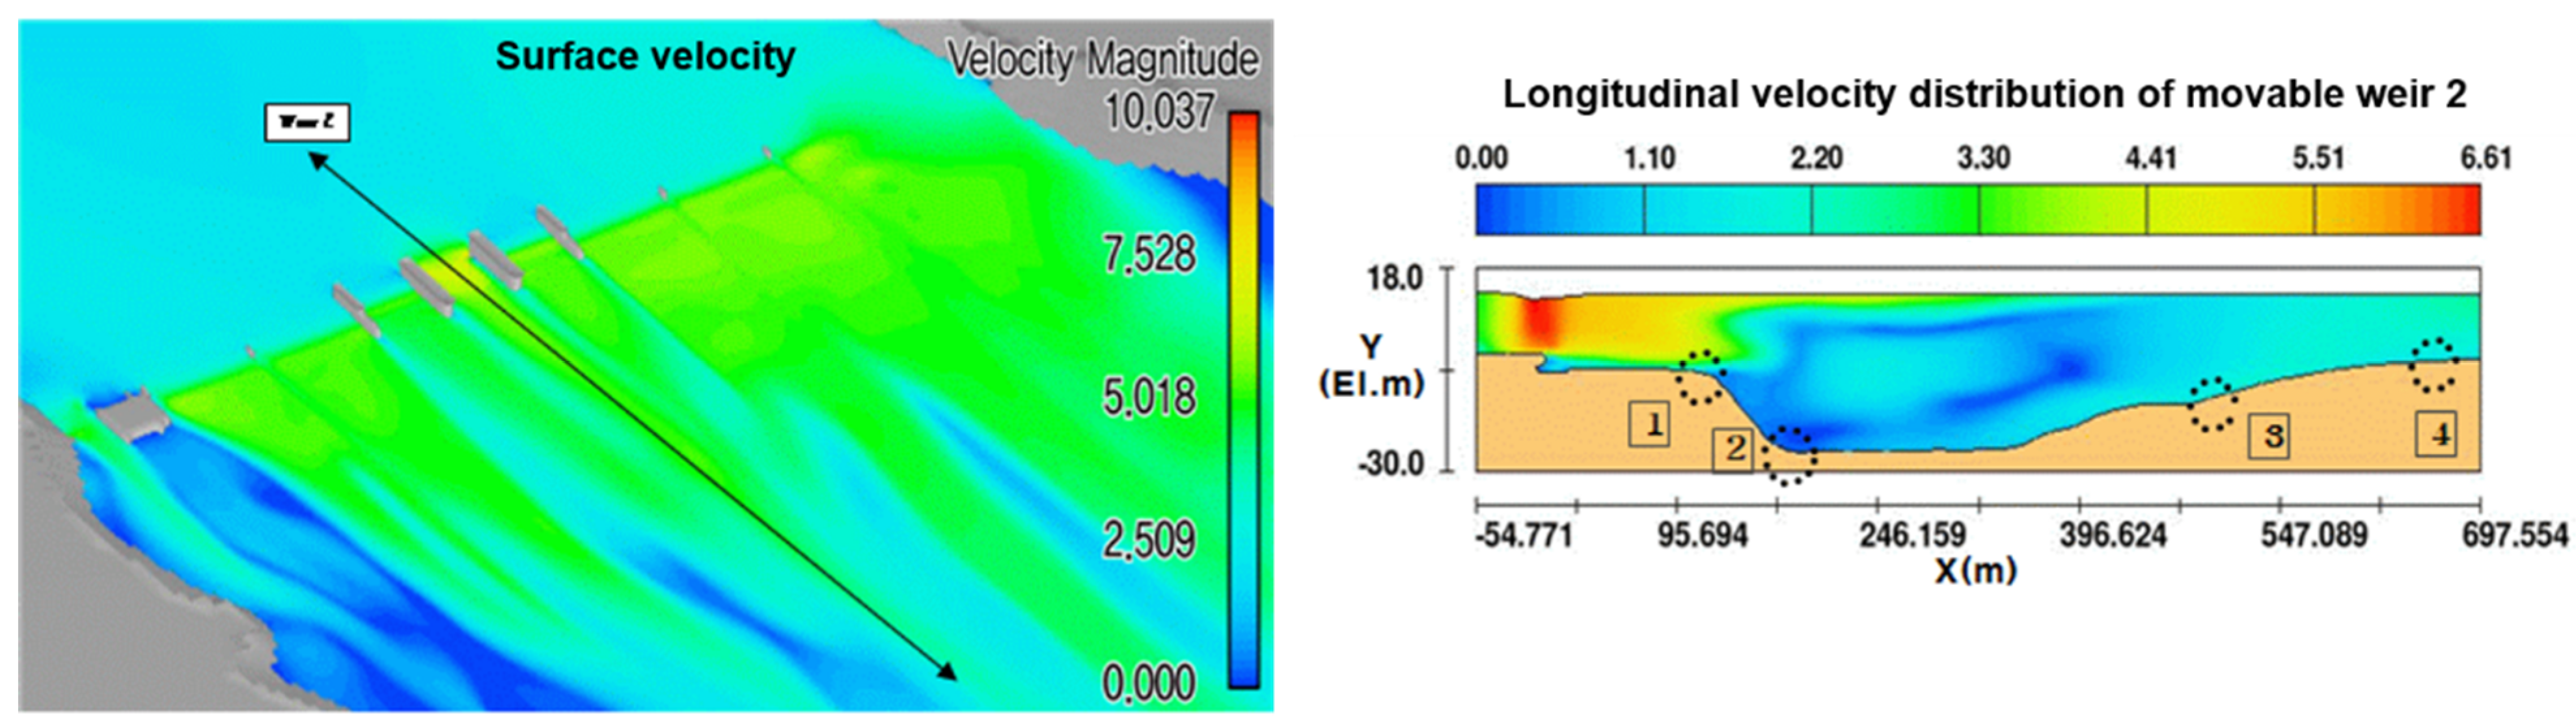
To verify the constructed FLOW-3D model, simulations were performed by applying the same upstream and downstream water level conditions and gate operating conditions as in the field gate discharge experiment. The surface flow velocity distribution according to the simulation results and the longitudinal velocity distribution in the center of the gate are shown in Figure 8 and Figure 9 for the two cases.
Table 4 and Table 5 show the surface velocity and flow rate at each point for the two cases by comparing the results of the field gate discharge experiment and numerical analysis. The flow accuracy was analyzed to be 82% (9 m3/s difference) in Case 1 and 87% (15 m3/s difference) in Case 2. For the flow velocity, 86–99% accuracy was confirmed in Case 1 with a difference of 0.04 to −0.01 m/s, whereas that in Case 2 was 83–98% with a difference of 0.16 to −0.01 m/s.
4. Analysis of 3D Flow Characteristics by Gate Operation Situation
4.1. Review Condition
In order to examine the worst-case scenario for weir hydraulic structures, it is important to consider the average water depth of the downstream section and the flow velocity at the bottom, which are applied as variables when designing the energy dissipator. Accordingly, in order to increase the stability of the design, it is important to estimate the flow velocity through appropriate boundary conditions and gate operating conditions.
In this study, as shown in Table 6, the water level with a fully open gate and a large difference in upstream and downstream water levels was first applied as a boundary condition. Second, the flood season water level at the planned frequency (100-year) with the largest flow discharge was applied as another boundary condition. In order to compare the difference in flow rates according to the gate operation, Case 3 and Case 5 reflect situations in which three gates are fully opened at once, whereas Case 4 and Case 6 reflect situations in which only the central floodgate is fully opened.
4.2. Analysis Results
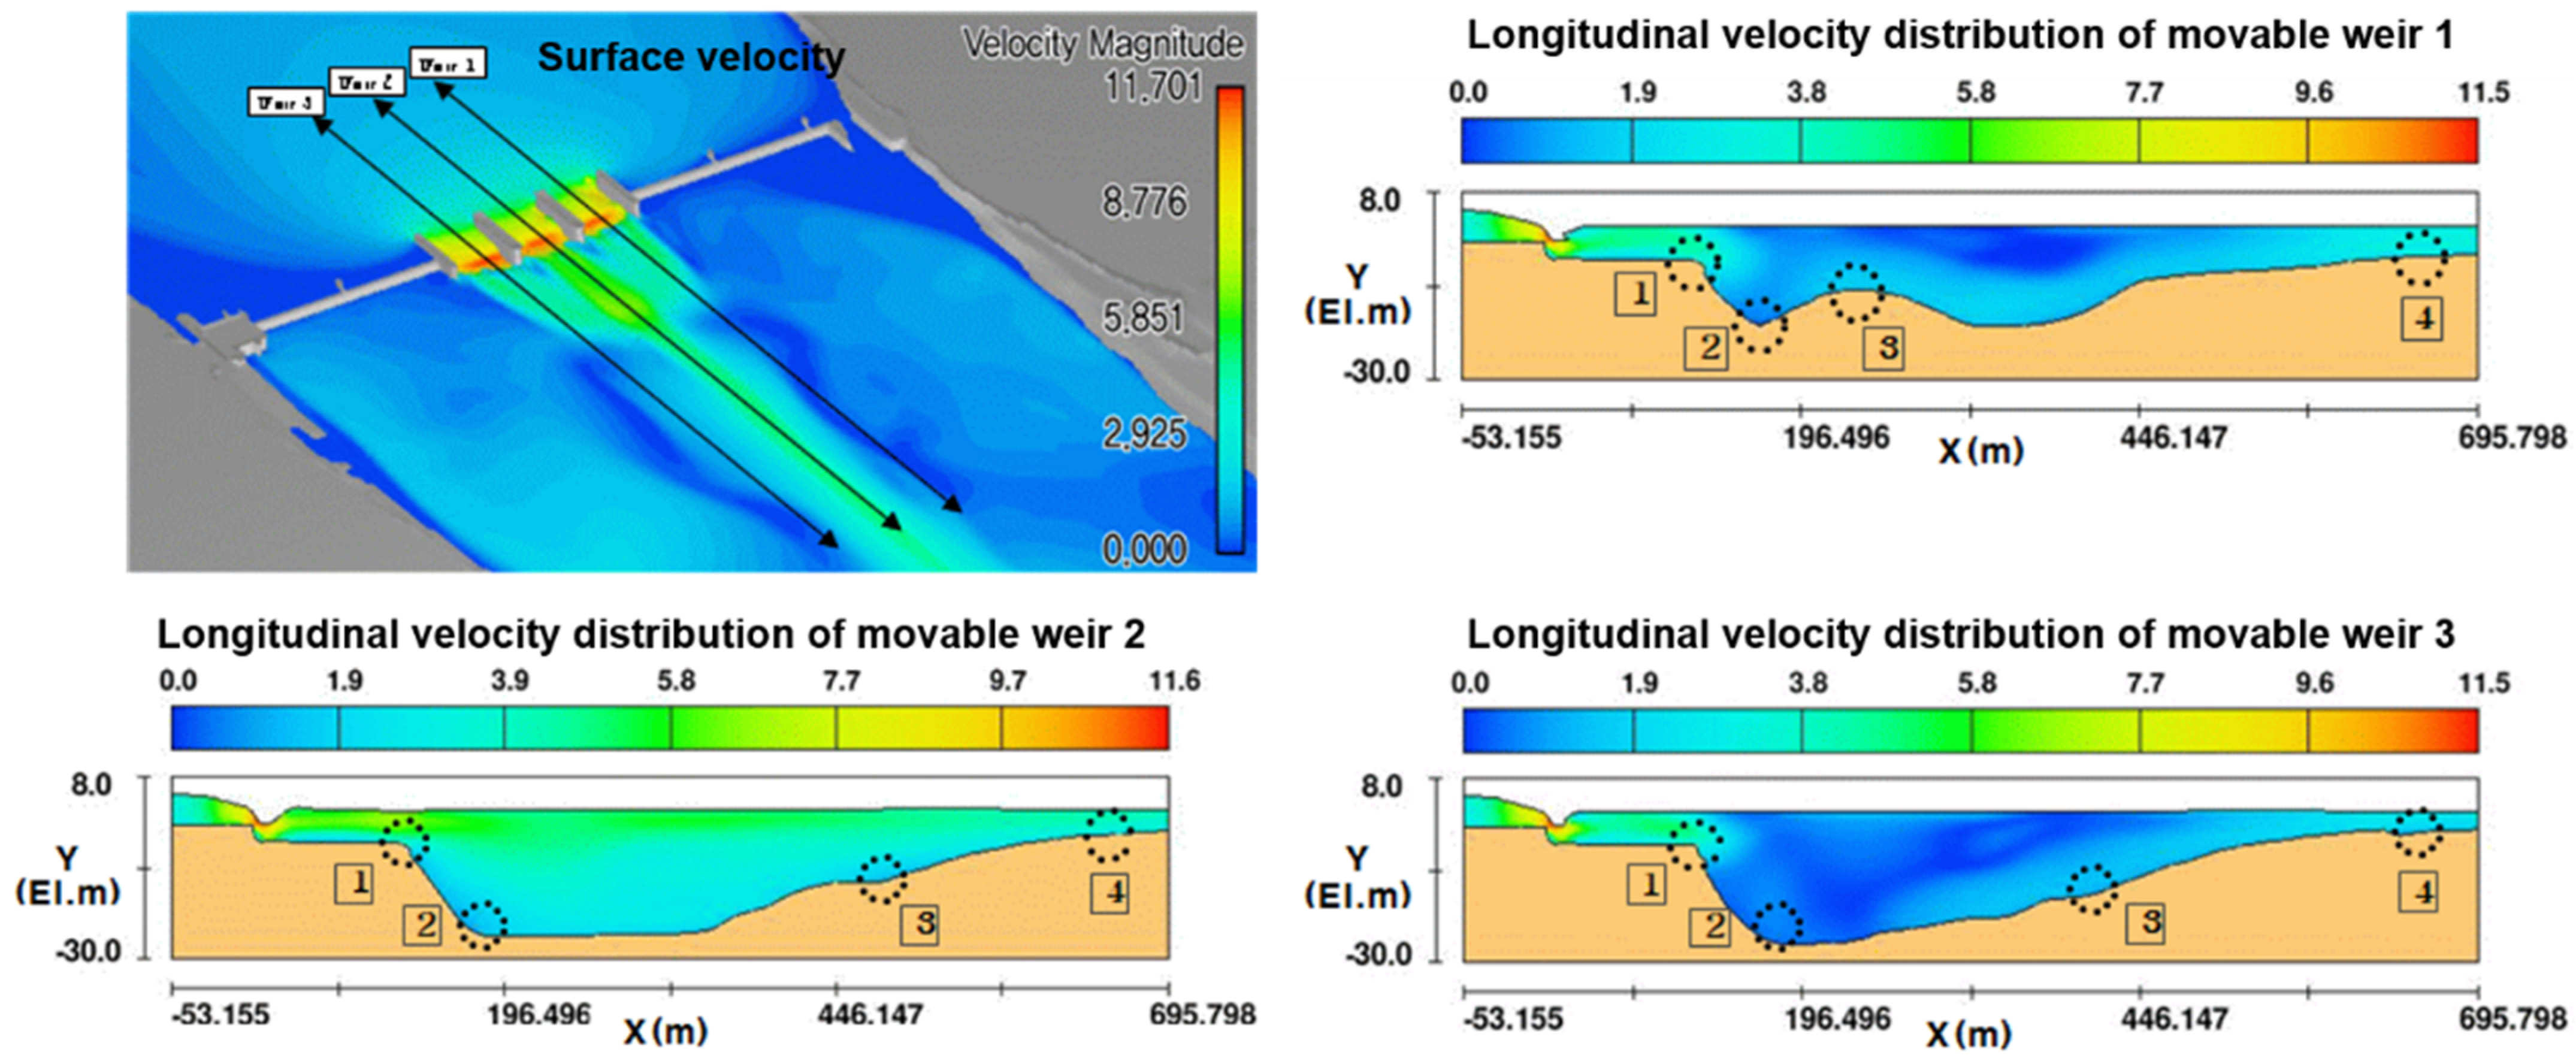
4.2.1. Case 3
As a result of the analysis of Case 3, the hydraulic jump was terminated within the apron section as shown in Table 7 and Figure 10. When examining the flow velocity in the bed protection section, a maximum flow velocity of 5.14 m/s occurred 124.5 m downstream of movable weir 2. As a result, the flow velocity propagation tendency was found up to about 700 m downstream with a high flow velocity of 5.0 m/s or more based on the maximum terminal velocity. In addition, as the flow rate weakened to 3.0 m/s or less as it passed through the puddle section, it can be confirmed that an energy reduction was achieved through a rapid change in the longitudinal section due to natural riverbed scour.
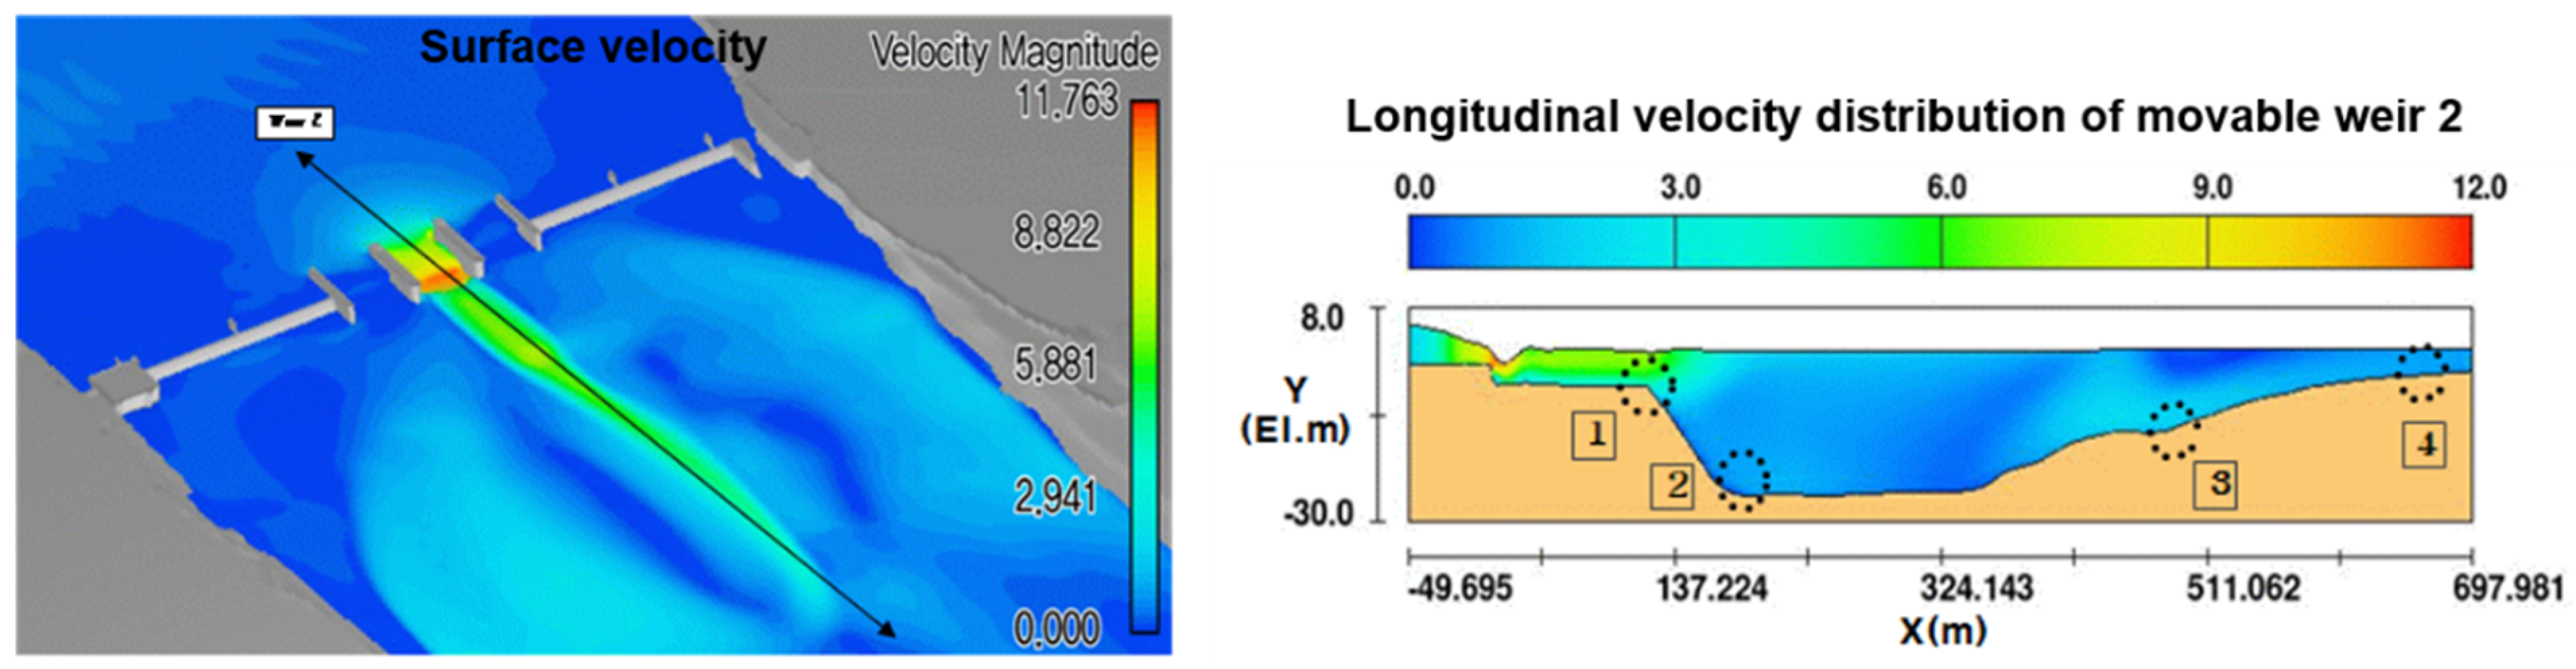
4.2.2. Case 4
As a result of the analysis of Case 4, the hydraulic jump was terminated within the apron section as shown in Table 8 and Figure 11. When examining the flow velocity in the bed protection section, a maximum flow velocity of 5.81 m/s occurred 124.5 m downstream of movable weir 2. As a result, the flow velocity propagation tendency was found up to about 200 m downstream with a high flow velocity of 5.0 m/s or more based on the maximum terminal velocity. Then as in the previous case, as the flow rate weakened to 1.0 m/s or less as it passed through the puddle section, it can be confirmed that an energy reduction was achieved through a rapid change in the longitudinal section due to natural riverbed scour.
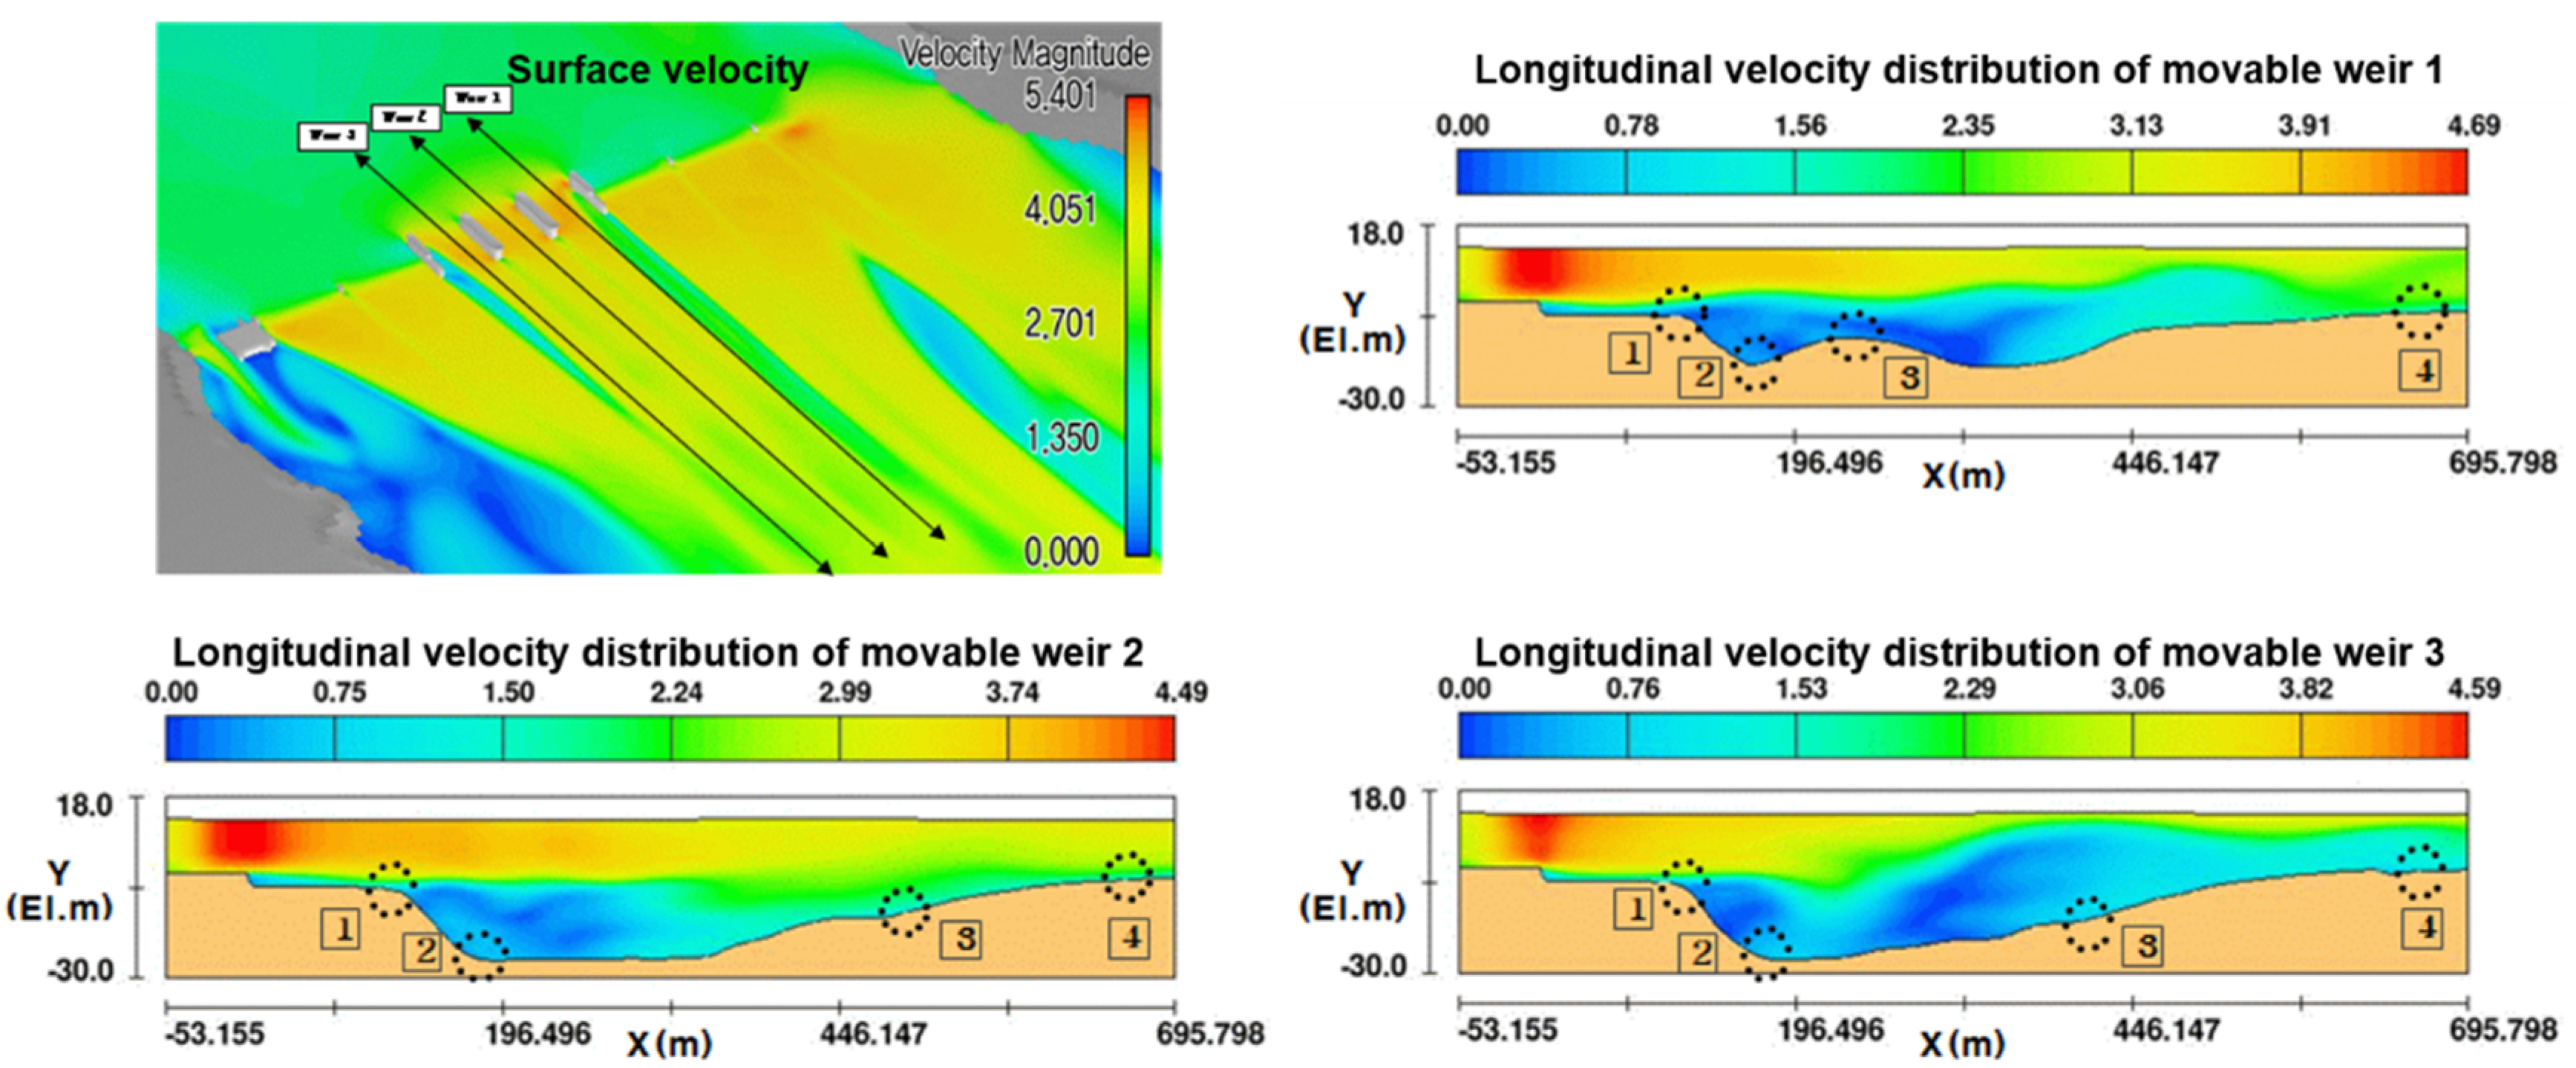
4.2.3. Case 5
As a result of the analysis of Case 5, a hydraulic jump did not occur due to the large flow discharge of the river. The results are shown in Table 9 and Figure 12. When examining the flow velocity in the bed protection section, a maximum flow velocity of 2.99 m/s occurred 124.5 m downstream of movable weir 2. As a result, the flow velocity propagation tendency was found up to about 200 m downstream with a high flow velocity of 3.0 m/s or more based on the maximum terminal velocity. It was also confirmed that the flow characteristics were restored to the average flow velocity of 2.0 m/s during a planned flooding as the flow passed through the puddle section.
4.2.4. Case 6
As a result of the analysis of Case 6, a hydraulic jump did not occur due to the large flow discharge of the river. The results are shown in Table 10 and Figure 13. When examining the flow velocity in the bed protection section, a maximum flow velocity of 4.36 m/s occurred 124.5 m downstream of movable weir 2. Again, it was confirmed that the flow velocity propagation tendency was restored to the average velocity of 2.0 m/s of a planned flood while passing through the puddle section about 150 m downstream based on the maximum longitudinal velocity.
4.2.5. Comparison of Analysis Results
Table 11 compares the results for the four virtual operating conditions. The change in the maximum downstream flow velocity according to the difference in water level, and the change in the maximum downstream flow velocity, water depth, and propagation distance according to the gate opening condition are shown.
In Cases 3 and 4, the management level condition, maximum velocity, and tractive force were greater downstream than in Cases 5 and 6. Therefore, it was confirmed that the effect of the water level difference on the downstream flow of the hydraulic structure has a greater effect than the discharge. In addition, Cases 3–6 were compared to check the difference in the downstream flow according to the opening of the gate. As a result, when all three gates were opened, the propagation distance of the flow was longer than when one gate was opened. In the case of opening one gate, the downstream maximum flow velocity and tractive force were greater than in the case of opening three gates. Therefore, Case 4, in which the maximum flow velocity and tractive force occurred, is judged to be the worst condition for hydraulic structure design.
4.3. Comparison with Actual Operating Conditions
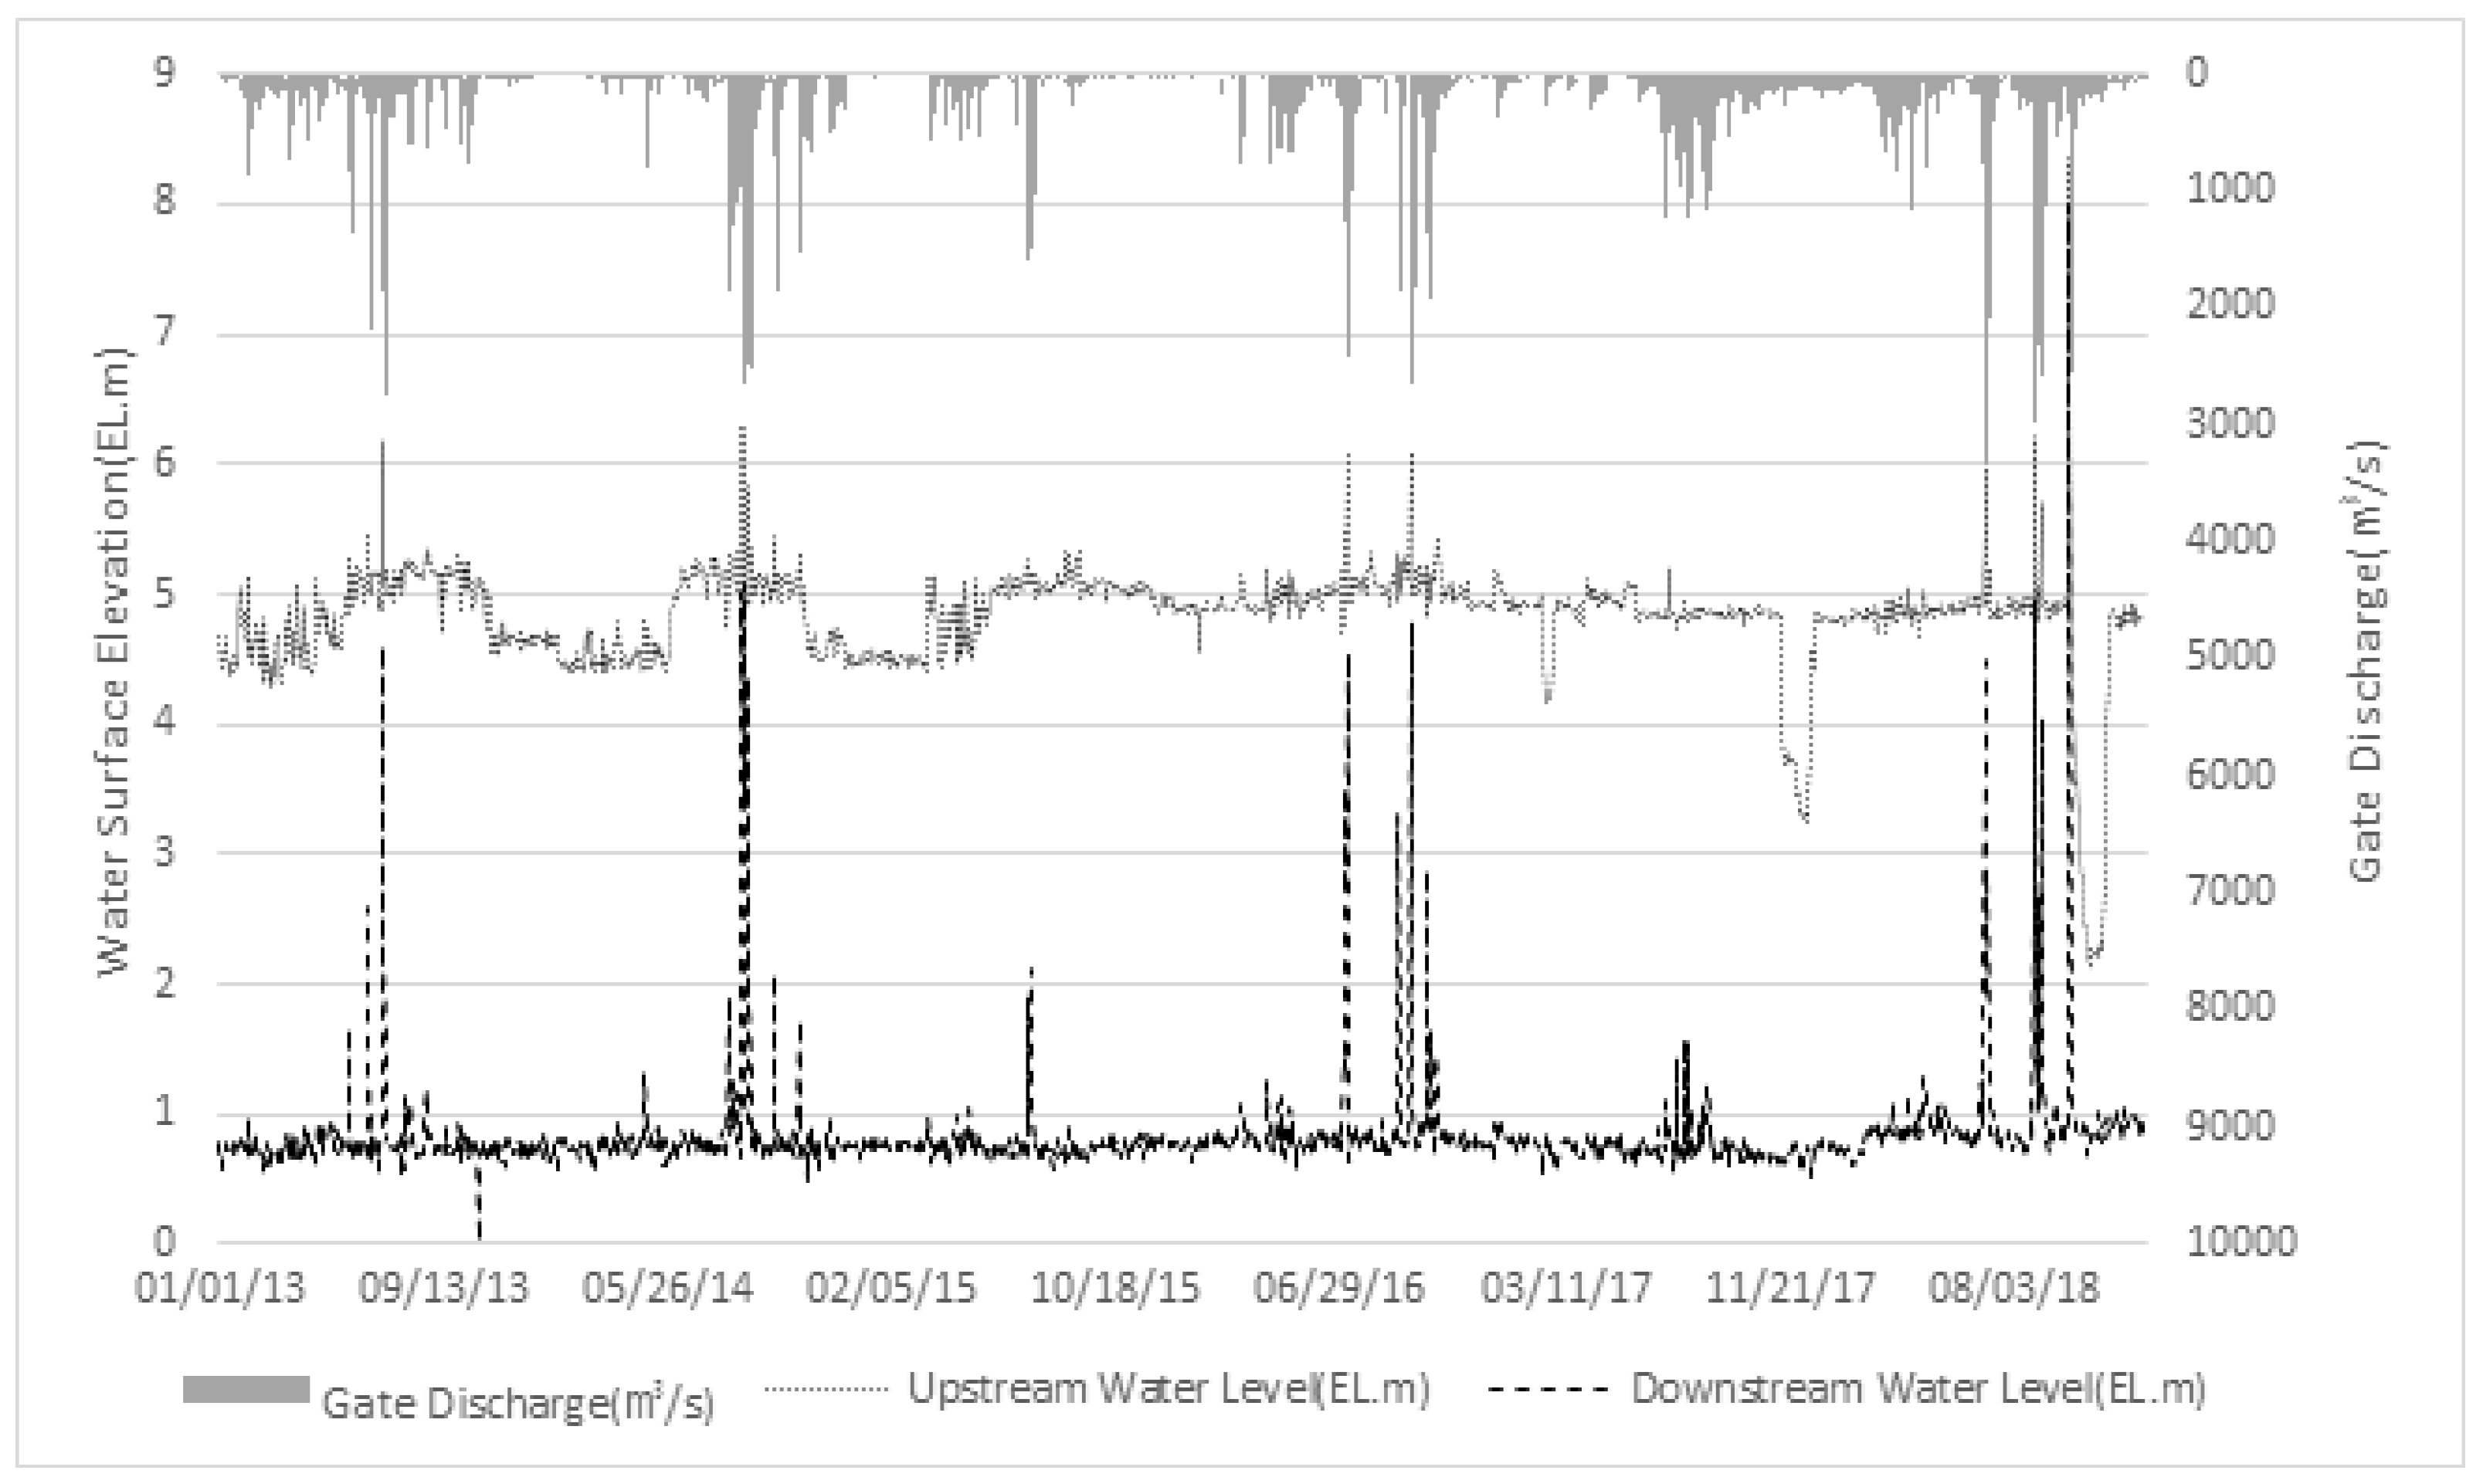
In real operating conditions, stronger flow conditions may occur than virtual conditions. Therefore, in this study, the Changnyeong-Haman weir gate operation history from 2013 to 2018 was reviewed (Figure 14). As for the review conditions, as shown in Table 12, the situation in which the sluice gate was discharged under the largest water level difference was selected as the comparative condition.
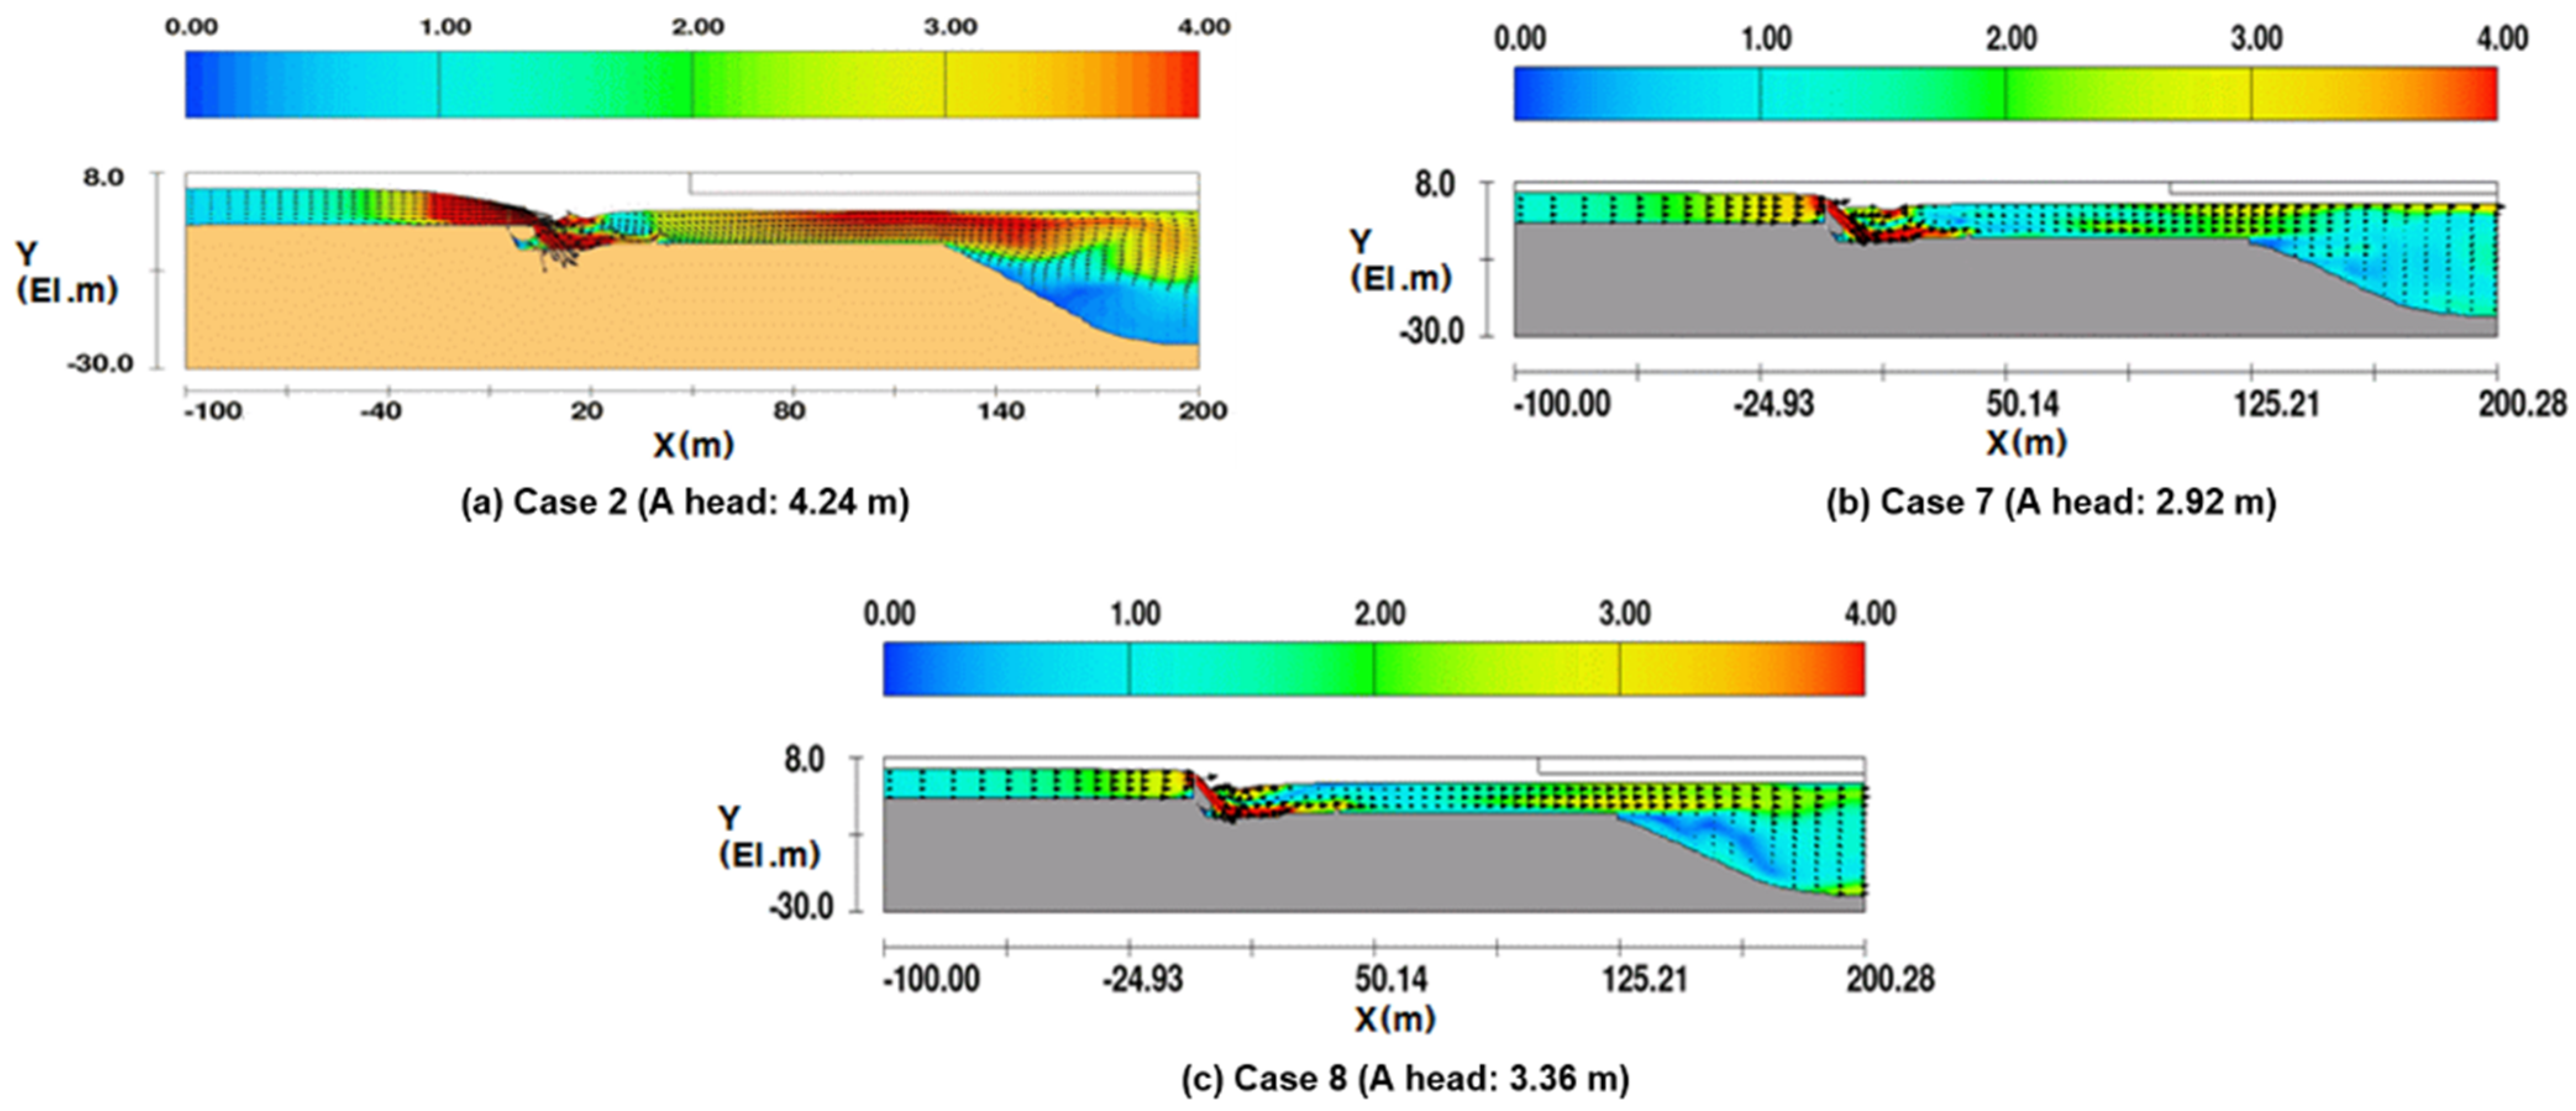
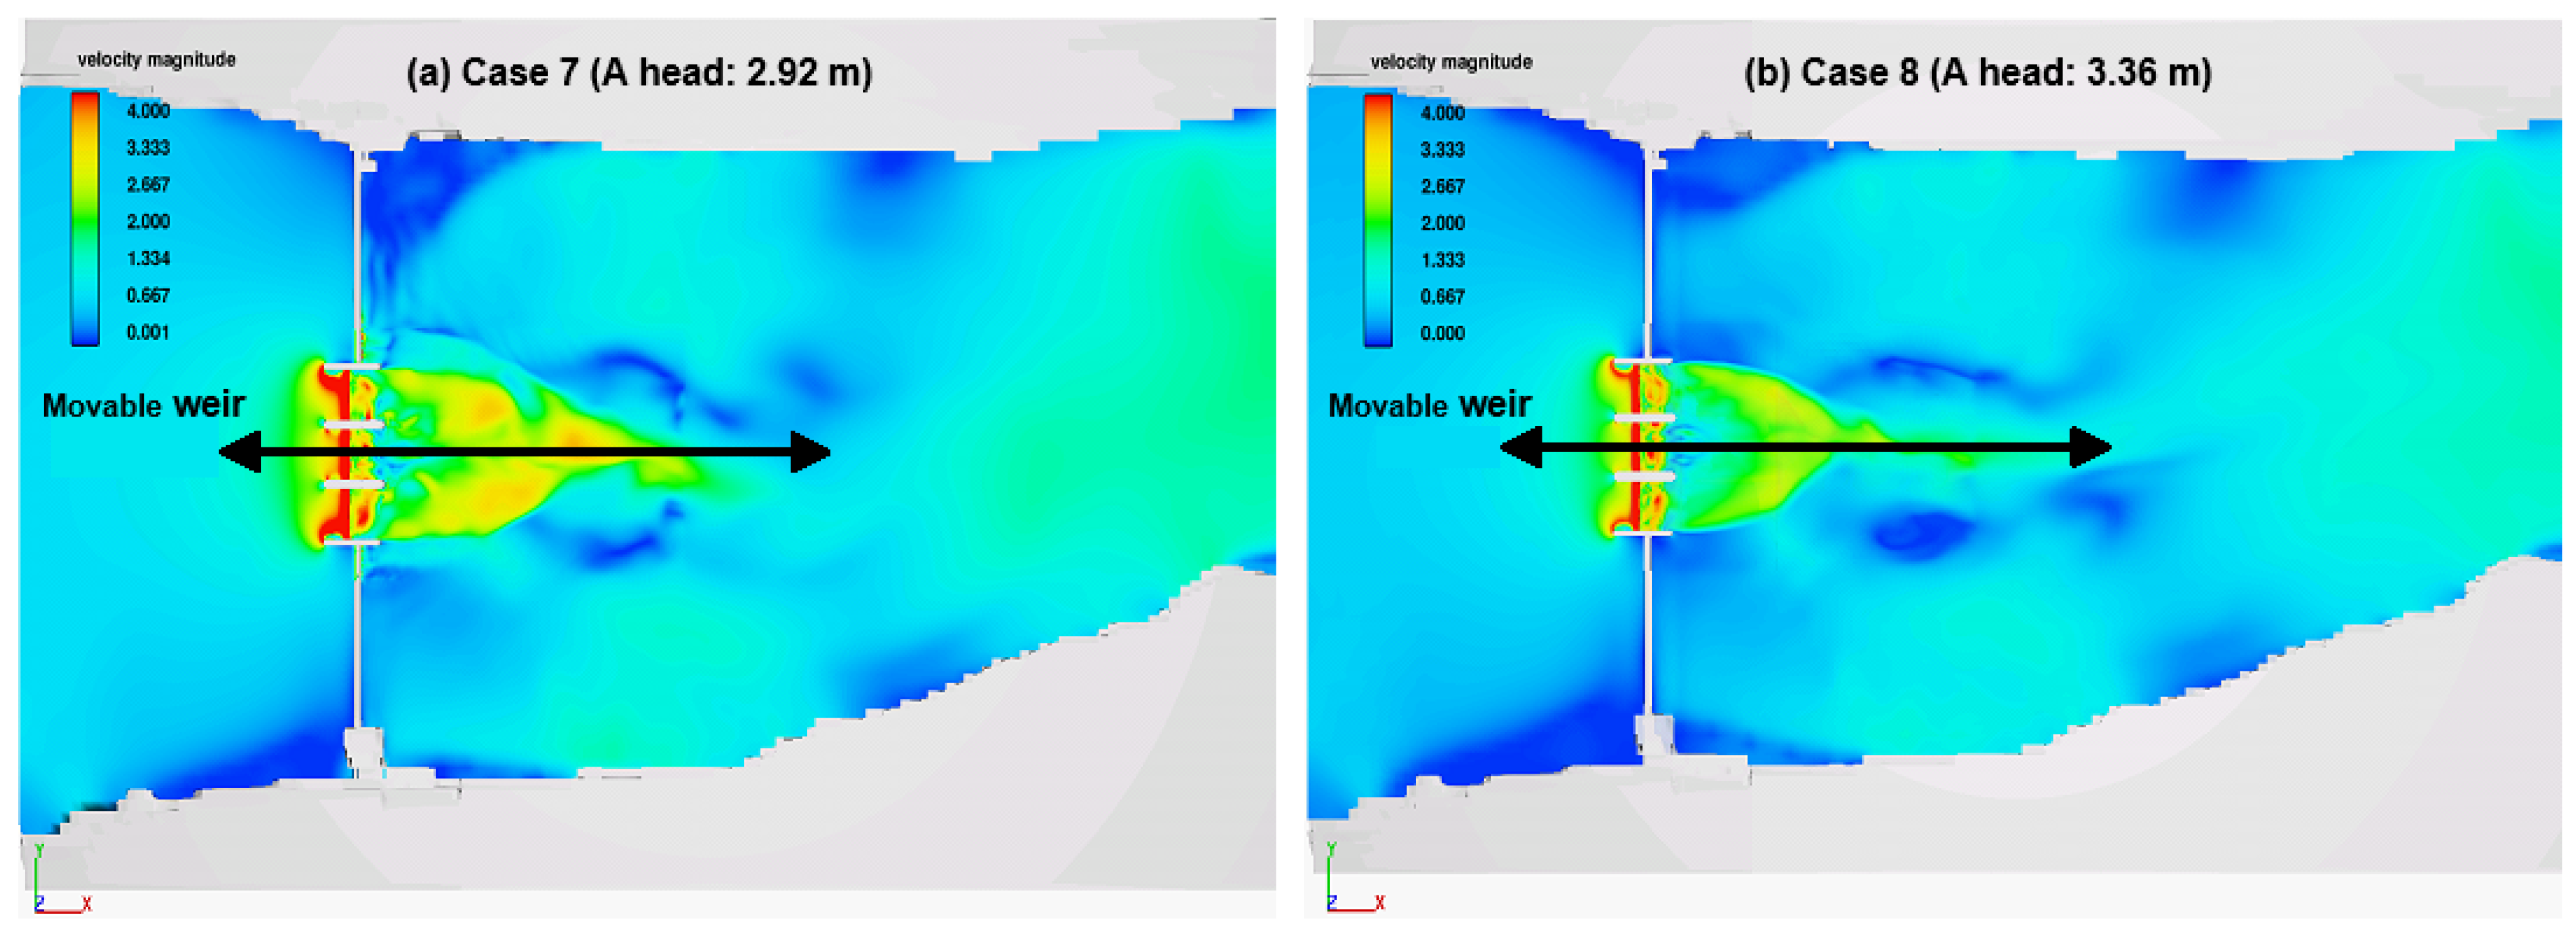
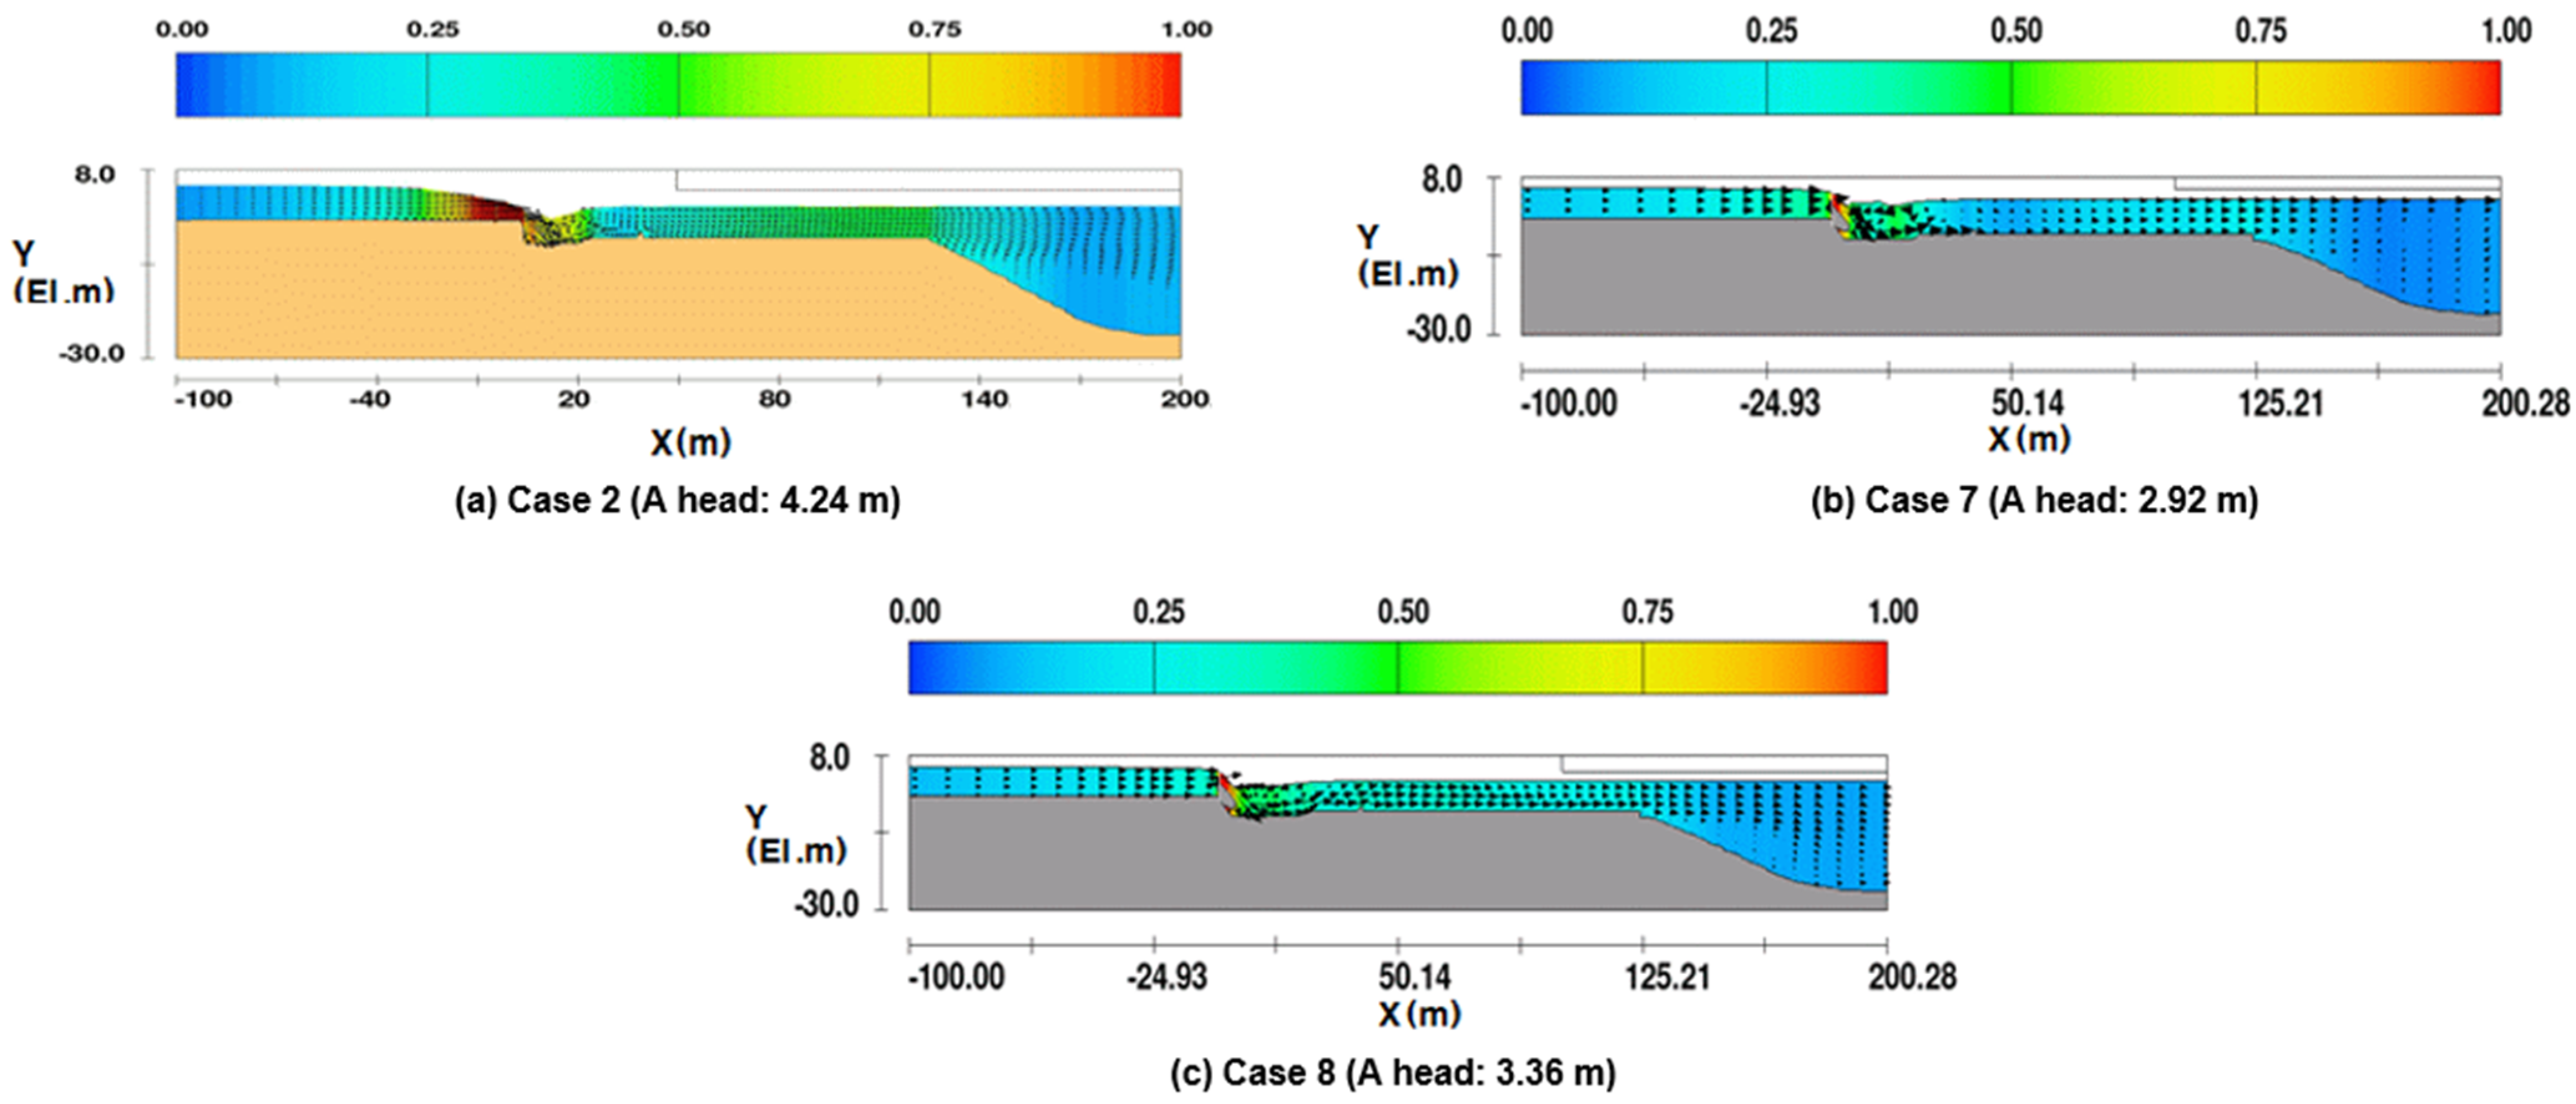
Case 7 is the condition in which all movable weir gates were opened by 3.8 m during the rainy season on 19 June 2013. Case 8 is the condition in which all movable weir gates were opened by 3.5 m during the rainy season on 9 July 2013. For the two cases, we examined how the downstream flow characteristics changed according to the upper and lower water levels and the gate opening condition. The analysis results are shown in Figure 15. The water level, flow velocity, and Froude number in each section were also compared, as shown in Figure 15, Figure 16 and Figure 17 and Table 13.
According to the analysis results, in Cases 7 and 8, it is judged that a hydraulic jump did not occur because the Froude number was maintained below 1, even in the section with gate overflow. The Froude number at the end of the apron was similar, around 0.2–0.3, in both design and actual operating conditions. Moreover, analyzing the velocity and Froude number in the bed protection section revealed that the actual operating conditions were lower than the design conditions. Therefore, it was possible to confirm that the previously selected design conditions were valid.
In Case 7, the gate opening was larger than in Case 8, whereas in Case 8, the water level difference between the upstream and downstream regions was larger than in Case 7. The average velocity and the bottom velocity at the section crossing the apron were largely analyzed in Case 7 with the large gate opening. On the other hand, the average of the maximum velocity in the bed protection section was largely analyzed in Case 8. As a result, it is judged that the gate opening has a large influence on the bottom velocity, and the upstream and downstream water level difference due to the influence of gravity waves has a more significant effect on the average flow velocity.
5. Conclusions
In this study, a 3D model was constructed to investigate the flow characteristics downstream of a hydraulic structure. The validity of the analysis model was first verified by comparing the analysis results with field discharge experiment results. Then, based on the verified analysis model, various boundary conditions and gate operating conditions were applied to identify the flow characteristics of the downstream hydraulic structures. The results of this study are summarized as follows:
- (1)
- A three-dimensional flow analysis tool that can calculate the flow velocity according to the water depth with the capability to handle rapidly varying flow analysis is essential for high-accuracy research. Therefore, among the commercialized 3D CFD programs, Flow Science Inc.’s FLOW-3D software was used, which has various application cases for domestic rivers, whereas the Changnyeong-Haman weir of the Nakdong River in the ROK was selected as the channel for analysis model construction.
- (2)
- A 3D flow analysis was performed by applying the same gate operating conditions as in a field gate discharge experiment. In the simulation results, the flow discharge differed from the measured value by 9–15 m3/s, from which the accuracy was evaluated to be 82–87%. The flow velocity was evaluated with an accuracy of 92% from a difference of 0.01 to 0.16 m/s. Accordingly, the suitability of the constructed analysis model was verified.
- (3)
- Based on the verified analysis model, various boundary conditions and gate operating conditions were applied to analyze the flow characteristics downstream of the hydraulic structure, the results of which were compared with the field experiment results. Case 4, where the maximum flow rate occurred in the bed protection section, was analyzed as the worst condition for hydraulic structure design.
- (4)
- Finally, by reviewing the gate operation performance of the Changnyeong-Haman weir from 2013 to 2018, two cases in which the sluice gate was opened by more than 50% under a large water level difference were selected, and the flow characteristics were analyzed. As a result of the analysis, the actual operating conditions showed that the velocity and the Froude number were lower than the optimal conditions, confirming that the selected design conditions were appropriate. Additionally, the flow velocity for the apron section was analyzed to be higher as the gate opening was larger. In the bed protection section, it was confirmed that the average flow velocity was high when the water level difference was large, and the bottom velocity was high when the gate opening was large.
Based on the results of this study, the developed FLOW-3D-based model can be applied to creating or updating flow analysis guidelines for future repair and reinforcement measures, as well as for hydraulic structure design. In addition, if the flow characteristics according to gate operation are analyzed in connection with soil transport and the transport-diffusion of pollutants, the developed model can be effectively applied to the prediction of riverbed fluctuations and water quality problems.
Author Contributions
Conceptualization, B.-J.K. and B.K.; Formal analysis, J.-H.H.; Methodology, B.-J.K. and J.-H.H.; Project administration, J.-H.H.; Supervision, B.K.; Writing—original draft, B.-J.K.; Writing—review & editing, B.K. All authors have read and agreed to the published version of the manuscript.
Funding
This work was supported by a National Research Foundation of Korea (NRF) grant funded by the Korean government (RS-2022-00144493). This work was also supported by the NRF (2020R1I1A3074459).
Institutional Review Board Statement
Not applicable.
Informed Consent Statement
Not applicable.
Data Availability Statement
Not applicable.
Conflicts of Interest
The authors declare that they have no known competing financial interest or personal relationship that could have appeared to influence the work reported in this paper.
References
- Wanoschek, R.; Hager, W.H. Hydraulic jump in trapezoidal channel. J. Hydraul. Res. 1989, 27, 429–446. [Google Scholar] [CrossRef]
- Bohr, T.; Dimon, P.; Putkaradze, V. Shallow-water approach to the circular hydraulic jump. J. Fluid Mech. 1993, 254, 635–648. [Google Scholar] [CrossRef]
- Chanson, H.; Brattberg, T. Experimental study of the air–water shear flow in a hydraulic jump. Int. J. Multiph. Flow 2000, 26, 583–607. [Google Scholar] [CrossRef]
- Dhamotharan, S.; Gulliver, J.S.; Stefan, H.G. Unsteady one-dimensional settling of suspended sediment. Water Resour. Res. 1981, 17, 1125–1132. [Google Scholar] [CrossRef]
- Ziegler, C.K.; Nisbet, B.S. Long-term simulation of fine-grained sediment transport in large reservoir. J. Hydraul. Eng. 1995, 121, 773–781. [Google Scholar] [CrossRef]
- Olsen, N.R.B. Two-dimensional numerical modelling of flushing processes in water reservoirs. J. Hydraul. Res. 1999, 37, 3–16. [Google Scholar] [CrossRef]
- Saad, N.Y.; Fattouh, E.M. Hydraulic characteristics of flow over weirs with circular openings. Ain Shams Eng. J. 2017, 8, 515–522. [Google Scholar] [CrossRef]
- Bagheri, S.; Kabiri-Samani, A.R. Hydraulic Characteristics of flow over the streamlined weirs. Modares Civ. Eng. J. 2018, 17, 29–42. [Google Scholar]
- Hussain, Z.; Khan, S.; Ullah, A.; Ayaz, M.; Ahmad, I.; Mashwani, W.K.; Chu, Y.-M. Extension of optimal homotopy asymptotic method with use of Daftardar–Jeffery polynomials to Hirota–Satsuma coupled system of Korteweg–de Vries equations. Open Phys. 2020, 18, 916–924. [Google Scholar] [CrossRef]
- Arifeen, S.U.; Haq, S.; Ghafoor, A.; Ullah, A.; Kumam, P.; Chaipanya, P. Numerical solutions of higher order boundary value problems via wavelet approach. Adv. Differ. Equ. 2021, 2021, 347. [Google Scholar] [CrossRef]
- Sharafati, A.; Haghbin, M.; Motta, D.; Yaseen, Z.M. The application of soft computing models and empirical formulations for hydraulic structure scouring depth simulation: A comprehensive review, assessment and possible future research direction. Arch. Comput. Methods Eng. 2021, 28, 423–447. [Google Scholar] [CrossRef]
- Khan, S.; Selim, M.M.; Khan, A.; Ullah, A.; Abdeljawad, T.; Ayaz, M.; Mashwani, W.K. On the analysis of the non-Newtonian fluid flow past a stretching/shrinking permeable surface with heat and mass transfer. Coatings 2021, 11, 566. [Google Scholar] [CrossRef]
- Khan, S.; Selim, M.M.; Gepreel, K.A.; Ullah, A.; Ayaz, M.; Mashwani, W.K.; Khan, E. An analytical investigation of the mixed convective Casson fluid flow past a yawed cylinder with heat transfer analysis. Open Phys. 2021, 19, 341–351. [Google Scholar] [CrossRef]
- Ullah, A.; Selim, M.M.; Abdeljawad, T.; Ayaz, M.; Mlaiki, N.; Ghafoor, A. A Magnetite–Water-Based Nanofluid Three-Dimensional Thin Film Flow on an Inclined Rotating Surface with Non-Linear Thermal Radiations and Couple Stress Effects. Energies 2021, 14, 5531. [Google Scholar] [CrossRef]
- Aamir, M.; Ahmad, Z.; Pandey, M.; Khan, M.A.; Aldrees, A.; Mohamed, A. The Effect of Rough Rigid Apron on Scour Downstream of Sluice Gates. Water 2022, 14, 2223. [Google Scholar] [CrossRef]
- Gharebagh, B.A.; Bazargan, J.; Mohammadi, M. Experimental Investigation of Bed Scour Rate in Flood Conditions. Environ. Water Eng. 2022; in press. [Google Scholar] [CrossRef]
- Laishram, K.; Devi, T.T.; Singh, N.B. Experimental Comparison of Hydraulic Jump Characteristics and Energy Dissipation Between Sluice Gate and Radial Gate. In Innovative Trends in Hydrological and Environmental Systems; Springer: Berlin/Heidelberg, Germany, 2022; pp. 207–218. [Google Scholar]
- Varaki, M.E.; Sedaghati, M.; Sabet, B.S. Effect of apron length on local scour at the downstream of grade control structures with labyrinth planform. Arab. J. Geosci. 2022, 15, 1240. [Google Scholar] [CrossRef]
- Rizk, D.; Ullah, A.; Elattar, S.; Alharbi, K.A.M.; Sohail, M.; Khan, R.; Khan, A.; Mlaiki, N. Impact of the KKL Correlation Model on the Activation of Thermal Energy for the Hybrid Nanofluid (GO+ ZnO+ Water) Flow through Permeable Vertically Rotating Surface. Energies 2022, 15, 2872. [Google Scholar] [CrossRef]
- Kim, K.H.; Choi, G.W.; Jo, J.B. An Experimental Study on the Stream Flow by Discharge Ratio. Korea Water Resour. Assoc. Acad. Conf. 2005, 05b, 377–382. [Google Scholar]
- Lee, D.S.; Yeo, H.G. An Experimental Study for Determination of the Material Diameter of Riprap Bed Protection Structure. Korea Water Resour. Assoc. Acad. Conf. 2005, 05b, 1036–1039. [Google Scholar]
- Choi, G.W.; Byeon, S.J.; Kim, Y.G.; Cho, S.U. The Flow Characteristic Variation by Installing a Movable Weir having Water Drainage Equipment on the Bottom. J. Korean Soc. Hazard Mitig. 2008, 8, 117–122. [Google Scholar]
- Jung, J.G. An Experimental Study for Estimation of Bed Protection Length. J. Korean Wetl. Soc. 2011, 13, 677–686. [Google Scholar]
- Kim, S.H.; Kim, W.; Lee, E.R.; Choi, G.H. Analysis of Hydraulic Effects of Singok Submerged Weir in the Lower Han River. J. Korean Water Resour. Assoc. 2005, 38, 401–413. [Google Scholar] [CrossRef]
- Kim, J.H.; Sim, M.P.; Choi, G.W.; Oh, J.M. Hydraulic Analysis of Air Entrainment by Weir Types. J. Korean Water Resour. Assoc. 2003, 36, 971–984. [Google Scholar] [CrossRef]
- Jeong, S.; Yeo, C.G.; Yun, G.S.; Lee, S.O. Analysis of Characteristics for Bank Scour around Low Dam using 3D Numerical Simulation. Korean Soc. Hazard Mitig. Acad. Conf. 2011, 02a, 102. [Google Scholar]
- Son, A.R.; Kim, B.H.; Moon, B.R.; Han, G.Y. An Analysis of Bed Change Characteristics by Bed Protection Work. J. Korean Soc. Civ. Eng. 2015, 35, 821–834. [Google Scholar]
- French, R.H.; French, R.H. Open-Channel Hydraulics; McGraw-Hill: New York, NY, USA, 1985; ISBN 0070221340. [Google Scholar]
Figure 1.
Effect of downstream riverbed erosion according to the type of weir foundation.

Figure 2.
Changnyeong-Haman weir depth survey results (June 2015).

Figure 3.
Grid of the model and 3D terrain shape.

Figure 4.
Field gate discharge experiment.

Figure 5.
Gate operating conditions in the discharge experiment.

Figure 6.
Surface velocity results from a 0.7 m open gate.

Figure 7.
Surface velocity results from a 1.2 m open gate.

Figure 8.
Numerical simulation results for the gate discharge test conditions, Case 1. (a) Case 1 surface velocity distribution. (b) Case 1 longitudinal velocity distribution of gate center.
Figure 8.
Numerical simulation results for the gate discharge test conditions, Case 1. (a) Case 1 surface velocity distribution. (b) Case 1 longitudinal velocity distribution of gate center.

Figure 9.
Numerical simulation results for the gate discharge test conditions, Case 2. (a) Case 2 surface velocity distribution. (b) Case 2 longitudinal velocity distribution of gate center.
Figure 9.
Numerical simulation results for the gate discharge test conditions, Case 2. (a) Case 2 surface velocity distribution. (b) Case 2 longitudinal velocity distribution of gate center.

Figure 10.
Analysis result of Case 3.

Figure 11.
Analysis result of Case 4.

Figure 12.
Analysis result of Case 5.

Figure 13.
Analysis result of Case 6.

Figure 14.
Changnyeong-Haman weir gate operation in the period 2013–2018.

Figure 15.
Analysis results of vertical velocity: Case 2, Case 7, Case 8.

Figure 16.
Analysis results for Case 7 and Case 8.

Figure 17.
Analysis results for the Froude number: Case 2, Case 7, Case 8.


Table 1.
Modeling range.
| Division | X Axis (Left, Right) | Y Axis (Flow Direction+) | Z Axis (Vertical Direction) | |||
|---|---|---|---|---|---|---|
| Min | Max | Min | Max | Min | Max | |
| Coordinates | −800 | 600 | −1000 | 1700 | −30 | 18 |
Table 2.
Grid size of the model.
| Division | X Size (m) | Y Size (m) | Z Size (m) | Grid Number | |||
|---|---|---|---|---|---|---|---|
| Min | Max | Min | Max | Min | Max | ||
| Surrounding structure | 0.25 | 0.25 | 0.50 | 0.50 | 0.23 | 0.26 | 153,600 |
| Upstream and downstream sections | 1.25 | 2.69 | 1.00 | 3.90 | 0.33 | 0.38 | 612,000 |
| Other | 2.00 | 12.20 | 4.00 | 9.40 | 0.90 | 1.20 | 775,200 |
| Total | 1,540,800 | ||||||
Table 3.
Overall results of the field gate discharge experiment.
| Division | Gate Opening | Surface Velocity (m/s) | |||
|---|---|---|---|---|---|
| Review | 20 m Downstream | 35 m Downstream | 55 m Downstream | ||
| Case 1 | 0.7 m (9%) | Min | 1.208 | 0.934 | 0.448 |
| Max | 0.240 | 0.135 | 0.201 | ||
| Average | 0.810 | 0.290 | 0.310 | ||
| Case 2 | 1.2 m (15%) | Min | 0.625 | 1.272 | 1.071 |
| Max | 0.243 | 0.100 | 0.798 | ||
| Average | 0.420 | 0.690 | 0.960 | ||
Table 4.
Comparison of field gate discharge experiment and numerical analysis results, Case 1.
| Division | Discharge (m3/s) | Surface Velocity (m/s) | ||
|---|---|---|---|---|
| 20 m Downstream | 35 m Downstream | 55 m Downstream | ||
| Field experiment | 50 | 0.81 | 0.29 | 0.31 |
| Numerical analysis | 59 | 0.80 | 0.33 | 0.34 |
| Difference | +9 | −0.01 | +0.04 | +0.03 |
| Accuracy | 82% | 99% | 86% | 90% |
Table 5.
Comparison of field gate discharge experiment and numerical analysis results, Case 2.
| Division | Discharge (m3/s) | Surface Velocity (m/s) | ||
|---|---|---|---|---|
| 20 m Downstream | 35 m Downstream | 55 m Downstream | ||
| Field experiment | 112 | 0.42 | 0.69 | 0.96 |
| Numerical analysis | 127 | 0.41 | 0.72 | 1.12 |
| Difference | +15 | −0.01 | +0.03 | +0.16 |
| Accuracy | 87% | 98% | 96% | 83% |
Table 6.
Boundary conditions for flow characteristics analysis.
| Division | Upstream Level (EL. m) | Downstream Level (EL. m) | Gate Operation | ||
|---|---|---|---|---|---|
| Virtual condition | Managementwater level | Case 3 | 5.00 | 0.76 | Full opening, three gates |
| Case 4 | 5.00 | 0.76 | Full opening, central gate | ||
| 100-year frequency | Case 5 | 12.80 | 12.03 | Full opening, three gates | |
| Case 6 | 12.80 | 12.03 | Full opening, central gate | ||
Table 7.
Comparison of maximum velocity by vertical section, Case 3.
| Division | Flow Velocity (m/s) | Tractive Force (N/m2) | ||||
|---|---|---|---|---|---|---|
| Weir 1 | Weir 2 | Weir 3 | Weir 1 | Weir 2 | Weir 3 | |
| No. 1 point | 3.98 | 5.14 | 4.81 | 18.47 | 30.95 | 26.89 |
| No. 2 point | 0.84 | 1.86 | 0.60 | 0.57 | 2.57 | 0.26 |
| No. 3 point | 1.81 | 1.98 | 1.53 | 3.10 | 3.52 | 2.02 |
| No. 4 point | 1.73 | 3.58 | 2.35 | 8.32 | 14.97 | 7.26 |
Table 8.
Comparison of maximum velocity by vertical section, Case 4.
| Division | Flow Velocity (m/s) | Tractive Force (N/m2) |
|---|---|---|
| Weir 2 | Weir 2 | |
| No. 1 point | 5.18 | 26.89 |
| No. 2 point | 1.17 | 0.26 |
| No. 3 point | 2.07 | 2.02 |
| No. 4 point | 1.32 | 7.26 |
Table 9.
Comparison of maximum velocity by vertical section, Case 5.
| Division | Flow Velocity (m/s) | Tractive Force (N/m2) | ||||
|---|---|---|---|---|---|---|
| Weir 1 | Weir 2 | Weir 3 | Weir 1 | Weir 2 | Weir 3 | |
| No. 1 point | 3.98 | 5.14 | 4.81 | 18.47 | 30.95 | 26.89 |
| No. 2 point | 0.84 | 1.86 | 0.60 | 0.57 | 2.57 | 0.26 |
| No. 3 point | 1.81 | 1.98 | 1.53 | 3.10 | 3.52 | 2.02 |
| No. 4 point | 1.73 | 3.58 | 2.35 | 8.32 | 14.97 | 7.26 |
Table 10.
Comparison of maximum velocity by vertical section, Case 6.
| Division | Flow Velocity (m/s) | Tractive Force (N/m2) |
|---|---|---|
| Weir 2 | Weir 2 | |
| No. 1 point | 4.36 | 16.07 |
| No. 2 point | 0.16 | 0.02 |
| No. 3 point | 1.66 | 2.06 |
| No. 4 point | 2.01 | 3.44 |
Table 11.
Comparison of analysis results by case.
| Division | Weir Gate | Water Level (Upstream, m) | Water Level (Downstream, m) | Velocity (m/s) | Depth (m) | Tractive Force (N/m2) | Propagation Distance (m) |
|---|---|---|---|---|---|---|---|
| Case 3 | #1 | 5.00 | 0.76 | 3.98 | 6.80 | 18.47 | 700 |
| #2 | 5.14 | 6.70 | 30.95 | 700 | |||
| #3 | 4.81 | 6.83 | 26.89 | 700 | |||
| Case 4 | #2 | 5.00 | 0.76 | 5.81 | 6.38 | 40.53 | 200 |
| Case 5 | #1 | 12.80 | 12.03 | 2.13 | 18.07 | 3.83 | 700 |
| #2 | 2.99 | 18.08 | 7.49 | 700 | |||
| #3 | 2.61 | 18.06 | 5.73 | 700 | |||
| Case 6 | #2 | 12.80 | 12.03 | 4.36 | 17.78 | 16.07 | 200 |
Table 12.
Boundary conditions for comparison with actual operating conditions.
| Division | Upstream Water Level (E.L. m) | Downstream Water Level (E.L. m) | Gate Operation | |
|---|---|---|---|---|
| Actual operating conditions | Case 7 | 5.50 | 2.58 | All gates, 54% open |
| Case 8 | 5.14 | 1.78 | All gates, 49% open | |
Table 13.
Analysis results by point for the design condition and actual operating conditions.
| Division | Observation Point (m) | |||||||||||||||
| −50 | −40 | −35 | −30 | −25 | −20 | −10 | 0 | 2.9 | 3.9 | 6.2 | 6.9 | 10 | 15 | |||
| Water level (EL. m) | Design | 4.83 | 4.69 | 4.58 | 4.38 | 4.10 | 3.69 | 2.61 | 1.20 | 0.46 | −0.39 | −1.57 | −1.45 | −1.06 | −0.12 | |
| Case 7 | 5.29 | 5.24 | 5.20 | 5.16 | 5.11 | 5.03 | 4.87 | 1.21 | 1.90 | 1.83 | 1.57 | 1.67 | 1.75 | 1.20 | ||
| Case 8 | 4.99 | 4.96 | 4.93 | 4.91 | 4.86 | 4.83 | 4.71 | 0.03 | 0.69 | 0.69 | 0.74 | 0.72 | 0.39 | 0.71 | ||
| Depth (m) | Design | 6.83 | 6.69 | 6.58 | 6.46 | 6.18 | 5.77 | 4.86 | 3.28 | 2.70 | 6.36 | 5.18 | 5.30 | 5.69 | 6.63 | |
| Case 7 | 7.29 | 7.24 | 7.20 | 7.24 | 7.17 | 7.11 | 6.96 | 3.66 | 8.65 | 8.58 | 8.32 | 8.42 | 8.50 | 7.95 | ||
| Case 8 | 6.99 | 6.96 | 6.93 | 6.99 | 6.94 | 6.91 | 6.80 | 2.93 | 7.44 | 7.44 | 7.49 | 7.47 | 7.14 | 7.46 | ||
| Velocity (m/s) | Average | Design | 1.68 | 2.34 | 2.78 | 3.43 | 4.17 | 5.07 | 6.65 | 9.09 | 11.6 | 6.69 | 6.77 | 6.45 | 5.73 | 5.25 |
| Case 7 | 1.98 | 2.23 | 2.42 | 2.55 | 2.81 | 3.02 | 3.30 | 7.50 | 3.79 | 3.58 | 3.33 | 3.30 | 3.44 | 4.04 | ||
| Case 8 | 1.63 | 1.82 | 1.96 | 2.07 | 2.29 | 2.46 | 2.68 | 8.00 | 3.61 | 3.42 | 3.52 | 3.54 | 3.95 | 3.50 | ||
| Bed | Design | 1.06 | 1.57 | 1.97 | 2.57 | 3.25 | 4.37 | 6.22 | 9.09 | 13.2 | 1.03 | 1.80 | 2.70 | 6.60 | 7.90 | |
| Case 7 | 1.52 | 1.72 | 1.92 | 1.96 | 2.21 | 2.42 | 2.20 | 6.36 | 1.06 | 1.89 | 4.36 | 4.87 | 6.42 | 6.32 | ||
| Case 8 | 1.24 | 1.38 | 1.53 | 1.57 | 1.79 | 1.97 | 1.71 | 8.34 | 1.97 | 3.37 | 5.29 | 5.60 | 6.93 | 6.28 | ||
| Froude number | Design | 0.20 | 0.29 | 0.35 | 0.43 | 0.54 | 0.67 | 0.97 | 1.60 | 2.25 | 0.85 | 0.95 | 0.90 | 0.77 | 0.65 | |
| Case 7 | 0.23 | 0.26 | 0.29 | 0.30 | 0.33 | 0.36 | 0.40 | 0.76 | 0.42 | 0.40 | 0.38 | 0.38 | 0.41 | 0.46 | ||
| Case 8 | 0.20 | 0.22 | 0.24 | 0.25 | 0.28 | 0.29 | 0.32 | 0.75 | 0.48 | 0.45 | 0.43 | 0.43 | 0.45 | 0.41 | ||
| Upstream bed protection | Concrete + gate | Downstream apron | ||||||||||||||
| Division | Observation point (m) | |||||||||||||||
| 20 | 25 | 30 | 50 | 60 | 70 | 80 | 90 | 100 | 110 | 120 | 150 | 175 | 200 | |||
| Water level (EL. m) | Design | −0.73 | 0.13 | 0.43 | 0.72 | 0.75 | 0.70 | 0.68 | 0.70 | 0.69 | 0.68 | 0.68 | 0.70 | 0.71 | 0.70 | |
| Case 7 | 1.97 | 2.28 | 2.41 | 2.52 | 2.59 | 2.57 | 2.53 | 2.55 | 2.57 | 2.55 | 2.50 | 2.57 | 2.59 | 2.57 | ||
| Case 8 | 1.18 | 1.42 | 1.62 | 1.74 | 1.79 | 1.82 | 1.79 | 1.74 | 1.72 | 1.72 | 1.72 | 1.73 | 1.79 | 1.80 | ||
| Depth (m) | Design | 6.02 | 5.83 | 6.13 | 6.42 | 6.45 | 6.40 | 6.38 | 6.40 | 6.39 | 6.38 | 6.38 | 15.90 | 24.26 | 26.07 | |
| Case 7 | 8.58 | 7.98 | 8.09 | 8.22 | 8.29 | 8.27 | 8.23 | 8.25 | 8.27 | 8.25 | 8.20 | 17.41 | 25.88 | 27.70 | ||
| Case 8 | 7.79 | 7.17 | 7.32 | 7.44 | 7.49 | 7.52 | 7.49 | 7.44 | 7.42 | 7.42 | 7.42 | 16.98 | 25.22 | 27.07 | ||
| Velocity (m/s) | Average | Design | 4.47 | 2.93 | 1.91 | 2.46 | 2.70 | 3.03 | 3.25 | 3.38 | 3.43 | 3.41 | 3.43 | 1.84 | 1.32 | 1.70 |
| Case 7 | 3.36 | 2.32 | 1.76 | 1.66 | 1.80 | 1.82 | 1.80 | 1.73 | 1.75 | 2.04 | 2.32 | 1.45 | 1.11 | 1.27 | ||
| Case 8 | 2.59 | 1.98 | 1.49 | 1.11 | 1.05 | 1.25 | 1.50 | 1.67 | 1.88 | 2.13 | 2.36 | 1.32 | 1.33 | 1.51 | ||
| Bed | Design | 5.80 | 5.76 | 4.08 | 1.52 | 1.69 | 1.96 | 2.13 | 2.20 | 2.18 | 2.11 | 2.19 | 0.18 | 0.35 | 0.42 | |
| Case 7 | 4.28 | 3.95 | 3.58 | 1.96 | 1.66 | 1.39 | 1.23 | 1.71 | 1.67 | 1.77 | 2.00 | 0.93 | 1.27 | 1.55 | ||
| Case 8 | 4.06 | 3.95 | 2.18 | 1.39 | 1.15 | 1.01 | 0.94 | 0.91 | 1.09 | 1.37 | 1.69 | 1.12 | 1.26 | 2.03 | ||
| Froude number | Design | 0.56 | 0.39 | 0.25 | 0.31 | 0.34 | 0.38 | 0.41 | 0.43 | 0.43 | 0.43 | 0.43 | 0.15 | 0.09 | 0.11 | |
| Case 7 | 0.35 | 0.26 | 0.20 | 0.19 | 0.20 | 0.20 | 0.20 | 0.19 | 0.19 | 0.23 | 0.26 | 0.11 | 0.07 | 0.08 | ||
| Case 8 | 0.37 | 0.35 | 0.32 | 0.32 | 0.33 | 0.33 | 0.29 | 0.28 | 0.27 | 0.27 | 0.27 | 0.10 | 0.10 | 0.10 | ||
| Downstream apron | Downstream bed protection | Stone reinforcement | ||||||||||||||
Publisher’s Note: MDPI stays neutral with regard to jurisdictional claims in published maps and institutional affiliations. |
© 2022 by the authors. Licensee MDPI, Basel, Switzerland. This article is an open access article distributed under the terms and conditions of the Creative Commons Attribution (CC BY) license (https://creativecommons.org/licenses/by/4.0/).
Share and Cite
MDPI and ACS Style
Kim, B.-J.; Hwang, J.-H.; Kim, B. FLOW-3D Model Development for the Analysis of the Flow Characteristics of Downstream Hydraulic Structures. Sustainability 2022, 14, 10493. https://doi.org/10.3390/su141710493
AMA Style
Kim B-J, Hwang J-H, Kim B. FLOW-3D Model Development for the Analysis of the Flow Characteristics of Downstream Hydraulic Structures. Sustainability. 2022; 14(17):10493. https://doi.org/10.3390/su141710493
Chicago/Turabian StyleKim, Beom-Jin, Jae-Hong Hwang, and Byunghyun Kim. 2022. "FLOW-3D Model Development for the Analysis of the Flow Characteristics of Downstream Hydraulic Structures" Sustainability 14, no. 17: 10493. https://doi.org/10.3390/su141710493
Note that from the first issue of 2016, this journal uses article numbers instead of page numbers. See further details here.