Article

The Future Impacts of ESL Events in Euro-Mediterranean Coastal Cities: The Coast-RiskBySea Model to Assess the Potential Economic Damages in Naples, Marseille and Barcelona

by
Maria Fabrizia Clemente
Department of Architecture, University of Naples Federico II, 80138 Naples, Italy
Sustainability 2022, 14(16), 10096; https://doi.org/10.3390/su141610096
Submission received: 14 June 2022 / Revised: 26 July 2022 / Accepted: 28 July 2022 / Published: 15 August 2022

Abstract

:
In coastal cities, the effects of climate change will cause an increase in the intensity and frequency of extreme sea level (ESL). In this scenario, the application of the Coast-RiskBySea model is proposed to assess the economic impacts of ESL on the built environment in three Euro-Mediterranean coastal cities: Naples, Barcelona, and Marseille. The risk (land use-based) is assessed in the GIS environment as a function of the potential direct and tangible economic damages. The results highlight risk scenarios in all three cities with significant economic damages expected, requiring the implementation of climate mitigation and adaptation measures to reduce the current impacts and limit future ones. The simulations highlight the potential of both remote sensing data and GIS systems to carry out homogeneous environmental analyses over wide areas. The results that were obtained are compared with existing works to verify the reliability of the Coast-RiskBySea model.

1. Introduction

In the Anthropocene, the human influence in warming the atmosphere, oceans, and soils is tangible and undeniable, as are the negative impacts of global warming on the climate and its effects on the natural and built environment [1].
As confirmed in the latest IPCC reports, coastal cities are increasingly vulnerable to the growing impacts of climate change in both the short- and mid- to long- terms, with significant expected impacts on socio-economic systems [2,3,4]. In this context, the Euro-Mediterranean coastal cities are considered high-risk areas. The major climate challenges for urban-coastal settlements derive from the sea level rise and from the increase, in frequency and intensity, of extreme climate events such as cyclones, storms and/or storm surges [5,6,7,8,9,10,11]. Moreover, along the coasts there is an intense anthropogenic pressure which increases the exposure and vulnerability to climate risks [12,13,14,15,16,17,18].
Concerning flood risk [19] in coastal areas, it is possible to identify two types of hazards: event-based or gradual. Event-based hazards are those that are characterized by sudden phenomena such as storm surges (SS), while gradual hazards are characterized by phenomena that are related to larger time scales, including sea level rise (SLR). The climate projections of event-based hazards depend on the representative concentration pathway scenario (RCP), return period (RP), and percentile (%), while gradual hazards depend on RCP and % [19,20,21]. Considering the joint action of event-based and gradual hazards it is possible to refer to extreme sea level (ESL) events [22]. ESL values result from the sum of the mean sea level rise, storm surges, wind waves, and tides. The values of the climate projections of ESL are, therefore, higher than the SLR values and represent an important and urgent threat to all coastal settlements [23].
ESLs present new challenges for Euro-Mediterranean coastal cities: if cities can nowadays adapt or defend against coastal floods, the long-term effects of climate change will increase the risk and will require a redefinition of coastal defense strategies, through the implementation of existing measures and/or the development of new ones [24,25,26,27]. In this scenario, in Euro-Mediterranean coastal cities, climate change mitigation and adaptation must become priority goals in the perspective of sustainable development [28,29,30,31,32,33].
For the implementation of climate-proof strategies, knowledge of climate risk plays a fundamental role and the performance of adaptation projects depends on the (project’s) ability to prefigure future scenarios, thus on the observation and knowledge of climate risks. Even though the role of knowledge is widely recognized, the EU impact assessment report [34], within the framework of the EU Adaptation Strategy, identifies knowledge gaps to support the decision-making process as well as weaknesses in the implementations, monitoring, and reporting of climate adaptation actions. The knowledge gaps concern a lack of relevant indicators and data in terms of information on damages, costs, and benefits of design solutions, as well as gaps in climate modelling and simulations to assess impacts at the local scale [34,35,36,37,38].
According with the IPCC—Intergovernmental Panel on Climate Change—conceptual framework (reports AR5 [2] and AR6 [10]), the quantitative or qualitative assessment of climate risk is related to the knowledge and the assessment of exposure, vulnerability, and hazard and can be implemented by multi-scale simulations and models that were developed thanks to the use of Key Enabling Technologies (KETs) [39]. Regarding flood risk, it is possible to consider a “source-pathway-receptor” model. Climate hazard relates to extreme weather events and can be considered as “source”, vulnerability relates to the intrinsic characteristics of hazard’s receptors and thus can be considered as “receptors”, while exposure relates to the geographical location and characteristics of receptors that can reduce or implement hazard’s impacts and thus can be considered as “pathway” [40].
In the age of green and digital transition, KETs have enabled the integration and processing of data and information to support design processes through decision support systems (DSSs). It is in this context that the contribution focuses on the application of a GIS-based model that is aimed at analyzing the impacts of extreme sea level (ESL) events on Euro-Mediterranean coastal cities. The Coast-RiskBySea model (COASTal zones RISK assessment for built environment by extreme SEA level) allows the assessment of potential economic damages due to ESL on the built environment in all European coastal settlements thanks to the use of open source and remote sensing data [41].
Since the model has already been presented in previous publications [41,42], detailing the input data, methodological approach, limitations, and the accuracy of simulations, the contribution focuses only on the application of the Coast-RiskBySea on three case studies: Naples, Barcelona, and Marseille. The results were compared and discussed to analyze the potential impacts of ESL in Euro-Mediterranean coastal cities highlighting the limitations and potentials of the approach.

2. Materials and Methods

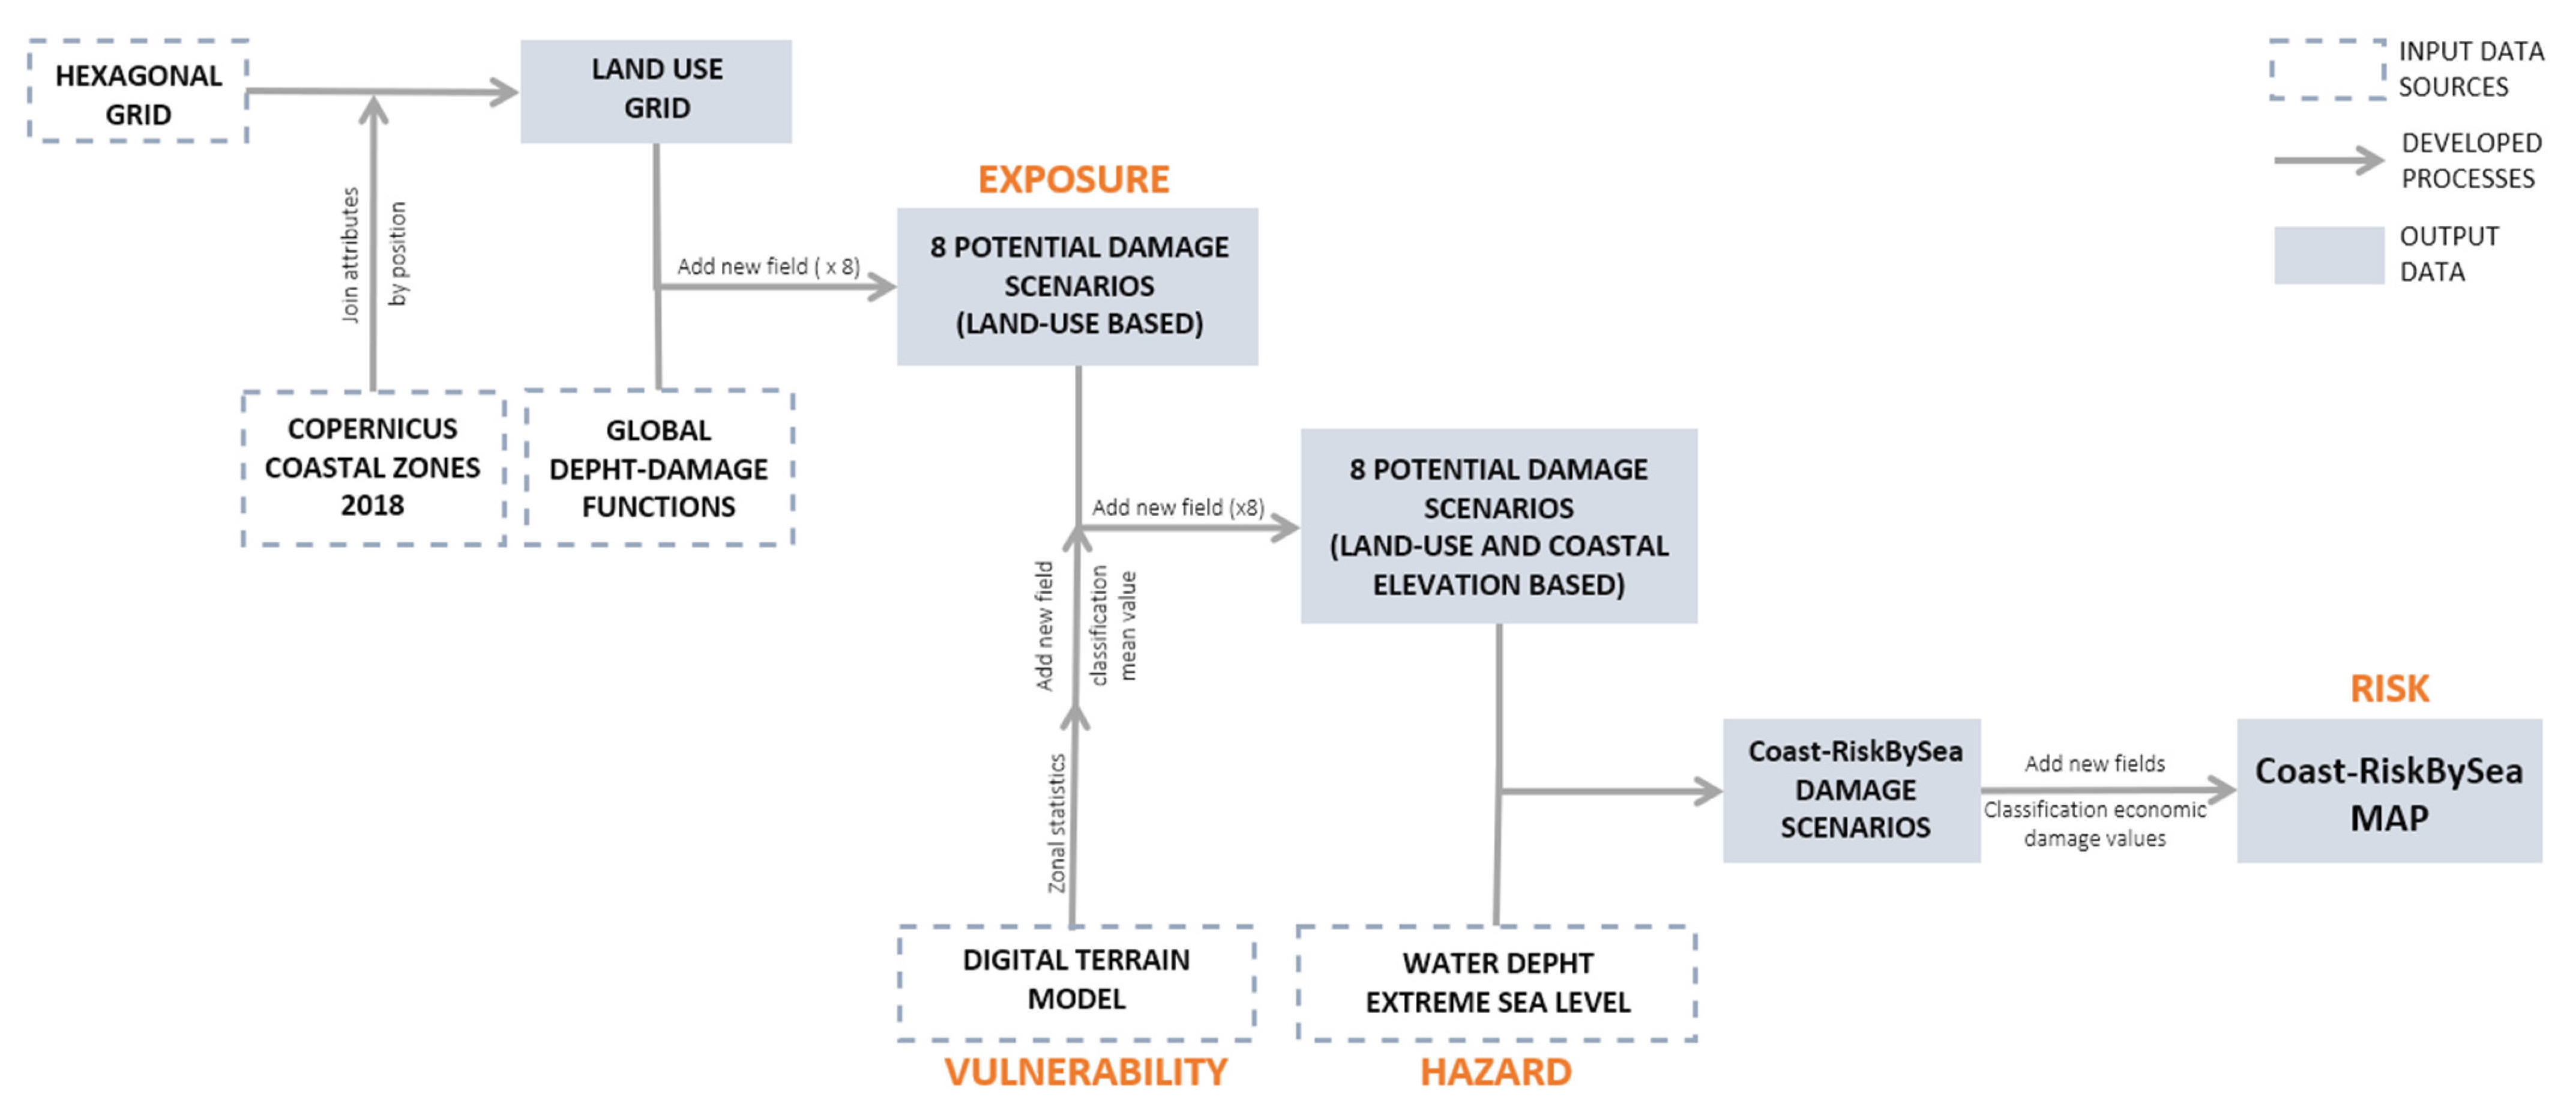
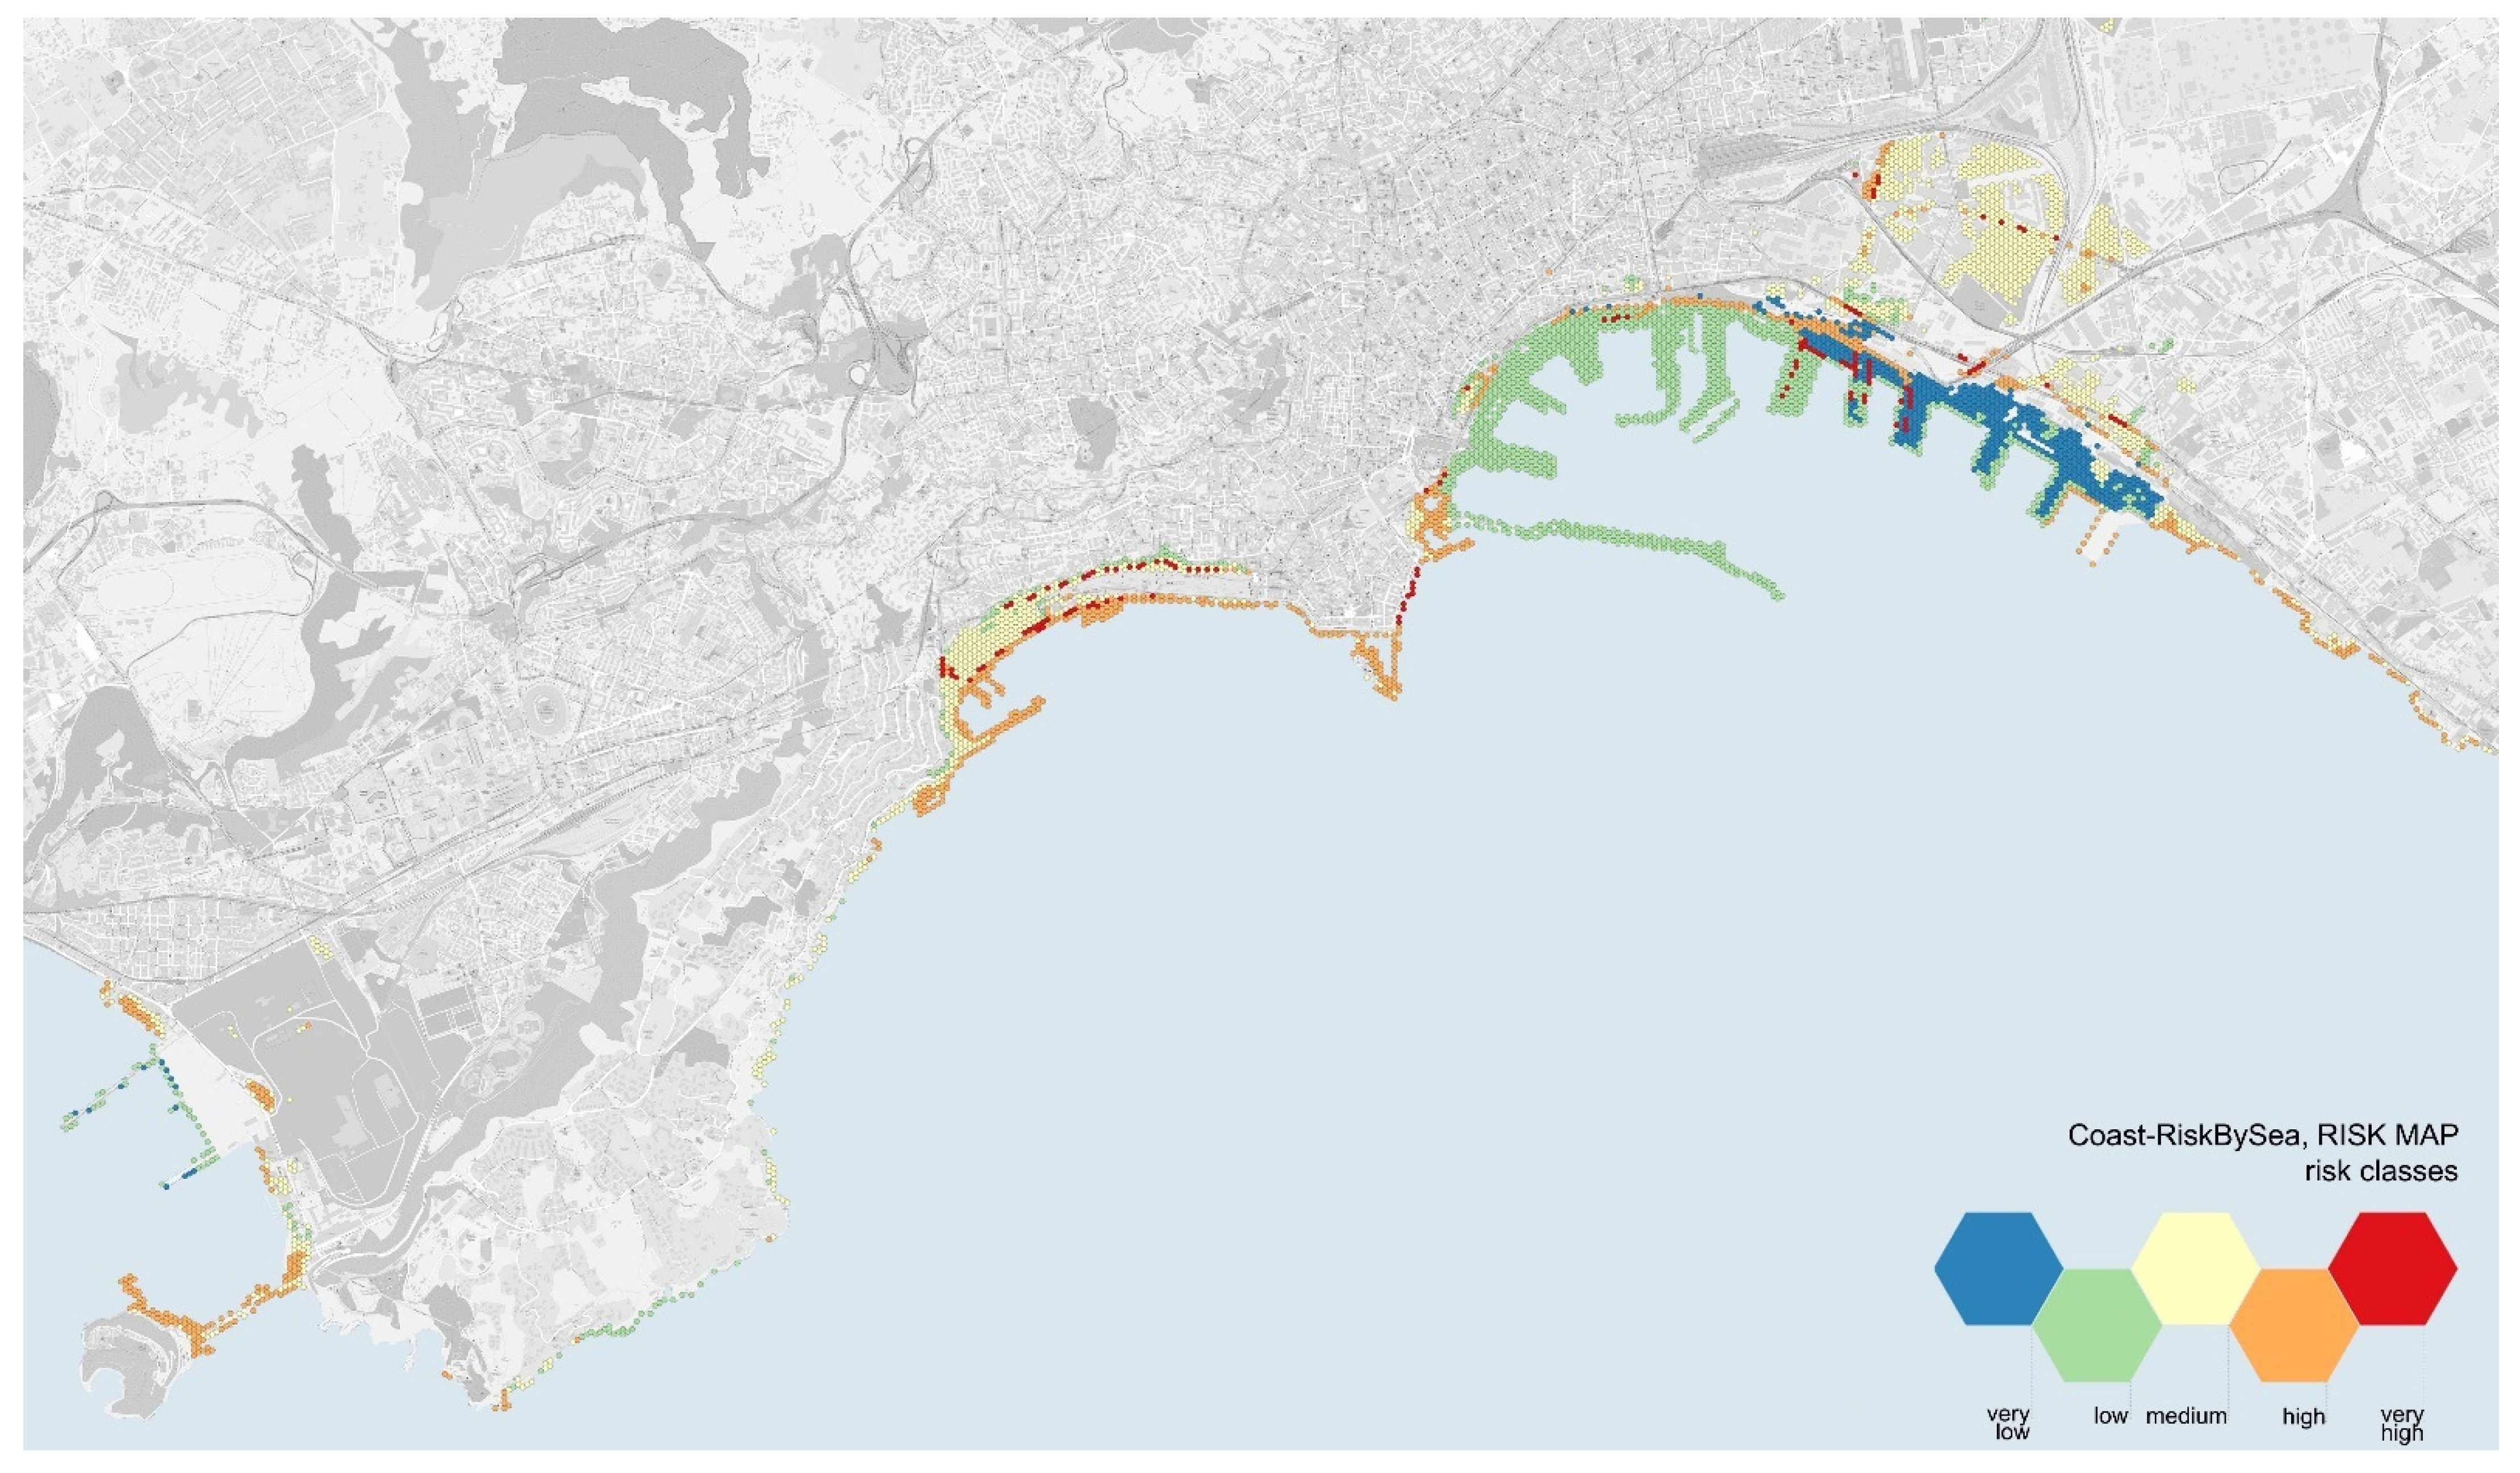
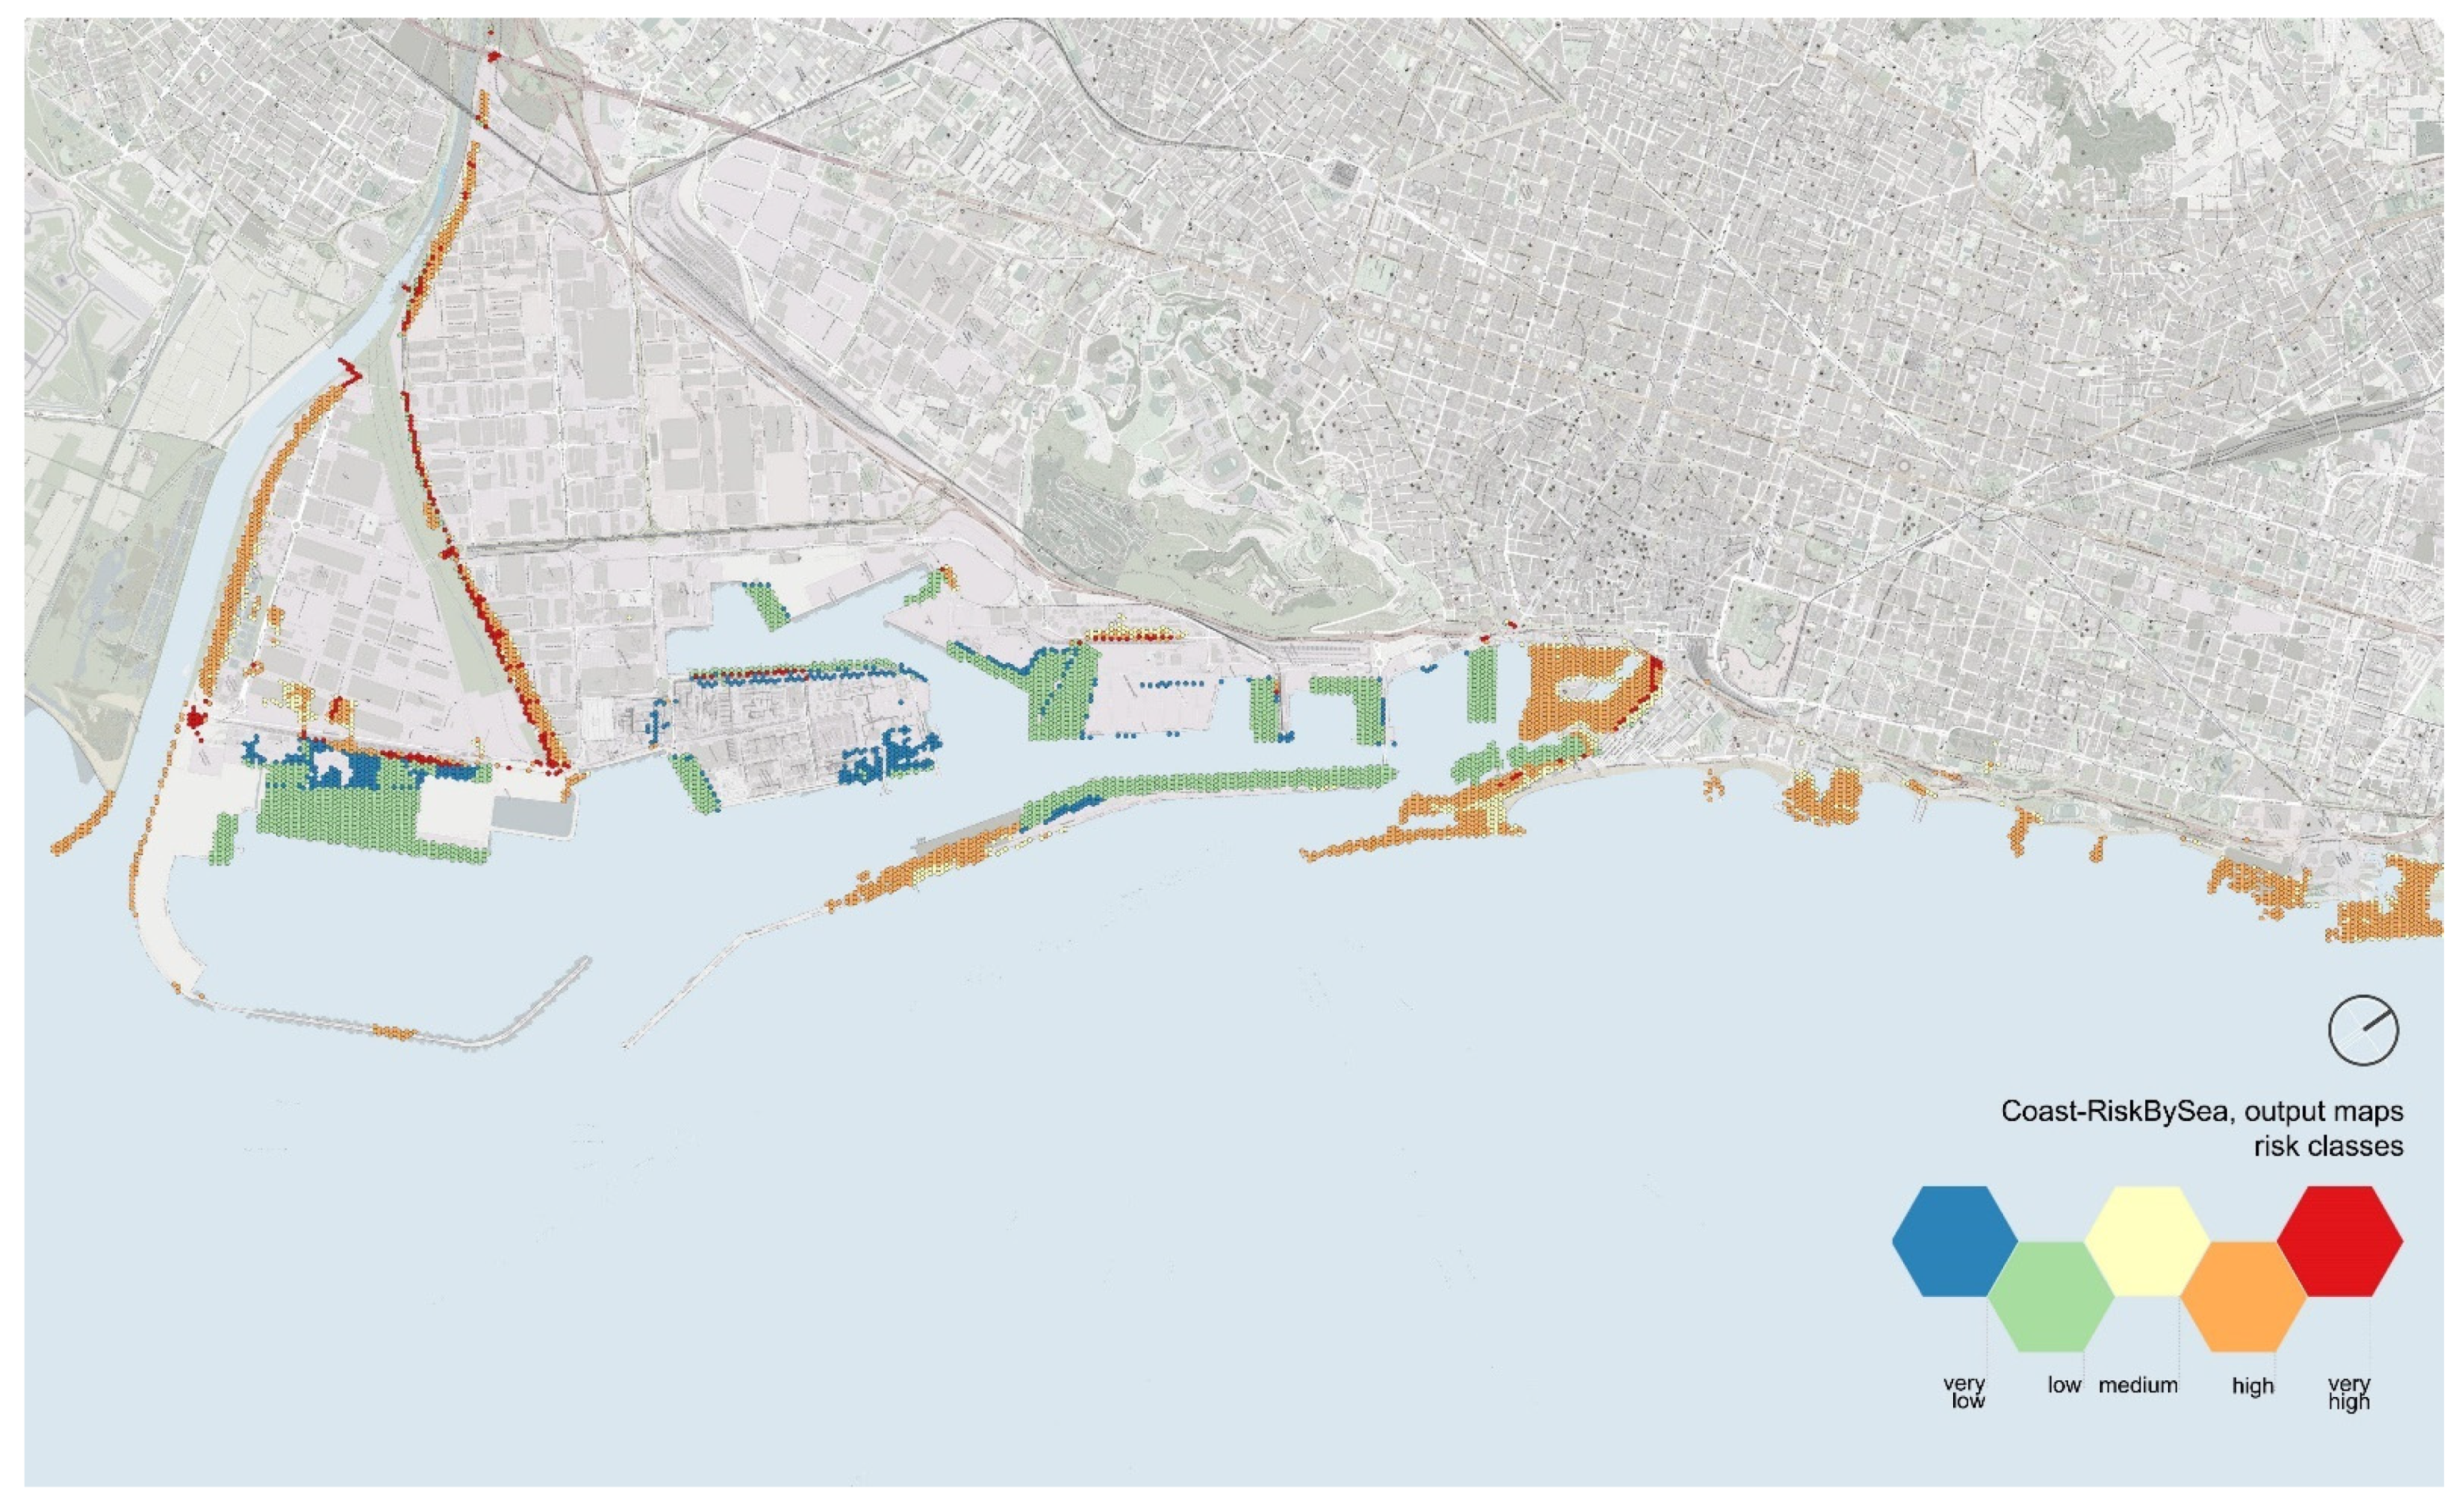
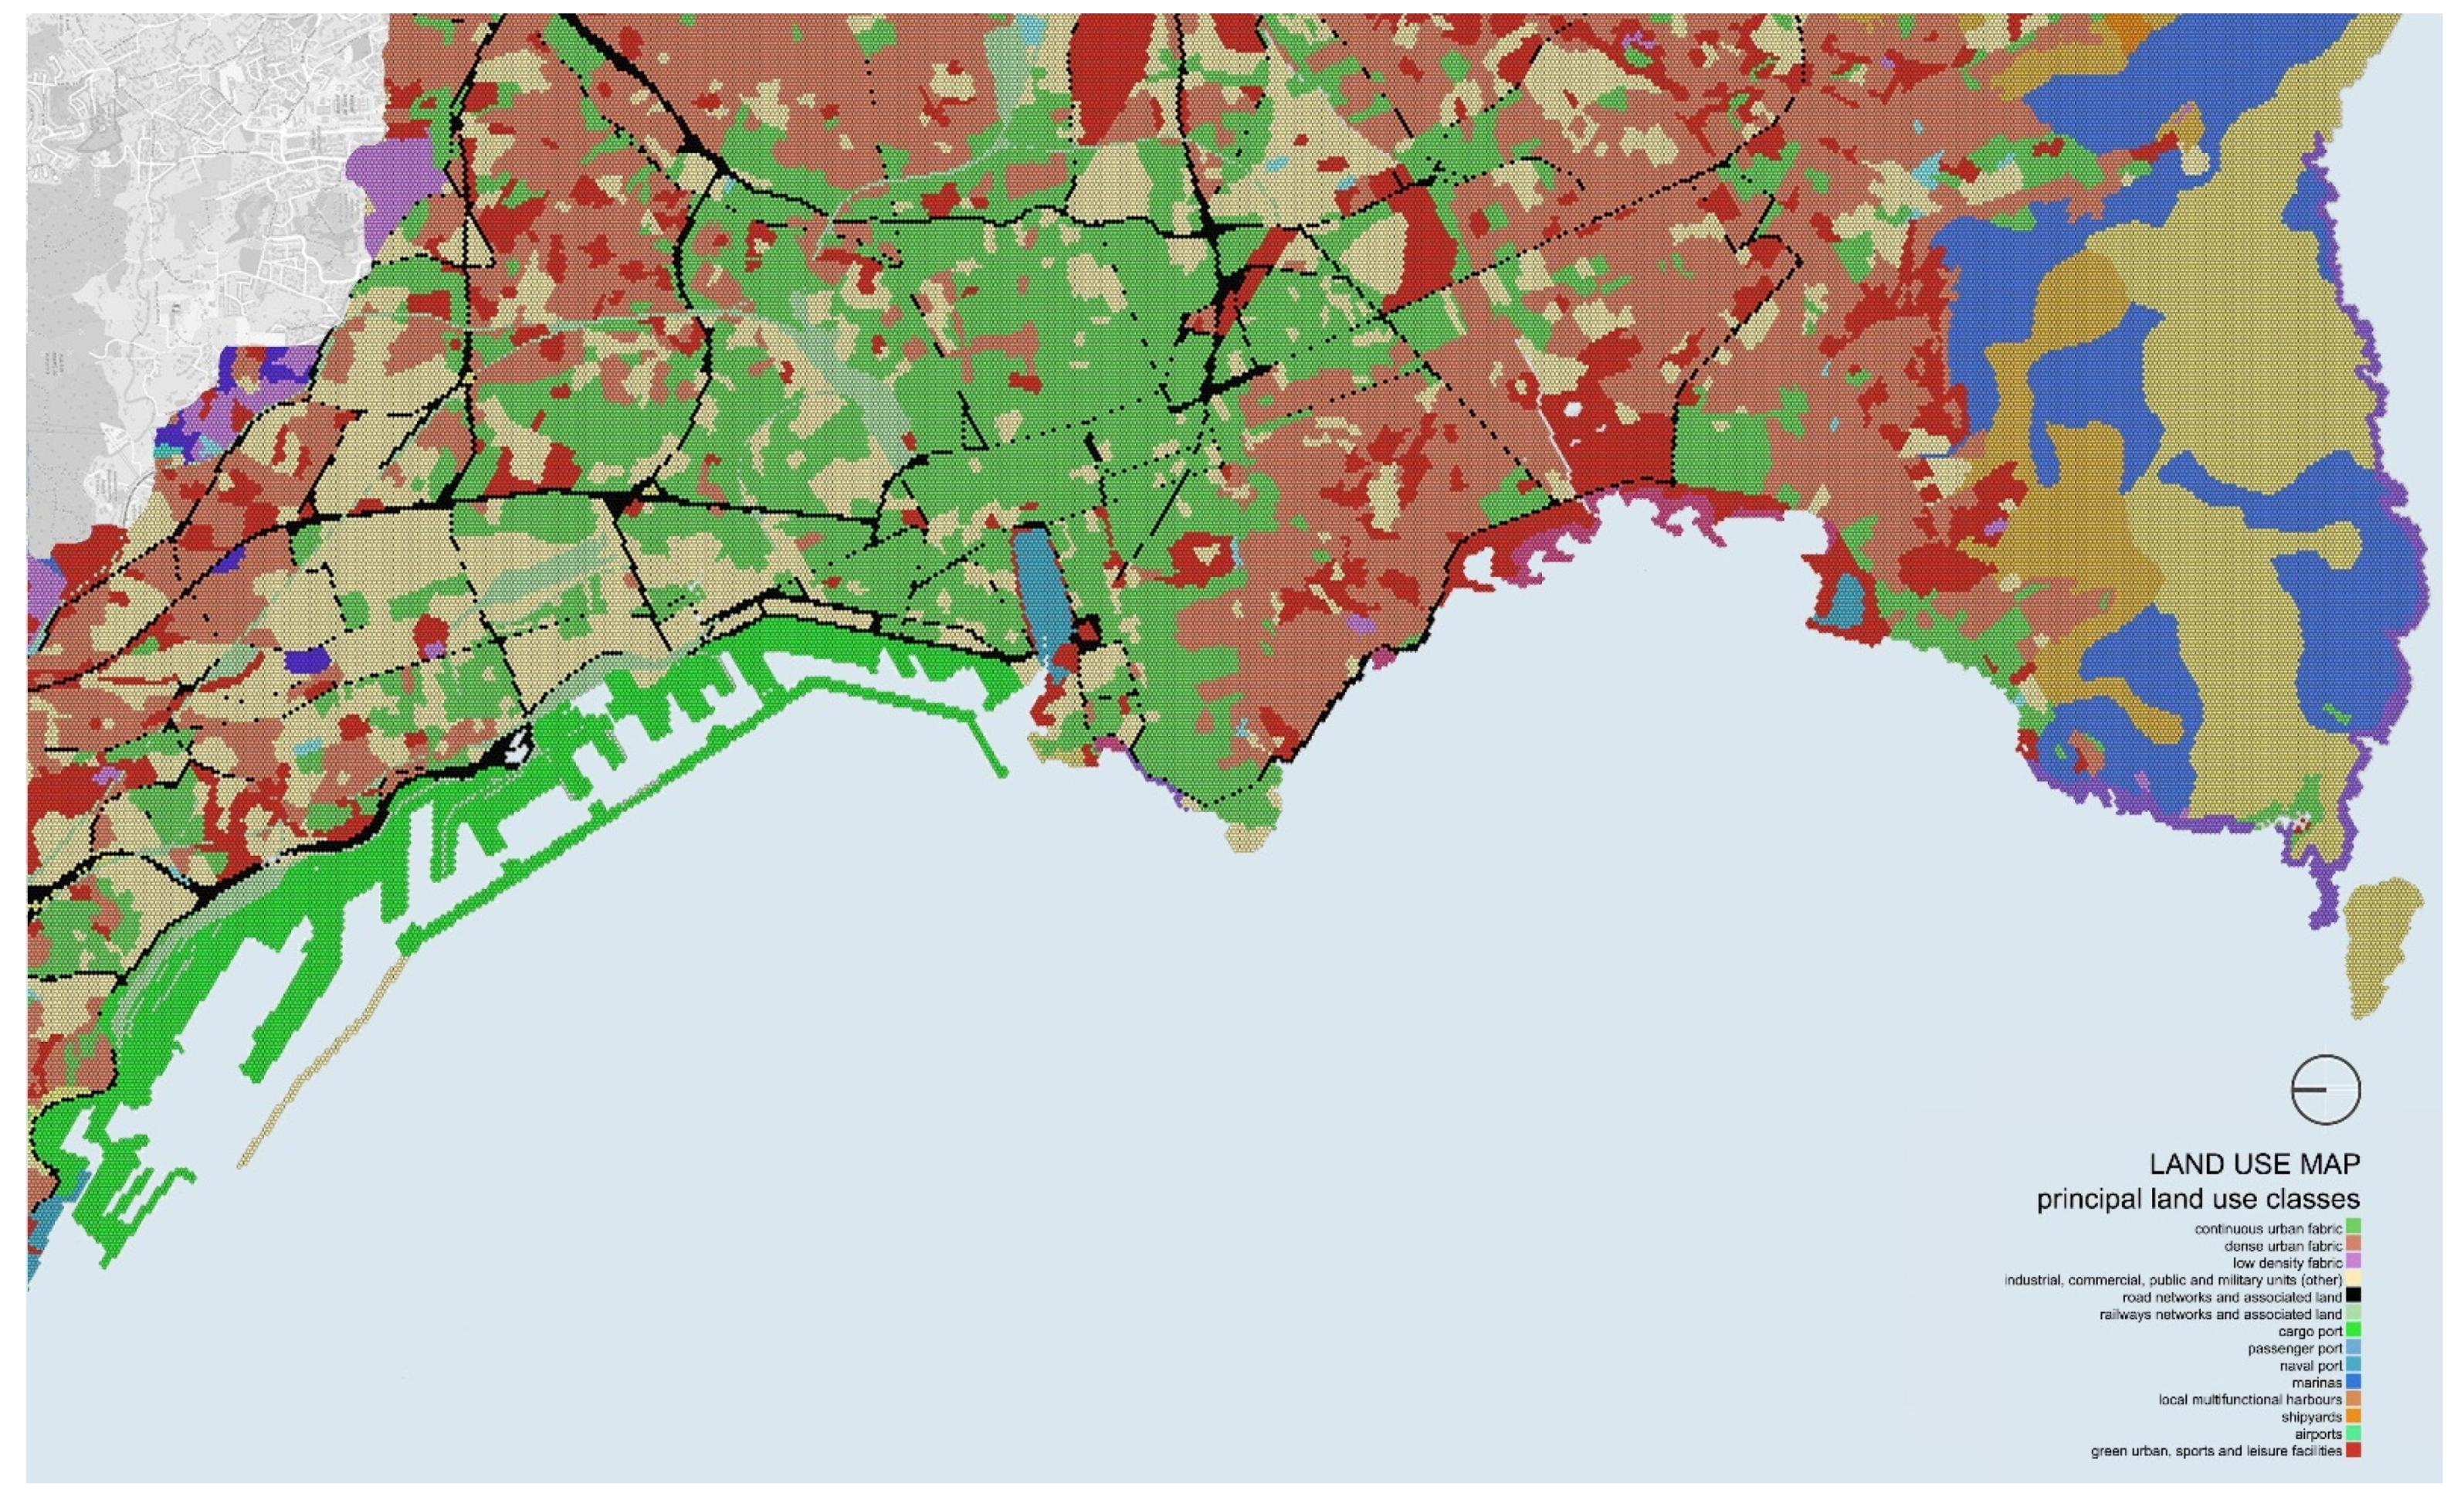
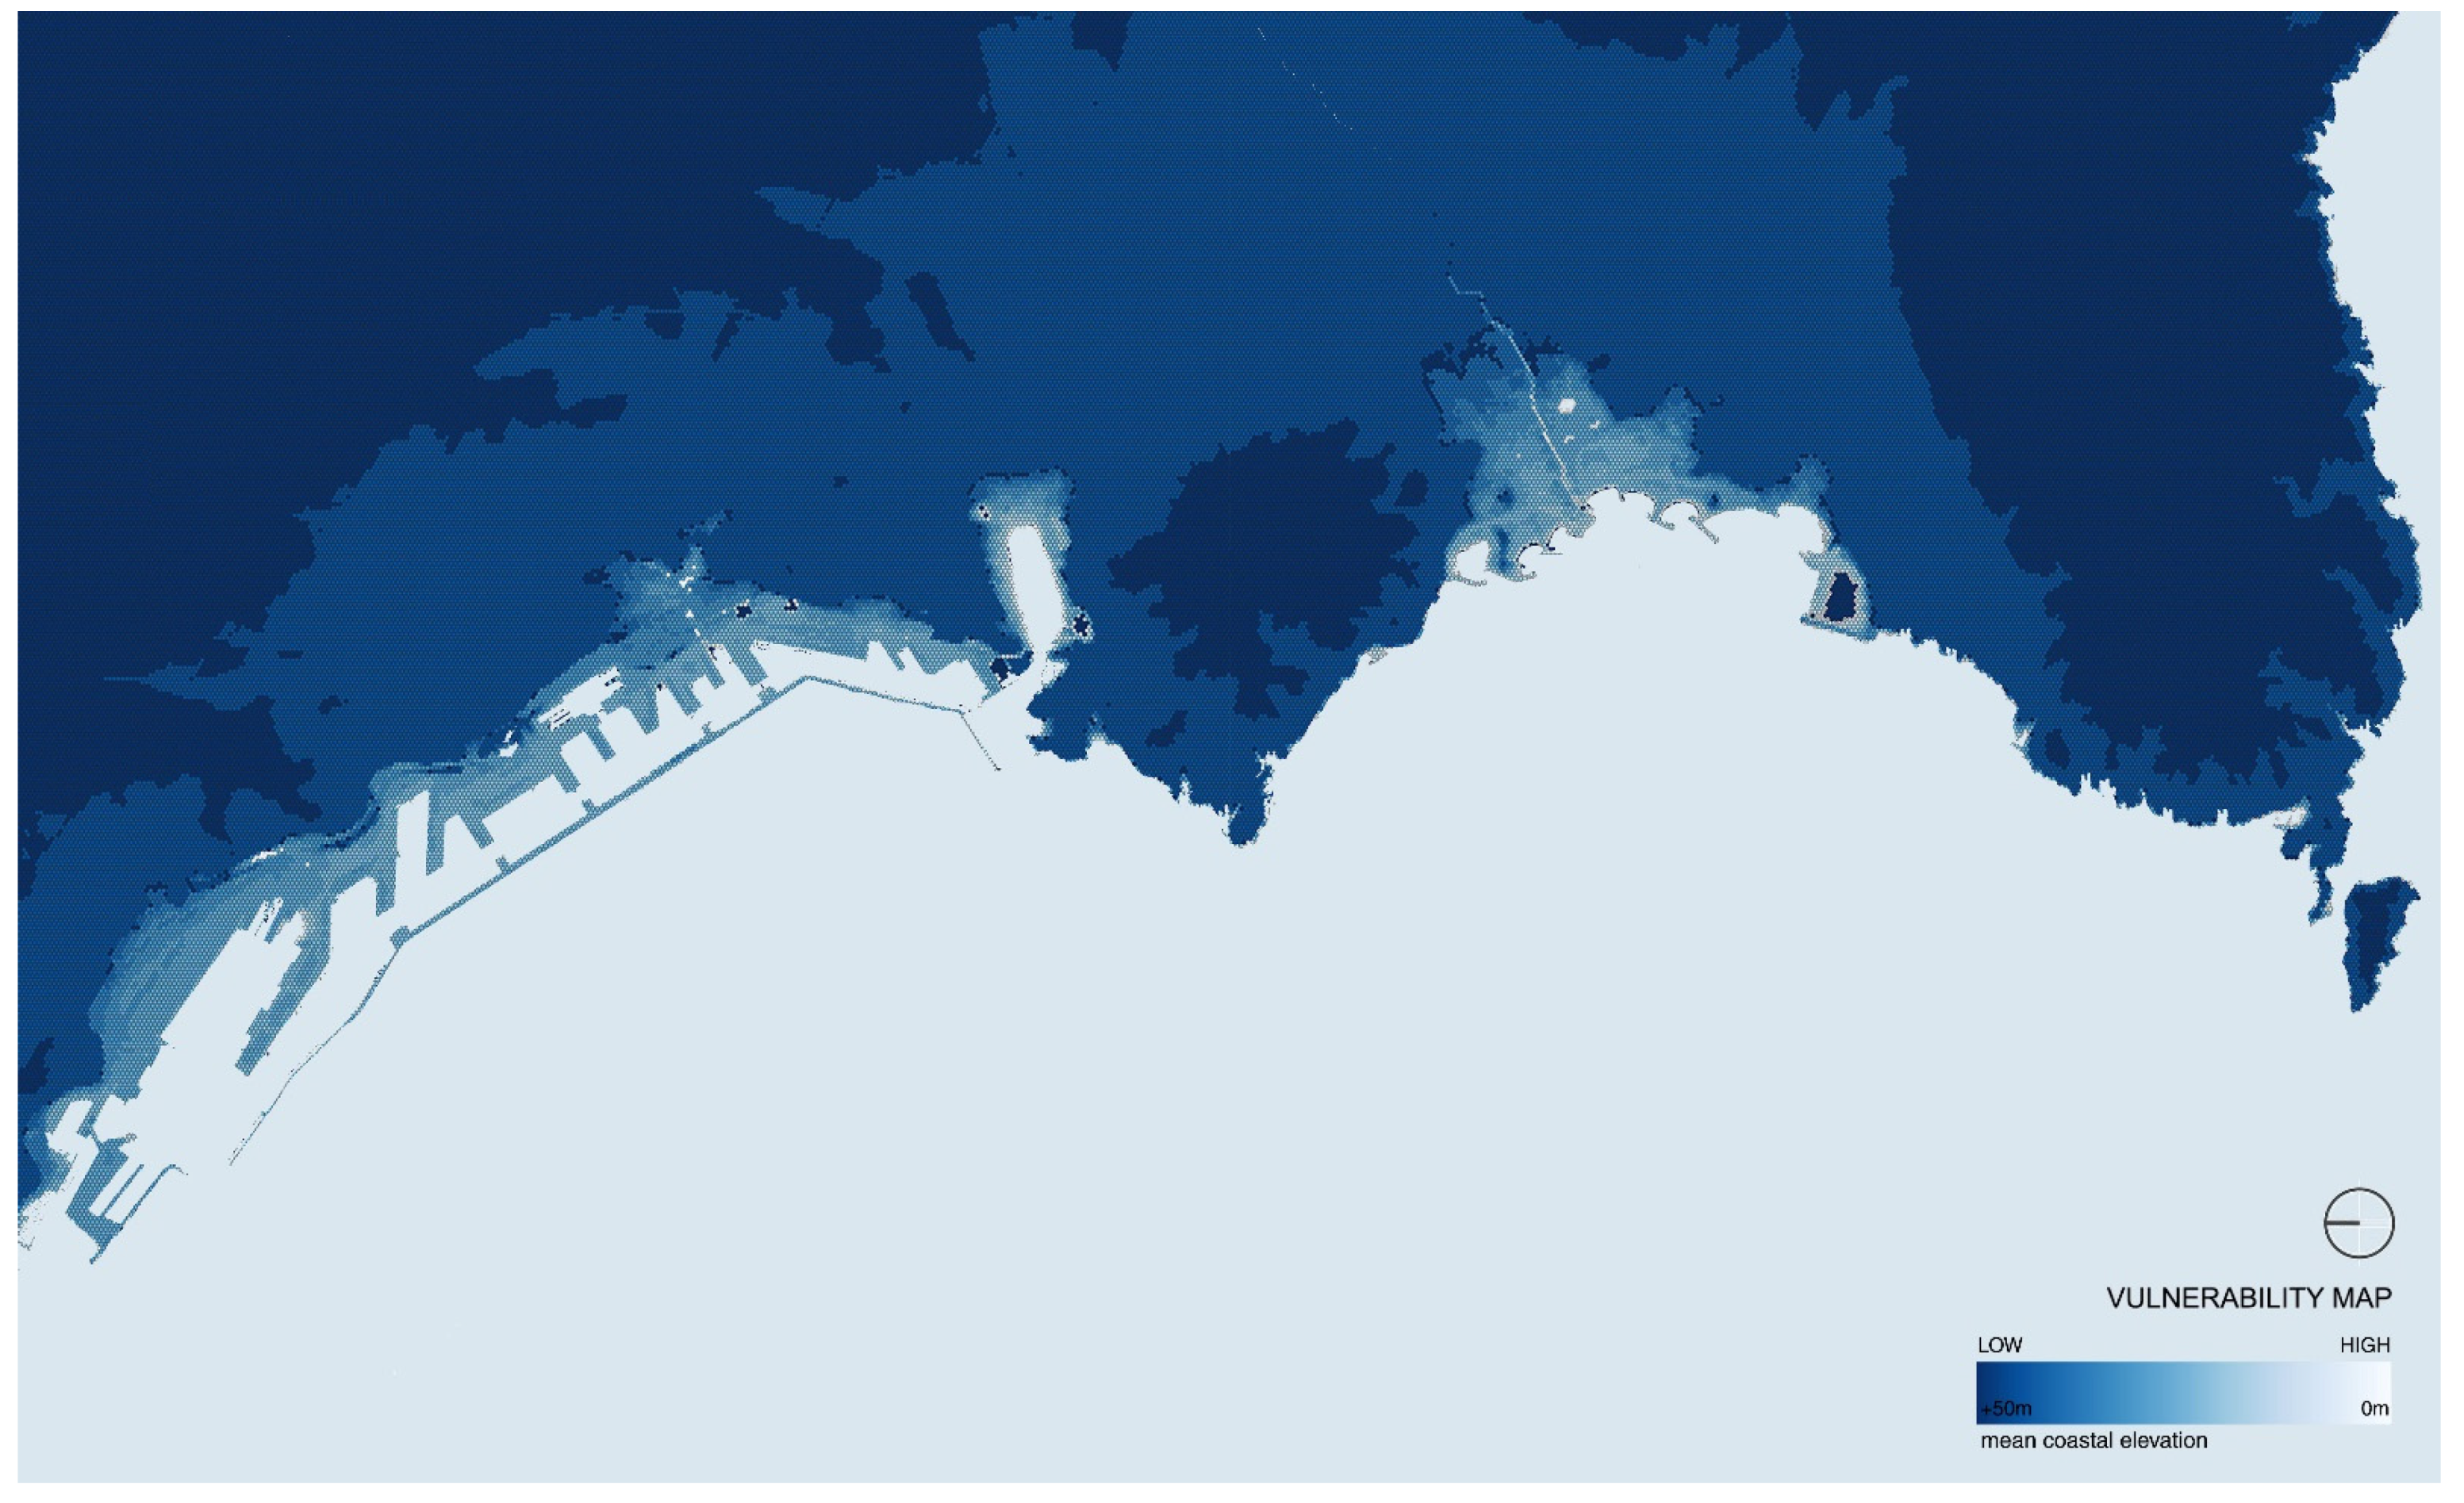
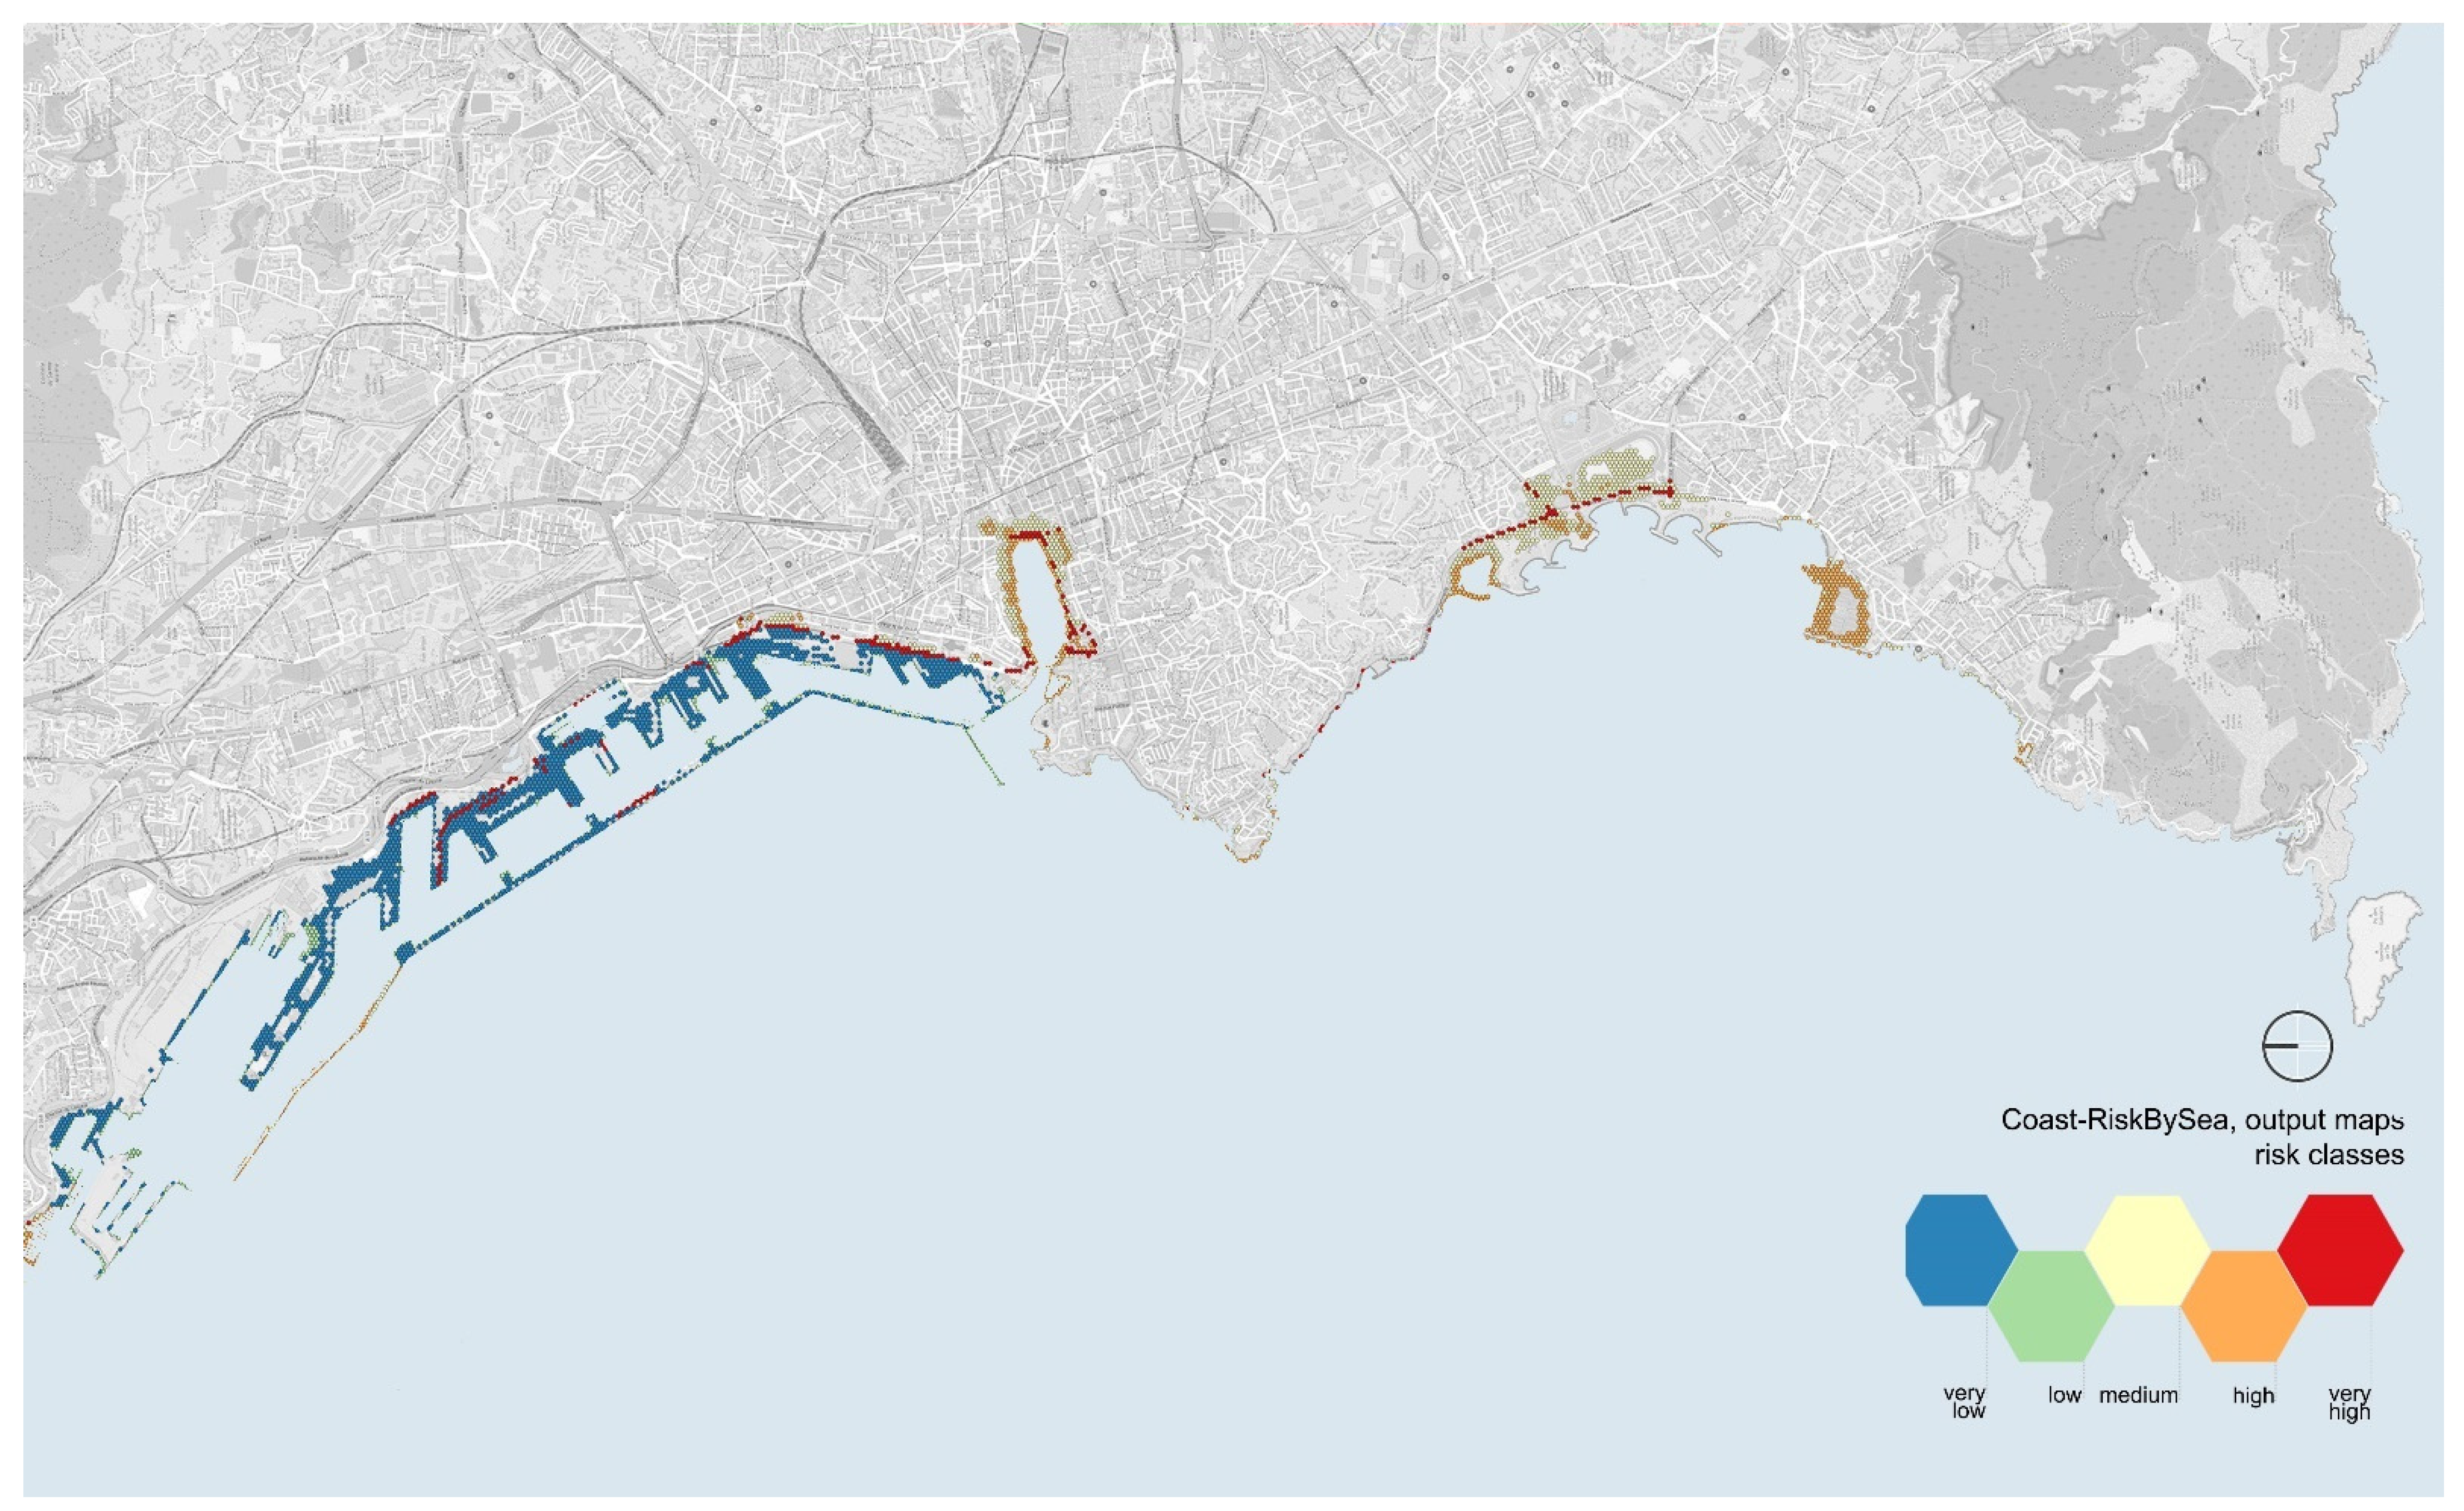
2.1. The Coast-RiskBySea Model

As anticipated, the paper focuses only on the application of the Coast-RiskBySea model on case studies, however, the model is synthetically described below.
The Coast-RiskBySea is elaborated in the GIS environment and the risk (land use-based) is assessed on homogeneous sampling units that are identified on a hexagonal georeferenced grid. The use of a georeferenced grid to assess climate risk is extremely useful: each sampling unit constitutes a homogeneous and georeferenced spatial unit where data are uploaded, analyzed, processed, and combined to assess the potential economic damages. The Coast-RiskBySea model is characterized by spatial units with an area of approximately 780 m2 and a side length of 30 m. The hexagonal shape and the surface area of the sampling units have been chosen considering the scale of the input data and the willingness to support decision-makers at the urban/local scale [43,44,45,46]. On each sampling unit the risk, as function of the potential direct and tangible economic damages, is assessed following the conceptual framework that was identified by the IPCC [2,10], thus combining exposure, vulnerability, and hazard. The data are approximate to the characteristic that prevails in terms of spatial surface.
As exposed element is considered the land use that is derived from the Copernicus Coastal Zones 2018 database [47] and transformed into exposed value through the global depth-damage functions that were developed by the Joint Research Centre of European Union (JRC) of the European Union (EU) [48]. The Copernicus land-use classes are grouped into six categories according to the land use categories that were identified by the JRC, then, according to the vertical intervals of water depths (+0.50 m, +1.00 m, +1.50 m, +2.00 m, +3.00 m, +4.00 m, +5.00 m, +6.00 m), on each sampling unit is assessed the exposed value as a function of the potential direct and tangible economic damages to the built environment (in euros).
Vulnerability is considered only the mean coastal elevation that is derived from the digital terrain models (DTMs). According to a static and simplified approach of the flood phenomena, everything that is below the expected water depth is considered inundated [49,50,51,52,53].
Finally, extreme sea level climate projections are studied as hazard [26] values that are also derived within the JRC database [54].
Once exposure (land use), exposed value (potential economic damages scenarios that are estimated through the introduction of depth-damage functions), vulnerability (mean coastal elevation), and hazard (expected ESL projections), have been assessed for each unit, all the information is combined in a final equation that assesses for each spatial unit the potential economic damages in euros. The economic values are then classified into five risk classes based on the following ranges:
  • very low (damages between 2000–5000 €),
  • low (damages between 5000–30,000 €),
  • medium (damages between 30,000–100,000 €),
  • high (damages between 100,000–200,000 €),
  • very high (damages between 200,000–500,000 €).
Figure 1 shows the workflow (Figure 1).
The key features of the Coast-RiskBySea model are: damage assessment on sampling units whose dimension (surface area of approximately 780 m2) allows to support decision-makers at the local/urban scale, the definition and characterization of vulnerability and exposure, the parameterization of risk as a function of the potential direct and tangible economic damages, the replicability of the approach thanks to the homogeneous spatial coverage of the input data source, and the possibility to implement and integrate analyses thanks to the use of the grid system.
The model thus represents a decision support to designers, planners, institutions, and/or insurances. As has also been proposed in previous studies in the reference scientific literature [4,53,55], quantifying climate impacts as a function of the potential economic damages is extremely useful for all decision-makers, however future implementations of the model will be needed to integrate the assessment of damages of the natural environment and the assessment of intangible damages both on the natural and built environment [56,57]. Moreover, the flood events should be modelled semi-dynamically considering the presence of defense systems to provide more accuracy of simulations [4,58,59,60].

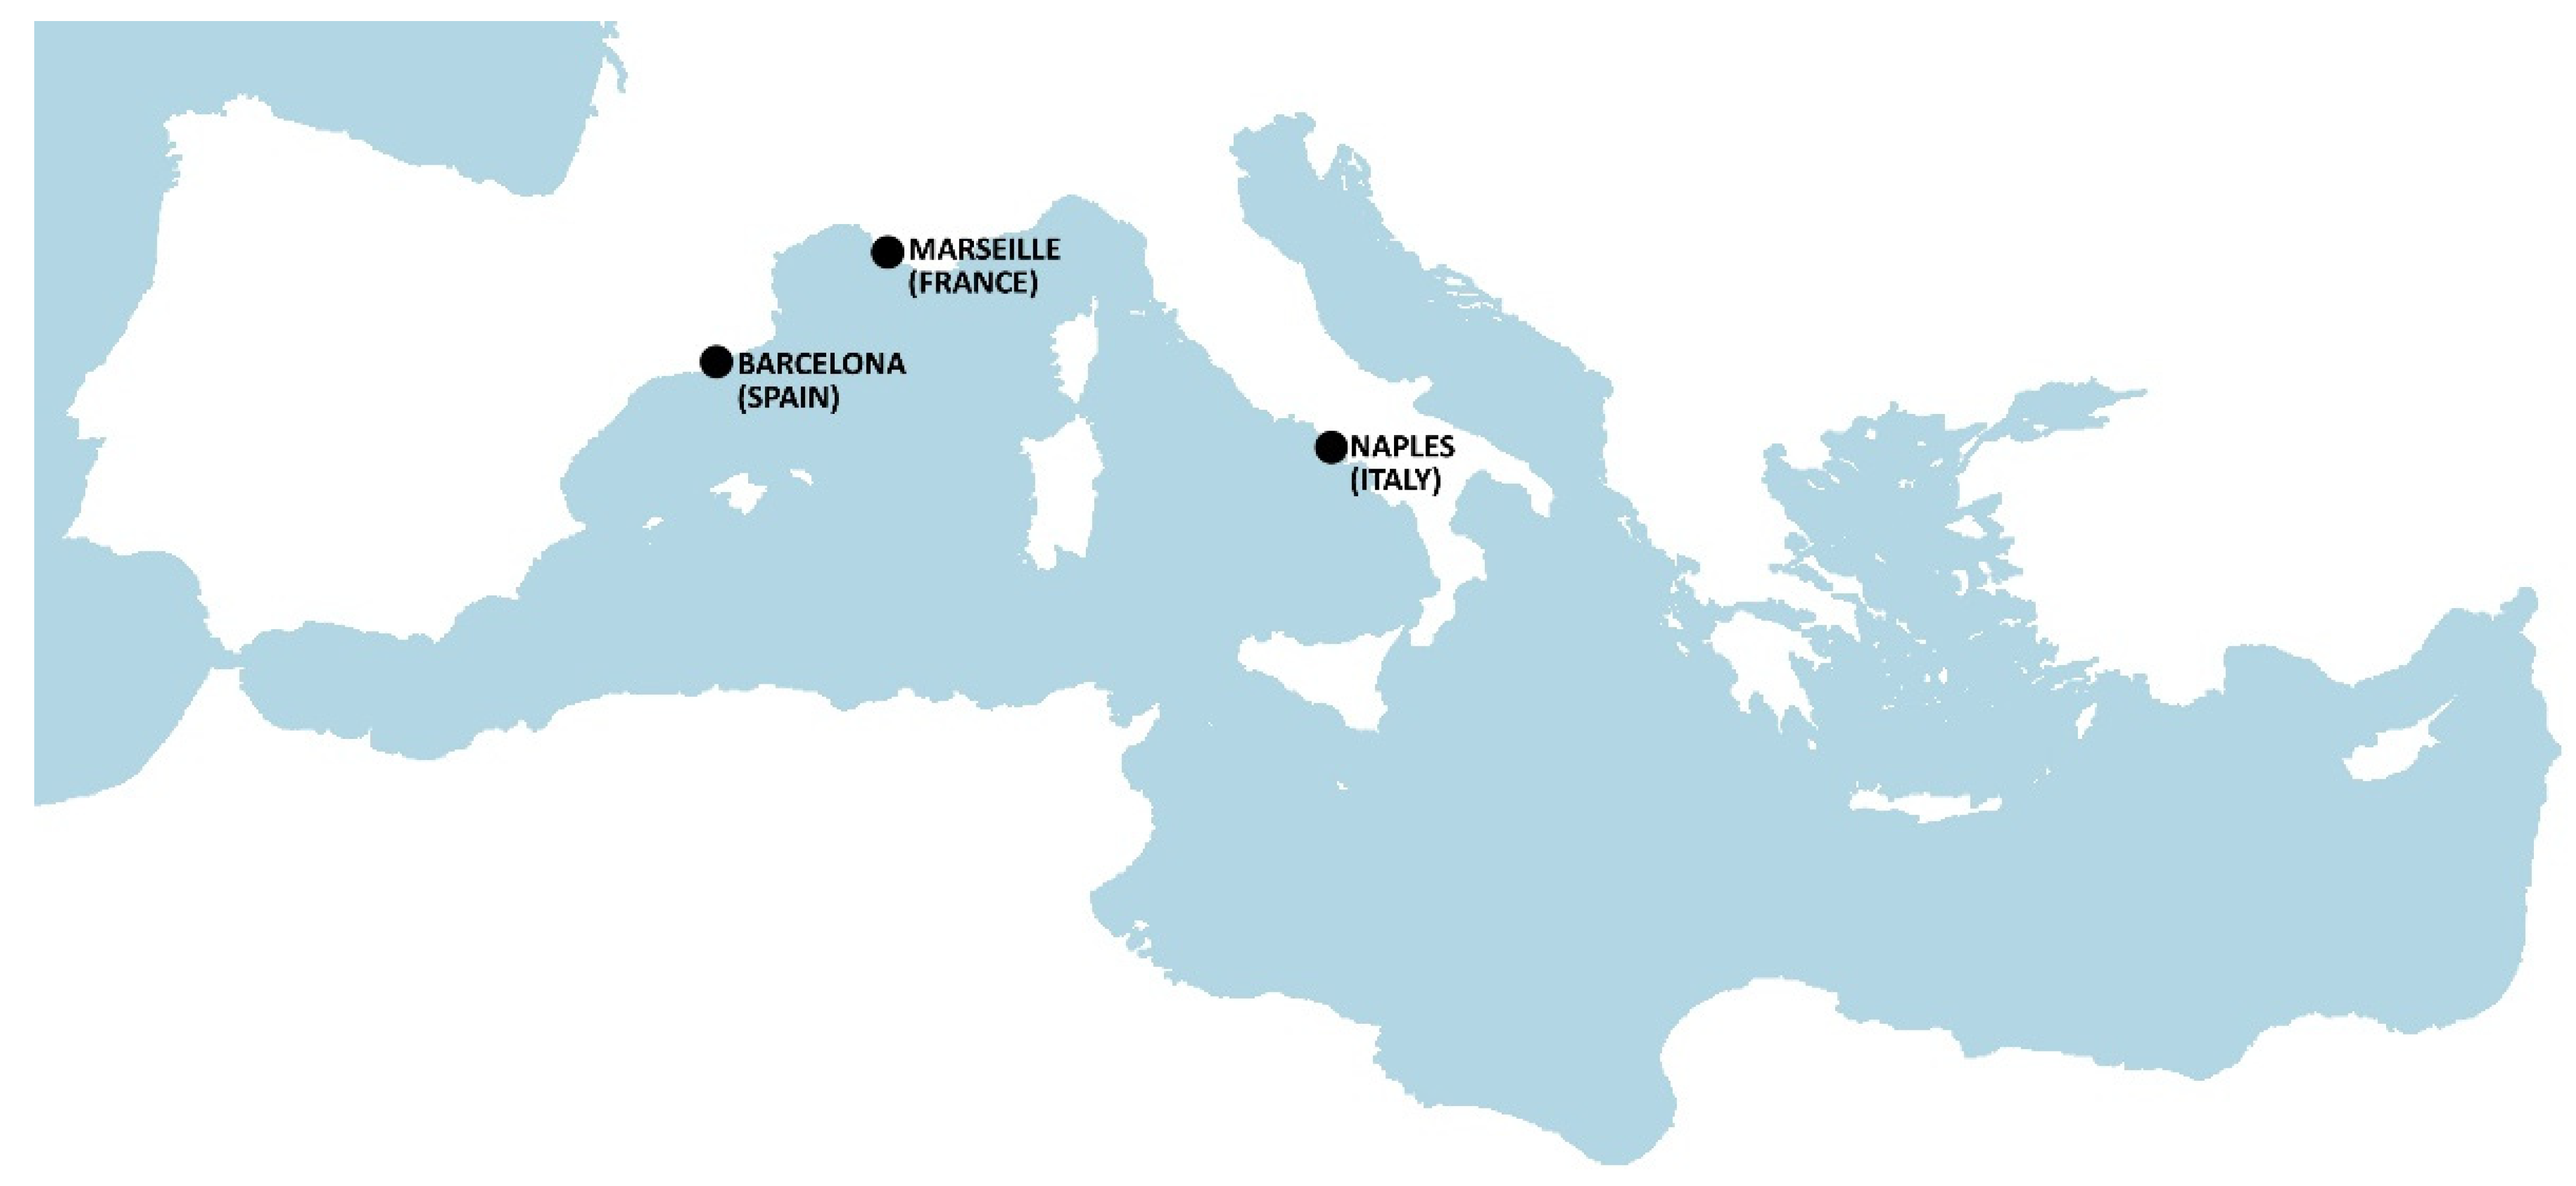
2.2. Study Areas: The Euro-Mediterranean Port-Cities

As already mentioned, in the European context, the Mediterranean Region is considered a high-risk area that is linked to growing effects of climate change [7,8,9,10,11,18,24,25] conditions that requires the urgent implementation of climate adaptation and mitigation strategies [32,33,34].
To test the model and compare the results, three coastal cities were selected as case studies: Naples in Italy, Barcelona in Spain, and Marseille in France. The three cities are located along the East-West axis of the Basin as part of the Latin arc [61] and thus provide an overview of the potential extreme sea level impacts in the north-western part of the Mediterranean Basin (Figure 2).
The case studies selection was made according to the following criteria: (a) analyze different Euro-Mediterranean cities to provide an overview of the climatic region, (b) select cities from different countries to test the replicability of the Coast-RiskBySea model, (c) consider urban areas with regional relevance, (d) investigate historical port-cities to understand the future impacts in the context of port infrastructure, and (e) the feasibility and data access.
Naples, Barcelona, and Marseille are all characterized by high values of vulnerability and exposure to extreme sea level events, mainly due to the intense urbanization of the coasts and the presence of strategic infrastructures in these areas (including ports, main roads, commercial/industrial areas, and archaeological sites). In Euro-Mediterranean coastal cities, the sea is not only an identity factor but also a key element of the sea-related economy (trade, tourism, economic activities, productive activities), and therefore, it is essential to manage coastal risks.
In the Mediterranean, Barcelona has for many years, been a model for the regeneration of historic port waterfronts and the city-port-sea integration [62,63,64]. More recently, Marseille within the Cité de la Méditerranée project, as part of the Euromeditérranée project, has started a large-scale redevelopment of about three miles of the historic waterfront to implement sustainability and quality of urban life [65,66,67]. In Naples, punctual projects are ongoing aimed at port-city integration.

3. Application of the Coast-RiskBySea Model

3.1. Data Collection

To apply the Coast-RiskBySea model in Naples, Barcelona, and Marseille, the first step is data collection. To make analyses replicable in all EU coastal territories, particular attention was given to open-source data, characterized by a European homogeneous spatial coverage.
Land use, derived from the Copernicus Coastal Zones database [47], is characterized by European homogeneous spatial coverage. Both the global depth-damage functions and the ESL climate projections [54] have been identified within the databases that were provided by the JRC and are also characterized by European homogeneous spatial coverage. Therefore, except for the DTMs [68,69,70], all the data are characterized by a homogeneous spatial coverage and are available online in an open-source format.
DTMs are local data as there are no European databases with an adequate spatial resolution and vertical accuracy in line with the proposed methodology. Coastal elevation is a key aspect of flood modelling [71,72,73,74], and in the analyzed case studies the spatial resolution of DTMs is 1 m × 1 m. Although there is not a unique European database, most European cities have online and open-source DTMs on national geoportals.
The input data and their main characteristics are shown in the table (Table 1).
In the table below are identified and compared the expected water depths by 2100 that were estimated by Vousdoukas et al. [56] highlighting the relative Sea Level Rise (rSLR) and the related Extreme Sea Level (ESL) according to the RCP 4.5 and RCP 8.5 scenarios for the three cities (Table 2). For both rSLR and ESL climate projections, it is considered the worst case (95th percentile) to avoid the underestimation of economic damages.
According to the workflow that was identified in Section 2.1 and to the data source that was identified in Section 3.1, the Coast-RiskBySea model is then applied to Naples, Barcelona, and Marseille. To compare the results, simulations are carried out by 2100 considering ESL events that were characterized by RCP 8.5, 100 yr RP and 95%, so considering the worst case. The ESL climate projections of JRC estimate values of about 3.22 m for Naples, 2.97 m for Barcelona, and 3.10 m for Marseille. According to the water depth ranges that were identified by the global depth-damage functions of JRC [48], the three values are approximated to 3.00 m.

3.2. Naples, Italy

As a first case study, the Coast-RiskBySea model is tested on the city of Naples, in Italy. A recent publication by the author explores more in detail the case study [41], however, the case is synthetically introduced to compare the results with the other case studies.
In synthesis, the first step is the spatial union between the land use Copernicus Coastal Zones and the hexagonal reference grid to obtain the land-use map. This map highlights a dense and continuous urbanization on the coastal zones; in fact, the area can be defined as an urban “techno-coast” [75]. On the functional-spatial level, according to the Copernicus land-use classes, prevails a dense urban fabric joint with the presence of the port and industrial, commercial, public, and military areas.
Identified for each cell an unique values of land use, the exposed value, in function of potential economic damages based only on land use, was then assessed on each sampling units according with the water depth values that were identified by the JRC damage functions [48].
The mean coastal elevation is then assigned to each territorial unit through the operator of zonal statistics on the DTM [68]. The resulting vulnerability map as function of ESL events, highlights a very rich and complex geomorphology and that several areas are characterized by critical elevation values (lower than 3 m), and are thus exposed to coastal floods. In fact, as in other Mediterranean coastal cities, in Naples the sea level rise could increase in the next years due to the effects of climate change. Furthermore, coastal floods will become more frequent and intense.
Based on the analysis of exposure and vulnerability, the Coast-RiskBySea map is finally elaborated according to the ESL scenario (RCP 8.5, 100 yr RP and 95%) by 2100 that was identified by Vousdoukas et al., 2018 [54].
The land use map (Figure 3), the vulnerability map (Figure 4) and the risk map (Figure 5) are shown below.
Without any climate mitigation or adaptation measures, by 2100 many areas will be potentially impacted by ESL events, with medium- and high-risk values as shown in the risk map and potential damages to the built environment could reach up to 226 million of euros (M€). The results of the Coast-RiskBySea application are presented in the table below, analyzing the impacted surface in terms of the percentage on the total impacted surface, the damages in M€, and the percentage of these damages on the total damage for each land use class (Table 3).
As shown in the table, although some land use classes are characterized by a lower impacted surface area, the corresponding economic damages can be higher than in the areas that are characterized by a larger impacted surface area. Economic damages vary in fact according to vulnerability and exposure and, therefore, depend on local characteristics.
In the examined case, the results show that on the spatial level, the damages are concentrated in the areas with industrial, commercial, public, or military land use (29% of the impacted surface), followed by passenger port areas (24% of the impacted surface), cargo port areas (16% of the impacted surface), and continuous urban fabric (9% of the impacted surface). The road networks and the associated land joint with railways and the associated land are also particularly at risk (9% of the impacted surface).
Meanwhile economic damages are concentrated in areas with industrial, commercial, public, or military land use with expected damages up to 80 M€ (36% of the total damages), followed by road networks and the associated land with expected damages up to 36 M€ (16% of the total damages), marinas with expected damages up to 33 M€ (15% of the total damages), railways and the associated land with expected damages up to 30 M€ (13% of the total damages), and continuous urban fabric with expected damages up to 15 M€ (7% of the total damages). By 2100, the total damages on the built environment considering both port areas and marinas could reach up to 54 M€.

3.3. Barcelona, Spain

After the case study of Naples in Italy, the Coast-RiskBySea model is applied to the city of Barcelona in Spain.
The first step is the analysis of the exposure and exposed value thanks to the database Copernicus Coastal Zones [47] and the global depth-damage functions [48]. The city is densely urbanized and on the functional-spatial level, the southern area is characterized by the presence of the port, leader in the transport of goods and passengers thanks to its strategic position in the Mediterranean Sea, while the northern area is characterized by the presence of the three residential districts: Vila Olìmpica, Poblenou, and Diagonal Mar. The three districts are characterized by a low urban density together with the presence of green urban areas, sports, leisure facilities, and sandy beaches.
Considering the vulnerability to ESL events, assessed as function of the mean coastal elevation values that were derived from the DTM model [69], several areas are characterized by critical elevation values (lower than 2.00 m). Indeed, as in the case of Naples, extreme sea level events will become more intense and frequent also in Barcelona, representing an urgent menace to all the socioeconomic activities that are located along the coast.
To analyze the future impacts of ESL, quantifying the potential economic damages to the built environment and to compare the results between the three cities, the Coast-RiskBySea model is applied on the city of Barcelona simulating an ESL event in 2100 that is characterized by RCP 8.5, 100 yr RP and 95%. The ESL climate projections of Vousdoukas et al., 2018 [54] estimated a water depth of about 2.97 m; also in this case, according to a simplified approach, the value is approximated to 3.00 m.
The resulting Coast-RiskBySea output map shows how the city it is characterized by the southern coast with low, medium, and high diffuse risk values and the northern coast where the risk is concentrated only in certain areas but is characterized by medium and high values. Among the areas that are most at risk there are the historic port area (the Port Vell), the Barceloneta neighborhood, and the riverside area (Delta del Llobregat) part of which is classified as cargo port areas and the other as industrial, commercial, public and military areas.
The land use map (Figure 6), the vulnerability map (Figure 7) and the risk map (Figure 8) are shown below.
By 2100, the potential total damages on the built environment due to ESL could reach up to 480 M€. The entire port and marinas areas will be impacted by ESL events with approximately 134 M€ of potential expected damages; considering also the industrial, commercial, public, and military areas adjacent to the port, the potential damage increases up to 367 M€. In the residential areas on the northern coast that are involved in the urban redevelopment project that took place during the 1992 Olympic Games, the damages are only punctually diffused.
As done for the case of Naples, the results, according to Copernicus land use classes, are reported and analyzed in the table below highlighting the damages in spatial and economic terms (Table 4).
The results show that spatially, the damages are concentrated on industrial, commercial, public, and military areas (30% of the impacted surface), cargo port areas (36% of the impacted surface), and passenger port areas (9% of the impacted surface). Marinas (13% of the impacted surface) and green urban, sports, and leisure facilities (3% of the impacted surface) are also particularly at risk.
The economic damages are concentrated in the industrial, public, commercial, and military areas with expected damages of up to 224 million euros (47% of the total damages); in the marina areas with expected damages of up to 108 million euros (23% of the total damages); and, finally, in the road transport networks and associated land with damages up to 73 million euros (15% of the total damages).
Barcelona, during the Olympic Games in 1992, was involved in a large-scale urban regeneration project that considered environmental, social, and economic issues. Although neither explicit nor a priority, the reference to sustainability appears evident; the awareness of the anthropic impact on the natural environment had already matured and started to be shared, translating into concrete design solutions. The project for the new Vila Olìmpica del Poblenou neighborhood, in the north-east part of the city, was an opportunity to solve the problem of temporary flooding that was mainly caused by rainfall. The area was characterized by an incorrect slope and the high impermeability of the soil surfaces. Moreover, there was also a widespread problem of ecological degradation and marine contamination. Therefore, the Olympic Games provided the opportunity to implement an appropriate water management and storage system through large-scale actions, such as improving the underground sewerage system, and specific measures to improve water collection and infiltration through adaptive design solutions at the local scale. Underground storage facilities were also created near the beach to store excess rainwater through collection systems, pumping systems, and purification plants for water reuse [76,77].
On the coastal area, the public waterfront design section is characterized by a multi-functional and multi-level waterfront, which provides in sequence: a wide beach (with a variable thickness between 50 and 100 m), a promenade is elevated about 4–6 m above the beach, followed by green spaces. The height difference in the sections was used to include commercial and public facilities at the lower level. The project thus integrates environmental, social, and economic aspects, combining climate protection and urban design through the creation of accessible and high-quality public space.
Thanks to the initiatives that were launched in the 1990s and those currently that are ongoing, Barcelona is now part of the C40 international network and has launched an ambitious Climate plan 2018–2030 [78] which, goal 11, identifies actions that are aimed at the conservation, restoration, and preservation of coastal areas by promoting their sustainable use through mitigation, adaptation, and climate resilience measures and specific action plans and projects such as the Comprehensive Coastline Management Plan (PGIL) of 2007 or the masterplan for the Olympic Port of 2018.

3.4. Marseille, France

As a third and last case study, the Coast-RiskBySea model is applied to the city of Marseille in the south of France.
Marseille is an important center of maritime economy in terms of trade and tourism thanks to the presence of the port. The Grand Port Maritime de Marseille is one of the most important commercial ports in France, the area is now involved in a series of urban regeneration projects that aim at increasingly integrating tourism and recreational uses to improve the port-city relationship [65,66].
Also in this case, the application of the model Coast-RiskBySea starts from the analysis of exposure and the exposed value. The coastal zone is densely urbanized and on a functional-spatial level the coastal area is characterized by the presence of the port in the northern area (mainly classified as cargo port according to the database Copernicus Coastal Zones), while the southern area is characterized by a dense urban fabric joint with green urban, sports, and leisure facilities. Meanwhile, from a geomorphological point of view, the city is characterized by a complex hilly topography (south-east) This complex soil topography, since the city foundation, has strongly conditioned the settlements of the urban area [79].
Due to its natural sloping topological configuration and anthropic pressure, the city is particularly vulnerable to critical pluvial flood events. The inadequacy of the drainage systems means that rainwater quickly reaches the coast, causing considerable environmental, social, and economic damages. The entire area, according to national legislation, is classified as a high flood risk area, “Territoire à Risque Important d’Inundation (TRI)” [80,81]. Although sea level rise does not represent the main climatic criticality for the Marseille coastline, due to the slope and the predominantly rocky soil type, the historic port, that is located in the south part, and part of the modern port could be subject to coastal flooding being characterized by average coastal elevation values (lower than 2.00 m).
According to ESL climate projections that were estimated Vousdoukas et al., 2018 [54] by 2100, ESL values, considering RCP 8.5, 100 yr RP, and 95%, could reach a critical depth of about 3.10 m high, as done for the other case studies, the value is approximated to 3.00 m.
The land use map (Figure 9), the vulnerability map to ESL (Figure 10), as a function of the mean coastal elevation values that were derived from the DTM [70], and the risk map (Figure 11) are shown below.
The Coast-RiskBySea output map (Figure 11) shows that the urban-port areas are characterized by medium- and high-risk values, while the residential area in the northern part, if not in a punctual manner, are not impacted.
Considering the ESL climate projections, the damages to port infrastructure could have disastrous consequences on a wider scale, going beyond the spatial and temporal boundaries of the areas that are directly affected by the events [82,83,84]. In Marseille’s urban and regional economy, the port infrastructure plays a key role; in 2011 it was estimated that the port employed about 43,000 people and adds value to the companies that are linked to it of more than €3.5 billion [80].
Furthermore, in addition to the economic damages, there could be multiple environmental and social damages, such as the loss or degradation of natural habitats or the increase of marine pollution, a condition that already affects the coastal area [66,85]. The results, according to the Copernicus land use classes, are reported and analyzed in Table 5.
The Coast-RiskBySea results show that, by 2100, for ESL events (RCP 8.5, 100 yr RP and 95%) on a spatial level, the damages are concentrated in the cargo port (59% of the impacted surface) and in the green urban, sport, and leisure facilities areas (17% of the impacted surface). Meanwhile the economic damages are concentrated in green urban, sport, and leisure facilities areas with expected damages up to 75 M€ (32% of the total damages); in the marinas 50 M€ (21% of the total damages); in the road networks and associated land 42 M€ (18% of the total damages); and the industrial, commercial, public, and military areas 28 M€ (12% of the total damages). The potential total damages could reach up to 240 M€.
In recent years, the waterfront of Marseille has been involved in numerous urban regeneration projects such as Villa Méditerranée, the Mucem or the Terrasses du Port shopping center and the Arenc docks [66]. However, the flooding risk has often not been considered over long-term time horizons, and the area of the historic port is still subject to flooding [85]. Thus, the model, also in this case, shows the need to implement long-term climate mitigation and adaptation strategies.

3.5. Model Realiability

Since the accuracy of the simulations has already been verified on the Naples case study [43], a validation of the reliability is proposed in this contribution. The reliability of the Coast-RiskBySea model is verified by comparing the results of the simulations with the results that were assessed by similar works in the scientific literature.
At this stage, considering the same surface extension, it is possible to compare the results of the Coast-RiskBySea model with the results that were obtained by Prahl et al. 2018 [55], only on the case study of Marseille. Prahl et al. 2018 [53] proposed damage functions and their applications for 600 European coastal cities. For each city, the potential economic damages are identified on regular vertical intervals of water depths of 50 cm. Both exposure and vulnerability are determined starting from input data with a lower spatial resolution. The exposure is derived from Copernicus CORINE land-cover (100 m spatial resolution) and LUCAS data (georeferenced point system); and vulnerability from the EU-DEM model SRTM based (30 m spatial resolution).
The comparison of the results that were obtained from the two models is, therefore, carried out for five water depths: +1.00 m, +1.50 m, 2.00 m, +2.50 m, and +3.00, the resulting economic damages are shown and compared in the table below (Table 6).
As shown in the table, the results of the Coast-RiskBySea model differ from the results of the Prahl et al. 2018 model by a maximum of 37% (simulation at 3.00 m) to a minimum of 5% (simulation at 2.00 m). The mean percentage difference is 20% and, therefore, the model can be considered reliable. The identified differences are attributable to the higher resolution of the input data that characterizes the Coast-RiskBySea model.
Further studies are needed to further validate the reliability of the Coast-RiskBySea model and can be implemented based on additional case studies.

4. Results and Discussion

4.1. The Potential Effects of Extreme Sea Level in Euro-Mediterannean Port-Cities

The Coast-RiskBySea simulations on Naples, Barcelona, and Marseille were performed at 2100 considering ESL events according to the scenario RCP 8.5, 100 yr return period and 95th percentile. The simulations that were carried out estimated potential damages for Naples of up to 226 M€, for Barcelona of up to 480 M€, and for Marseille of up to 240 M€.
The results show that in Naples as well as in Barcelona and Marseille, many areas will be potentially impacted by ESL events with a medium level of risk by 2100, but also highlight the presence of some higher risk areas that are mainly located in the historical parts of the cities.
To provide a more detailed analysis, in addition to the proposed simulations, four scenarios are analyzed and compared, two at 2050 and two at 2100, considering ESL events that are characterized by the RCP 8.5, 100 yr return period, 95th percentile and by RCP 4.5, 100 yr return period, 95th percentile. If the simulations that were conducted considering the RCP 8.5 evaluate the worst-case “business-as-usual scenario”, the RCP 4.5 evaluate the “intermediate scenario” in which climate actions are applied [86].
According to the expected water depths in Table 2, a synthesis of the results is presented in table (Table 7).
The application of the Coast-RiskBySea on Naples in the case of RCP 4.5 highlights a stabilization scenario compared to RCP 8.5 business-as-usual scenario, a decrease of economic damages of up to 36% in 2050, and of up to 69% in 2100. In the case of Barcelona, the results highlight a decrease of up to 23% in 2050 and of up to 48% in 2100. Finally, the simulations that were conducted on Marseille highlight a decrease of up to 30% in 2050 and of up to 58% in 2100. It is clear how the reduction of GHG emissions can lead a decrease in the intensity and frequency of extreme sea level events, as well as a lower increase in sea level rise, and thus a decrease in their associated economic damages.
The areas that will potentially be most impacted are those that are characterized by a land use that is industrial, commercial, public, and military together with green urban, sport, and leisure facilities and port areas. Concerning port areas with the related industrial, commercial, public, and military areas, considering that the average lifetime of these infrastructures is approximately 80–90 years, these territories should be redefined by integrating climate mitigation and adaptation issues considering long-term climate goals [87,88,89,90].
The simulations that were conducted show the maximum potential economic damage for ESL events on the built environment. As anticipated, the simulations consider the worst case, in terms of return period and percentile, and thus the maximum potential economic damage. Besides testing alternative hazard scenarios, further efforts are needed to integrate the potential effect of defense systems (reefs, barriers, beaches, etc.) and the potential parameters of water flow increase/decrease (distance from the coastline, slopes, surface permeability, etc.) that could significantly reduce economic damages.

4.2. The Coast-RiskBySea Model to Support Decision Makers

Climate objectives should be integrated into urban design to implement prevention, adaptation, and recovery to climate impacts by mitigating the causes and prefiguring the capacity of urban systems to respond to future impacts. In the context of Euro-Mediterranean port cities, the theme of urban regeneration and climate protection offers an opportunity to protect and enhance the built and the natural environment.
The Coast-RiskBySea model aims to become a decision support tool to identify risk areas and the related degree of risk. The knowledge of risk that is parameterized according to the potential economic damages is a key issue for all decision-makers. Currently the model allows to assess only the direct and tangible impacts, but further studies could include the assessment of indirect and intangible ones.
Compared to the models in the reference literature, the Coast-RiskBySea is characterized by the use of open-source data with European spatial coverage, combined with remote sensing data (DTM), thus allowing analysis even in areas where there are no specific data. To test the replicability of the approach, the model was tested in three cities of different European countries: Italy, Spain, and France. The use of data with homogeneous spatial coverage in GIS systems allows to perform assessments in a short time.
Another key aspect of the proposed method is the use of the reference grid that, despite the simplification of the territory, allows to store the information that is useful for decision support, for example, legislative restrictions. Moreover, the use of a standard nomenclature ensures that assessment can always be updated.
Although compared to similar models in the scientific literature, the Coast-RiskBySea allowed a greater downscaling of the analyses, further efforts are needed to improve decision support. Economic damages are assessed over the entire surface extension of the sampling units (cells) and, therefore, to improve support at the scale of specific urban elements (such us buildings, streets, and open spaces), it is necessary to investigate the elements within these areas.
Moreover, only risk information is provided, without proposing any climate adaptation design strategies to support decision-makers; possible developments of the model, therefore, suggest the integration of a database of climate adaptive solutions.

5. Conclusions

In coastal areas, climate projections, both in the short- and long-term, show a significant increase in terms of the frequency and intensity of extreme sea level events [25], with potential disastrous consequences for urban settlements that are located along the coast where, moreover, there is a high population density that is accompanied by the presence of important infrastructure and activities.
In Euro-Mediterranean port-cities and, in general, in maritime cities, climate mitigation and adaptation will have to become priority objectives for a sustainable development perspective [31,32,33,38]. Under climate change, the performance of projects depends directly on the knowledge of climate risks [34]. Following the objectives of the European Community for green and digital transformation, the Coast-RiskBySea (COASTal zones RISK assessment for built environment by extreme SEA level) model represents an innovative methodology and tool for observation and knowledge of coastal risk that is oriented to support designers, planners, institution, and/or insurers [41]. The model is characterized by the use of homogeneous sampling units on which, following the IPCC framework, exposure, vulnerability, and hazard are assessed to then determine the potential economic damages and to define risk scenarios. Thus, the Coast-RiskBySea allows the identification of areas that are at risk and the related degree of risk that is parameterized according to the potential direct and tangible economic damages on the built environment.
The model was tested on Naples in Italy, Barcelona in Spain, and Marseille in France to get an overview of the western Euro-Mediterranean region under ESL climate scenario. The simulations show the synergy between GIS open-source/remote sensing data for coastal risk assessment, especially concerning the recent Copernicus Coastal Zones database [47]. The results evidence that the three cities will potentially be impacted by ESL events both in 2050 and 2100 with significant economic consequences.
Ports and marinas in Naples, Barcelona and will be particularly impacted, suggesting that long-term climate objectives should be integrated into the design of these infrastructures. Furthermore, the simulations highlight how reducing GHG emissions is an urgent imperative to limit global warming and thus the potential economic damages on the built environment due to ESL events.

Funding

The contribution was developed within the framework of a PhD project in Architecture at the Department of Architecture of the University of Naples Federico II.

Institutional Review Board Statement

Not applicable.

Informed Consent Statement

Not applicable.

Data Availability Statement

Data that were used are all available online in open-source format, in particular: Copernicus Coastal Zones Land Cover/Land Use 2018 data—https://land.copernicus.eu/local/coastal-zones/coastal-zones-2018, accessed on 20 September 2021; Digital Terrain Model—http://www.pcn.minambiente.it/viewer/index.php?services=LiDAR_Campania (Naples), accessed on 10 October 2020; https://geoportalcartografia.amb.cat/AppGeoportalCartografia2/index.html?locale=en (Barcelona), accessed on 17 October 2021; https://geoservices.ign.fr/ (Marseille), accessed on 5 October 2021; ESL projections database—https://data.jrc.ec.europa.eu/collection/LISCOAST, accessed on 5 October 2021; Global depth-damage functions—https://publications.jrc.ec.europa.eu/repository/handle/JRC105688, accessed on 20 September 2021. OpenStreetMap® was used for the base maps. The software used is QGIS 3.16.

Conflicts of Interest

The authors declare no conflict of interest.

Abbreviations

%Climate percentile
EUEuropean Union
JRCJoint Research Centre
DTMDigital Terrain Model
ESLExtreme Sea Leve
IPCCIntergovernmental Panel on Climate Change
yryears
mmeters
MMillion
RCPRepresentative Concentration Pathways
RPReturn Period

References

  1. Crutzen, P.J. Geology of mankind. Nature 2002, 415, 23. [Google Scholar] [CrossRef]
  2. Oppenheimer, M.; Campos, M.; Warren, R.; Birkmann, J.; Luber, G.; O’Neill, B.; Takahashi, K. Emergent risks and key vulnerabilities. In Climate Change 2014: Impacts, Adaptation, and Vulnerability; Part A: Global and Sectoral Aspects; Contribution of Working Group II to the Fifth Assessment Report of the Intergovernmental Panel of Climate Change; Field, C.B., Barros, V.R., Dokken, D.J., Mach, K.J., Mastrandrea, M.D., Bilir, T.E., Chatterjee, M., Ebi, K.L., Estrada, Y.O., Genova, R.C., et al., Eds.; Cambridge University Press: Cambridge, UK, 2014; pp. 1039–1099. [Google Scholar]
  3. IPCC. Summary for Policy makers. In Climate Change 2021: The Physical Science Basis; Contribution of Working Group I to the Sixth Assessment Report of the Intergovernmental Panel on Climate Change. Change (2021); Masson-Delmotte, V., Zhai, P., Pirani, A., Connors, S.L., Péan, C., Berger, S., Caud, N., Chen, Y., Goldfarb, L., Gomis, M.I., et al., Eds.; Cambridge University Press: Cambridge, UK; New York, NY, USA, 2021; pp. 23–32. [Google Scholar]
  4. Hallegatte, S.; Green, C.; Nicholls, R.J.; Corfee-Morlot, J. Future flood losses in major coastal cities. Nat. Clim. Chang. 2013, 3, 802–806. [Google Scholar] [CrossRef]
  5. Turner, R.K.; Subak, S.; Adger, W.N. Pressures, trends, and impacts in coastal zones: Interactions between socioeconomic and natural systems. Environ. Manag. 1996, 20, 159–173. [Google Scholar] [CrossRef]
  6. Nicholls, R.J.; Wong, P.P.; Burkett, V.R.; Codignotto, J.O.; Hay, J.E.; McLean, R.F.; Ragoonaden, S.; Woodroffe, C.D. Coastal Systems and Low-Lying Areas Climate Change 2007: Impacts, Adaptation and Vulnerability; Contribution of Working Group II to the Fourth Assessment Report of the Intergovernmental Panel on Climate Change; Parry, M.L., Canziani, O.F., Palutikof, J.P., van der Linden, P.J., Hanson, C.E., Eds.; Cambridge University Press: Cambridge, UK, 2007; pp. 315–335. Available online: https://www.ipcc.ch/site/assets/uploads/2018/02/ar4-wg2-chapter6-1.pdf (accessed on 12 October 2021).
  7. Kron, W. Coasts: The high-risk areas of the world. Nat. Hazards 2012, 66, 1363–1382. [Google Scholar] [CrossRef]
  8. Giorgi, F. Climate Change Hot-Spots. Geophys. Res. Lett. 2006, 33, 101029. [Google Scholar] [CrossRef]
  9. Ruti, P.M.; Somot, S.; Giorgi, F.; Dubois, C.; Flaounas, E.; Obermann, A.; Dell’Aquila, A.; Pisacane, G.; Harzallah, A.; Lombardi, E.; et al. Med-CORDEX Initiative for Mediterranean Climate Studies. Bull. Am. Meteorol. Soc. 2016, 97, 1187–1208. [Google Scholar] [CrossRef]
  10. IPCC. Climate Change 2022: Impacts, Adaptation and Vulnerability; Contribution of Working Group II to the Sixth Assessment Report of the Intergovernmental Panel on Climate Change; Pörtner, H.-O., Roberts, D.C., Tignor, M., Poloczanska, E.S., Mintenbeck, K., Alegría, A., Craig, M., Langsdorf, S., Löschke, S., Möller, V., et al., Eds.; Cambridge University Press: Cambridge, UK; New York, NY, USA, 2022. [Google Scholar]
  11. Satta, A.; Puddu, M.; Venturini, S.; Giupponi, C. Assessment of coastal risks to climate change related impacts at the regional scale: The case of the Mediterranean region. Int. J. Disaster Risk Reduct. 2017, 24, 284–296. [Google Scholar] [CrossRef]
  12. Small, C.; Nicholls, R. A Global Analysis of Human Settlement in Coastal Zones. J. Coast. Res. 2003, 19, 584–599. Available online: http://www.jstor.org/stable/4299200 (accessed on 11 November 2021).
  13. Neumann, B.; Vafeidis, A.T.; Zimmermann, J.; Nicholls, R.J. Future coastal population growth and exposure to sea-level rise and coastal flooding-a global assessment. PLoS ONE 2015, 10, e0118571. [Google Scholar] [CrossRef]
  14. Wolff, C.; Nikoletopoulos, T.; Hinkel, J.; Vafeidis, A.T. Future urban development exacerbates coastal exposure in the Mediterranean. Sci. Rep. 2020, 10, 14420. [Google Scholar] [CrossRef] [PubMed]
  15. Zacharias, I.; Zamparas, M. Mediterranean temporary ponds. A disappearing ecosystem. Biodivers. Conserv. 2010, 19, 3827–3834. [Google Scholar] [CrossRef]
  16. Toubes, D.R.; Gössling, S.; Hall, C.M.; Scott, D. Vulnerability of Coastal Beach Tourism to Flooding: A Case Study of Galicia, Spain. Environments 2017, 4, 83. [Google Scholar] [CrossRef]
  17. Garcia-Ayllon, S. Long-Term GIS Analysis of Seaside Impacts Associated to Infrastructures and Urbanization and Spatial Correlation with Coastal Vulnerability in a Mediterranean Area. Water 2018, 10, 1642. [Google Scholar] [CrossRef]
  18. Reimann, L.; Vafeidis, A.T.; Brown, S.; Hinkel, J.; Tol, R.S.J. Mediterranean UNESCO World Heritage at risk from coastal flooding and erosion due to sea-level rise. Nat. Commun. 2018, 9, 4161. [Google Scholar] [CrossRef]
  19. European Comission. Directive 2007/60/EC of the European Parliament and of the Council of 23 October 2007 on the Assessment and Management of Flood Risks. Official Journal of the European Union. 2007. Available online: https://eur-lex.europa.eu/legal-content/EN/TXT/?uri=CELEX:32007L0060 (accessed on 10 November 2021).
  20. Church, J.A.; Clark, P.U.; Cazenave, A.; Gregory, J.M.; Jevrejeva, S.; Levermann, A.; Merrifield, M.A.; Milne, G.A.; Nerem, R.S.; Nunn, P.D.; et al. Sea Level Change. In Climate Change 2013: The Physical Science Basis. Contribution of Working Group I to the Fifth Assessment Report of the Intergovernmental Panel on Climate Change; Stocker, T.F., Qin, D., Plattner, G.-K., Tignor, M., Allen, S.K., Boschung, J., Nauels, A., Xia, Y., Bex, V., Midgley, P.M., Eds.; Cambridge University Press: Cambridge, UK; New York, NY, USA, 2013; pp. 1137–1216. Available online: https://www.ipcc.ch/report/ar5/wg1/ (accessed on 8 March 2022).
  21. Vermeer, M.; Rahmstorf, S. Global Sea Level Linked to Global Temperature. Proc. Natl. Acad. Sci. USA 2009, 106, 21527–21532. [Google Scholar] [CrossRef] [PubMed]
  22. Vitousek, S.; Barnard, P.L.; Fletcher, C.H.; Frazer, N.; Erikson, L.; Storlazzi, C.D. Doubling of coastal flooding frequency within decades due to sea-level rise. Sci. Rep. 2017, 7, 1399. [Google Scholar] [CrossRef] [PubMed]
  23. Taherkhani, M.; Vitousek, S.; Barnard, P.L.; Frazer, N.; Anderson, T.R.; Fletcher, C.H. Sea-level rise exponentially increases coastal flood frequency. Sci. Rep. 2020, 10, 6466. [Google Scholar] [CrossRef] [PubMed]
  24. Wahl, T.; Haigh, I.D.; Nicholls, R.J.; Arns, A.; Dangendorf, S.; Hinkel, J.; Slangen, A.B.A. Understanding extreme sea levels for broad-scale coastal impact and adaptation analysis. Nat. Commun. 2017, 8, 16075. [Google Scholar] [CrossRef] [PubMed]
  25. Vousdoukas, M.I.; Mentaschi, L.; Voukouvalas, E.; Verlaan, M.; Jevrejeva, S.; Jackson, L.P.; Feyen, L. Global probabilistic projections of extreme sea levels show intensification of coastal flood hazard. Nat. Commun. 2018, 9, 2360. [Google Scholar] [CrossRef] [PubMed]
  26. Weisse, R.; Bellafiore, D.; Menéndez, M.; Méndez, F.; Nicholls, R.J.; Umgiesser, G.; Willems, P. Changing extreme sea levels along European coasts. Coast. Eng. 2013, 87, 4–14. [Google Scholar] [CrossRef]
  27. Muis, S.; Verlaan, M.; Winsemius, H.; Aerts, J.C.J.H.; Ward, P.J. A global reanalysis of storm surges and extreme sea levels. Nat. Commun. 2016, 7, 11969. [Google Scholar] [CrossRef] [PubMed]
  28. Hinkel, J.; Nicholls, R.J.; Vafeidis, A.T.; Tol, R.S.; Avagianou, T. Assessing risk of and adaptation to sea-level rise in the European Union: An application of DIVA. Mitig. Adapt. Strateg. Glob. Change 2010, 15, 703–719. [Google Scholar] [CrossRef]
  29. Rosenzweig, C.; Solecki, W.; Romero-Lankao, P.; Mehrotra, S.; Dhakal, S.; Bowman, T.; Ibrahim, S.A. ARC3.2 Summary for City Leaders Climate Change and Cities: Second Assessment Report of the Urban Climate Change Research Network; Cambridge University Press: Cambridge, UK, 2015. [Google Scholar]
  30. Spano, D.; Mereu, V.; Bacciu, V.; Giuliana, B.; Casartelli, V.; Ellena, M.; Lamesso, E.; Ledda, A.; Marras, S.; Mercogliano, P.; et al. Analisi del Rischio. I Cambiamenti Climatici in sei Città Italiane; Fondazione CMCC—Centro Euro-Mediterraneo sui Cambiamenti Climatici: Lecce, Italy, 2020. [Google Scholar] [CrossRef]
  31. European Commission. Communication from the Commission to the European Parliament, the Council, the European Economic and Social Committee and the Committee of the Regions. An EU Strategy on Adaptation to Climate Change. COM/2013/0216 Final. 2013. Available online: https://eur-lex.europa.eu/legal-content/IT/TXT/?uri=CELEX%3A52013DC0216 (accessed on 18 October 2021).
  32. EEA. Climate Change Adaptation and Disaster Risk Reduction in Europe. EEA–European Environment Agency Reports. 2017. Available online: https://www.eea.europa.eu/publications/climate-change-adaptation-and-disaster (accessed on 18 October 2021).
  33. European Environment Agency. Europe’s Seas and Coasts. 2019. Available online: https://www.eea.europa.eu/themes/water/europes-seas-and-coasts (accessed on 18 October 2021).
  34. European Commission. Impact Assessment Report The new EU Strategy on Adaptation to Climate Change, 2021, SWD/2021/25 final. Available online: https://ec.europa.eu/clima/eu-action/adaptation-climate-change/eu-adaptation-strategy_it (accessed on 10 January 2022).
  35. Castellari, S.; Venturini, S.; Ballarin Denti, A.; Bigano, A.; Bindi, M.; Bosello, F.; Carrera, L.; Chiriaco, M.V.; Danovaro, R.; Desiato, F.; et al. Rapporto Sullo Stato Delle Conoscenze Scientifiche Su Impatti, Vulnerabilità Ed Adattamento Ai Cambiamenti Climatici in Italia; Ministero dell’Ambiente e della Tutela del Territorio e del Mare: Rome, Italy, 2014. [Google Scholar]
  36. Reckien, D.; Salvia, M.; Pietrapertosa, F.; Simoes, S.G.; Olazabal, M.; De Gregorio Hurtado, S.; Geneletti, D.; Lorencová, E.K.; D’Alonzo, V.; Krook-Riekkola, A.; et al. Dedicated versus mainstreaming approaches in local climate plans in Europe. Renew. Sustain. Energy Rev. 2019, 112, 948–959. [Google Scholar] [CrossRef]
  37. EEA. Report No 6/2020. Monitoring and Evaluation of National Adaptation Policies Throughout the Policy Cycle. Available online: https://www.eea.europa.eu/publications/national-adaptation-policies. (accessed on 20 September 2021).
  38. Feyen, L.; Ciscar Martinez, J.; Gosling, S.; Ibarreta Ruiz, D.; Soria Ramirez, A.; Dosio, A.; Naumann, G.; Russo, S.; Formetta, G.; Forzieri, G.; et al. Climate Change Impacts and Adaptation in Europe; EUR 30180 EN; Publications Office of the European Union: Luxembourg, 2020. [Google Scholar]
  39. European Commission. Communication from the Commission to the European Parliament; the Council, the European Economic and Social Committee and the Committee of the Regions. A European Strategy for Key Enabling Technologies—A Bridge to Growth and Jobs. COM(2012)341. 2012. Available online: https://ec.europa.eu/transparency/documents-register/detail?ref=COM(2012)341&lang=en (accessed on 10 September 2021).
  40. Kaźmierczak, A.; Cavan, G. Surface water flooding risk to urban communities: Analysis of vulnerability, hazard and exposure. Landsc. Urban Plan. 2011, 103, 185–197. [Google Scholar] [CrossRef]
  41. Clemente, M.F.; D’Ambrosio, V.; Focareta, M. The proposal of the Coast-RiskBySea: COASTal zones RISK assessment for Built environment bY extreme SEA level, based on the new Copernicus Coastal Zones data. Int. J. Disaster Risk Reduct. 2022, 75, 102947. [Google Scholar] [CrossRef]
  42. Clemente, M.F.; D’Ambrosio, V.; Focareta, M. Processi GIS-based finalizzati alla classificazione della vulnerabilità dell’ambiente urbano-costiero in regime di cambiamento climatico. In GIS Day 2020, il GIS per il Governo e la Gestione del Territorio; Cardone, B., Di Martino, F., Eds.; Aracne Editore: Rome, Italy, 2021; pp. 103–122. [Google Scholar]
  43. Birch, C.; Sander, O.; Beecham, J. Rectangular and hexagonal grids used for observation, experiment and simulation in ecology. Ecol. Model. 2007, 206, 347–359. [Google Scholar] [CrossRef]
  44. Dong, N.; Yang, X.; Cai, H.; Xu, F. Research on Grid Size Suitability of Gridded Population Distribution in Urban Area: A Case Study in Urban Area of Xuanzhou District, China. PLoS ONE 2017, 12, e0170830. [Google Scholar] [CrossRef] [PubMed]
  45. Shoman, W.; Alganci, U.; Demirel, H. A comparative analysis of gridding systems for point-based land cover/use analysis. Geocarto Int. 2019, 34, 867–886. [Google Scholar] [CrossRef]
  46. Bousquin, J. Discrete Global Grid Systems as scalable geospatial frameworks for characterizing coastal environments. Environ. Model. Softw. 2021, 105210. [Google Scholar] [CrossRef] [PubMed]
  47. Copernicus Coastal Zones Land Cover/Land Use. 2018. Available online: https://land.copernicus.eu/local/coastal-zones/coastal-zones-2018 (accessed on 20 September 2021).
  48. Huizinga, J.; De Moel, H.; Szewczyk, W. Global Depth-Damage Functions Database with Guidelines. EUR 28552 EN, Publications Office of the European Union: Luxembourg. Available online: https://publications.jrc.ec.europa.eu/repository/handle/JRC105688 (accessed on 20 September 2021).
  49. Bates, P.D.; De Roo, A.P.J. A simple raster-based model for flood inundation simulation. J. Hydrol. 2000, 236, 54–77. [Google Scholar] [CrossRef]
  50. Boettle, M.; Kropp, J.P.; Reiber, L.; Roithmeier, O.; Rybski, D.; Walther, C. About the influence of elevation model quality and small-scale damage functions on flood damage estimation. Nat. Hazards Earth Syst. Sci. 2011, 11, 3327–3334. [Google Scholar] [CrossRef]
  51. Breilh, J.F.; Chaumillon, E.; Bertin, X.; Gravelle, M. Assessment of static flood modeling techniques: Application to contrasting marshes flooded during Xynthia (western France). Nat. Hazards Earth Syst. Sci. 2013, 13, 1595–1612. [Google Scholar] [CrossRef]
  52. Ali, A.M.; Solomatine, D.P.; Di Baldassarre, G. Assessing the impact of different sources of topographic data on 1-D hydraulic modelling of floods. Hydrol. Earth Syst. Sci. 2015, 19, 631–643. [Google Scholar] [CrossRef]
  53. Prahl, B.F.; Boettle, M.; Costa, L.; Kropp, J.P.; Rybski, D. Damage and protection cost curves for coastal floods within the 600 largest European cities. Sci. Data 2018, 5, 180034. [Google Scholar] [CrossRef] [PubMed]
  54. Vousdoukas, M.; Mentaschi, L.; Voukouvalas, E.; Verlaan, M.; Jevrejeva, S.; Jackson, L.; Feyen, L. Global Extreme Sea Level Projections; European Commission, Joint Research Centre (JRC): Ispra, Italy, 2018. [Google Scholar] [CrossRef]
  55. Abadie, L.M. Sea level damage risk with probabilistic weighting of IPCC scenarios: An application to major coastal cities. J. Clean. Prod. 2018, 175, 582–598. [Google Scholar] [CrossRef]
  56. Meyer, V.; Becker, N.; Markantonis, V.; Schwarze, R.; van den Bergh, J.C.J.M.; Bouwer, L.M.; Bubeck, P.; Ciavola, P.; Genovese, E.; Green, C.; et al. Review article: Assessing the costs of natural hazards—State of the art and knowledge gaps. Nat. Hazards Earth Syst. Sci. 2013, 13, 1351–1373. [Google Scholar] [CrossRef]
  57. Armaroli, C.; Duo, E.; Viavattene, C. From Hazard to Consequences: Evaluation of Direct and Indirect Impacts of Flooding Along the Emilia-Romagna Coastline, Italy. Front. Earth Sci. 2013, 7, 103. [Google Scholar] [CrossRef]
  58. Rogers, A.A.; Dempster, F.L.; Hawkins, J.I.; Johnston, R.J.; Boxall, P.C.; Rolfe, J.; Kragt, M.E.; Burton, M.P.; Pannell, D.J. Valuing non-market economic impacts from natural hazards. Nat. Hazards 2019, 99, 1131–1161. [Google Scholar] [CrossRef]
  59. Gallien, T.W.; Sanders, B.F.; Flick, R.E. Urban coastal flood prediction: Integrating wave overtopping, flood defenses and drainage. Coast. Eng. 2014, 91, 18–28. [Google Scholar] [CrossRef]
  60. Seenath, A.; Wilson, M.; Miller, K. Hydrodynamic versus GIS modelling for coastal flood vulnerability assessment: Which is better for guiding coastal management? Ocean Coast. Manag. 2016, 120, 99–109. [Google Scholar] [CrossRef]
  61. European Commision. ESDP European Spatial Development Perspective. Towards Balanced and Sustainable Developent of the Territory of the European; European Commision: Luxembourg, 1999. [Google Scholar]
  62. Jauhiainen, J.S. Waterfront redevelopment and urban policy: The case of Barcelona, Cardiff and Genoa. Eur. Plan. Stud. 1995, 3, 3–23. [Google Scholar] [CrossRef]
  63. Monclús, F.-J. The Barcelona model: And an original formula? From ‘reconstruction’ to strategic urban projects (1979–2004). Plan. Perspect. 2003, 18, 399–421. [Google Scholar] [CrossRef]
  64. Degen, M.; Garcia, M. The Transformation of the ‘Barcelona Model’: An Analysis of Culture, Urban Regeneration and Governance. Int. J. Urban Reg. Res. 2012, 36, 1022–10338. [Google Scholar] [CrossRef]
  65. Alemany Llovera, J. Marseille, the Port and the European Capital of Culture 2013. Portus: The Online Magazine of Rete 2013. RETE Publisher, Venice, Italy. Available online: https://portusonline.org/marseille-the-port-and-the-european-capital-of-culture-2013-2/ (accessed on 23 March 2022).
  66. Buslacchi, M.E. A View From The Sea The Regeneration of Marseille Waterfront: Iconic Buildings And Mediterranean Sea. Territ. Ric. Insediamenti Ambiente 2013, 11, 3–14. [Google Scholar] [CrossRef]
  67. Pirlone, F.; Erriu, D. Waterfront and urban regeneration. J. Land Use Mobi l. Environ. 2016, 9, 305–322. [Google Scholar] [CrossRef]
  68. DTM Naples. Available online: http://www.pcn.minambiente.it/viewer/index.php?services=LiDAR_Campania (accessed on 10 October 2020).
  69. DTM Barcelona. Available online: https://geoportalcartografia.amb.cat/AppGeoportalCartografia2/index.html?locale=en (accessed on 17 October 2021).
  70. DTM Marseille. Available online: https://geoservices.ign.fr/ (accessed on 5 October 2021).
  71. Kenward, T.; Lettenmaier, D.P.; Wood, E.F.; Fielding, E. Effects of Digital Elevation Model Accuracy on Hydrologic Predictions. Remote Sens. Environ. 2000, 74, 432–444. [Google Scholar] [CrossRef]
  72. Casas, A.; Benito, G.; Thorndycraft, V.R.; Rico, M. The topographic data source of digital terrain models as a key element in the accuracy of hydraulic flood modelling. Earth Surf. Process. Landf. 2006, 31, 444–456. [Google Scholar] [CrossRef]
  73. Arrighi, C.; Campo, L. Effects of digital terrain model uncertainties on high-resolution urban flood damage assessment. J. Flood Risk Manag. 2019, 12, e12530. [Google Scholar] [CrossRef]
  74. Muthusamy, M.; Casado, M.R.; Butler, D.; Leinster, P. Understanding the effects of Digital Elevation Model resolution in urban fluvial flood modelling. J. Hydrol. 2021, 596, 126088. [Google Scholar] [CrossRef]
  75. Valente, R.; Stamatopoulos, L.; Donadio, C. Environmental Design Criteria through Geoindicators for two Mediterranean Coastlands. City Saf. Energy 2014, 63–76. [Google Scholar] [CrossRef]
  76. Saurí, D.; Palau-Rof, L. Urban drainage in Barcelona: From hazard to resource? Water Altern. 2017, 10, 475–492. [Google Scholar]
  77. Losasso, M. Progettazione ambientale, rischi climatici, resilienza del costruito. In Progettazione Ambientale per L’adattamento al Climate Change–2. Strumenti e Indirizzi per la Riduzione dei Rischi Climatici; D’Ambrosio, V., Leone, M.F., Eds.; Clean Edizioni: Naples, Italy, 2017; pp. 152–174. [Google Scholar]
  78. Barcelona Climate Plan 2018–2030. Available online: https://www.c40knowledgehub.org/s/article/Barcelona-s-Climate-Action-Plan-2018-2030?language=en_US (accessed on 5 February 2022).
  79. Robert, S.; Fox, D.; Boulay, G.; Grandclément, A.; Garrido, M.; Pasqualini, V.; Prévost, A.; Schleyer-Lindenmann, A.; Trémélo, M.-L. A framework to analyse urban sprawl in the French Mediterranean coastal zone. Reg. Environ. Chang. 2019, 19, 559–572. [Google Scholar] [CrossRef]
  80. Chalvet, M.; Claeys, C. Marseille, une ville méditerranéenne entre pénurie et inondation. VertigO Rev. Électronique Sci. Environ. 2011, 10. [Google Scholar] [CrossRef]
  81. DREAL PACA. Territoire à Risque Important d’inondation (TRI) de Marseille—Aubagne. Cartographie des Surfaces Inondables et des Risques—Service Prévention des Risques. 2014. Available online: https://www.rhone-mediterranee.eaufrance.fr/cartographie-des-risques-dinondations-du-tri-de-marseilleaubagne (accessed on 20 March 2022).
  82. Adam, E.F.; Brown, S.; Nicholls, R.J.; Tsimplis, M. A systematic assessment of maritime disruptions affecting UK ports, coastal areas and surrounding seas from 1950 to 2014. Nat. Hazards 2016, 83, 691–713. [Google Scholar] [CrossRef]
  83. Wendler-Bosco, V.; Nicholson, C. Port disruption impact on the maritime supply chain: A literature review. Sustain. Resilient Infrastruct. 2020, 5, 378–394. [Google Scholar] [CrossRef]
  84. Izaguirre, C.; Losada, I.J.; Camus, P.; Vigh, J.L.; Stenek, V. Climate change risk to global port operations. Nat. Clim. Chang. 2021, 11, 14–20. [Google Scholar] [CrossRef]
  85. Robert, S.; Laffont-Schwob, I. Le littoral marseillais: Marseille et l’environnement. Bilan Qual. Enjeux 2021, 6, 147–170. [Google Scholar] [CrossRef]
  86. Van Vuuren, D.P.; Edmonds, J.; Kainuma, M.; Riahi, K.; Thomson, A.; Hibbard, K.; Hurtt, G.C.; Kram, T.; Krey, V.; Lamarque, J.-F.; et al. The representative concentration pathways: An overview. Clim. Chang. 2011, 109, 5–31. [Google Scholar] [CrossRef]
  87. Becker, A.; Inoue, S.; Fischer, M.; Schwegler, B. Climate change impacts on international seaports: Knowledge, perceptions, and planning efforts among port administrators. Clim. Chang. 2012, 110, 5–29. [Google Scholar] [CrossRef]
  88. Schipper, C.A.; Vreugdenhil, H.; de Jong, M.P.C. A sustainability assessment of ports and port-city plans: Comparing ambitions with achievements. Transp. Res. Part D Transp. Environ. 2017, 57, 84–111. [Google Scholar] [CrossRef]
  89. Hanson, S.E.; Nicholls, R.J. Demand for ports to 2050: Climate policy, growing trade and the impacts of sea-level rise. Earth’s Future 2020, 8, e2020EF001543. [Google Scholar] [CrossRef]
  90. Toimil, A.; Losada, I.J.; Nicholls, R.J.; Dalrymple, R.A.; Stive, M.J. Addressing the challenges of climate change risks and adaptation in coastal areas: A review. Coast. Eng. 2020, 156, 103611. [Google Scholar] [CrossRef]
Figure 1. Coast-RiskBySea workflow. Source: [41].
Sustainability 14 10096 g001
Figure 2. Location map of case studies.
Sustainability 14 10096 g002
Figure 3. Coast-RiskBySea on Naples (Italy), land use map. Source: [41].
Sustainability 14 10096 g003
Figure 4. Coast-RiskBySea on Naples (Italy), vulnerability map. Source: [41].
Sustainability 14 10096 g004
Figure 5. Coast-RiskBySea on Naples (Italy), risk map to ESL (RCP 8.5, 100 yr RP, 95%). Source: [41].
Sustainability 14 10096 g005
Figure 6. Coast-RiskBySea on Barcelona (Spain), land use map.
Sustainability 14 10096 g006
Figure 7. Coast-RiskBySea on Barcelone (Spain), vulnerability map.
Sustainability 14 10096 g007
Figure 8. Coast-RiskBySea on Barcelona (Spain), risk map.
Sustainability 14 10096 g008
Figure 9. Coast-RiskBySea on Marseille (France), land use map.
Sustainability 14 10096 g009
Figure 10. Coast-RiskBySea on Marseille (France), vulnerability map.
Sustainability 14 10096 g010
Figure 11. Coast-RiskBySea on Marseille (France), risk map.
Sustainability 14 10096 g011
Table 1. Coast-RiskBySea data source.
ParameterData SourceData Characteristics
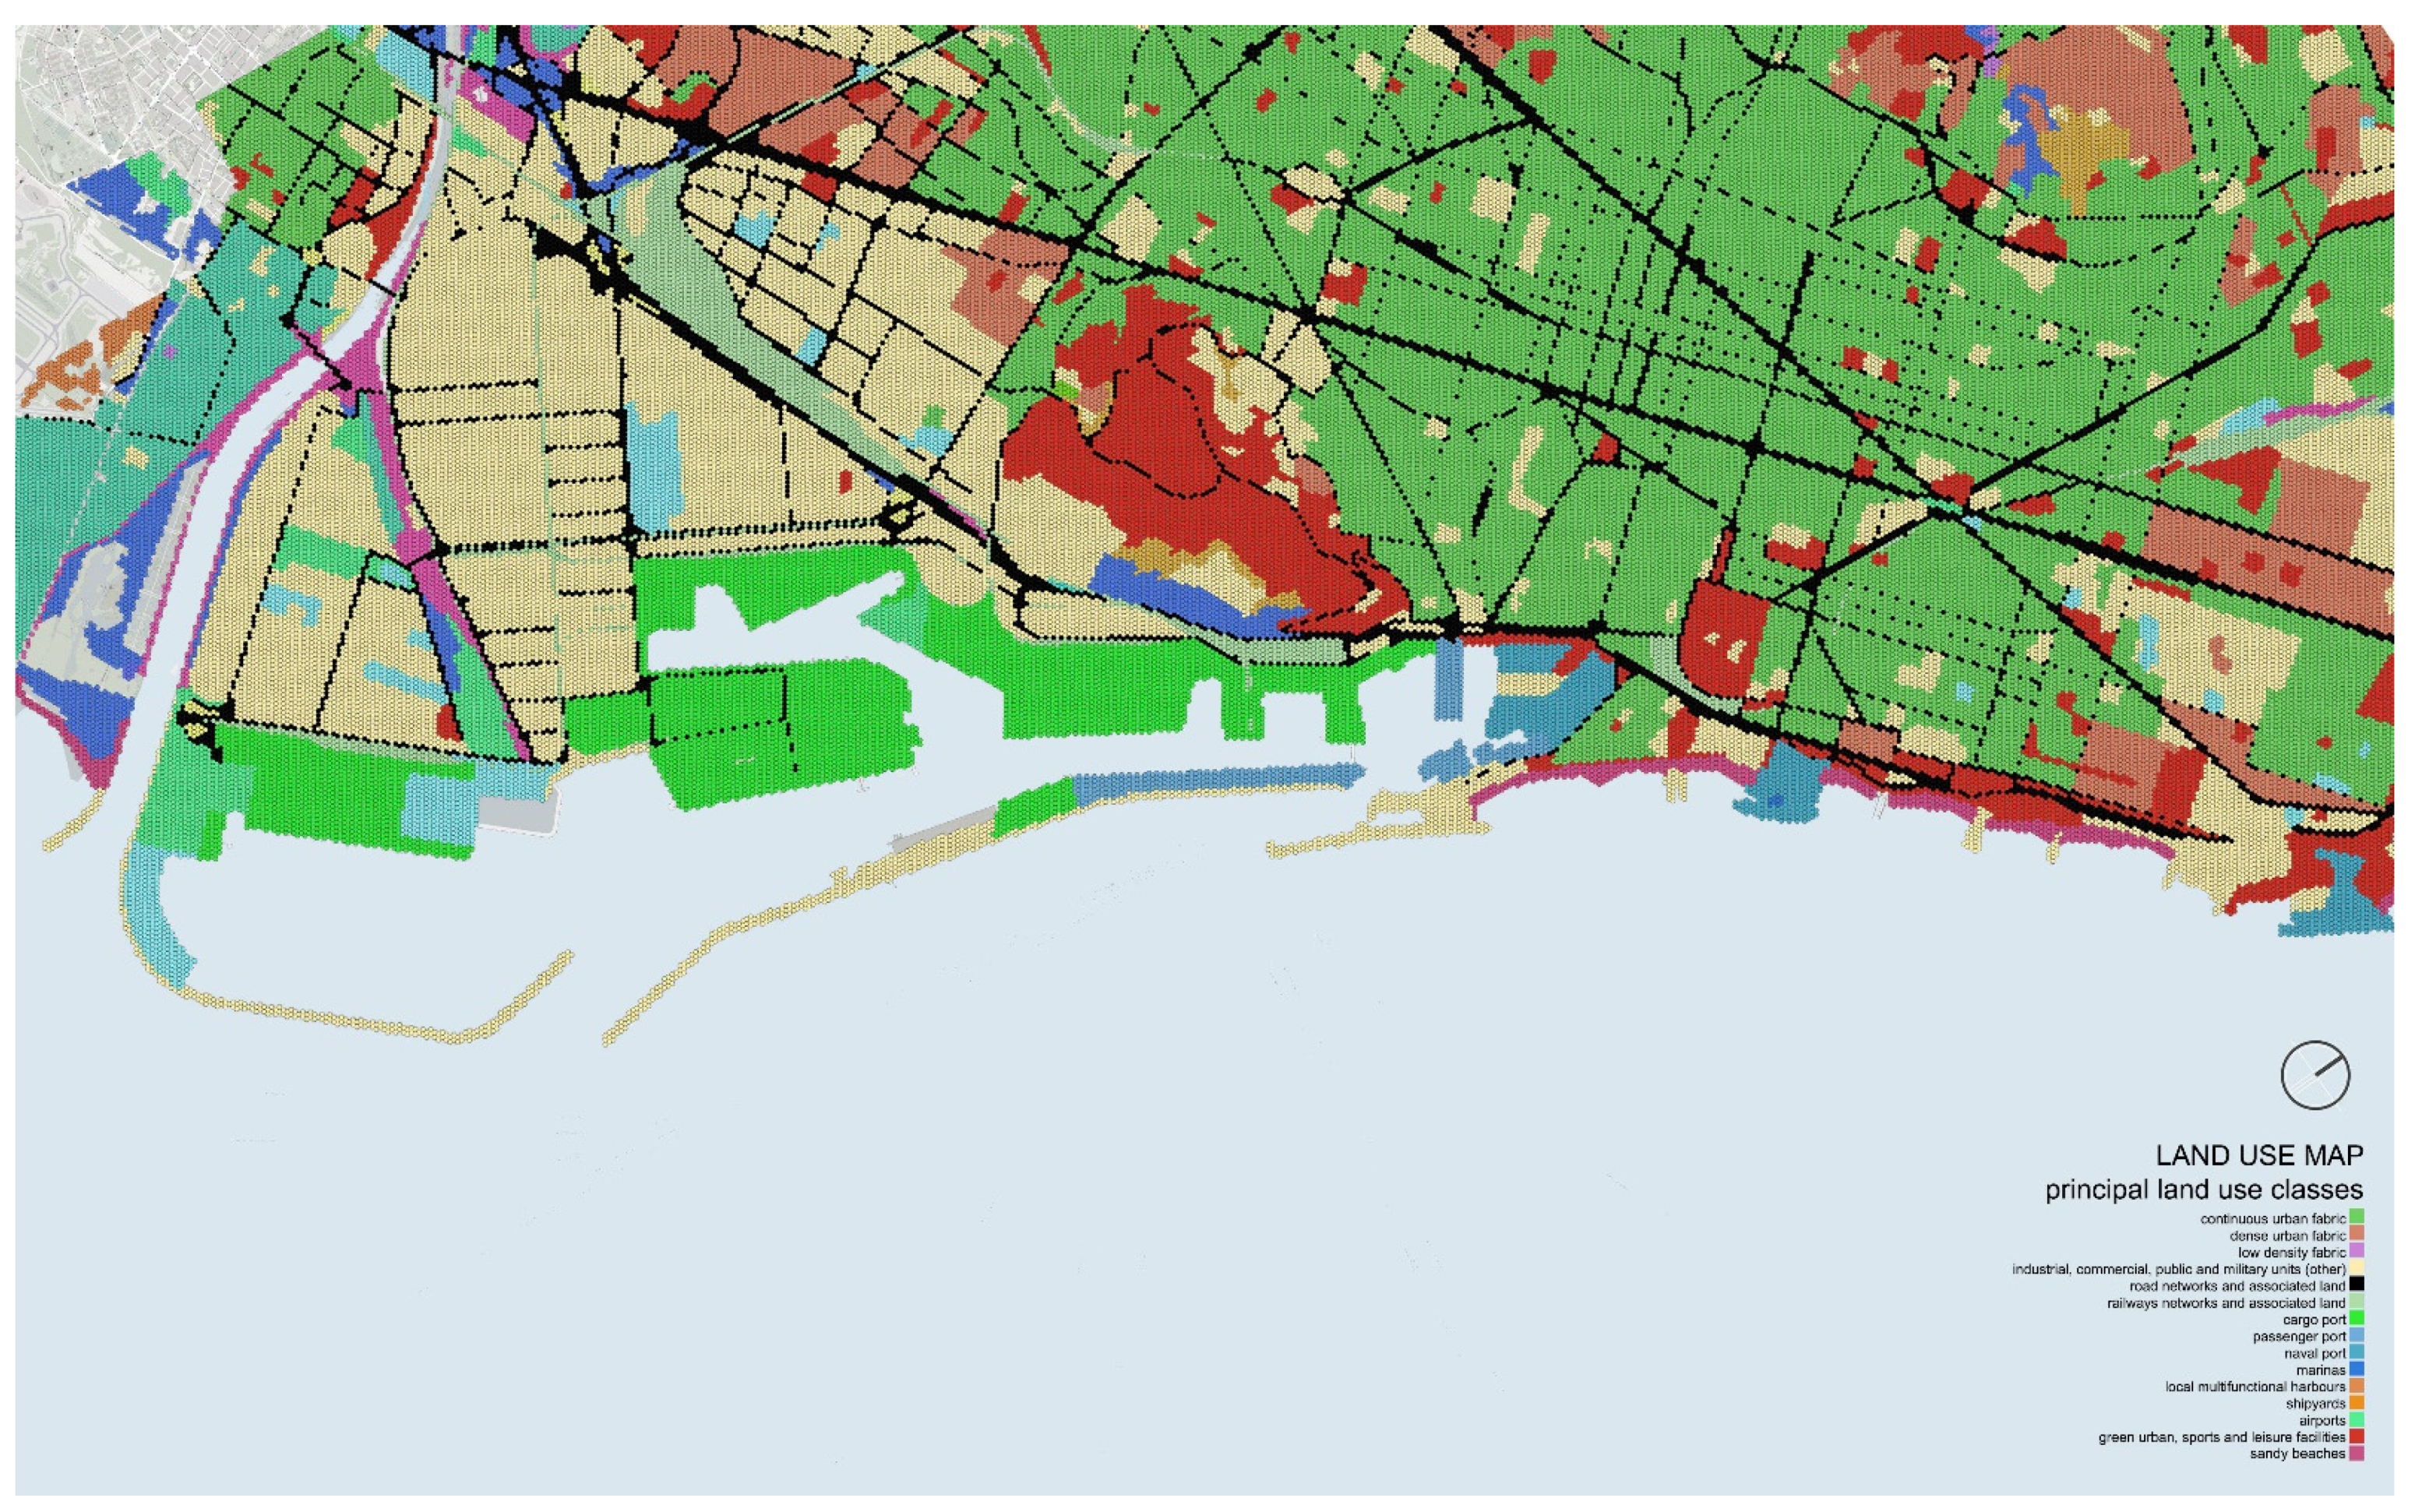
Exposure
Land use translated into exposed value through damage function
Copernicus Coastal zones 2018
[47]
The database provides a land cover/land use that identifies 71 classes over a continuous 10 km strip for European coastal zones. The scale varies between 1:5000 and 1:10,000. The minimum mapping width is 10 m.
Global depth-damage
functions
[48]
These functions allow the economic assessment of flood impacts on the built environment. Values are calculated by combining potential water depths with normalized damage indices, differentiated by six land use classes, and the related national €/m2 costs.
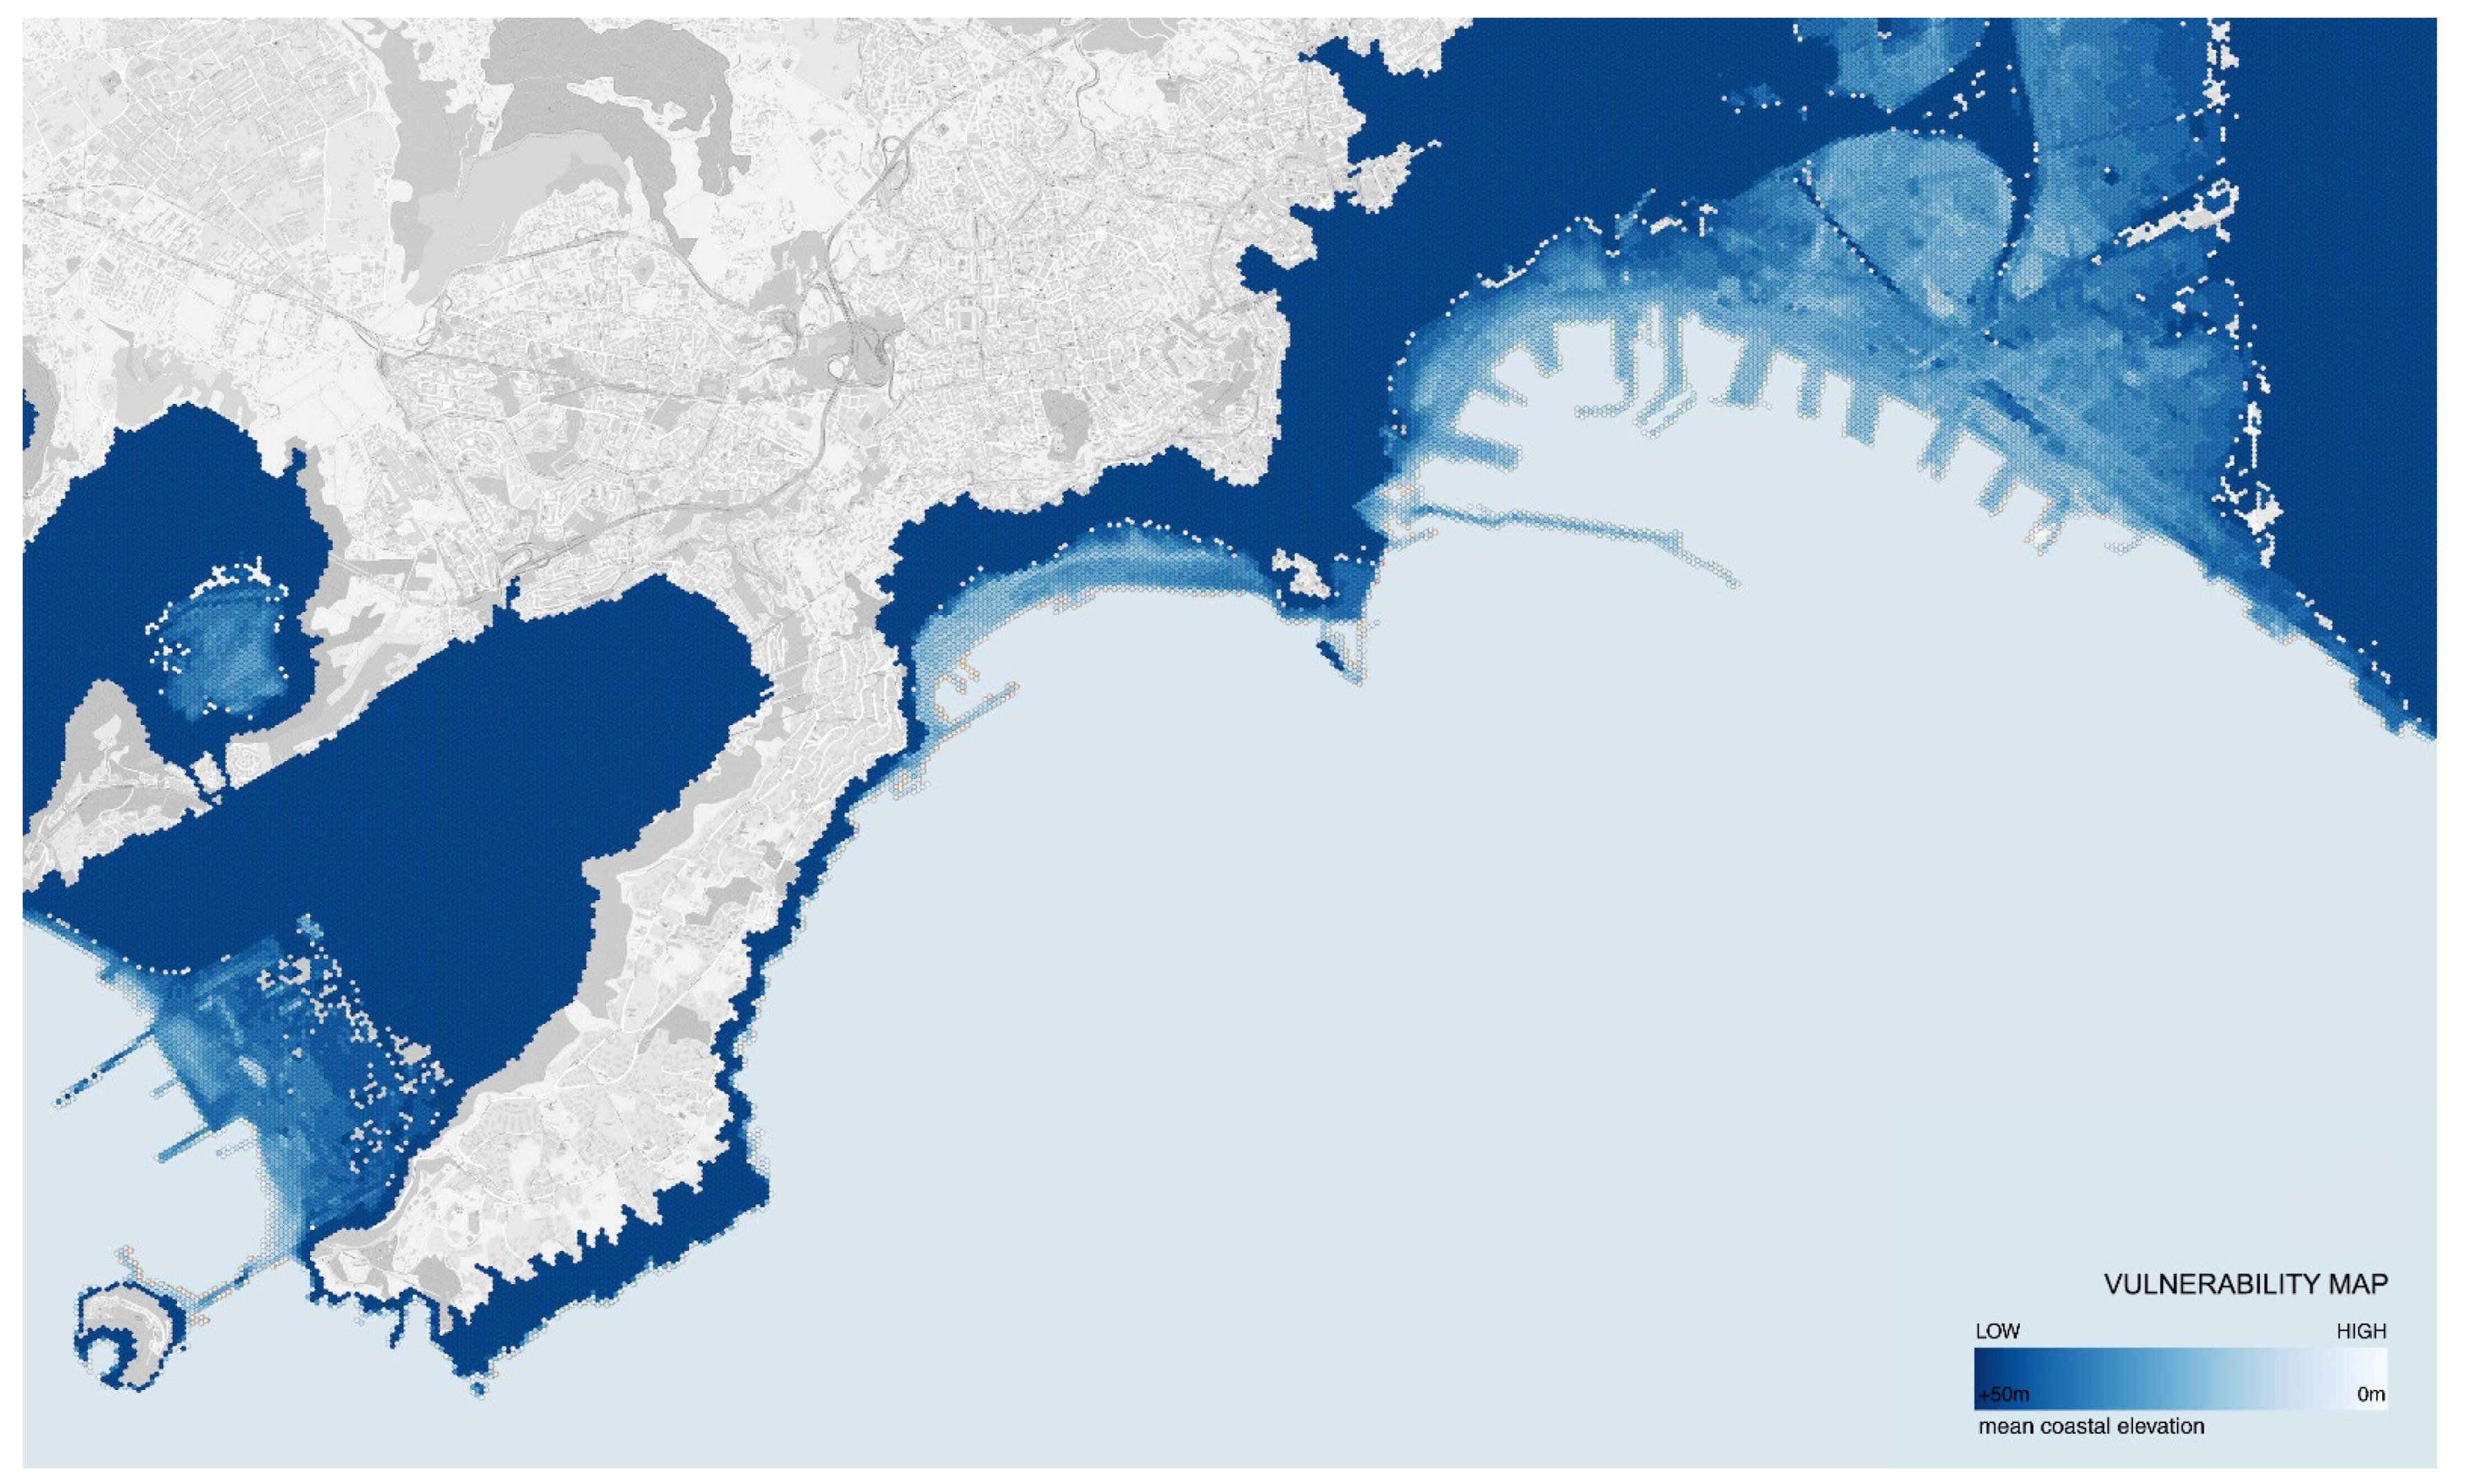
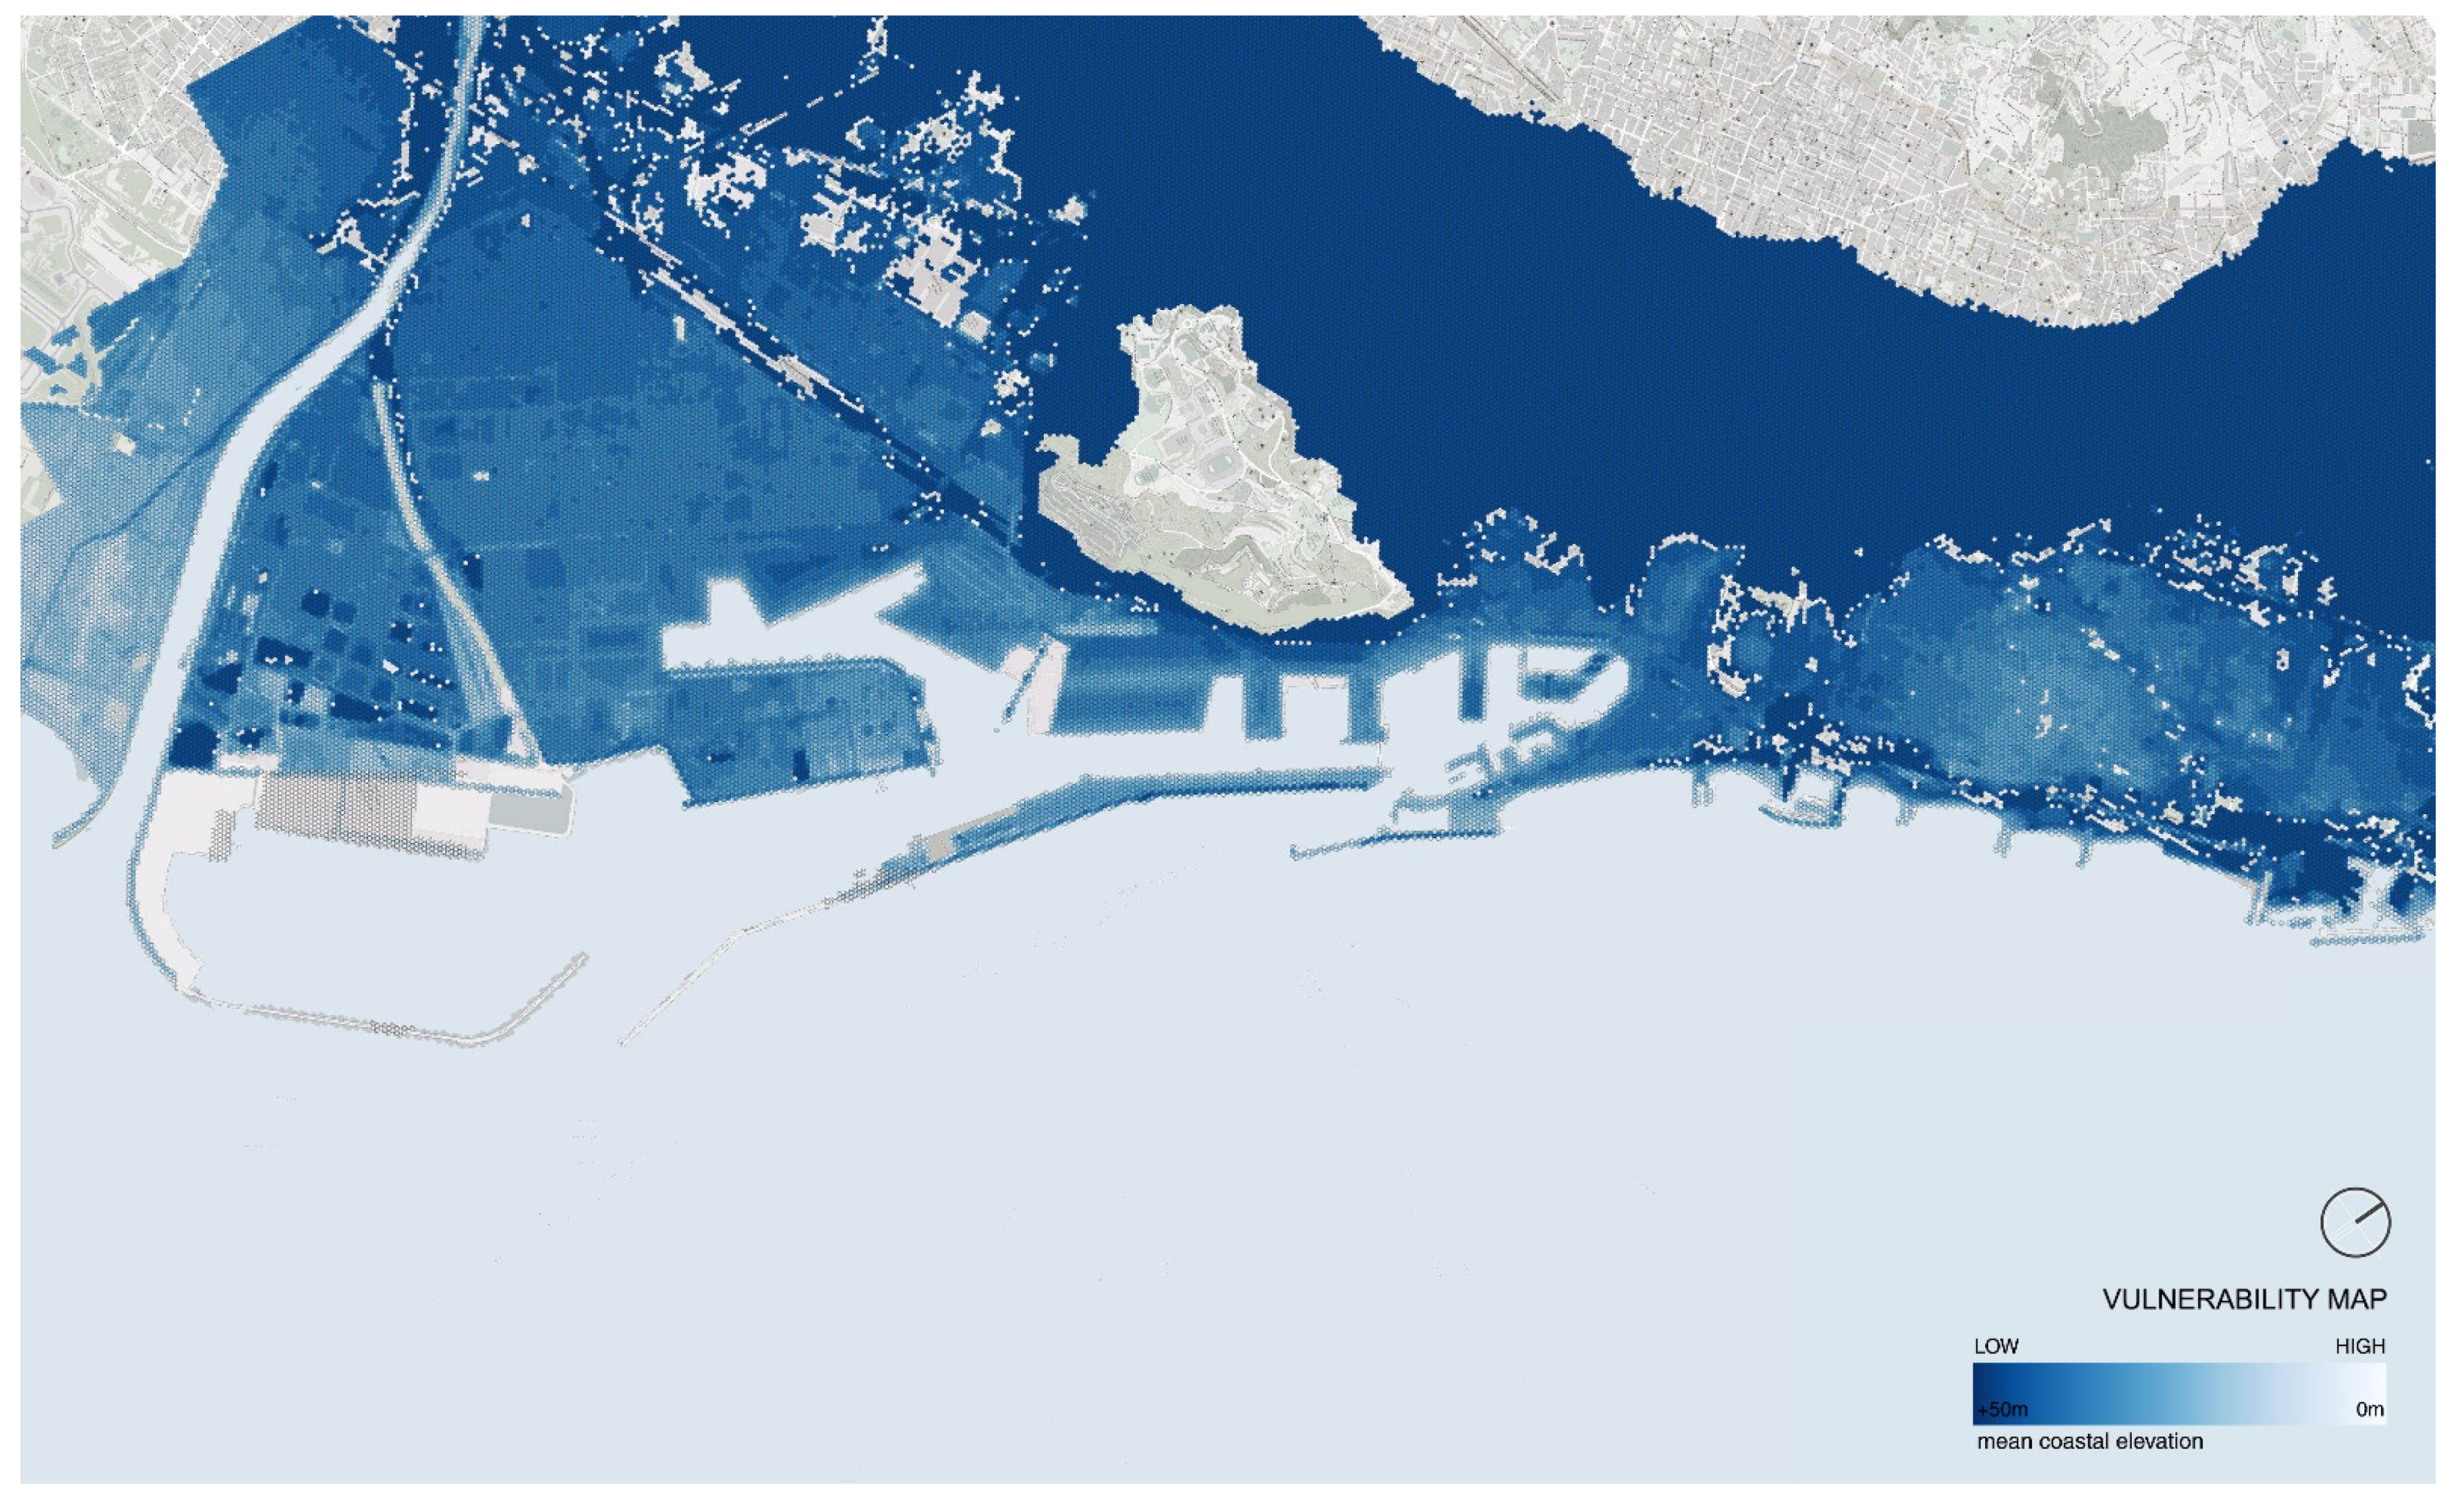
Vulnerability
Mean coastal elevation
Digital Terrain
Models (DTMs)
[68,69,70]
DTMs of Naples, Barcelona, and Marseille are available online and in open-source format on the national geoportals. The raster images are characterized by pixels 1 m × 1 m.
Hazard
ESL projections
Global Extreme Sea Level projections
[54]
The values of ESL are expressed in meters and vary according to RCP, RP, and %. Data are characterized by a municipal scale spatial resolution.
Table 2. Expected water depth by 2100 (rSLR and ESL) in Naples, Barcelona, and Marseille, according to climate projections of Vousdoukas et al. [54].
CityRCP ScenariorSLR (95%)ESL (100 RP–95%)
Naples4.50.76 m2.15 m
8.51.88 m3.22 m
Barcelona4.50.89 m1.90 m
8.51.89 m2.97 m
Marseille4.50.78 m2.04 m
8.51.86 m3.10 m
Table 3. Coast-RiskBySea result analysis for ESL events (RCP 8.5, 100 yr RP and 95%) on Naples, Italy. Source: [41].
Land Use Classes (Copernicus)% Impacted SurfaceDamages M €% Damages on Total Damage
11110Continuous urban fabric (IMD ≥ 80%)9%15 M€7%
11120Dense urban fabric (IMD ≥ 30–80%)3%5 M€2%
11130Low density fabric (IMD < 30%)1%0.06 M€0%
11210Industrial, commercial, public, and military units (other)29%80 M€36%
12100Road networks and associated land4%36 M€16%
12200Railways and associated land5%30 M€13%
12310Cargo port16%4 M€2%
12320Passenger port24%10 M€5%
12350Marinas6%33 M€15%
12370Shipyards1%3 M€1%
14000Green urban, sports, and leisure facilities2%7 M€3%
Table 4. Coast-RiskBySea result analysis for ESL events (RCP 8.5, 100 yr RP and 95%) on Barcelona (Spain).
Land Use Classes (Copernicus)% Impacted SurfaceDamages M €% Damages on Total Damage
11110Continuous urban fabric (IMD ≥ 80%)1%3.071%
11120Dense urban fabric (IMD ≥ 30–80%)
11130Low density fabric (IMD < 30%)
11210Industrial, commercial, public, and military units (other)30%224.4647%
12100Road networks and associated land5%72.7815%
12200Railways and associated land3%19.444%
12310Cargo port36%18.574%
12320Passenger port9%6.571%
12350Marinas13%108.4623%
12370Shipyards0%0.10%
14000Green urban, sports, and leisure facilities3%26.425%
Table 5. Coast-RiskBySea result analysis for ESL events (RCP 8.5, 100 yr RP and 95%) on Marseille (France).
Land Use Classes (Copernicus)% Impacted SurfaceDamages M €% Damages on Total Damage
11110Continuous urban fabric (IMD ≥ 80%)2%63%
11120Dense urban fabric (IMD ≥ 30–80%)1%0.080%
11210Industrial, commercial, public, and military units (other)6%2812%
12100Road networks and associated land4%4218%
12200Railways and associated land2%177%
12310Cargo port59%177%
12350Marinas9%5021%
14000Green urban, sports, and leisure facilities17%7532%
Table 6. Reliability assessment of the Coast-RiskBySea model on the Marseille case study based on Prahl et al. 2018 [53].
Water DepthPrahl et al. 2018 [55]Coast-RiskBySeaDifference in %
1.00 m49 M€39 M€20%
1.50 m75 M€70 M€6%
2.00 m102 M€97 M€5%
2.50 m133 M€177 M€33%
3.00 m172 M€240 M€37%
Table 7. Coast-RiskBySea summary of the results for Naples, Barcelona, and Marseille.
NaplesBarcelonaMarseille
2050ESL—RCP 4.5, 100 yr RP, 95%44 M€250 M€70 M€
ESL—RCP 8.5, 100 yr RP, 95%69 M€250 M€100 M€
2100ESL—RCP 4.5, 100 yr RP, 95%69 M€369 M€100 M€
ESL—RCP 8.5, 100 yr RP, 95%226 M€480 M€240 M€
Publisher’s Note: MDPI stays neutral with regard to jurisdictional claims in published maps and institutional affiliations.

