
Examining the Value Co-Creation Model in Motor Racing Events: Moderating Effect of Residents and Tourists


1
Kinesiology, School of Public Health, Indiana University-Bloomington, Bloomington, IN 47405, USA
2
Management, College of Business, Limestone University, Gaffney, SC 29340, USA
3
Sport Management, Wellness, and Physical Education, College of Education, University of West Georgia, Carrollton, GA 30118, USA
*
Author to whom correspondence should be addressed.
Sustainability 2022, 14(15), 9648; https://doi.org/10.3390/su14159648
Submission received: 8 July 2022
/
Revised: 29 July 2022
/
Accepted: 2 August 2022
/
Published: 5 August 2022
Abstract
:Value co-creation measurements in a recurring sporting event sprang from an academic and a practical desire to understand value co-creation. This study aims to (1) identify and explore the co-production and value-in-use, two dimensions of value co-creation measurement; (2) verify the validity of the measurements of the value co-creation model; and (3) examine whether noteworthy differences exist between residents and tourists in co-creation, respectively. For this purpose, this study conducted two studies. Study 1 establishes the value co-creation model and compares the reflective and formative models. Study 2 tests the proposed model’s validity and reliability and examines the moderating effect of travel patterns (residents and tourists). The results indicated that the value co-creation measurement is hierarchical and exhibits reliability and validity in the reflective model. The results further demonstrate that co-production and value-in-use patterns differ by residents or tourists. The current study uses S-D logic to better understand value co-creation’s hierarchical theoretical nature from the perspective of residents and tourists in the recurring sporting event context, thus contributing to sport management literature. Furthermore, this paper contributes to value co-creation studies, showing that various attendees (residents and tourists) perceive different levels of co-creation because resources may vary by social group.
1. Introduction
In a sporting event context, event organizers are willing to offer a platform that facilitates value co-creation among all stakeholders, including fans and other spectators. For example, in 2019, 53,000 participants joined the New York City Marathon, which created a webpage entitled “Get Inspired” to share the runners’ photos and stories and co-create value together with the runners. As presented in sport management studies, value co-creation theoretical mechanisms and dimensions have not been identified. To begin with, although value co-creation is a hierarchical order model and can be measured at two levels of abstraction: value-in-use and co-production [1]. Little research has systematically examined the precise nature of the dimensions of value co-creation and has rarely offered justification for their adoption of either a reflective or formative scale. This lack of research means that questions still abound as to what exactly constitutes the concept of value co-creation. Simply put, a reflective model is one in which the indicators of a construct are caused by the construct, the latent variable. In contrast, in a formative model, the indicators cause the latent variable. Furthermore, according to the social exchange theory, every aspect of social life can be investigated through the focal points of tangible and intangible rewards and as a resource exchange between actors [2]. However, few studies use the social exchange theory as a foundation for understanding value co-creation. The addition of the social exchange theory to the value co-creation framework, can assist scholars in examining the nomological validity of value co-creation in sport management studies. In addition, although the degree of resident value co-creation differs from the degree of value co-creation related to tourists who are present at the destination to attend the event [3], few researchers have examined the differences that exist in value co-creation based on attendee type (i.e., residents and sport tourists). Therefore, four research objectives are proposed in the current study, which offers an in-depth examination of value co-creation: (a) to establish the value co-creation model, (b) to compare the reflective and formative models, (c) to test the nomological network of the value co-creation scale with possible outcome variables, and (d) to examine whether noteworthy differences exist between residents and tourists in co-creation, respectively.
2. Theoretical Background and Hypothesis Development
2.1. Theoretical Dimensions of Value Co-Creation
According to the literature review for co-creation’s boundary by Galvagno and Dalli [4], the concept of co-creation refers to the collaboration process to produce a new value, and the literature body has grown in service management, innovation management, marketing, and consumer studies. Co-creation study not only belongs to management literature, but it can also be found in the education field (teachers–students), inter-organizational cooperation (companies–institutions), the role of children in the family [4], and tourism marketing (tourists–organizations and tourists–tourists) [5. Social media influencers (SMIs) also provide a popular marketing study context regarding the co-creation between brands and social media content creators [5]. The collaboration between brands and SMIs is conducted by exerting influencers’ knowledge regarding the brands and developing intimate relationships with consumers. Thus, the created content from SMIs refers to co-creation value with the brands, and recent studies indicated that SMI marketing is approximately seven times more effective than traditional marketing approaches [5]. This study extends and explores the co-creation concept in sport management studies.
A majority of studies view value co-creation as a reflective construct [6,7,8]. To begin with, it is within reason to expect that the total value co-creation, caused by each value co-creation subdimension, can be explained by the social exchange theory. According to the social exchange theory, the range of social behaviors individuals express during social interactions represent exchanges of material or non-material goods [2], as participants of these processes tend to possess positive expectations and perceive a status bump as a result of their role in the development process, which leads to a commitment on the part of these individuals to the endeavors in which they are involved [9].
Regarding the statistical evaluation of the formative model, two chief problems exist. First, estimating the parameters of a formative model within a structural equation without linking it to at least one other is impossible under the formative measurement approach. Moreover, if a critical degree of multicollinearity among the formative indicators is present, the estimates will be biased [10]. Consequently, value co-creation was treated as reflective measure in this research. More details will be explained in the following sections.
According to Ranjan and Read [1], the value co-creation concept has two chief dimensions: co-production and value-in-use. Inherent in co-production is customers being involved in the product and service design processes, either by sharing information or knowledge with firms or facilitating such a role. On the other hand, value-in-use goes beyond the co-production stage to the consumption stage, which involves the reception of a good or service; during this stage, customers use their usage experiences to gauge the value of a good or service [1,11].
2.2. Outcome of the Value Co-Creation: Gratitude, Revisit Intention, and Word of Mouth
Value co-creation and co-production involve the undertaking of value-creating activities by consumers functioning as either coworkers or providers, leading to the generation of products eventually consumed by these individuals and that come to constitute their consumption experiences [1]. Prior studies on personalization and experience note that guests who feel as if they receive personal or individualized treatment or feel recognized offer positive feedback. These individuals also revisit and spread positive word of mouth, providing personal recommendations to people they know [12,13]. Certain studies have posited that, from a spectator perspective, giving back in spectator–event organizer interactions come from gratitude, revisit intention, and word of mouth [8,14]. In other words, those spectators who experience high-value co-creation at events use these measures to return the “favor” or maintain their “rewarding transactions and relationships” with event organizers. This study examines the impacts of spectator value co-creation for the three outcomes: gratitude, revisit intention, and word of mouth.
2.3. Moderating Role of Travel Patterns Types in the Value Co-Creation
Residents are the persons who must reside in a single location. The resident spectator is defined as a spectator spectating the event—as an individual who travels from within 50 miles to watch a sporting event [3]. One effect of sport event value co-creation is elevating the destination’s infrastructure, resources, and public accommodations. Host cities frequently benefit from the advancement of public transportation, parks, and other infrastructure projects designed to facilitate greater destination attachment and imagery.
A tourist, by U.S. standards, travels round-trip for leisure or business, a distance exceeding 100 miles in a single day, or stays overnight in a place other than their chief residence [15]. Furthermore, a sport event tourist stays at least twenty-four hours (or one whole day) in the host location for the chief purpose of watching or participating in a sporting event, with the visited destination being a lesser consideration [16].
Residents’ place identity can be defined as the unique combination of attachment, commitment, knowledge, and meaning that residents associate with a particular place [17]. Importantly, a strong place identity is unlikely to be formed among tourists who visit a site only once and for a concise time. Moreover, per the social identity theory [18], individuals base their social groups on geographical proximity or value setting. A person’s home, then, constitutes a significant part of an individual’s “self,” helping him distinguish between the “we” (e.g., residents) versus “them” (e.g., tourists). Residents and tourists have different identities, so they are expected to behave differently regarding the place. Existing research sheds some light on the differences between local participants and sport tourists [19,20].
2.4. Hypothesis Development
2.4.1. Co-Production
Customer co-production is regarded as a facet of value co-creation. Customer co-production may occur before the usage stage during the production process so that co-production may be differentiated from value-in-use in the usage/consumption stage [18]. In the Sport Value Framework, sport scholars proposed that “Sport firms create value propositions mainly in the configuration of a value network” and emphasized that value can be created in the production process through interaction between various actors [21] (p. 26). Spectators can also customize and co-produce jerseys, allowing them to create value through personalization (i.e., the name, number, and color on the jersey). The above analysis leads to the following hypothesis:
Hypothesis 1:
Sport spectators’ co-creation will positively impact the overall co-production evaluation.
According to Ranjan and Read [1], there are three critical facets of co-production: knowledge, equity, and interaction. Resource integration involves evaluating and applying human knowledge and can be directed to operant and operand resources [22]. Generally, sport market participants can create value by leveraging the applied knowledge and skills of others. Event organizers open social media accounts to facilitate a conversational process. They communicate with sport spectators, event sponsors, and the public to exchange information, make their knowledge and other operant resources available, and generate new knowledge or operant resources [23]. This co-production process inspires a process of situating knowledge and practices when knowledge is produced not only by one actor but also by a network of players committed to co-creating value [22]. The co-production dialogue and collaboration that consumers participate in can be regarded as the performance of the various activities (e.g., initiating, designing, resource aggregating) in one or more production stage that leads to the creation of outputs that serve as platforms for the delivery of knowledge that is later used/consumed [24].
Hypothesis 1a:
Sport spectators’ overall assessment of the co-production will positively impact the co-production of knowledge.
In sport management studies, equity is fair distribution and justice. Manuscripts focused on sport studies were divided into gender and diversity categories [25]. According to S-D logic, in this study, equity refers to a person’s willingness to relinquish a share of control to give power to consumers and increase their desire to take part in co-creation activities [26,27]. With that said, in a sporting event context, equity is associated with the willingness of the event organizer or other event service providers to impose restrictions on the desires of the sport spectators in the co-creation activities. In the sporting event context, sport spectators can take on a portion of the role of a sports marketer and event organizers to co-produce value.
Hypothesis 1b:
Sport spectators’ overall assessment of the co-production will positively impact the co-production of equity.
Person-to-person interaction offers services as well as reciprocal benefits [28]. This interaction facilitates entrance to the value-creating process of other actors by actors, wherein they can support and benefit from such processes [29]. The two parties play differing roles in the interaction, with the customer serving as a co-producer (co-designer, co-developer) of the firm’s production process in such a way that he becomes a resource in that process [30]. For example, the circuit is usually situated on a 1000-acre site at a recurring sport event such as a Formula One event. Co-production, that is, when event organizers and spectators have an encounter to exchange value, it is possible to interact with the event organizer to ask for an upgrade to VIP valet parking to accommodate families with kids. If there is no encounter to include the role of both event organizers or the spectators, interaction will fail between the spectator and the event organizers. Thus, the co-production process makes the interaction potentially accessible to the customer [30].
Hypothesis 1c:
Sport spectators’ overall assessment of the co-production will positively impact the co-production of interaction.
2.4.2. Value-in-Use
Customers assess and determine a proposition’s value based on their usage’s specificity, so value is co-created in use [1,28]. In sport management, because value generates from the actual use of the value network and the value propositions of actors, “co-created value is always value-in-use” [21] (p. 18). All the components of a sporting event, such as sport fans, teams, athletes, event staff, physical environment, weather, and rivalry, impact spectators’ assessments of the sporting event experience through the resource integration approach [31]. The above analysis leads to the following hypothesis.
Hypothesis 2:
Sport spectators’ overall assessment of the value co-creation will positively affect the value co-creation of value-in-use.
Value-in-use determines by three sub-dimensions: experience, personalization, and relationships. First, experience is a memorable and emotional interaction characterized by empathy and containing intrinsic value [32]. Experience results from products and services provided by firms and from customers linking their experiences across their affective, cognitive, and physical dimensions [1]. For the customer, the integration of resources leads to only potential value [29]. Value actualization occurs through use, and they experience actual value [28]. Sport provides customers with a unique ideological and socio-cultural interface to experience action, consumption, and meaning [33]. Value-in-use generates experience because it offers a sense of self-transformation; in the sport context, a sporting event with value is a source of sensing displacement, creating play space, and event spectating space.
Hypothesis 2a:
Sport spectators’ overall assessment of the value-in-use will positively affect the value-in-use of experience.
Personalization is a feeling gained from personalized services or customized services offered by firms [26]. Practically, it refers to the individualization of the use process, whether real or perceived, with the value being gauged based on the unique characteristics of the process [34]. In the sport context, given the experiential, time-independent, and fandom-driven (cultural, symbolic) nature of sports, personalization can occur when fans personalize their consumption styles [35]. This phenomenon was highlighted by Wimbledon 2016, which created official apps that allowed fans to completely personalize their experiences. As part of this personalization process, fans were welcomed by name, and given access to personalized content and messaging.
Hypothesis 2b:
Sport spectators’ overall assessment of the value-in-use will positively affect the value-in-use of personalization.
In an environment of active communication or engagement, the relationship between customer and object is formed by collaborative, iterative, and reciprocal processes [1]. At active sporting events, sport spectators and event organizers enter a relationship built on collaborative, reciprocal, and repetitive processes. Regarding team sporting events, sport spectators and organizations are part of transformational relationships that result from group social networks based on communication, which enable co-creation and eventual collaboration between spectators and organizations [35]. Spectator value-in-use better captures the relationship between those who attend sporting events and those who use events as a vehicle for business and leisure activities [35].
Hypothesis 2c:
Sport spectators’ overall assessment of the value-in-use will positively affect the value-in-use of the relationship.
Building on the theoretical wholeness of the synthesis of value co-creation, co-production, and value-in-use are the two fundamental conceptual characteristics of value co-creation. The equity, interaction, and knowledge of co-production and the experience, personalization, and relationship of value-in-use help shed light on the mechanisms involved in how spectators evaluate value co-creation. Therefore, the conceptual nature of value co-creation through the analysis of a two-factor model in which knowledge, equity, and interaction are set to contribute to co-production and experience, personalization, and relationship is set to contribute to value-in-use (Figure 1).
2.4.3. Gratitude, Revisit Intention, and Word-of-Mouth
Gratitude results from perceptions that an individual has benefited from the actions of another [36]. Palmatier and his colleagues defined gratitude as a broad tendency to acknowledge and respond with grateful emotion to the sporting event when individuals perceive the obtainment of benefits and positive experiences. Based on the social exchange theory, the present research uses the affect theory of social exchange [37] to demonstrate how value co-creation helps facilitate spectators’ gratitude toward the event. According to the affect theory of social exchange, the degree and intensity of an emotional response directly correspond with the number of benefits all parties of a joint social exchange receive. This indicates that receiving relationship investments from retailers may facilitate customer perception of the value they co-created during a successful social transaction. Accordingly, this serves as the basis for customer gratitude.
Hypothesis 3:
Spectator value co-creation will positively affect spectator gratitude toward the event.
Various studies [8,38,39] have shown value co-creation to be both a driver and a mediator of behavioral intentions. In sport management literature, revisit intention refers to the spectators revisiting the events in the future [40]. Relevant literature shows that word of mouth is frequently the reason consumers’ relatives and friends attend events [41]. Additionally, spreading good word of mouth to promote events, venues, products, etc., can be done with high levels of utility to attract consumers [41]. Based on the reciprocity of the social exchange theory, promoting events with a high level of utility could be seen through customers’ revisit intentions and positive word of mouth. As there are an increasing number of co-production processes from the standpoint of value co-creation, it becomes essential to assess the predictive impact of spectator value co-creation on both revisit intentions and word of mouth. Given this, the study proposed the following hypotheses.
Hypothesis 4:
Spectator value co-creation will positively affect spectator revisit intentions in the context of the event.
Hypothesis 5:
Spectator value co-creation will positively affect spectator word of mouth in the context of the event.
As such, the study assessed the predictive relevance of value co-creation by linking it with spectators’ gratitude, revisit intentions, and word of mouth (see Figure 1).
2.4.4. Moderating Roles of Residents and Tourists
The current study examines sport tourists and local participants to gauge whether attendee type (i.e., local and sport tourist) at a recurring sporting event impacts value co-creation and whether local participants and sport tourists perceive co-production and value-in-use differently.
Extant literature in the field of sport management explains the differences between residents and tourists through a focus on athletics identity rather than place identity [20]. Some studies have noted a tendency of sport tourists to attach more to the sporting event experience than they do to the destination [19,42]. Furthermore, given the diversity of motivations, social groups, and production and consumption processes, related research on value co-creation has noted that the degree to which value co-creation occurs may depend on customer type [43]. Sport events enable both sport tourists and residents to interact, participate in business and leisure activities, and co-create value as a result [44]. This study diverges from prior research that focuses on place identity by considering place identity as a psychological factor that influences the behavior and value co-creation processes of both residents and tourists. A majority of studies have explored the co-creation process in light of individual attitudes toward value co-creation, including information seeking, innovation, interaction, experience, equity, knowledge sharing, personalization, relationship, and responsibilities [1,7]. Resident and tourist participation must be “dynamic and active”, however, if the benefits of decentralization, feelings of responsibility and identity toward a place, and practical involvement are to be allowed.
Hypothesis 6:
The impact of co-production on knowledge is significantly different between residents and sport tourists.
Hypothesis 7:
The impact of co-production on equity is significantly different between residents and sport tourists.
Hypothesis 8:
The impact of co-production on interaction is significantly different between residents and sport tourists.
Hypothesis 9:
The impact of the value-in-use on experience is significantly different between residents and sport tourists.
Hypothesis 10:
The impact of the value-in-use on personalization is significantly different between residents and sport tourists.
Hypothesis 11:
The impact of the value-in-use on relationship subdimensions of value co-creation is significantly different between residents and sport tourists.
The degree of place identity is heavily associated with stakeholder gratitude. Importantly, gratitude offers a psychological, social, and religious context for this positive emotion [45]. When experiencing gratitude, an individual’s relationship with others facilitates a self-awareness that constitutes their being. Therefore, practices of gratitude are part of an individual’s identity [46]. For instance, residents feel grateful both toward the event and the community because they regard the efforts put into the event to be part of a unique spatial, social setting, which is their place identity.
Hypothesis 12:
The relationship between value co-creation and gratitude is significantly different between residents and sport tourists.
Additionally, it is not only regarding gratitude toward the event where spectators differ, as they differ primarily in terms of their behavior. According to Chang et al. [14], the loyalty process between residents and tourists is dissimilar when the social exchange theory is applied. Satisfaction, for instance, significantly impacted the behavioral intentions of residents. Findings further note that residents who are highly involved in the event will more likely attend the next event of its kind. However, though tourists were slightly more satisfied with the event than were residents, this group did not express a high level of intention to return. Because tourists experience low identity with the destination, even if they are satisfied with the short-term onsite experience, the temporary and present-focused state of their emotions and perceptions means that they may not become repeat tourists or spread positive word of mouth about the event [14]. Value co-creation can also impact feelings of obligation as manifested by certain behaviors [17].
Hypothesis 13:
The relationship between value co-creation and revisit intentions is significantly different between residents and sport tourists.
Hypothesis 14:
The relationship between value co-creation and word of mouth is significantly different between residents and sport tourists.
Two studies were conducted, occurring in two recurring sport events. Study 1 established the value co-creation model and compared the reflective and formative models. Study 2 tested the proposed model’s validity and reliability and examined the moderating effect of travel patterns.
3. Methods: Study 1
We conducted Study 1 to investigate the content validity, convergent validity, and discriminant validity of the value co-creation measures in the recurring sporting event context. Based on Viechtbauer et al. [47]’s formula for the sample size calculation in pilot studies, in a group of 58.4 participants, there is a 0.05 probability of encountering unanticipated reasons for exclusion for a given participant within a 95% confidence interval. Therefore, the design of Study 1 involved 60 spectators who attended the Indianapolis 500 to identify preliminary items and validate the latent structure in a reflective model. Comparisons were also made between the higher-order reflective model and the formative model to ensure both the reflective value co-creation model’s reliability and validity.
3.1. Participants and Data Collection
Because the Indianapolis 500 was canceled in 2020, the respondents of this study were residents and sport tourists who attended the Indianapolis 500 in 2017, 2018, or 2019. As a recall survey, wherein respondents recall the event hosted previously, it is worth noting that it has also been recognized that the longer the recall period, the less accurate the reported estimates [48]. In consumer consumption studies, a respondent’s cognitive feedback is believed to consist of the twelve-month recall period and the extensive range of question types being asked [49]. However, the recall period also depends on the event frequency [49]. More salient events call for a longer recall period, whereas more frequent events call for a shorter period [48]. Considering that the Indianapolis 500 is an annual event hosted in Indianapolis once a year, respondents within a three-year recall period were considered good candidates to provide accurate evaluations.
Researchers recruited survey participants via the Amazon Mechanical Turk (M Turk) service. The online survey is used because it still accesses a significant portion of culturally and demographically diverse participants. This allows for a more plausible generalization of the population at large [50]. Therefore, the study was designed on Qualtrics.com (accessed on 6 May 2020) and was shared on Amazon MTurk to select participants based on age, language, region, etc., to compensate for participants completing the questionnaire. The study asked two qualifying questions to ensure the participants were (a) currently residing in the United States and (b) spectators who had attended the Indianapolis 500 within the last three years. Sixty responses were collected through this online survey. As a result of incomplete information, four responses from the Study 1 survey were thrown out; as such, 56 respondents who had attended the Indianapolis 500 within the last three years were recruited by using the online survey on MTurk.
Among the 56 respondents with valid surveys, 60.7% of the attendees were residents, and 39.3% were sport tourists. With regard to gender, 67.9% of participants were male, and the rest, 32.1%, were female. The median age of the participants was 34 years. The primary respondents (55.4%) were 20–29 years old. Regarding education, 58.9% held Bachelor’s degrees, and 30.4% held graduate degrees. Primary participants had attended the Indianapolis 500 three times (30.4%), followed by two times (26.8%), and then once (19.6%). Furthermore, this demographic information was compared to the standard attendance profile of the Indianapolis 500 from 2018 to show the representation of the samples. According to the Indianapolis 500 attendance profile from Sport Marketing Analytics, 67.5% of participants were male, and 32.5% were female; the median age was 36 in 2018 [51]. Therefore, there was an adequate match between the Indy Car Attendance Profile and sample demographics regarding age and gender.
3.2. Instruments
Based on two dimensions, co-production (12 items) and value-in-use (11 items), co-production was conceptualized as the direct or indirect coworking among the event organizer and the spectators using three subdimensions—knowledge (4 items), equity (4 items), and interaction (4 items)—adopting the items from Ranjan and Read [1]. Furthermore, value-in-use was defined as the spectator’s experiential evaluation of the event beyond its functional value by using three more subdimensions also adopted from Ranjan and Read: experience (3 items), personalization (4 items), and relationship (4 items). Although these items were formulated in the retail context, they focus on service marketing, wherein customers often extend external resources to be integrated to produce services (Ranjan & Read). Like Ranjan and Read, the current study draws from the fundamental tenants of S-D logic, but the unique characteristics of recurring sport events are considered. In the recurring sport event context, sporting events are considered services where sport spectators can produce services together with the event organizers and perceive value-in-use. These 23 items complete the multidimensional conceptual nature of value co-creation and generate a measurement instrument that draws from S-D logic; the knowledge, equity, and interaction in co-production and the experience, personalization, and relationship in value-in-use can explain the mechanisms of how they underpin value co-creation. Therefore, all 23 items were adopted from Ranjan and Read. Following that, changes were made to fit the recurring sporting event context because items were originally developed for the retail context. For example, the item “The party was open to my ideas and suggestions about its existing products or towards developing a new product” in Ranjan and Read’s study was changed to “The event was open to spectators’ ideas and suggestions about its existing services or towards developing a new event service” to fit the recurring sporting event context. The psychometric literature suggests that in certain situations, more than seven categories are ideal when considering the effects of the number of scale points on the reliability of rating scales, whereas fewer than seven categories may be acceptable in other circumstances [52]. The 7-point seems to balance discrimination points well without too many options. Items were measured on a 7-point Likert scale (1 = strongly disagree; 7 = strongly agree), with the means of the measures being used for the variables. The beginning of the questionnaire asked respondents to fill out demographic information (e.g., gender, age, race, education, marital status). Also, the respondents were approached and informed about travel patterns, and they were asked questions about whether the circuit was more than 50 miles from their home and asked to state the travel pattern. Additionally, the wording of one of the ten questions was reversed to ensure that respondents provided serious answers to the survey items. The reversed items were used to receive more careful (and accurate) responses because the reverse-coded items would stimulate respondents to a higher degree of cognitive processing, which results in more thoughtful and accurate responses [53].
To determine the nomological validity of value co-creation, the current study used established value-related outcome variables: gratitude [8], revisit intentions [54], and word of mouth [55]. Researchers used three items [8] to posit gratitude as feelings of appreciation, gratefulness, and thankfulness. Four items from Kim and Byon [54] were used to assess revisit intentions, which measured the likeliness to revisit events in the future. Three measures adopted by Kim et al. [55] were used to measure word of mouth, which refers to friend, family, or acquaintance referrals to visit the event. All items were evaluated on a 7-point rating scale (1 = “strongly disagree”; 7 = “strongly agree”).
3.3. Data Analysis
PLS-SEM was conducted in this study by using SmartPLS Version 3 software, which was developed and managed by the SmartPLS GmbH company at Oststeinbek in Germany. The current study uses PLS-SEM instead of covariance-based SEM. This is because PLS-SEM can be used to test substantive models and measurements for data analysis, as in this study, and assess the causal relationships between value co-creation and its subdimensions in the conceptualized research model. The covariance-based SEM technique is used mainly for hypothesis testing, wherein theories are confirmed or rejected [56]. Of chief importance is that the model of the cause-and-effect relationship must be accurately specified [56]. The proposed model derives value co-creation development from several sporting event context theories. This means that PLS-SEM is required to evaluate the causal relationship between constructs in the proposed model [56]. Furthermore, PLS-SEM is regarded as a better technique than covariance-based SEM, given that only 56 respondents participated in Study 1. Although the sample size is under 100, PLS-SEM has an inherent advantage in that it is robust and exhibits relatively higher statistical power in small samples than the covariance-based SEM [57].
The extent to which a construct relates to another construct in a theoretical network is known as nomological validity [56]. For this research, researchers assessed predictions of the value co-creation on consequences to evaluate the nomological validity [56], with gratitude, revisit intentions, and word of mouth is the consequences of value co-creation in this study and positive relationships being expected.
During cross-validation, the PLS model is developed for all but one case and subsequently tested on that particular case. This type of leave-one-out cross-validation is effective at evaluating small and medium datasets, though split sample and reserved test set methods necessitate the use of large samples. R2 is the cross-validation coefficient, which refers to the percentage of the variance in the dependent variate that can be explained by the predictions from the leave-one-out process [58]. Three judgment levels are associated with the R2 value: high (0.26 or higher), medium (0.13–0.26), and low (0.02–0.13). Models with significant cross-validation may be optimal, as they are the most parsimonious [58].
4. Results: Study 1
4.1. Descriptive Statistics
An assessment of the normality of data is a prerequisite for SEM. Skewness and kurtosis were assessed to test the normality of the data. Skewness is the absence of symmetry in the normal distribution. Kurtosis measures how peaked distribution is [56]. The initial kurtosis value is also known as kurtosis (proper). SPSS provides “excess” kurtosis, often known as kurtosis (excess), which is calculated by subtracting 3 from the kurtosis (proper) [59]. This study uses skewness and kurtosis (excess) to assess the normal distribution. The current study of skewness and kurtosis (excess) ranged from −1.59 to −0.07 and from −0.31 to 2.98, respectively, for each item; both fell well within Chou and Bentler’s [60] criteria (skewness < 5; kurtosis < 5). Nevertheless, with small-to-moderate sample sizes (i.e., n < 100), this approach is less accurate because it cannot alter the standard error. The standard error reduces as the sample size grows. To address this issue, a Z-test with skewness and kurtosis is used for normality testing. A Z score might be produced by dividing the skewness values or excess kurtosis value by their standard errors. For medium-sized samples (50 ≤ n < 300), at an absolute z-value of 3.29, infer that the sample distribution is normal [61]. The results show the skewness z-value ranged from −4.42 to −0.19, and the kurtosis Z-value ranged from −0.46 to 4.46. Although one of the items, “The benefits, value, or fun derived from the event depended on the other spectators,” in the personality subdimension was identified as the non-normality, other skewness and kurtosis Z-values are within the ±3.29, suggesting that there was no significant evidence of non-normality.
In addition, univariate outliers and multivariate outliers with no major violations were noted. Also, the mean values of knowledge, equity, interaction, experience, personalization, and relationship ranged from 5.77 to 6.05, which indicated positive spectator perceptions toward these variables with the liberal threshold of 0.50 [62,63].
4.2. Reflective Measurement Model
The reflective model results revealed that all factor loadings are significant by using t-statistics, with most loadings higher than the recommended 0.5 (from 0.41 to 0.91). Except for the fourth item in personalization, “The event provided an overall good personal experience, going beyond monetary value” (factor loading = 0.41), other factor loadings were above the cut-off value of 0.50. However, this item was kept in the current study for further analysis for two reasons. First of all, this item is fairly representative of the personalization construct in S-D logic. The first half of this item, “The event provided an overall good personal experience,” is consistent with the definition of personalization as a feeling obtained from personalized or customized services provided by firms [26]. Also, the notion of “going beyond monetary value” shows that this item measures service value, which is different from good-dominant logic that focuses on monetary value. Therefore, the item was retained to preserve content validity. The higher-order results also revealed that all factor loadings are significant, with item-to-total correlations of each construct being higher than the recommended 0.5 (from 0.61 to 0.78). The AVE values, ranging from 0.50 to 0.61, were above the acceptable threshold of 0.50 [58]. Although the AVE values were not above the stringent criterion of 0.70 for a very good convergent validity [58], the convergent validity was confirmed in the reflective model.
As Table 1 shows, Cronbach’s α (from 0.75 to 0.89) and composite reliability (from 0.76 to 0.90) were above the recommended value of 0.70 [47], showing satisfactory reliability of the scale in the reflective model.
Correlations between constructs, the Fornell–Larcker criterion [64], and the HTMT [65] were used to evaluate the discriminant validity. However, not all the square roots of each construct’s AVE (diagonal values) were larger than their corresponding correlation coefficients (Table 1). Following the Fornell–Larcker criterion, some HTMT values were higher than the suggested 0.90, ranging from 0.42 to 1.10 (Table 2). In particular, the second-order and third-order factors have larger correlations of indicators with other constructs’ indicators than the correlations of indicators within the same construct. Thus, discriminant validity was not fully supported. It is worth noting that in a general model such as value co-creation, some high correlations among the latent constructs included in the model are to be expected.
Table 3 displays the impacts of value co-creation on gratitude (β = 0.63, p < 0.01), revisit intentions (β = 0.45, p < 0.01), and word-of-mouth (β = 0.70, p < 0.01) are all significant, establishing the nomological validity. Value co-creation reflective construct predicted 39.2% of the variance in gratitude (R2 = 0.392), 20.0% of the variance in revisit intentions (R2 = 0.200), and 49.5% of the variance in word-of-mouth (R2 = 0.495).
To examine whether the lower-order constructs form the intended higher-order constructs, a third-order reflective factor analysis was performed for value co-creation to test the hypothesis of the theoretical existence of a reflective–reflective higher-order factor that aggregates the six first-order factors and two second-order factors of the main construct. The model consists of six first-order factors measured by 23 indicators, two second-order factors accounting for the first-order factors’ correlations, and one third-order factor accounting for the second-order factors’ correlations. The weights from co-production to knowledge (γ = 0.88, t = 26.42, p < 0.01), equity (γ = 0.95, t = 60.95, p < 0.01) and interaction (γ = 0.92, t = 39.95), and from co-creation value to co-production (γ = 0.97, t = 71.96, p < 0.01) were significant and positive. Thus, hypotheses H1a, H1b, and H1c were supported. In addition, the influence of value-in-use on the experience (γ = 0.90, t = 33.68, p < 0.01), personalization (γ = 0.90, t = 28.03, p < 0.01) and interaction (γ = 0.87, t = 12.65, p < 0.01) were significant and positive. Thus, hypotheses H2a, H2b, and H2c were supported. The weights of the first-order constructs on the second-order constructs are shown in Table 4, suggesting that co-production is a second-order factor with three substantial first-order dimensions, including knowledge, equity, and interaction and that value-in-use is a second-order factor with three significant first-order dimensions, including experience, personalization, and relationship. The results of the weights of the second-order constructs on the designated third-order constructs indicated that the influence of value co-creation on co-production (β = 0.97, t = 71.96, p < 0.01) and value-in-use (β = 0.94, t = 67.06, p < 0.01) were significant and positive. Therefore, hypotheses H1 and H2 were supported. Additionally, results reflected the weights of the second-order constructs on the designated third-order construct, indicating that the value co-creation is a third-order factor with two second-order dimensions, including co-production and value-in-use.
4.3. Formative Measurement Model
Significance test results of the formative model showed statistical significance for the outer weights of all formative indicators, ranging from 0.24 to 0.53, satisfying the formative model’s convergent validity criteria. Moreover, as all VIF values are below 5, multicollinearity is not a significant problem in the reflective model (Table 1). Correlations among constructs, the Fornell–Larcker criterion [64], and the HTMT [65] were used to assess the discriminant validity. Importantly, not every square root of the AVE (diagonal values) for each construct was bigger than its corresponding correlation coefficient (Table 1). Regarding the Fornell–Larcker criterion, some HTMT values were higher than the recommended 0.90, ranging anywhere from 0.42 to 1.10 (Table 2). The second-order factors and the third-order factor possess larger correlations of indicators with external constructs’ indicators than they do with indicators that are within the same construct. As with the reflective model, discriminant validity was not wholly supported. Importantly, however, with general models such as those of value co-creation, researchers should expect some high correlations between the latent constructs contained in the model.
For the outcome of the value co-creation, the impacts of value co-creation on gratitude (β = 0.63, p < 0.01), revisit intentions (β = 0.45, p < 0.01), and word-of-mouth (β = 0.71, p < 0.01) are all significant, establishing the nomological validity (Table 3). Value co-creation reflective construct predicted 39.5% of the variance in gratitude (R2 = 0.395), 20.1% of the variance in revisit intentions (R2 = 0.200), and 49.6% of the variance in word of mouth (R2 = 0.496).
Results of the bootstrapping suggested that all path weights of the lower-order constructs form the intended higher-order constructs, as they were significant at the 0.001 level. These results show that lower-order constructs made sufficient contributions to forming the higher-order formative constructs. To be specific, all first- and second-order constructs are necessary to form higher-order constructs. Equity (γ = 0.40, p < 0.01) accounted for most of the variance in co-production, and personalization (γ = 0.39, p < 0.01) accounted for most of the variance in value-in-use. Regarding the third-order construct of value co-creation, co-production (β = 0.60, p < 0.01) explained more of the variance in value co-creation than it did in value-in-use (β = 0.45, p < 0.01).
In conclusion, for both reflective and formative models, all the first-order factors were found to have a significant relationship with their second-order factors, and both the second-order factors were discovered to have a significant relationship with the value co-creation, although the magnitude of these relationships was higher in the reflective model than in the formative model. The second-order factor of co-production is represented by three first-order factors—knowledge, equity, and interaction. In the case of the reflective model, the most important aspect of co-production was equity. Similarly, the formative model analysis revealed that equity was the strongest dimension in terms of co-production. Indeed, the first-order factor of personalization was shown to be the strongest dimension of value-in-use in both the reflective and the formative model. In addition, the comparison of the two models for the second-order factors on value co-creation was similar to the comparison of the previous results that showed that co-production is the strongest dimension in terms of value co-creation. The analysis of the two models provided similar results in regard to what the strongest dimension was. The results were discussed more in the Section 7.
4.4. Common Method Variance
When using self-reported data, the potential for common method variance (CMV) exists [66]. CMV has been defined as systematic error variance affecting multiple variables introduced as a function of the same method and measured concurrently with that method [66]. The present research integrated Podsakoff et al.’s suggestions to negate any CMV that may have been present in the data. There are two characteristics of common method bias: “Only a single factor emerges from the factor analysis” and “One general factor account for the majority of the covariance among measures” (Podsakoff et al., p. 889). Harman’s single-factor test, a post hoc method conducted after data collection to verify if a single factor is responsible for variance in the data, was used in the current study [67] to check for this problem. As part of this method, each item from all constructs is put into a factor analysis to see if one single factor is identified or if, instead, a single general factor corresponds to a majority of the covariance among the measures; if no single factor accounting for most of the covariance is identified, CMV is deemed a non-pervasive problem in the study [67]. Principal component analysis was applied in SPSS 26 in order to conduct the Harman single-factor analysis, with all 23 items of the value co-creation being entered into a single common factor. Researchers investigated the total variance associated with the single common factor to identify the single factor is compared against the threshold of 0.5 [68]. The results revealed the singer factor accounts for 33.85% of the variance in the data. As such, no single factor came forth in the analysis, and the first factor did not capture most of the variance. Given this, CMV was deemed a non-issue in this study.
5. Methods: Study 2
Study 2 aims at assessing reliability, convergent validity, discriminant validity, and the nomological validity and reliability of the value co-creation measure in the context of the recurrent sport event. In addition, Study 2 focused on examining whether noteworthy differences exist between residents and sport tourists, respectively, in the structure of the co-creation value.
The U.S. Grand Prix was chosen for developing an empirical study. The U.S. Grand Prix is an annual, three-day event consisting of a Friday practice session, a Saturday qualifying session, and a Sunday race. Spectators of the Grand Prix come from various places and are not limited to the local destination. Several travel agencies also provide exclusive travel packages with hotels, event tickets, and transfers to the Circuit of the Americas. Therefore, the U.S. Grand Prix is highly relevant when comparing the differences between both residents and tourists.
5.1. Participants and Data Collection
The Grand Prix was canceled in 2020, so the respondents of this study were residents and sport tourists who attended the U.S. Grand Prix either in 2017, 2018, or 2019. The survey used a three-year recall period to test spectators’ value co-creation. Amazon Mechanical Turk (MTurk) was used to recruit participants for the survey. In fact, samples of MTurk often yield superior quality data than student, community, or even high-quality domestic respondents [69].
Respondents were notified of the study’s purpose and were also asked screening questions that verified that they were spectators who attended all three sessions of the U.S. Grand Prix (i.e., the practice session, qualifying session, and the race itself). Questions were asked to classify respondents based on attendee type—specifically, questions identified whether respondents came from up to 50 miles from Austin, Texas, or already resided in the city. Finally, the wording of the questions was reversed after every ten questions. According to Weijters et al. [70], when reversed items are close, they tend to correlate because, at the cognitive level, people perceive them as being similar. Despite this, these reversed items appearing every six items induce a positive impact, as individuals perceive a difference that facilitates thought [71]. Therefore, every tenth question being reverse-coded increased the data quality. Qualified individuals who completed the survey received $1 in their Amazon.com (accessed on 12 September 2020) accounts. Considering the survey was designed to test if value co-creation varied with travel patterns, this was analyzed with a multi-group analysis (parametric test). If a small effect size is chosen (f = 0.10), GPower 3 showed that the total sample size necessary for 80% power at the 5% alpha level is 243. Therefore, a total of 300 responses were collected through the online survey.
Totals of 181 (50.9%) residents and 174 (40.0%) sport tourists were collected. Regarding gender, 75.4% of the residents were male, 24.6% were female; 60.1% of the sport tourists were male, and 39.9% were female. The average age of the residents was 32 years, and the average age of the sport tourists was 36 years. A total of 60.8% of the residents held Bachelor’s degrees, and 28.7% held graduate degrees; among sport tourists, 64.4% and 15.5%, respectively, held those same degrees. The study also provided a breakdown of the respondents’ event attendance frequency. Most of the residents (38.2%) had watched the U.S. Grand Prix three times, followed by twice as the next biggest demographic (33.8%). Most sport tourists (43.9%) had watched the U.S. Grand Prix only once, and 29.1% had watched the Grand Prix twice. Most residents (58.0%) and sport tourists (71.8%) were Caucasian.
5.2. Instruments
The measurements of the co-created value used the third-order reflective model containing the finalized 23 items in Study 1. The present research used an established value-related outcome variable in gratitude [8], revisit intentions [54], and word of mouth [55] to ascertain the nomological validity of value co-creation. Three items [8] were used to conceptualize gratitude as feelings of appreciation, gratefulness, or thankfulness. Revisit intentions measured the likeliness to revisit those events in the future with four items from Kim and Byon. Word of mouth refers to referrals from friends, family, and other acquaintances; this was examined by using three measures adopted from Kim et al. All items used a 7-point rating scale (1 = “strongly disagree”; 7 = “strongly agree”). Furthermore, the questionnaire asked respondents to provide demographic information. As a result, 40 items were retained, which included: (a) value co-creation (23 items); (b) gratitude (3 items); (c) revisit intentions (4 items); (d) word-of-mouth (3 items); and (g) demographic information (7 items) (see Appendix A). 5.3. Data Analysis
Although there are benefits to the PLS-SEM approach discussed in Study 1, PLS-SEM is not suitable for all types of statistical studies [56]. When applying PLS-SEM, component estimates, loadings, and path coefficients might be biased due to a lack of perfect consistency in latent variable scores. It may cause substantial mean square errors in path coefficient loading estimates [72]. Thus, Study 2 used covariance-based SEM techniques for several reasons. To begin with, when compared to PLS-SEM techniques, covariance-based SEM techniques provide more accurate estimations of path coefficients [73]. Additionally, as noted by Chin [74], covariance-based SEM techniques have the potential to be very robust and be better at estimating population parameters than PLS-SEM. Furthermore, covariance-based SEM techniques frequently produce better results regarding the research aim of deriving accurate path coefficients. Thus, covariance-based SEM is better for the research than PLS-SEM because Study 2 intends to examine the outcomes of value co-creation and its coefficient between residents and tourists.
As Study 1 tested the causal relationship between value co-creation and its subdimensions, Study 2 seeks to confirm the model’s reliability and validity and compare the differences between residents and tourists. Given this, covariance-based SEM is an effective method for Study 2. As such, SPSS 26 and AMOS 23 were used to conduct the statistical analyses by applying the two-step modeling approach. Data distribution normality was initially evaluated. Following that, a third-order CFA was performed to test the measurement model. Then, a structural equation modeling (SEM) was applied to test the hypothesized structural model.
The SEM was used to investigate the hypothesized relationships after CFA and the stated tests for measurement reliability and validity. The sample was then separated into two groups to examine differences between the travel patterns (i.e., residents vs. sport tourists). Multi-group SEMs were then performed to examine the proposed hypothesis. There have been several invariance tests in a third-order model. The structural invariance test was used to evaluate whether the hypothesized model was equivalent between residents and sport tourists and whether the hypothesized model path was invariant among the residents and sport tourists.
6. Results: Study 2
6.1. Descriptive Statistics
The absolute values of skewness and kurtosis were used to check the normal distribution, which ranged from −1.10 to −0.48 and from −0.58 to 4.66 among all the respondents (N = 355) for all constructs; both fell well within Chou and Bentler’s [60] criteria (skewness < 5; kurtosis < 5), indicating no indication of non-normality. Neither linearity nor univariate outliers had no serious violations.
6.2. Measurement Model
A third-order CFA was performed to test the measurement model (see Appendix A). Model fit of the third-order measurement model showed a satisfactory fit for the data (χ2 = 1549.40, df = 421, χ2/df = 3.68, p < 0.01, CFI = 0.89, TLI = 0.86, RMSEA = 0.06). Both Cronbach’s α (from 0.71 to 0.80) and composite reliability values (from 0.85 to 0.88) were higher than the suggested criteria of 0.70 [50], thereby showing internal consistency reliability. All average variance extracted (AVE) values were greater than 0.5 [56]. Again, not all the square roots of each construct’s AVE (diagonal values) were larger than their corresponding correlation coefficients, pointing to discriminant validity issues [64]. For example, the square roots of the AVE (AVE = 0.57) are smaller than the correlations between value co-creation and gratitude (r = 0.80), revisit intentions (r = 0.85), and word of mouth (r = 0.84). As they shared the highest correlation with value co-creation, revisit intentions and value co-creation were combined into one overall measure. A model was assessed wherein revisit intentions and value co-creation were loaded onto a higher-order latent variable to solve the discriminant validity issue (Farrell, 2010). Table 5 shows the results of correlations, Cronbach’s α, composite reliability, and AVE in the third-order model.
Table 6 shows the first-order constructs on a defined second-order construct, co-production consisting of three major first-order dimensions, including knowledge, equity, and interaction. The value-in-use is a second-order factor having three important first-order dimensions, including experience, personalization, and relationships among residents and sport tourists. Furthermore, it also reflects the coefficients of the second-order constructs on the designated third-order construct, demonstrating that the value co-creation is a third-order factor with two second-order dimensions, including co-production and value-in-use among residents and sport tourists.
6.3. Structural Equation Modeling
The structural equation model was used to ensure the nomological validity of the value co-creation scale, with measurements being examined to assess the impact on gratitude, revisit intentions, and word of mouth. The results demonstrated a satisfactory model fit (χ2 = 1589.84, df = 424, χ2/df = 3.75, p <.01, CFI = 0.91, RMSEA = 0.06, and TLI = 0.90). Table 7 displays the results of the structural model estimation. Results show that value co-creation significantly and positively affected gratitude (β= 0.87; p < 0.01), revisit intention (β = 0.89; p < 0.01), and word of mouth (β= 0.82; p < 0.01). As such, H3, H4, and H5 were all supported (Table 7). The value co-creation was examined with the value co-creation outcomes of gratitude, revisit intentions, and word of mouth.
6.4. Discriminant Validity
Following the suggestions for lack of discriminant validity [75], two structural models were conducted, one using revisit intentions and value co-creation as two separate variables and another loading these variables onto a second-order latent variable to mitigate minor issues with discriminant validity. As such, a model was assessed wherein these two variables were loaded onto a higher-order latent variable. The results of the measurement model showed good model fit (χ2 = 1610.65, df = 420, χ2/df = 3.83, p < 0.01, CFI = 0.88, TLI = 0.85, RMSEA = 0.06). A structural model with three latent variables revealed good model fit (χ2 = 1594.05, df = 423, χ2/df = 3.76, p <.01, CFI = 0.91, RMSEA = 0.06, and TLI = 0.90). The chi-square difference test between separated variables and one second-order variable revealed a statistically significant difference between the two models (Δχ2[1] = 4.21, p < 0.01). The consequences of the difference in chi-square suggested that value co-creation and revisit intentions referred to different factors, showing discriminant validity between value co-creation and revisit intentions [75].
6.5. Multi-Group Analysis
To test how value co-creation changes across travel patterns (i.e., residents vs. sport tourists), an invariance test was conducted for both measurement and structural models by using the resident samples (n = 181) and the sport tourist samples (n = 174). Cheung and Rensvold [76] proposed CFI and RMSEA difference tests (i.e., ΔCFI ≤ 0.01 and ΔRMSEA ≤ 0.015) for the confirmatory factor analytic test of measurement invariance (MI). Also, Cheung and Rensvold’s [76] measurement invariance method has been applied to the hierarchical latent variable model. For example, Chen et al. [76] investigated measurement invariance in a quality of life second-order factor model. The invariance of factor variances/covariances in the third-order value co-creation model has thus been evaluated across the samples by using Cheung and Rensvold’s techniques [76]. Given that higher-order invariance tests can only be useful if the first-order factors are reasonably invariant [77], both first-order and third-order factor models and their invariance across residents and sport tourists were tested. First, a configural invariance model was constructed by using CFA if the factor loadings for sport tourists and residents were not limited to being equal [76]. The unrestricted first-order model included an adequate fit to the data (χ2 = 2060.42, p < 0.01, χ2/df = 2.59, CFI = 0.93, and RMSEA = 0.05), and the unrestricted third-order model contained an adequate fit to the data (χ2 = 2188.19, p < 0.01, χ2/df = 2.60, CFI = 0.91, and RMSEA = 0.06). Secondly, a fully metric invariance model was run by using CFA while constraining all factor loadings to be equal across residents and sport tourists. The metric invariance model showed a good fit to the data (first-order model: χ2 = 2161.08, p < 0.01; χ2/df = 2.61; CFI = 0.92, and RMSEA = 0.06; third-order model: χ2 = 2217.86, p < 0.01; χ2/df = 2.60; CFI = 0.91, and RMSEA = 0.06). To assess metric invariance, the fit of the metric model was compared with the fit of the configural model (first-order model: ∆CFI = 0.004; ∆RMSEA = 0.001; third-order model: ∆CFI = 0.001; ∆RMSEA = 0.000). Third, the intercepts of the same items were constrained to be equal to test the scalar invariance. To assess scalar invariance, the fit of the scalar model was compared with the fit of the metric model (first-order model: ∆CFI = 0.001; ∆RMSEA = 0.000; third-order model: ∆CFI = 0.000; ∆RMSEA = 0.001). As indicated in Table 4, ∆CFI and ∆RMSEA were below the cutoff values. The findings satisfied the requirements for both first-order model and third-order model partial measurement invariance [56]. Table 8 presents the results of third-order measurement invariance tests.
Following this, researchers developed a baseline model for structural invariance with an acceptable fit to the data (χ2 = 2231.52.79, df = 848, χ2/df = 2.63, p < 0.01, CFI = 0.91, and RMSEA = 0.06). Then, the model was compared to the nested constrained model with fit to the data (χ2 = 2403.93, df = 909, χ2/df = 2.65, p < 0.01, CFI = 0.89, and RMSEA = 0.06). Researchers subsequently compared the fit of the baseline model with the fit of the nested constrained model (∆CFI = 0.016; ∆RMSEA = 0.000; Δχ2 (61) = 172.40, p < 0.01), finding that minuscule changes took place between the residents and tourists. Then, chi-square difference tests were run comparing the baseline model with a series of nested models. Specifically, differences pertaining to a certain path between the residents and sport tourists were examined by setting each path to equal across groups in a sequence, thereby creating nested models. Table 9 shows information related to these models. According to the results, residents have stronger value co-creation perceptions on equity, experience, interaction, and personalization when compared to sport tourists on these same value co-creation subdimensions. Table 9 shows the knowledge (residents: β = 0.90 > sport tourists: β = 0.86, Δχ2 (1) = 12.51, p < 0.05), equity (residents: β = 0.96 > sport tourists: β = 0.92, Δχ2 (1) = 5.58, p < 0.05), interaction (residents: β = 0.97 > sport tourists: β = 0.93, Δχ2 (1) = 6.01, p < 0.05), and experience (residents: β = 0.94 > sport tourists: β = 0.88, Δχ2 (1) = 4.26, p < 0.05) value co-creation subdimensions, which differ substantially between residents and sport tourists. Thus, these findings supported H6, H7, H8, and H9. Despite this, the personalization (residents: β = 0.94 > sport tourists: β = 0.93, Δχ2 (1) = 0.06, p > 0.10) and relationship (residents: β = 0.96 > sport tourists: β = 0.93, Δχ2 (1) = 0.27, p > 0.10) value co-creation subdimensions did not differ significantly between residents and sport tourists, which goes against H10 and H11. Additionally, differences between residents and sport tourists regarding value co-creation and the outcome variable and revisit intentions were significant (residents: β = 0.99 > sport tourists: β = 0.95, Δχ2 (1) = 6.57, p < 0.05). Results showed that value co-creation has a stronger impact on revisit intentions for residents when compared to sport tourists. This supports H13. Differences between resident and sport tourist value co-creation and gratitude and value co-creation (residents: β = 0.95 > sport tourists: β = 0.92, Δχ2 (1) = 2.90, p < 0.10) and word of mouth (residents: β = 0.84 > sport tourists: β = 0.78, Δχ2 (1) = 1.87, p > 0.10) were insignificant, which goes against H12 and H14.
7. Discussion and Implications
In Study 1, the analysis of the two models provided similar results regarding what the strongest dimension was. After examining the relationships between the first-order and second-order constructs, researchers also estimated the structural relationships between constructs to determine if there were any potential similarities. First, value co-creation positively influenced the outcome variables, gratitude, revisit intentions, and word of mouth with similar path coefficients. Secondly, the R2 values were slightly larger in the formative model than in the reflective model, with 0.3% more variance explained in gratitude, 0.1% more in revisit intentions, and 0.1% in word of mouth. According to Henseler and Chin [78], even if there is almost no difference in variance explanation (R2 varied by only 0.3%), this does not always mean there are differences in general. Therefore, both models have the same prediction accuracy. As such, the formative and reflective models provide a very similar image of what is essential to spectators in terms of value co-creation in the recurring sporting event context. In recurring sporting events, it is suggested that considering value co-creation causes evaluations of co-production and value-in-use in a recurring sport event. Co-production and value-in-use are critical elements in determining whether sport spectators value co-creation. It is demonstrated that the reflective model of value co-creation is not habitually applied to the research. Overall, applying reflective indicators rather than formative indicators in the value co-creation measurement for recurring sport events is valid. Furthermore, the results of both reflective and formative measurement models showed internal consistency, reliability, content validity, convergent validity, and nomological validity. However, discriminant validity was not established among the co-production, value-in-use, and value co-creation. Problems with discriminant validity led to issues with interpreting findings related to these latent constructs. In cases where discriminant validity has not been established, any conclusions about the relationships between the examined constructs may not be accurate. As Study 1 is a pilot study, researchers must exercise caution when evaluating results concerning these latent constructs. Given this, researchers collected additional data in Study 2 to better determine whether sampling flukes were to blame for the discriminant validity issue. Following Study 1, a third-order CFA and structural equation model were performed with the residents in the U.S. Grand Prix to further validate the latent structure.
Study 2 found the first-order factors (i.e., knowledge, equity, interaction, experience, personalization, and relationship) and the second-order factors (i.e., co-production, value-in-use) to be both conceptually and empirically reliable in the third-order factor value co-creation model. Results indicated value co-creation is a third-order construct in value systems research in the recurring sport event context. Then, the results indicated the construction of value co-creation to be linked to gratitude, revisit intentions, and word of mouth. Among these, value co-creation contributes most to revisit intentions and least to word of mouth. The investigation also confirmed that the dimensions were nomologically and convergently valid. Of note, correlations between value co-creation and revisit intentions and between value co-creation and word-of-mouth were comparatively high in the third-order model.
Moreover, the present study finds that value co-creation differs between different groups of social actors in the context of the recurring sport event. The coefficients of the residents’ co-production on knowledge (H6), equity (H7), interaction (H8), value-in-use on experience (H9), and value co-creation on revisit intentions (H13) were significantly larger than the coefficients among tourists. The results of this study are inconsistent with those of Aicher et al. [3], who found that sport tourists reported greater levels of emotional meaning regarding their participation. One possible reason for this could be that residents are more interested in the benefits of being involved in an event and participating in the decision-making process than tourists, who generally spend around one week in the host city during the event process. Previous place identity studies support this explanation, positing that the more one’s identity is tied to the resources in a specific location, the more likely that person will participate in activities beneficial to that place [17]. In the case of the recurring sport event, the residents strongly impact the sense of place and sense of identity that can influence the value co-creation. The other explanation may be related to the pandemic when it comes to the U.S. Grand Prix, which was canceled in 2020. Travel restrictions in 2020 significantly reduced tourists’ intentions to revisit the event and interact with others because of restricted mobility and social distancing [79]. However, non-significant differences existed between the effect of value-in-use on personalization (H10) and relationship (H11) and value co-creation on gratitude (H12) and word of mouth (H14) between resident and sport tourist groups. One potential reason is that attending sports events costs money and time for those out-of-region spectators traveling to attend the event. Future research should focus on the costs of attending the event and explore how these costs influence resident and tourist behavior intentions.
7.1. Theoretical Implications
Recent sport management literature has focused on theoretical and empirical studies examining the role of value co-creation [21,55]. Though these studies have effectively measured certain facets of value co-creation, little time has been spent investigating co-created value as a construct that measures resource-integrating value perspectives. The present study uses S-D logic to investigate the notion of value co-creation in the recurring sport event context. This research developed a hierarchical model that researchers can use to study value co-creation through the lens of both co-production and value-in-use, as well as to study the spectator behavior intentions related to the value co-creation processes. The present research proposes the potential existence of a moderating effect on value co-creation that is based on attendee type (i.e., resident vs. tourist) and provides insight into the behavior of recurring sporting event spectators in light of four perspectives.
To begin with, value co-creation is a resource exchange process wherein resource integrators interact to generate resource exchange and create reciprocal value [11]. Accordingly, as in Ranjan and Read [1], the present study sees value co-creation as belonging to two main categories using six first-order factors in the context of the recurring sport event: co-production and value-in-use. Unlike Ranjan and Read’s formative model, however, the reflective hierarchical model remains a preliminary investigation into the notion of value co-creation in the context of the recurring sport event. In the reflective model, it is defined as value co-creation based on attributes that reflect the value co-creation, such as co-production and value-in-use. As spectators value co-creation increases, co-production may increase, and the spectators will be more likely to endorse the items of knowledge, equity, and interaction. As a result, item responses are influenced by or reflect the underlying variable. The opposite is not true: direct manipulation of the manifestations specified in the items is unlikely to influence the construct [80]. In other words, stopping the co-production or value-in-use will not be likely to change the underlying value co-creation.
Also, it is an initial attempt to use resource integration rather than the features-and-benefits approach to developing a better understanding of sport consumption behavior and broader sport phenomena. The present study’s findings boost our understanding of value co-creation and lend credence to the idea that value is co-created by sport spectators through resource integration processes and interactions with sport organizations and other stakeholders. Furthermore, building upon the social exchange theory, value co-creation measure helps to recognize the influence of value co-creation on gratitude, revisit intention, and word of mouth. The study’s outcomes help to comprehend value co-creation conceptually and empirically within the recurring sport event context by examining the value co-creation and the outcomes of the value co-creation process. Extant literature on the social exchange theory has been developed into the realm of the S-D logic. Researchers have used social exchange in sporting event studies [81]. The reciprocal nature of spectators’ consumption that has been explored in the previous studies was also investigated and explored in this study. Spectators are keen to work with other stakeholders to obtain rewards, if they consider that they engage in the co-production process and receive high value-in-use. This is consistent with the social exchange theory. The importance of the social exchange theory and reciprocity can be seen in the host community supporting the hosting event when it has a beneficial influence on their economic, environmental, and sociocultural well-being [81].
In addition, this study benefits sport management research by offering a hierarchical value co-creation model from resident and tourist perspectives in the recurring sporting event context. Specifically, the current research makes a distinction between attendee type, dividing them into two separate groups (i.e., resident and sport tourist) while also examining the moderating role attendee type has in assessing value co-creation. The prior literature indicates that, though many assumptions, frameworks, and models stating that perceptions could differ between residents and tourists [19,42] exist, no one has yet to investigate which group facilitates the highest value co-creation. Therefore, this study’s comparison between value co-creation’s production and consumption processes between residents and sport tourists serves as a unique conceptual contribution to resident and sport tourist value co-creation literature. Because residents potentially generate, on average more value co-creation than tourists as it relates to equity, experience, interaction, and personalization, this contribution is even more significant. If we suppose that studies could further find that residents are more likely to revisit an event than tourists, we could contribute even more to the theoretical advancement of the literature on travel patterns in the recurring sporting event context.
Finally, unlike previous studies that primarily center on value co-creation at professional team events [35], the present research supports multiple perspectives in the recurring sport event context. Empirical support is offered for the idea that spectator value co-creation is not limited to just professional team events (e.g., the English football league, NBA) but also takes place at annual recurring sport events using the Sport Framework Value, which posits that value co-creation differs substantially based on the context wherein the value was generated.
7.2. Practical Implications
Important practical implications for sport management authorities at recurring sport events were offered in the current study. To begin with, sporting event professionals need to consider what decisions will be made because of the reflective model. As a reflective value co-creation measurement model, although stopping the co-production or value-in-use will not likely change the underlying value co-creation, the reflective measure might enable feedback to spectators on their value co-creation development. An event manager may be interested in spectators’ attributes that reflect the value co-creation, such as knowledge, equity, interaction, personality, and relationship. The assumption is that as the level of value co-creation increases, a respondent would be more likely to endorse these subdimensions. Therefore, the reflective model of value co-creation will assist sporting event professionals in assessing the effectiveness of spectator and event provider value co-creation processes, as well as track progress made in identifying and developing highly effective resource integration by examining co-production and value-in-use, along with relevant subdimensions such as equity, experience, interaction, knowledge, personalization, and relationship. Delineating the value co-creation into these categories could enhance event organizers’ evaluation of spectators’ value co-creation. By using a reflective model, event service providers may obtain important information about what guests expect from the event and increase flexibility in generating both a more personalized event experience and a more personal relationship. At times, event managers may not be able to perceive the effort event staff exert during the co-production and value-in-use processes; as such, the co-production subdimensions (i.e., equity, interaction, knowledge) and the value-in-use subdimensions (i.e., experience, personalization, and relationship) in this study can help these managers determine the decision making on how to recruit, train, assess, and reward their staffs for keeping their behavior aligned with event co-creation goals. For instance, staff members may be rewarded by event managers if a constant provision of up-to-date and thorough event information and illustrations is performed, spectators are motivated to participate in event decision-making processes, and spectators at the event can state their demands precisely. Value co-creation should also be applied to the recruitment processes to ensure that a proper staff is hired, which gives guests chances to relate their desires or be part of the co-creation process. During the training process, event managers should emphasize the sustainability of the service and teach employees to constantly update customers through social media and open communication channels throughout the year.
Furthermore, results suggest that interaction is one of the most influential factors in the value co-creation construct. Findings indicate that managers and event organizers should ensure interaction between spectators and the event. However, there may be times when event managers cannot interact with the spectators. Therefore, more platforms (i.e., sport arenas, social media, apps) with various functions should be provided to give spectators chances to interact with the event organizers. For example, Formula One allows spectators with event tickets to sit anywhere in the grandstands to watch the Friday practice sessions from various views. Another suggestion involves creating a social media campaign through popular platforms like TikTok or Instagram, wherein spectators can post short videos from various viewpoints while using a specific hashtag. Using this as a base, the event can challenge spectators to take the best videos, with the individual who uploads the video with the most likes being offered a prize, such as free tickets, the opportunity to meet some F-1 drivers, etc. Also, if F-1 drivers or influencers who are collaborating with F-1 post the information on their social media, the social media influencer (SMI) marketing would be much more effective than traditional strategies approaching the consumers [82]. According to the growth of individual contact creators on streaming platforms, such as YouTube, streamers are considered a new type of influencer. The collaboration with the streamers might be highly effective in SMI marketing. For tourists’ customer-to-customer value co-creation, Rihova et al. [82] indicated multiple social levels (detached tourist, social bubble, and communitas). For detached tourists, they are in a place together, such as campsites or beaches, and co-create scenes of the crowd, but they build physical barriers to detach themselves. Social bubble level co-creation is planning the trip with friends and sharing memories. The communitas level co-creates a sense of belonging among tourists by sharing their experiences [82]. Social media might affect all levels of tourist co-creation. For example, all social levels (detached, social bubble, and communitas) of individuals may participate in the New York City Marathon. The webpage entitled “Get Inspired” for sharing the runners’ photos and stories may be for communitas-level tourists, but the social media images of individual tourist/participants might extend to detached or social bubble co-creation experience positively, and even to communitas. Activities such as these could increase interaction, benefitting spectators and the sports organization. Importantly, technology is a chief factor whereby enhanced on-the-ground experiences can be co-created, and employee–customer, customer–customer, and customer–firm interactions can be boosted [83]. Interactions can also occur through the official event app; new functions using 5G technology allow spectators to choose the part of the stadium from which to watch the game and hear their audio, which should be delivered with multiple cameras installed in stadiums. Racing events are held in large arenas; if spectators choose the camera angles for their broadcasts, they can interact with their own spectating experience and co-create value with the event provider and players.
Finally, the results offer important practical implications for the effective management of both residents and tourists in the recurring sport event context. The study highlights the importance of relationships between equity, interaction, knowledge, and co-production and between experience, relationship, personalization, and value-in-use for the resident and the tourist groups. Despite this, the relationship between equity, interaction, and co-production—and the relationship between experience, personalization, and value-in-use—is stronger with residents than with tourists. Regarding value co-creation outcomes, the presence of a stronger influence of value co-creation on revisit intentions among residents when compared to tourists indicates that residents are a better target group than tourists if event organizers wish to keep their revisit spectators. Overall, respondents in this study reported that interaction was the highest level of the first-order factor in value co-creation. In contrast, tourists reported that personalization was the highest level of the first-order factor in value co-creation. Therefore, event organizers could better develop personalization strategies specific to the needs and desires of the tourist group. Personalization has been around for a long time, though not always in the same form, as there has been a major transformation in what drives personalization, as well as in the technologies that facilitate it. For example, the coronavirus pandemic has brought personalization to the forefront in both on-site venues and online. Event managers must provide one-to-one experiences. For example, machine learning can be used to achieve personalization at scale across the entire range of residents and tourists, apply context about tourists’ circumstances (e.g., hometown, stay days, travel habits), and provide customized communications (e.g., special deals) and offer customized ticket packages. Also, for the spectators who are willing to listen to the portable radio with headphones onsite, the content of the trackside commentary on AM or FM radio should be different between residents and tourists. More destinations, local culture, transportation, and travel information should be provided for the tourists. This can be an excellent way to keep them up to date with not only the trackside action but also the destination information. Overall, event organizers should consider residents’ and tourists’ levels of value-in-use and co-production in the process of value co-creation process to develop different and more targeted event strategies for the two groups.
8. Limitations and Suggestions for Future Study
The third-order value co-creation model was explored between residents and tourists in recurring sport event contexts, but it also has several limitations.
To begin with, the current research is primarily concerned with spectator–event organizer interactions in the value co-creation context. From a theoretical standpoint, multiple stakeholders and their social networks are jointly involved in both direct and indirect activities that eventuate in improved service system vitality, and mutual benefits [32] take part in the value co-creation process. In the recurring sporting event context, the value co-creation that spectators have associated with the event experience is played by different stakeholders (e.g., the organization, sponsors, media, vendors, transit providers, other consumers) [84]. For example, sponsors may co-create value with this event by offering products and services for a recurrent event and conveying event values in their promotion efforts. Spectators and spectator interactions are important to value co-creation because they contribute to the game’s unique atmosphere [21]. Future research should assess this study’s new value co-creation measure from various stakeholders’ interaction standpoints. For instance, research should study how value co-creation can be evaluated between spectators and spectators and between sponsors and event organizers in the recurring sporting event context.
Furthermore, only a set number of consequences were examined in the nomological network of value co-creation. Given this, except for value co-creation, different individual psychological factors should be included to examine how this value affects commitment, trust, and well-being [6], which captures spectator perceptions and attitudes toward value co-creation actors. Extra value co-creation consequences, such as commitment, trust, and well-being, can enhance a nomological network reflecting mutual, relational, and positive-sum outcomes that improve value co-creation service systems. Additionally, no antecedents for nomological validity were examined. It follows that future studies should account for other value co-creation antecedents in addition to value co-creation. For instance, studies may examine how customer engagement or openness levels influence value co-creation [6].
Another issue is that the sample size in Study 1 is somewhat tiny. Although PLS-SEM has a smaller sampling bias than CB-SEM, Study 1 still considers small sample concerns. The small sample size causes identification issues and lower levels of statistical power [85]. In other words, assuming all other factors are equal, smaller samples have a higher sampling error than larger samples. These sample problems may restrict the findings’ generalizability. As a result, the study’s findings may not be generalized beyond the sample size. As a result, additional research with a bigger sample size in different events is expected to validate the current study’s findings.
Moreover, one disadvantage of the current study is that convergent validity was tested by using factor loading in confirmatory factor analysis. Although CFA is one way of analyzing MTMM data and demonstrating convergent validity, the method impacts might be multiplicative rather than additive at times [86]. The usual CFA is inapplicable in the presence of multiplicative method effects. This implies that, rather than assuming that a certain model (e.g., CFA) is acceptable, one should evaluate and test other models against the data. As a result, more research may be conducted by using various processes for evaluating multitrait–multimethod matrices, such as the Campbell–Fiske approach and the direct product model.
In addition, a weak discriminant validity was found in Study 1. Although discriminant validity was proven (Study 2) in the combination of revisiting intentions and value co-creation as a single overall measure, revisit intentions and value co-creation are theoretically different. Combining two separate constructs makes no theoretical sense. As a result, this strategy may not be applicable in all cases. Scholars may need to collect additional data to evaluate whether discriminant validity is due to sampling errors [75]. Researchers can delete one (or more) independent variables if problems persist [75].
Author Contributions
Conceptualization, K.K.B. and J.Z.; methodology, formal analysis, J.Z. and K.K.B.; data collection, J.Z.; writing—original draft preparation, J.Z. and K.K.B.; supervision, K.K.B.; data cleaning, J.Z.; writing—review and editing, W.J. and K.K.B.; All authors have read and agreed to the published version of the manuscript.
Funding
This research received no external funding.
Institutional Review Board Statement
The study was conducted according to the guidelines of the Declaration of Helsinki and approved by the Institutional Review Board of Indiana University (Protocol #: 1911062899A001, Date of approval: 6 May 2020).
Informed Consent Statement
Informed consent was obtained from all subjects involved in the study.
Data Availability Statement
The data that support the findings of this study are available from the author, J.Z., upon request.
Conflicts of Interest
The authors declare no conflict of interest.
Appendix A
| Variables | Items | λ of Residents (n = 181) | λ ofTourists (n = 174) |
| Knowledge 1 | The event was open to spectators’ ideas and suggestions about its existing services or towards developing a new service. | 0.73 | 0.81 |
| Knowledge 2 | The event provided sufficient information (e.g., player information, event schedule, parking, transportation) related to the event to me. | 0.73 | 0.69 |
| Knowledge 3 | As a spectator, I felt I willingly spent time and effort to share ideas and suggestions with the event to improve its service and event quality. | 0.71 | 0.83 |
| Knowledge 4 | The event provided a suitable platform and opportunity (e.g., feedback button on the event website, on-site customer survey) to spectators to offer suggestions and ideas about the event to event organizers. | 0.73 | 0.78 |
| Equity 1 | Event organizers understand spectator preferences toward the event service. | 0.83 | 0.78 |
| Equity 2 | The event schedules were aligned with spectators’ requirements (e.g., the way I wish them to be). | 0.79 | 0.80 |
| Equity 3 | The event considered spectators’ feedback to be as important as event organizers’ feedback in the event. | 0.81 | 0.83 |
| Equity 4 | The event organizers invited spectators in the event design process. | 0.81 | 0.79 |
| Interaction 1 | Before, during, and after the event, spectators could conveniently express their specific preferences. | 0.83 | 0.77 |
| Interaction 2 | All relevant information about the event was communicated to spectators. | 0.71 | 0.72 |
| Interaction 3 | The event encouraged spectator interactions (e.g., developing event services, talking with other fans, assisting other fans, etc.)” | 0.80 | 0.70 |
| Interaction 4 | In order to obtain maximum benefits from the event, spectators had to apply their skills, knowledge, and time to the event. | 0.74 | 0.76 |
| Experience 1 | The benefits, value, or fun derived from the event depended on the other spectators. | 0.90 | 0.79 |
| Experience 2 | Depending on the type/degree of participation of the event activities, spectators’ experiences at the event might be different from other spectators. | 0.78 | 0.77 |
| Experience 3 | It was possible for spectators to experiment and try new things (e.g., drinking new beverage, playing new racing video games, upgrade seating experience). | 0.78 | 0.79 |
| Personalization 1 | The benefits, value, or fun derived from the event depended on the other spectators. | 0.82 | 0.78 |
| Personalization 2 | The event tried to serve the individual needs of its spectators. | 0.78 | 0.81 |
| Personalization 3 | Spectators involved themselves differently at the event depending on their knowledge and preferences. | 0.80 | 0.83 |
| Personalization 4 | The event provided an overall good personal experience, going beyond monetary value. | 0.58 | 0.51 |
| Relationship 1 | The event provided everything necessary for spectators to fully enjoy the event. | 0.82 | 0.79 |
| Relationship 2 | Spectators felt an attachment to or relationship with the event. | 0.79 | 0.84 |
| Relationship 3 | The event built a community of spectators who really like the event. | 0.78 | 0.79 |
| Relationship 4 | The event became well known because spectators shared their positive experiences on social media. | 0.79 | 0.84 |
| Gratitude 1 | I strongly identify with the event. | 0.81 | 0.88 |
| Gratitude 2 | When someone praises about the event, it feels like a personal compliment. | 0.81 | 0.86 |
| Gratitude 3 | I feel attached to this event. | 0.82 | 0.84 |
| Revisit Intention 1 | I will make an effort to attend the future Grand Prix in Austin. | 0.88 | 0.87 |
| Revisit Intention 2 | I intend to revisit the future Grand Prix in Austin. | 0.84 | 0.92 |
| Revisit Intention 3 | I intend to save time and money to revisitthe future Grand Prix in Austin. | 0.78 | 0.87 |
| Revisit Intention 4 | I am willing to revisit the future Grand Prix in Austin. | 0.87 | 0.88 |
| Word-of-mouse 1 | I will recommend the Grand Prix in Austin to to my family. | 0.84 | 0.89 |
| Word-of-mouse 2 | I am likely to recommend the Grand Prix in Austin to my friends. | 0.77 | 0.86 |
| Word-of-mouse 3 | I will recommend the U.S. Grand Prix to people interested in racing. | 0.86 | 0.85 |
References
- Ranjan, K.R.; Read, S. Value co-creation: Concept and measurement. J. Acad. Market. Sci. 2016, 44, 290–315. [Google Scholar] [CrossRef]
- Homans, G.C. Social Behavior: Its Elementary Forms; Harcourt, Brace & World: San Diego, CA, USA, 1961. [Google Scholar]
- Aicher, T.J.; Karadakis, K.; Eddosary, M.M. Comparison of sport tourists’ and locals’ motivation to participate in a running event. Int. J. Event Festiv. Manag. 2015, 6, 215–234. [Google Scholar] [CrossRef]
- Galvagno, M.; Dalli, D. Theory of value co-creation: A systematic literature review. Manag. Serv. Qual: An Intern. J. 2014, 24, 643–683. [Google Scholar] [CrossRef]
- Cheung, M.L.; Leung, W.K.; Aw, E.C.X.; Koay, K.Y. “I follow what you post!”: The role of social media influencers’ content characteristics in consumers’ online brand-related activities (COBRAs). J. Retail. Consum. Serv. 2022, 66, 102940. [Google Scholar] [CrossRef]
- Busser, J.A.; Shulga, L.V. Co-created value: Multidimensional scale and nomological network. Tour. Manag. 2018, 65, 69–86. [Google Scholar] [CrossRef]
- Yi, Y.; Gong, T. Customer value co-creation behavior: Scale development and validation. J. Bus. Res. 2013, 66, 1279–1284. [Google Scholar] [CrossRef]
- Zhang, J.C.; Byon, K.K.; Tsuji, Y.; Pedersen, P.M. Co-created value influences residents’ support toward the sporting event through the mediating mechanism of gratitude. Eur. Sport Manag. Q. 2021, 1–23. [Google Scholar] [CrossRef]
- Schmitt, C.D.S.; Petroll, M.D.L.M. A theoretical essay on the influence of Social Exchange Theory and Value Co-creation in Crowdfunding. Intercom Rev. Bras. Ciências Comun. 2021, 44, 247–269. [Google Scholar] [CrossRef]
- Christophersen, T.; Konradt, U. Development and validation of a formative and a reflective measure for the assessment of online store usability. Behav. Inf. Technol. 2012, 31, 839–857. [Google Scholar] [CrossRef]
- Vargo, S.L.; Lusch, R.F. The four service marketing myths: Remnants of a goods-based, manufacturing model. J. Serv. Res. 2004, 6, 324–335. [Google Scholar] [CrossRef] [Green Version]
- Barnes, S.J.; Mattsson, J.; Sørensen, F. Destination brand experience and visitor behavior: Testing a scale in the tourism context. Ann. Tour. Res. 2014, 48, 121–139. [Google Scholar] [CrossRef]
- Neuhofer, B.; Buhalis, D.; Ladkin, A. Smart technologies for personalized experiences: A case study in the hospitality domain. Electron. Mark. 2015, 25, 243–254. [Google Scholar] [CrossRef]
- Chang, M.J.; Kang, J.H.; Ko, Y.J.; Connaughton, D.P. The effects of perceived team performance and social responsibility on pride and word-of-mouth recommendation. Sport Market. Q. 2017, 26, 31–41. [Google Scholar]
- Travel Industry Association of America. Glossary of Travel Terms. 2020. Available online: https://www.travellaw.com/glossary (accessed on 12 September 2020).
- Chen, J.S.; Tsou, H.T.; Ching, R.K. Co-production and its effects on service innovation. Ind. Market. Manag. 2011, 40, 1331–1346. [Google Scholar] [CrossRef]
- Yang, Y.; Wang, S.; Cai, Y.; Zhou, X. How and why does place identity affect residents’ spontaneous culture conservation in ethnic tourism community? A value co-creation perspective. J. Sustain. Tour. 2022, 30, 1344–1363. (in press). [Google Scholar] [CrossRef]
- Tajfel, H.; Turner, J.C.; Austin, W.G.; Worchel, S. An Integrative Theory of Intergroup Conflict; Austin, W., Worchel, S., Eds.; Oxford University Press Inc.: New York, NY, USA, 1979. [Google Scholar]
- Kaplanidou, K.; Vogt, C. The meaning and measurement of a sport event experience among active sport tourists. J. Sport Manag. 2010, 24, 544–566. [Google Scholar] [CrossRef] [Green Version]
- Snelgrove, R.; Taks, M.; Chalip, L.; Green, B.C. How visitors and locals at a sport event differ in motives and identity. J. Sport Tour. 2008, 13, 165–180. [Google Scholar] [CrossRef] [Green Version]
- Woratschek, H.; Horbel, C.; Popp, B. The sport value framework—A new fundamental logic for analyses in sport management. Eur. Sport Manag. Q. 2014, 14, 6–24. [Google Scholar] [CrossRef] [Green Version]
- Mele, C.; Pels, J.; Polese, F. A brief review of systems theories and their managerial applications. Serv. Sci. 2010, 2, 126–135. [Google Scholar] [CrossRef] [Green Version]
- Gerke, A.; Woratschek, H.; Dickson, G. The sport cluster concept as middle-range theory for the sport value framework. Sport Manag. Rev. 2020, 13, 200–214. [Google Scholar] [CrossRef]
- Etgar, M. A descriptive model of the consumer co-production process. J. Acad. Mark. Sci. 2008, 36, 97–108. [Google Scholar] [CrossRef]
- Shilbury, D. A bibliometric analysis of four sport management journals. Sport Manag. Rev. 2011, 14, 434–452. [Google Scholar] [CrossRef]
- Chatterjee, S.; Nguyen, B. Value co-creation and social media at bottom of pyramid (BOP). Bottom Line 2021, 34, 101–123. [Google Scholar] [CrossRef]
- Hoyer, W.D.; Chandy, R.; Dorotic, M.; Krafft, M.; Singh, S.S. Consumer cocreation in new product development. J. Serv. Res. 2010, 13, 283–296. [Google Scholar] [CrossRef]
- Vargo, S.L.; Lusch, R.F. Service-dominant logic: Continuing the evolution. J. Acad. Mark. Sci. 2008, 36, 1–10. [Google Scholar] [CrossRef]
- Gummesson, E.; Mele, C. Marketing as value co-creation through network interaction and resource integration. J. Bus. Mark. Manag. 2010, 4, 181–198. [Google Scholar] [CrossRef]
- Grönroos, C.; Voima, P. Critical service logic: Making sense of value creation and co-creation. J. Acad. Mark. Sci. 2013, 41, 133–150. [Google Scholar] [CrossRef]
- Hedlund, D.P. Creating value through membership and participation in sport fan consumption communities. Eur. Sport Manag. Q. 2014, 14, 50–71. [Google Scholar] [CrossRef]
- Lusch, R.F.; Vargo, S.L. Service-dominant logic: Reactions, reflections and refinements. Mark. Theory 2006, 6, 281–288. [Google Scholar] [CrossRef]
- Horbel, C.; Popp, B.; Woratschek, H.; Wilson, B. How context shapes value co-creation: Spectator experience of sport events. Serv. Ind. J. 2016, 36, 510–531. [Google Scholar] [CrossRef] [Green Version]
- Karpen, I.O.; Bove, L.L.; Lukas, B.A. Linking service-dominant logic and strategic business practice: A conceptual model of a service-dominant orientation. J. Serv. Res. 2012, 15, 21–38. [Google Scholar] [CrossRef]
- Kolyperas, D.; Maglaras, G.; Sparks, L. Sport fans’ roles in value co-creation. Eur. Sport Manag. Q. 2019, 19, 201–220. [Google Scholar] [CrossRef] [Green Version]
- Palminteri, S.; Lebreton, M.; Worbe, Y.; Grabli, D.; Hartmann, A.; Pessiglione, M. Pharmacological modulation of subliminal learning in Parkinson’s and Tourette’s syndromes. Proc. Natl. Acad. Sci. USA 2009, 106, 19179–19184. [Google Scholar] [CrossRef] [Green Version]
- Lawler, E.J. An affect theory of social exchange. Am. J. Sociol. 2001, 107, 321–352. [Google Scholar] [CrossRef] [Green Version]
- Chiu, W.; Won, D.; Bae, J.S. Customer value co-creation behaviour in fitness centres: How does it influence customers’ value, satisfaction, and repatronage intention? Manag. Sport Leis. 2019, 24, 32–44. [Google Scholar] [CrossRef]
- See-To, E.W.; Ho, K.K. Value co-creation and purchase intention in social network sites: The role of electronic Word-of-Mouth and trust–A theoretical analysis. Comput. Hum. Behav. 2014, 31, 182–189. [Google Scholar] [CrossRef]
- Ballouli, K.; Trail, G.T.; Koesters, T.C.; Bernthal, M.J. Differential effects of motives and points of attachment on conative loyalty of Formula 1 US Grand Prix attendees. Sport Market. Q. 2016, 25, 166–181. [Google Scholar]
- Koo, S.K.S.; Byon, K.K.; Baker III, T.A. Integrating Event Image, Satisfaction, and Behavioral Intention: Small-Scale Marathon Event. Sport Market. Q. 2014, 23, 127–137. [Google Scholar]
- Chen, N.; Funk, D.C. Exploring destination image, experience and revisit intention: A comparison of sport and non-sport tourist perceptions. J. Sport Tour. 2010, 15, 239–259. [Google Scholar] [CrossRef]
- Füller, J. Refining virtual co-creation from a consumer perspective. Calif. Manag. Rev. 2010, 52, 98–122. [Google Scholar] [CrossRef]
- Lin, Z.; Chen, Y.; Filieri, R. Resident-tourist value co-creation: The role of residents’ perceived tourism impacts and life satisfaction. Tour. Manag. 2017, 61, 436–442. [Google Scholar] [CrossRef] [Green Version]
- Palmatier, R.W.; Jarvis, C.B.; Bechkoff, J.R.; Kardes, F.R. The role of customer gratitude in relationship marketing. J. Mark. 2009, 73, 1–18. [Google Scholar] [CrossRef] [Green Version]
- Emmons, R.A.; McCullough, M.E. The Psychology of Gratitude; Oxford University Press Inc.: New York, NY, USA, 2004. [Google Scholar]
- Viechtbauer, W.; Smits, L.; Kotz, D.; Budé, L.; Spigt, M.; Serroyen, J.; Crutzen, R. A simple formula for the calculation of sample size in pilot studies. J. Clin. Epidemiol. 2015, 68, 1375–1379. [Google Scholar] [CrossRef] [Green Version]
- Kjellsson, G.; Clarke, P.; Gerdtham, U.G. Forgetting to remember or remembering to forget: A study of the recall period length in health care survey questions. J. Health Econ. 2014, 35, 34–46. [Google Scholar] [CrossRef] [Green Version]
- Bradburn, N.M. Recall Period in Consumer Expenditure Surveys Program [Paper presentation]. In Proceedings of the NORC the Bureau of Labor Statistics Consumer Expenditure Survey Methods Workshop, Chicago, IL, USA; 2010. Available online: http://citeseerx.ist.psu.edu/viewdoc/summary?doi=10.1.1.364.176 (accessed on 14 July 2010).
- Andrew, D.; Pedersen, P.M.; McEvoy, C. Research Methods and Design in Sport Management; Human Kinetics: Champaign, IL, USA, 2019. [Google Scholar]
- Sport Marketing Analytics. Indy Car Attendance Profile. Available online: http://sportsmarketanalytics.com.proxyiub.uits.iu.edu/research.aspx?subrid=558 (accessed on 1 July 2021).
- Komorita, S.S.; Graham, W.K. Number of scale points and the reliability of scales. Edu. Psy. Meas. 1965, 25, 987–995. [Google Scholar] [CrossRef]
- Herche, J.; Engelland, B. Reversed-polarity items and scale unidimensionality. J. Acad. Mark. Sci. 1996, 24, 366–374. [Google Scholar] [CrossRef]
- Kim, K.A.; Byon, K.K. The dark side of spectator behavior: Effects of spectator dysfunctional behavior on anger, rumination, and revisit intention. Sport Market. Q. 2020, 29, 228–240. [Google Scholar] [CrossRef]
- Kim, K.; Byon, K.K.; Baek, W. Customer-to-customer value co-creation and co-destruction in sporting events. Serv. Ind. J. 2020, 40, 633–655. [Google Scholar] [CrossRef]
- Hair, J.F.; Black, W.C.; Babin, B.; Anderson, R.; Tatham, R. Multivariate Data Analysis; Prentice-Hall Inc.: Upper Saddle River, NJ, USA, 2010. [Google Scholar]
- Reinartz, W.; Haenlein, M.; Henseler, J. An empirical comparison of the efficacy of covariance-based and variance-based SEM. Int. J. Res.Mark. 2009, 26, 332–344. [Google Scholar] [CrossRef] [Green Version]
- Garson, G.D. Partial Least Squares: Regression and Structural Equation Models; Statistical Associates Publishers: Asheboro, NC, USA, 2016. [Google Scholar]
- Mishra, P.; Pandey, C.M.; Singh, U.; Gupta, A.; Sahu, C.; Keshri, A. Descriptive statistics and normality tests for statistical data. Ann. Card. Anaesth. 2019, 22, 67–78. Available online: https://www.annals.in/text.asp?2019/22/1/67/250184 (accessed on 1 July 2021).
- Chou, C.P.; Bentler, P.M. Estimates and Tests in Structural Equation Modeling; Hoyle, R.H., Ed.; Sage Publications, Inc.: Thousand Oaks, CA, USA, 1995. [Google Scholar]
- West, S.G.; Finch, J.F.; Curran, P.J. Structural Equation Models with Nonnormal Variables: Problems and Remedies; Hoyle, R.H., Ed.; Sage Publications Inc.: Thousand Oaks, CA, USA, 1995. [Google Scholar]
- Hair Jr, J.F.; Hult, G.T.M.; Ringle, C.M.; Sarstedt, M. A primer on Partial Least Squares Structural Equation Modeling (PLS-SEM); Sage Publications Inc.: Thousand Oaks, CA, USA, 2021. [Google Scholar]
- Hair, J.F.; Risher, J.J.; Sarstedt, M.; Ringle, C.M. When to use and how to report the results of PLS-SEM. Eur. Bus. Rev. 2019, 31, 2–24. [Google Scholar] [CrossRef]
- Fornell, C.; Larcker, D.F. Evaluating structural equation models with unobservable variables and measurement error. J. Mark. Res. 1981, 18, 39–50. [Google Scholar] [CrossRef]
- Henseler, J.; Ringle, C.M.; Sarstedt, M. A new criterion for assessing discriminant validity in variance-based structural equation modeling. J. Acad. Mark. Sci. 2015, 43, 115–135. [Google Scholar] [CrossRef] [Green Version]
- Podsakoff, P.M.; MacKenzie, S.B.; Lee, J.Y.; Podsakoff, N.P. Common method biases in behavioral research: A critical review of the literature and recommended remedies. J. Appl. Psychol. 2003, 88, 879–903. [Google Scholar] [CrossRef]
- Tehseen, S.; Ramayah, T.; Sajilan, S. Testing and controlling for common method variance: A review of available methods. J. Manag. Sci. 2017, 4, 142–168. [Google Scholar] [CrossRef]
- Kock, N. Harman’s single factor test in PLS-SEM: Checking for common method bias. Data Anal. Perspect. J. 2021, 2, 1–6. [Google Scholar]
- Anson, I.G. Taking the time? Explaining effortful participation among low-cost online survey participants. Res. Politics 2018, 5, 1–8. [Google Scholar] [CrossRef] [Green Version]
- Weijters, B.; Geuens, M.; Schillewaert, N. The stability of individual response styles. Psychol. Methods 2010, 15, 96–110. [Google Scholar] [CrossRef] [Green Version]
- Salazar, M.S. The dilemma of combining positive and negative items in scales. Psicothema 2015, 27, 192–199. [Google Scholar] [CrossRef]
- Wong, K.K.K. Partial least squares structural equation modeling (PLS-SEM) techniques using SmartPLS. Mark. Bull. 2013, 24, 1–32. [Google Scholar]
- Hsu, S.H.; Chen, W.H.; Hsieh, M.J. Robustness testing of PLS, LISREL, EQS and ANN-based SEM for measuring customer satisfaction. Total Qual. Manag. Bus. Excell. 2006, 17, 355–372. [Google Scholar] [CrossRef]
- Chin, W.W. Partial Least Squares is to LISREL as principal components analysis is to common factor analysis. Technol. Stud. 1995, 2, 315–319. [Google Scholar]
- Farrell, A.M. Insufficient discriminant validity: A comment on Bove, Pervan, Beatty, and Shiu (2009). J. Bus. Res. 2010, 63, 324–327. [Google Scholar] [CrossRef] [Green Version]
- Cheung, G.W.; Rensvold, R.B. Evaluating goodness-of-fit indexes for testing measurement invariance. Struct. Equ. Model. 2002, 9, 233–255. [Google Scholar] [CrossRef]
- Marsh, H.W.; Hocevar, D. Application of confirmatory factor analysis to the study of self-concept: First-and higher order factor models and their invariance across groups. Psychol. Bull. 1985, 97, 562–582. [Google Scholar] [CrossRef]
- Henseler, J.; Chin, W.W. A comparison of approaches for the analysis of interaction effects between latent variables using partial least squares path modeling. Struct. Equ. Model. 2010, 17, 82–109. [Google Scholar] [CrossRef]
- Gössling, S.; Scott, D.; Hall, C.M. Pandemics, tourism and global change: A rapid assessment of COVID-19. J. Sustain. Tour. 2020, 29, 1–20. [Google Scholar] [CrossRef]
- Jarvis, C.B.; MacKenzie, S.B.; Podsakoff, P.M. A critical review of construct indicators and measurement model misspecification in marketing and consumer research. J. Consum. Res. 2003, 30, 199–218. [Google Scholar] [CrossRef]
- Zhang, J.C.; Byon, K.K.; Williams, A.S.; Huang, H. Effects of the event and its destination image on sport tourists’ attachment and loyalty to a destination: The cases of the Chinese and US Formula One Grand Prix. Asia Pac. J. Tour. Res. 2019, 24, 1169–1185. [Google Scholar] [CrossRef]
- Rihova, I.; Buhalis, D.; Moital, M.; Gouthro, M.B. Conceptualising customer-to-customer value co-creation in tourism. Intern. J. Tour. Res. 2015, 17, 356–363. [Google Scholar] [CrossRef]
- Assiouras, I.; Skourtis, G.; Giannopoulos, A.; Buhalis, D.; Koniordos, M. Value co-creation and customer citizenship behavior. Ann. Tour. Res. 2019, 78, 1–11. [Google Scholar] [CrossRef]
- Jones, C.W.; Byon, K.K.; Huang, H. Service quality, perceived value, and fan engagement: Case of Shanghai Formula One racing. Sport Mark. Q. 2019, 28, 63–76. [Google Scholar] [CrossRef] [Green Version]
- Sarstedt, M.; Hair, J.F.; Ringle, C.M.; Thiele, K.O.; Gudergan, S.P. Estimation issues with PLS and CBSEM: Where the bias lies! J. Bus. Res. 2016, 69, 3998–4010. [Google Scholar] [CrossRef] [Green Version]
- Bagozzi, R.P.; Yi, Y. Multitrait-multimethod matrices in consumer research. J. Consum. Res. 1991, 17, 426–439. [Google Scholar] [CrossRef]
Figure 1.
The hypothesized model.


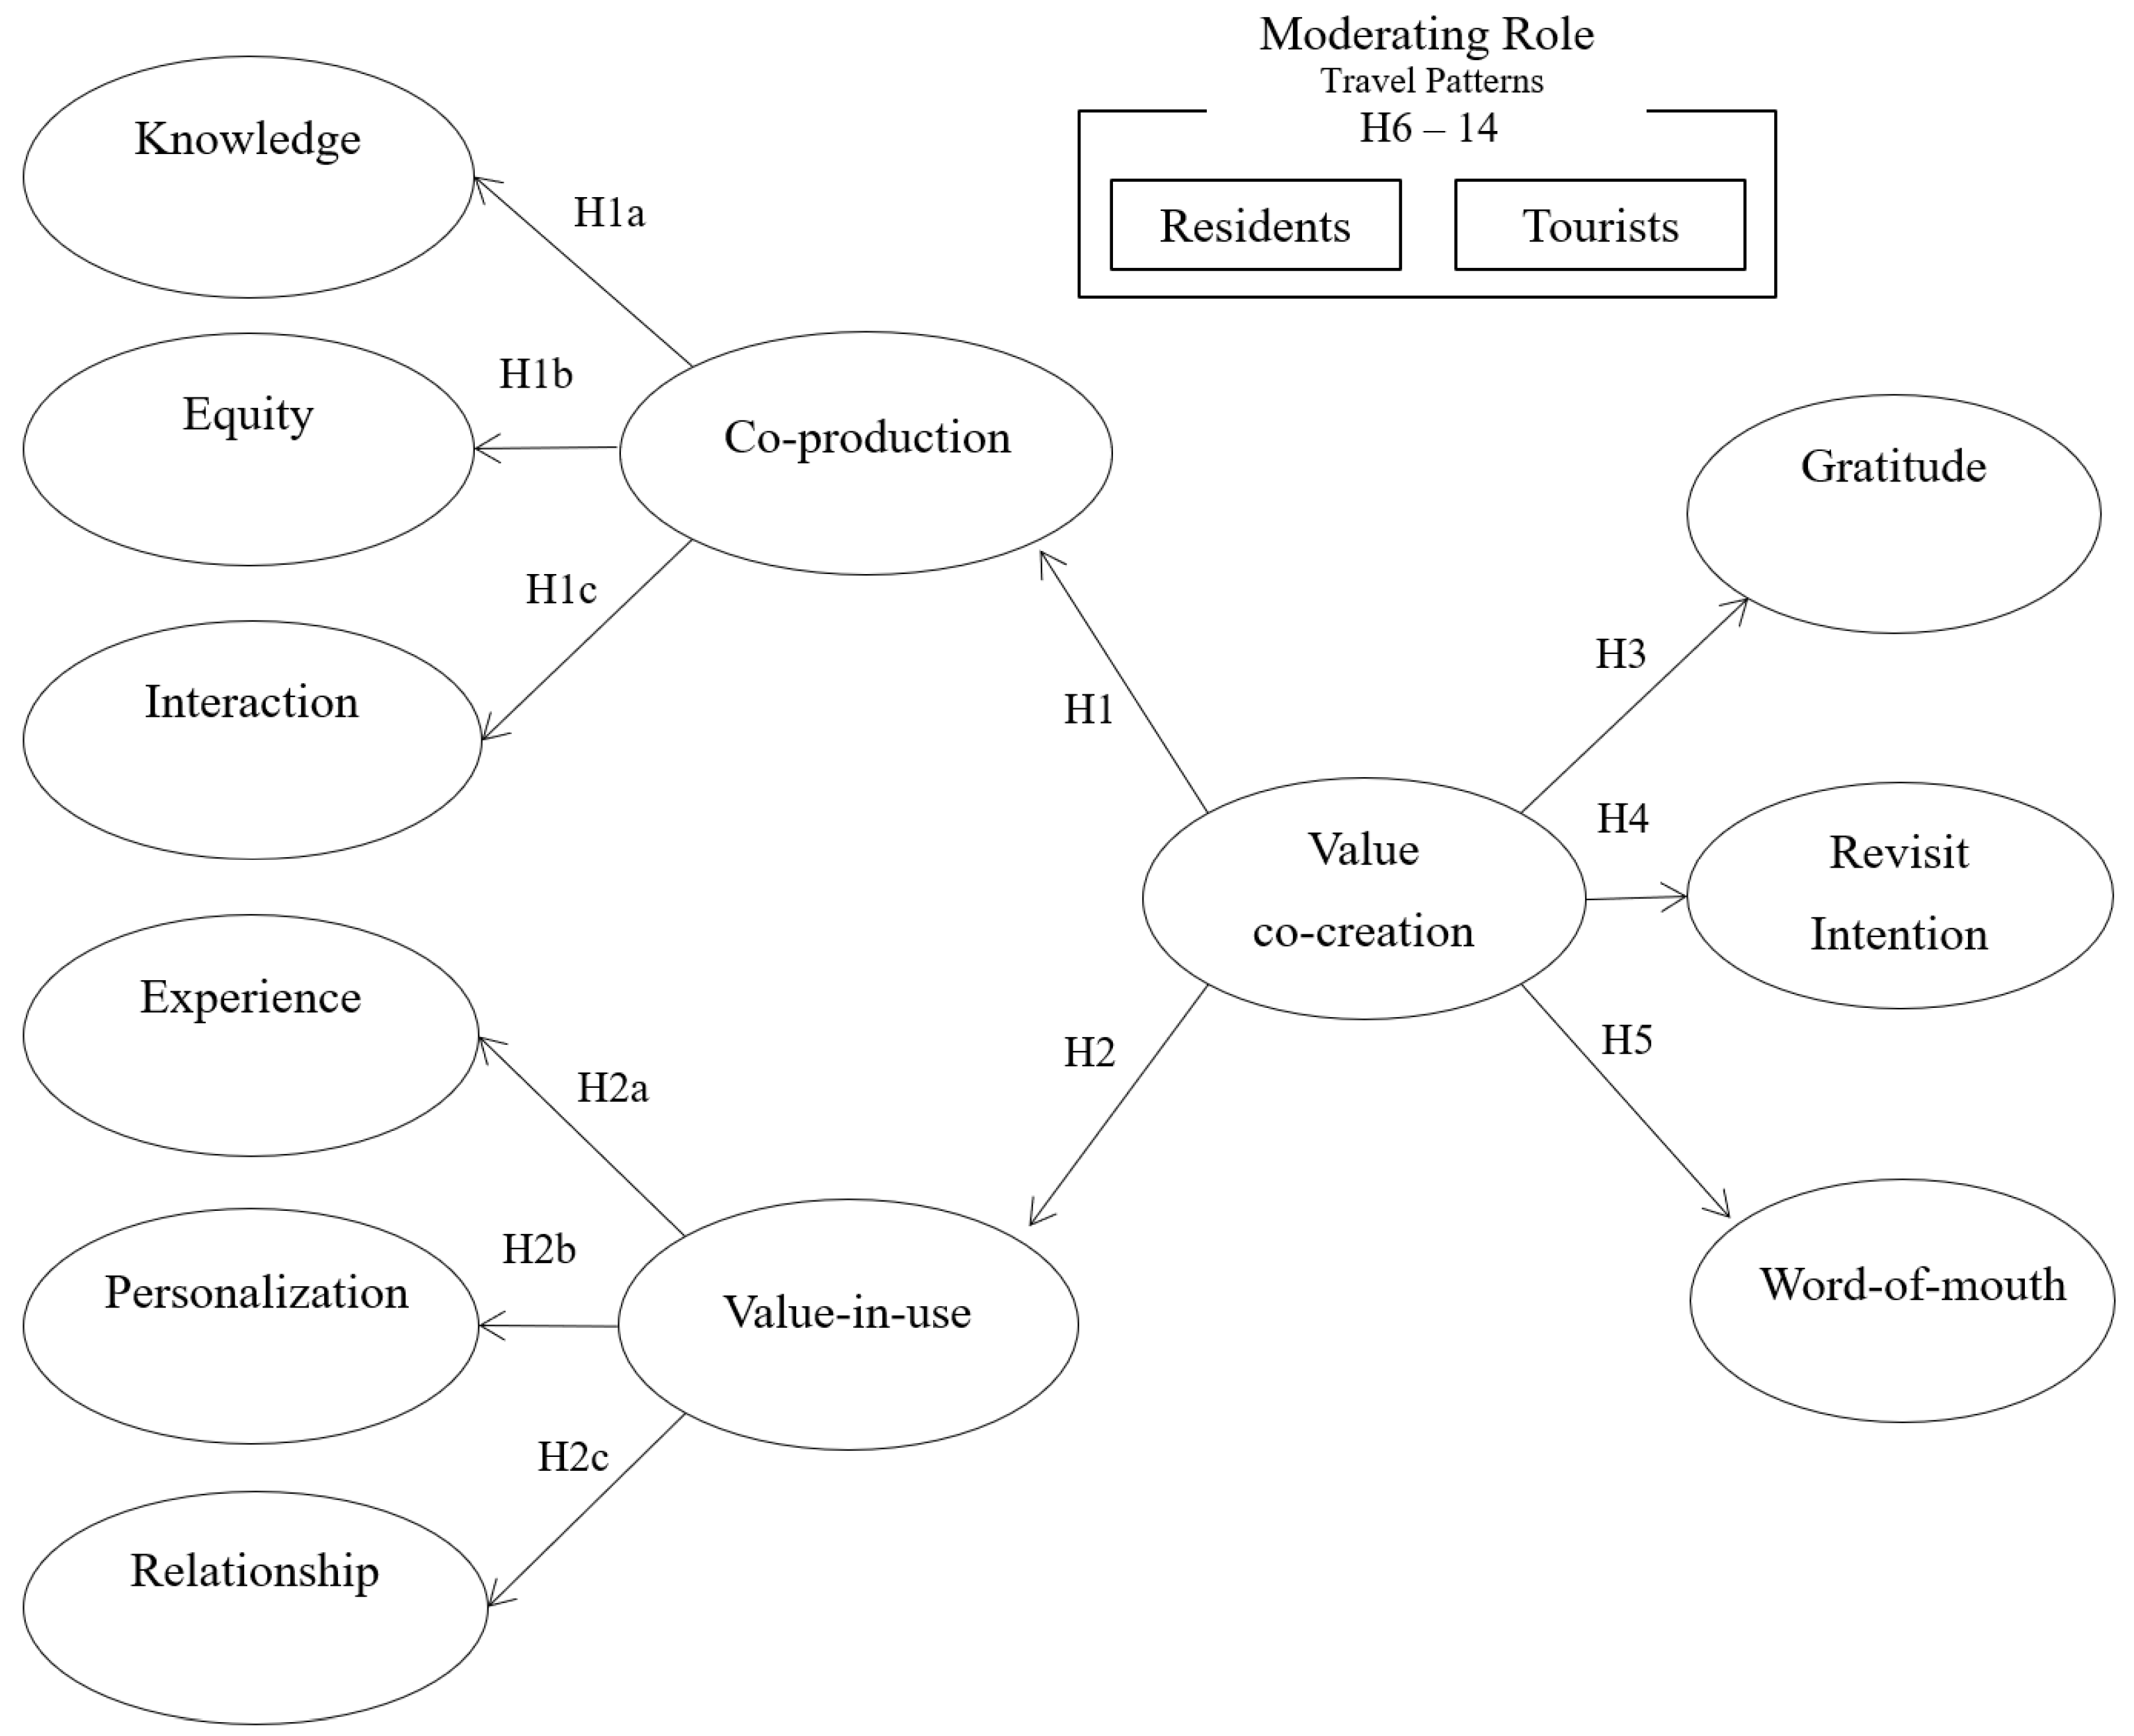
Table 1.
Indianapolis 500 (N = 56) inter-factor correlations, AVE, Cronbach’s alpha, and CR.
| Reflective Model | ||||||||||||
|---|---|---|---|---|---|---|---|---|---|---|---|---|
| KNLG | EQT | ITCT | EXPC | PSNZ | RLSP | COP | VIU | VCC | α | CR | AVE | |
| KNLG | 0.72 | 0.81 | 0.81 | 0.52 | ||||||||
| EQT | 0.77 | 0.77 | 0.85 | 0.86 | 0.60 | |||||||
| ITCT | 0.68 | 0.83 | 0.74 | 0.83 | 0.83 | 0.55 | ||||||
| EXPC | 0.64 | 0.75 | 0.74 | 0.75 | 0.79 | 0.79 | 0.57 | |||||
| PSNZ | 0.74 | 0.79 | 0.71 | 0.75 | 0.78 | 0.75 | 0.76 | 0.61 | ||||
| RLSP | 0.58 | 0.48 | 0.64 | 0.66 | 0.70 | 0.71 | 0.79 | 0.79 | 0.50 | |||
| COP | 0.88 | 0.95 | 0.92 | 0.78 | 0.81 | 0.62 | 0.71 | 0.89 | 0.90 | 0.51 | ||
| VIU | 0.74 | 0.76 | 0.79 | 0.90 | 0.90 | 0.86 | 0.83 | 0.71 | 0.83 | 0.87 | 0.50 | |
| VCC | 0.85 | 0.91 | 0.90 | 0.87 | 0.89 | 0.75 | 0.97 | 0.67 | 0.71 | 0.83 | 0.86 | 0.50 |
| Formative Model | ||||||||||||
| KNLG | EQT | ITCT | EXPC | PSNZ | RLSP | COP | VIU | VCC | α | CR | AVE | |
| KNLG | 0.72 | 0.81 | 0.81 | 0.52 | ||||||||
| EQT | 0.77 | 0.77 | 0.85 | 0.86 | 0.60 | |||||||
| ITCT | 0.68 | 0.83 | 0.74 | 0.83 | 0.83 | 0.55 | ||||||
| EXPC | 0.64 | 0.75 | 0.74 | 0.75 | 0.79 | 0.79 | 0.57 | |||||
| PSNZ | 0.74 | 0.79 | 0.71 | 0.75 | 0.78 | 0.75 | 0.76 | 0.61 | ||||
| RLSP | 0.58 | 0.48 | 0.64 | 0.66 | 0.70 | 0.71 | 0.79 | 0.79 | 0.50 | |||
| COP | 0.88 | 0.95 | 0.92 | 0.78 | 0.81 | 0.62 | 0.75 | 0.89 | 0.90 | 0.56 | ||
| VIU | 0.74 | 0.76 | 0.79 | 0.90 | 0.90 | 0.86 | 0.83 | 0.71 | 0.83 | 0.87 | 0.50 | |
| VCC | 0.85 | 0.91 | 0.90 | 0.87 | 0.89 | 0.75 | 0.97 | 0.67 | 0.71 | 0.83 | 0.86 | 0.50 |
Note. KNLG, knowledge; EQT, equity; ITCT, interaction; EXPC, experience; PSNZ, personalization; RLSP, relationship; COP, co-production; VIU, value-in-use; VCC, value co-creation; AVE, average variance extracted; CR, composite reliability. Diagonal (bold), square root of average variance extracted.
Table 2.
Indianapolis 500 (N = 56) HTMT ratio.
| Reflective Model | |||||||||
|---|---|---|---|---|---|---|---|---|---|
| KNLG | EQT | ITCT | EXPC | PSNZ | RLSP | COP | VIU | VCC | |
| KNLG | |||||||||
| EQT | 0.83 | ||||||||
| ITCT | 0.71 | 0.97 | |||||||
| EXPC | 0.69 | 0.88 | 0.83 | ||||||
| PSNZ | 0.85 | 0.87 | 0.78 | 0.84 | |||||
| RLSP | 0.63 | 0.42 | 0.75 | 0.77 | 0.59 | ||||
| COP | 1.01 | 1.06 | 1.04 | 0.85 | 0.91 | 0.67 | |||
| VIU | 0.77 | 0.81 | 0.86 | 1.06 | 1.10 | 1.05 | 0.89 | ||
| VCC | 0.94 | 0.98 | 0.99 | 0.97 | 1.02 | 0.86 | 1.03 | 1.04 | |
| Formative Model | |||||||||
| KNLG | EQT | ITCT | EXPC | PSNZ | RLSP | COP | VIU | VCC | |
| KNLG | |||||||||
| EQT | 0.83 | ||||||||
| ITCT | 0.71 | 0.97 | |||||||
| EXPC | 0.69 | 0.88 | 0.83 | ||||||
| PSNZ | 0.85 | 0.87 | 0.78 | 0.84 | |||||
| RLSP | 0.63 | 0.42 | 0.75 | 0.77 | 0.59 | ||||
| COP | 1.01 | 1.06 | 1.04 | 0.85 | 0.91 | 0.67 | |||
| VIU | 0.77 | 0.81 | 0.86 | 1.06 | 1.10 | 1.05 | 0.89 | ||
| VCC | 0.94 | 0.98 | 0.99 | 0.97 | 1.02 | 0.86 | 1.03 | 1.04 | |
Note. KNLG, knowledge; EQT, equity; ITCT, interaction; EXPC, experience; PSNZ, personalization; RLSP, relationship; COP, co-production; VIU, value-in-use; VCC, value co-creation.
Table 3.
Nomological validity of the value co-creation.
| Reflective Model (Formative Model) | |||
|---|---|---|---|
| Path Coefficient | SE | p-Value | |
| Value co-creation → Gratitude | 0.63 (0.63) | 0.07 (0.07) | <0.01 (<0.01) |
| Value co-creation → Revisit intentions | 0.45 (0.45) | 0.11 (0.11) | <0.01 (<0.01) |
| Value co-creation → Word of mouth | 0.70 (0.71) | 0.05 (0.05) | <0.01 (<0.01) |
| R2 | |||
| Gratitude | 0.392 (0.395) | ||
| Revisit intentions | 0.200 (0.201) | ||
| Word of mouth | 0.495 (0.496) | ||
Table 4.
Third-order reflective value co-creation model hypothesis tests.
| Weights of the First-Order Constructs on the Designated Second-Order Constructs | |||||||
|---|---|---|---|---|---|---|---|
| Indianapolis 500 (N = 56) | |||||||
| Second-Order Constructs | First-Order Constructs | Weight | t-Value | SD | 95% CI Lower Bound | 95% CI Upper Bound | |
| Hypothesis 1a | Co-production | Knowledge | 0.88 ** | 26.42 | 0.03 | 0.82 | 0.95 |
| Hypothesis 1b | Co-production | Equity | 0.95 ** | 60.95 | 0.02 | 0.91 | 0.98 |
| Hypothesis 1c | Co-production | Interaction | 0.92 ** | 39.95 | 0.02 | 0.87 | 0.96 |
| Hypothesis 2a | Value-in-use | Experience | 0.90 ** | 33.68 | 0.03 | 0.85 | 0.95 |
| Hypothesis 2b | Value-in-use | Personalization | 0.90 ** | 28.03 | 0.03 | 0.84 | 0.96 |
| Hypothesis 2c | Value-in-use | Relationship | 0.86 ** | 12.65 | 0.07 | 0.72 | 0.95 |
| Weights of the Second-Order Constructs on the Designated Third-Order Constructs | |||||||
| Third-Order Constructs | Second-Order Constructs | Weight | t-Value | SD | 95% CI Lower Bound | 95% CI Upper Bound | |
| Hypothesis 1 | Co-creation value | Co-production | 0.97 ** | 71.96 | 0.01 | 0.95 | 0.98 |
| Hypothesis 2 | Co-creation value | Value-in-use | 0.94 ** | 67.06 | 0.01 | 0.91 | 0.97 |
Note: ** p < 0.01.
Table 5.
Third-order inter-factor correlations, AVE, descriptive statistics, Cronbach’s alpha, and CR (N = 355).
Table 5.
Third-order inter-factor correlations, AVE, descriptive statistics, Cronbach’s alpha, and CR (N = 355).
| VCC | GTT | ReV | WOM | Mean | SD | Skewness | Kurtosis | α | CR | AVE | |
|---|---|---|---|---|---|---|---|---|---|---|---|
| VCC | 0.78 | 5.56 | 0.83 | −0.65 | 0.08 | 0.76 | 0.85 | 0.61 | |||
| GTT | 0.80 | 0.84 | 5.56 | 0.93 | −0.70 | 0.12 | 0.79 | 0.88 | 0.71 | ||
| ReV | 0.85 | 0.81 | 0.88 | 5.79 | 1.01 | −1.00 | 0.65 | 0.71 | 0.88 | 0.77 | |
| WOM | 0.84 | 0.83 | 0.82 | 0.85 | 5.78 | 0.94 | −0.57 | −0.37 | 0.80 | 0.88 | 0.72 |
Note. VCC, value co-creation; GTT, gratitude; ReV, revisit intentions; WOM = word of mouth; AVE, average variance extracted; CR, composite reliability. Diagonal (bold), square root of average variance extracted.
Table 6.
Results of hypotheses 1–2 in the third-order model.
| Coefficients of the First-Order Constructs on the Designated Second-Order Constructs | |||||||
|---|---|---|---|---|---|---|---|
| Residents (n = 181) | |||||||
| Second-Order Constructs | First-Order Constructs | Weight | t-Value | SD | 95% CI Lower Bound | 95% CI Upper Bound | |
| Hypothesis 1a | Co-production | Knowledge | 0.87 ** | 35.42 | 0.02 | 0.84 | 0.90 |
| Hypothesis 1b | Co-production | Equity | 0.93 ** | 75.54 | 0.02 | 0.91 | 0.95 |
| Hypothesis 1c | Co-production | Interaction | 0.95 ** | 85.45 | 0.01 | 0.92 | 0.96 |
| Hypothesis 2a | Value-in-use | Experience | 0.90 ** | 46.30 | 0.02 | 0.87 | 0.93 |
| Hypothesis 2b | Value-in-use | Personalization | 0.93 ** | 76.39 | 0.01 | 0.91 | 0.95 |
| Hypothesis 2c | Value-in-use | Relationship | 0.94 ** | 83.97 | 0.01 | 0.92 | 0.96 |
| Coefficients of the Second-Order Constructs on the Designated Third-Order Constructs | |||||||
| N = 355 | |||||||
| Third-Order Constructs | Second-Order Constructs | Weight | t-Value | SD | 95% CI Lower Bound | 95% CI Lpper Bound | |
| Hypothesis 1 | Co-creation value | Co-production | 0.93 ** | 48.39 | 0.02 | 0.89 | 0.95 |
| Hypothesis 2 | Co-creation value | Value-in-use | 0.96 ** | 95.32 | 0.01 | 0.94 | 0.98 |
Note: ** p < 0.01.
Table 7.
Structural estimates (hypotheses testing).
| Hypotheses | Beta | t-Value | 95% CI Lower Bound | 95% CI Upper Bound | Decision |
|---|---|---|---|---|---|
| H3: VCC → GTT | 0.87 ** | 44.57 | 0.81 | 0.97 | supported |
| H4: VCC → ReV | 0.89 ** | 48.45 | 0.82 | 0.98 | supported |
| H5: VCC → WOM | 0.82 ** | 41.82 | 0.78 | 0.98 | supported |
Note: ** p < 0.01; VCC, value co-creation; GTT, gratitude; ReV, revisit intentions; WOM, word of mouth.
Table 8.
Goodness-of-fit Indices for invariance models.
| First-Order Factor Invariance Tests | |||||||||
|---|---|---|---|---|---|---|---|---|---|
| Models | χ2 | df | χ2/df | RMSEA | CFI | TLI | ΔCFI | ΔRMSEA | Δχ2 |
| Configural invariance | 2060.42 | 796 | 2.59 | 0.057 | 0.925 | 0.882 | / | / | / |
| Metric invariance | 2161.08 | 828 | 2.61 | 0.058 | 0.921 | 0.880 | 0.004 | 0.001 | Δχ2 (32) = 100.66, p < 0.01 |
| Scalar invariance | 2221.11 | 851 | 2.61 | 0.058 | 0.920 | 0.879 | 0.001 | 0.000 | Δχ2 (23) = 80.86, p < 0.01 |
| Third-Order Factor Invariance Tests | |||||||||
| Models | χ2 | df | χ2/df | RMSEA | CFI | TLI | ΔCFI | ΔRMSEA | Δχ2 |
| Configural invariance | 2188.19 | 842 | 2.60 | 0.057 | 0.914 | 0.881 | / | / | / |
| Metric invariance | 2217.86 | 853 | 2.60 | 0.057 | 0.913 | 0.881 | 0.001 | 0.000 | Δχ2 (11) = 100.66, p < 0.01 |
| Scalar invariance | 2236.45 | 860 | 2.60 | 0.057 | 0.913 | 0.881 | 0.000 | 0.000 | Δχ2 (7) = 80.86, p < 0.01 |
Table 9.
Results of path differences between residents and tourists.
| Path | Residents Path Coefficients | Tourists Path Coefficients | Resident & Tourists Difference | Chi-Square Difference | p-Value (Residents vs. Sport Tourists) | Results | |
|---|---|---|---|---|---|---|---|
| H6 | COP → Knowledge | 0.90 | 0.86 | 0.04 | Δχ2 (1) = 12.51 | 0.01 | Supported |
| H7 | COP → Equity | 0.96 | 0.92 | 0.04 | Δχ2 (1) = 5.58 | 0.02 | Supported |
| H8 | COP → Interaction | 0.97 | 0.93 | 0.04 | Δχ2 (1) = 6.01 | 0.01 | Supported |
| H9 | VIU → Experience | 0.94 | 0.88 | 0.06 | Δχ2 (1) = 4.26 | 0.04 | Supported |
| H10 | VIU → personalization | 0.94 | 0.93 | 0.01 | Δχ2 (1) = 0.06 | 0.80 | Rejected |
| H11 | VIU → relationship | 0.96 | 0.93 | 0.02 | Δχ2 (1) = 0.27 | 0.60 | Rejected |
| H12 | VCC → GTT | 0.95 | 0.92 | 0.03 | Δχ2 (1) = 2.90 | 0.09 | Rejected |
| H13 | VCC → ReV | 0.99 | 0.95 | 0.04 | Δχ2 (1) = 6.57 | 0.01 | Supported |
| H14 | VCC → WOM | 0.84 | 0.78 | 0.06 | Δχ2 (1) = 1.87 | 0.17 | Rejected |
Note. COP, co-production; VIU, value-in-use; VCC, value co-creation; GTT, gratitude; ReV, revisit intentions; WOM, word of mouth.
Publisher’s Note: MDPI stays neutral with regard to jurisdictional claims in published maps and institutional affiliations. |
© 2022 by the authors. Licensee MDPI, Basel, Switzerland. This article is an open access article distributed under the terms and conditions of the Creative Commons Attribution (CC BY) license (https://creativecommons.org/licenses/by/4.0/).
Share and Cite
MDPI and ACS Style
Byon, K.K.; Zhang, J.; Jang, W. Examining the Value Co-Creation Model in Motor Racing Events: Moderating Effect of Residents and Tourists. Sustainability 2022, 14, 9648. https://doi.org/10.3390/su14159648
AMA Style
Byon KK, Zhang J, Jang W. Examining the Value Co-Creation Model in Motor Racing Events: Moderating Effect of Residents and Tourists. Sustainability. 2022; 14(15):9648. https://doi.org/10.3390/su14159648
Chicago/Turabian StyleByon, Kevin K., Jingxian (Cecilia) Zhang, and Wooyoung (William) Jang. 2022. "Examining the Value Co-Creation Model in Motor Racing Events: Moderating Effect of Residents and Tourists" Sustainability 14, no. 15: 9648. https://doi.org/10.3390/su14159648
Note that from the first issue of 2016, this journal uses article numbers instead of page numbers. See further details here.