
The Influence of Mixing Degree between Coarse and Fine Particles on the Strength of Offshore and Coast Foundations


1
School of Civil Engineering, Hunan University of Science and Technology, Xiangtan 411201, China
2
School of Civil Engineering, Central South University, Changsha 410075, China
3
School of Civil Engineering, Lanzhou Jiaotong University, Lanzhou 730070, China
4
Hunan Province Key Laboratory of Geotechnical Engineering Stability Control and Health Monitoring, Hunan University of Science and Technology, Xiangtan 411201, China
5
Department of Civil Engineering, Ahmadu Bello University, Zaria 810107, Nigeria
6
Department of P.E., Central South University, Changsha 410075, China
7
China State Construction Railway Investment & Engineering Group Co., Ltd., Beijing 102600, China
*
Author to whom correspondence should be addressed.
Sustainability 2022, 14(15), 9177; https://doi.org/10.3390/su14159177
Submission received: 9 June 2022
/
Revised: 12 July 2022
/
Accepted: 20 July 2022
/
Published: 27 July 2022
(This article belongs to the Special Issue Marine Geotechnical Engineering and Marine Civil Engineering Construction)
Abstract
:The variability in strata of foundation soil in marine environments makes it tedious to design foundations for offshore structures. Hence, it is essential to investigate and evaluate the strength properties of this type of soil. This study investigates the variability of the soil strata (which is quantified by the index of the mixing degree between coarse and fine particles) and its influence on the stability of the soil by mixing coarse and fine particles at varying proportions. A series of discrete element method triaxial shear tests were conducted on binary geotechnical mixtures with a varying proportion of coarse content (25%, 50% and 75%) and different mixing degrees (ranging from 0.0 to 1.0). The macroscopic results show that the peak shear strength increases with an increase in mixing degree, and the increase is more obvious with increasing coarse content, while the critical shear strength is independent of the mixing degree. The main evaluation of the number, mean normal force and distribution of the coarse–fine (cf) contact helps to clarify the meso-mechanisms that result in the variations in peak shear strength and critical shear strength with mixing degree. The increase in the peak strength may primarily be due to the increased number and globalized distribution of coarse–fine contact. However, the decreased contact force of coarse–fine contact counterbalances the strength gain due to the increased number and globalized distribution, which maintain the stability of the critical strength.
1. Introduction
Binary geotechnical mixtures are ubiquitous in nature, especially in marine geotechnical engineering. As the direct support of offshore or coastal facilities, it is important to consider the stability of binary geotechnical mixtures during the construction and operation of offshore and coastal installations [1]. For example, as one of the main foundation forms of marine structures, the bearing capacity of the soil around the pile must be considered in the calculation and design of the screw anchor [2]. However, the formation and evolution of binary geotechnical mixtures offshore or in coastal regions is a natural morphodynamic process, predominantly affected by currents, tides, waves, and even storm surges [3,4]. The complex formation process results in distinct stratification of the offshore and coastal soils, i.e., uneven mixing between coarse and fine particles. For example, the stratigraphical results from the Shetland Islands show distinct stratification of coarse and fine particles, which is confirmed to have been caused by three tsunamis between 8000 and 1500 years ago [5]; some artificial activities also create layered coastal foundations [6]. Previous studies have shown that the uniformity of mixing between particles affects the local and even the global properties of granular materials [7,8]. However, this effect has not been systematically studied in the aspect of foundation stability in marine geotechnical engineering. In other fields of geotechnical engineering, some researchers have begun to pay attention to the influence of the interparticle mixing degree on the strength of the mixture. Azéma et al. [7] analyzed the effect of the mixing degree on shear strength using the discrete element method (DEM). They reported that the shear strength was not affected by the mixing degree. Although, it was observed that they considered the mixing of only disks and rods of the same diameter in 2D, which cannot represent the actual difference in size between rock and soil particles observed in the binary geotechnical mixtures. Dong et al. [9] performed a strength analysis for a soil–rock mixture by preparing three specimens at different mixing proportions. However, they did not give the quantitative description of the mixing proportions; hence, their conclusions could not be applied to other projects.
Therefore, the variability of the soil strata was quantified by the index of mixing degree between coarse and fine particles. And the mixing degree index proposed by Liu et al. [10], which can be obtained by the simple analysis of borehole sampling results, was used in this study to guide the preparation of specimens in this paper. The strength analysis of gap-graded binary geotechnical mixtures under different mixing degrees was carried out using a verified DEM model, which is an effective way to study the mechanical and structural behaviors of binary geotechnical mixtures from a micromechanical perspective [11,12]. The macroscopic trend and meso-mechanism of the variation in strength with mixing degree was analyzed intuitively.
2. Index of Mixing Degree and DEM Model Verification Result
The calculation principle of the mixing degree index and the verification process of the DEM model have been described in detail by the authors in [10], which is more to validate the usefulness of mixing degree and the DEM model. The research object in [10] is for a loose sample generated by the limitation of experimental instruments, and is completely different from the compacted sample used to analyze the stability of subgrade in this paper. Therefore, only these two results are concisely described here.
2.1. Index of Mixing Degree
The greatest shortcoming of the existing indices is that obtaining particle information is difficult to realize in marine geotechnical engineering; for example, all of the particle positions [13], the local particle concentration [14], particle number ratio [15], relative position ratio [16], contact number ratio [17], and bed height ratio [18]. In marine geotechnical engineering, the most common way to obtain particle information is through borehole exploration, which can indicate the distribution of different particles along the depth direction. Thus, the most applicable mixing index for this field should be based on the information obtained from borehole exploration.
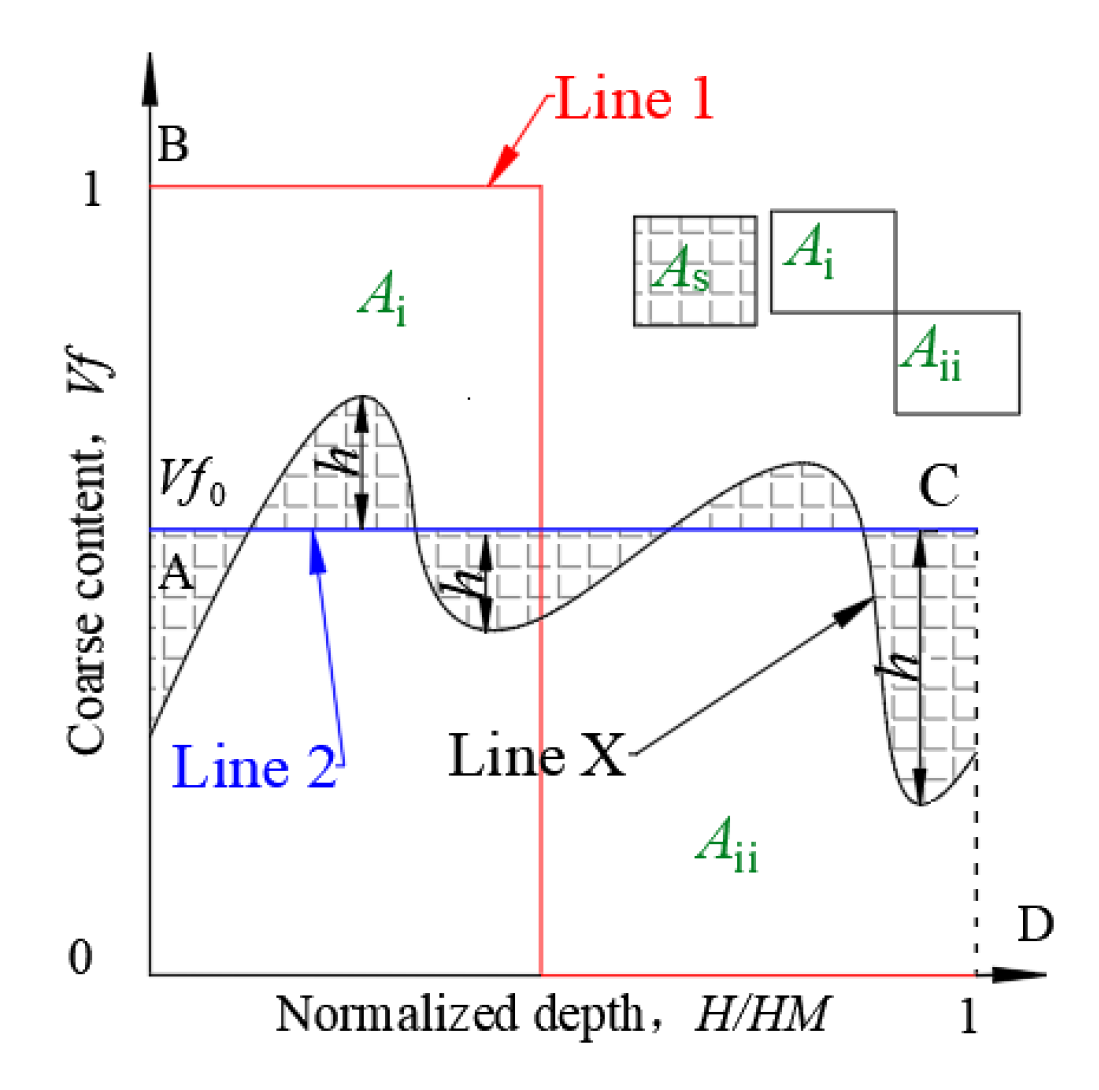
Hence, after the improvement based on the index of Dai et al. [19], a new index is proposed and illustrated in combination with Figure 1. Figure 1 shows the content of particle A (A represents one kind of particle in a binary mixture) as a function of normalized depth H/HM (H is the actual height when the content of particle A is Vf, and HM is the binary mixture height). When the content of particle A is assumed to be Vf0, Line 1 and Line 2 represent the two states of complete separation (Md = 0) and homogeneous mixing (Md = 1), respectively. Line X arbitrarily represents a mixing degree between 0 and 1. As long as a point on Line X does not perfectly coincide with Line 2, it is in the state of segregation, and the distance from this point to Line 2 directly reflects the degree of segregation at its corresponding height. Based on this principle, the improved mixing degree index adopted in this paper can be represented as follows:
where As is the area enclosed by Line 2 and Line X, and Ai and Aii represent the area of the upper left and lower right rectangles enclosed by Line 1, Line 2 and the coordinate axes, respectively.
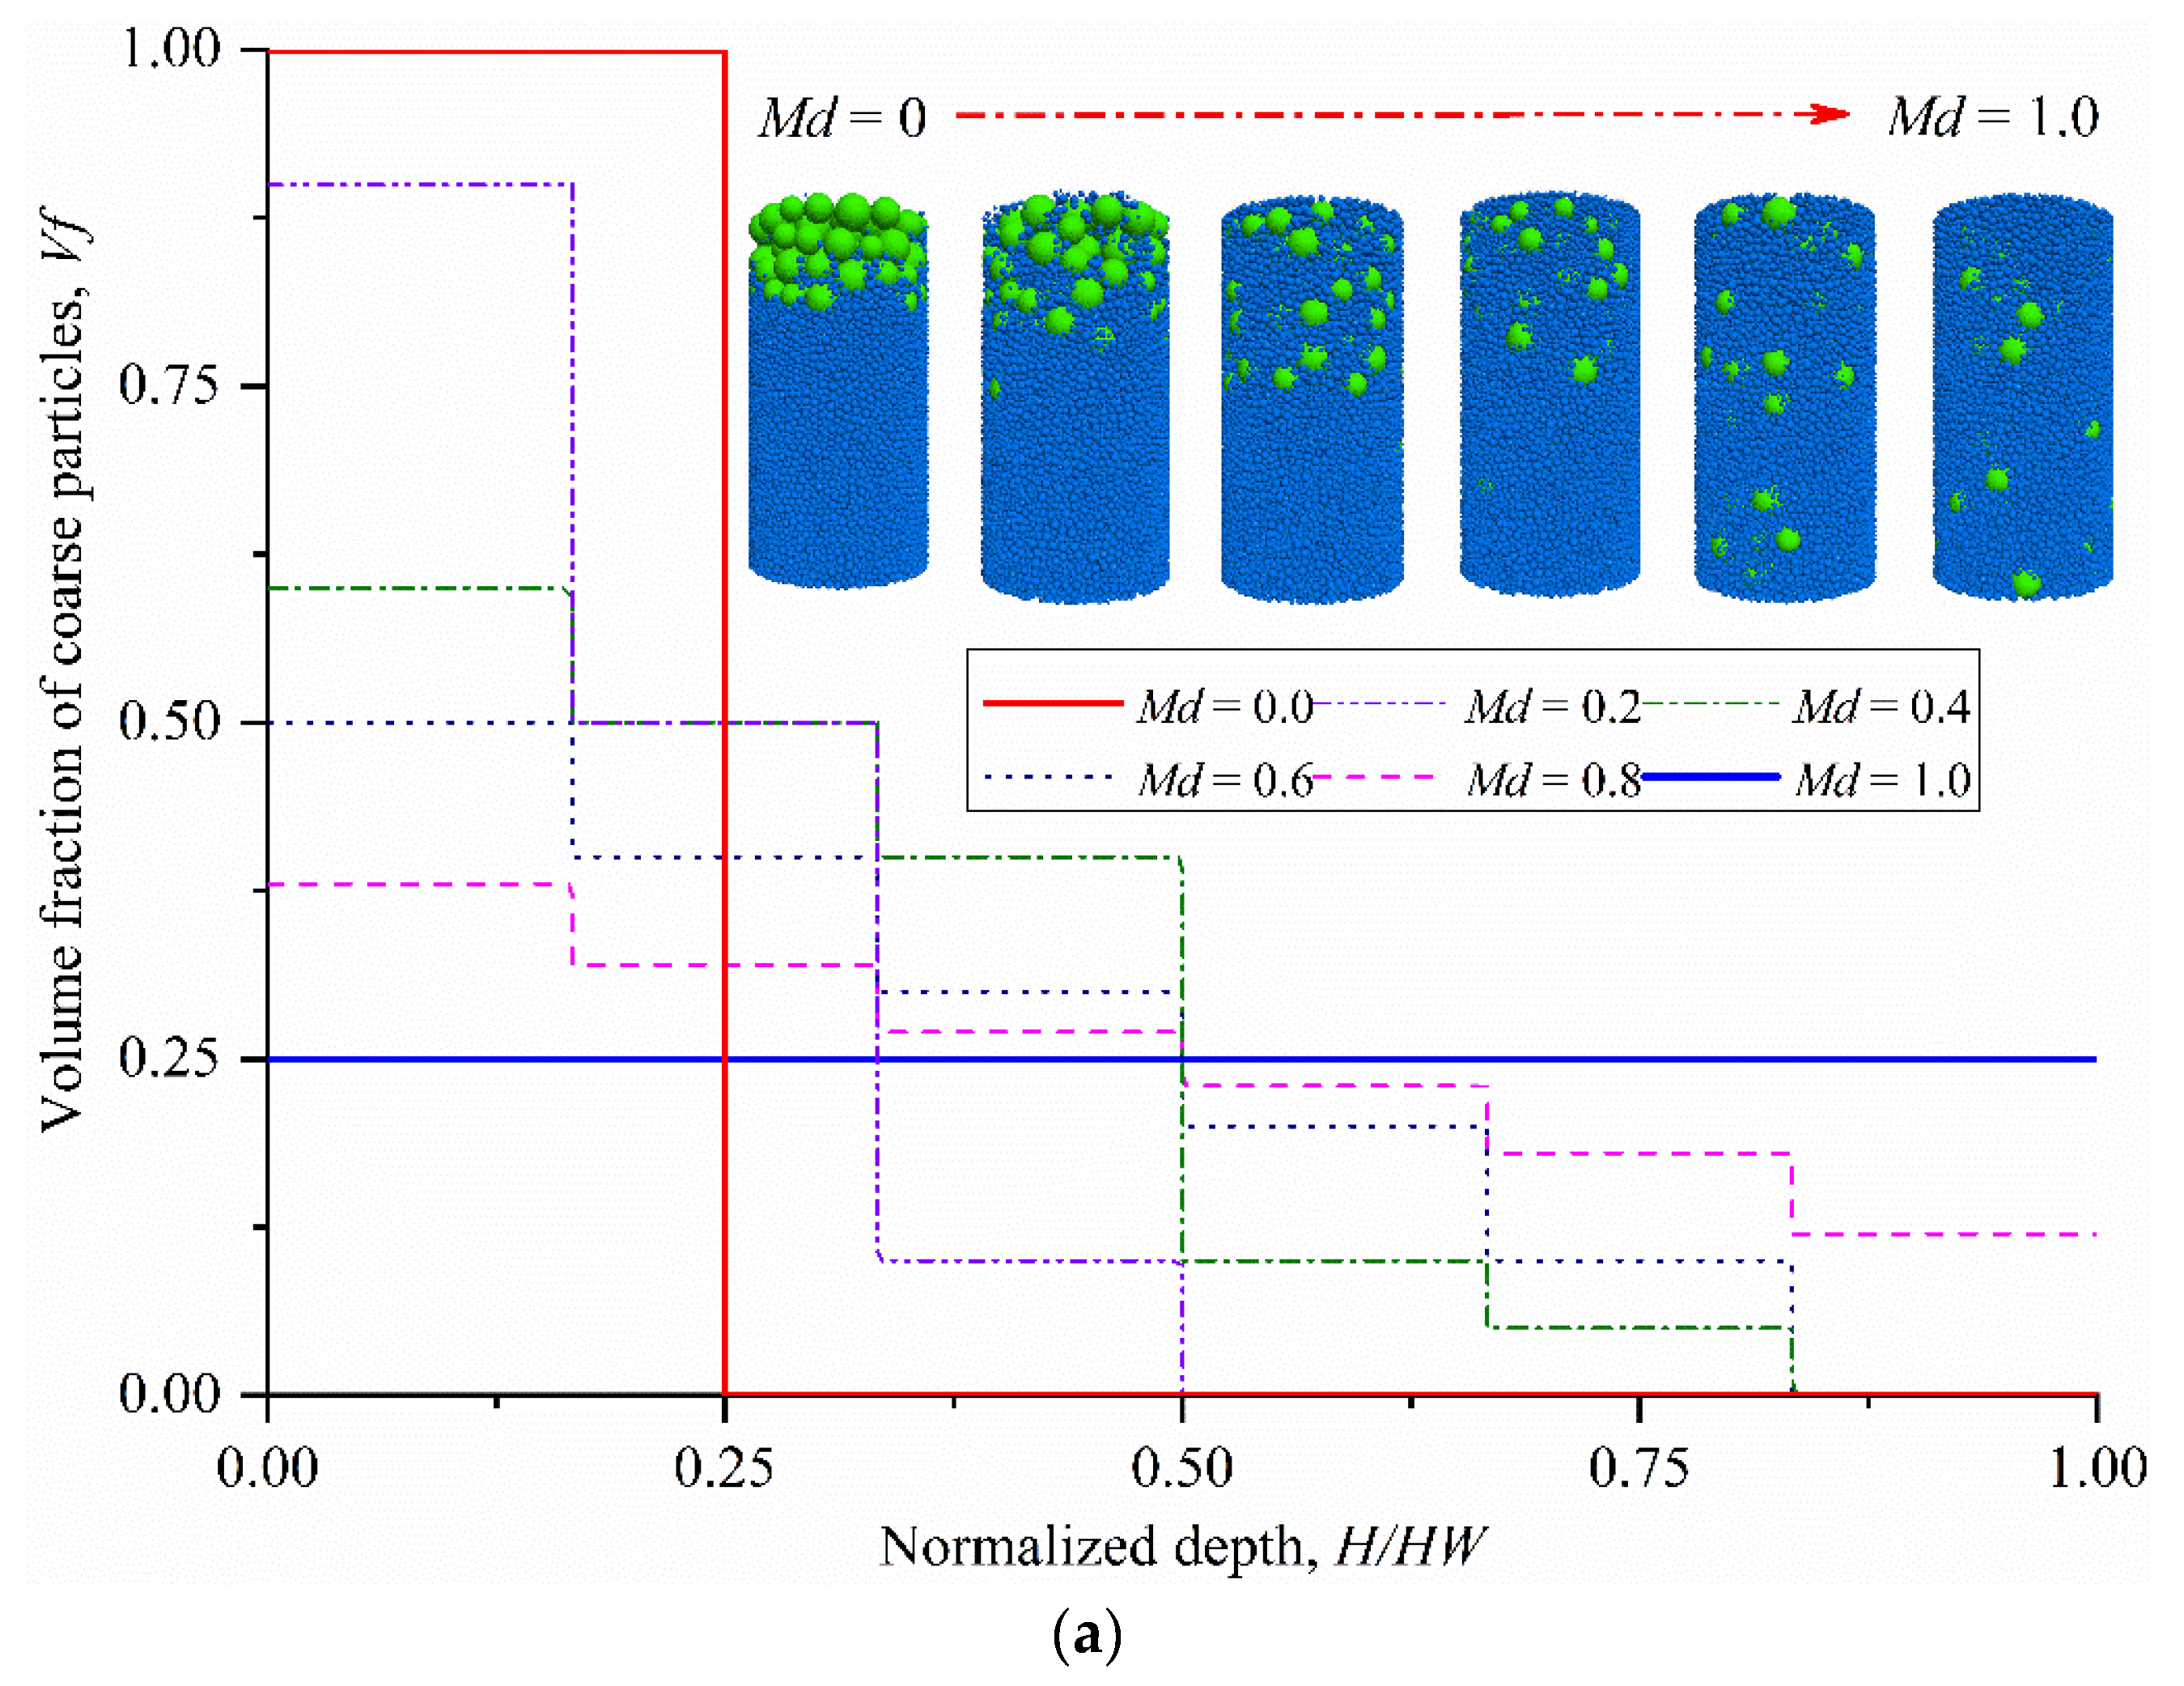
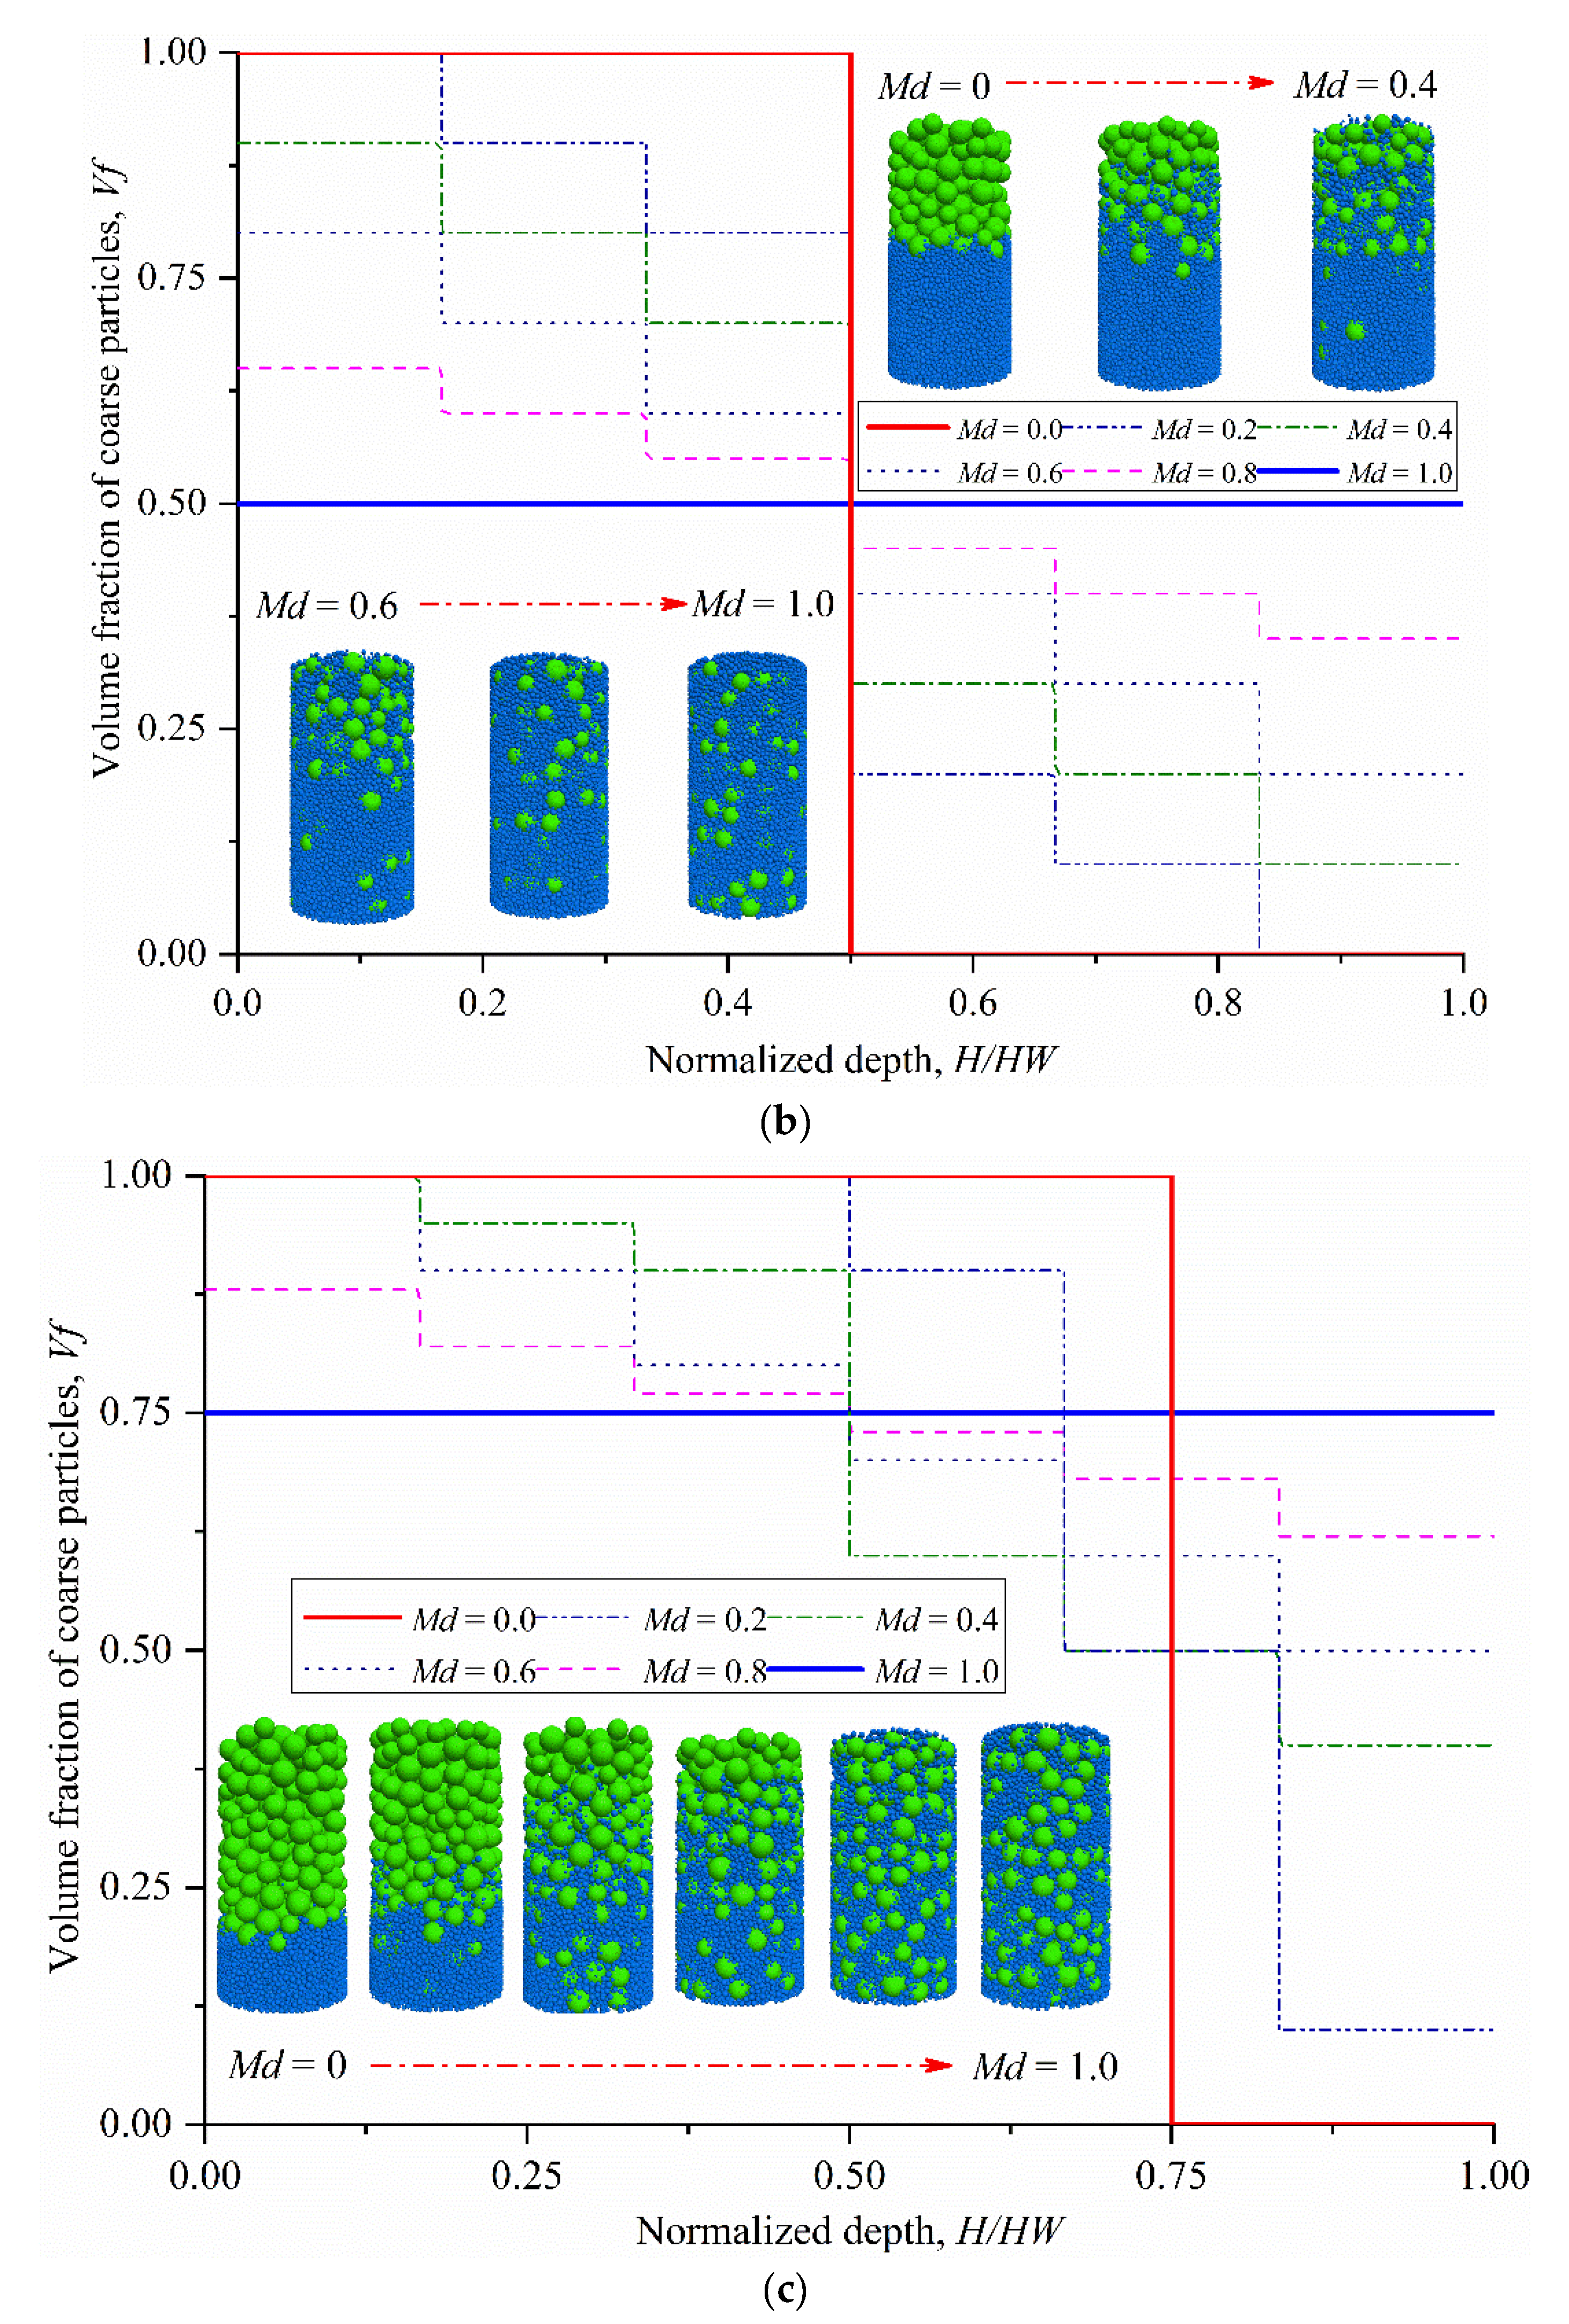
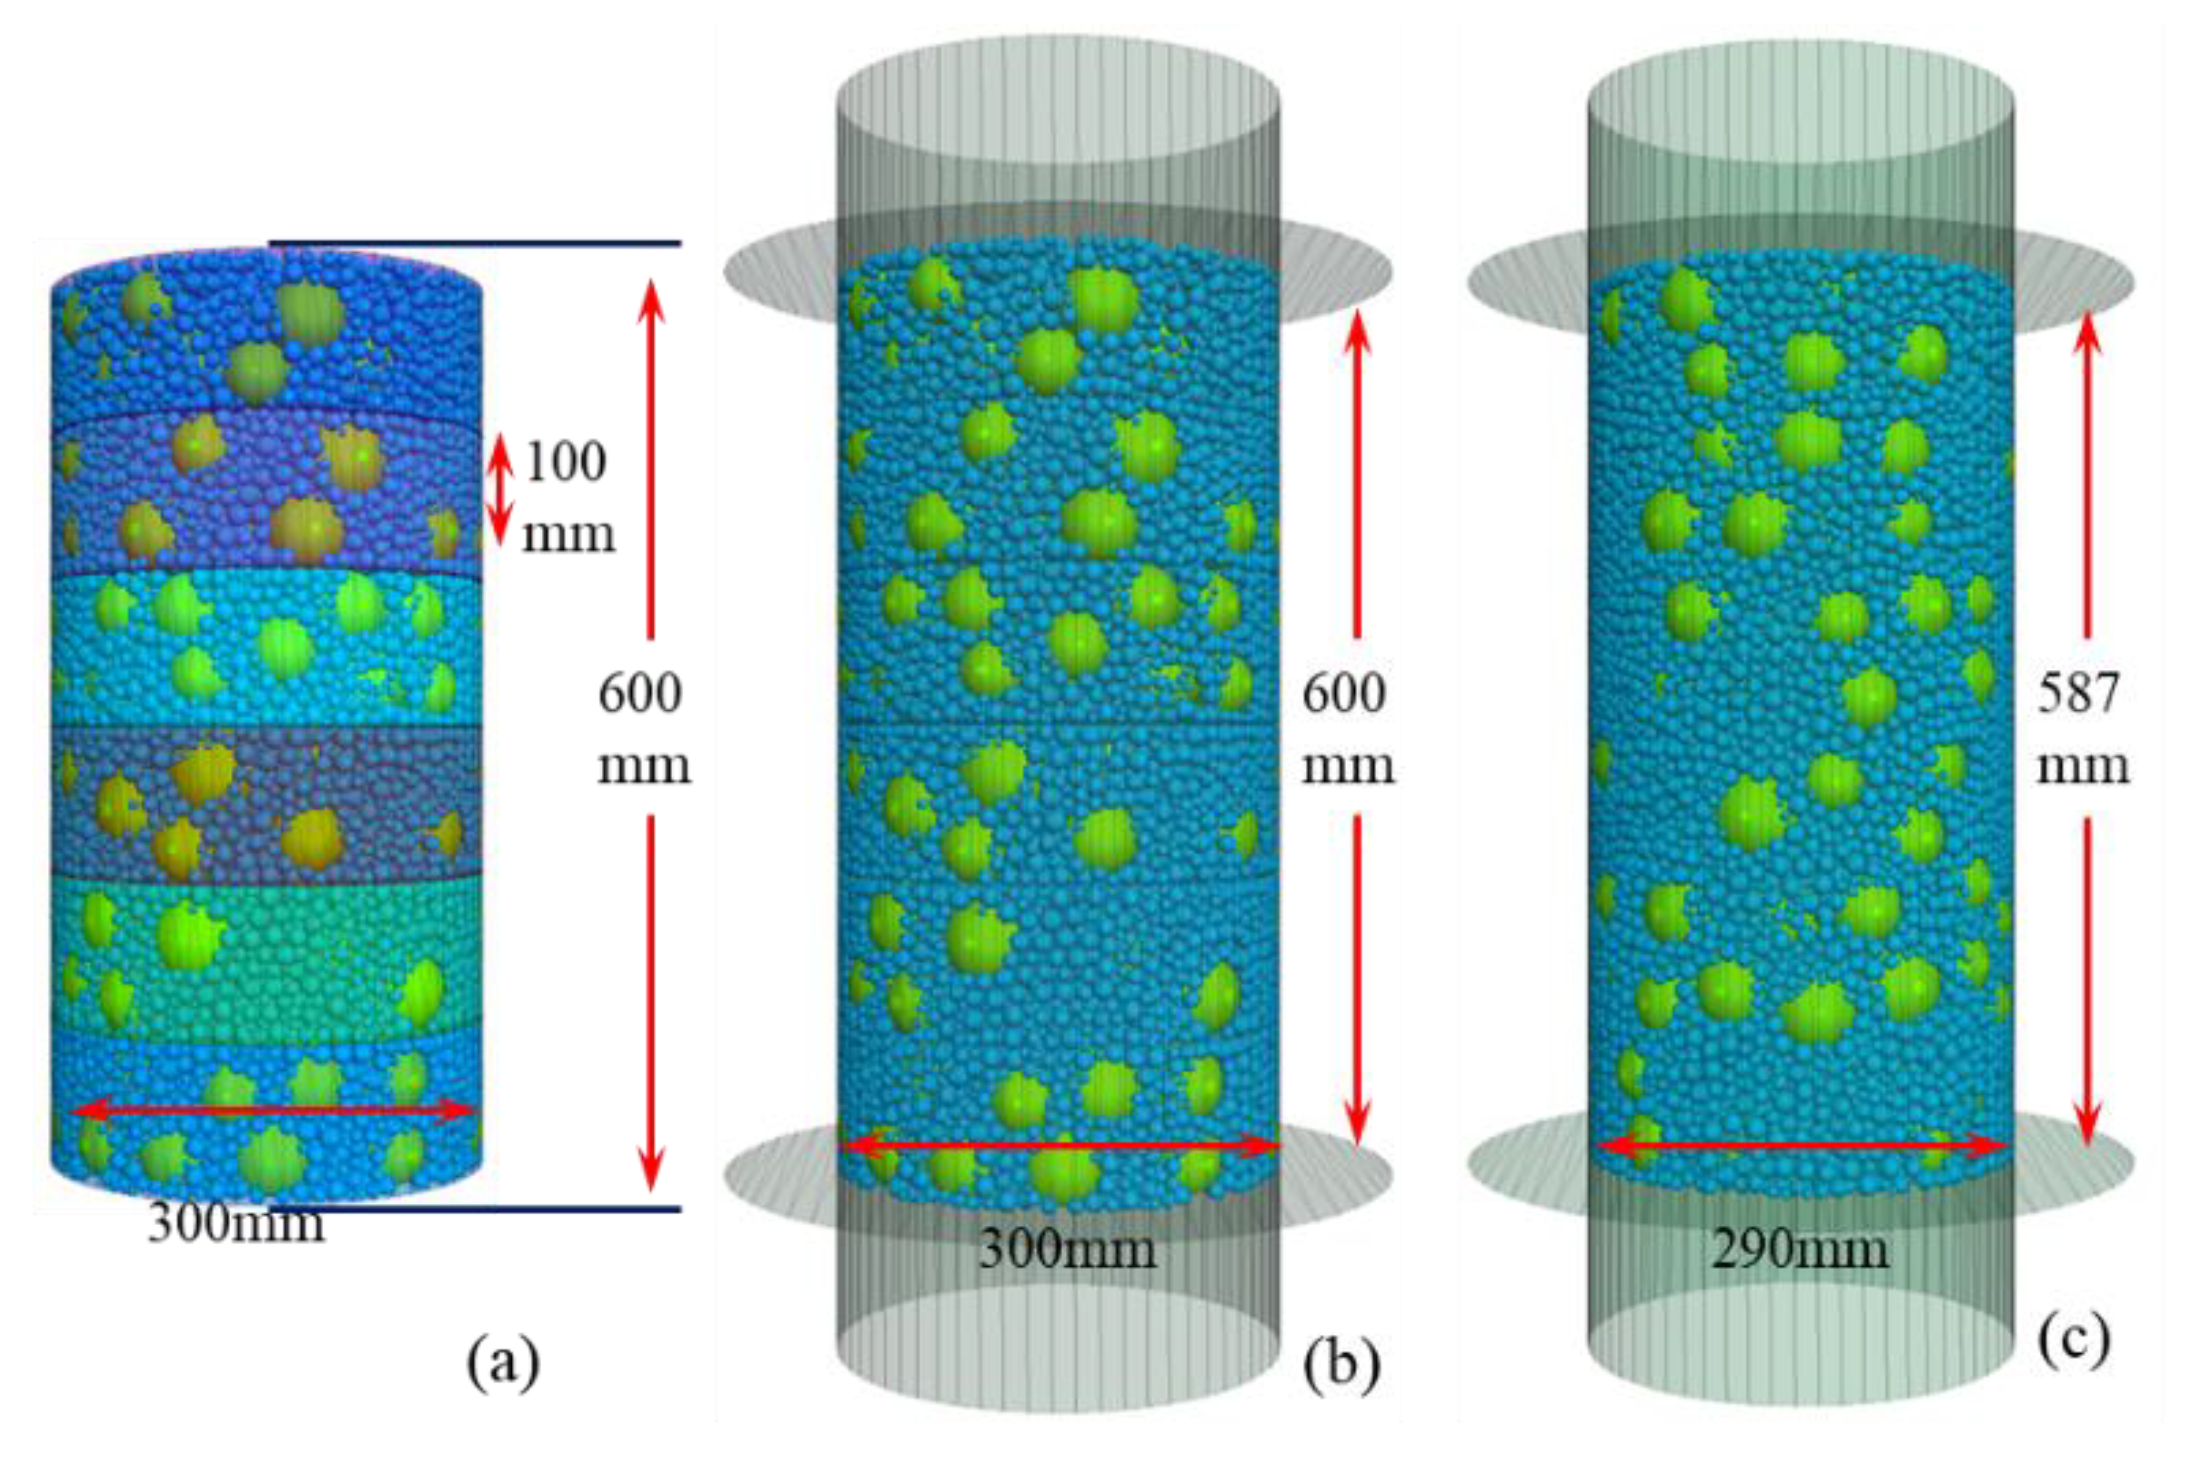
Several researchers have focused on the relationship between coarse particle content and shear strength of binary geotechnical mixtures [20,21,22]. The results show that when the coarse particles content of a binary geotechnical mixture is outside the range of 25–75%, the physical and mechanical properties of the binary geotechnical mixture are usually affected by only the fine or coarse particles. Therefore, the coarse content of the tested binary geotechnical mixture specimens were 25%, 50% and 75%. In addition, combined with the following test dimensions, the specimens tested using the numerical simulations in this paper were divided into six layers, on average, for preparation. The coarse content as a function of normalized depth H/HM and the prepared specimens are as shown in Figure 2.
2.2. DEM Model Verification Result
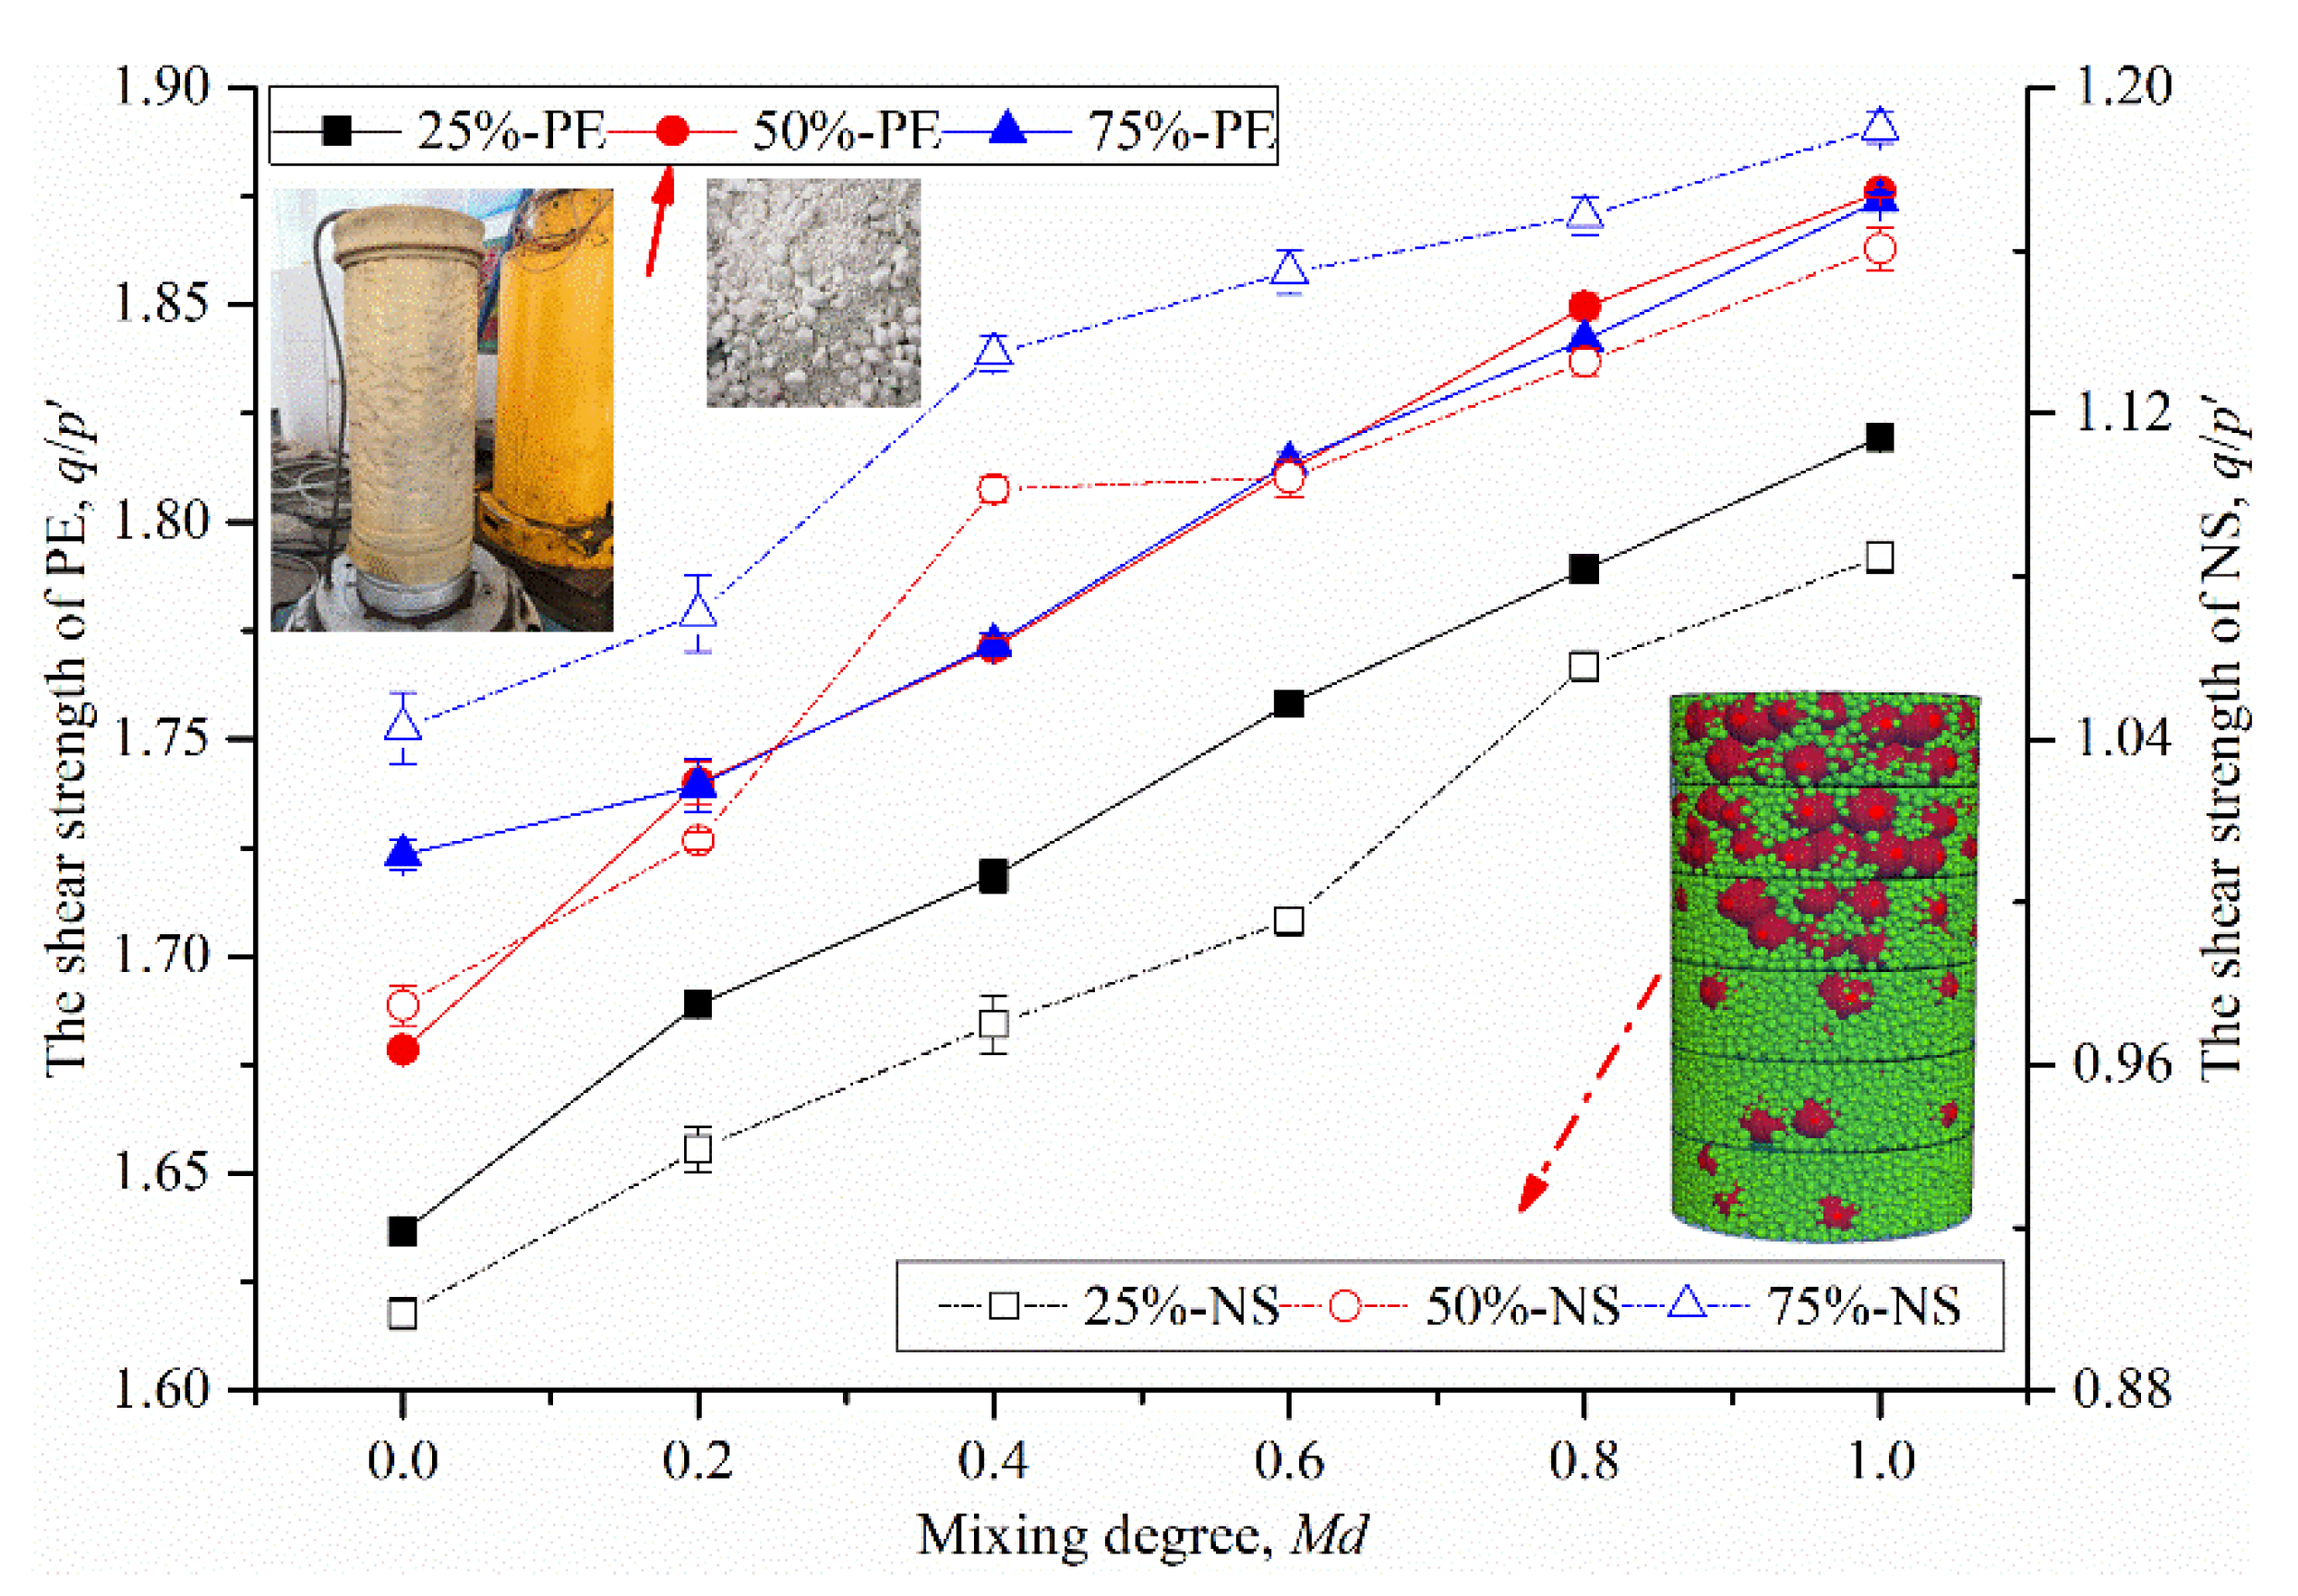
The reliability of the numerical simulation results were verified using PFC3D to reproduce large-scale triaxial tests. The samples were prepared from particle packings with different coarse particle contents (25%, 50% and 75%) and Md values (0.0, 0.2, 0.4, 0.6, 0.8 and 1.0). Both the simulation and physical experiments were carried out with the same specimen size, which was Φ × H = 300 mm × 600 mm (where Φ is the diameter and H is the height). The particles in the numerical simulation (NS) were spheres, and the particles used in the physical experiments (PE) were Yuhua pebbles, which have relatively smooth surfaces. According to previous numerical simulation findings, the particle size enlargement method has little influence on the mechanical behavior of the particle materials [23,24]. Therefore, considering both the size effect and calculation efficiency, the particle sizes assumed in the numerical simulations were doubled compared with those of the physical experiments. In the process of preparing samples for the physical experiments and numerical simulations, first, a mixture was made according to the Md index in Figure 2, which determines the coarse and fine particle contents in each layer. Then 18 samples are prepared from particle packings with three coarse particle contents (25%, 50% and 75%) and six Md values (0.0, 0.2, 0.4, 0.6, 0.8 and 1.0), respectively. The sample preparation process and quantity in Section 3 are similar. In the numerical simulation, the friction coefficient between particles was set as 0.6, which is consistent with the real particles and the calibration results in the physical experiment. This was also the main reason why the samples were relatively loose. The comparison results are as shown in Figure 3. For convenience, each sample is identified by test category and coarse content. For example, 75%-PE and 25%-NS represent physical experiment samples with a coarse content of 75% and numerical simulation samples with a coarse content of 25%, respectively.
Figure 3 shows that the shear strength q/p′ (where q is the deviatoric stress and p′ is the effective mean stress) increases with an increase in the mixing degree index. It can be observed that the increasing trends for both the physical experiment and numerical simulation results at the same mixing degree index are highly consistent. Although the q/p′ values in the physical experiments are higher than those in the numerical simulations by approximately 0.6–0.8, the result is acceptable when the shape factor is taken into account [22,23,24,25,26]. This is because the physical experiments used real particles, whose shapes deviate from spherical particles, while the numerical simulations use ideal spherical particles. Relevant studies have also proven that when the shape index of certain aggregate particles deviate from the spherical shape, generally, its shear strength is approximately 50% higher than that of spherical particles, with a maximum of 80% [25,26,27,28,29]. Therefore, it was appropriate to use these parameters in this paper to carry out numerical simulation and analyze the meso-mechanism of the influence of mixing degree on the shear strength of the studied binary geotechnical mixtures.
3. Specimen’s Properties and Simulation Parameters
3.1. Specimen’s Properties
The size and other parameters of the simulated specimens were exactly the same as those in the verification test, and the details are as follows. According to the research results of Medley [20] and Xu et al. [30], the soil/rock threshold was divided according to the limit of 0.05Lc (Lc is the minimum specimen size, normally 300 mm). Therefore, particles with a diameter of more than 15 mm were defined as “rock”, which are referred to as “coarse particles” in this paper, and particles with a diameter of less than or equal to 15 mm were defined as “soil”, which are referred to as “fine particles” in this paper. Therefore, considering both the size effect and calculation efficiency, the diameter of the coarse particles was 40–60 mm, and the diameter of the fine particles was 5–15 mm. Because the fine and coarse particle sizes were evenly distributed in their respective ranges, the average particle size ratio of the coarse and fine particles was 5, meeting the size requirements of crystallography. That is, when a fine particle could exactly fit in the void formed by four tangent coarse particles of the same size, the size ratio between them is 4.45 [31].
The preparation of a specimen was divided into three steps: (1) Six small closed cylinders with sizes Φ × H = 300 mm × 100 mm were generated and filled with particles according to the coarse contents listed in Figure 2. (2) All the particles were bound by an open cylinder, a bottom disk and a top disk, and then the small cylinders were removed. The initial contact forces and velocities were decreased to 0 for the 5 cycles before the 20000 test cycles, to eliminate the large contact forces between particles in steps (1) and (2), respectively. (3) The specimen was subjected to isotropic compression. Meanwhile, a servo-control mechanism acted on all the walls to ensure the required confining stress of 500 kPa. The assembly was considered to reach equilibration when the ratio of the mean static unbalanced force to the mean contact force was less than 10−5 and the tolerance of the stress from the walls was less than 0.5%. The details are shown in Figure 4, where Figure 4a–c corresponds to steps (1)–(3). The friction coefficients between the particle–particle and particle–wall contacts were set to 0 to obtain the densest assemblies [32], which correspond to the compacted aggregates.
The series of simulations were carried out using a simple linear force-displacement contact law, which resembled the Hertz–Mindlin model, in terms of both the microscopic and macroscopic mechanical behaviors of granular material with spherical and non-spherical particles [25,33]. It has been used in several previous studies [34,35,36]. For the linear model, the main microscopic parameters are the normal contact stiffness kn, shear contact stiffness ks and the coefficient of friction μb between particles. The kn and ks mainly affect the macroscopic elastic modulus of the particle aggregates and are assigned by the effective modulus Ec, based on the linear contact model in PFC3D (), where Ra and Rb are the radii of the spheres in contact. The μb mainly affects the shear strength. The selection of these parameters has been verified in [10], and the reliability has also been verified, as presented in Figure 3. Specifically, the effective modulus E* was 1 × 10⁹ Pa, the friction coefficient μb between particles was 0.6, the friction coefficient between the particles and wall was 0, the value of kn/ks was 4/3, the damping constant β was 0.7, and the particle density ρ was 2650 kg/m3.
Three coarse particle contents (25%, 50% and 75%) and six Md values (0.0, 0.2, 0.4, 0.6, 0.8 and 1.0) of assemblies were prepared at their densest condition for the generation procedure. Quantitative relationships between mixing degree and strength indices, as well as stress–strain relationships were investigated. In addition, the relationships between mixing degree and particle-scale characteristics, such as coordination number, fabric structure, contact types, contact numbers and forces, were studied. Moreover, the accuracy of the stress–force–fabric based on the branch vector frame was analyzed, and any fabric anisotropies affected by mixing degree were evaluated in the peak and critical states. This detailed analysis of fabric anisotropies allowed us to determine the microscopic mechanisms underlying the dependence of shear strength on mixing degree.
3.2. Simulation Parameters
In conventional triaxial tests, the effective mean stress (p′) and deviatoric stress (q) are respectively defined as:
where σ1 denotes the axial stress and σ2 = σ3 denote the lateral stresses. The axial strain (ε1) and the volumetric strain (εv) can be estimated from the boundary displacements:
where hi and hc are the initial height and current height of the specimen, respectively, and v0 and v are the initial volume and the current volume, respectively. The dilatancy angle (ψ) is defined in triaxial tests as follows:
The internal angle of friction (φ), which reflects the shear strength of granular materials, in the peak or critical state, can be defined as follows:
A positive correlation between the angle of internal friction (φ) and the effective stress ratio (q/p′) has been established, so it is appropriate to use q/p′ to represent the shear strength of the binary geotechnical mixtures.
4. Results and Analyses
4.1. Macroscopic Variation in Strength with Mixing Degree
4.1.1. Shear Strength
This study focused on quantifying the influence of the mixing degree on the macroscopic characteristics, especially the shear strength (q/p′), and identifying their relationship to the micro-characteristics, which cannot be observed in physical experiments. Hence, all of the assemblies were sheared to approximately 40% of ε1 to explore the macroscopic behaviors at both the peak and critical states.
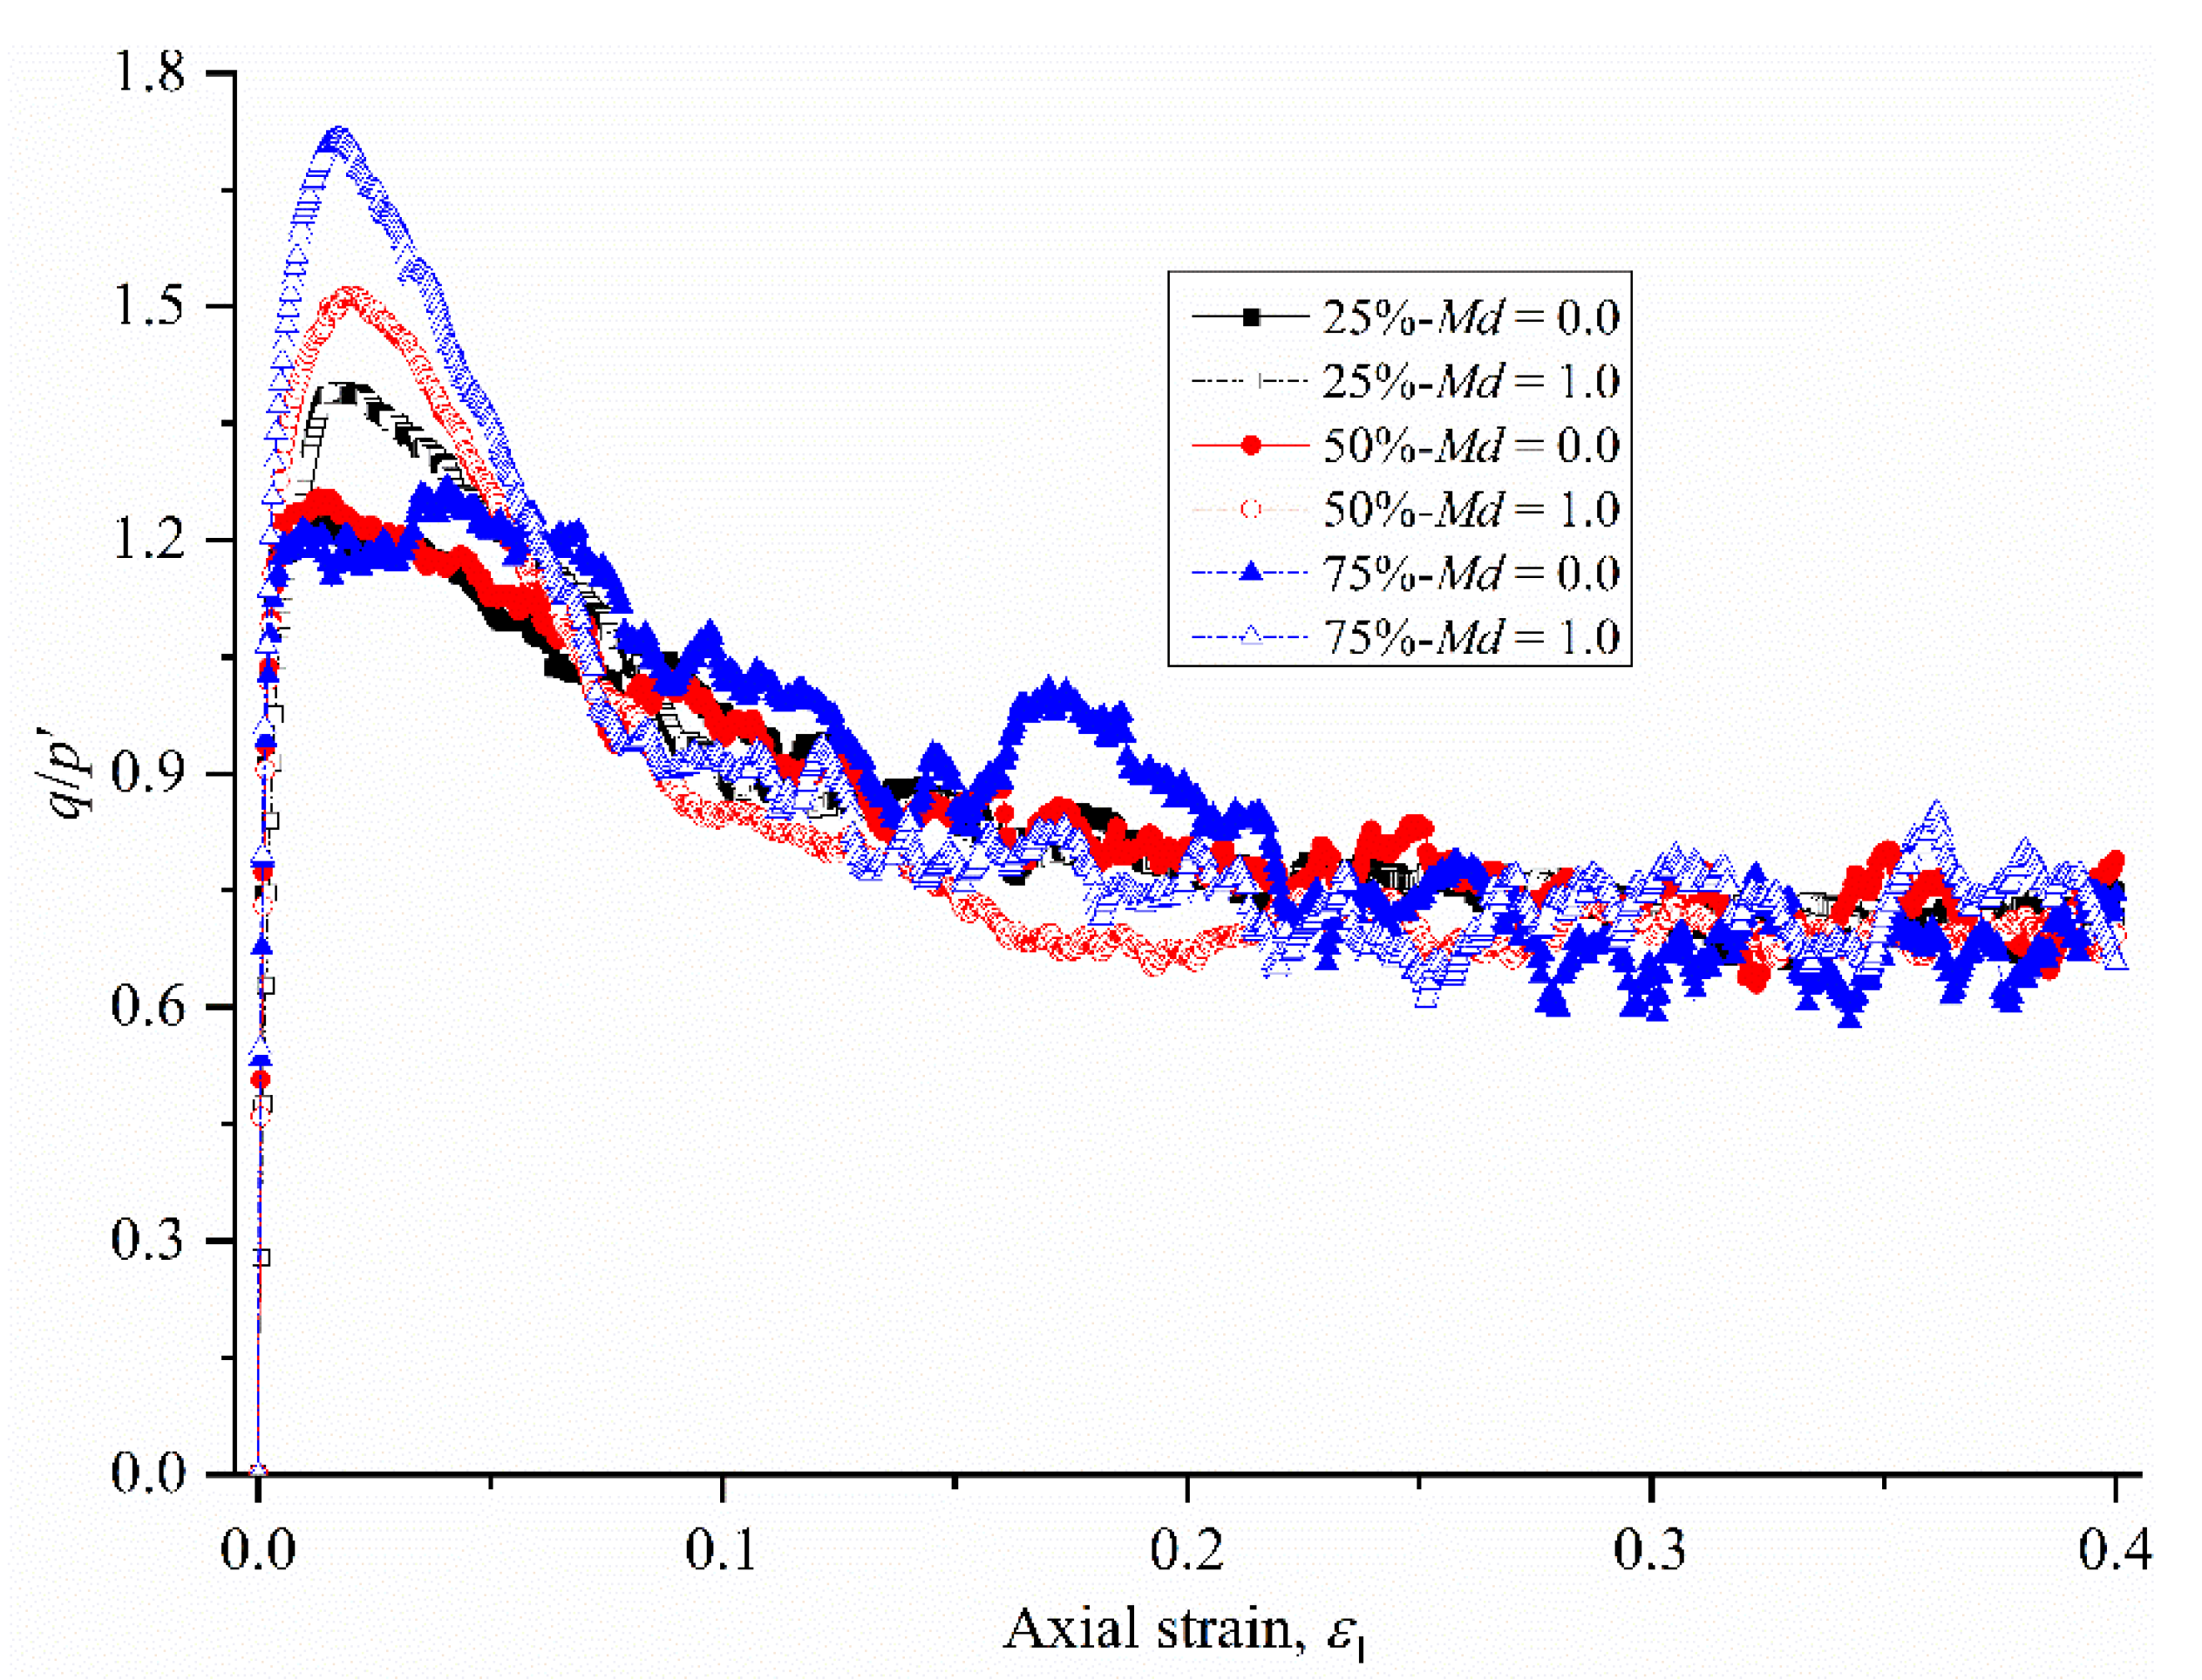
The relationships between the shear strength ratio (q/p′) and the axial strain ε1 for the various mixing degrees are presented in Figure 5. Since there is no quantitative analysis presented here and there will be a considerable amount of overlap if all 18 curves in this paper are presented, only the results of Md = 0.0 and Md = 1.0 for each tested coarse content are presented here. It can be observed that the q/p′ value rapidly rises to the peak value within a strain value (ε1) of 0.00–0.02, then gradually declines within ε1 = 0.02–0.15, and eventually approaches the critical state. When ε1 is greater than 0.30, the curve is more stable. Hence, the average value of q/p′ within the axial strain interval [0.30, 0.40] is taken as the critical strength.
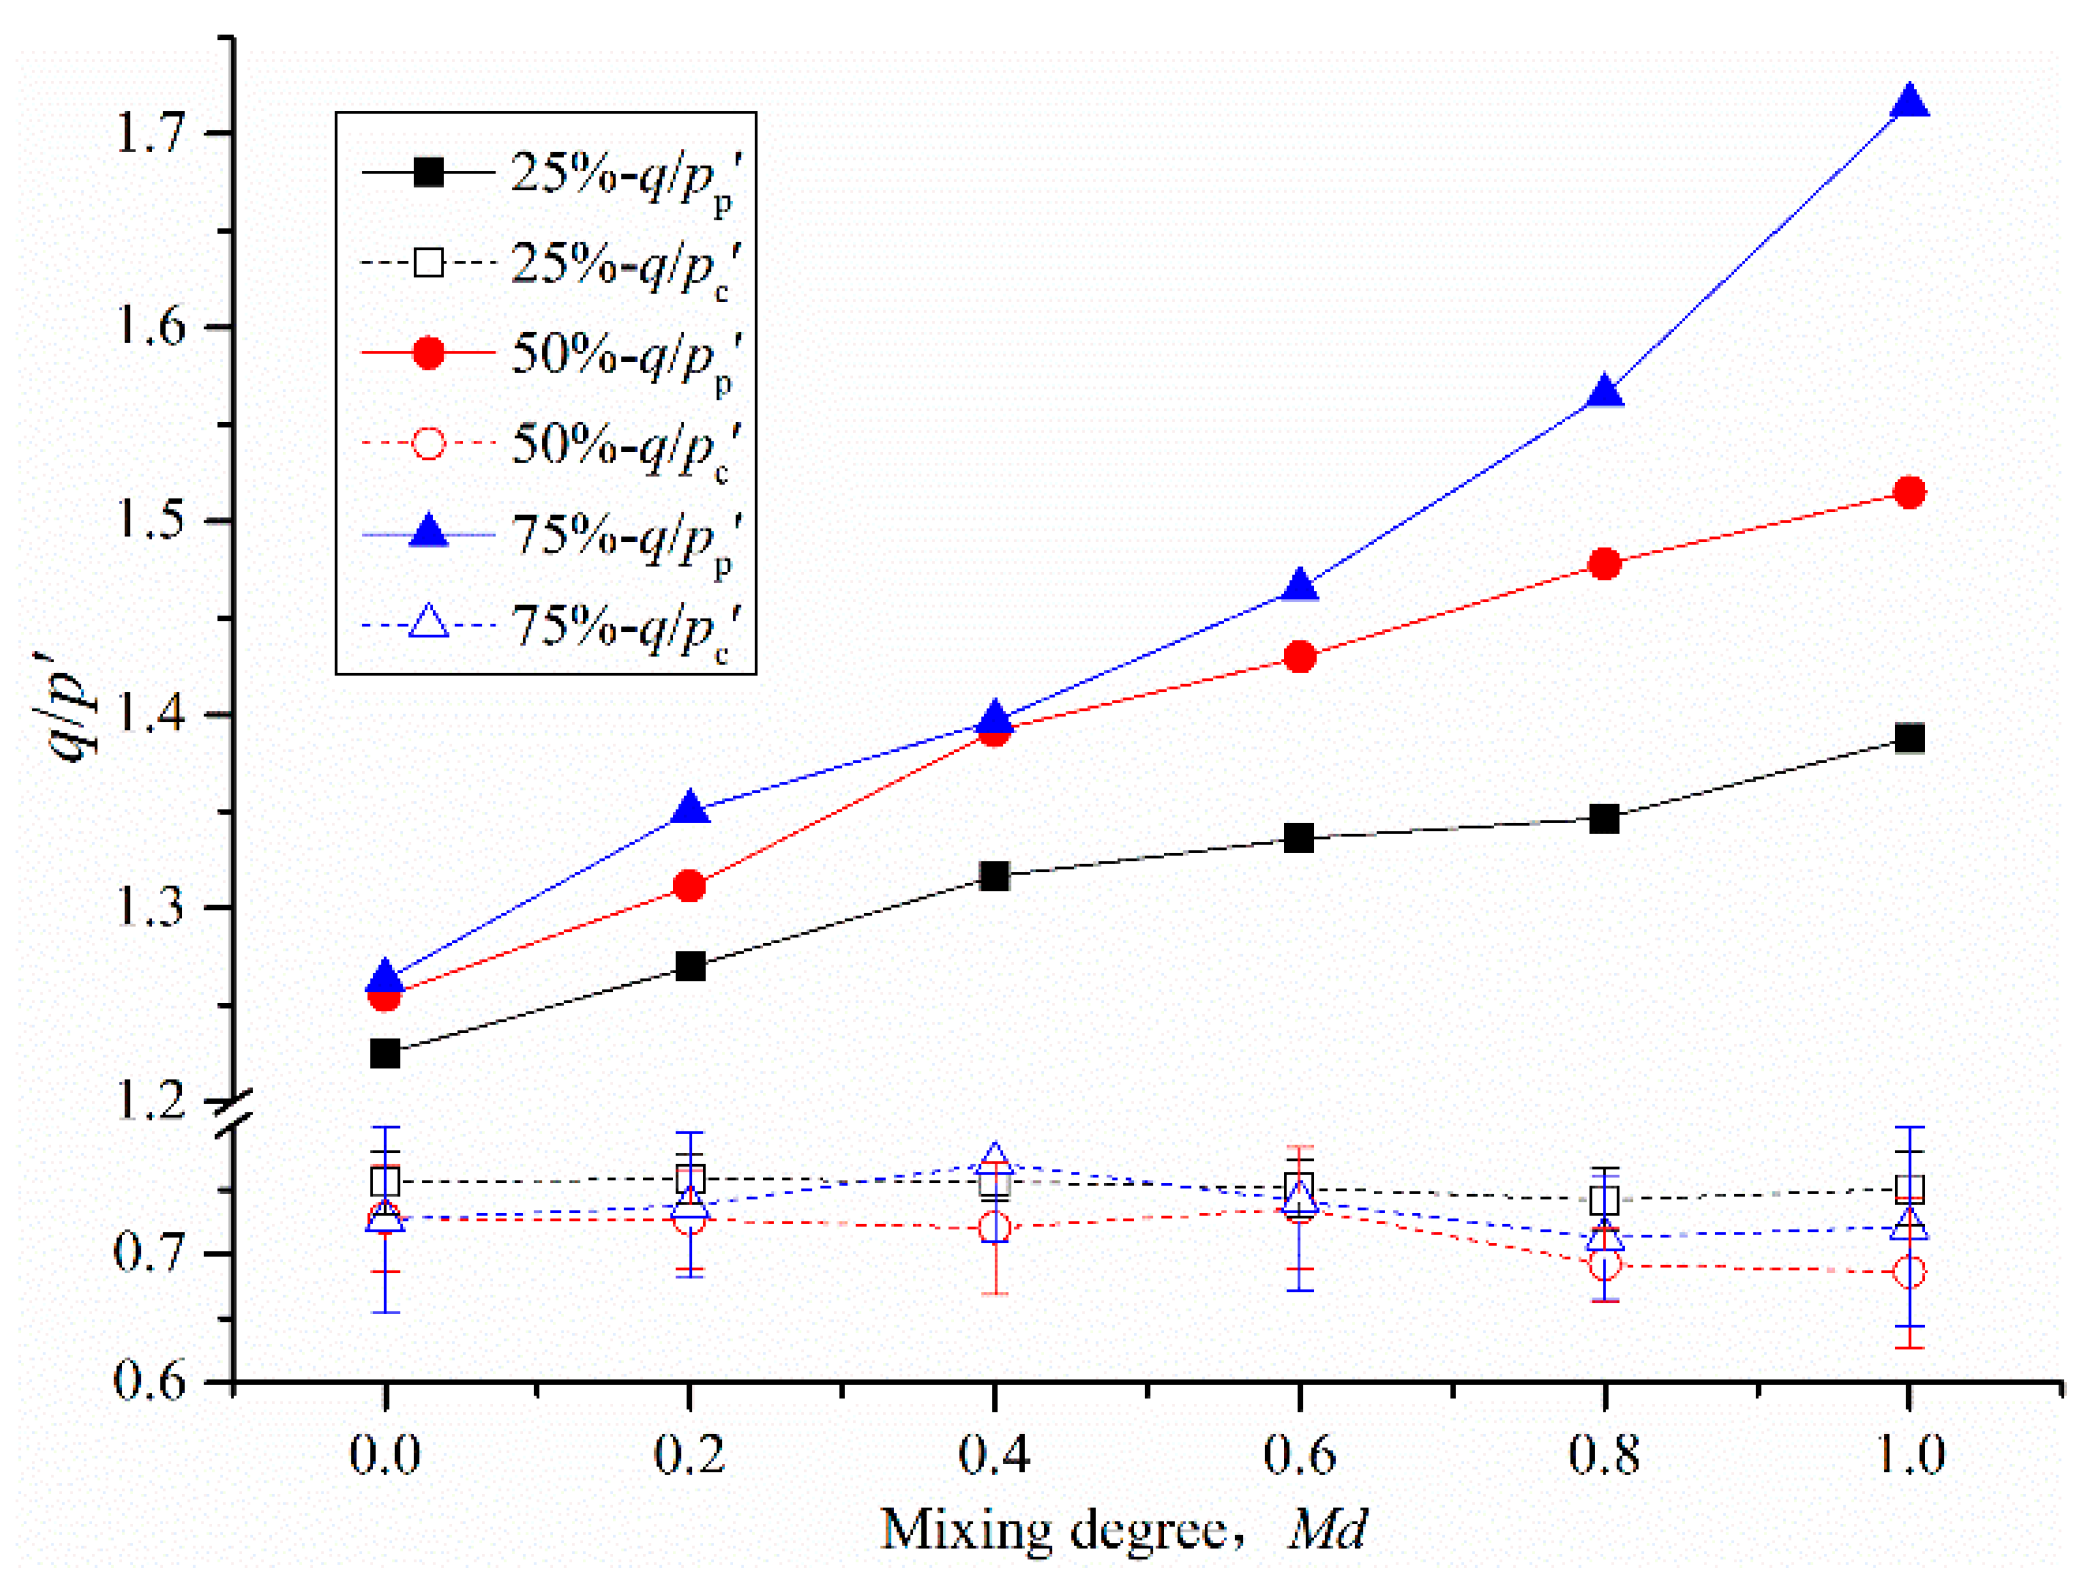
The influence of the mixing degree on the peak shear strength () and the critical shear strength () are as depicted in Figure 6. The increases with an increase in mixing degree, and the increasing trend is more obvious with increasing coarse content. However, fluctuates slightly within a certain range. The peak shear strength exhibits a monotonic increase as the mixing degree increases, and the critical shear strength was found to be independent of the mixing degree.
4.1.2. Volumetric Strain and Dilatancy Angle
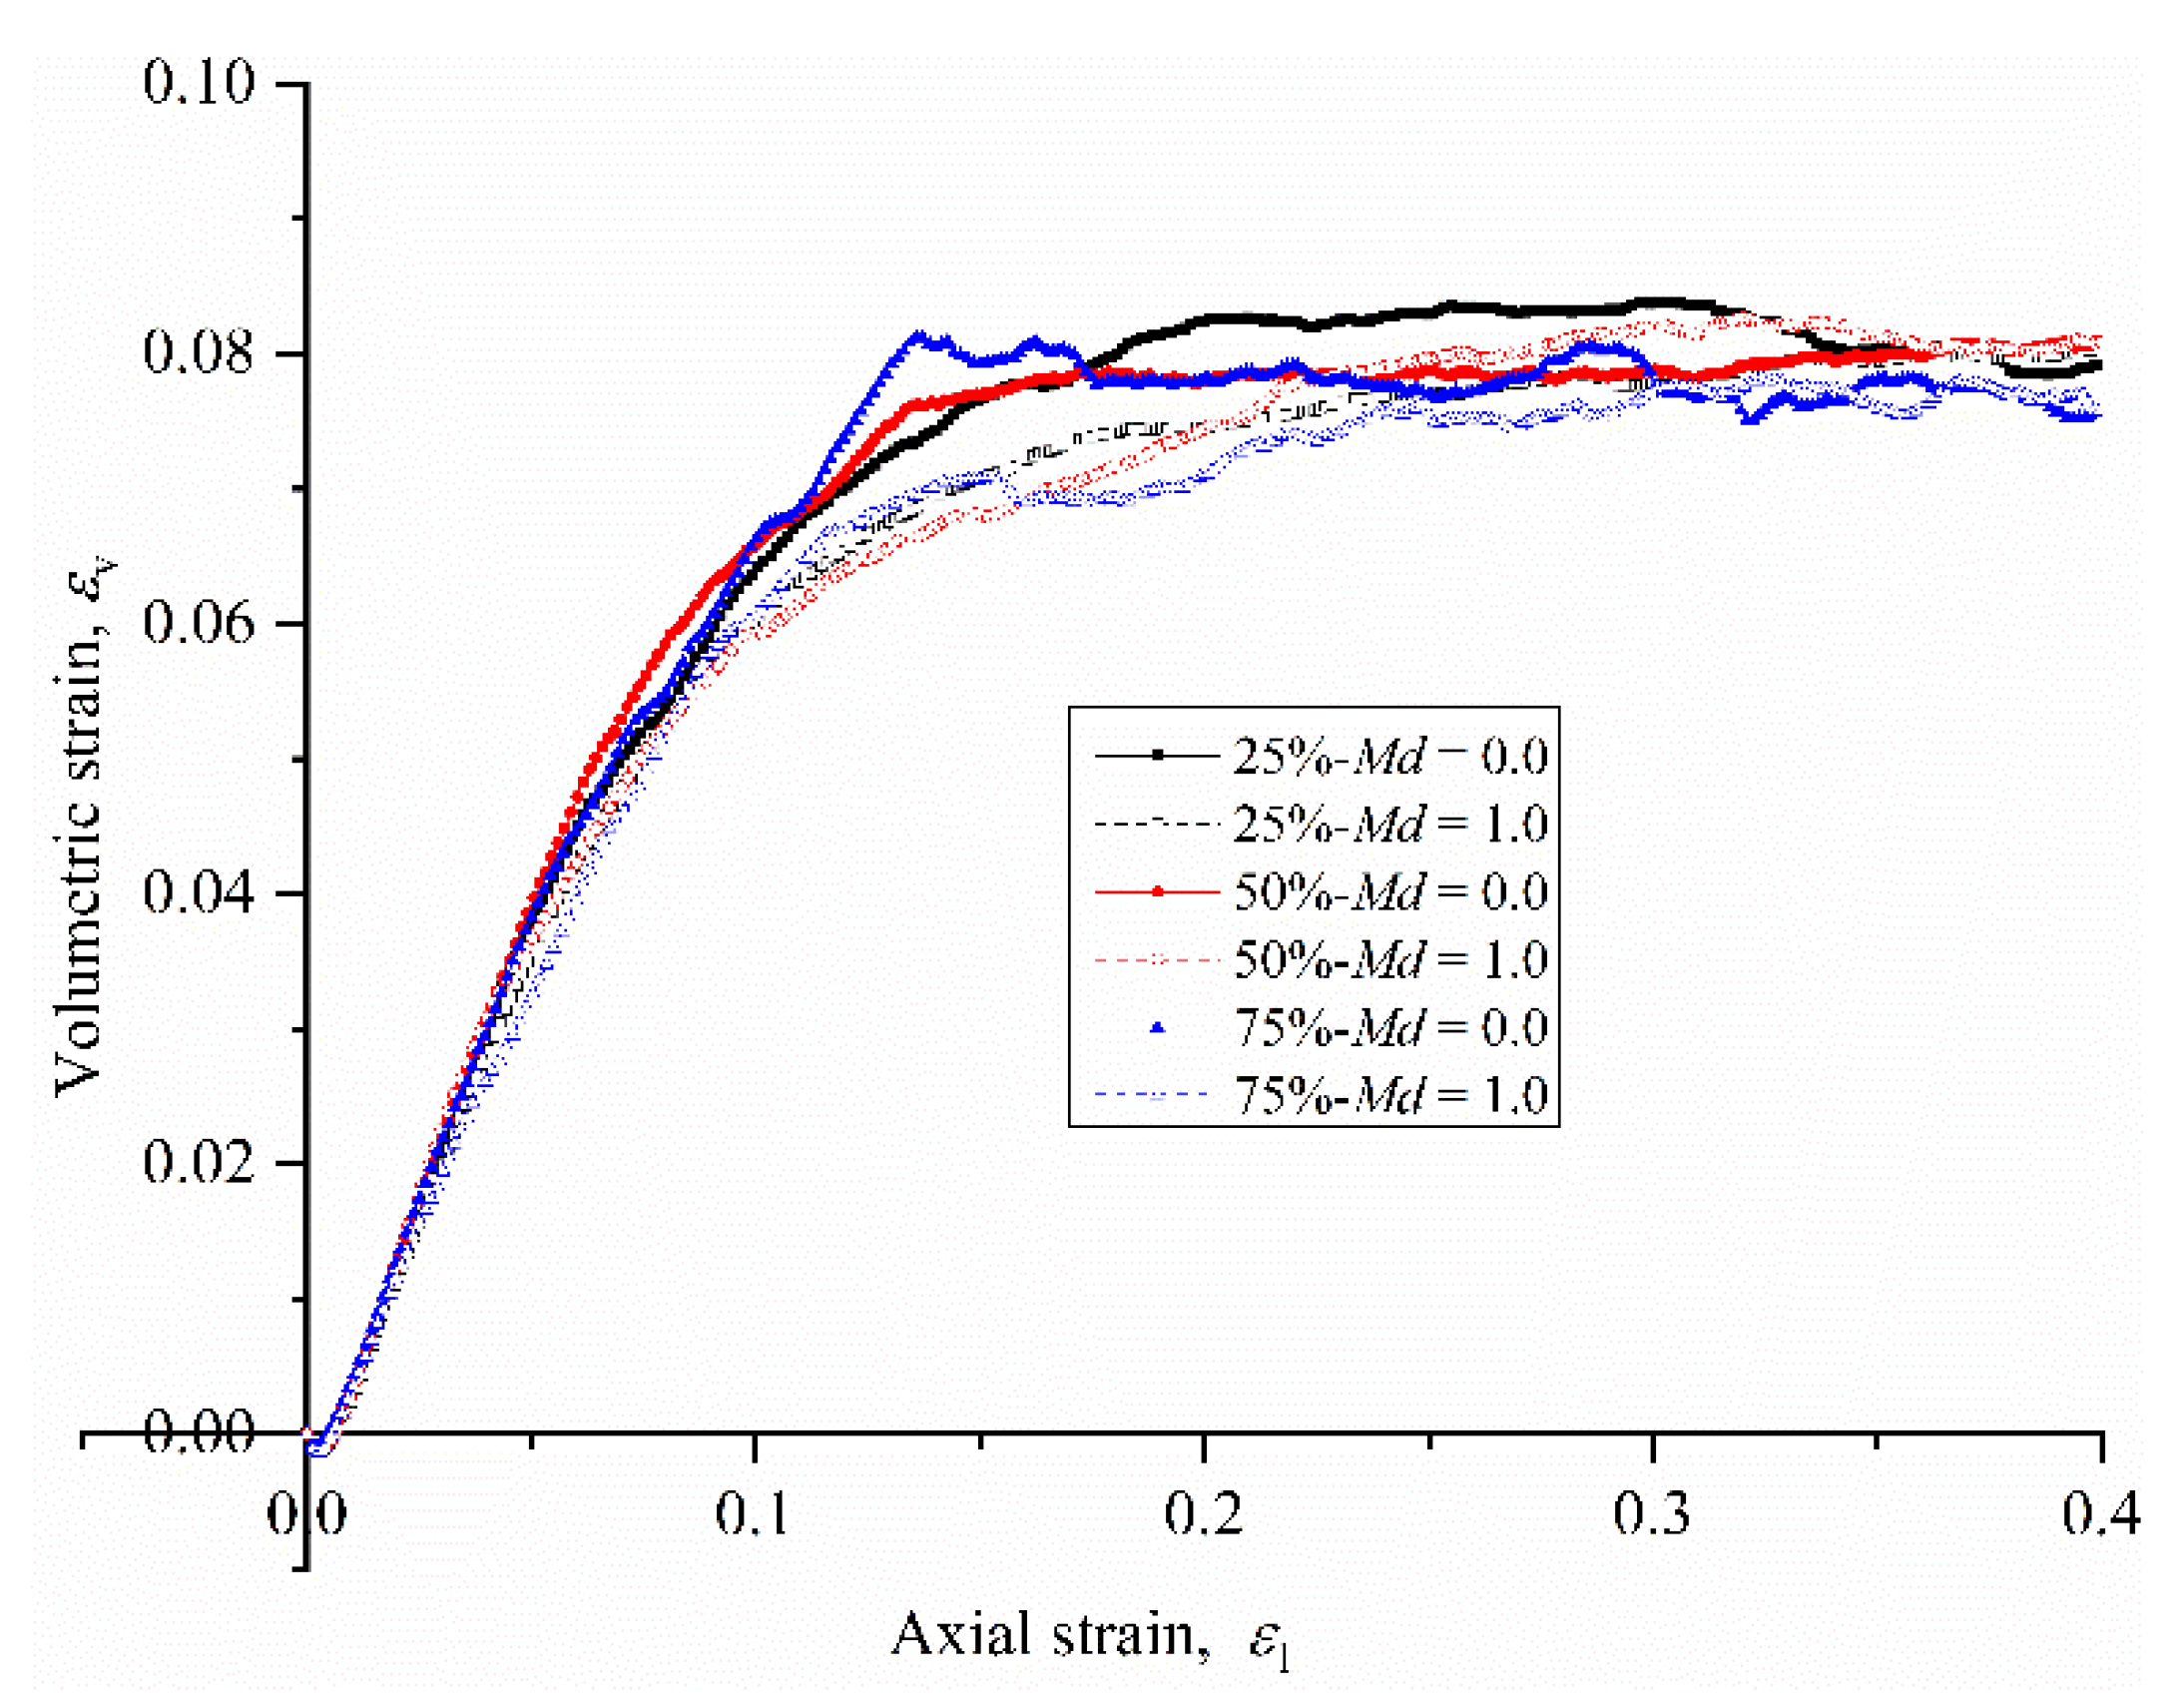
As the contact between the binary geotechnical mixture particles is nonplanar, the particles are staggered, which leads to the behavior of particle translation and rotation on the shear plane during the shear process, along with the change in volumetric strain. Figure 7 shows the evolution of the volumetric strain εv with the axial strain ε1 and presents the relationship between the results of volumetric strain against the axial strain. It can be seen that, at the initial stage of the test, there was no significant difference in strain values for respective specimens until the critical state was attained. This behavior is inconsistent with the volumetric strain behavior of typical dense granular materials [27,37].
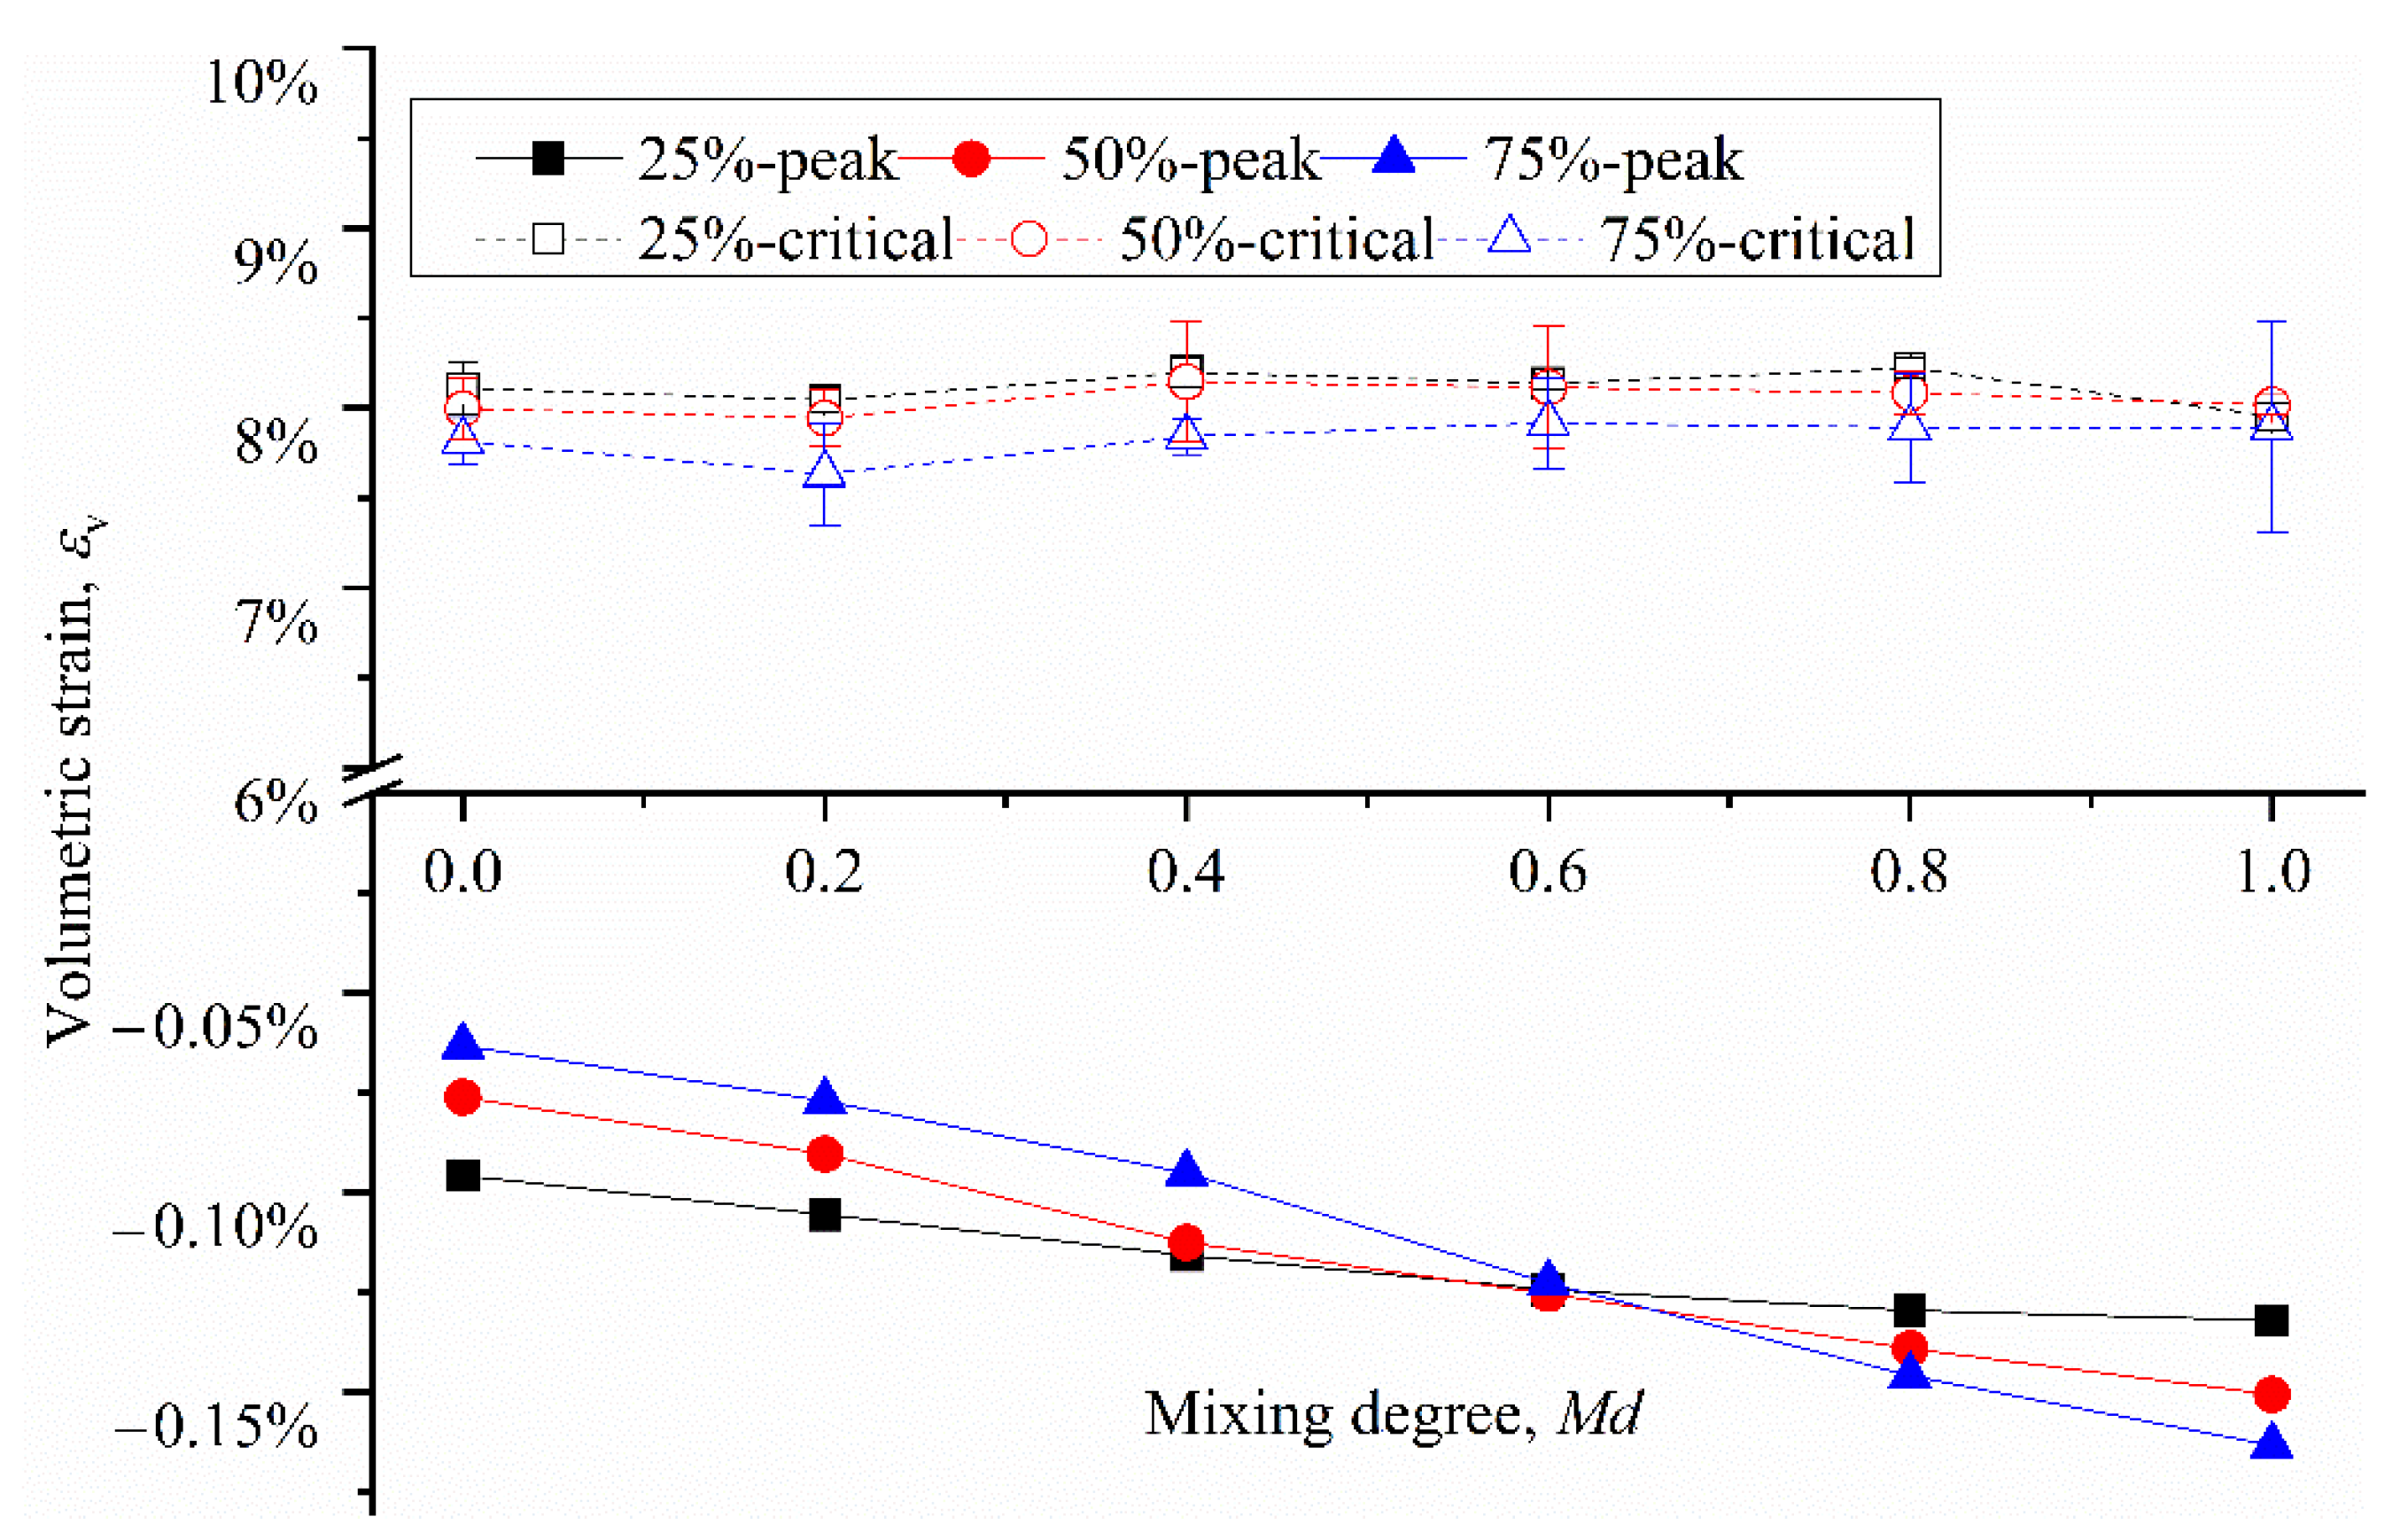
As it is difficult to distinguish the change in volumetric strain with mixing degree in Figure 7, the peak shrinkage value and critical dilatancy value are shown in Figure 8 in detail. The volumetric strain (shrinkage value) of the specimen in the peak state increases with an increase in mixing degree, while the volumetric strain (dilatancy value) at the critical state is not affected by the change in mixing degree. In fact, both the peak strength and critical strength of soil are closely related to volumetric strain, e.g., the critical point from shrinkage to dilatancy corresponds to the peak shear strength of soil, while the stable dilatancy state corresponds to the critical shear strength [38]. Therefore, it can easily be explained why the variation trend of volumetric strain with mixing degree in the peak or critical state is highly consistent with the variation trend of strength with mixing degree. The volumetric strain has a significant influence on both the peak strength and critical strength, and the quantitative analysis is carried out below.
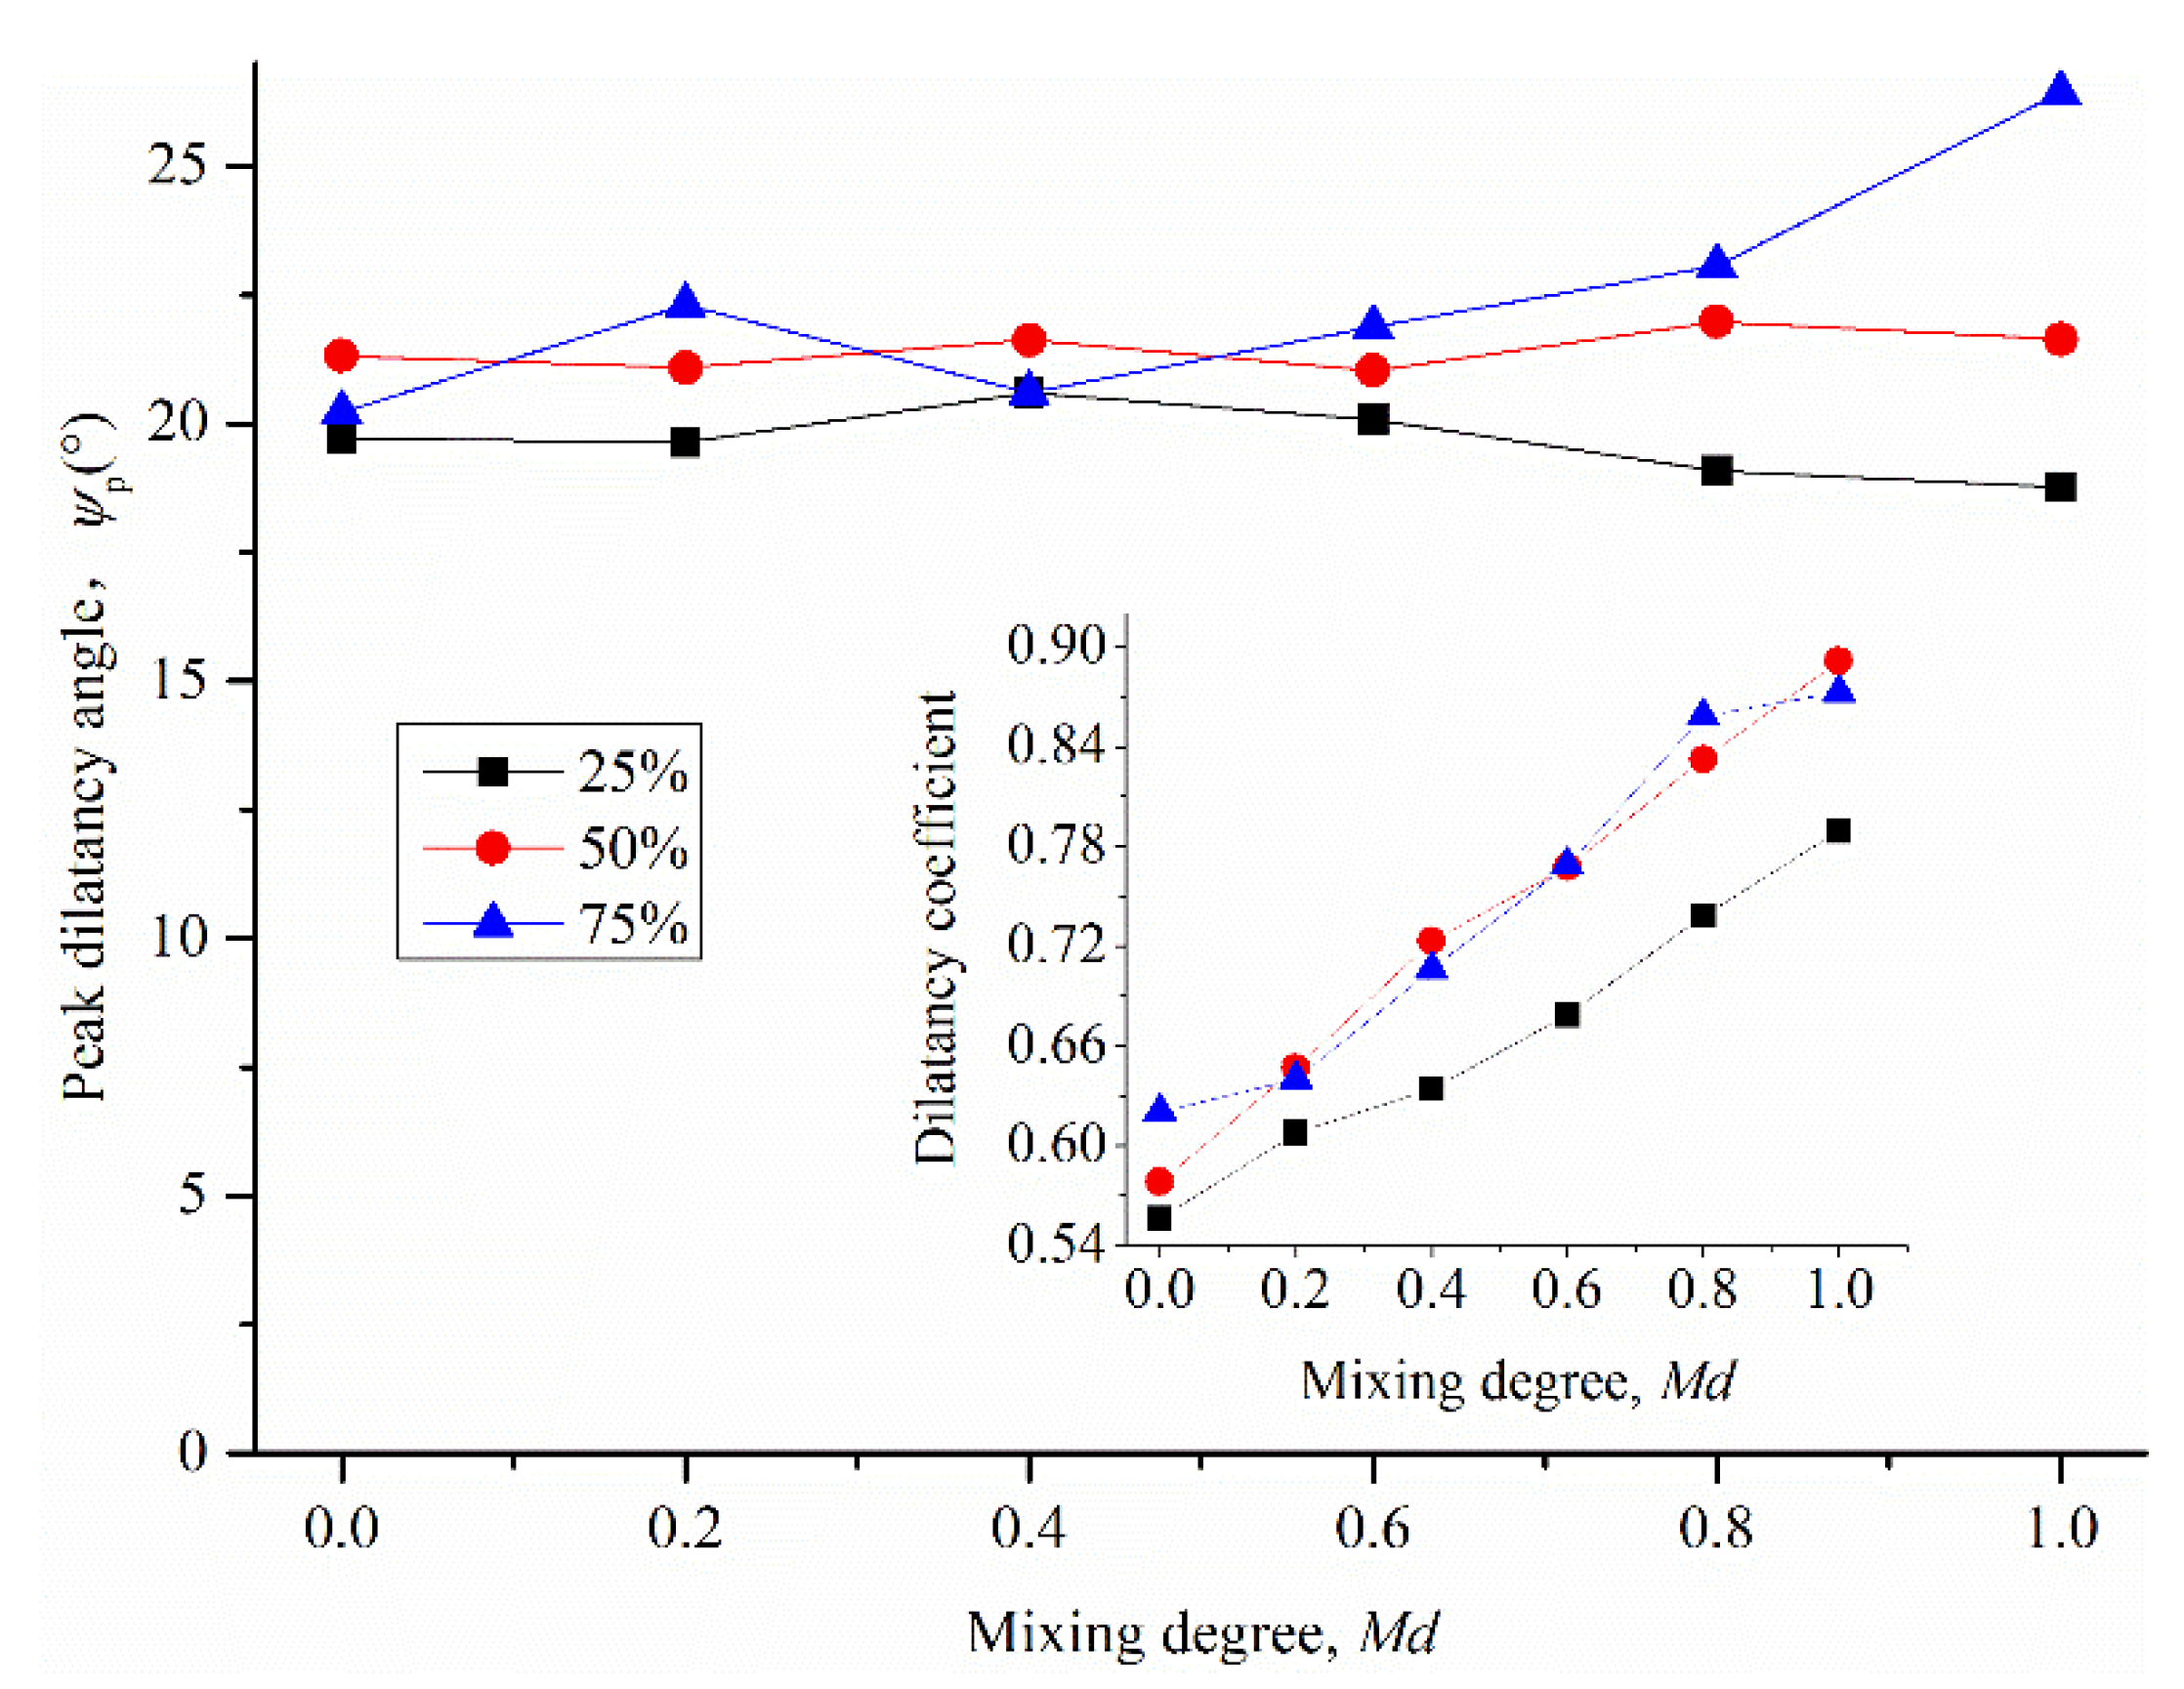
Volume expansion can be indicated in terms of the dilatancy angle (ψ). The maximum dilatancy angle is called the peak dilatancy angle ψp, which is closely related to the peak shear strength [39]. Figure 9 displays the variation in the peak dilatancy angle with mixing degree. The peak dilatancy angle is not influenced by the mixing degree of the specimen, except that it increases slightly in the specimen with Vf = 75%. This is quite different from the trend of the peak shear strength with the mixing degree. It could be that the variation in the peak shear strength in specimens with different mixing degrees is not directly related to the peak dilatancy angle.
Bolton [38] describes the relationship between the dilatancy angle and shear strength with Equation (8), which is a simplification of an expression presented by Rowe [40]:
where φp and φc represent the peak friction angle and critical friction angle, respectively, and α is the dilatancy coefficient, which represents the contribution of dilatancy to the peak shear strength and, to a certain extent, varies with different soil properties. The evolution of the dilatancy coefficient with the mixing degree is shown in Figure 9. For all samples with a given coarse content, the dilatancy coefficient increases significantly with an increase in mixing degree. This implies that the contribution of shrinkage to peak shear strength is more obvious in specimens with higher mixing degrees. It is also proven that the variation in peak shear strength is directly related to the peak dilatancy angle.
4.2. Mesomechanism of the Variation in Strength with Mixing Degree
The macroscopic analysis shows that the coarse content only affects the variation degree of the shear strength with mixing degree. Hence, the subsequent microscopic analysis takes the result of the specimen with a 50% coarse content as the bench mark for the subsequent analysis.
4.2.1. Contact Number
The coordination number is an important parameter for measuring the internal structural characteristics of granular mixtures. The coordination number depends on the type contact between particles. The contact networks in this study were divided into three subnetworks: (i) a coarse–coarse (cc) contact network, (ii) coarse–fine (cf) contact network, and (iii) fine–fine (ff) contact network. The overall coordination number can also be divided into three partial coordination numbers Zcc, Zcf, and Zff, defined as follows [35,41]:
where Cm indicates the contact number corresponding to the m contact type (m can be cc, cf and ff). N is the total number of all the particles, Nc is the number of coarse particles and Nf is the number of fine particles.
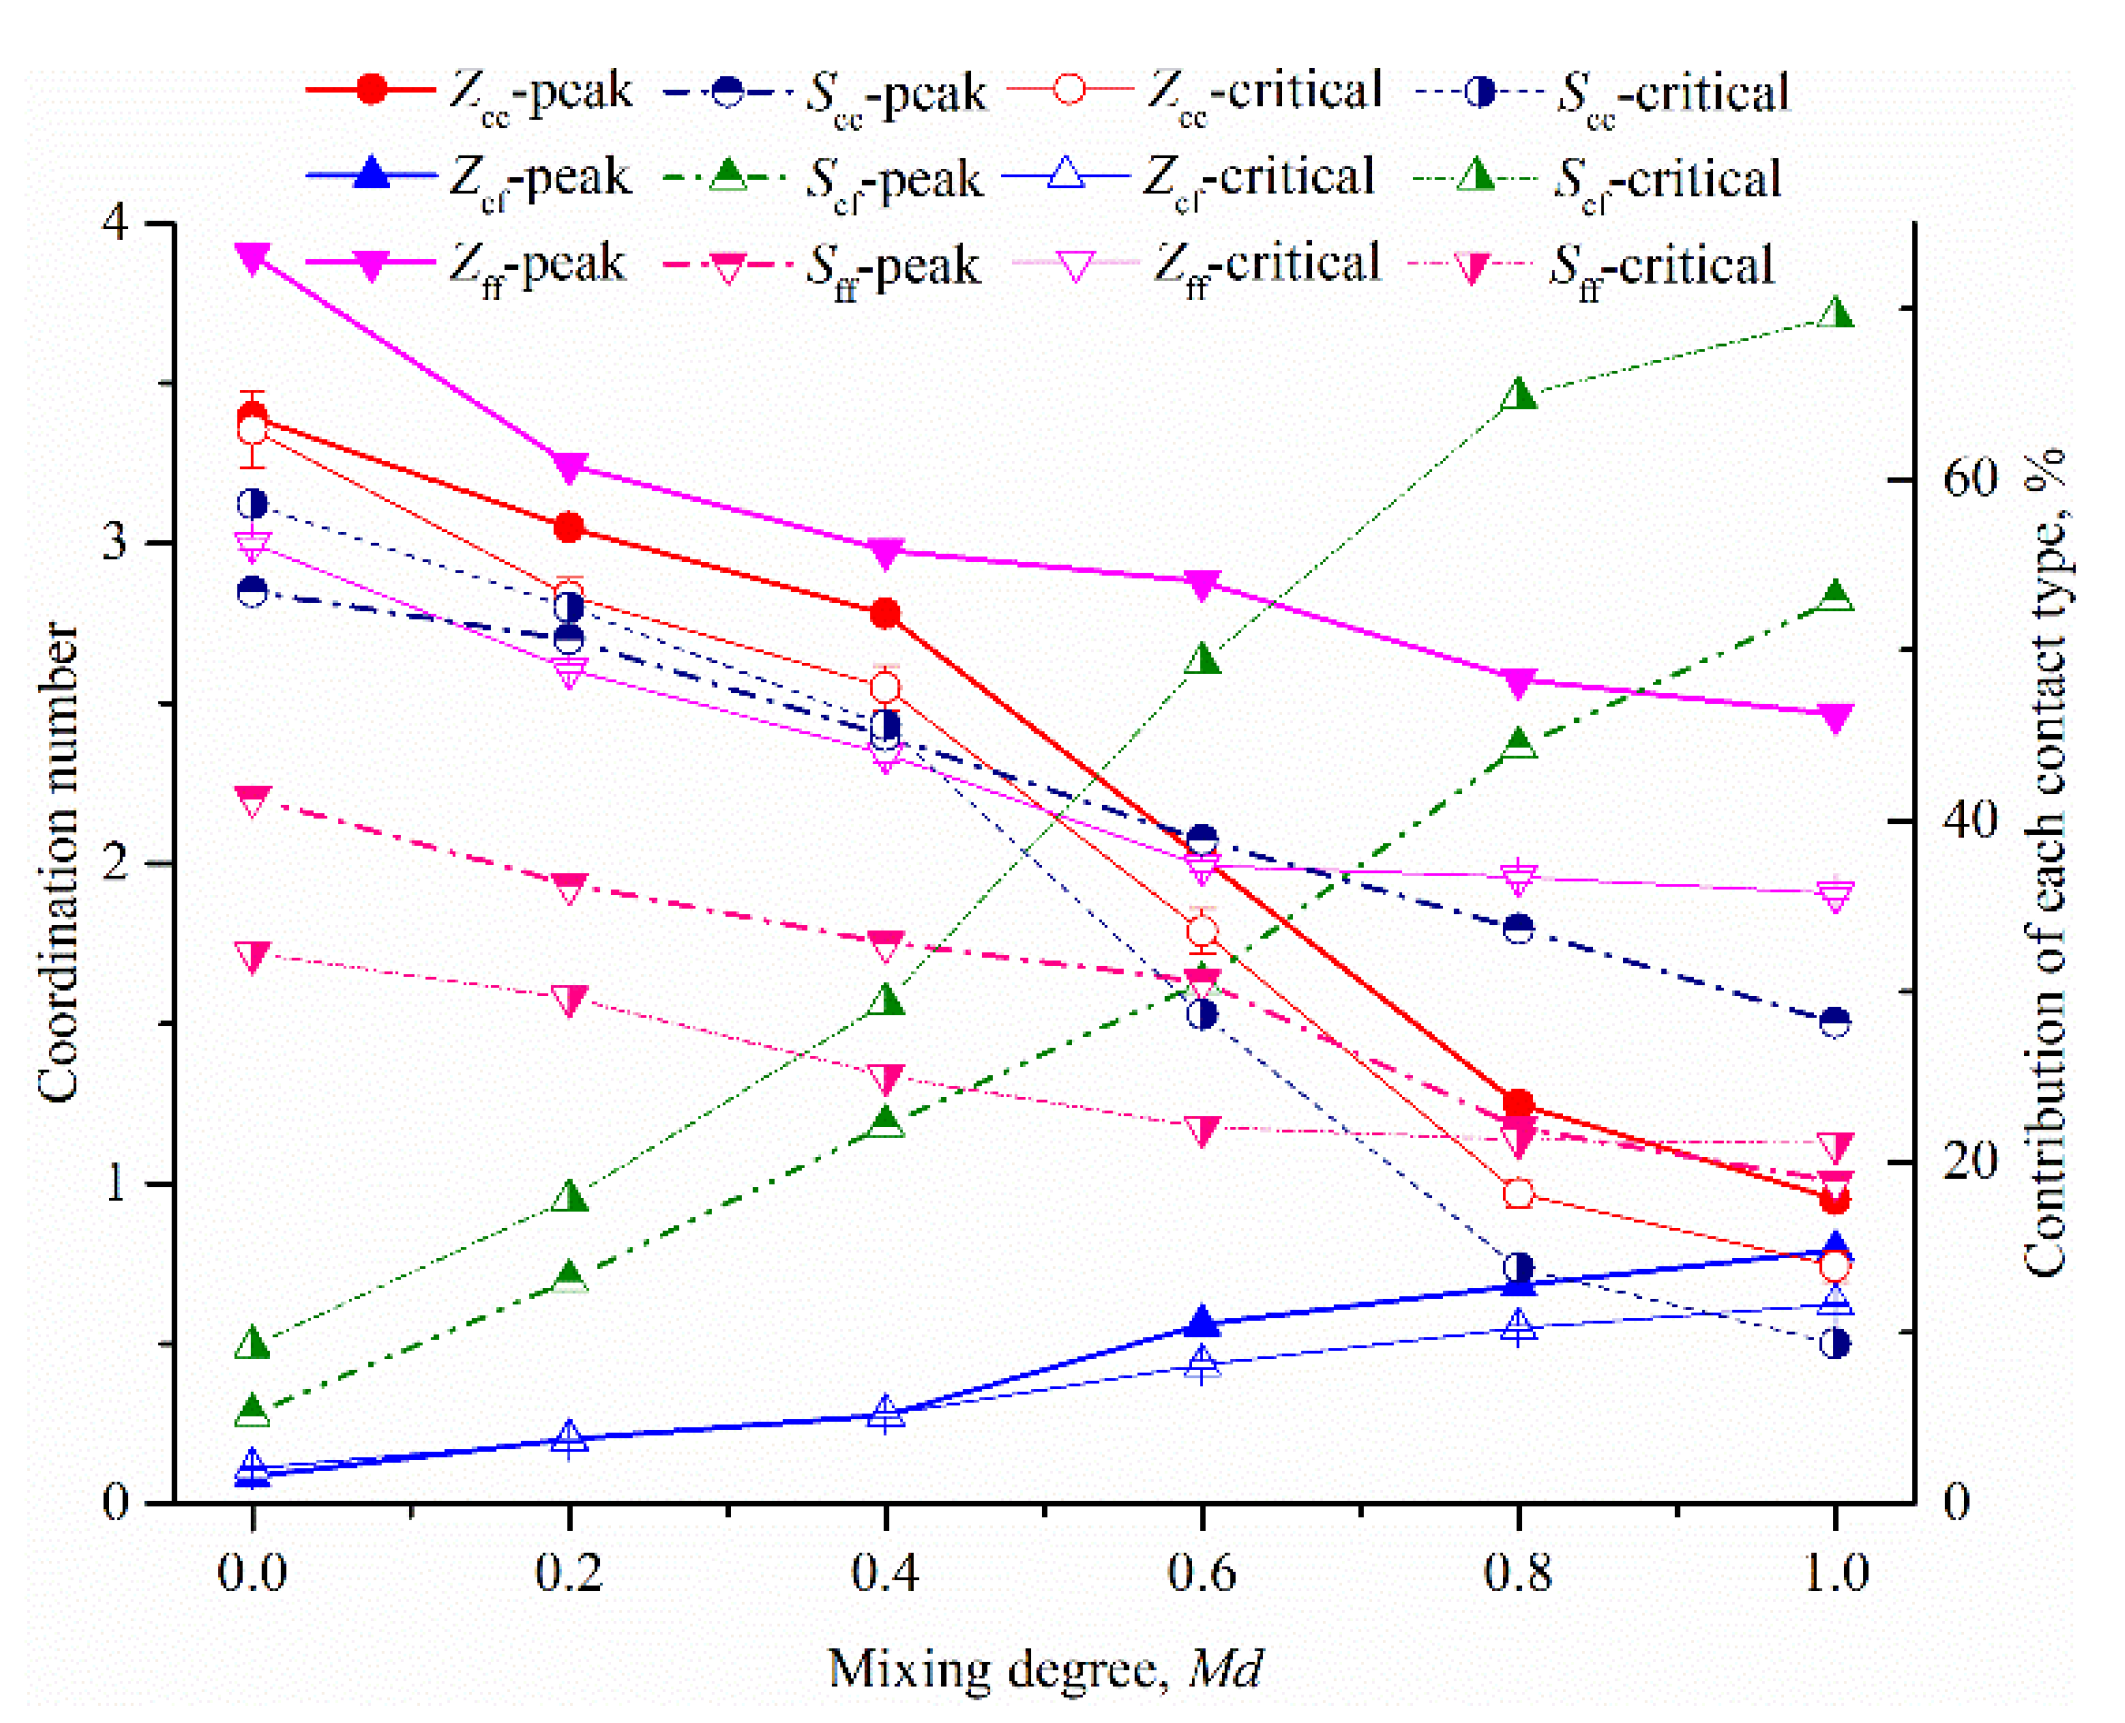
Hence, the partial coordination number represents the number of different contact types. The coordination is used to quantify the extent to which the different contact types contribute to the shear strength [42]. Figure 10 shows the evolution of the partial coordination numbers and the contribution of each contact type to the shear strength with the mixing degree, where Scc, Scf and Sff represent the contributions of the cc contacts, cf contacts and ff contacts to the shear strength, respectively. It can be clearly observed that, in the peak and critical state, the partial coordination number and the contribution to the shear strength of different contact types follow the same trend. The partial coordination number and the contribution to the shear strength of cc contacts and ff contacts monotonically decrease with an increase in mixing degree, and those of cf contacts monotonically increase with an increase in mixing degree. An intuitive explanation for these results is that as the mixing degree increases, the distribution of coarse and fine particles changes from polarized to uniform. Hence, the contacts between coarse and fine particles become more common, accompanied by the inevitable decrease in the number of contacts between fine particles and between coarse particles. Then, the puzzle is whether the change in the number of contacts affects the shear strength. For example, in the case that the numbers of cc and ff contacts decrease with increasing mixing degree, the increase in peak shear strength with an increase in mixing degree seems to be due to the increased number of cf contacts, while the critical shear strength is independent of these changes. The contribution of different contacts to shear strength varies significantly; this could be attributed to the change in contact numbers.
4.2.2. The Fabric Structure
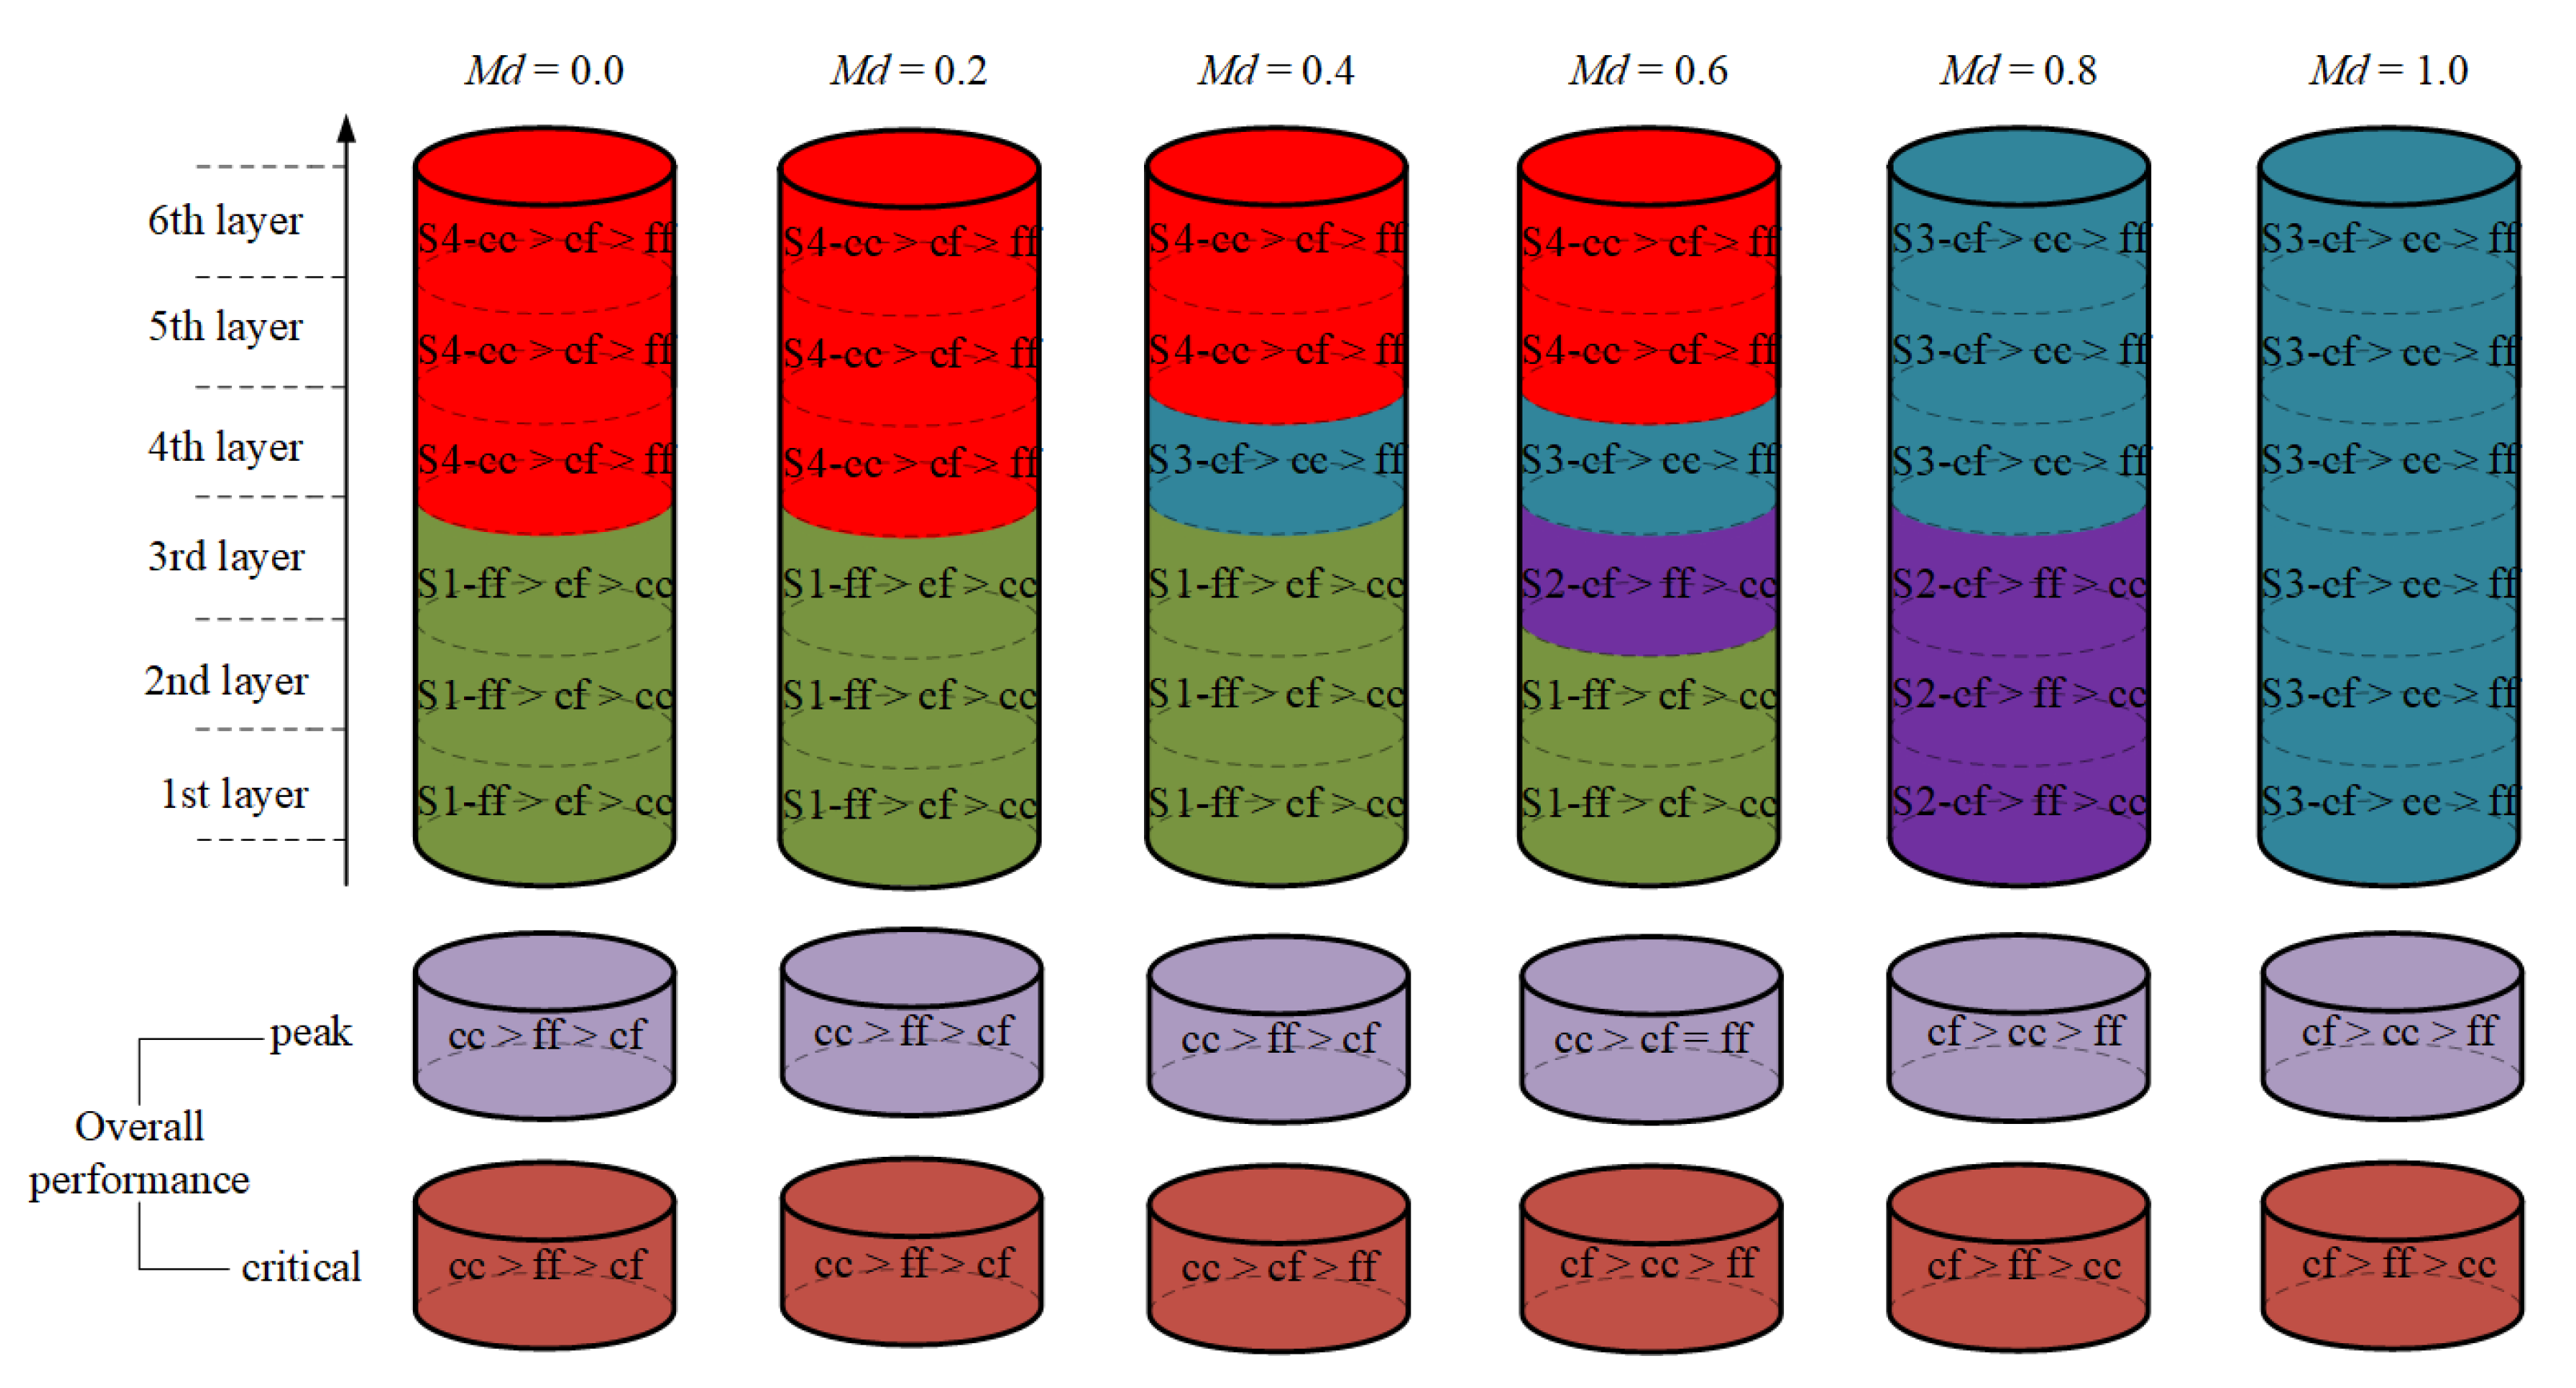
Gong et al. [43] divided the fabric structure of a binary mixture into four types (S1, S2, S3 and S4) according to different coarse contents (i.e., Vf ≤ 30% in S1; 30 < Vf ≤ 48% in S2; 48 < Vf ≤ 70% in S3; Vf > 70% in S4). And the contribution of contact type to strength was varied in different structures (i.e., ff > cf > cc in S1; cf > ff > cc in S2; cf > cc > ff in S3; cc > cf > ff in S4). It is worth pointing out that the results in Figure 10 do not strictly satisfy this rule. In other words, all the samples in Figure 10 belong to the S3 structure as a whole, but not all the contributions of contact type to shear strength meet the condition of cf > cc > ff. This is attributed to the mixing degree. It was found that the mixing degree has a direct influence the change of local coarse content, which leads to the differences in local fabric structure from the whole, as shown in Figure 11.
It can be seen from Figure 11, when the mixing degree is low (i.e., Md = 0.0 and 0.2), the local fabric structures are only S1 and S4 in the sample. Therefore, in both peak and critical states, cc contact plays a dominant role in contribution to the strength, followed by ff, and finally cf. With the improvement in mixing degree (i.e., Md = 0.4 and 0.6), S2 and S3 fabric structures gradually appeared in the middle of the sample, and the contribution of cf contact to strength began to increase in the overall performance. When the samples were uniformly mixed (i.e., Md = 1.0), S3 dominated the local fabric structure, and cf contact played a dominant role in the contribution to strength; this is consistent with the previous studies [43,44,45]. It should be pointed out that the analysis object is the sample with Vf = 50%, and the value is at the junction of the S2 structure and S3 structure. Therefore, in the peak state, the contribution of cc contact to strength is greater than that of ff contact (the overall performance is biased to S3), while in the critical state, the contribution of ff contact to strength is greater than that of cc contact (the overall performance is biased to S2).
In general, the analysis results of Figure 10 and Figure 11 show that with the mixing degree increased, the most intuitive change on the mesoscopic level is that the cf contact number and its contribution to strength increases gradually. However, this change causes different results in peak and critical state; the peak strength gradually increases and the critical strength remained constant, which need further discussion.
4.2.3. Contact Force
In fact, the variation in the contributions of each contact type to the shear strength may be caused by two factors: the contact number and the contact force. When the contact numbers are insufficient to explain the variation in shear strength, the magnitude of the contact force is taken into account. The mean normal contact force is defined as the average of the overall normal contact force of the contacts. Similarly, _m represents the mean normal force of m contact type (m can be cc, cf and ff). Table 1 enumerates the contact numbers and the mean normal contact forces _m of various specimens.
It can be observed that, for all the specimens, _cc is the largest, followed by _cf, and _ff is the smallest, which is consistent with previous numerical results [42,46,47]. With an increase in mixing degree, in the peak state, _cc, _cf and _ff all fluctuate within a certain range, while Ccc and Cff decrease significantly and Ccf increases obviously. Thus, the increase in contribution of cf contacts to peak shear strength is undoubtedly determined to be caused by the increase in the cf contact number. In the critical state, _cc and _ff decrease slightly, Ccc and Cff decrease significantly, while _cf decreases and Ccf increases significantly with increasing Md. At this point, it can be revealed that the effect of the increase in cf contact number on the critical strength is offset by the decrease in the other five factors (e.g., _cc, _cf, _ff, Ccc and Cff), especially _cf, resulting in the stability of the critical shear strength. However, such a simple conclusion does not seem sufficient to explain the mechanism of the change in critical shear strength. Therefore, further analysis needs to be carried out on the distribution of contact types.
4.2.4. Distribution of Contacts
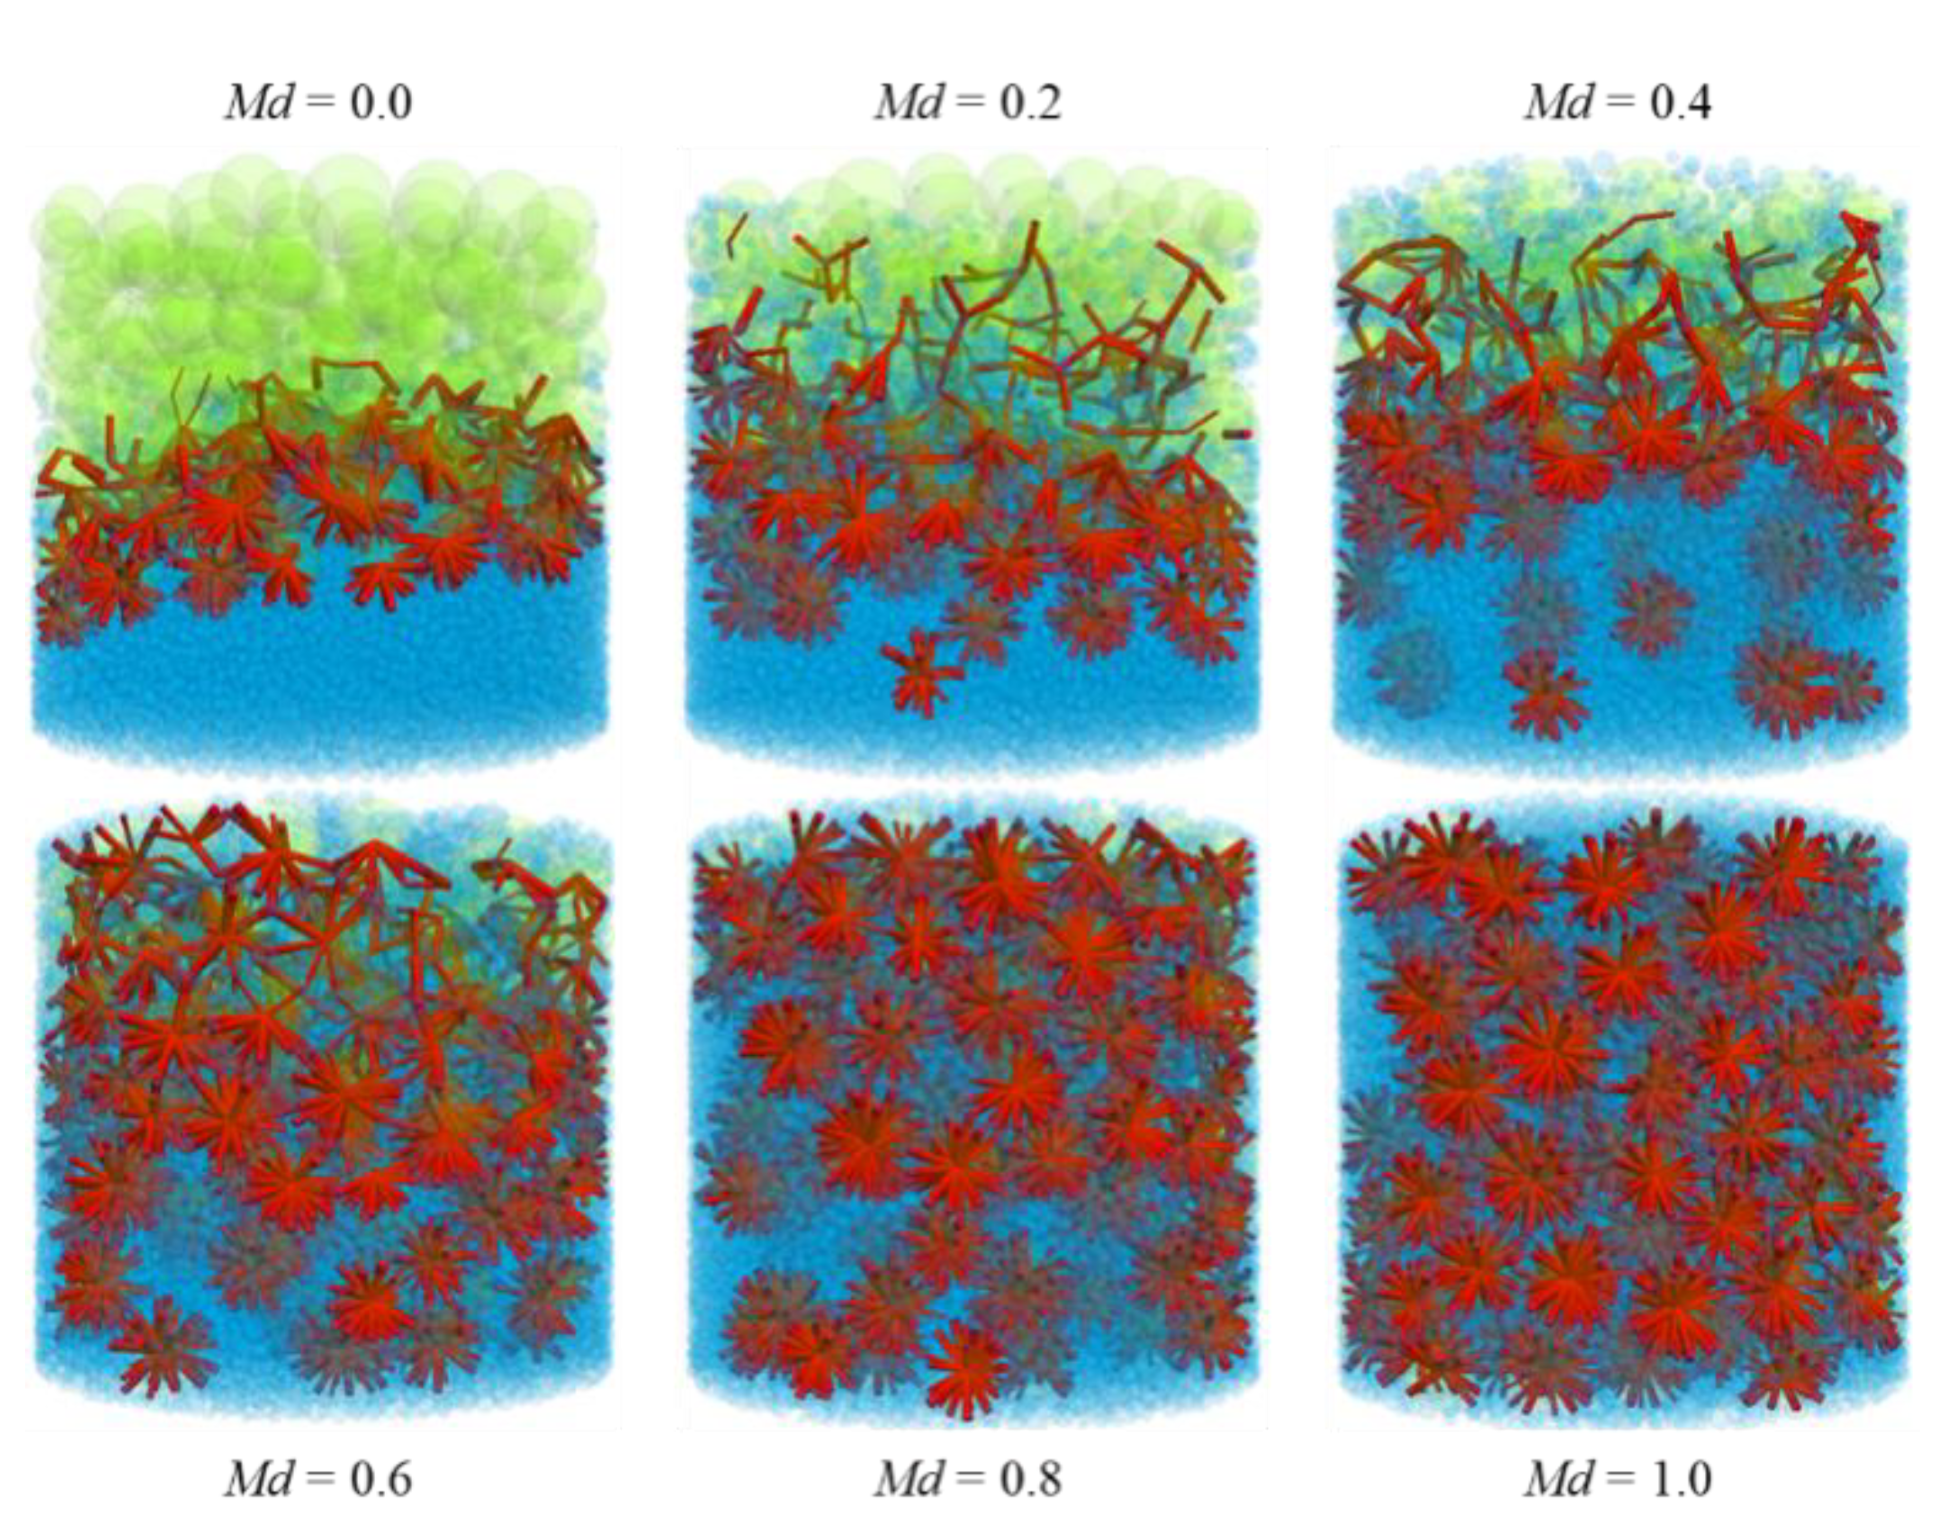
Apart from other factors (e.g., shape and size), the most intuitive influence of mixing degree on the specimen is the change in the distribution of coarse and fine particles, resulting in different contact distributions. Based on the results obtained, as presented in Table 1, the cf contact type is the most noteworthy. Therefore, the change in the distribution of cf contacts in specimens with different mixing degrees is shown in Figure 12. In Figure 12, the blurred green and blue spheres represent coarse and fine particles, respectively, while the solid red bars represent cf contacts. It can be seen clearly that the distribution of cf contacts gradually changes from a sporadic distribution at the interface when Md = 0.0 to a global distribution at Md = 1.0. This means that with the increase in mixing degree, the number of cf contacts in the sample increases and the distribution becomes more uniform. The magnitudes of _cf and were compared in order to ascertain if the influence of cf contact number on the shear strength is controlled by the contact distribution in the specimen.
The network of contacts that are used to carry forces can be divided into two subnetworks, using strong and weak contacts [48]. The strong contacts can carry larger forces than the mean normal contact force , whereas the weak contacts carry smaller forces than the mean normal contact force . In the shearing of granular materials, strong contacts can work together to transfer force, and the weak contacts provide stability under the forces propagating along the strong contacts. By comparing the values between the mean normal contact forces and _m, it is not difficult to find that _cc and _cf are much larger than , while _ff is less than . These results indicate that the cc and cf contacts are dominated by strong contacts, whereas the ff contacts are dominated by weak contacts. It is clear that only an increase in Ccf can offset the effect of the reduction in _cc, _cf, _ff, Ccc and Cff and maintain the stability of the critical shear strength: with the increase in mixing degree, cf contacts gradually spread through the strong contact network from the interface throughout the specimen. At this point, the strong contacts, which can transfer forces, are homogeneously distributed throughout the whole specimen. This further confirms the claim that the increase in peak shear strength is caused by the increase in the cf contacts, which have a similar distribution in the critical state.
4.2.5. Force–Fabric Anisotropies
In terms of micromechanics, the force–fabric anisotropies can be regarded as the source of the shear resistance of granular materials [25,49,50]. In order to establish the relationship between macroscopic strength (q/p′) and microscopic force–fabric anisotropies of cohesionless granular materials under triaxial condition, the following formula is usually used:
where ac, an, and at indicate the normal contact anisotropy, normal contact force anisotropy, and tangential contact force anisotropy, respectively, which can be calculated from the generalized fabric and force tensors, and have been confirmed by previous studies [48,51].
In the three subnetworks mentioned earlier, Equation (12) can also be represented as
where ξm denotes the weighting parameter of the mth subnetwork (i.e., the cc, cf and ff contacts); reflects the anisotropy coefficient of contacts in the mth subnetwork and is obtained by restricting the equations of to the mth subnetwork.
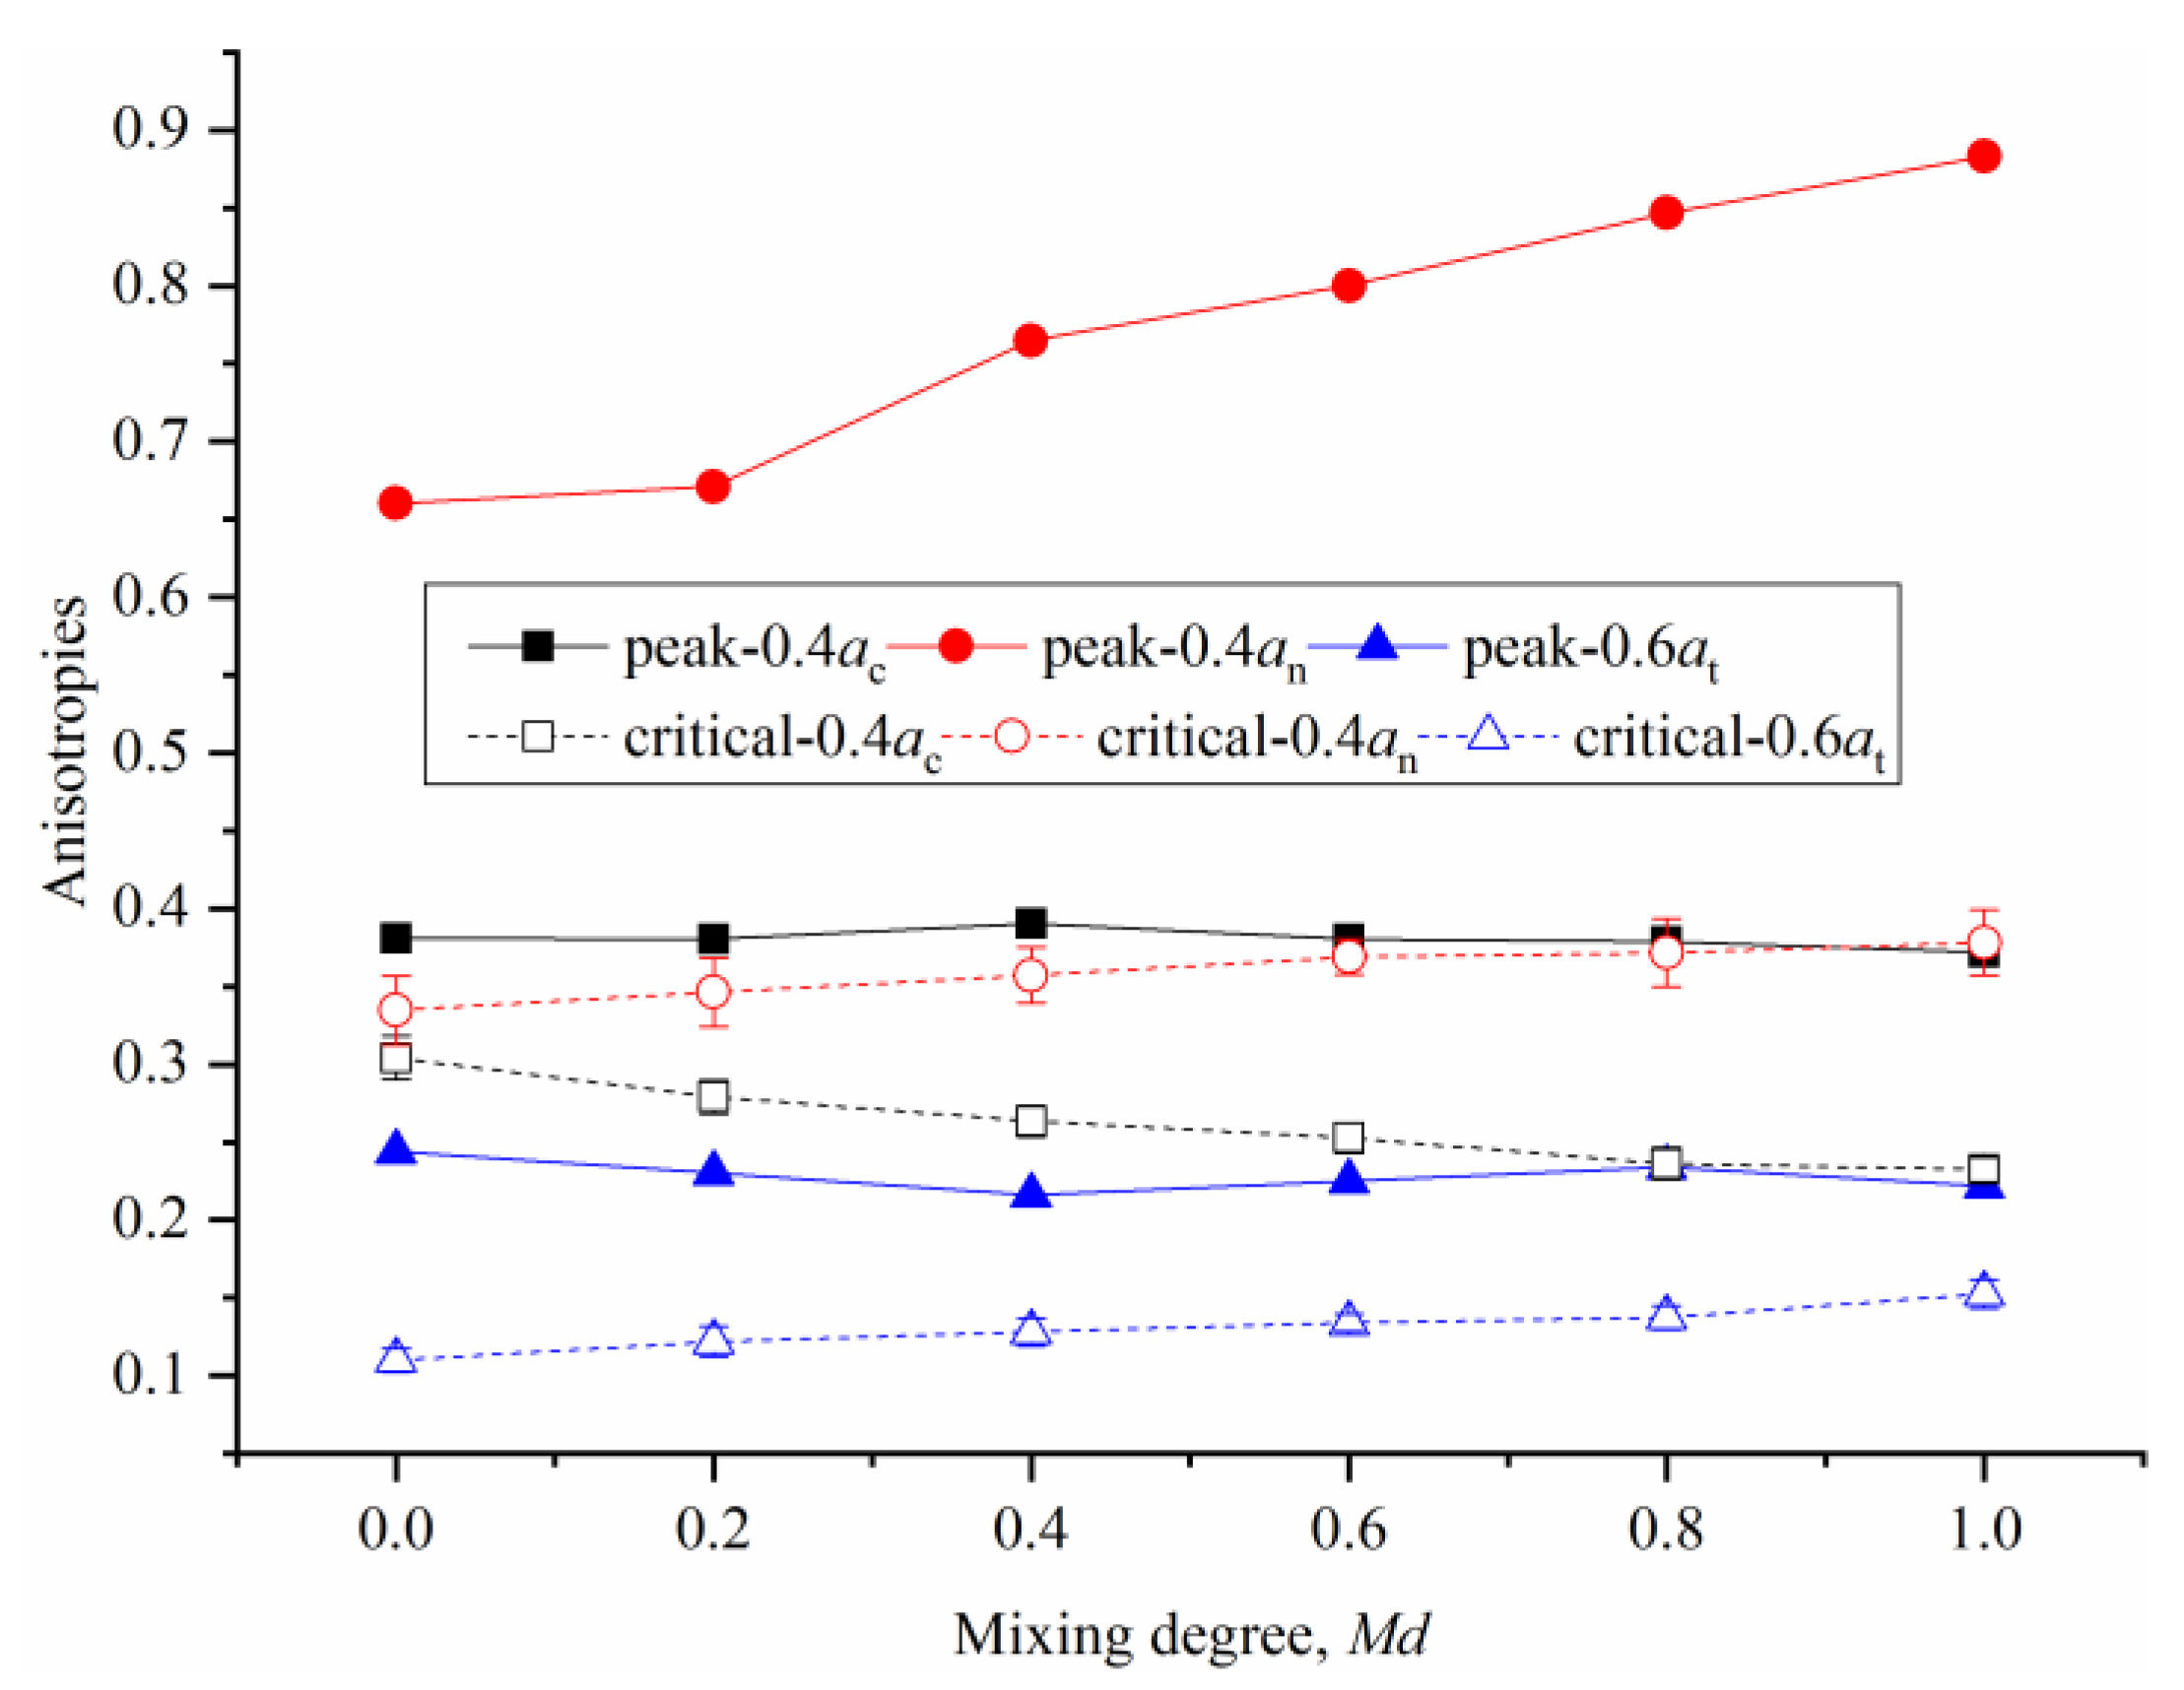
Figure 13 shows the variations in anisotropies with Md. It can be seen from Figure 13 that, in both states (the peak state and the critical state), 0.4an dominates the strength, followed by 0.4ac, and then 0.6at. The difference is that, in the peak state, both 0.4ac and 0.6at decrease slightly with an increase in Md, while 0.4an increases significantly, which means that the increase in peak strength is mainly caused by the increase in 0.4an. In the critical state, both 0.4an and 0.6at increased with the increase in Md, while 0.4ac decreased significantly. This implies that the contributions of these two changes in the strength offset each other and maintain the stability of the critical strength.
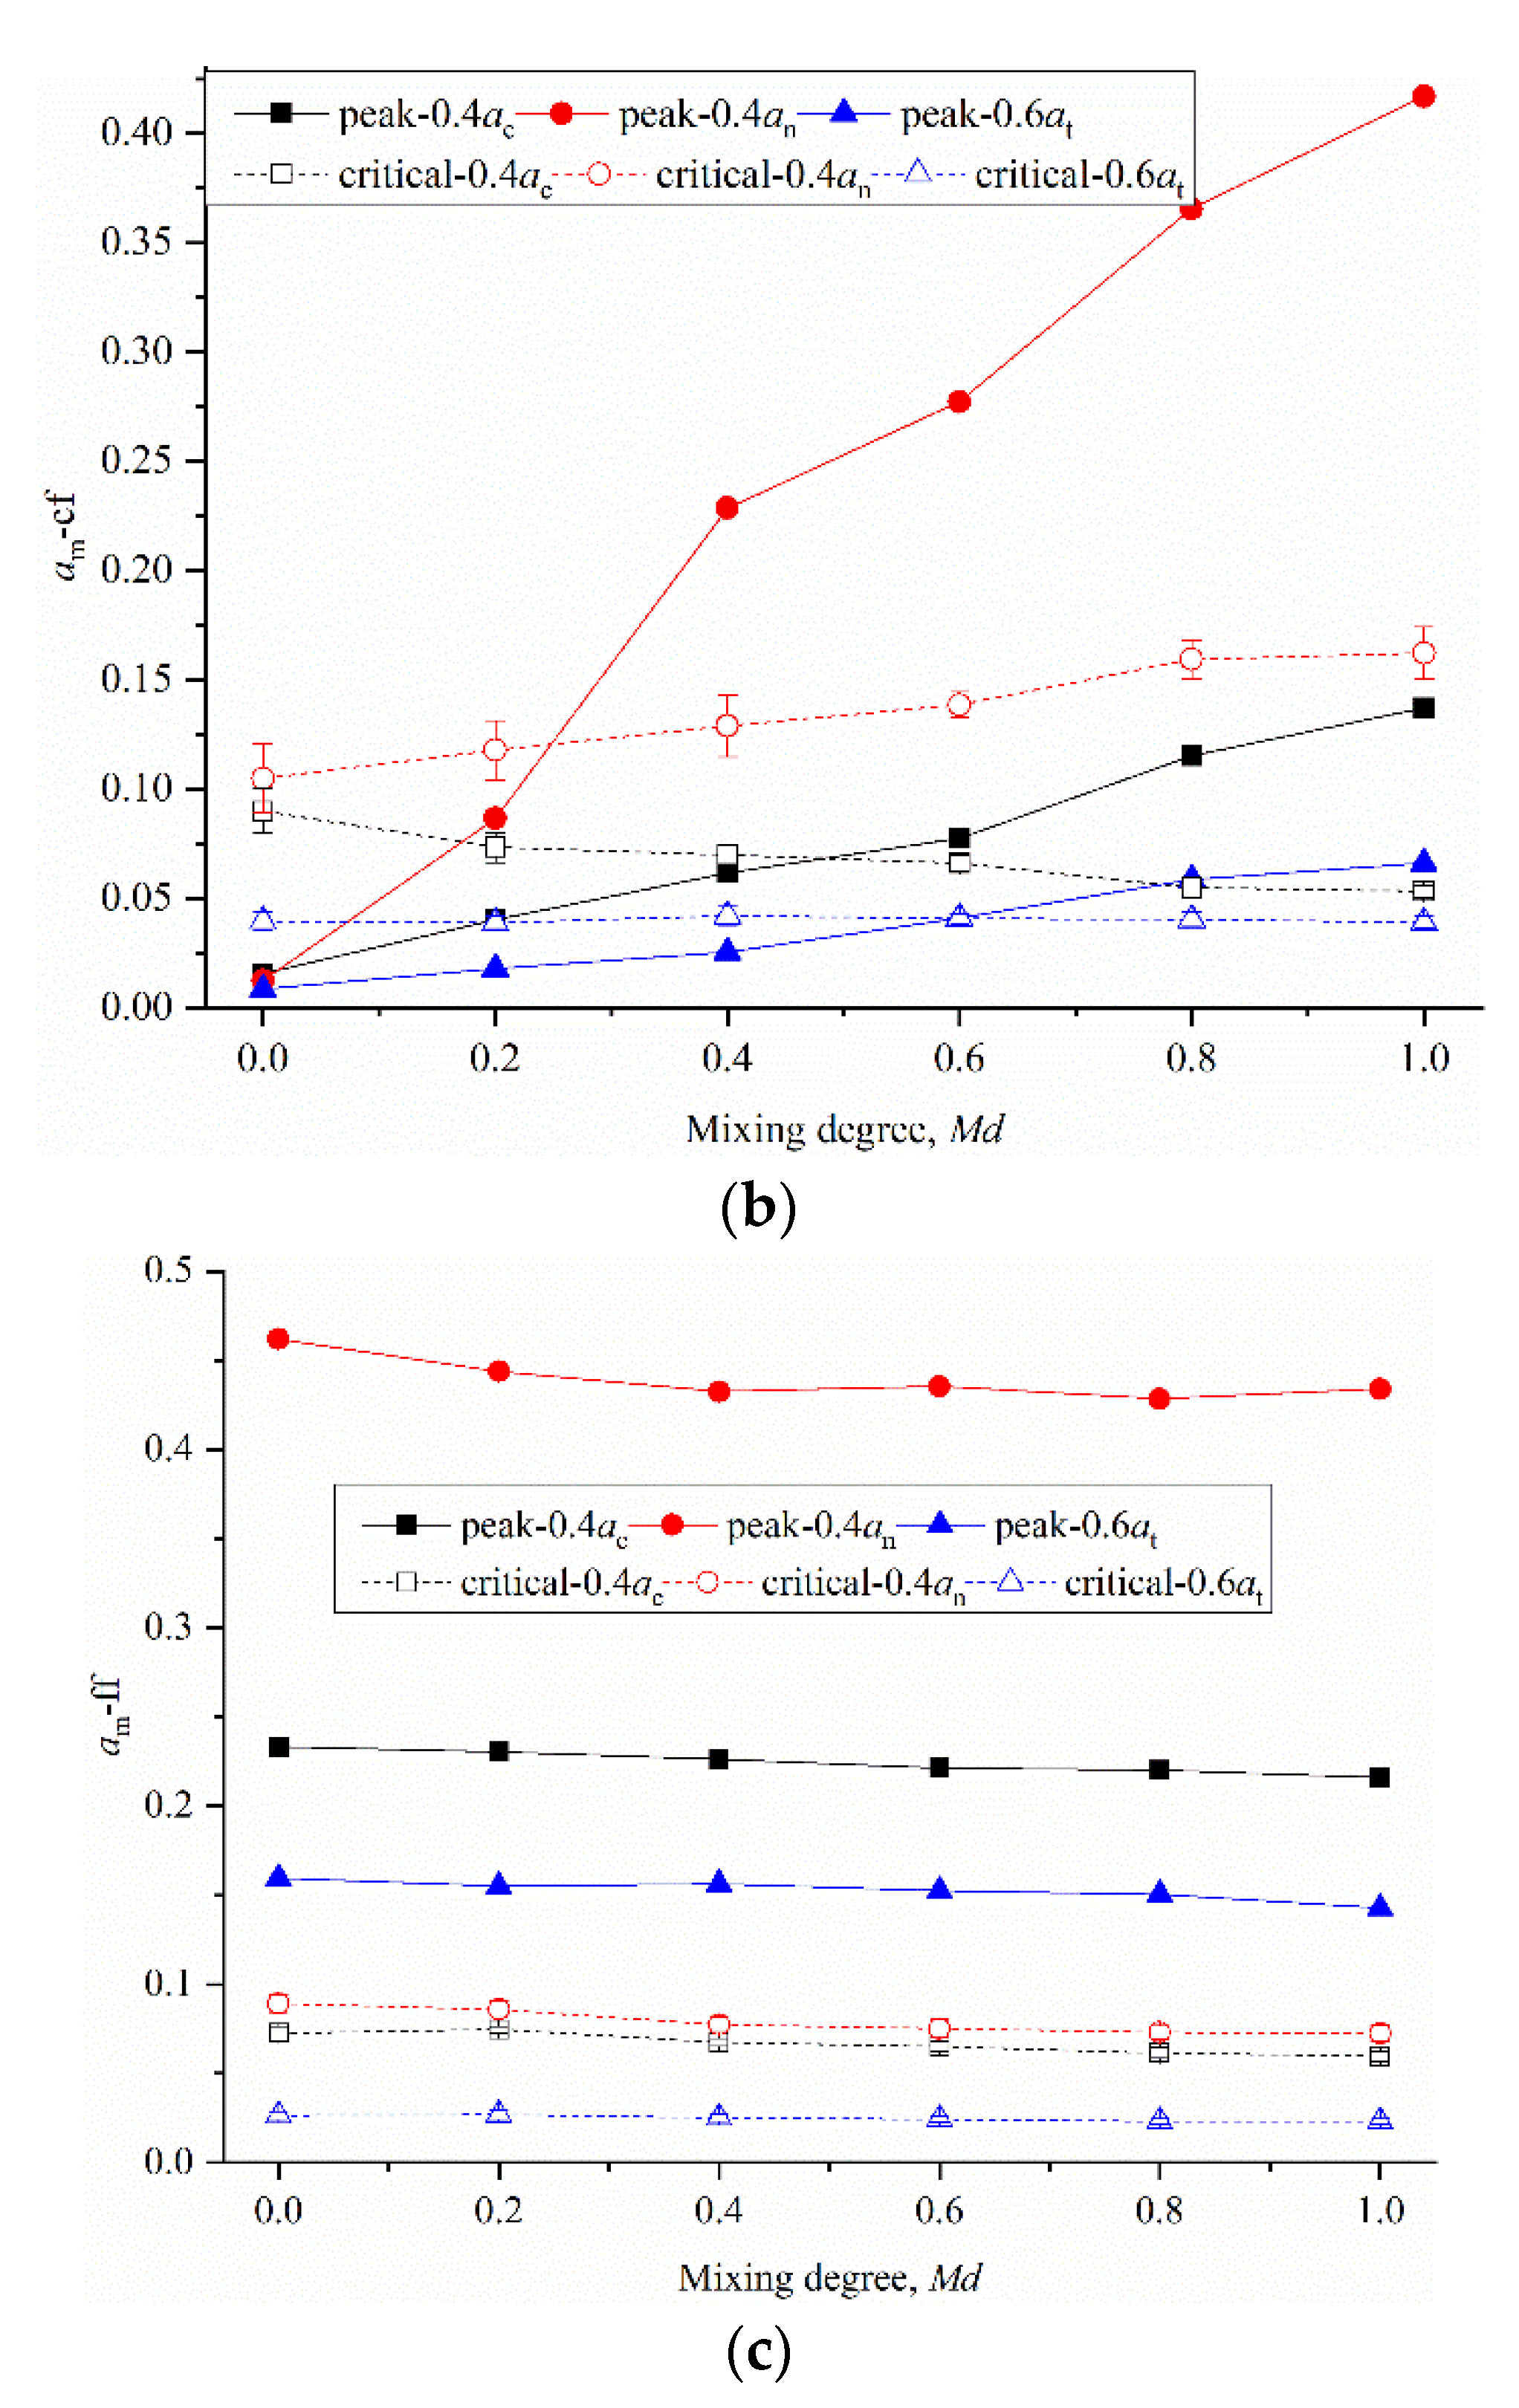
Considering that the force–fabric anisotropies in the binary geotechnical mixture are determined by the three subnetworks, as quantified in Equation (13), Figure 14a–c shows the evolution of the anisotropies for the various contact types as a function of Md. In the cc contact network, in the peak state, 0.4ac, 0.4an and 0.6at all decrease significantly with an increase in Md, while at the critical state, 0.4ac decreases slightly, 0.4an is relatively stable, and 0.6at increases slightly. In the cf contact network, 0.4ac, 0.4an and 0.6at are all significantly increased with the increase in Md in the peak state, while 0.4an is significantly increased, 0.4ac shows a downward trend, and 0.6at is basically stable in the critical state. In the ff contact network, all the force–fabric anisotropy coefficients show a slight downward trend regardless of the peak or critical state.
It can be seen that, in the peak state on the premise, the force–fabric anisotropies in the cc and ff contact networks decrease, and increase significantly in the cf contact network, which results in an increase in peak strength. In the critical state, although the force–fabric anisotropies of the sub-contact network change to some extent, the trend of these changes is relatively gentle, and plays a role in mutual cancellation, resulting in the stability of the critical strength. This result confirms the previous conclusion that the change in strength is mainly caused by the changes in the cf contact number and contact force.
4.3. Influence of Coarse Content on the Increased Range of Peak Shear Strength
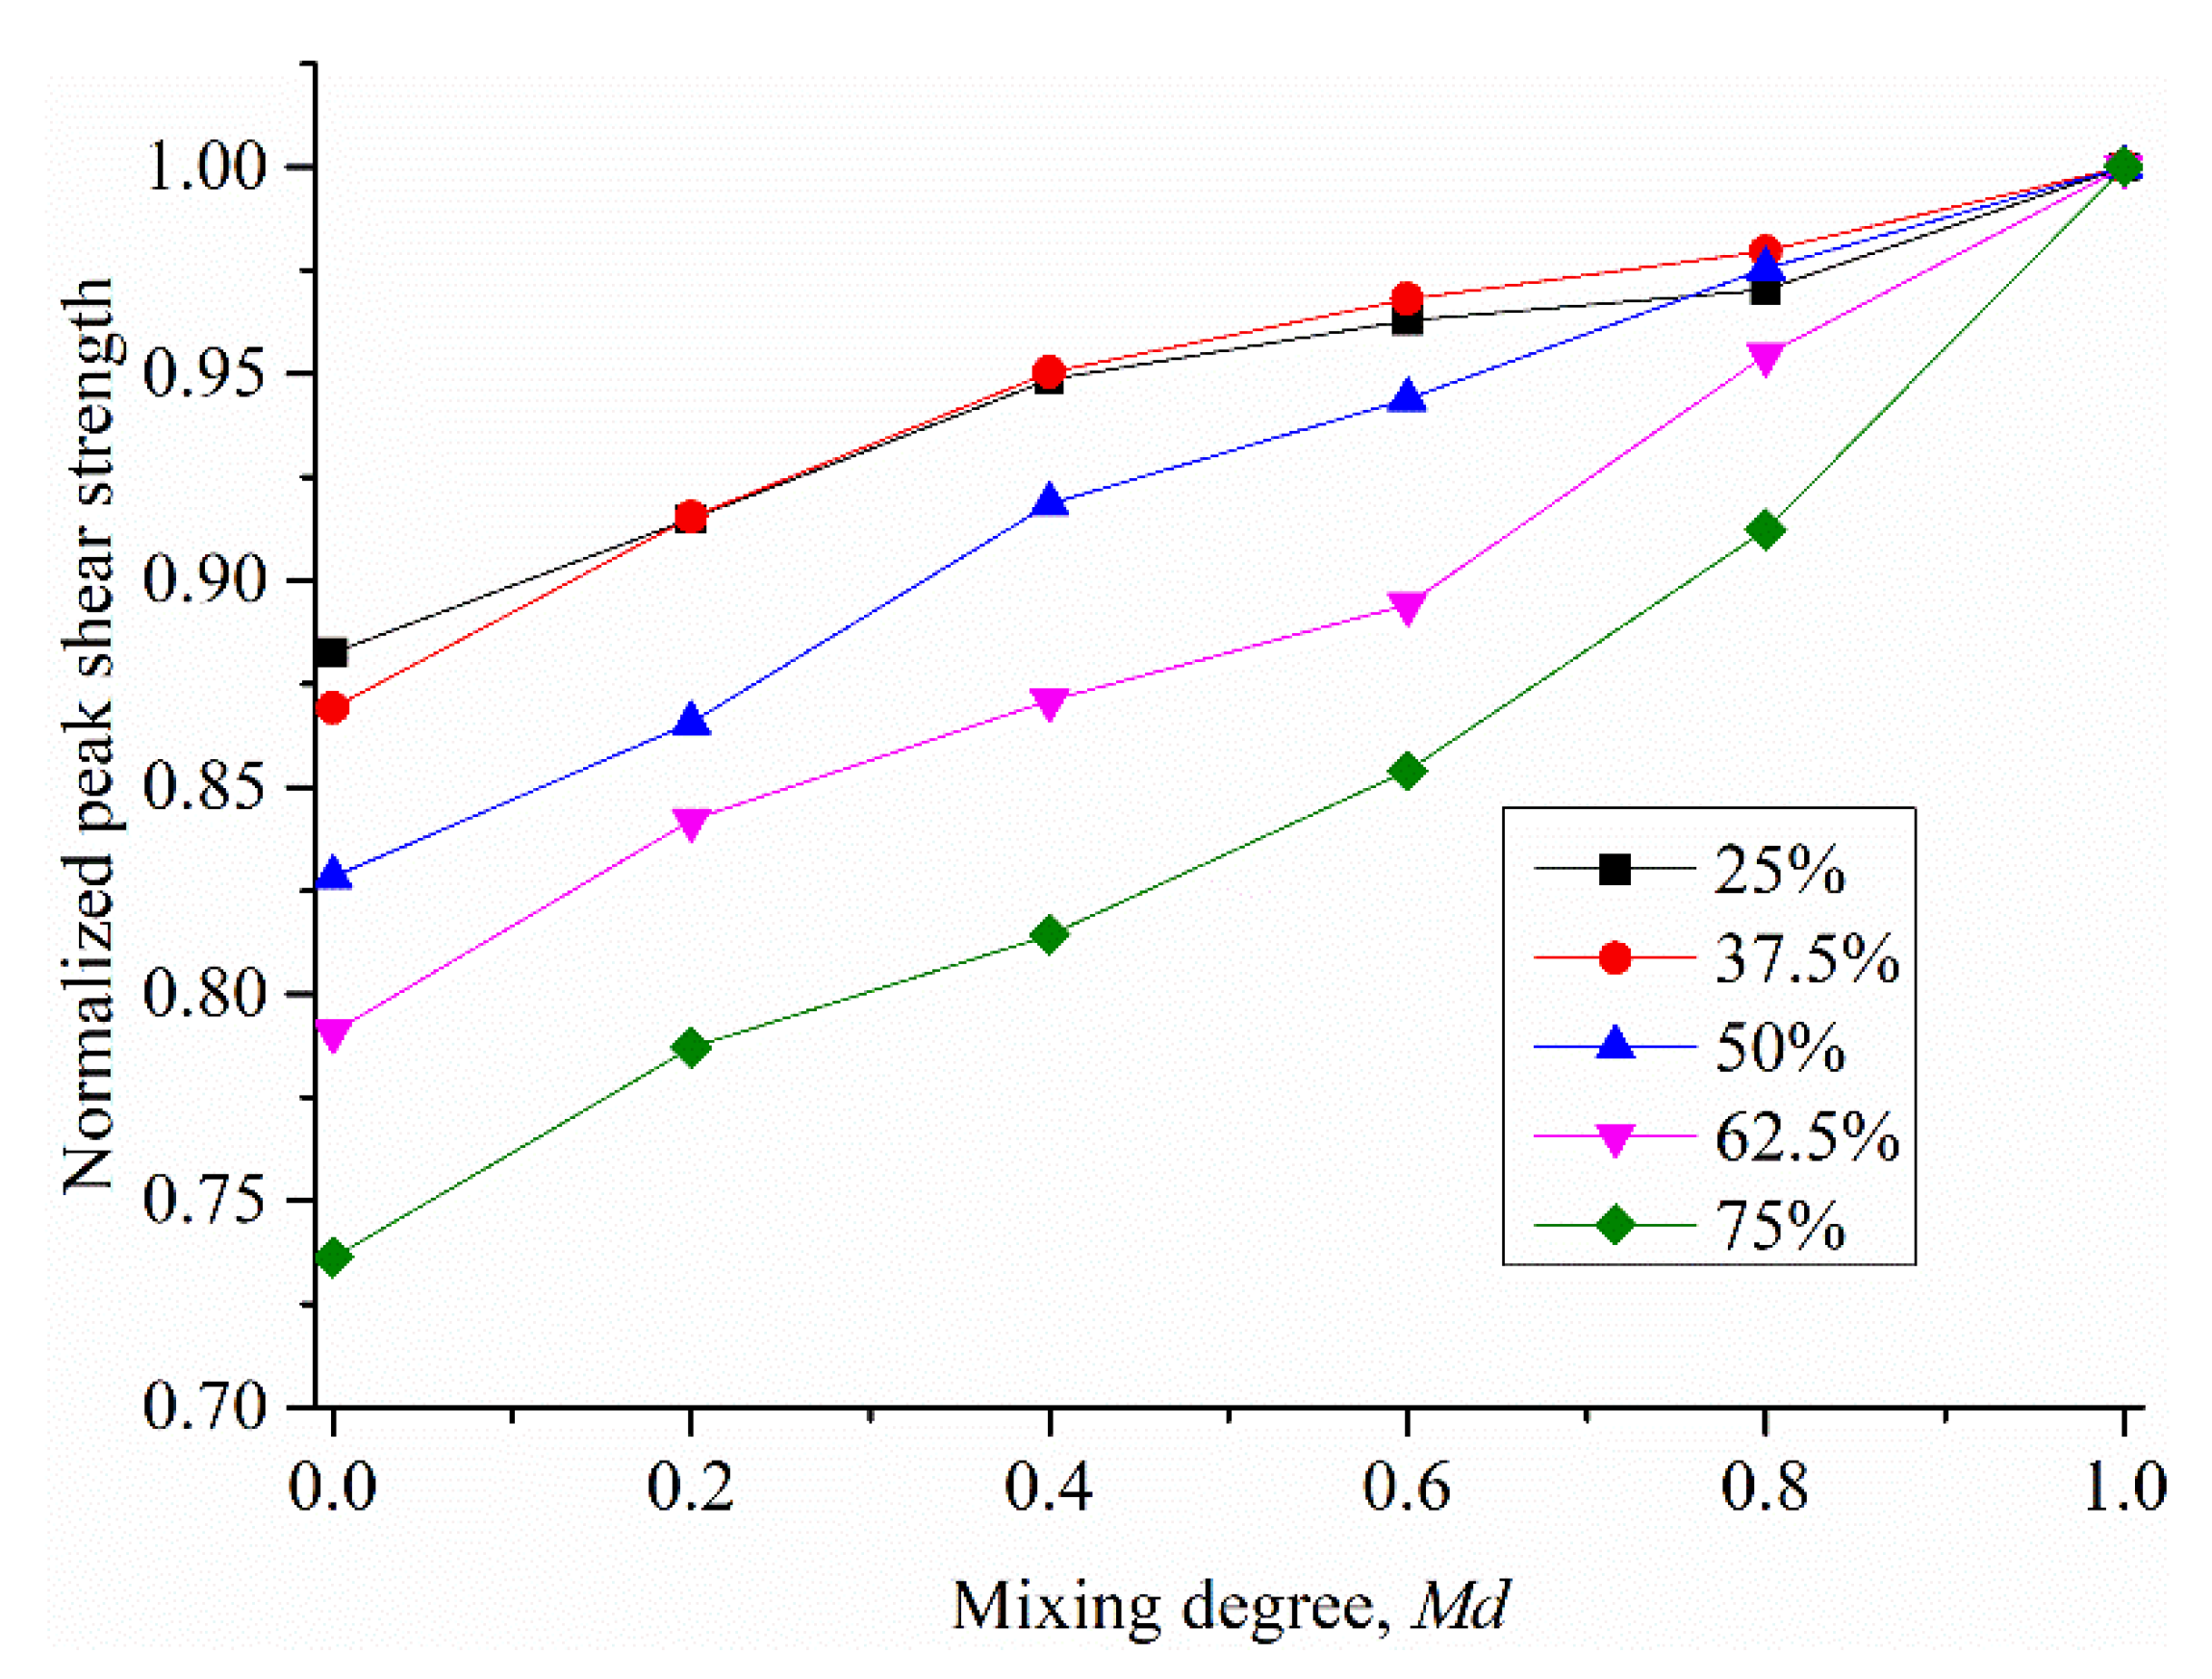
As shown in Figure 6, under the same mixing degree, the peak shear strength increases monotonically with increasing coarse content (which is increased from 25% to 75%). This is consistent with the results of previous studies on homogeneous specimens; that is, the maximum peak shear strength appears at a coarse content of approximately 75% [52,53]. However, another noteworthy phenomenon is that the increased range of peak shear strength with mixing degree is not consistent under different coarse contents. This means that the mixing degree has different influence levels on the peak shear strength of binary geotechnical mixtures with different coarse contents. Figure 15 shows the curve of normalized peak shear strength changing with mixing degree, where the values of the homogeneous specimens (Md = 1.0) are taken as the control. In order to make the conclusion more convincing, the results of samples with 37.5% and 62.5% coarse contents are added here. It can be clearly seen that the higher the coarse content, the more the peak strength is affected by the mixing degree. Specifically, as the coarse and fine particles in the specimens change from homogeneous mixing (Md = 1.0) to complete separation (Md = 0.0), the peak shear strength of the specimens decreases by 11.7% at 25% coarse content, while it decreases by 17.2% at 50% coarse content and decreases by 26.4% at 75% coarse content.
Some previous studies have shown that the binary geotechnical mixture exhibits many “optimal properties” when the coarse content is approximately 75%, and all of them show monotonically increasing properties with coarse content range of 25–75%. For example, the minimum void ratio results in the maximum peak shear strength [52]; in this case, the cf contact number and mean normal force also reach the maximum, while the sliding fraction of the cf contact is the minimum [54]. The cf contact is proven to be the main factor affecting the peak shear strength in this paper. On the other hand, for granular materials, the shear strength mainly depends on the interlocking effect of particle accumulation [55]. Meanwhile, a previous study shows that the average degree of interlocking of a particle increases with increasing coarse content [43]. The above conclusions show that when the coarse content is 75% and the specimen is homogeneously mixed (Md = 1.0), all the indices correspond to the peak shear strength. The mixing degree changes the local coarse content of the specimen. Regardless of the coarse content, the homogeneous specimen gradually exhibits complete segregation with further mixing degrees; that is, coarse and fine particles occupy separate parts of the specimen, as shown in Figure 2. Hence, there is no doubt that the closer the homogeneous specimen is to the “optimal state”, the more obvious the loss in strength when the mixing degree gradually changes to 0.0. That is, the closer the coarse content is to 75%, the more the peak shear strength is affected by the mixing degree.
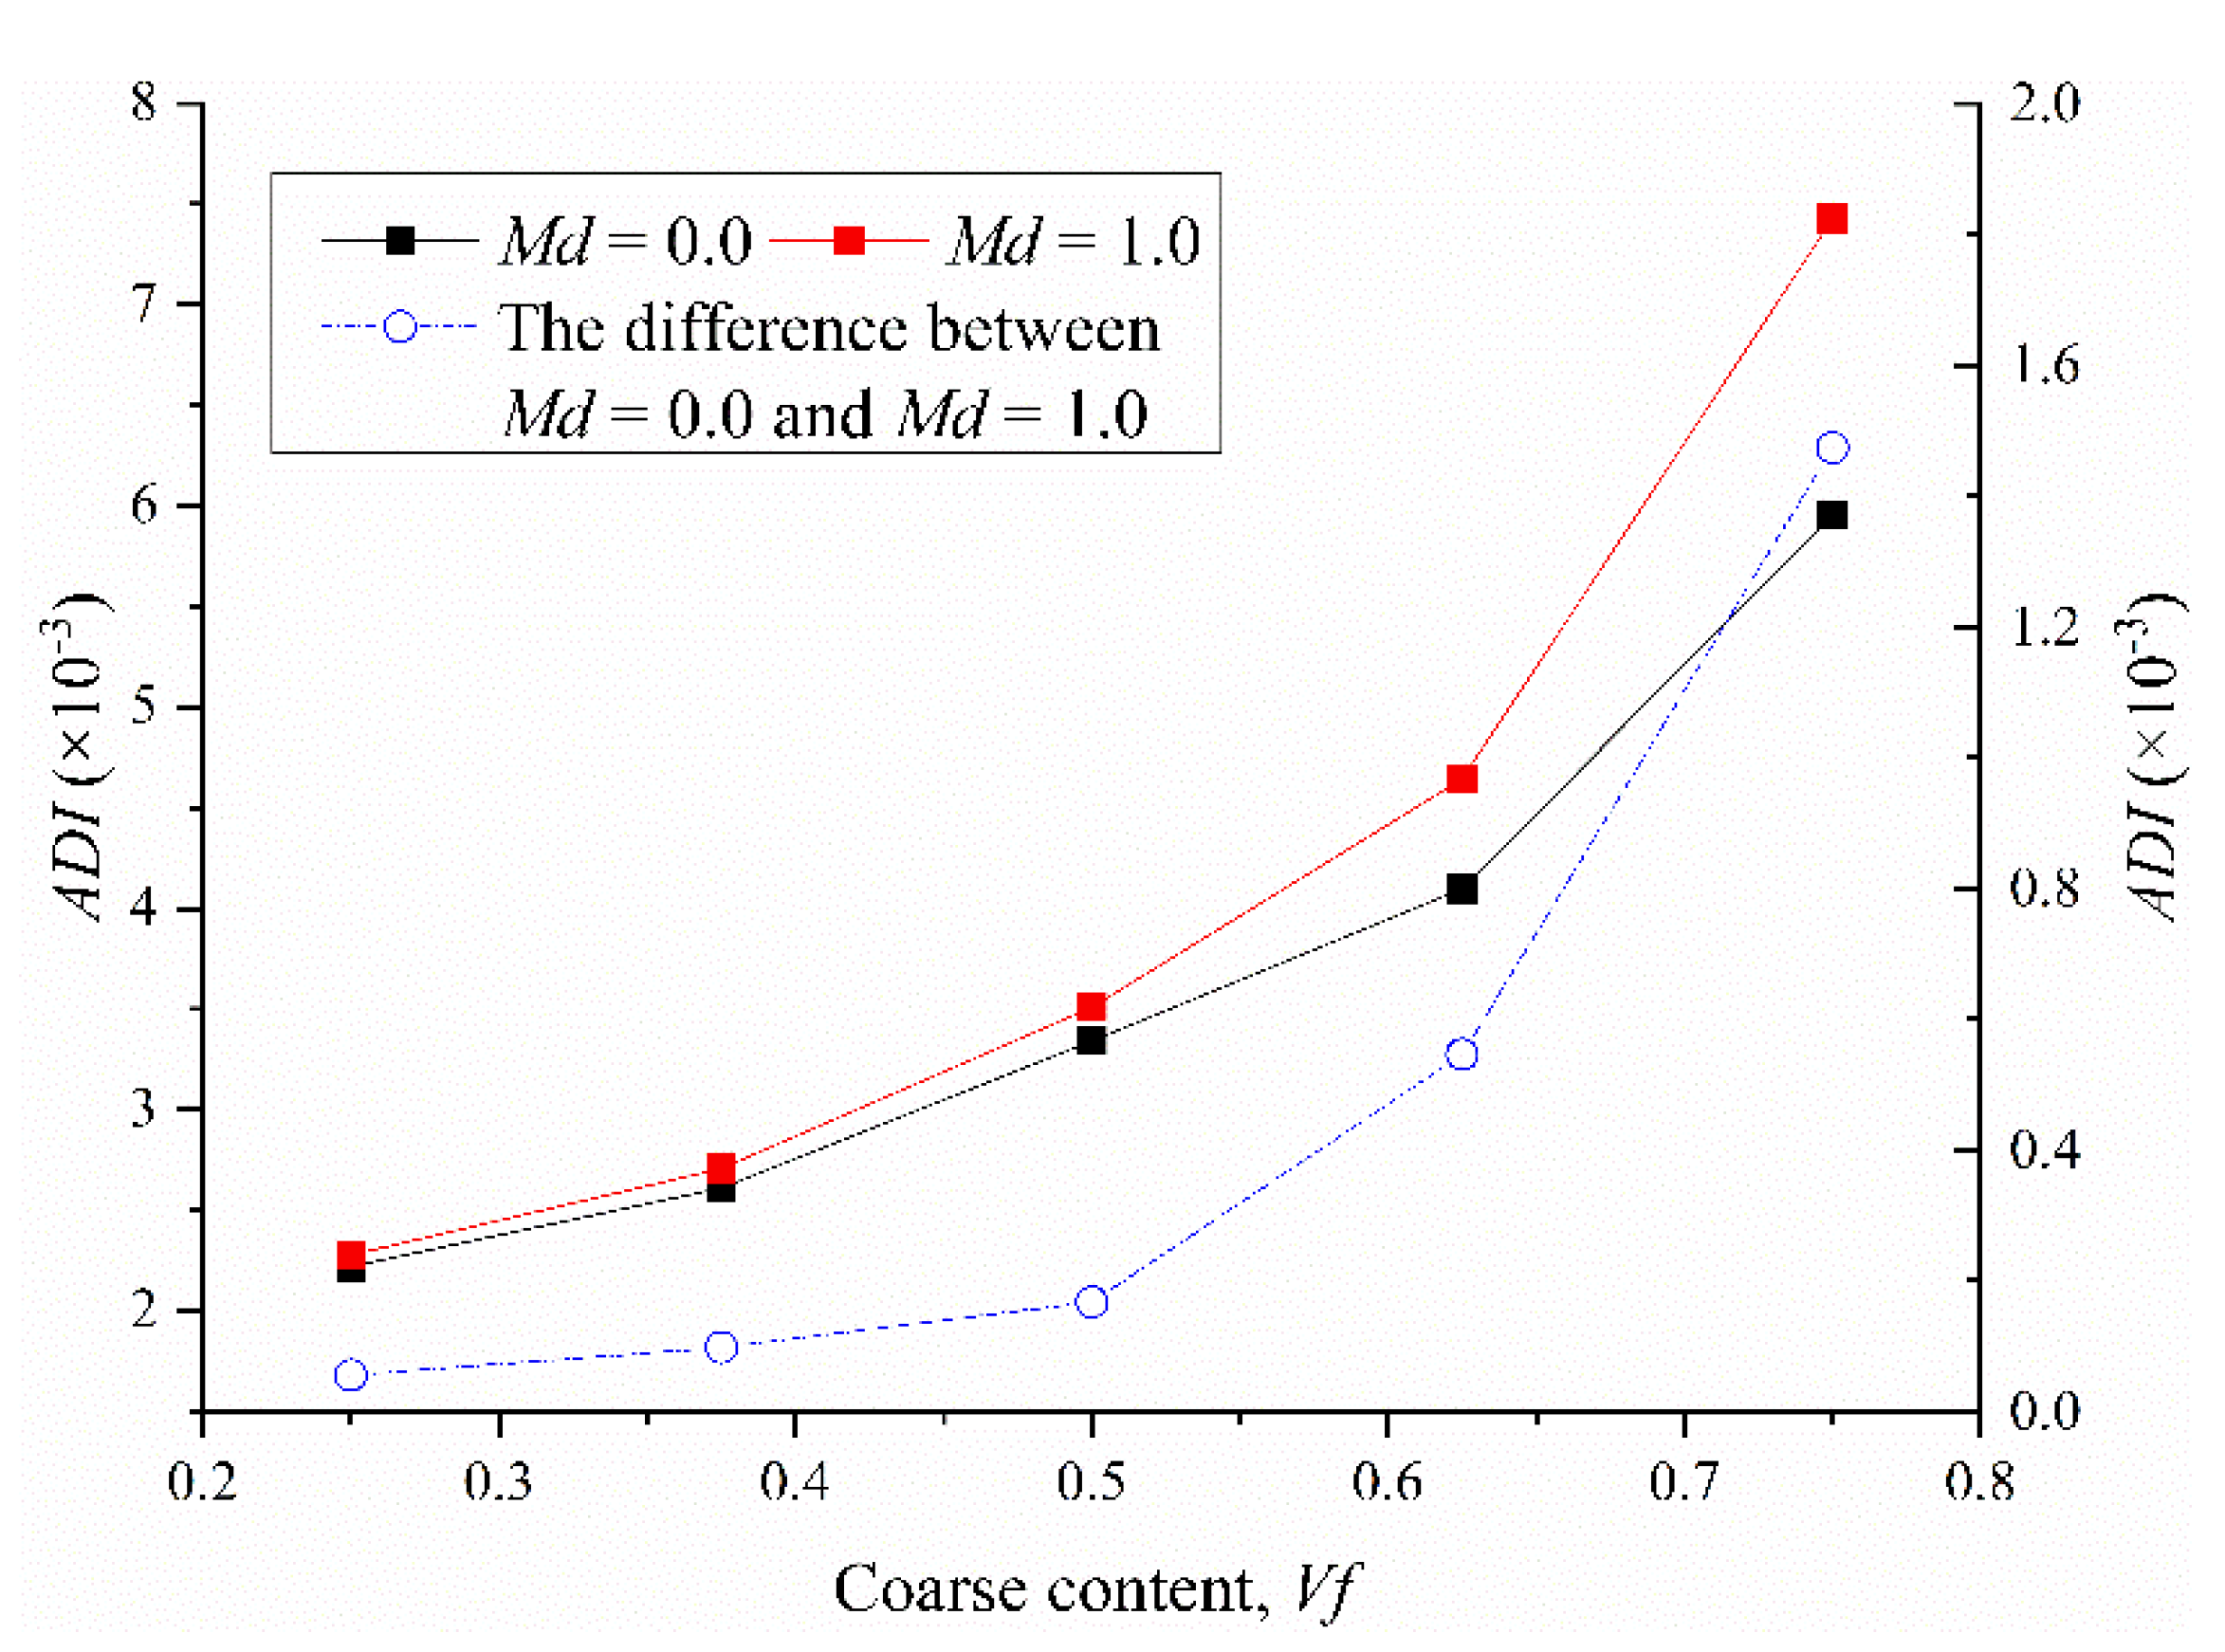
According to the definition of Scholtes et al. [56], the degree of interlocking of a particle p can be estimated through the assessment of its mean internal moment mp, and Gong et al [43] further stated that the average degree of interlocking (ADI) of a particle in the sample can be defined as: . Therefore, the evolution of ADI with respect to Vf is illustrated in Figure 16, which can be used to quantify the interlocking effect of samples with different coarse contents. It was clearly observed that the evolutions of ADI in the samples of Md = 0 and Md = 1 with Vf are roughly consistent. Specifically, the ADI value increases with the increase in Vf, and the increased range is wide continuously. This is in agreement with the conclusion of Gong et al [43]. It can be seen that the difference of ADI between Md = 0 and Md = 1 increases with the increase in Vf, and the increased range increased sharply with the increase in Vf. Thus, the higher the Vf the more the interlocking effect of the sample is affected by the mixing degree. This result, as an example, can be used to explain why the closer the coarse content is to 75%, the more the peak shear strength is affected by the mixing degree.
5. Conclusions
In this paper, the effect of the mixing degree on both the peak and critical shear strengths of binary geotechnical mixtures was quantitatively analyzed through verified DEM simulations. The results can guide the construction of marine geotechnical engineering, such as more accurate calculation of foundation stability and screw anchor bearing capacity. The samples with three coarse contents (ranging from 25% to 75%) and six mixing degrees (ranging from 0.0 to 1.0) were prepared to create specimens of binary geotechnical mixtures. Both the macroscopic trends of the variations in strength and the meso-mechanisms of the variations in strength were meticulously examined. The main findings are summarized as follows:
- (1)
- The peak shear strength increases with increasing mixing degree, while the critical shear strength is not affected. This trend is consistent with that of volumetric strain with increasing mixing degree, and the variation in peak shear strength is directly related to the peak dilatancy angle.
- (2)
- The variations in both the peak and critical shear strengths are mainly affected by the cf contact type. Specifically, when the mixing degree increases, the mean normal force of cf contacts does not change, while the increase in the number of cf contacts and their global distribution contribute to the increase in peak shear strength. The increase in the cf contact number and the changes in the distribution of cf contacts from local to global offset the influence of the reduction in the mean normal forces of the cc, cf and ff contacts and the cc and ff contact numbers, which results in stable critical shear strength.
- (3)
- The force–fabric anisotropies of the whole contact network and three subnetworks are evaluated. The force–fabric anisotropies of the whole contact network explain the microscopic mechanism of the strength. The increase in peak strength is mainly caused by the increase in 0.4an. And the increase in 0.4an and 0.6at, with a decrease in 0.4ac, offsets each other, which maintain the stability of the critical strength. The meticulous analysis of the force–fabric anisotropies of three subnetworks affords a way to explain the micro-mechanisms that result in the dependency of the contributions of different contact types to the strength on the mixing degree.
- (4)
- The range of coarse contents conformed to the definition of binary geotechnical mixture and the influence of the mixing degree on the peak shear strength increases with increasing coarse content. This means that with a higher coarse content, a greater influence of the mixing degree on the shear strength performance of binary geotechnical mixture should be considered.
Author Contributions
Conceptualization, S.L. and Z.L.; methodology, M.A.; validation, Y.N. and W.H.; resources, Z.L.; data curation, S.L.; writing—original draft preparation, S.L.; writing—review and editing, Y.N.; supervision, W.H.; project administration, Z.L.; funding acquisition, J.Z. All authors have read and agreed to the published version of the manuscript.
Funding
The study was funded by the National Natural Science Foundation of China, (Nos. 51809292, 52078500 and 52178332) and the Beijing Municipal Science and Technology Project: Research and Application of Design and Construction Technology of Railway Engineering Traveling the Rift Valley, China (No. Z181100003918005).
Institutional Review Board Statement
Not applicable.
Informed Consent Statement
Not applicable.
Data Availability Statement
Not applicable.
Conflicts of Interest
The authors declare no conflict of interest.
References
- Huang, Y.; Jin, P. Impact of human interventions on coastal and marine geological hazards: A review. Bull. Eng. Geol. Environ. 2018, 77, 1081–1090. [Google Scholar] [CrossRef]
- Fateh, A.M.A.; Eslami, A.; Fahimifar, A. Direct CPT and CPTu methods for determining bearing capacity of helical piles. Mar. Georesources Geotechnol. 2016, 35, 193–207. [Google Scholar] [CrossRef]
- Huang, Y.; Bao, Y.; Zhang, M.; Liu, C.; Lu, P. Analysis of the mechanism of seabed liquefaction induced by waves and related seabed protection. Nat. Hazards 2015, 79, 1399–1408. [Google Scholar] [CrossRef]
- Zhang, M.; Huang, Y.; Bao, Y. The mechanism of shallow submarine landslides triggered by storm surge. Nat. Hazards 2016, 81, 1373–1383. [Google Scholar] [CrossRef]
- Bondevik, S.; Mangerud, J.; Dawson, S.; Dawson, A.; Lohne, Ø. Evidence for three North Sea tsunamis at the Shetland Islands between 8000 and 1500 years ago. Quat. Sci. Rev. 2005, 24, 1757–1775. [Google Scholar] [CrossRef] [Green Version]
- Lee, C.-W.; Kim, Y.-S.; Yoon, Y.-S.; Chang, D.-S.; Choo, Y.W.; Jung, M.-C. Stability Study of a Tide Embankment Subjected to Sea Level Variations Using Centrifugal Model Tests. Mar. Georesources Geotechnol. 2015, 33, 376–390. [Google Scholar] [CrossRef]
- Azema, E.; Preechawuttipong, I.; Radjai, F. Binary mixtures of disks and elongated particles: Texture and mechanical properties. Phys. Rev. E 2016, 94, 042901. [Google Scholar] [CrossRef]
- Molinero Guerra, A.; Mokni, N.; Cui, Y.-J.; Delage, P.; Tang, A.M.; Aimedieu, P.; Bernier, F.; Bornert, M. Impact of initial structural heterogeneity on long-term swelling behavior of MX80 bentonite pellet/powder mixtures. Can. Geotech. J. 2020, 57, 1404–1416. [Google Scholar] [CrossRef]
- Dong, H.; Peng, B.; Gao, Q.-F.; Hu, Y.; Jiang, X. Study of hidden factors affecting the mechanical behavior of soil–rock mixtures based on abstraction idea. Acta Geotech. 2021, 16, 595–611. [Google Scholar] [CrossRef]
- Liu, S.; Hu, W.; Gong, J.; Nie, Z. An improved index of mixing degree and its effect on the strength of binary geotechnical mixtures. Granul. Matter 2021, 24, 1–19. [Google Scholar] [CrossRef]
- Cao, X.; Zhu, Y.; Gong, J. Effect of the intermediate principal stress on the mechanical responses of binary granular mixtures with different fines contents. Granul. Matter 2021, 23, 1–19. [Google Scholar] [CrossRef]
- Rahman, S.; Khattak, M.J.; Adhikari, B.; Adhikari, S. Discrete element modeling of bonded soil mixtures under uniaxial compression and indirect tension test. Transp. Geotech. 2021, 26, 100438. [Google Scholar] [CrossRef]
- Lacey, P.M.C. Developments in the theory of particle mixing. J. Appl. Chem. 1954, 4, 257–268. [Google Scholar] [CrossRef]
- Windows-Yule, C.R.K.; Scheper, B.J.; Horn, A.J.; Hainsworth, N.; Saunders, J.; Parker, D.J.; Thornton, A.R. Understanding and exploiting competing segregation mechanisms in horizontally rotated granular media. New J. Phys. 2016, 18, 023013. [Google Scholar] [CrossRef]
- Cho, M.; Dutta, P.; Shim, J. A non-sampling mixing index for multicomponent mixtures. Powder Technol. 2017, 319, 434–444. [Google Scholar] [CrossRef]
- Siraj, M.S.; Radl, S.; Glasser, B.J.; Khinast, J.G. Effect of blade angle and particle size on powder mixing performance in a rectangular box. Powder Technol. 2011, 211, 100–113. [Google Scholar] [CrossRef]
- Yan, Z.; Wilkinson, S.K.; Stitt, E.H.; Marigo, M. Investigating mixing and segregation using discrete element modelling (DEM) in the Freeman FT4 rheometer. Int. J. Pharm. 2016, 513, 38–48. [Google Scholar] [CrossRef]
- Konan, N.A.; Huckaby, E.D. Kinetic theory-based numerical modeling and analysis of bi-disperse segregated mixture fluidized bed. Powder Technol. 2017, 319, 71–91. [Google Scholar] [CrossRef]
- Dai, B.B.; Yang, J.; Liu, F.T.; Gu, X.Q.; Lin, K.R. A new index to characterize the segregation of binary mixture. Powder Technol. 2020, 363, 611–620. [Google Scholar] [CrossRef]
- Medley, E. Systematic characterization of melange bimrocks and other chaotic soil_rock mixtures. Felsbau 1999, 17, 152–162. [Google Scholar]
- Zhao, H.F.; Zhang, L.M. Effect of coarse content on shear behavior of unsaturated coarse granular soils. Can. Geotech. J. 2014, 51, 1371–1383. [Google Scholar] [CrossRef]
- Yan, X.; Zhan, W.; Hu, Z.; Yu, Y.; Xiao, D.; de Oliveira Correia, J.A.F. Experimental Study on the Effect of Compaction Work and Defect on the Strength of Soil-Rock Mixture Subgrade. Adv. Mater. Sci. Eng. 2021, 2021, 1–13. [Google Scholar] [CrossRef]
- Belheine, N.; Plassiard, J.P.; Donzé, F.V.; Darve, F.; Seridi, A. Numerical simulation of drained triaxial test using 3D discrete element modeling. Comput. Geotech. 2009, 36, 320–331. [Google Scholar] [CrossRef]
- Evans, T.M.; Valdes, J.R. The microstructure of particulate mixtures in one-dimensional compression: Numerical studies. Granul. Matter 2011, 13, 657–669. [Google Scholar] [CrossRef]
- Zhao, S.; Matthew, E.T.; Zhou, X. Shear-induced anisotropy of granular materials with rolling resistance and particle shape effects. Int. J. Solids Struct. 2018, 150, 268–281. [Google Scholar] [CrossRef]
- Abedi, S.; Mirghasemi, A.A. Particle shape consideration in numerical simulation of assemblies of irregularly shaped particles. Particuology 2011, 9, 387–397. [Google Scholar] [CrossRef]
- Gong, J.; Liu, J. Effect of aspect ratio on triaxial compression of multi-sphere ellipsoid assemblies simulated using a discrete element method. Particuology 2017, 32, 49–62. [Google Scholar] [CrossRef]
- Nie, Z.; Zhu, Y.; Wang, X.; Gong, J. Investigating the effects of Fourier-based particle shape on the shear behaviors of rockfill material via DEM. Granul. Matter 2019, 21, 1–15. [Google Scholar] [CrossRef]
- Yang, Y.; Wang, J.F.; Cheng, Y.M. Quantified evaluation of particle shape effects from micro-to-macro scales for non-convex grains. Particuology 2016, 25, 23–35. [Google Scholar] [CrossRef]
- Xu, W.J.; Xu, Q.; Hu, R.L. Study on the shear strength of soil–rock mixture by large scale direct shear test. Int. J. Rock Mech. Min. Sci. 2011, 48, 1235–1247. [Google Scholar]
- Zhou, W.; Xu, K.; Ma, G.; Yang, L.; Chang, X. Effects of particle size ratio on the macro- and microscopic behaviors of binary mixtures at the maximum packing efficiency state. Granul. Matter 2016, 18, 1–13. [Google Scholar] [CrossRef]
- Abbireddy, C.O.R.; Clayton, C.R.I. Varying initial void ratios for DEM simulations. Géotechnique 2010, 60, 497–502. [Google Scholar] [CrossRef]
- Zhao, S.; Evans, T.; Zhou, X. Effects of curvature-related DEM contact model on the macro-and micro-mechanical behaviours of granular soils. Géotechnique 2018, 68, 1085–1098. [Google Scholar] [CrossRef]
- Nie, Z.; Liu, S.; Hu, W.; Gong, J. Effect of local non-convexity on the critical shear strength of granular materials determined via the discrete element method. Particuology 2020, 52, 105–112. [Google Scholar] [CrossRef]
- Minh, N.H.; Cheng, Y.P. A DEM investigation of the effect of particle-size distribution on one-dimensional compression. Géotechnique 2013, 63, 44–53. [Google Scholar] [CrossRef]
- Gu, X.; Zhang, J.; Huang, X. DEM analysis of monotonic and cyclic behaviors of sand based on critical state soil mechanics framework. Comput. Geotech. 2020, 128, 103787. [Google Scholar] [CrossRef]
- Zhu, Y.; Nie, Z.; Gong, J. Influence of the rolling-resistance-based shape of coarse particles on the shear responses of granular mixtures. Particuology 2020, 52, 67–82. [Google Scholar] [CrossRef]
- Bolton, M.D. The strength and dilatancy of sands. Géotechnique 1986, 35, 65–78. [Google Scholar] [CrossRef] [Green Version]
- Simoni, A.; Houlsby, G.T. The Direct Shear Strength and Dilatancy of Sand-gravel Mixtures. Geotech. Geol. Eng. 2006, 24, 523–549. [Google Scholar] [CrossRef]
- Rowe, P.W. The relation between the shear strength of sands in triaxial compression, plane strain and direct. Geotech. 1969, 19, 75–86. [Google Scholar] [CrossRef]
- Thornton, C. Numerical simulations of deviatoric shear deformation of granular media. Géotechnique 2000, 50, 43–53. [Google Scholar] [CrossRef]
- Minh, N.H.; Cheng, Y.P.; Thornton, C. Strong force networks in granular mixtures. Granul. Matter 2014, 16, 69–78. [Google Scholar] [CrossRef]
- Gong, J.; Liu, J.; Cui, L. Shear behaviors of granular mixtures of gravel-shaped coarse and spherical fine particles investigated via discrete element method. Powder Technol. 2019, 353, 178–194. [Google Scholar] [CrossRef]
- De Frias Lopez, R.; Silfwerbrand, J.; Jelagin, D.; Birgisson, B. Force transmission and soil fabric of binary granular mixtures. Géotechnique 2016, 66, 578–583. [Google Scholar] [CrossRef]
- Vallejo, L.E. Interpretation of the limits in shear strength in binary granular mixtures. Can. Geotech. J. 2001, 38, 1097–1104. [Google Scholar] [CrossRef]
- Voivret, C.; Radjai, F.; Delenne, J.Y.; El Youssoufi, M.S. Multiscale force networks in highly polydisperse granular media. Phys. Rev. Lett. 2009, 102, 178001. [Google Scholar] [CrossRef] [PubMed] [Green Version]
- Gong, J.; Liu, J. Mechanical transitional behavior of binary mixtures via DEM: Effect of differences in contact-type friction coefficients. Comput. Geotech. 2017, 85, 1–14. [Google Scholar] [CrossRef]
- Sufian, A.; Russell, A.R.; Whittle, A.J. Anisotropy of contact networks in granular media and its influence on mobilised internal friction. Géotechnique 2017, 67, 1–14. [Google Scholar] [CrossRef]
- Ouadfel, H.; Rothenburg, L. ‘Stress-force-fabric’ relationship for assemblies of ellipsoids. Mech. Mater. 2001, 33, 201–221. [Google Scholar] [CrossRef]
- Guo, N.; Zhao, J. The signature of shear-induced anisotropy in granular media. Comput. Geotech. 2013, 47, 1–15. [Google Scholar] [CrossRef]
- Markauskas, D.; Kačianauskas, R.; Džiugys, A.; Navakas, R. Investigation of adequacy of multi-sphere approximation of elliptical particles for DEM simulations. Granul. Matter 2009, 12, 107–123. [Google Scholar] [CrossRef]
- Zhu, Y.; Nie, Z.; Gong, J.; Zou, J.; Zhao, L.; Li, L. An analysis of the effects of the size ratio and fines content on the shear behaviors of binary mixtures using DEM. Comput. Geotech. 2020, 118, 103353. [Google Scholar] [CrossRef]
- Zhu, Y.; Gong, J.; Nie, Z. Numerical investigation of the elastic properties of binary mixtures as a function of the size ratio and fines content. Int. J. Geomech. 2020, 20, 04020155. [Google Scholar] [CrossRef]
- Zhou, W.; Wu, W.; Ma, G.; Ng, T.-T.; Chang, X. Undrained behavior of binary granular mixtures with different fines contents. Powder Technol. 2018, 340, 139–153. [Google Scholar] [CrossRef]
- Yao, Y.; Li, J.; Ni, J.; Liang, C.; Zhang, A. Effects of gravel content and shape on shear behaviour of soil-rock mixture: Experiment and DEM modelling. Comput. Geotech. 2022, 141, 104476. [Google Scholar] [CrossRef]
- Scholtès, L.; Hicher, P.-Y.; Sibille, L. Multiscale approaches to describe mechanical responses induced by particle removal in granular materials. C. R. Mécanique 2010, 338, 627–638. [Google Scholar] [CrossRef] [Green Version]
Figure 1.
Calculation diagram of mixing degree.

Figure 2.
The coarse content as a function of normalized depth H/HM for the prepared specimens: (a) Vf0 = 25%; (b) Vf0 = 50%; and (c) Vf0 = 75%.
Figure 2.
The coarse content as a function of normalized depth H/HM for the prepared specimens: (a) Vf0 = 25%; (b) Vf0 = 50%; and (c) Vf0 = 75%.


Figure 3.
Reliability verification of the numerical simulation.

Figure 4.
Specimen preparation process: (a) generate particles; (b) eliminate the large contact forces; (c) prepare specimen.
Figure 4.
Specimen preparation process: (a) generate particles; (b) eliminate the large contact forces; (c) prepare specimen.

Figure 5.
The q/p′ versus axial strain ε1, for specimens with different mixing degrees.

Figure 6.
The peak and critical shear strengths as a function of mixing degree.

Figure 7.
Evolution of the volumetric strain (εv) with the axial strain (ε1).

Figure 8.
The peak shrinkage and critical dilatancy as a function of Md.

Figure 9.
The peak dilatancy angle and dilatancy coefficient as a function of Md.

Figure 10.
Evolutions of the partial coordination number and the contribution of each contact type to the shear strength with Md.
Figure 10.
Evolutions of the partial coordination number and the contribution of each contact type to the shear strength with Md.

Figure 11.
The variation of local fabric structures with depth.

Figure 12.
Distribution of cf contacts in the specimens when ε1 = 0.4.

Figure 13.
Variations in anisotropies with respect to Md.

Figure 14.
Evolutions of anisotropies of different contact types as a function of Md: (a) cc contact; (b) cf contact; (c) ff contact.
Figure 14.
Evolutions of anisotropies of different contact types as a function of Md: (a) cc contact; (b) cf contact; (c) ff contact.


Figure 15.
Normalized peak shear strength as a function of mixing degree.

Figure 16.
Evolution of the average degree of interlocking of a particle in the sample ADI with respect to Vf.
Figure 16.
Evolution of the average degree of interlocking of a particle in the sample ADI with respect to Vf.


Table 1.
The contact numbers and the mean normal contact forces _m of various specimens.
| State | Specimen | Ccc | Ccf | Cff | ||||
|---|---|---|---|---|---|---|---|---|
| peak | I = 0.0 | 2795.68 | 250.28 | 117.78 | 149.95 | 403 | 756 | 36,211 |
| I = 0.2 | 2796.66 | 246.22 | 126.88 | 160.88 | 362 | 2062 | 33,239 | |
| I = 0.4 | 2664.39 | 250.87 | 125.23 | 162.89 | 309 | 3083 | 30,310 | |
| I = 0.6 | 2936.14 | 248.44 | 127.54 | 164.82 | 227 | 5230 | 27,208 | |
| I = 0.8 | 2833.42 | 256.10 | 129.67 | 161.64 | 116 | 6714 | 25,614 | |
| I = 1.0 | 3272.87 | 255.50 | 124.99 | 169.73 | 96 | 7802 | 20,904 | |
| critical | I = 0.0 | 2104.77 | 326.81 | 114.41 | 144.26 | 398 | 1173 | 31,348 |
| I = 0.2 | 2153.30 | 312.60 | 113.70 | 149.69 | 343 | 2099 | 27,270 | |
| I = 0.4 | 1997.71 | 302.12 | 113.09 | 154.18 | 312 | 3006 | 24,827 | |
| I = 0.6 | 1853.70 | 290.62 | 106.88 | 154.75 | 210 | 4627 | 20,895 | |
| I = 0.8 | 1718.37 | 274.28 | 96.98 | 139.63 | 97 | 5863 | 19,102 | |
| I = 1.0 | 1649.24 | 245.63 | 99.41 | 136.64 | 76 | 6657 | 18,589 |
Publisher’s Note: MDPI stays neutral with regard to jurisdictional claims in published maps and institutional affiliations. |
© 2022 by the authors. Licensee MDPI, Basel, Switzerland. This article is an open access article distributed under the terms and conditions of the Creative Commons Attribution (CC BY) license (https://creativecommons.org/licenses/by/4.0/).
Share and Cite
MDPI and ACS Style
Liu, S.; Nie, Y.; Hu, W.; Ashiru, M.; Li, Z.; Zuo, J. The Influence of Mixing Degree between Coarse and Fine Particles on the Strength of Offshore and Coast Foundations. Sustainability 2022, 14, 9177. https://doi.org/10.3390/su14159177
AMA Style
Liu S, Nie Y, Hu W, Ashiru M, Li Z, Zuo J. The Influence of Mixing Degree between Coarse and Fine Particles on the Strength of Offshore and Coast Foundations. Sustainability. 2022; 14(15):9177. https://doi.org/10.3390/su14159177
Chicago/Turabian StyleLiu, Shunkai, Yuxing Nie, Wei Hu, Mohammed Ashiru, Zhong Li, and Jun Zuo. 2022. "The Influence of Mixing Degree between Coarse and Fine Particles on the Strength of Offshore and Coast Foundations" Sustainability 14, no. 15: 9177. https://doi.org/10.3390/su14159177
Note that from the first issue of 2016, this journal uses article numbers instead of page numbers. See further details here.