
Phenotypic Variability of Wheat and Environmental Share in Soil Salinity Stress [3S] Conditions

 ,
,  ,
,  , , ,
, , ,  , ,
, ,
Abstract
:1. Introduction
2. Materials and Methods
2.1. Plant Material and Field Exams
2.2. Statistical Tools
3. Results
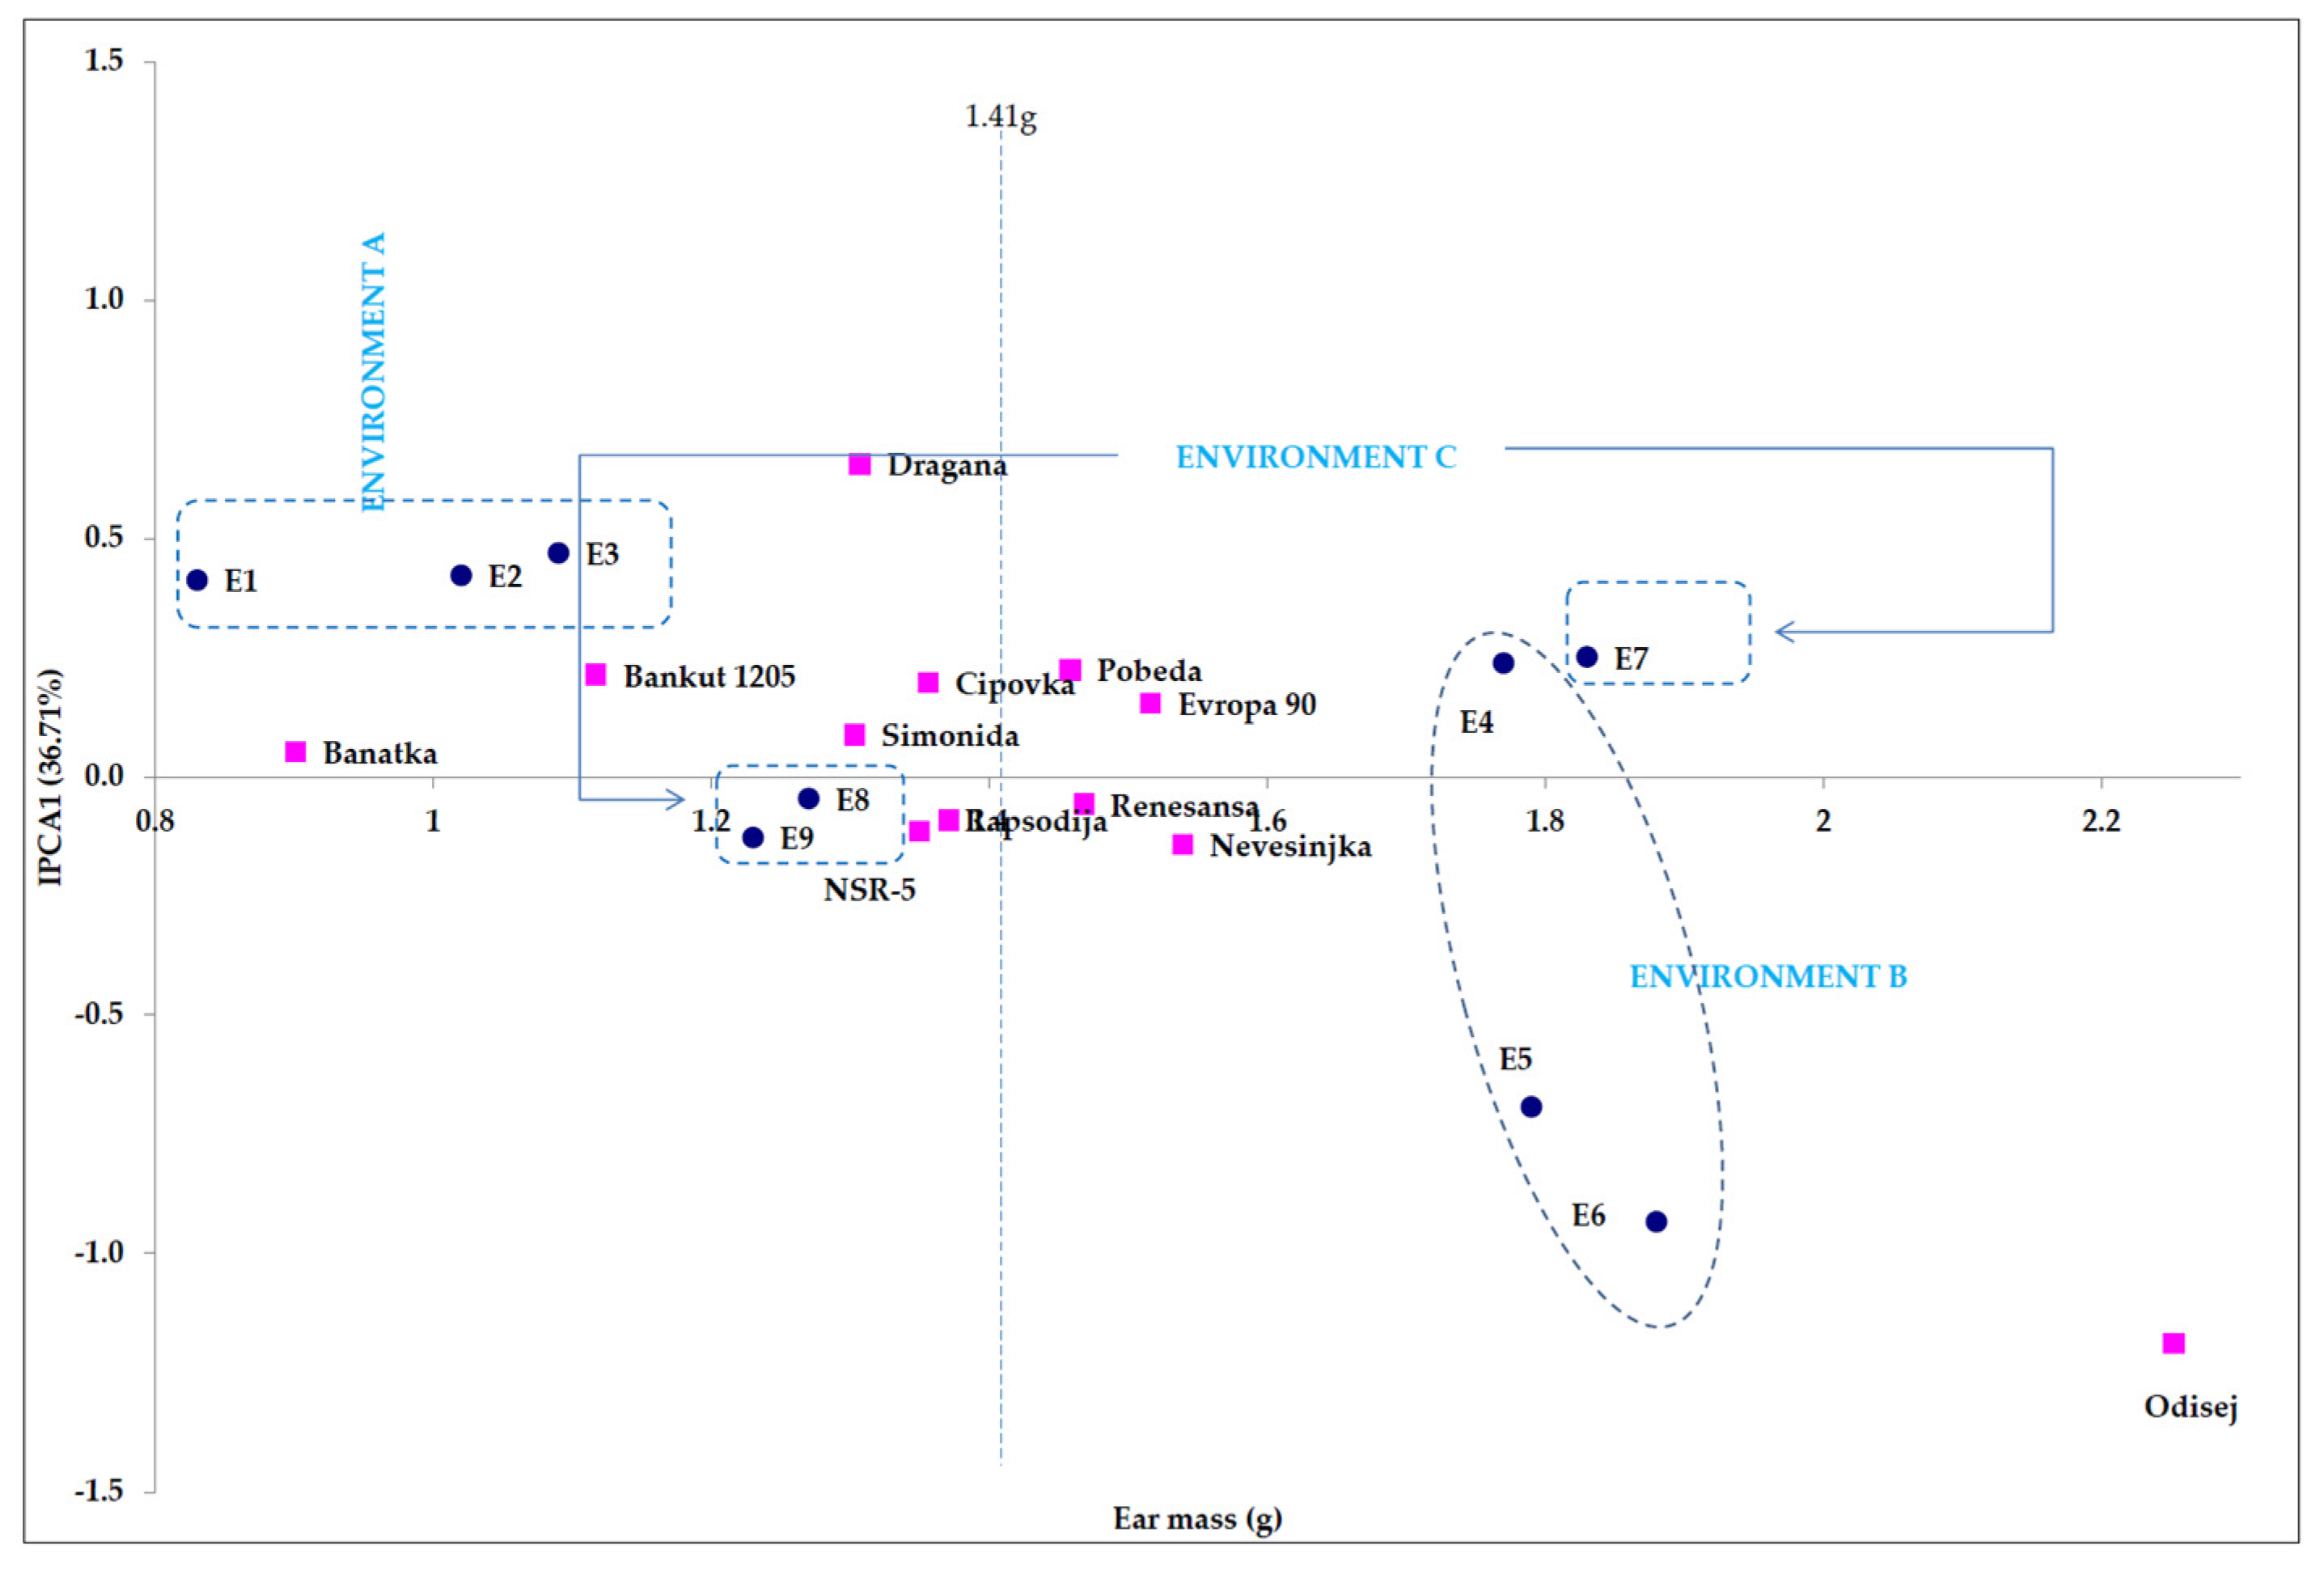
3.1. Ear Mass
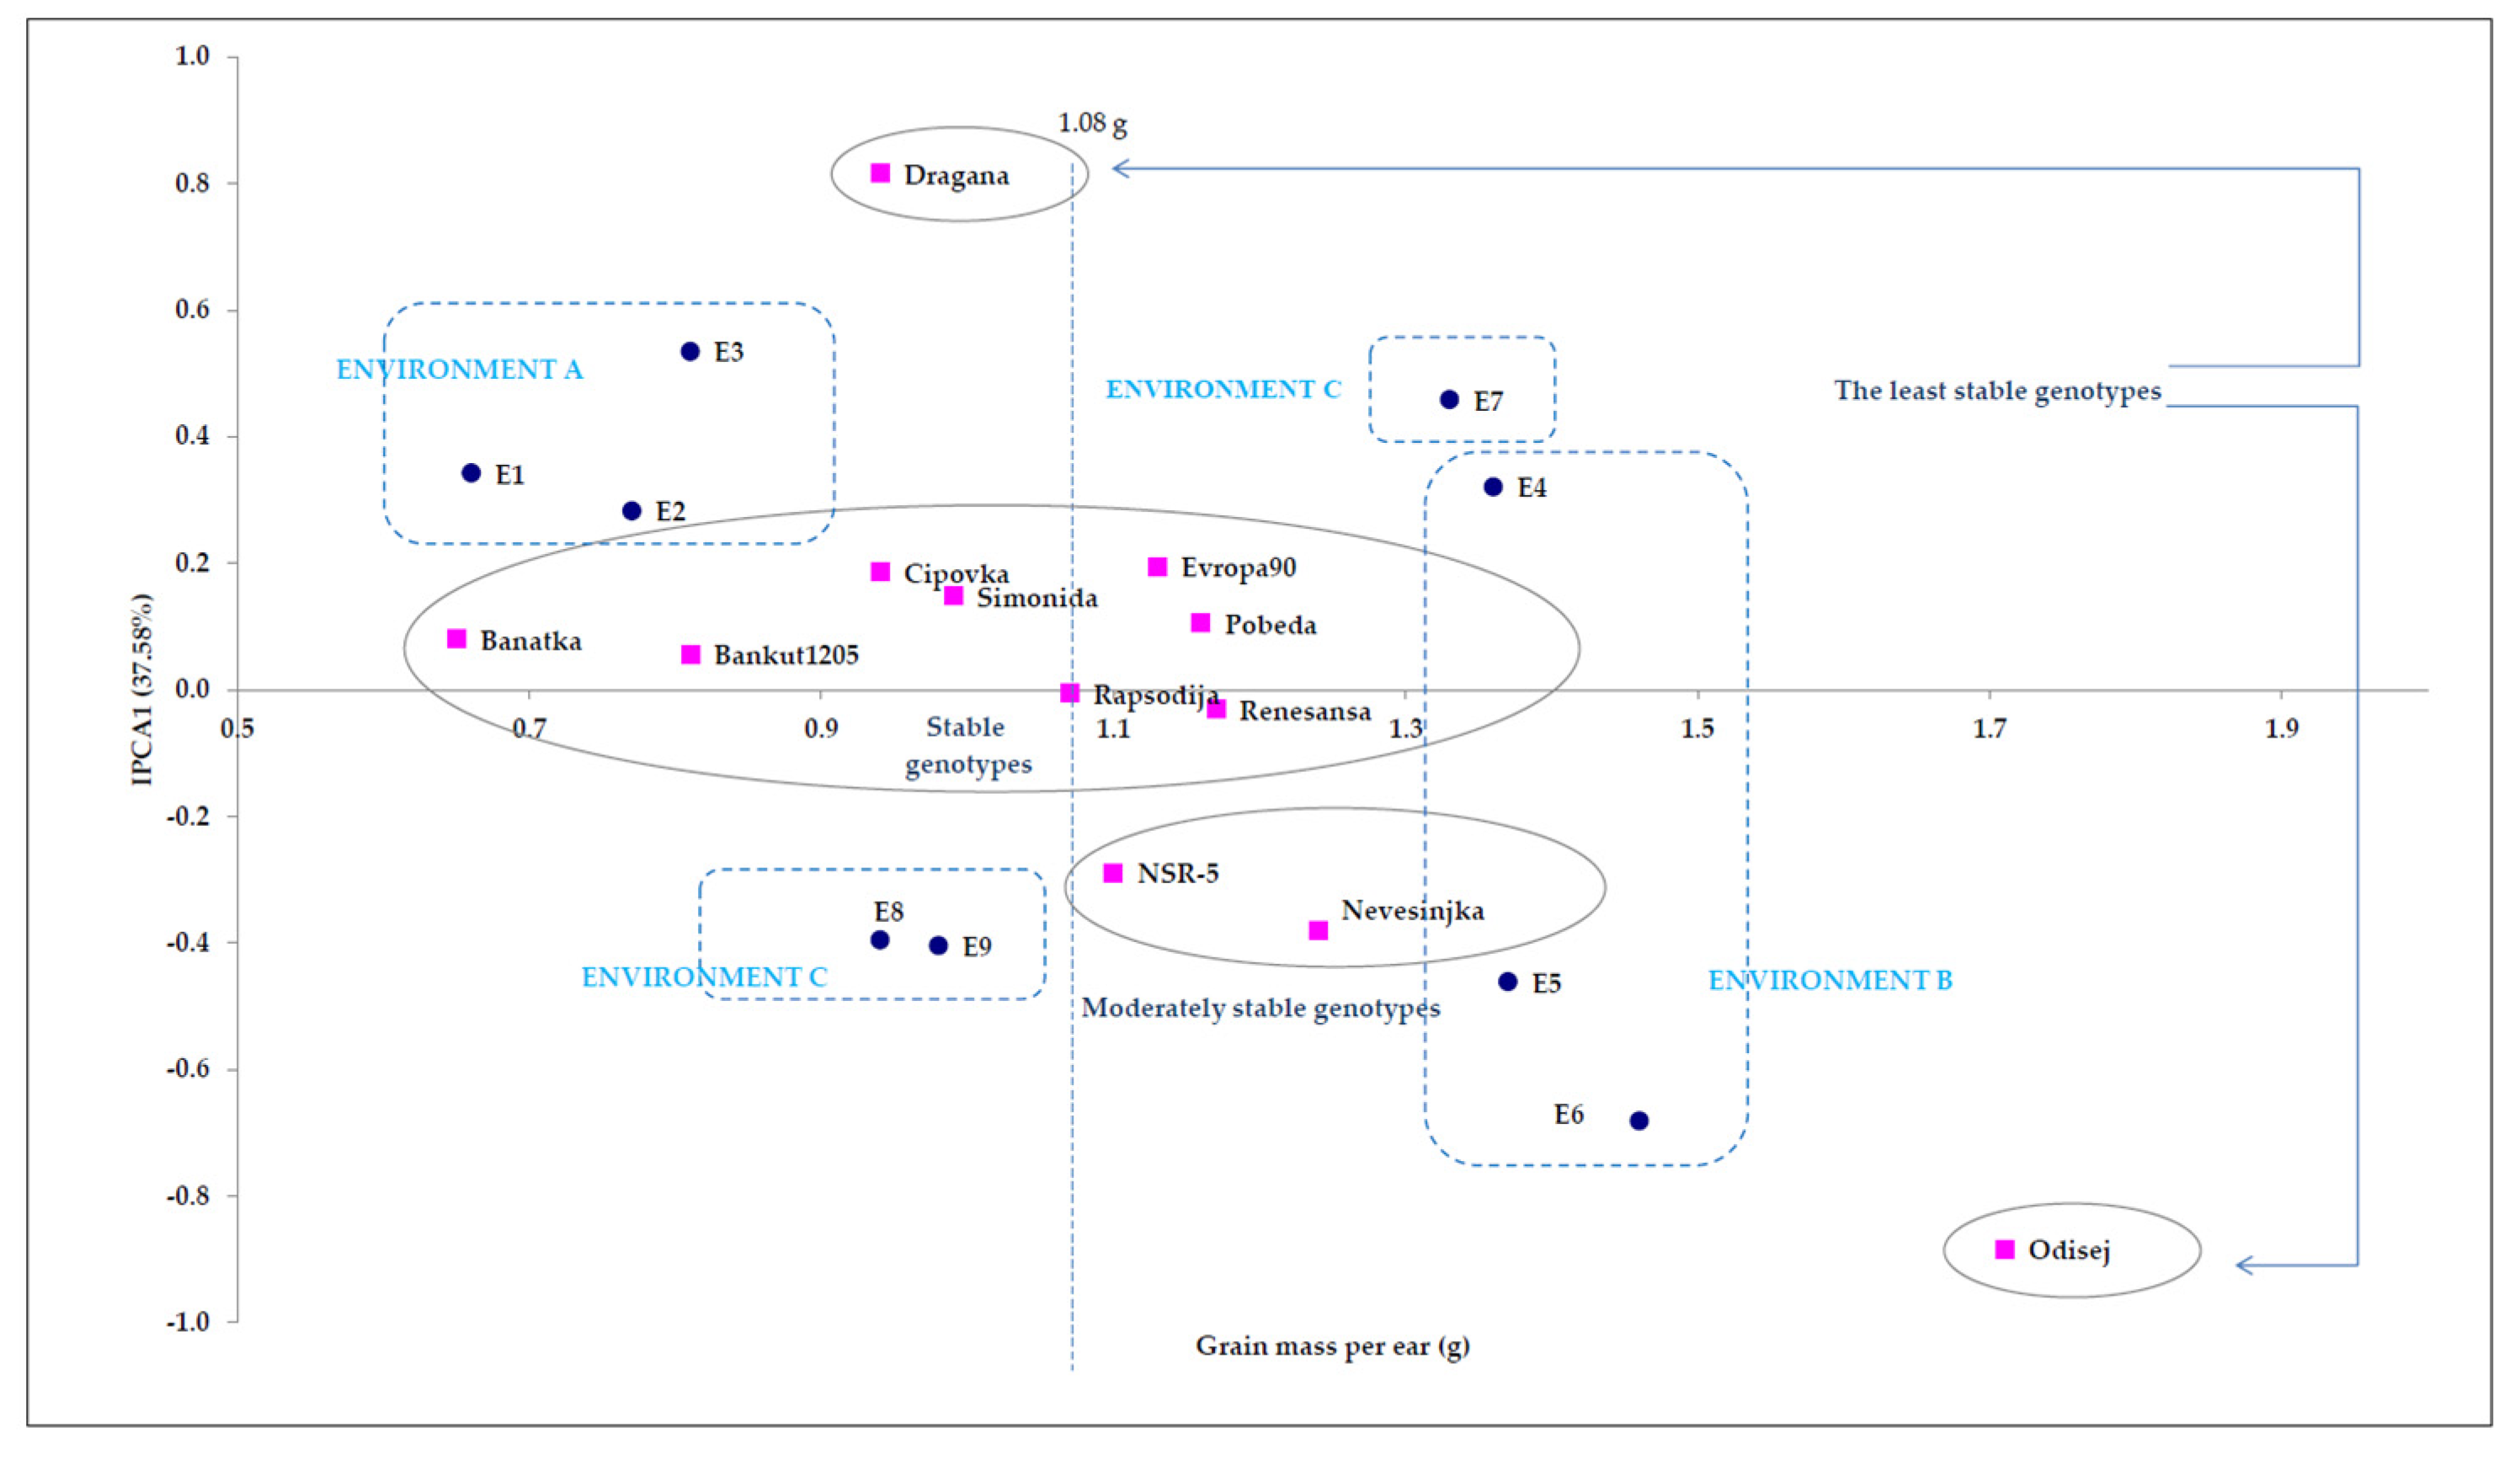
3.2. Grain Mass per Ear
3.3. Genetic Parameters
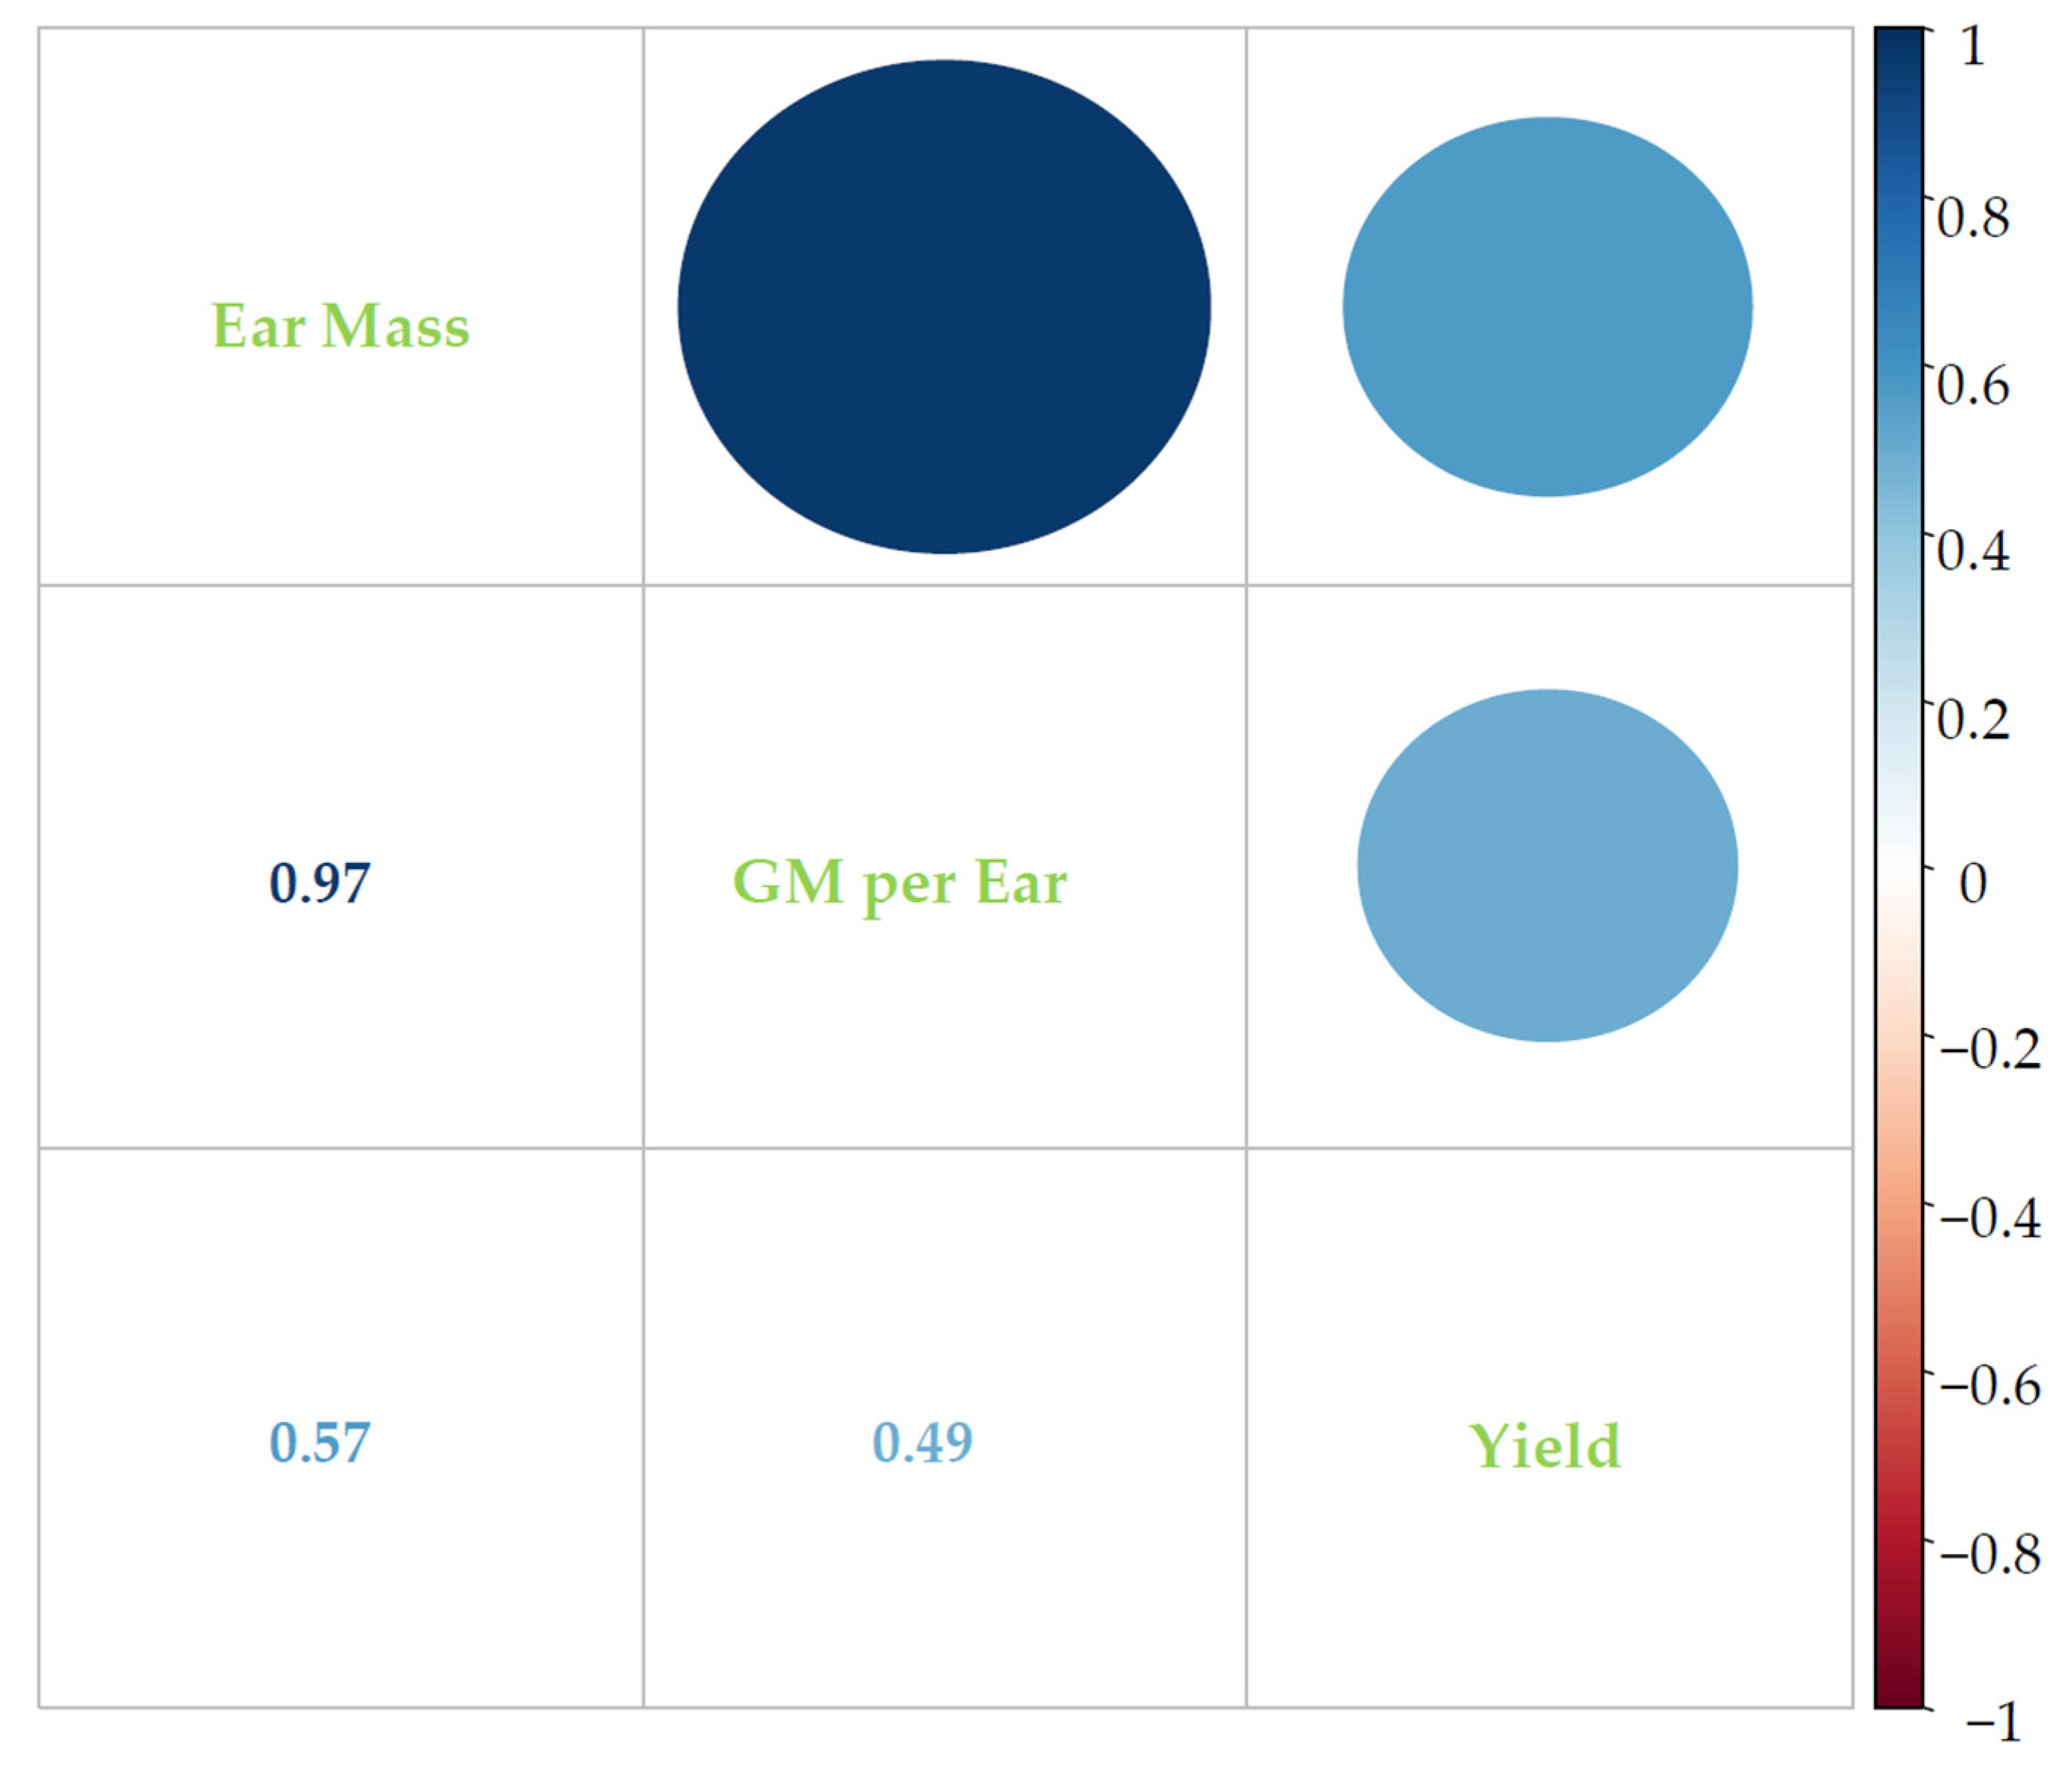
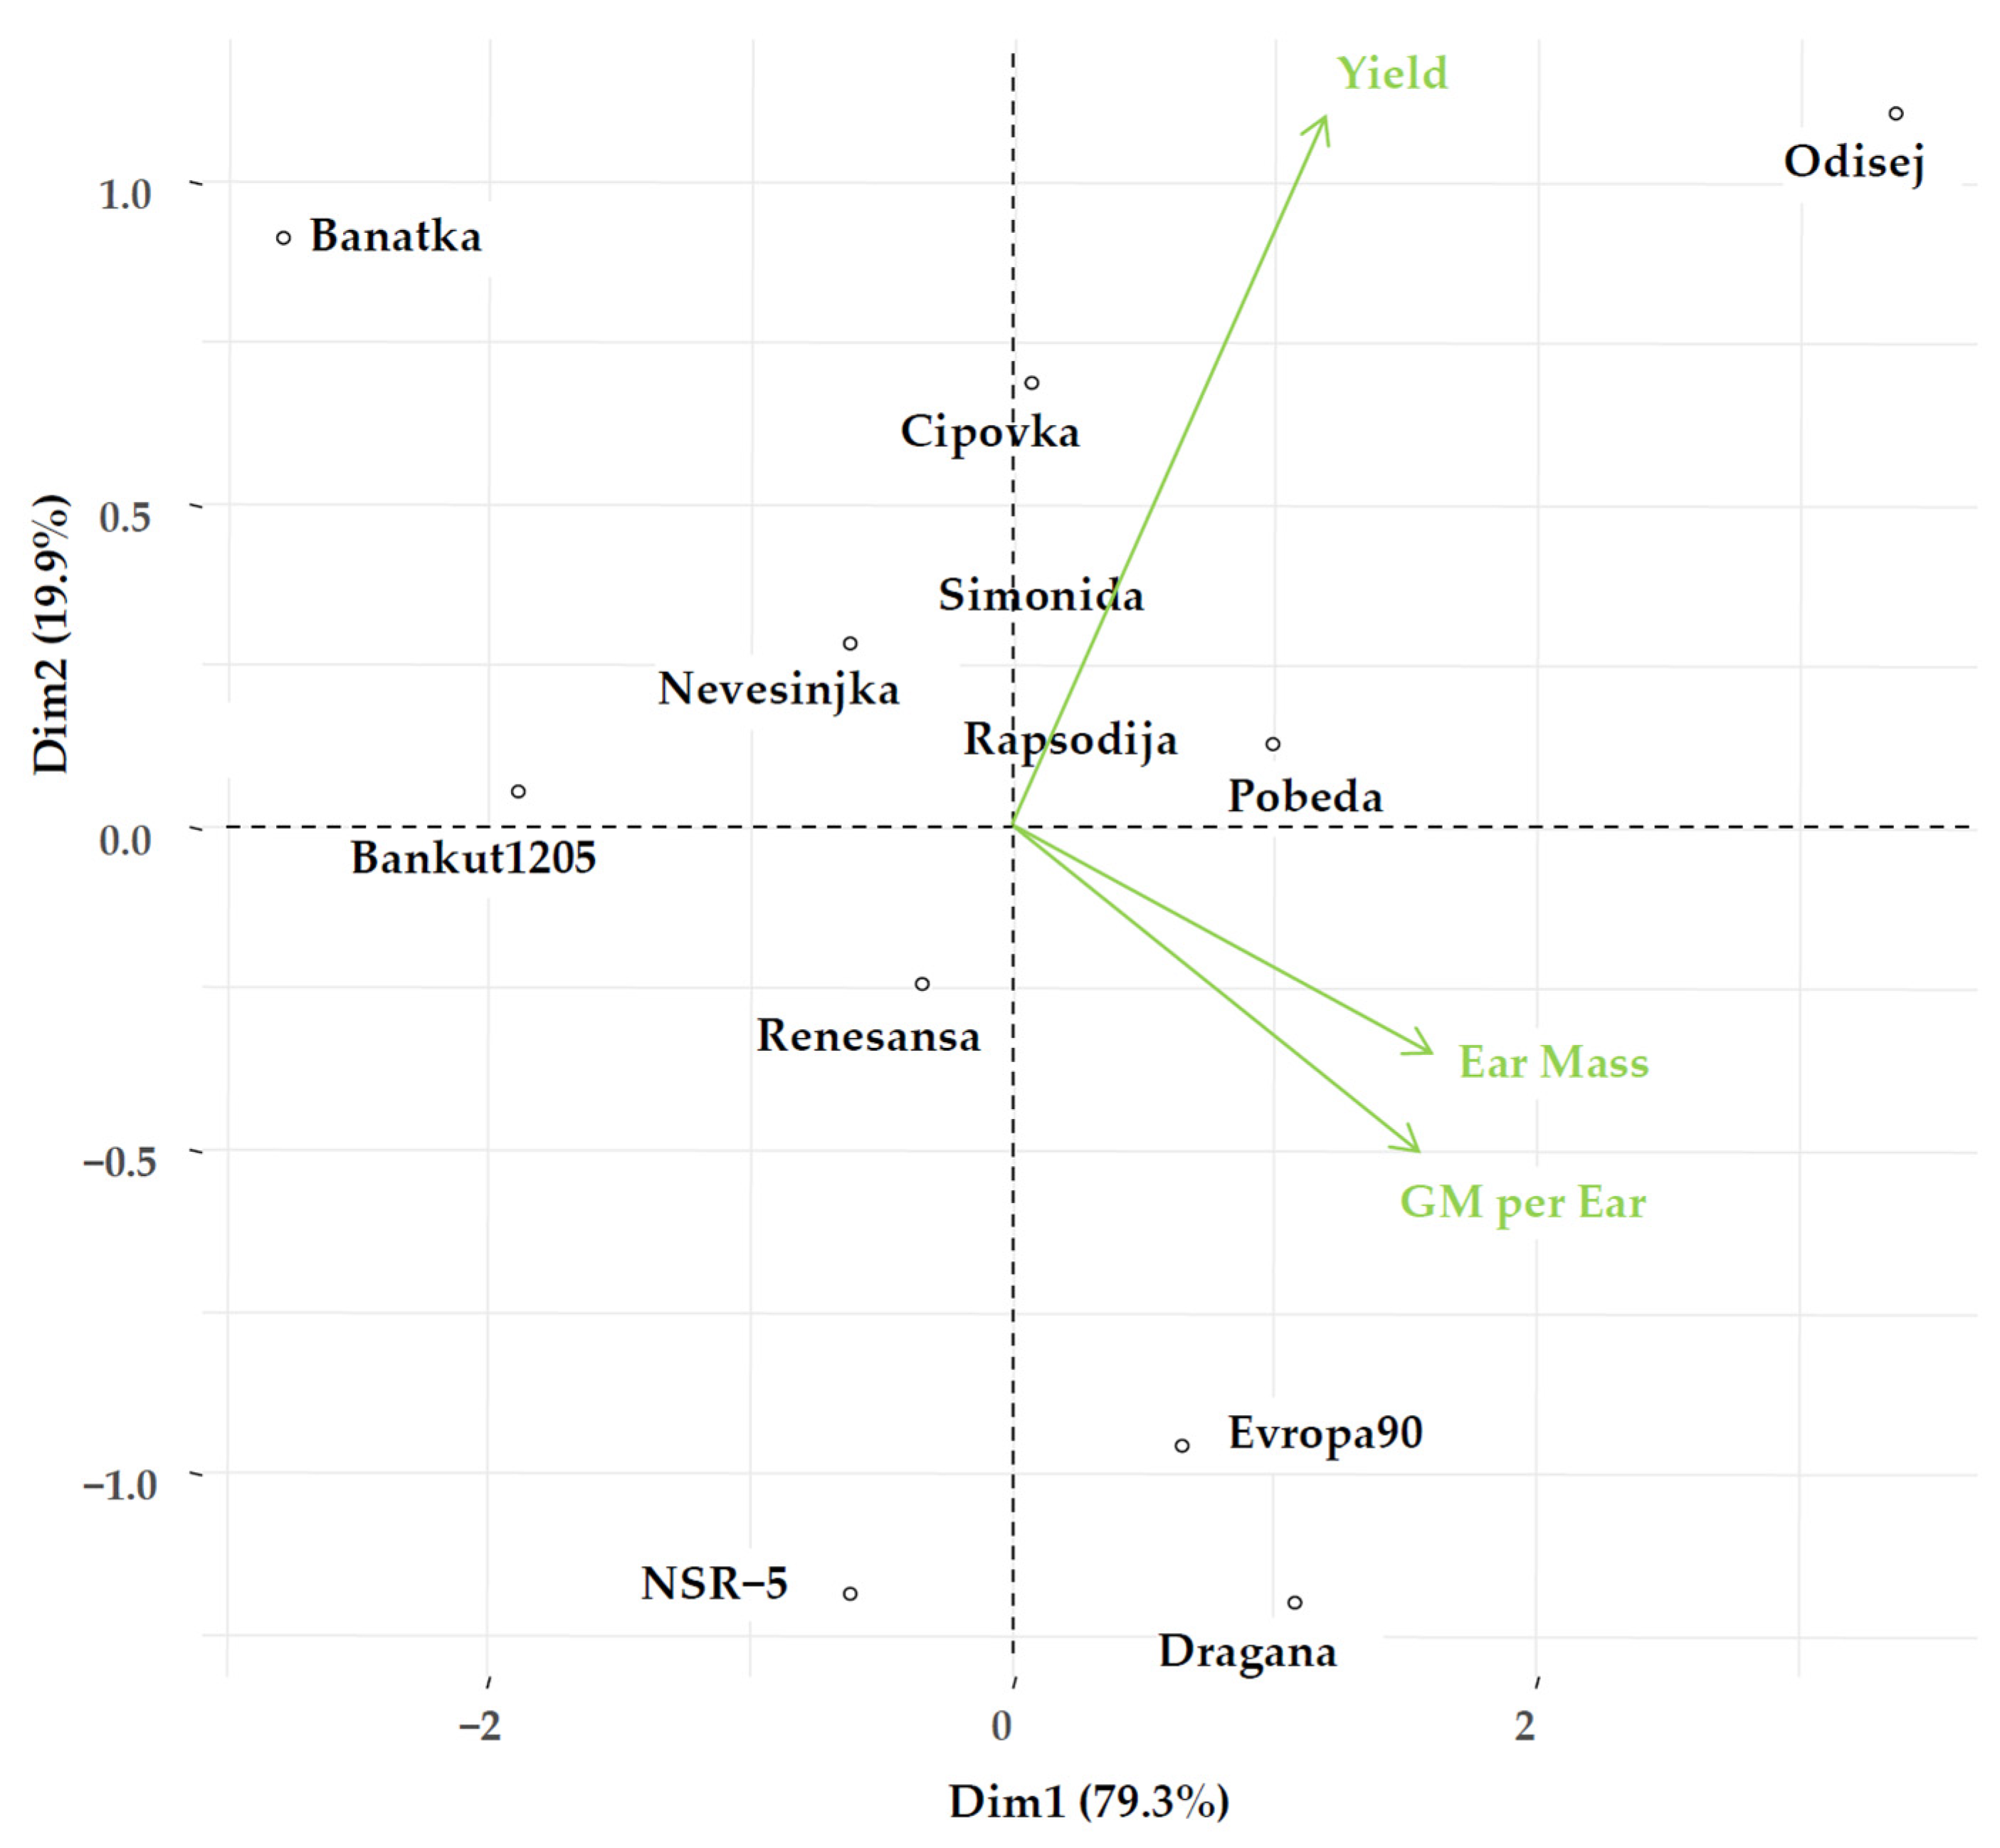
3.4. Correlations between Studied Parameters and Grain Yield of Wheat under 3S Conditions
4. Discussion
4.1. Point Distribution of Genotype and Environmental Share: Markers of Genotype Stability
4.2. The External Environment: Sculptor of Genetic Expression of Examined Traits
5. Conclusions
Author Contributions
Funding
Institutional Review Board Statement
Informed Consent Statement
Data Availability Statement
Acknowledgments
Conflicts of Interest
References
- Shiferaw, B.; Smale, M.; Braun, H.J.; Duveiller, E.; Reynolds, M.; Mauricho, G. Crops that feed the world 10. Past scuccesses and future challenges to the role played by wheat in global food security. Food Secur. 2013, 5, 291–317. [Google Scholar] [CrossRef] [Green Version]
- Knežević, D.; Zečcević, V.; Dukić, N.; Dodig, D. Genetic and phenotypic variability of grain mass per spike of winter wheat genotypes (Triticum aestivum L.). Kragujev. J. Sci. 2008, 30, 131–136. [Google Scholar]
- Li, T.; Deng, G.; Tang, Y.; Su, Y.; Wang, J.; Cheng, J. Identification and Validation of a Novel Locus Controlling Spikelet Number in Bread Wheat (Triticum aestivum L.). Front. Plant Sci. 2021, 12, 611106. [Google Scholar] [CrossRef] [PubMed]
- Popović, V.; Ljubičić, N.; Kostić, M.; Radulović, M.; Blagojević, D.; Ugrenović, V.; Popović, D.; Ivošević, B. Genotype × Environment Interaction for Wheat Yield Traits Suitable for Selection in Different Seed Priming Conditions. Plants 2020, 9, 1804. [Google Scholar] [CrossRef]
- Sheoran, S.; Jaiswal, S.; Raghav, N.; Sharma, R.; Sabhyata; Gaur, A.; Jaisri, J.; Gitanjali, T.; Singh, S.; Sharma, P.; et al. Genome-Wide Association Study and Post-genome-Wide Association Study Analysis for Spike Fertility and Yield Related Traits in Bread Wheat. Front. Plant Sci. 2022, 12, 820761. [Google Scholar] [CrossRef]
- Delvet, A. Crop Production and Yield Limiting Factors. MAS J. Appl. Sci. 2021, 6, 325–349. [Google Scholar]
- Tóth, G.; Montanarella, L.; Stolbovoy, V.; Máté, F.; Bódis, K.; Jones, A.; Panagos, P.; Van, M.; Liedekerke, M. Soils of the European Union; Office for Official publications of the European Communities: Luxembourg, 2008; p. 85. [Google Scholar]
- Bai, R.; Zhang, Z.; Hu, Y.; Fan, M.; Schmidhalter, U. Improving the salt tolerance of Chinese spring wheat through an evaluation of genotype genetic variation. Aust. J. Crop Sci. 2011, 5, 1173–1178. [Google Scholar]
- Borzouei, A.; Kafi, M.; Akbari-Ghogdi, E.; Mousavi-Shalmani, M. Long term salinity stress in relation to lipid peroxidation, superoxide dismutase activity and proline content of saltsensitive and salt-tolerant wheat cultivars. Chil. J. Agric. Res. 2012, 72, 476–482. [Google Scholar] [CrossRef]
- Liu, X.; Chen, D.; Yang, T.; Huang, F.; Fu, S.; Li, L. Changes in soil labile and recalcitrant carbon pools after land-use change in a semi-arid agro-pastoral ecotone in Central Asia. Ecol. Indic. 2020, 110, 105925. [Google Scholar] [CrossRef]
- Sairam, R.K.; Rao, K.V.; Srivastava, G.C. Differential response of wheat genotypes to long term salinity stress in relation to oxidative stress, antioxidant activity and osmolyte concentration. Plant Sci. 2002, 163, 1037–1046. [Google Scholar] [CrossRef]
- Mladenov, V.; Fotopoulos, V.; Kaiserli, E.; Karalija, E.; Maury, S.; Baranek, M.; Segal, N.; Testillano, P.S.; Vassileva, V.; Pinto, G.; et al. Deciphering the Epigenetic Alphabet Involved in Transgenerational Stress Memory in Crops. Int. J. Mol. Sci. 2021, 22, 7118. [Google Scholar] [CrossRef] [PubMed]
- Ullah, K.; Khan, S.J.; Muhammad, S.; Irfaq, M.; Muhammad, T. Genotypic and phenotypic variability, heritability and genetic diversity for yield components in bread wheat (Triticum aestivum L.) germplasm. Afr. J. Agric. Res. 2011, 6, 5204–5207. [Google Scholar]
- Azarbad, H.; Tremblay, J.; Giard-Laliberté, C.; Bainard, L.D.; Yergeau, E. Four decades of soil water stress history together with host genotype constrain the response of the wheat microbiome to soil moisture. FEMS Microbiol Ecol. 2020, 96, fiaa098. [Google Scholar] [CrossRef] [PubMed]
- Petrović, S.; Dimitrijević, M.; Kraljević-Balalić, M. Stabilnost mase klasa divergentnih genotipova pšenice [Stability of spike weight of divergent wheat genotypes]. Letop. Naučnih Rad. Poljopr. Fak. 2001, 25, 32–39. [Google Scholar]
- Knežević, D.; Zečević, V.; Kondić, D.; Marković, S.; Šekularac, A. Genetic and phenotypic variability of grain mass per spike in wheat under different dose of nitrogen nutrition. Tur. J. Agric. Nat. Sci. 2014, 1, 805–810. [Google Scholar]
- Knežević, D.; Radosavac, A.; Zelenika, M. Variability of grain weight per spike of wheat grown in different ecological conditions. Acta Agric. Serb. 2015, 20, 85–95. [Google Scholar] [CrossRef]
- Jiang, T.; Dou, Z.; Liu, J.; Gao, Y.; Malone, R.W.; Chen, S.; Feng, H.; Yu, Q.; Xue, G.; He, J. Simulating the Influences of Soil Water Stress on Leaf Expansion and Senescence of Winter Wheat. Agric. For. Meteorol. 2020, 291, 108061. [Google Scholar] [CrossRef]
- Arzani, A.; Ashraf, M. Smart engineering of genetic resources for enhanced salinity tolerance in crop plants. Crit. Rev. Plant Sci. 2016, 35, 146–189. [Google Scholar] [CrossRef]
- Mohammadi, R.; Armion, M.; Zadhasan, E.; Ahamdi, M.M.; Amir, A. The use of AMMI model for interpreting genotype × environment interaction in durum wheat. Exp. Agric. 2018, 54, 670–683. [Google Scholar] [CrossRef]
- Verma, A.; Singh, G.P. AMMI with BLUP analysis for stability assessment of wheat genotypes under multi locations timely sown trials in Central Zone of India. J. Agric. Sc. Food Technol. 2021, 7, 118–124. [Google Scholar]
- Sime, B.; Tesfaye, S.M. Stability performance of bread wheat (Triticum aestivum L.) genotype for yield and yield components in Oromia, Ethiopia. J. Agric. Res. Dev. 2021, 12, 625. [Google Scholar]
- Zobel, R.W.; Wright, M.J.; Gauch, H.G. Statistical analysis of a yield trial. Agron. J. 1988, 80, 388–393. [Google Scholar] [CrossRef]
- Gauch, H.G. A simple protocol for AMMI analysis of yield trials. Crop. Sci. 2013, 53, 1860. [Google Scholar] [CrossRef]
- Petrović, S.; Dimitrijevic, M.; Belić, M.; Banjac, B.; Boškovic, J.; Zečević, V.; Pejić, B. The variation of yield components in wheat (Triticum aestivum L.) in response to stressful growing conditions of alkaline soil. Genetika 2010, 42, 545–555. [Google Scholar] [CrossRef]
- Banjac, B.; Mladenov, V.; Dimitrijević, M.; Petrović, S.; Boćanski, J. Genotype x environment interactions and phenotypic stability for wheat grown in stressful conditions. Genetika 2014, 46, 799–806. [Google Scholar] [CrossRef]
- Neisse, A.C.; Kirch, J.L.; Hongyu, K. AMMI and GGE Biplot for genotype × environment interaction: A medoid–based hierarchical cluster analysis approach for high–dimensional data. Biom. Lett. 2018, 55, 97–121. [Google Scholar] [CrossRef] [Green Version]
- Hongyu, K. Adaptability, stability and genotype by environment interaction using the AMMI model for multienvironmental trials. Biodiversity 2018, 17, 10–21. [Google Scholar]
- Dimitrijević, M.; Petrović, S.; Belić, M.; Mladenov, N.; Banjac, B.; Vukosavljev, M.; Hristov, N. Utjecaj limitirajućih uvjeta solonjeca na variranje uroda krušne pšenice [The influence of solonetz soil limited growth conditions on bread wheat yield]. In Proceedings of the 45th Croatian & 5th International Symposium on Agriculture, Opatija, Croatia, 15–19 February 2010; Faculty of Agriculture, University of Josip Juraj Strossmayer: Osijek, Croatia, 2010; pp. 394–398. [Google Scholar]
- Petrović, S.; Dimitrijević, M.; Kraljević-Balalić, M.; Crnobarac, J.; Lalić, B.; Arsenić, I. Uticaj genotipova i spoljne sredine na komponente prinosa novosadskih sorti pšenice [The effect of genotype and the environment on yield components in Novi Sad wheat varieties]. Zb. Rad. Naučnog Inst. Za Ratar. I Povrtarsvo 2005, 41, 199–206. [Google Scholar]
- Zadoks, J.C.; Chang, T.T.; Konzak, C.F. A decimal code for the growth stage of cereals. Weed Res. 1974, 14, 415–421. [Google Scholar] [CrossRef]
- GENSTAT 9th Edition, Trial Version; VSN International Ltd.: Indore, India, 2009.
- Comstock, R.R.; Robinson, H.F. Genetic parameters, their estimation and significance. In Proceedings of the 6th International Grassland Congress, State College, PA, USA, 17–23 August 1952; National Publishing Company: Washington, DC, USA, 1952; Volume 1, pp. 248–291. [Google Scholar]
- Singh, R.K.; Chaudhary, B.D. Biometrical Methods in Quantitative Genetic Analysis; Kalyani Publishers: New Delhi/Ludhiana, India, 1985; pp. 39–78. [Google Scholar]
- Falconer, D.S. Introduction to Quantitative Genetics, 3rd ed.; Longman Scientific and Technical: New York, NY, USA, 1989; p. 438. [Google Scholar]
- R Project for Statistical Computing, Version 4.2.0 (2022-04-22 ucrt); R Foundation for Statistical Computing: Vienna, Austria, 2022. Available online: https://www.R-project.org/(accessed on 3 July 2022).
- Banjac, B.; Dimitrijević, M.; Petrović, S.; Mladenov, V.; Banjac, D.; Kiprovski, B. Antioxidant variability of eheat genotypes under salinity stress. Genetika 2020, 52, 1145–1160. [Google Scholar] [CrossRef]
- Matković Stojšin, M.; Petrović, S.; Dimitrijević, M.; Šućur Elez, J.; Malenčić, Đ.; Zečević, V.; Banjac, B.; Knežević, D. Effect of salinity stress on antioxidant activitz and grain yield of different wheat genotypes. Turk. J. Field Crops 2022, 27, 33–40. [Google Scholar] [CrossRef]
- Gharib, M.; Qabil, N.; Salem, A.; Ali, M.; Awaad, H.; Mansour, E. Characterization of wheat landraces and commercial cultivars based on morpho-phenological and agronomic traits. Cereal Res. Commun. 2020, 49, 149–159. [Google Scholar] [CrossRef]
- Saradadevi, G.P.; Das, D.; Mangrauthia, S.K.; Mohapatra, S.; Chikkaputtaiah, C.; Roorkiwal, M.; Solanki, M.; Sundaram, R.M.; Chirravuri, N.N.; Sakhare, A.S.; et al. Genetic, Epigenetic, Genomic and Microbial Approaches to Enhance Salt Tolerance of Plants: A Comprehensive Review. Biology 2021, 10, 1255. [Google Scholar] [CrossRef] [PubMed]
- Denčić, S.; Kastori, R.; Kobiljski, B.; Duggan, B. Evaluation of grain yield and its components in wheat cultivars and landraces under near optimal and drought conditions. Euphytica 2000, 113, 43–52. [Google Scholar] [CrossRef]
- Matković Stojšin, M.; Petrović, S.; Banjac, B.; Zečević, V.; Roljević Nikolić, S.; Majstorović, H.; Đorđević, R.; Knežević, D. Assessment of genotype stress tolerance as an effective way to sustain wheat production under salinity stress conditions. Sustainability 2022, 14, 6973. [Google Scholar] [CrossRef]
- Ljubičić, N.; Popović, V.; Ćirić, V.; Kostić, M.; Ivošević, B.; Popivić, D.; Pandžić, M.; El Musafah, S.; Janković, S. Multivariate Interaction Analaysis of Winter Wheat Grown in Environmen of Limited Soil Conditions. Plants 2021, 10, 604. [Google Scholar] [CrossRef]
- Purchase, J.L.; Hatting, H.; van Deventer, C.S. Genotype × environment interaction of winter wheat (Triticum aestivum L.) in South Africa: II. Stability analysis of yield performance. S. Afr. J. Plant Soil 2000, 17, 101–107. [Google Scholar] [CrossRef]
- Hagos, H.G.; Abay, F. AMMI and GGE biplot analysis of bread wheat genotypes in the northern part of Ethiopia. J. Plant Breed. Genet. 2013, 1, 12–18. [Google Scholar]
- Zhao, C.; Liu, B.; Piao, S.; Wang, X.; Lobell, D.B.; Huang, Y.; Huang, M.; Yao, Y.; Bassu, S.; Ciais, P.; et al. Temperature increase reduces global yields of major crops in four independent estimates. Proc. Natl. Acad. Sci. USA 2017, 114, 9326–9331. [Google Scholar] [CrossRef] [Green Version]
- Dimitrijević, M.; Petrović, S.; Banjac, B. Wheat breeding in abiotic stress conditions of solonetz. Genetika 2012, 44, 91–100. [Google Scholar] [CrossRef]
- Matković Stojšin, M.; Zečević, V.; Petrović, S.; Dimitrijević, M.; Mićanović, D.; Banjac, B.; Knežević, D. Variability, correlation, path analysis and stepwise regression for yield components of different wheat genotypes. Genetika 2018, 50, 817–828. [Google Scholar] [CrossRef] [Green Version]
- Kakoulidou, I.; Avramidou, E.V.; Baranek, M.; Brunel-Muguet, S.; Farrona, S.; Johannes, F.; Kaiserli, E.; Lieberman-Lazarovich, M.; Martinelli, F.; Mladenov, V.; et al. Epigenetics for crops improvement of global change. Biology 2021, 10, 766. [Google Scholar] [CrossRef]
- El-Hendawy, S.E.; Hassan, W.M.; Al-Suhaibani, N.A.; Refay, Y.; Abdella, K.A. Comparative performance of multivariable agro-physiological parameters for detecting salt tolerance of wheat cultivars under simulated saline field growing conditions. Front. Plant Sci. 2017, 8, 435. [Google Scholar] [CrossRef] [Green Version]
- El-Hendawy, S.; Al-Suhaibani, N.; Mubushar, M.; Tahir, M.U.; Refay, Y.; Tola, E. Potential use of hyperspectral reflectance as a high-throughput nondestructive phenotypic tool for assessing salt tolerance in advanced spring wheat lines under field conditions. Plants 2021, 10, 2512. [Google Scholar] [CrossRef]
- Mansour, E.; Moustafa, E.S.; Desoky, E.S.M.; Ali, M.; Yasin, M.A.; Attia, A.; Alsuhaibani, N.; Tahir, M.U.; El-Hendawy, S. Multidimensional evaluation for detecting salt tolerance of bread wheat genotypes under actual saline field growing conditions. Plants 2020, 9, 1324. [Google Scholar] [CrossRef]


| Genotype Description | Genotype Name | Genotype Pedigree |
|---|---|---|
| Winter wheat cultivar | Renesansa | Jugoslavija/NS 55–25 |
| Winter wheat cultivar | Pobeda | Sremica/Balkan |
| Winter wheat cultivar | Evropa 90 | Talent/NSR2 |
| Winter wheat cultivar | Novosadska rana 5 | NSR1/Tisa//Partizanka/3/Mačvanka 1 |
| Winter wheat cultivar | Dragana | Sremka 2/Francuska |
| Winter wheat cultivar | Rapsodija | Agri/Nacozari F76//Nizija |
| Winter wheat cultivar | Simonida | NS 63–25/Rodna//NS-3288 |
| Winter wheat cultivar | Cipovka | NS 3288/Rodna |
| Local population; old winter wheat | Banatka | LV-Banat |
| Winter wheat cultivar; old winter wheat | Bankut 1205 | Bankut 5/Marquis |
| Optional wheat cultivar | Nevesinjka | Dugoklasа/Jarka |
| Triticosecale cultivar | Odisej | LT 338.75/BL. 517 |
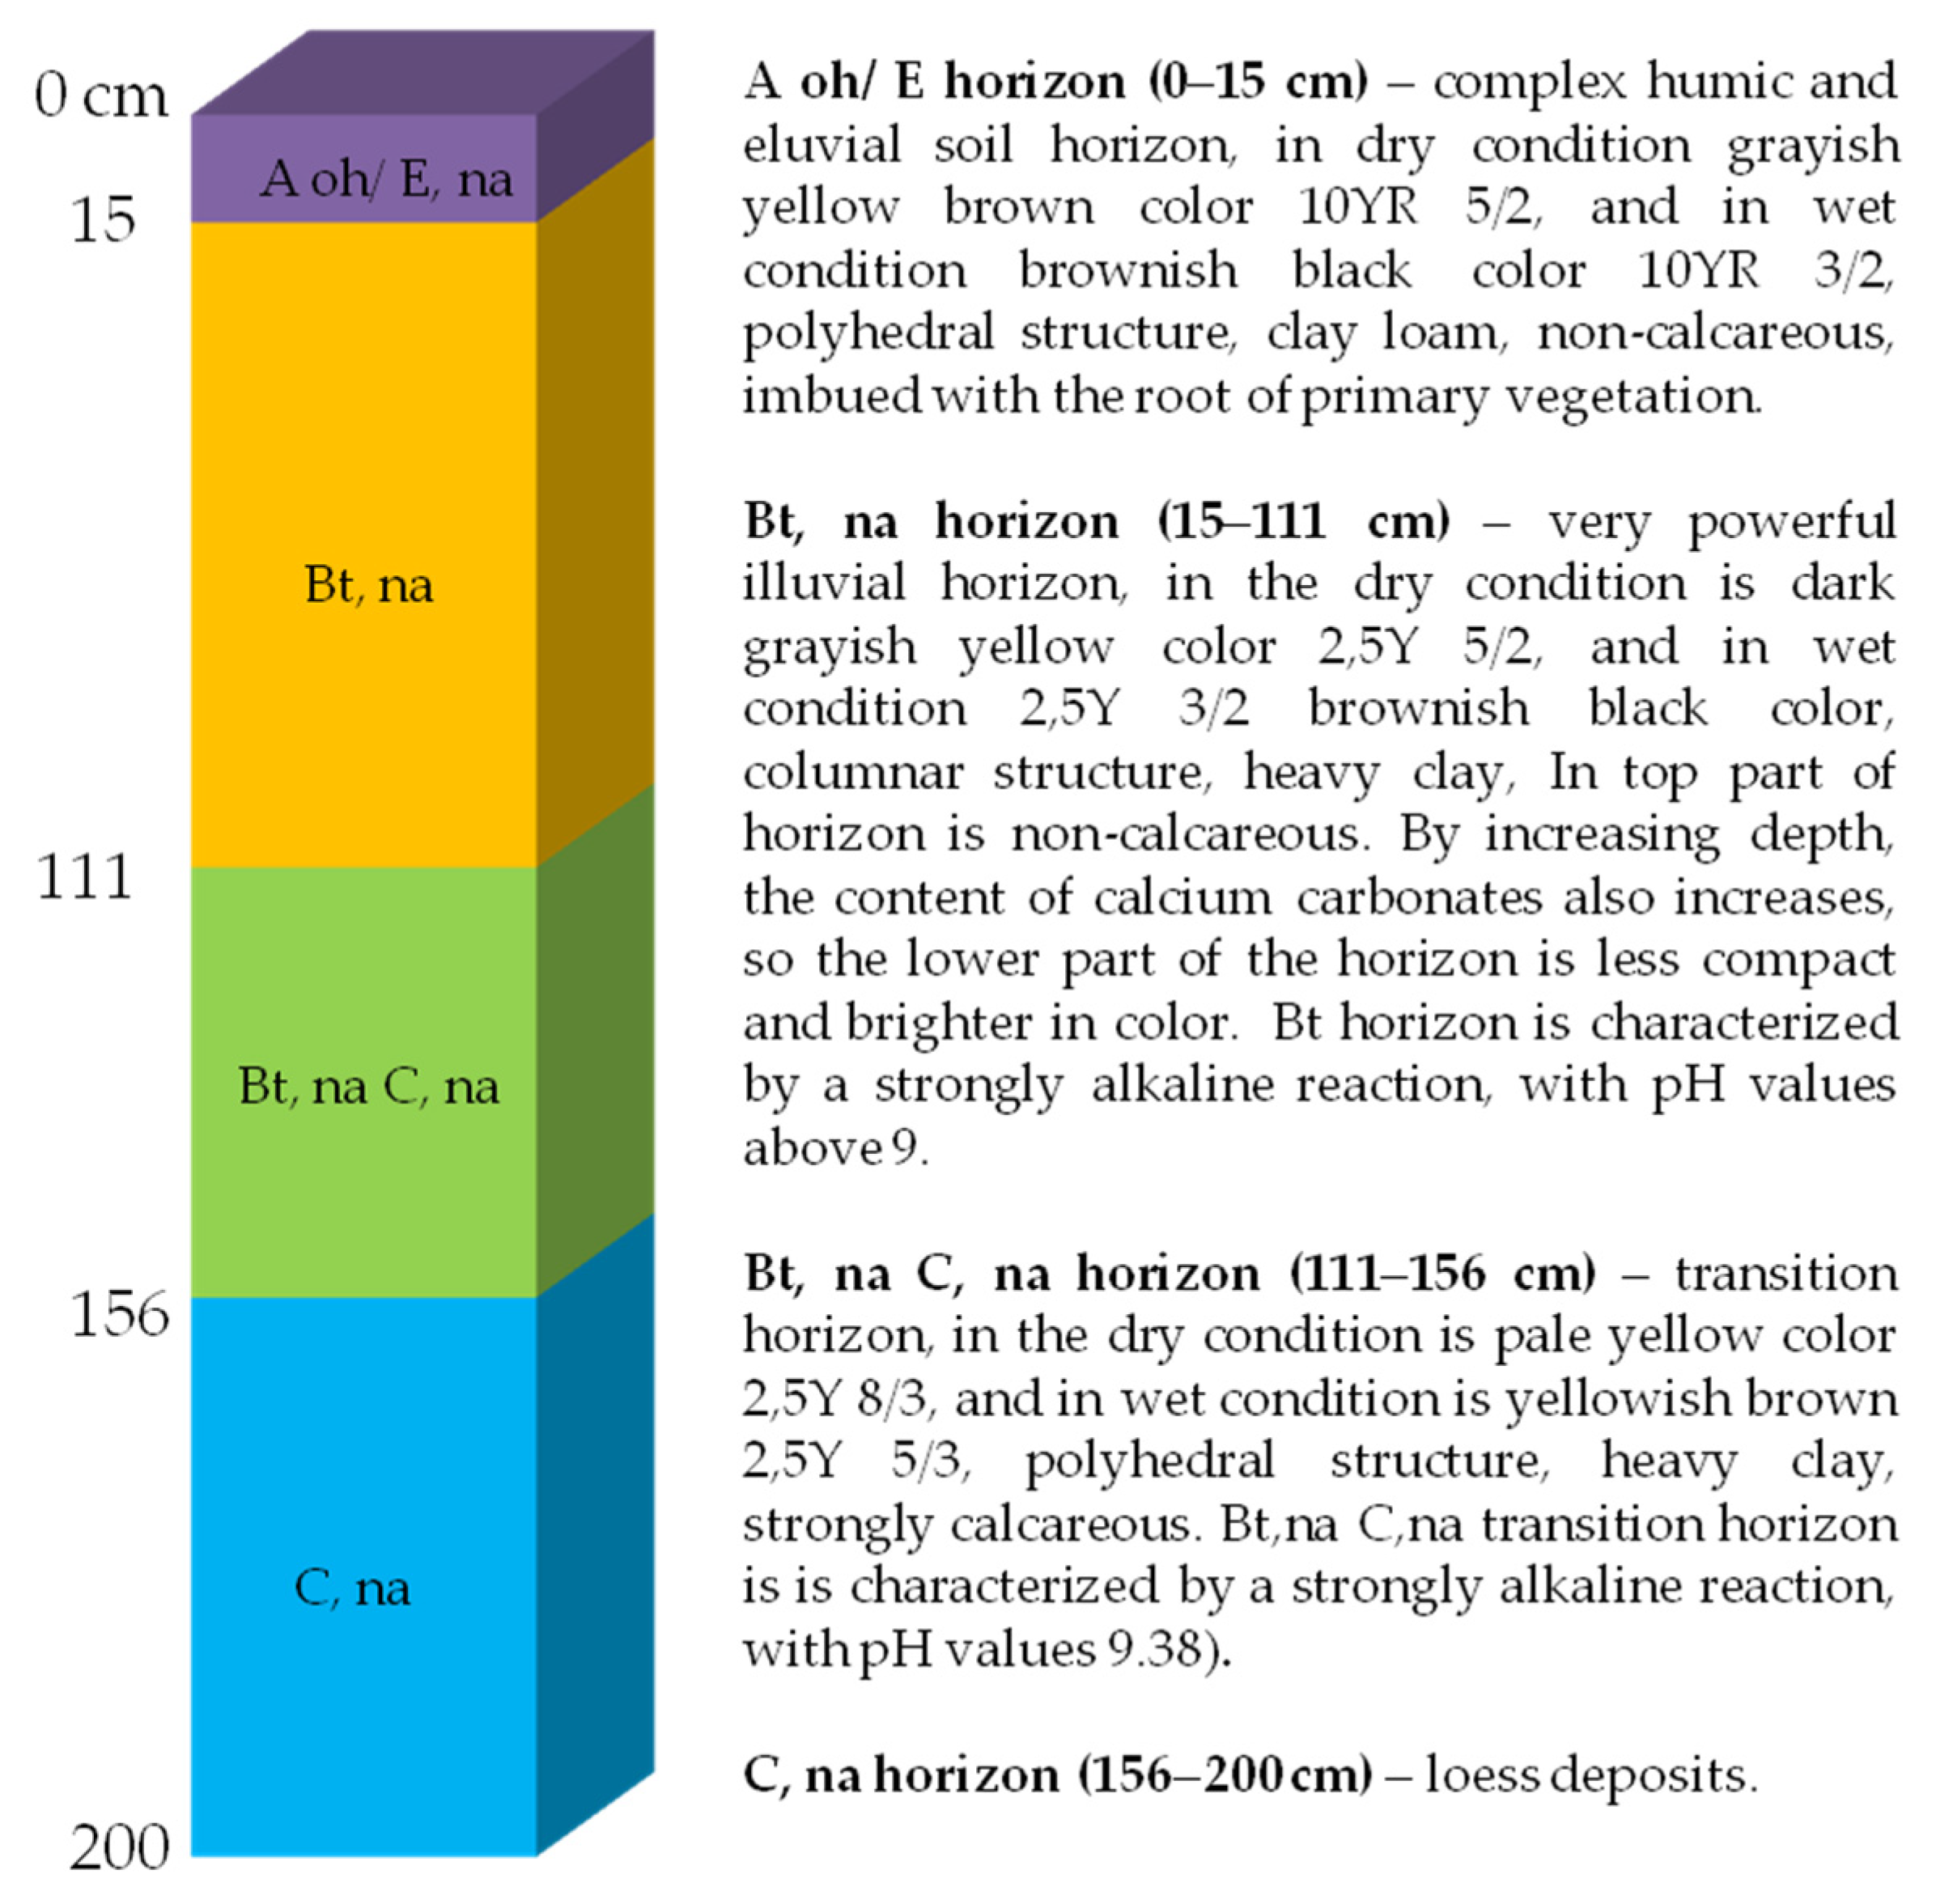
| Horizon (Depth cm) | Adsorbed Cations | Salinity Properties | |||||||
|---|---|---|---|---|---|---|---|---|---|
| Ca++ (mg/100 g Soil) | Mg++ (mg/100 g Soil) | K+ (mg/100 g Soil) | Na+ (mg/100 g Soil) | Ca++ (%) * | Na+ (%) * | ECe 25 °C ** (mS/cm) | Total Salts (%) | pH Soil Extract | |
| Aoh/E, na (0–15) | 128.26 | 37.92 | 74.68 | 20.69 | 53.14 | 7.91 | 0.62 | 0.03 | 5.41 |
| Bt, na (15–111) | 392.98 | 136.74 | 26.98 | 269.67 | 58.92 | 32.90 | 2.16 | 0.15 | 7.72 |
| Bt, na C, na (111–156) | 707.81 | 143.79 | 19.16 | 214.04 | 61.16 | 18.06 | 1.10 | 0.17 | 8.89 |
| C, na (156–200) | 658.51 | 136.50 | 15.64 | 152.65 | 63.80 | 14.49 | 1.03 | 0.12 | 8.79 |
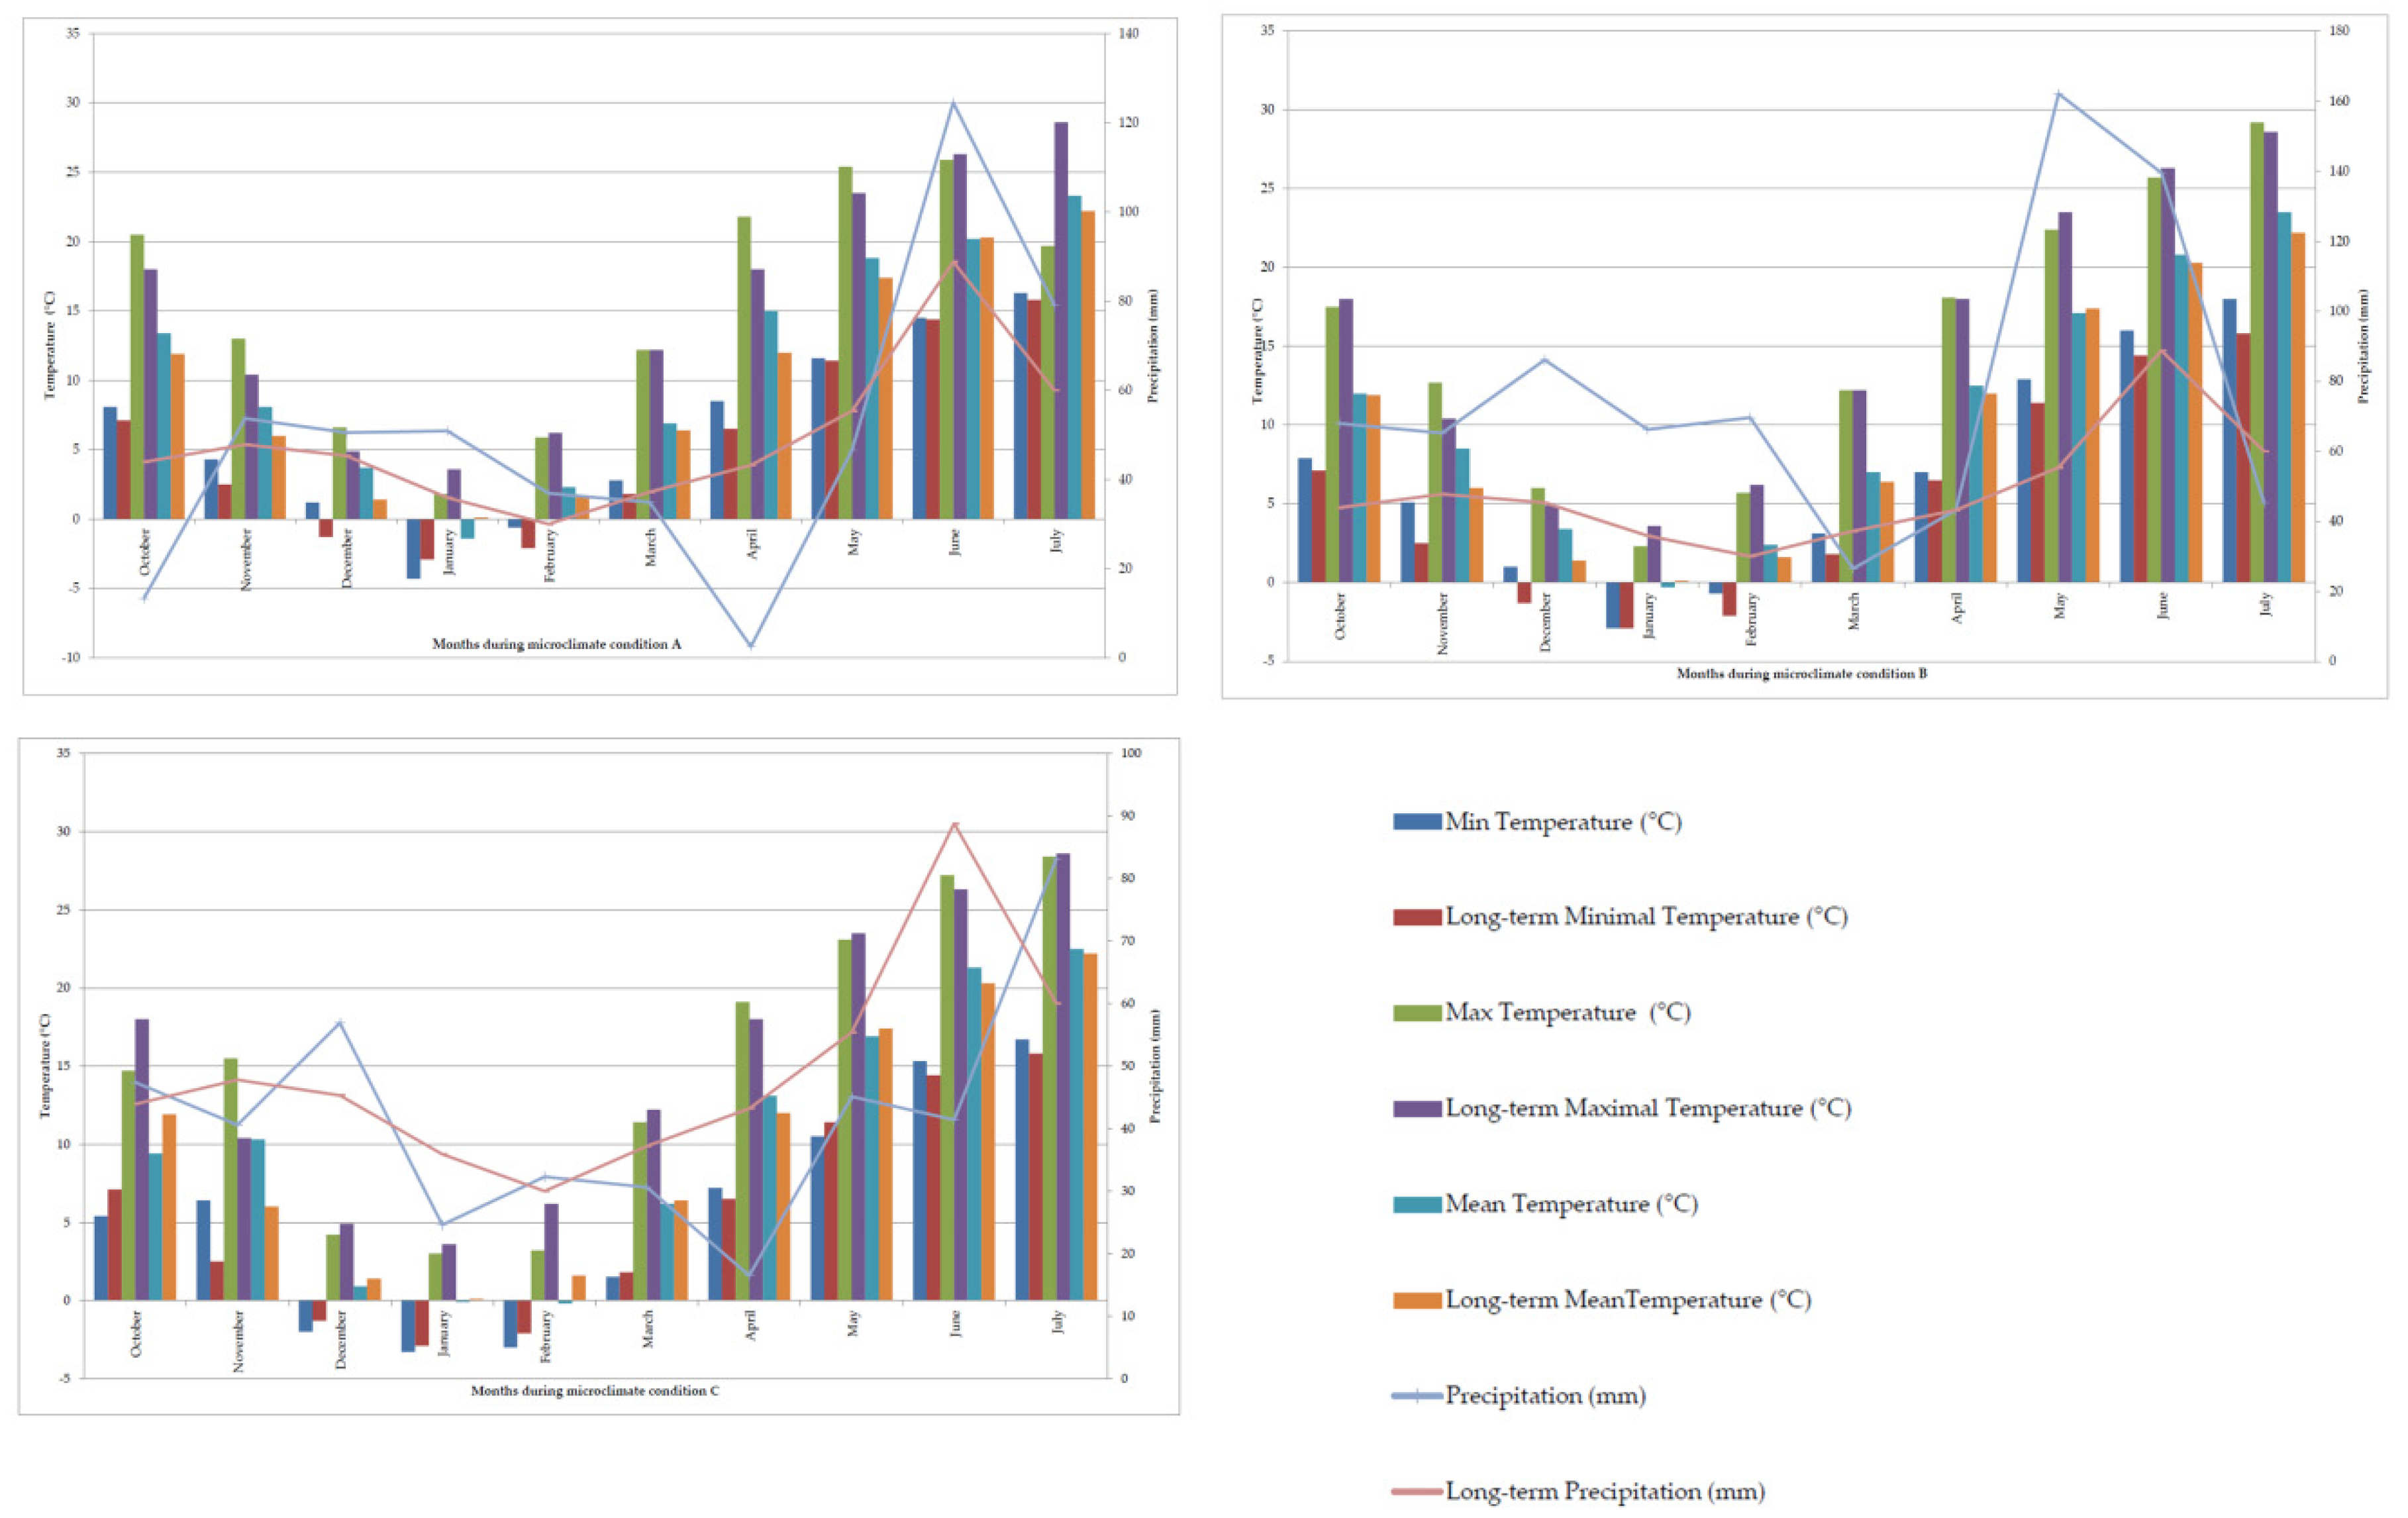
| Environments | ||
|---|---|---|
| Microclimate condition A | code E1 | solonetz; natural pasture |
| code E2 | Soil reclaimed by 25 t × ha−1 phosphogypsum | |
| code E3 | Soil reclaimed by 50 t × ha−1 phosphogypsum | |
| Microclimate condition B | code E4 | solonetz; natural pasture |
| code E5 | Soil reclaimed by 25 t × ha−1 phosphogypsum | |
| code E6 | Soil reclaimed by 50 t × ha−1 phosphogypsum | |
| Microclimate condition C | code E7 | solonetz; natural pasture |
| code E8 | Soil reclaimed by 25 t × ha−1 phosphogypsum | |
| code E9 | Soil reclaimed by 50 t × ha−1 phosphogypsum | |
| Environments | ||||||||
|---|---|---|---|---|---|---|---|---|
| Genotype | Solonetz; | Soil Reclaimed by Phosphogypsum | Average Value | |||||
| Natural Pasture | 25 t × ha−1 | 50 t × ha−1 | ||||||
| Codes E1; E4 and E7 | Codes E2; E5 and E8 | Codes E3; E6 and E9 | ||||||
| (g) | V (%) | (g) | V (%) | (g) | V (%) | (g) | V (%) | |
| Renesansa | 1.4 | 13.6 | 1.6 | 2.8 | 1.4 | 10.2 | 1.5 | 8.9 |
| Pobeda | 1.6 | 6.9 | 1.6 | 25.4 | 1.2 | 11.0 | 1.5 | 14.4 |
| Evropa 90 | 1.7 | 5.3 | 1.3 | 3.0 | 1.6 | 15.8 | 1.5 | 8.0 |
| NSR5 | 1.5 | 6.8 | 1.2 | 12.0 | 1.4 | 6.3 | 1.4 | 8.4 |
| Dragana | 1.8 | 9.5 | 1.0 | 9.8 | 1.1 | 17.8 | 1.3 | 12.4 |
| Rapsodija | 1.5 | 11.0 | 1.4 | 13.3 | 1.2 | 10.9 | 1.4 | 11.7 |
| Simonida | 1.4 | 11.0 | 1.3 | 10.4 | 1.3 | 7.5 | 1.3 | 9.6 |
| Cipovka | 1.5 | 9.6 | 1.3 | 13.2 | 1.3 | 5.3 | 1.4 | 9.4 |
| Banatka | 0.8 | 8.6 | 0.8 | 7.0 | 1.0 | 3.8 | 0.9 | 6.5 |
| Bankut 1205 | 1.1 | 7.4 | 1.1 | 6.4 | 1.2 | 7.7 | 1.1 | 7.2 |
| Nevesinjka | 1.3 | 5.1 | 1.6 | 13.3 | 1.7 | 11.8 | 1.5 | 10.1 |
| Odisej | 2.1 | 5.5 | 2.2 | 12.9 | 2.4 | 4.4 | 2.2 | 7.6 |
| Average value | 1.5 | 8.4 | 1.4 | 10.8 | 1.4 | 9.4 | ||
| LSD0.05 = 0.180 | ||||||||
| LSD0.01 = 0.236 | ||||||||
| Source of Variation 1 | df 2 | MS 3 | F Value | F Table | The Share of Total Variation | |
|---|---|---|---|---|---|---|
| 0.05 | 0.01 | |||||
| Total | 323 | 0.4 | - | - | - | 100 |
| Treatments | 107 | 1.1 | ** 13.03 | 1.00 | 1.00 | 86.60 |
| Genotypes | 11 | 2.7 | ** 33.93 | 1.83 | 2.32 | 23.19 |
| Environments | 8 | 5.9 | ** 75.54 | 1.94 | 2.51 | 36.78 |
| Blocks | 18 | 0.1 | 0.98 | 1.57 | 1.87 | 1.10 |
| Interactions | 88 | 0.4 | ** 4.87 | 1.00 | 1.00 | 26.64 |
| IPCA1 4 | 18 | 0.7 | ** 8.74 | 1.57 | 1.87 | 36.71 |
| IPCA2 | 16 | 0.5 | ** 6.39 | 1.57 | 1.87 | 23.85 |
| IPCA3 | 14 | 0.4 | ** 4.98 | 1.75 | 2.18 | 16.26 |
| IPCA4 | 12 | 0.3 | ** 3.22 | 1.75 | 2.18 | 9.00 |
| IPCA5 | 10 | 0.3 | ** 3.28 | 1.83 | 2.32 | 7.64 |
| IPCA6 | 8 | 0.2 | * 2.45 | 1.94 | 2.51 | 4.56 |
| IPCA7 | 6 | 0.1 | 1.32 | 2.09 | 2.80 | 1.85 |
| Residuals | 4 | 0.01 | 0.13 | 2.37 | 3.32 | - |
| Error | 198 | 0.08 | - | - | - | - |
| Environments | ||||||||
|---|---|---|---|---|---|---|---|---|
| Genotype | Solonetz; | Soil Reclaimed by Phosphogypsum | Average Value | |||||
| Natural Pasture | 25 t × ha−1 | 50 t × ha−1 | ||||||
| Codes E1; E4 and E7 | Codes E2; E5 and E8 | Codes E3; E6 and E9 | ||||||
| (g) | V (%) | (g) | V (%) | (g) | V (%) | (g) | V (%) | |
| Renesansa | 1.1 | 12.4 | 1.2 | 12.3 | 1.2 | 15.3 | 1.2 | 13.3 |
| Pobeda | 1.3 | 5.3 | 1.2 | 21.2 | 0.9 | 9.4 | 1.1 | 12.0 |
| Evropa 90 | 1.3 | 5.1 | 0.9 | 3.7 | 1.3 | 13.9 | 1.2 | 7.6 |
| NSR5 | 1.1 | 12.5 | 1.0 | 10.7 | 1.2 | 9.1 | 1.1 | 10.8 |
| Dragana | 1.4 | 9.6 | 0.6 | 5.3 | 0.8 | 10.2 | 0.9 | 8.4 |
| Rapsodija | 1.1 | 13.3 | 1.1 | 9.8 | 1.0 | 14.1 | 1.1 | 12.4 |
| Simonida | 1.1 | 14.6 | 1.0 | 6.0 | 0.9 | 8.0 | 1.0 | 9.5 |
| Cipovka | 1.0 | 22.6 | 0.8 | 13.1 | 1.0 | 4.0 | 0.9 | 13.2 |
| Banatka | 0.6 | 10.0 | 0.6 | 8.9 | 0.7 | 19.7 | 0.6 | 12.9 |
| Bankut 1205 | 0.8 | 2.1 | 0.8 | 7.7 | 0.8 | 8.2 | 0.8 | 6.0 |
| Nevesinjka | 1.0 | 6.4 | 1.3 | 14.3 | 1.3 | 11.6 | 1.2 | 10.8 |
| Odisej | 1.5 | 8.2 | 1.7 | 15.8 | 1.9 | 2.0 | 1.7 | 8.7 |
| Average value | 1.1 | 10.2 | 1.0 | 10.7 | 1.1 | 10.5 | ||
| LSD0.05 = 0.142 | ||||||||
| LSD0.01 = 0.187 | ||||||||
| Source of Variation 1 | df 2 | MS 3 | F Value | F Table | The Share of Total Variation | |
|---|---|---|---|---|---|---|
| 0.05 | 0.01 | |||||
| Total | 323 | 0.3 | - | - | - | 100 |
| Treatments | 107 | 0.7 | ** 13.10 | 1.00 | 1.00 | 86.04 |
| Genotypes | 11 | 1.8 | ** 35.31 | 1.83 | 2.32 | 23.85 |
| Environments | 8 | 3.4 | ** 39.55 | 1.94 | 2.51 | 31.89 |
| Blocks | 18 | 0.1 | * 1.64 | 1.57 | 1.87 | 1.82 |
| Interactions | 88 | 0.3 | ** 5.61 | 1.00 | 1.00 | 30.30 |
| IPCA1 4 | 18 | 0.5 | ** 10.30 | 1.57 | 1.87 | 37.58 |
| IPCA2 | 16 | 0.4 | ** 8.41 | 1.57 | 1.87 | 27.26 |
| IPCA3 | 14 | 0.3 | ** 5.28 | 1.75 | 2.18 | 14.95 |
| IPCA4 | 12 | 0.2 | ** 3.77 | 1.75 | 2.18 | 9.15 |
| IPCA5 | 10 | 0.2 | ** 2.84 | 1.83 | 2.32 | 5.76 |
| IPCA6 | 8 | 0.1 | 1.90 | 1.94 | 2.51 | 3.08 |
| Residuals | 10 | 0.06 | 1.08 | 1.83 | 2.32 | - |
| Error | 198 | 0.05 | - | - | - | - |
| Traits a | Mean Values | Estimates of Variance Components b | Genotypes Mean of Square | CVg (%) | CVp (%) | h2 (%) | |||
|---|---|---|---|---|---|---|---|---|---|
| σ2g | σ2p | σ2i | σ2e | ||||||
| All tested microclimates combined | |||||||||
| EM | 1.41 | 0.087 | 0.272 | 0.104 | 0.081 | 2.744 ** | 20.92 | 36.98 | 31.98 |
| GMpE | 1.08 | 0.057 | 0.192 | 0.079 | 0.056 | 1.837 ** | 22.11 | 40.57 | 29.69 |
| Microclimate A | |||||||||
| EM | 0.98 | 0.021 | 0.074 | 0.008 | 0.045 | 0.256 ** | 14.84 | 27.84 | 28.38 |
| GMpE | 0.75 | 0.008 | 0.054 | 0.014 | 0.032 | 0.150 ** | 12.00 | 31.19 | 14.81 |
| Microclimate B | |||||||||
| EM | 1.82 | 0.233 | 0.390 | 0.116 | 0.041 | 2.484 ** | 26.59 | 34.41 | 59.74 |
| GMpE | 1.40 | 0.155 | 0.262 | 0.079 | 0.028 | 1.665 ** | 28.14 | 36.59 | 59.16 |
| Microclimate C | |||||||||
| EM | 1.44 | 0.072 | 0.353 | 0.125 | 0.156 | 1.176 ** | 18.59 | 41.17 | 20.40 |
| GMpE | 1.08 | 0.046 | 0.256 | 0.105 | 0.105 | 0.837 ** | 19.82 | 46.76 | 17.97 |
Publisher’s Note: MDPI stays neutral with regard to jurisdictional claims in published maps and institutional affiliations. |
© 2022 by the authors. Licensee MDPI, Basel, Switzerland. This article is an open access article distributed under the terms and conditions of the Creative Commons Attribution (CC BY) license (https://creativecommons.org/licenses/by/4.0/).
Share and Cite
Banjac, B.; Mladenov, V.; Petrović, S.; Matković-Stojšin, M.; Krstić, Đ.; Vujić, S.; Mačkić, K.; Kuzmanović, B.; Banjac, D.; Jakšić, S.; et al. Phenotypic Variability of Wheat and Environmental Share in Soil Salinity Stress [3S] Conditions. Sustainability 2022, 14, 8598. https://doi.org/10.3390/su14148598
Banjac B, Mladenov V, Petrović S, Matković-Stojšin M, Krstić Đ, Vujić S, Mačkić K, Kuzmanović B, Banjac D, Jakšić S, et al. Phenotypic Variability of Wheat and Environmental Share in Soil Salinity Stress [3S] Conditions. Sustainability. 2022; 14(14):8598. https://doi.org/10.3390/su14148598
Chicago/Turabian StyleBanjac, Borislav, Velimir Mladenov, Sofija Petrović, Mirela Matković-Stojšin, Đorđe Krstić, Svetlana Vujić, Ksenija Mačkić, Boris Kuzmanović, Dušana Banjac, Snežana Jakšić, and et al. 2022. "Phenotypic Variability of Wheat and Environmental Share in Soil Salinity Stress [3S] Conditions" Sustainability 14, no. 14: 8598. https://doi.org/10.3390/su14148598