Article

Impact of Prolonged Exposure to Sour Service on the Mechanical Properties and Corrosion Mechanism of NACE Carbon Steel Material Used in Wet Sour Gas Multiphase Pipeline

by
Manoj Yadav
1,
Mostafa H. Sliem
2,
Aboubakr M. Abdullah
2,*,
Khaled M. Youssef
1 and
Noora H. Al-Qahtani
2
1
Materials Science and Technology Program, College of Arts and Sciences, Qatar University, Doha 2713, Qatar
2
Center for Advanced Materials, Qatar University, Doha 2713, Qatar
*
Author to whom correspondence should be addressed.
Sustainability 2022, 14(13), 8015; https://doi.org/10.3390/su14138015
Submission received: 30 March 2022 / Revised: 7 May 2022 / Accepted: 14 June 2022 / Published: 30 June 2022
(This article belongs to the Section Sustainable Materials)

Abstract

:
The oil and gas industry is involved with severe corrosive/sour environmental conditions due to H2S, CO2, and moisture content. The National Association of Corrosion Engineers (NACE) has developed standards to enable users to select suitable materials for given sour conditions which utilize laboratory testing. A failed piping sample (API-5L-X65) was removed from a pipeline after 15 years of service. Optical microscopy was used to compare the microstructure of the corroded sample near the exposed surface to both the service environment, and further away from it. Moreover, pitted samples were analyzed using a scanning electron microscope coupled with energy dispersive X-ray (SEM/EDS) to understand the deposits’ morphology. Furthermore, XPS analysis proves the presence of a significant content of sulfur compound. Additionally, the mechanical properties of both corroded and non-corroded samples were evaluated and compared. Micro-hardness was carried out on the cross-section of the removed sample to understand any evident hardness variation from the inner diameter (ID) to the outer diameter (OD) of the piping. All the results suggest that prolonged service exposure has resulted in the development of micro defects, resulting in the reduction of strength and impact toughness, and the reduction in the hardness at the exposed surface of the corroded piping. Understanding the corrosion mechanism of pipelines exposed to sour media in the long-term helps in repair/replacement planning and extending the usable design life of the material, and paving the way for the oil and gas industry to develop additional ways to monitor the changes in the critical materials’ properties when exposed to sour service.

1. Introduction

Handling wet hydrogen sulfide (H2S) is one of the significant challenges in the oil and gas industry. H2S is a threat to equipment/piping reliability and is a life-threatening gas. Two failure modes are associated with wet H2S: cracking and thinning (localized/general) [1]. Several industrial standards have been developed for the design, material selection, and fabrication of equipment handling wet H2S service [2,3]. However, failures related to sour service are common in the oil and gas industry. Wet H2S has a significant effect on steel as it charges it with nascent hydrogen, thus influencing its substantial mechanical properties, such as tensile strength, ductility, and fracture toughness [4,5]. This change in critical mechanical properties can affect material functioning during operation and may lead to failures. Additionally, feed gas coming from wellheads carries H2S, CO2, chlorides, and organic acids that can cause accelerated corrosion/thinning in carbon steel pipes. Factors affecting corrosion rates are flow, temperature, pressure, dead-legs, gas composition, corrosion inhibitor (CI) performance, etc. [6,7]. To add more complexity, other chemicals, such as hydrate inhibitors, are also injected into the feed gas to prevent hydrate formation during winter seasons. However, many efforts are made in simulating the field conditions while selecting corrosion and hydrate inhibitors. Still, it is always challenging to create an actual field environment due to a myriad of variables [8]. Lots of work has been conducted in the past in evaluating the effect of hydrogen charging in steel. In one such experiment, API-5L X65 (in-service) piping was used to understand the impact of hydrogen charging on its mechanical properties. However, the service of this piping was non-sour, and non-corroded samples were used for the experiment. Hydrogen was charged in the specimen while carrying out mechanical testing. Hydrogen was generated in the steel due to its reaction to the testing solution. Ductility was measured in terms of elongation and reduction in area, and results were compared between hydrogen-charged and normal steels. A significant reduction in ductility at room temperature (both in terms of elongation and reduction in area) was observed in the steel. This proves that the pre-charging of pipeline steels to a certain hydrogen content can cause irreversible changes in the anelastic and mechanical properties of steel, and result in the modification of the fracture surface and hydrogen permeation process [9]. In another study, the influence of hydrogen and low temperature on mechanical properties of two pipeline materials, X65 and F22 low alloy steel, was studied. New material was used in the experiment, and an electrochemical setup was utilized for hydrogen charging. The diffusible hydrogen content of steels was kept in the range of 0.6 to 2 PPM. The Charpy test was conducted on both X65 and F22 samples with and without hydrogen-charged specimens. A slight reduction in upper-shelf energy along with scattered results for both energy and brittle area values was observed for hydrogen-charged specimens [10]. Hence, in the current research project, the aim is to study the actual piping component which has been exposed to sour feed gas service for around 15 years, and has shown significant corrosion. The corrosion deposits observed on the pitted samples were studied by scanning electron microscope (SEM) imaging and X-ray photoelectron spectroscopy (XPS) analysis. Electrochemical impedance spectroscopy measurements were also conducted on the corroded samples to understand the performance/property of the corrosion scales. The research sample was a part of the 2” piping spool, which is associated with a slug catcher inlet pipeline of a gas plant situated in the State of Qatar. An actual piping sample, which was exposed to sour service in the wet gas multiphase pipeline for 15 years, was tested for its mechanical properties. The selected 2” piping spool has seen active corrosion and was replaced based on severe localized thickness loss. Current research indicates that hydrogen charging impacts the critical mechanical properties of the material [11,12]. The impact was quantified for actual in-service piping material under a specific sour service environment. This information will be utilized for developing future maintenance philosophy for the complete pipeline, based on the severity of the observed impact. In addition, this information will be used for developing repair plans during the replacement of corroded sections of a slug catcher and its associated piping.

2. Materials and Methods

2.1. Materials

The corroded sample analyzed in this research is part of a wet gas inlet pipeline coming from offshore and going to the slug catcher. The corroded piping was a 2″ bypass of an emergency shutdown valve (ESDV13) installed on a 38″ mainline, as seen in Figure 1.
The corroded piping metallurgy is API5L-X60 (NACE), while a nominal thickness of the 2″ piping is 8.74 mm. Table 1 provides the chemical composition and Table 2 shows the mechanical properties of the material as per specification.

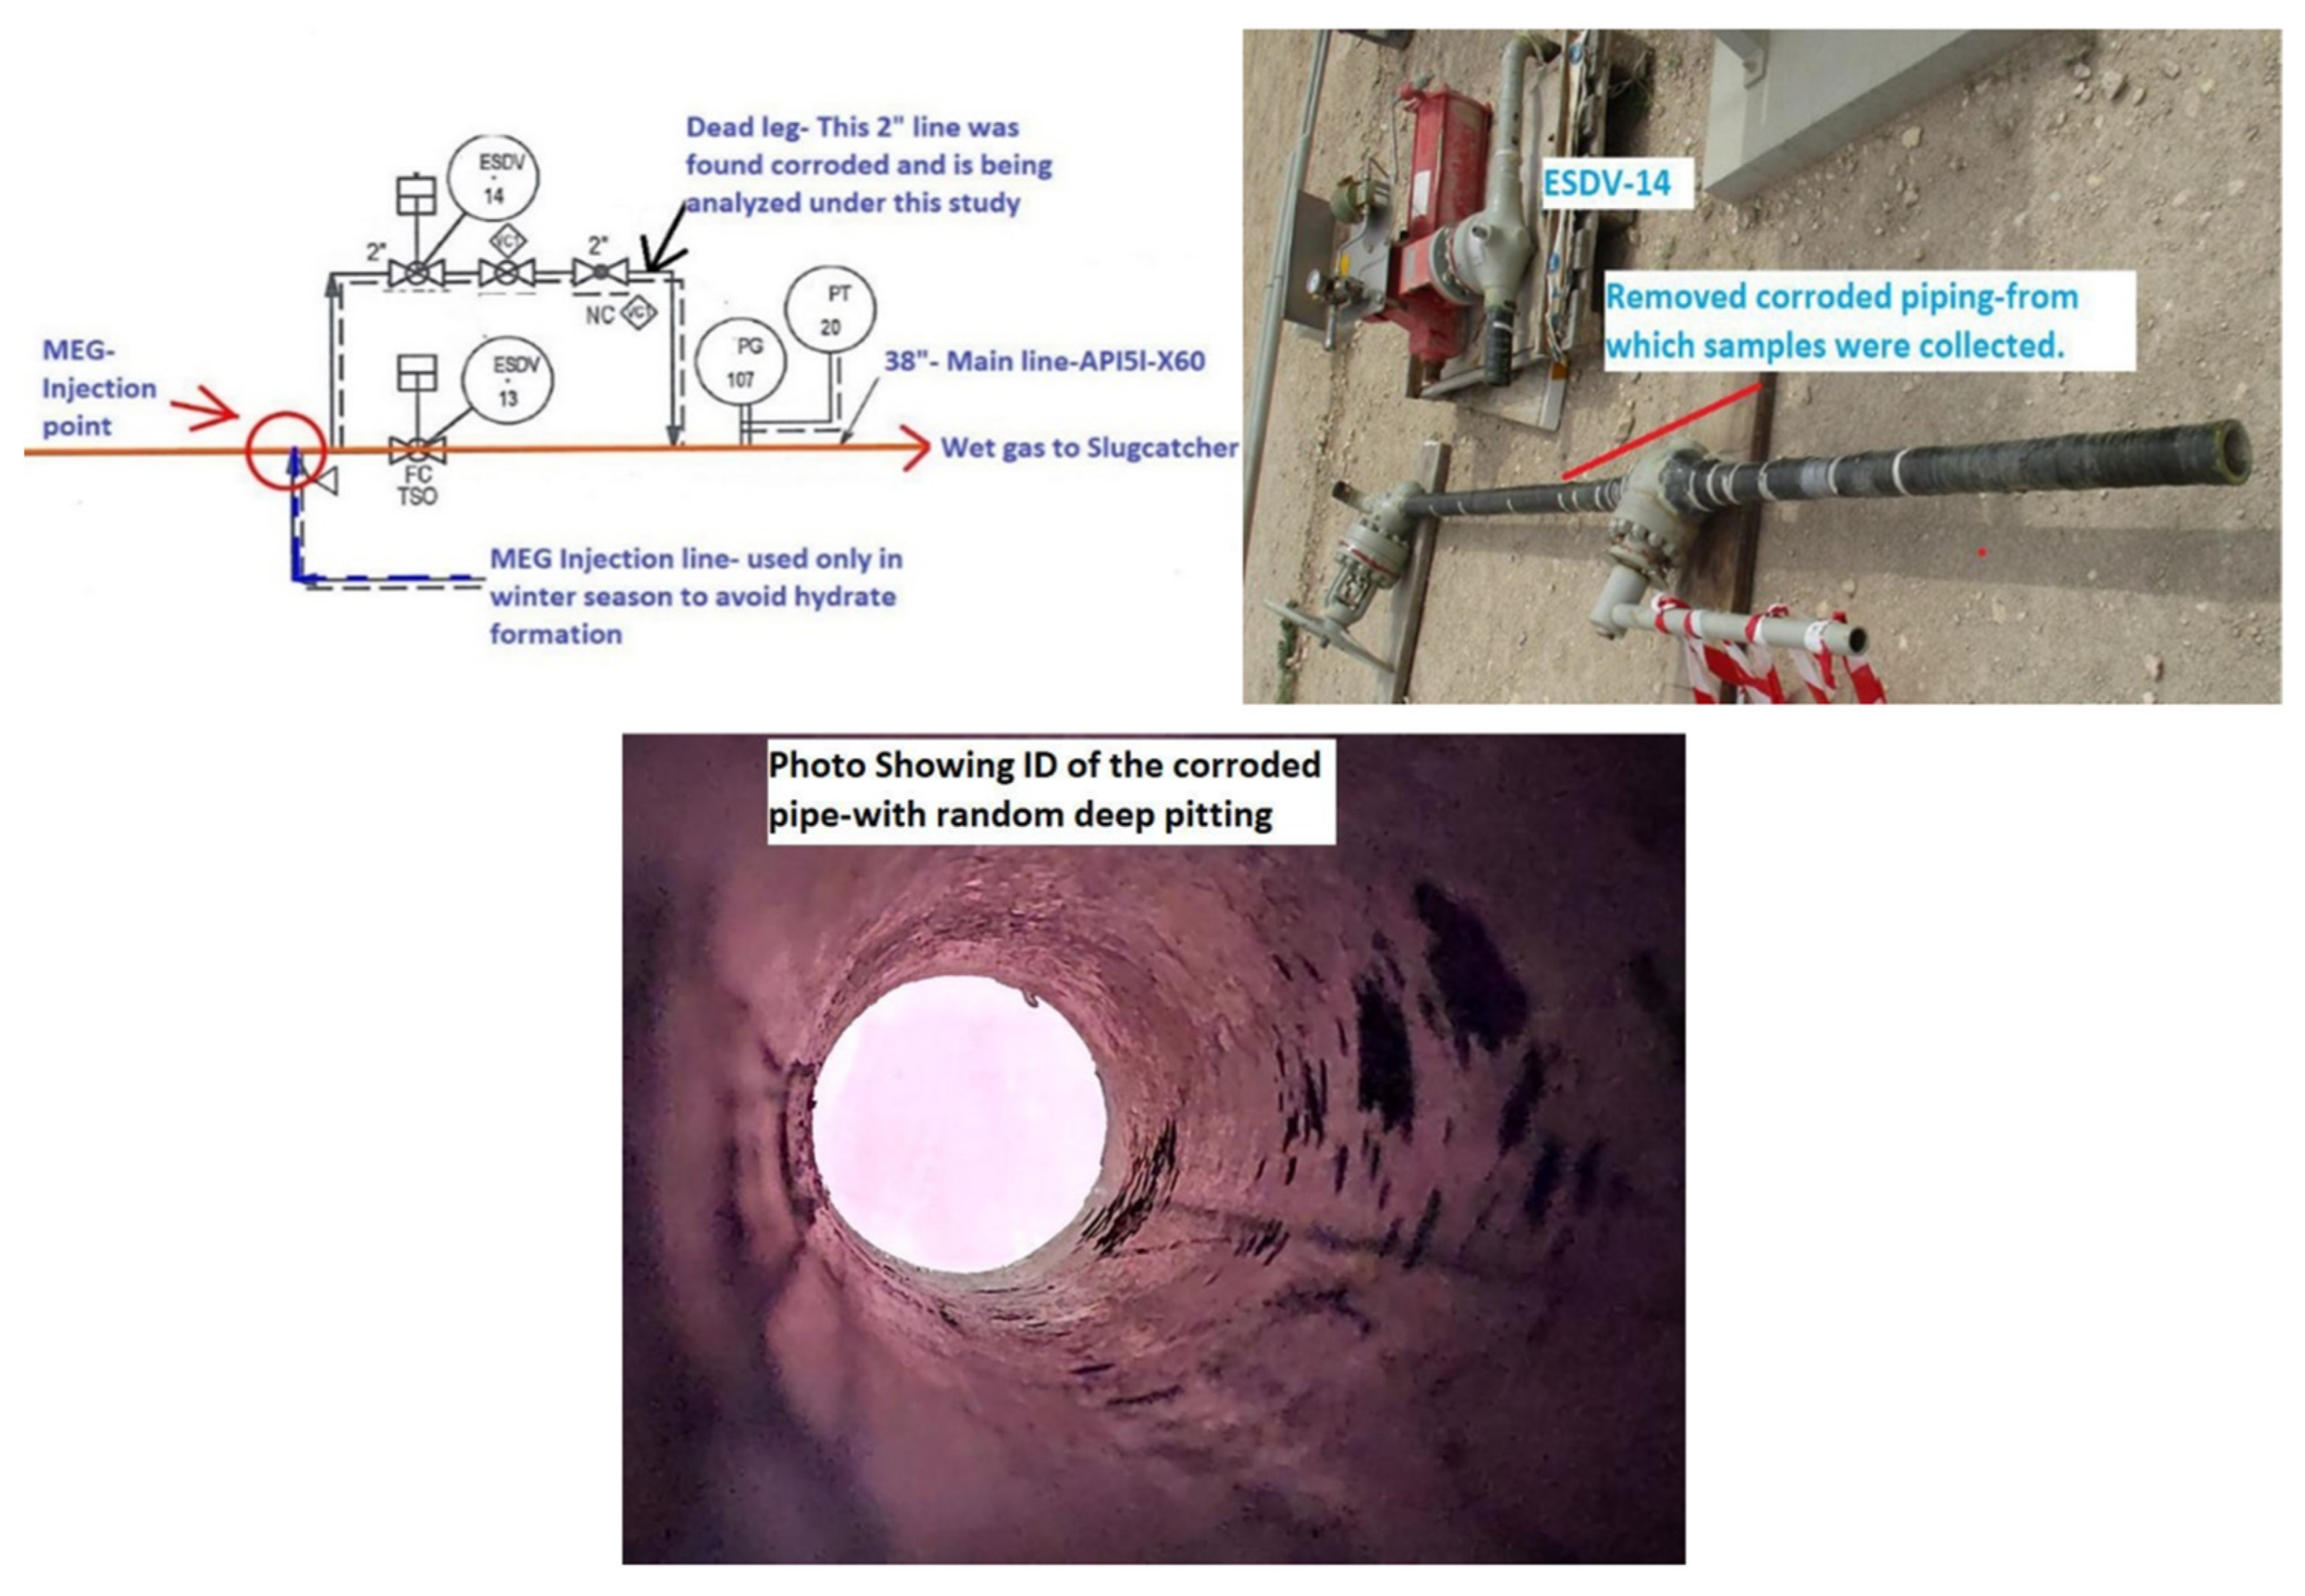
2.2. Operating Conditions

This corroded portion of the piping was a dead-leg as it is a portion of piping with no flow/intermittent flow. However, it was exposed to the operating fluid which is sour wet gas, and has three phases (vapor, liquid condensate, and water). The operating temperature is around room temperature, and the pressure is 80 bar (g). The usual composition of the process fluid is provided in Table 3.

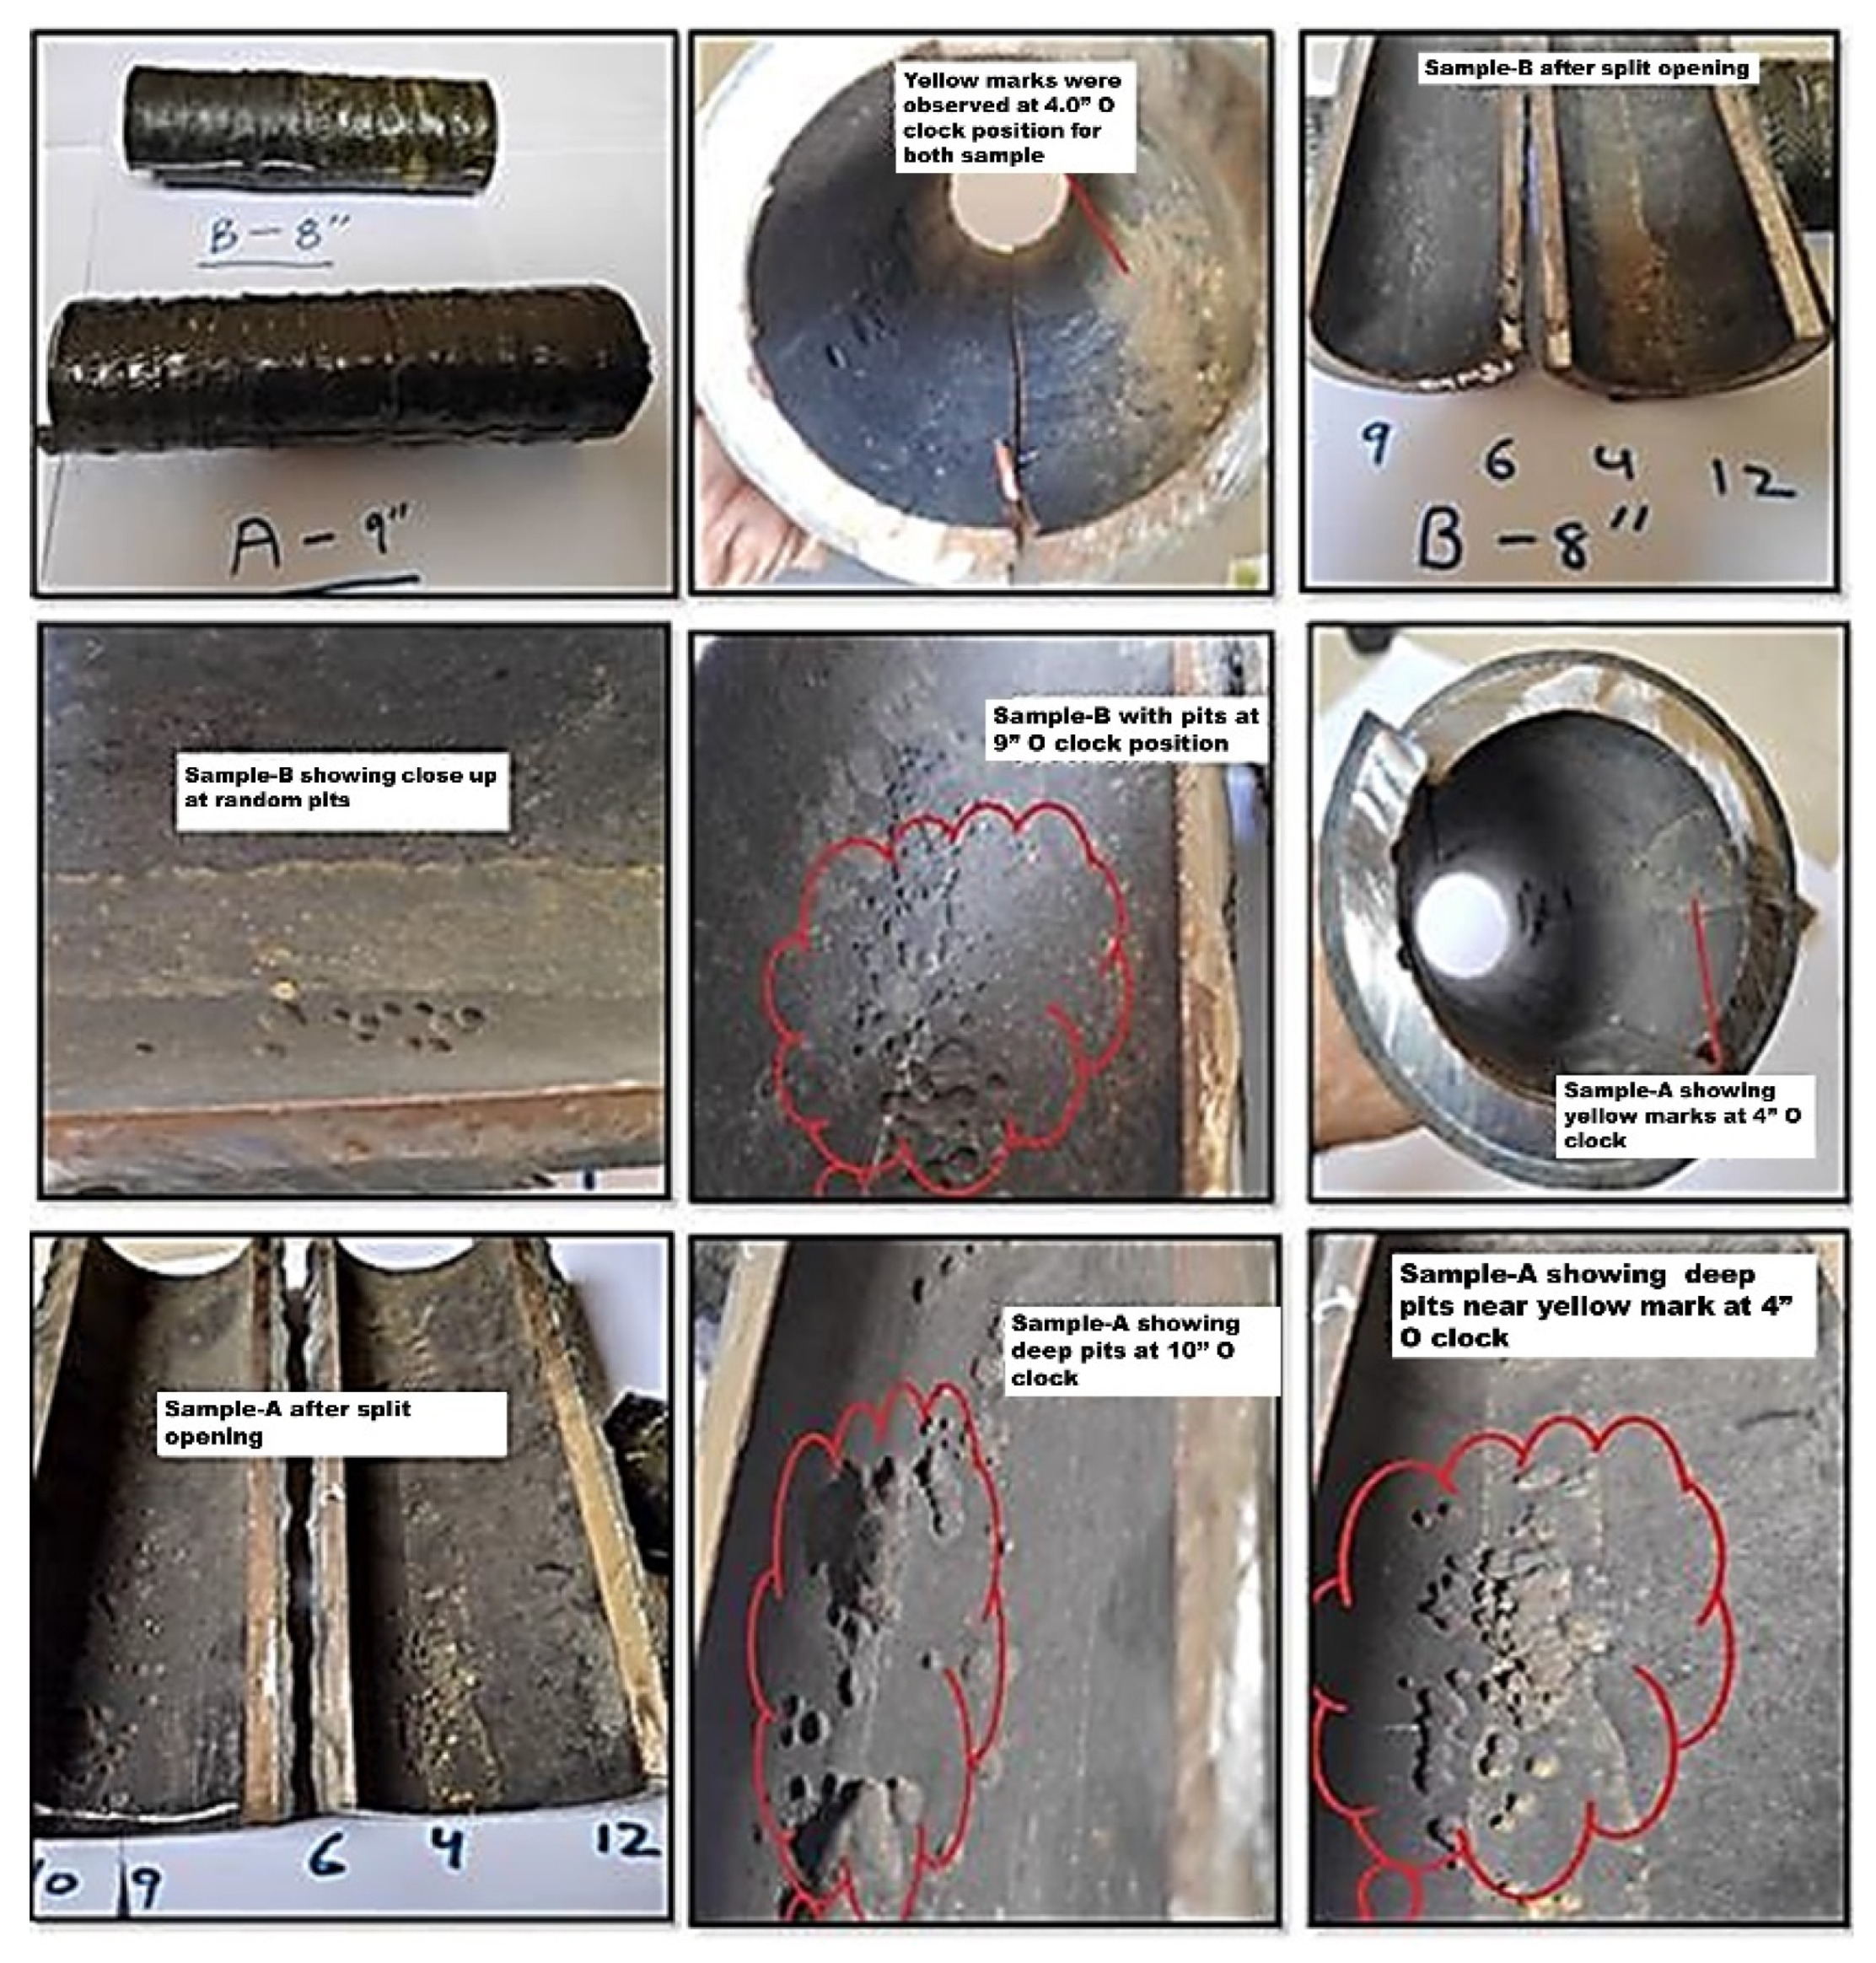
2.3. Visual Inspection Findings of the Corroded Spools

Figure 2 shows two pipe spools (A—9″ and B—8″) which were cut from the removed piping for investigation purposes. The bottom (six o’clock) position was marked in both spools. The corroded piping was externally composite-wrapped to avoid failure during operations. Composite wrapping is visible in the sample photographs. Close visual inspection was carried out on as-removed samples. Following are a few critical observations made on the collected samples: Both samples showed a band of yellow marking at the four o’clock position. Random pits were observed on both samples. The severity of pitting was at its maximum at the 9–10 o’clock position, near the yellow marking.

2.4. Sample Preparation and Testing

The above two piping spools were utilized to prepare the testing specimen for mechanical and surface characterization. Two corroded samples (A and B) were polished, and microhardness was taken across the cross-sectional area to understand the difference in hardness from the ID to the outer diameter (OD) of the samples. The ID of the sample was exposed to sour service and thus had a corroded surface, while the OD had not directly seen the service fluid. The machine used during the testing of samples was FM100. The same samples were utilized to carry out optical microscopy to understand the difference in the microstructure near the ID and the bulk material. A tensile test was carried out using the Instron Universal testing machine. Six samples were fabricated based on the ASTM standard E8/E8M-16a [13]. Three samples were without evident thinning/pitting at the reduced parallel section, whereas the other three samples were prepared with the pitting/corroded area within the reduced parallel sections. Moreover, the strain rate for sample –T1 was kept as 10−4/s, while for rest, the strain rate was kept as 10−3/s. Five standard samples were prepared as per the ASTM standard E23 for the impact test [14]. Three samples were polished and provided with the notch in the center. However, the remaining two samples were prepared without polishing, with the pitted area at the center. Impact testing for all samples was carried out at room temperature using an Avery-Dension, UK Impact Testing machine. All defected points were analyzed by X-ray photoelectron spectroscopy (XPS), Model Axis (Ultra DLD XPS Kratos, Manchester, UK), and were equipped with a monochromatic Al Kα radiation source (1486.6 eV) X-ray Power, 15 kV, 20 mA under a UHV environment (ca. 5 × 10⁻⁹ Torr). XPS is equipped with a set of chambers to transfer sensitive samples from the sample transfer Chamber (STC) to the XPS surface analysis chamber (SAC) under an ultra-high vacuum. SEM and EDS analysis was utilized using Nova Nano SEM 450, with a voltage capability ranging from 200 V to 30 kV. All the samples (A1–A6 and B1–B6) were scanned without removing corrosion products or deposits. Additionally, the fractured surface of the two tensile samples (T2 and T4) were compared to understand the difference in the surface morphology of the failed corroded and non-corroded samples. Electrochemical measurements were performed for both corroded and polished samples. A graphite rod was utilized as an auxiliary electrode. An Ag/AgCl electrode was employed as a reference electrode. The reference electrode is coupled with a Luggin capillary to minimize the potential drop between the electrodes. The tested sample was immersed in 0.5 M Na2SO4 for 30 min before each electrochemical test to achieve a steady-state condition. The EIS analyses were performed under an open circuit potential (OCP) condition at a frequency range of 1 × 10⁻¹ to 1 × 10⁵ Hz, with an AC amplitude of ±10 mV, using a GAMRY 3000 potentiostat (Gamry, Warminster, PA, USA).

3. Results and Discussion

3.1. Optical Microscopy Analysis
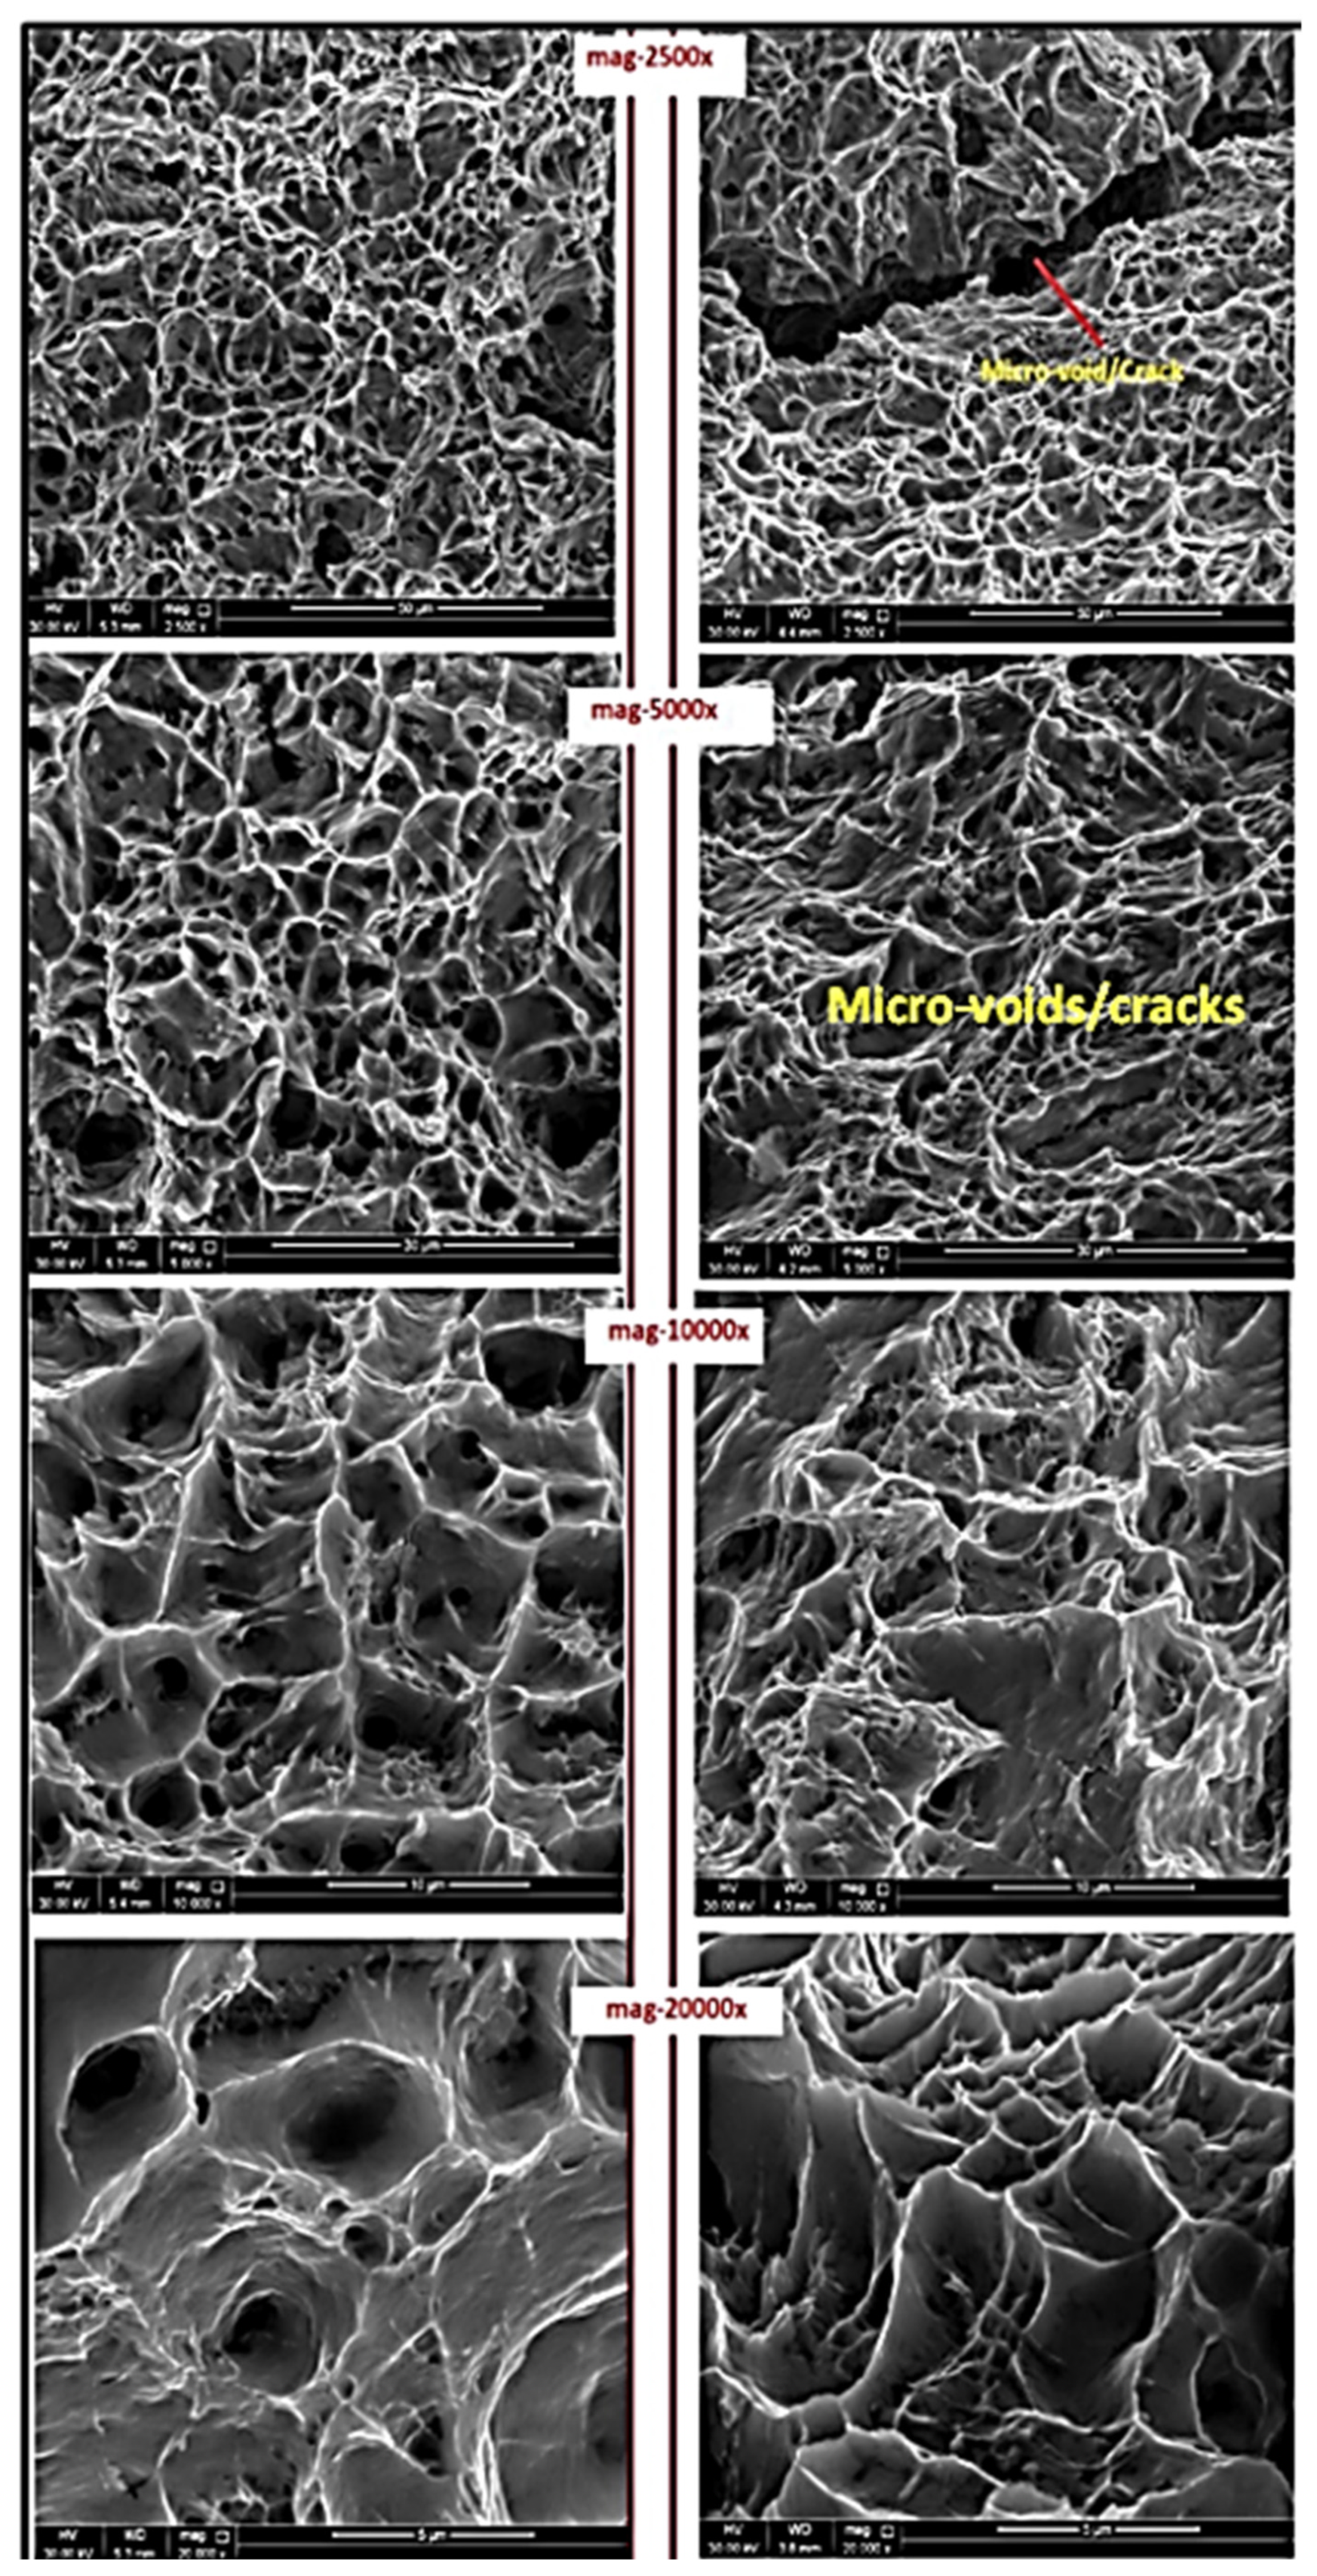
Different points in the defected surfaces were examined by optical microscopy to understand the difference in microstructure at the ID and bulk of the sample. Optical microscopy images, Figure 3, clearly indicate differences in microstructure in the area exposed to service (sample ID) and at the bulk of the samples. The cluster of hydrogen blisters can be seen near the ID of corroded samples. The area near the ID/corroded surface also corresponds to low hardness. The presence of micro-cracks near the ID of the sample is also clearly visible. These findings indicate significant degradation in the material due to long-term exposure to sour service.

3.2. SEM Analysis

All samples were analyzed with an SEM/EDS technique to understand the as-received surface morphology of the corroded and non-corroded samples. All analyses show a significant presence of sulfur in the deposits. The shown SEM micrographs were taken without any cleaning or polishing to understand the pitting/corrosion morphology and to carry out deposit analysis. Samples were divided into three categories:
Figure 4 depicts the SEM images of samples with pitting in the yellow-mark area represented in points A1, A2, B1, and B2. All points prove the porous nature of corrosion scales; furthermore, in the close-up view of the scales in B1 and B2, the aggregated particles confirm the presence of sulfur.
Figure 5 shows the SEM images of the samples with pitting corrosion outside the yellow-mark area: A3, B3, and B4. The SEM images are evidence of the sulfur grains of these samples.
Figure 6 represents the SEM images of the samples with no evident pitting corrosion (A5, A6, B5, B6). It can be noticed that the SEM image of point B5 shows a spherical mineral aggregate. Meanwhile, the caption of the B6 image shows possible sulfur grains.
Carbon, iron, elemental sulfur, sodium, and potassium were found in all EDS analyses. The corrosion deposit layer was found porous (non-adherent) with multiple cracks, which indicates active corrosion. Samples with visible pits were also seen with corrosion products, similar to the one found in the pitted samples. The SEM images clearly indicate active corrosion happening in the piping.

3.3. Microhardness Test

As mentioned previously, two corroded samples were polished, and microhardness was taken across the cross-sectional area to understand the difference in hardness from the ID to the OD of the samples. Figure 7 shows one of the samples, and the hardness profile was developed from the ID to the OD, i.e., from the corroded surface to the bulk material.
The low thickness is evident at the ID (near the corroded surface) of the samples. Hardness in the bulk material (at center and OD) is observed to be similar to the average hardness of the new API 5L-X60 material. Loss of hardness is aligned with yield strength, and UTS results obtained from these samples. This indicates the effect of a prolonged in-service environment and active corrosion. The overall mechanical results can be summarized as a loss of strength and toughness, accompanied by a reduction in hardness (especially at the exposed surface). Nykyforchyn et al. reported similar results, and it was explained by the proposed theory of the development of microdefectness after 10–20 years of service [11].

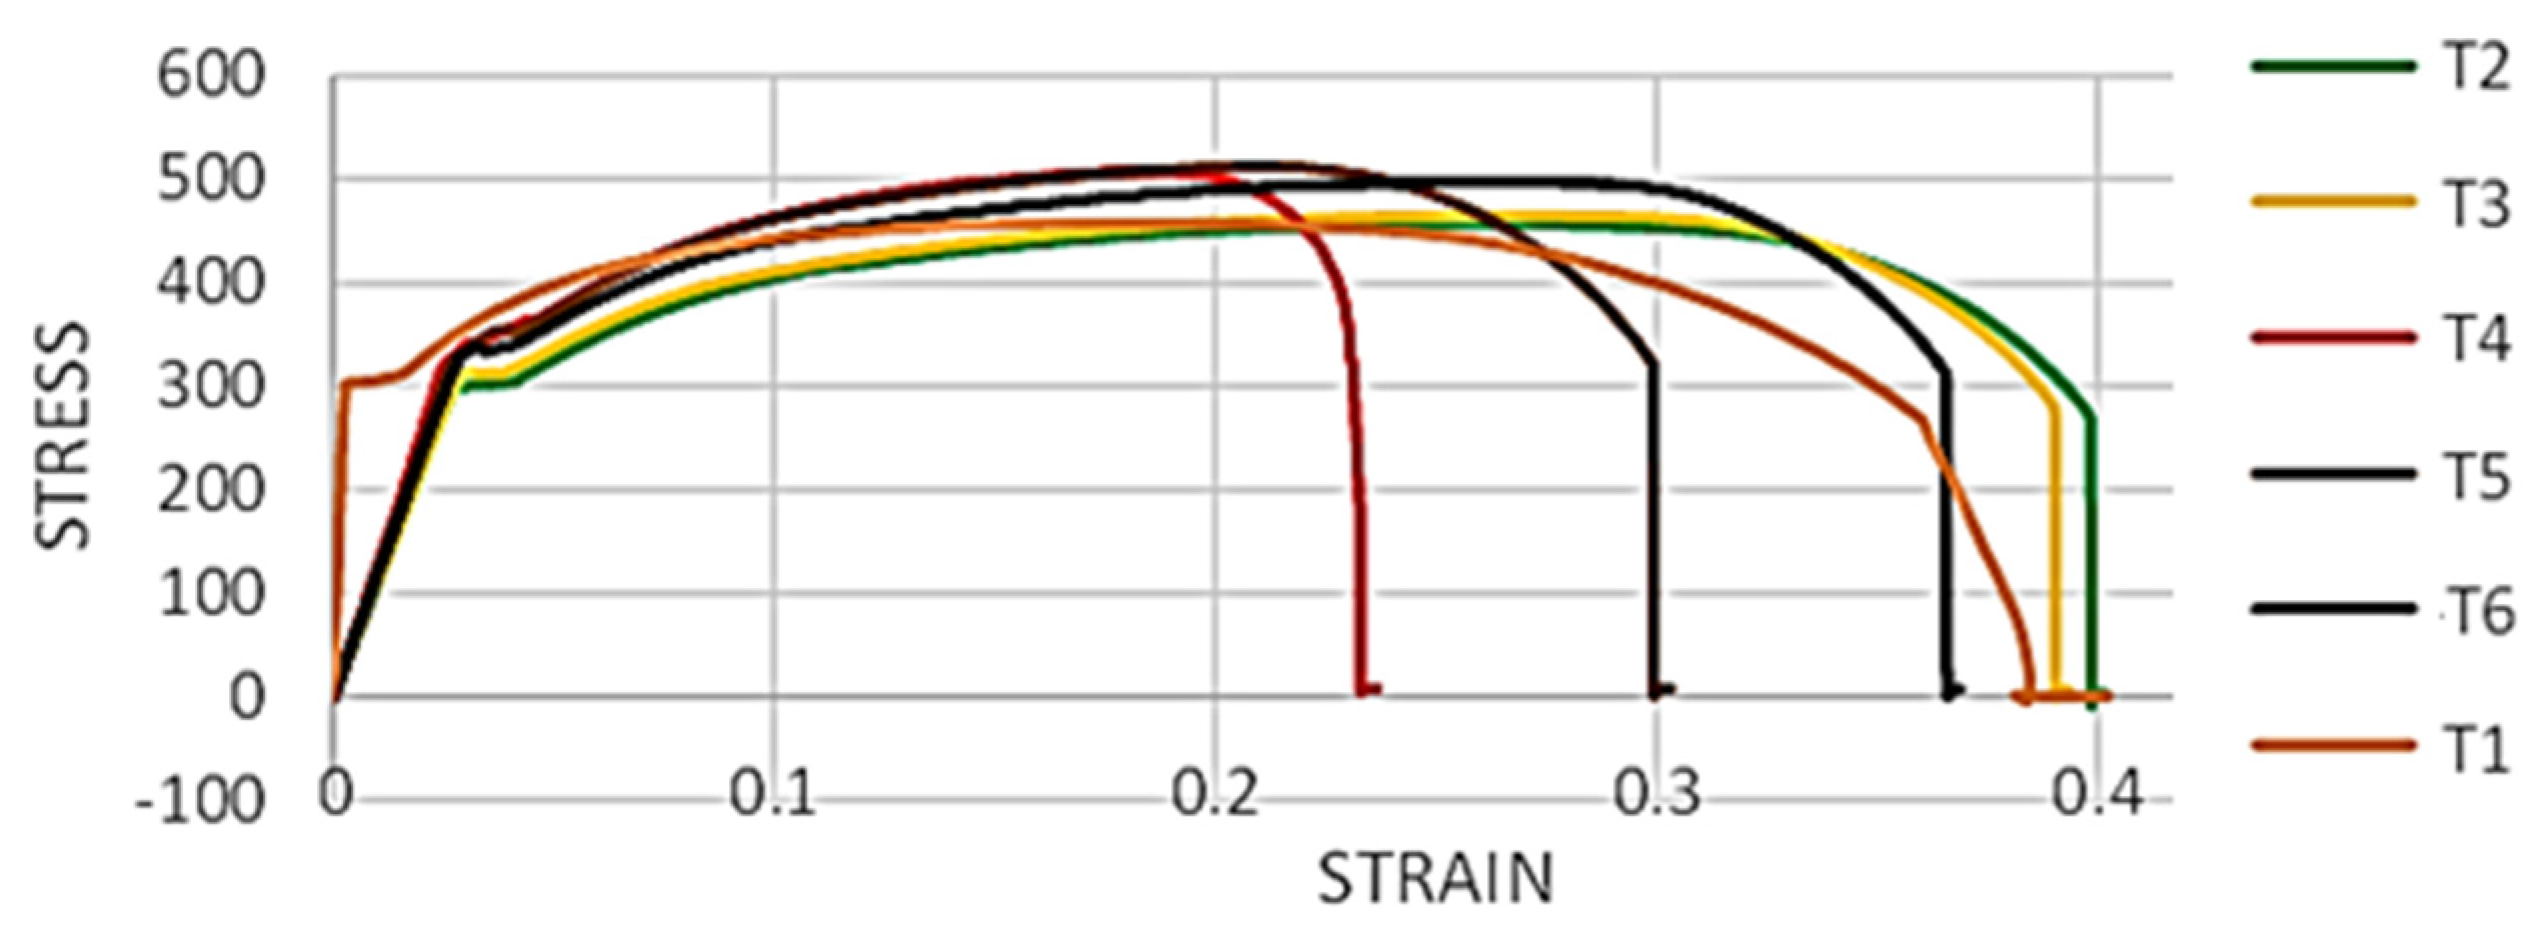
3.4. Tensile Test Results
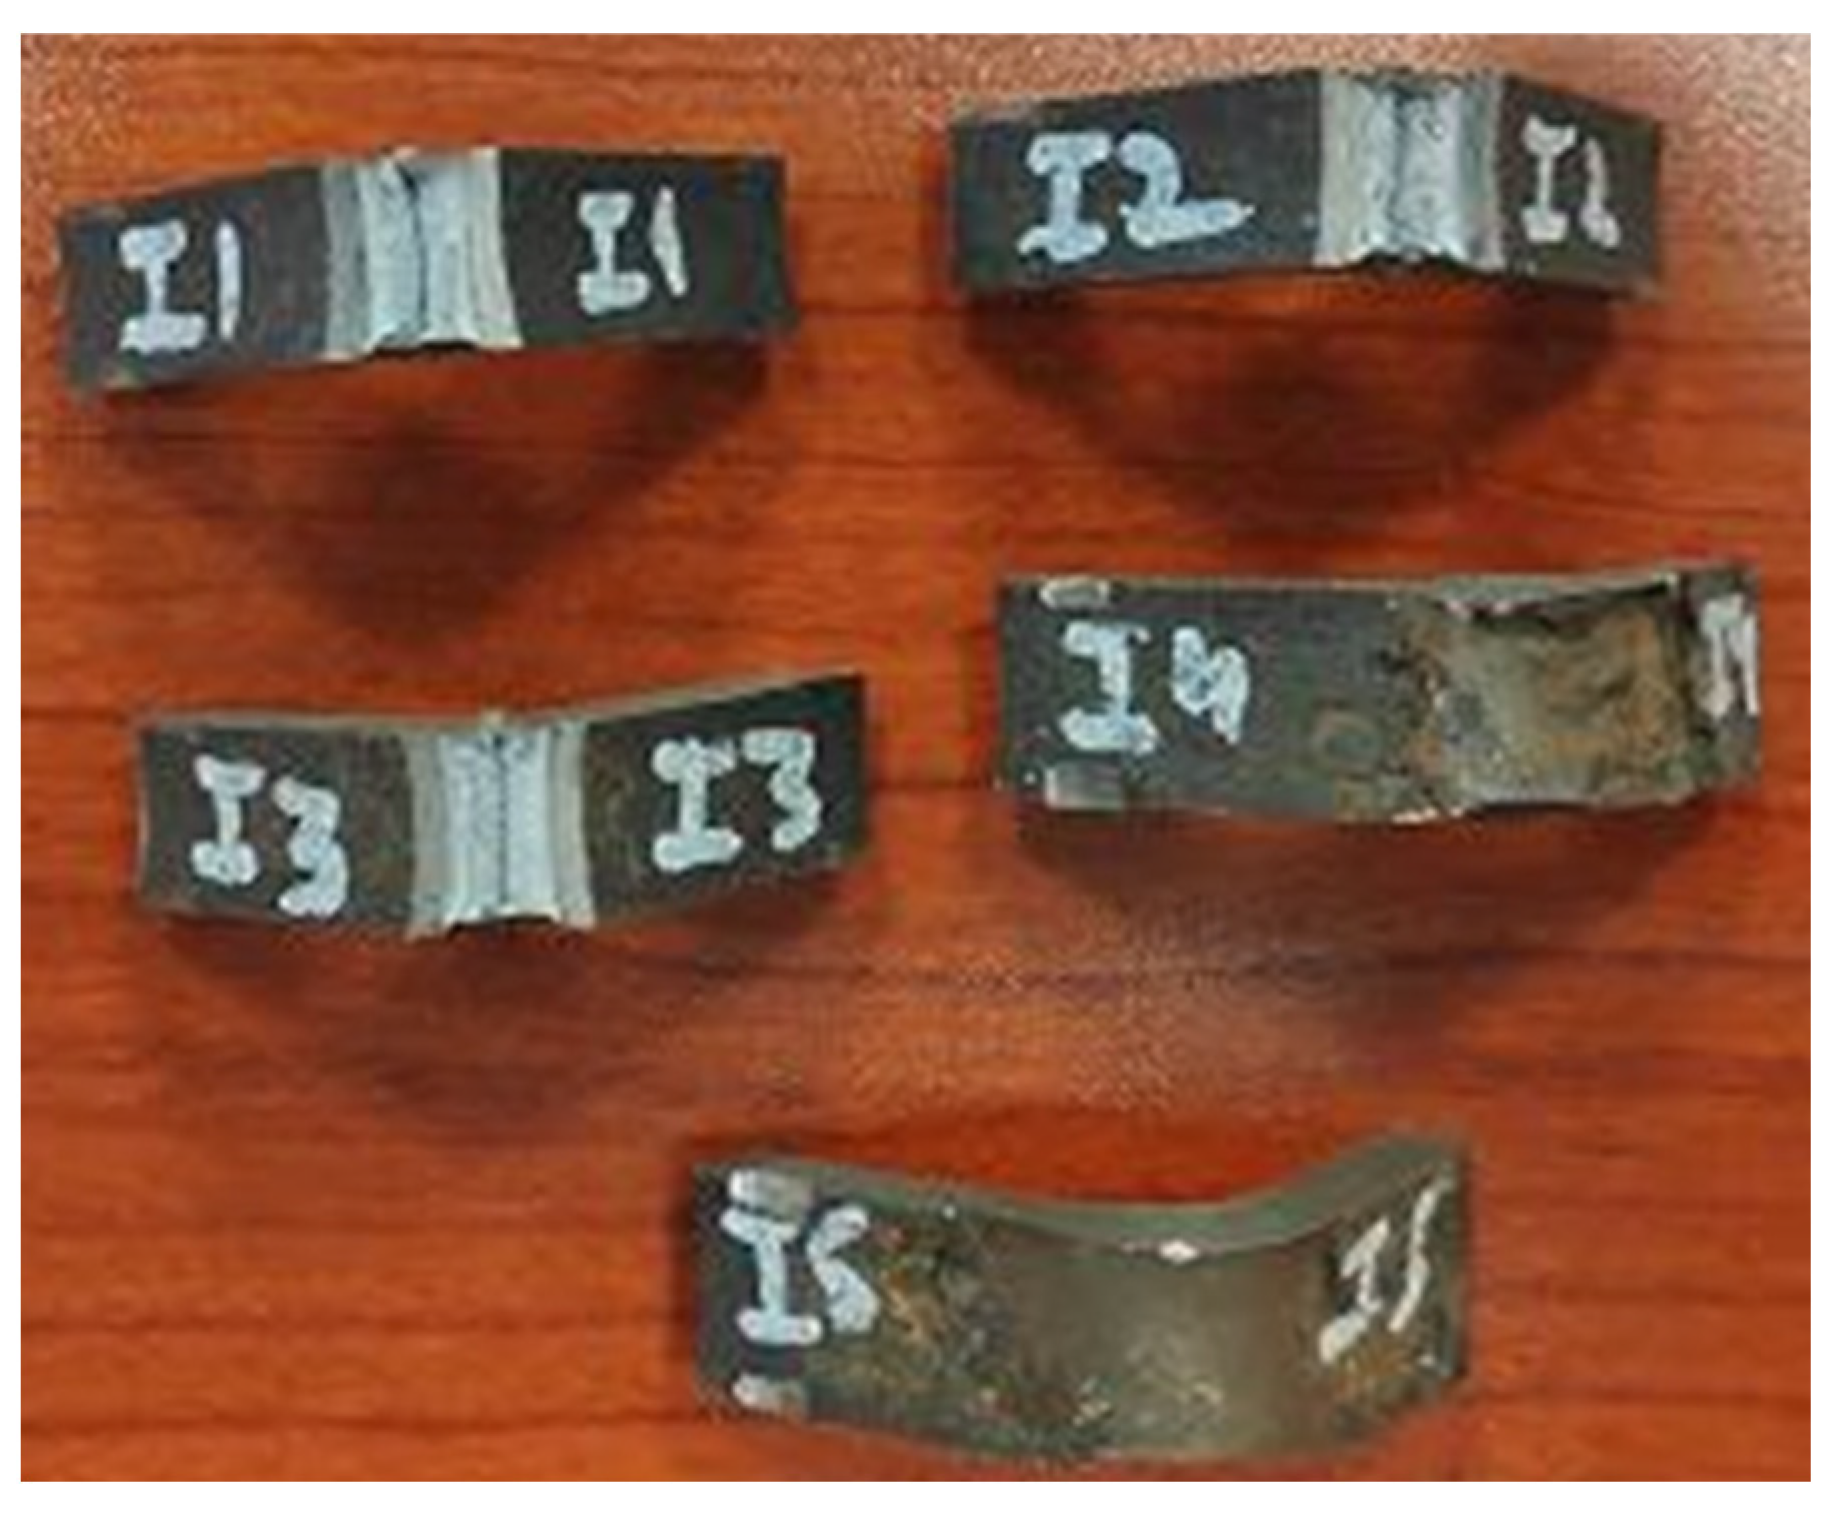
Table 4 provides a summary of the results for all tensile samples. Corroded samples show higher yield stress and UTS when compared to non-corroded samples; however, absolute values for both samples are significantly lower than the standard values. This suggests that complete in-service piping was affected by the prolonged exposure to sour service irrespective of the corrosion condition. However, the effect on the corroded portion seems to be more aggravated in terms of reduction in yield stress and UTS. The elongation% values are found to be significantly higher than the standard values. However, a stark difference is noticed between the corroded and non-corroded samples. Corroded samples exhibit lower values of % elongation. However, the obtained values are still higher than the standard values [15].
Figure 8 shows the elongated length of all failed samples. It is evident that the elongated length of corroded samples (T4, T5, and T6) is lesser than the elongated length of un-corroded samples (T1, T2, and T3). The difference in the elastic modulus of stress-strain curves is due to the resistance of the sample to elastic deformation; hence, the samples with higher elastic modulus are harder than samples with a lower elongated length. Based on the observed results, the area under the stress strain curve clearly shows a reduction in the toughness of the corroded samples. The loss in yield and tensile strength is evident in all samples (corroded or non-corroded). In wet H2S environments, the H+ ions combine with the electron released by the corrosion of piping, and from atomic hydrogen. More active corrosion yields more atomic hydrogen on the piping surface exposed to the sour service. Atomic hydrogen can recombine to form molecular hydrogen, which is usually harmless for steel. However, this atomic hydrogen recombination reaction rate is significantly reduced due to the presence of H2S. Thus, the accumulated atomic hydrogen on the steel surface can permeate into the steel material and accumulates at available hydrogen traps (inclusions/grain boundaries/laminations/dislocations, etc.). This permeation of atomic hydrogen is directly proportional to the partial pressure of H2S in the service [16,17].
The samples tested during this research were operated at 80 bar pressure, with 3 mol% of H2S in the liquid phase. This accumulated hydrogen can promote dislocation emission, multiplication, and motion at the local hydrogen enrichment region [15,18]. Another effect of hydrogen is to decrease the cohesive strength of Fe-Fe bonds. Finally, yet importantly, accumulated atomic hydrogen can recombine and form molecular H2, thus increasing the internal pressure, enhancing the crack growth and the reduction in both yield and tensile strength [12]. Another important observation made from the tensile testing is that the corroded samples showed relatively lesser % elongation when compared to non-corroded samples. Corroded samples were not polished and had noticeable pits at the center of the reduced cross-sectional area of the tensile samples. Pitting corrosion can act as a stress concentration site and thus can affect the overall elongation of the corroded samples though overall, all samples revealed higher % elongation than the minimum required (17.5%) as per standard. The other main reason for this relatively lower elongation % in the corroded samples could be bulk material degradation (both macroscopic and microscopic) due to the combination of the effect of stresses and a corrosive environment [11]. The charged hydrogen can significantly increase the dislocation density, increasing the strength and reducing the % elongation in corroded samples compared with non-corroded samples.
Two fractured surfaces from the tensile test for corroded and non-corroded samples were analyzed with SEM to understand the difference in the failure mode of corroded and non-corroded samples, which are represented by T2 and T4, respectively. Figure 9 shows the SEM images at different magnifications of both samples. Significant differences can be noticed in the failed tips. Micro-voids or cracks can be seen in sample T2. The depth of the cup/cone is significantly more in the T4 sample. Thus, indicating that active corrosion impacts the ductility and microstructure of the piping material. The same was noticed in terms of the elongation% results.

3.5. Impact Results

All samples were tested using an Avery-Dension, UK Impact Testing machine. Samples (I4 and I5) without a notch were not broken, and the energy absorbed was significantly higher than the samples which had a notch. Table 5 provides a summary of the results:
Figure 10 illustrates the broken impact samples. It is evident that the samples without a notch did not break and absorbed more energy. Additionally, the notched samples were not broken into two pieces. However, as per the ASTM standard-E23: If a fractured impact specimen does not separate into two pieces, report it as unbroken. Unbroken specimens with absorbed energies of less than 80% of the machine capacity may be averaged out with the values from broken specimens [14].
A significant decrease in brittle fracture resistance (absorbed energy) at room temperature was noticed in all tested samples. This may be explained by the presence of hydrogen (produced due to corrosion) mostly bound in deep traps and inclusion sites available in the original material. During the impact tests, the diffusion and accumulation of hydrogen were inhibited due to the high-impact speed. The reduction in the Charpy absorbed energy of specimens after corrosion is mainly attributed to the decreasing Fe-Fe bonds and the presence of hydrogen-induced microcracks [20]. Similar results were also reported by researchers while testing an in-service material X52 Steel [11].

3.6. XPS Analysis

All the tested samples (A1/A3/B1/B3) show the presence of sulfur, iron, and oxygen in the surface analysis results. Table 6 provides the summary of elements found in each tested sample:
The peak fitting of XPS data shows the presence of hydrocarbon, iron oxides, iron sulfide, iron sulfite, and elemental sulfur. The presence of elemental sulfur explains the yellow layer observed in the corroded samples during visual inspection. Glycol was injected into the piping during every winter season to inhibit hydrate formation, which explains the presence of hydroxide in deposits. The presence of elemental sulfur in a sour environment makes it very aggressive for corrosion [19]. Elemental sulfur is generally present in the sour gas coming from offshore and is produced due to oxidation of H2S. Like the temperature, the pressure of the pipeline changes, and the elemental sulfur can accumulate on the pipe surface and cause a catastrophic corrosion of carbon steel [21]. The corroded pipe taken for this research is a dead-leg (a portion of pipe with no flow/intermittent flow), and thus conditions are ideal for the elemental sulfur deposition. Formation of elemental sulfur can take place in an aqueous system as a result of the oxidation of sulfide species, as shown by the following equations [22]:
8 H 2 S + 16 Mn +     16 H + + 16 Mn ( n 1 ) +  
8 H 2 S + 4 O 2     S 8 + 8 H 2 O  
Some researchers propose that the formation of acidic species due to the hydrolysis of sulfur species is the governing factor for corrosion in the presence of elemental sulfur [23].
Other researchers hypothesize that an electrochemical reaction between iron and polysulfide is the driving force for corrosion in systems with the presence of elemental sulfur [24,25]. Though a consensus has not been reached in terms of the actual corrosion mechanism related to the elemental sulfur, Figure 11 and Figure 12 depict the XPS analysis for different corroded samples (A1/A3) and (B1/B3), respectively. XPS, carried out to see the effect of element sulfur on corrosion rate, concludes that the absence of sulfur decreases the corrosion rates by two-fold, thus proving that even 1 ppm of elemental sulfur can significantly contribute to higher corrosion rates [26].

3.7. Electrochemical Measurements

An EIS technique was employed to describe the electrode/electrolyte interfaces quantitatively. It is considered a potent method that can explain the corrosion behavior and calculate their rates [27,28,29,30,31,32]. Figure 13 shows the proposed equivalent circuit (EC) utilized to analyze and fit the collected experimental data. It exhibits the one-time constant equivalent circuit. The parameters of the electrochemical reactions occurring at the metal/solution interface are listed in Table 7, and are measured and calculated from the EIS Nyquist plot, in which the electrolyte resistance (Rs), charge transfer resistance (Rct), constant phase elements for the charge transfer resistance (CPEct), and the deviation parameters (n) from the ideal double-layer capacitance (Cdl) are included.
The constant phase element is used in place of a pure capacitor as it is composed of the capacitance and deviation parameter to encounter the imperfect behavior of a double layer, which may occur because of a non-uniform thickness of the corrosion inhibitor layer, non-uniform corrosion reaction on the surface, or non-uniform current distribution and surface roughness. The capacitance behavior is mainly attributed to the dielectric nature of the surface film (corrosion product and/or inhibitor film), which affects the corrosion rate of the metal, and it can be expressed by the following equation [27]:
Z C P E = [   Y o 1   ( j ω ) n ]
where Z C P E is the impedance of CPE (Ω cm−2), Y o is a proportional factor in sn Ω−1 cm−2, j = (−1)1/2, ω is the angular frequency in rad s−1, and n is the deviation parameter, and its value is between 0 and 1. When n = 1, the CPE becomes equivalent to an ideal capacitor, and when n = 0, the CPE becomes equivalent to a resistor [27].
Figure 14 shows the measured Nyquist EIS data for uncorroded and corroded API-5L-X60 specimens immersed in 0.5 M Na2SO4 to compare the corrosion behavior of the two specimens. Table 7 clearly shows that the corroded sample (without polishing) exhibits a lower corrosion resistance when compared to the un-corroded polished sample. This also proves that the corrosion product layer on the corroded sample does not adhere and is not sufficient to stop further corrosion. These results are also aligned with the SEM images, which showed the porosity in the corrosion deposits found in the samples.

3.8. Correlating of Surface Analysis Results

The SEM images of the pitted and not-pitted samples show a significant amount of porous deposits. Corrosion impacts the generation of atomic hydrogen, which can diffuse into steel and accumulate and form blisters, as seen in the optical microscopic images. The process parameters of the failed sample show the presence of sulfides, carbide, and free sulfur, thus making it a complex system to predict corrosion rates [33]. A lot of research has been undertaken to understand the effect of H2S on the CO2 system [34,35,36,37,38,39]. The corrosion process involves lots of complex combinations of reactions that affect the corrosion rates and film-forming rates. In the presence of aqueous H2S, iron sulfide formation can take place by any of the three routes. First is the formation of the black layer by the anodic dissolution of iron at the surface. This Fes layer/film keeps on increasing by continuing the anodic dissolution of iron at the metal and sulfide film interface. However, the reaction rate is limited by the diffusion of Fe ions and electrons through the FeS layer. Another possibility is that Fe ions directly dissolve into the solution and react with sulfide ions present in the solution. No FeS layer is deposited on the solution/metal interface during this kind of interaction. Alternatively, ferrous ions can react at both the surface and the solution, resulting in the formation of a porous, non-adherent, and non-protective FeS layer. Besides enabling cathodic reactions, this corrosion layer also facilitates anodic dissolution of Fe which can be considered as a galvanic corrosion interaction [40,41]. As explained in XPS, elemental sulfur can further aggravate the corrosion rates. The above results indicate that the corrosion product layer observed in the examined samples is porous, non-adherent, and thus provides no protection against ongoing corrosion.

3.9. Correlating Mechanical and SEM Analysis

Results obtained from all the mentioned analyses need to be analyzed comprehensively with respect to the overall effect of the hydrogen-charging environment on the material properties. Material strength was reduced, along with an increase in elongation%. Similarly, hardness values were reduced at the ID of material that was exposed to the sour service, along with a significant reduction in the absorbed energy values during the impact testing. SEM analysis of the fractured surface of tensile samples clearly indicates the presence of microvoids/microcracks. The size of dimples was found smaller in the corroded sample than in the non-corroded samples. All of these changes can be attributed to the effect of hydrogen charging in the material due to prolonged exposure to wet H2S service. Based on previous research, there are mainly three principal mechanisms of hydrogen embrittlement (HE) and Hydrogen induced sulfide stress corrosion cracking, which can be used to explain the observed results during this research. These are Hydrogen Enhanced Localized Plasticity (HELP), Hydrogen Enhanced Decohesion (HEDE), and Adsorption Induced Dislocation Emission (AIDE) [42].
HELP: This mechanism is based on localized softening because of the solute hydrogen forming hydrogen atmosphere around both mobile dislocations and dislocations obstacles [43]. This results in the reduction of resistance of dislocation motion due to obstacles and increment in the dislocation velocities in the presence of hydrogen. As the hydrogen concentration is localized near crack tips due to hydrostatic forces, it is proposed that deformation is facilitated locally near crack tips via a localized microvoid coalescence process. Thus, HELP should result in smaller dimples on fracture surfaces than those produced in inert environments [42].
HEDE: This mechanism is based on the weakening of metal–metal bonds at or near crack tips due to the high concentration of hydrogen, resulting in tensile separation of atoms in the place of slip [42]. The weakening of bonds is thought to result from a decrease in electron charge density between metal–metal atoms due to hydrogen’s presence [44].
AIDE: This mechanism is also based on weakening interatomic bonds due to hydrogen charging, causing crack growth by a localized slip instead of tensile separation [45]. It is proposed that the adsorbed hydrogen (at the surface and up to a few atomic layer depths) causes weakening in the interatomic bonds of the substrate, further facilitating the emission of dislocations from the crack tip.
Considering the complex nature of the mechanisms explained above, it is extremely difficult to conclude one mechanism causes an alteration in the mechanical properties of the material. These mechanisms for cracking may occur conjointly in some circumstances, although with one dominant mechanism [42]. However, all the above cracking mechanism or their combination can explain the reduction in the strength of material and increment in the elongation%. The effect of adsorbed hydrogen near the ID may also cause the softening effect of the substrate.

4. Conclusions

The purpose of the research was to understand the effect of prolonged exposure to a sour environment on the piping material (API-5L-X60), which was selected as per the NACE- MR0175 standard. Limited research has been conducted on the piping samples that have been exposed to the severe sour environment. Optical microscopy revealed degradation in microstructure near the ID of the pipe. Hydrogen blistering and microcracks can be clearly seen in optical microscopy images at the ID of the samples. Hardness data revealed a difference near the exposed surface (ID), against that at the bulk of the material. The surface exposed to sour service exhibited lower hardness values compared to bulk hardness. Tensile test results clearly suggest the degradation of material in terms of a 22% reduction of yield strength and a 5% reduction of UTS when compared to the minimum standard values. Reduction in YS and UTS was also accompanied by an increase in elongation%. A clear difference was observed in the corroded and non-corroded samples in terms of % elongation, with corroded samples demonstrating 10–15% less elongation. Moreover, the overall toughness of the corroded samples was also observed to be significantly lower than the un-corroded samples. Additionally, a severe reduction (64%) in the impact properties was also observed in the samples, proving that prolonged exposure has significantly reduced the impact toughness of the piping material. The research confirms the degradation of pipeline steel with active corrosion over a period of 15 years of service. The impact of active corrosion is not limited to a reduction in thickness; rather, it also impacts the critical mechanical properties of the material.

Author Contributions

Conceptualization, A.M.A.; methodology, M.Y. and M.H.S.; validation, K.M.Y. and A.M.A.; formal analysis, M.Y. and M.H.S.; investigation, M.Y.; resources, N.H.A.-Q.; data curation, M.Y. and K.M.Y.; writing—original draft preparation, M.Y. and A.M.A.; writing—review and editing, M.H.S. and A.M.A.; supervision, A.M.A. and K.M.Y.; funding acquisition, A.M.A. All authors have read and agreed to the published version of the manuscript.

Funding

This work was supported by (i) the Qatar National Research Fund (QNRF, a member of the Qatar Foundation) through the National Priority Research Program Grant (NPRP) NPRP13S-0117-200095 and (ii) Qatar University throught an International Research Collaboration Co-Fund grant, IRCC-2021-015. Statements made herein are solely the responsibility of the authors.

Institutional Review Board Statement

Not applicable.

Informed Consent Statement

Not applicable.

Data Availability Statement

Data will be available upon request.

Acknowledgments

SEM images were done at the Central Laboratory Unit (CLU) of Qatar University.

Conflicts of Interest

The authors declare no conflict of interest.

References

  1. Nešić, S. Key issues related to modelling of internal corrosion of oil and gas pipelines—A review. Corros. Sci. 2007, 49, 4308–4338. [Google Scholar] [CrossRef]
  2. Traidia, A.; Alfano, M.; Lubineau, G.; Duval, S.; Sherik, A. An effective finite element model for the prediction of hydrogen induced cracking in steel pipelines. Int. J. Hydrogen Energy 2012, 37, 16214–16230. [Google Scholar] [CrossRef]
  3. Alamri, A.H. Localized corrosion and mitigation approach of steel materials used in oil and gas pipelines—An overview. Eng. Fail. Anal. 2020, 116, 104735. [Google Scholar] [CrossRef]
  4. Shibata, A.; Madi, Y.; Okada, K.; Tsuji, N.; Besson, J. Mechanical and microstructural analysis on hydrogen-related fracture in a martensitic steel. Int. J. Hydrogen Energy 2019, 44, 29034–29046. [Google Scholar] [CrossRef]
  5. Silva, S.; Silva, A.; Gomes, J.P. Hydrogen embrittlement of API 5L X65 pipeline steel in CO2 containing low H2S concentration environment. Eng. Fail. Anal. 2020, 120, 105081. [Google Scholar] [CrossRef]
  6. Wang, P.; Wang, J.; Zheng, S.; Qi, Y.; Xiong, M.; Zheng, Y. Effect of H2S/CO2 partial pressure ratio on the tensile properties of X80 pipeline steel. Int. J. Hydrogen Energy 2015, 40, 11925–11930. [Google Scholar] [CrossRef]
  7. Sliem, M.; Fayyad, E.; Abdullah, A.; Younan, N.; Al-Qahtani, N.; Nabhan, F.F.; Ramesh, A.; Laycock, N.; Ryan, M.; Maqbool, M.; et al. Monitoring of under deposit corrosion for the oil and gas industry: A review. J. Pet. Sci. Eng. 2021, 204, 108752. [Google Scholar] [CrossRef]
  8. Cheng, Y. Analysis of electrochemical hydrogen permeation through X-65 pipeline steel and its implications on pipeline stress corrosion cracking. Int. J. Hydrogen Energy 2007, 32, 1269–1276. [Google Scholar] [CrossRef]
  9. Xie, J.; Yang, L.; Worthingham, B.; King, F. Hydrogen Effects on High Strength Pipeline Steels. In Proceedings of the Corros 2009, Atlanta, GA, USA, 22–26 March 2009. NACE-09120. [Google Scholar]
  10. Fassina, P.; Bolzoni, F.; Fumagalli, G.; Lazzari, L.; Vergani, L.; Sciuccati, A. Influence of hydrogen and low temperature on me-chanical behaviour of two pipeline steels. Eng. Fract. Mech. 2012, 81, 43–55. [Google Scholar] [CrossRef]
  11. Nykyforchyn, H.; Lunarska, E.; Tsyrulnyk, O.T.; Nikiforov, K.; Genarro, M.E.; Gabetta, G. Environmentally assisted “in-bulk” steel degradation of long term service gas trunkline. Eng. Fail. Anal. 2010, 17, 624–632. [Google Scholar] [CrossRef]
  12. Qi, Y.; Luo, H.; Zheng, S.; Chen, C.; Lv, Z.; Xiong, M. Comparison of tensile and impact behavior of carbon steel in H2S environments. Mater. Des. 2014, 58, 234–241. [Google Scholar] [CrossRef]
  13. ASTM E8; ASTM E8/E8M Standard Test Methods for Tension Testing of Metallic Materials 1. Annu B ASTM Stand 4 2010. ASTM International: West Conshohocken, PA, USA, 2020; pp. 1–27.
  14. ASTM E23-07ae1; Standard Test Methods for Notched Bar Impact Testing of Metallic Materials. ASTM International: West Conshohocken, PA, USA, 2007; pp. 1–28.
  15. Robertson, I.M. The effect of hydrogen on dislocation dynamics. Eng. Fract. Mech. 2001, 68, 671–692. [Google Scholar] [CrossRef]
  16. Turk, A.; Rivera-Díaz-del-Castillo, P.E. Hydrogen Resistant Ferritic and Martensitic Steels. Part I: The Origin of Embrittlement. Encycl. Mater. Met. Alloy. 2022, 4, 716–746. [Google Scholar]
  17. Martin, M.L.; Sofronis, P. Hydrogen-induced cracking and blistering in steels: A review. J. Nat. Gas Sci. Eng. 2022, 101, 104547. [Google Scholar] [CrossRef]
  18. Gonzalez, J.L.; Ramirez, R.; Hallen, J.M.; Guzman, R.A. Hydrogen-induced crack growth rate in steel plates exposed to sour environments. Corrosion 1997, 53, 935–943. [Google Scholar] [CrossRef]
  19. Alfitouri, A.O.; Savaş, M.A.; Evcil, A. Charpy Impact and Tension Tests of Two Pipeline Materials at Room and Cryogenic Temperatures. Int. J. Appl. Eng. Res. 2018, 13, 13321–13334. [Google Scholar]
  20. Godefroid, L.B.; Cândido, L.C.; Toffolo, R.V.B.; Barbosa, L.H.S. Microstructure and mechanical properties of two API steels for iron ore pipelines. Mater. Res. 2014, 17, 114–120. [Google Scholar] [CrossRef]
  21. Fang, H.; Young, D.; Nesic, S. Corrosion of Mild Steel In The Presence Of Elemental Sulfur. In Proceedings of the Corros 2008, New Orleans, LA, USA, 16–20 March 2008. NACE-08637. [Google Scholar]
  22. Bich, N.N.; Goerz, K. Caroline Pipeline Failure: Findings on Corrosion Mechanisms in Wet Sour Gas Systems Containing Significant Co. In CORROSION 96; NACE International: Houston, TX, USA, 1996. [Google Scholar]
  23. Maldonado-Zagal, S.B.; Boden, P.J. Hydrolysis of Elemental Sulphur in Water and its Effect on the Corrosion of Mild Steel. Br. Corros. J. 1982, 17, 116–120. [Google Scholar] [CrossRef]
  24. MacDonald, D.D.; Roberts, B.; Hyne, J.B. The corrosion of carbon steel by wet elemental sulphur. Corros. Sci. 1978, 18, 411–425. [Google Scholar] [CrossRef]
  25. Schmitt, G. Effect of elemental sulfur on corrosion in sour gas systems. Corrosion 1991, 47, 285–308. [Google Scholar] [CrossRef]
  26. Jackson, T.; Moses, J.; Stegmann, D. Sour Gas Plant Corrosion in the Presence of Elemental Sulfur. In Proceedings of the Corros 2018, Phoenix, AZ, USA, 15–19 April 2018. NACE-11266. [Google Scholar]
  27. Sliem, M.H.; Shahzad, K.; Sivaprasad, V.N.; Shakoor, R.A.; Abdullah, A.M.; Fayyaz, O.; Kahraman, R.; Umer, M.A. Enhanced mechanical and corrosion protection properties of pulse electrodeposited NiP-ZrO2 nanocomposite coatings. Surf. Coat. Technol. 2020, 403, 126340. [Google Scholar] [CrossRef]
  28. Sliem, M.H.; Radwan, A.B.; Mohamed, F.S.; Alnuaimi, N.A.; Abdullah, A.M. An efficient green ionic liquid for the corrosion inhibition of reinforcement steel in neutral and alkaline highly saline simulated concrete pore solutions. Sci. Rep. 2020, 10, 14565. [Google Scholar] [CrossRef] [PubMed]
  29. Sliem, M.H.; El Basiony, N.; Zaki, E.; Sharaf, M.A.; Abdullah, A.M. Corrosion Inhibition of Mild Steel in Sulfuric Acid by a Newly Synthesized Schiff Base: An Electrochemical, DFT, and Monte Carlo Simulation Study. Electroanalysis 2020, 32, 3145–3158. [Google Scholar] [CrossRef]
  30. Sliem, M.H.; Afifi, M.; Radwan, A.B.; Fayyad, E.M.; Shibl, M.F.; Heakal, F.E.-T.; Abdullah, A.M. AEO7 Surfactant as an Eco-Friendly Corrosion Inhibitor for Carbon Steel in HCl solution. Sci. Rep. 2019, 9, 2319. [Google Scholar] [CrossRef] [PubMed] [Green Version]
  31. Ogawa, Y.; Matsunaga, H.; Yamabe, J.; Yoshikawa, M.; Matsuoka, S. Unified evaluation of hydrogen-induced crack growth in fatigue tests and fracture toughness tests of a carbon steel. Int. J. Fatigue 2017, 103, 223–233. [Google Scholar] [CrossRef]
  32. Frankel, G.; Sridhar, N. Understanding localized corrosion. Mater. Today 2008, 11, 38–44. [Google Scholar] [CrossRef]
  33. Asmara, Y.P. The Roles of H2S Gas in Behavior of Carbon Steel Corrosion in Oil and Gas Environment: A Review. J. Tek. Mesin 2018, 7, 37. [Google Scholar] [CrossRef] [Green Version]
  34. Zhang, Z.; Zheng, Y.; Hou, D.; Zhang, H.; Li, Y.; Zhang, L. The influence of hydrogen sulfide on internal pres-sure strength of carbon steel production casing in the gas well. J. Pet. Sci. Eng. 2020, 191, 107113. [Google Scholar] [CrossRef]
  35. Morana, R.; Nice, P.I. Corrosion Assessment of High Strength Carbon Steel Grades P-110, Q-125, 140 and 150 for H2S Containing Producing Well Environments. In Proceedings of the Corrosion 2009, Atlanta, GA, USA, 22–26 March 2009. [Google Scholar]
  36. Okonkwo, P.C.; Sliem, M.H.; Shakoor, R.A.; Mohamed, A.M.A.; Abdullah, A.M. Effect of Temperature on the Corrosion Behavior of API X120 Pipeline Steel in H2S Environment. J. Mater. Eng. Perform. 2017, 26, 3775–3783. [Google Scholar] [CrossRef]
  37. Asmara, Y.P.; Ismail, M.C. Efficient design of response surface experiment for corrosion prediction in CO2 environments. Corros. Eng. Sci. Technol. 2012, 47, 10–18. [Google Scholar] [CrossRef]
  38. Asmara, Y.P.; Juliawati, A.; Sulaiman, A. Jamiluddin Mechanistic model of stress corrosion cracking (scc) of carbon steel in acidic solution with the presence of H2S. IOP Conf. Ser. Mater. Sci. Eng. 2013, 50, 012072. [Google Scholar] [CrossRef] [Green Version]
  39. Hua, Y.; Barker, R.; Neville, A. The influence of SO2 on the tolerable water content to avoid pipeline corrosion during the transportation of supercritical CO2. Int. J. Greenh. Gas Control 2015, 37, 412–423. [Google Scholar] [CrossRef]
  40. Nesic, S.; Vrhovac, M. A neural network model for CO2 corrosion of carbon steel. JCSE J. Corros. Sci. Eng. 1999, 1, 1–13. [Google Scholar]
  41. Nesic, S.; Nordsveen, M.; Maxwell, N.; Vrhovac, M. Probabilistic modelling of CO2 corrosion laboratory data using neural networks. Corros. Sci. 2001, 43, 1373–1392. [Google Scholar] [CrossRef]
  42. Lynch, S.P. Progress Towards Understanding Mechanisms of Hydrogen Embrittlement and Stress Corrosion Cracking. In Proceedings of the Corrosion 2007, Nashville, TN, USA, 11–15 March 2007. NACE-07493. [Google Scholar]
  43. Birnbaum, H.K. On the mechanisms of hydrogen related fracture in metals. In Environment Sensitive Fracture of Metals and Alloys; Wei, R.P., Duquette, D.J., Crooker, T.W., Sedriks, A.J., Eds.; Office of Naval Research: Arlington, VA, USA, 1987; pp. 105–113. [Google Scholar]
  44. Troiano, A.R. The role of hydrogen and other interstitials in the mechanical behavior of metals. Metallogr. Microstruct. Anal. 2016, 5, 557–569. [Google Scholar] [CrossRef]
  45. Lynch, S.P. Mechanisms of hydrogen assisted cracking—A review. In Hydrogen Effects on Material Behaviour and Corrosion Deformation Interactions; Metals & Materials Society: Warrendale, PA, USA, 2003; pp. 449–466. [Google Scholar]
Figure 1. Showing the actual location of the corroded sample analyzed in this research and the inner diameter (ID) of the failed spool.
Sustainability 14 08015 g001
Figure 2. Visual observation graphs highlighting all critical points.
Sustainability 14 08015 g002
Figure 3. Optical microscopy images at various mag, for both ID and bulk.
Sustainability 14 08015 g003
Figure 4. SEM micrographs samples with pitting inside yellow-mark area (A1, A2, B1, B2).
Sustainability 14 08015 g004
Figure 5. SEM analysis for samples with pitting outside the yellow-mark area (A3, B3, B4).
Sustainability 14 08015 g005
Figure 6. SEM analysis for samples without pitting (A5, A6, B5, B6).
Sustainability 14 08015 g006
Figure 7. (a) Image for one of the tested samples and (b) Hardness results of the samples.
Sustainability 14 08015 g007
Figure 8. Stress-strain graphs of all tensile samples.
Sustainability 14 08015 g008
Figure 9. SEM images for failed T2 (Left) and T4 (Right) tensile samples.
Sustainability 14 08015 g009
Figure 10. Charpy specimens after the test.
Sustainability 14 08015 g010
Figure 11. XPS spectrum for samples A1/A3 (a) full survey, (b) carbon, (c) oxygen, and (d) sulfur.
Sustainability 14 08015 g011
Figure 12. XPS spectrum for samples B1/B3 (a) full survey, (b) carbon, (c) oxygen, and (d) sulfur.
Sustainability 14 08015 g012
Figure 13. An equivalent circuit (EC) was used to fit the measured data.
Sustainability 14 08015 g013
Figure 14. Nyquist plots for the measured EIS data (dots) for non-corroded (black) and corroded (red) API-5L-X60 specimens immersed I 0.5 M Na2SO4. The solid lines are the fitted curves.
Sustainability 14 08015 g014
Table 1. Chemical composition of a sample as per specification.
ElementsCSiMnPSVNbTiFe
Mass %0.160.451.650.020.0030.080.050.04Bal.
Table 2. The mechanical properties of the sample as per specification.
Yield Strength (MPa)Tensile Strength (MPa)Ratio
MinMaxMinMaxMax
4155655207600.93
Table 3. Chemical composition of the service fluid.
Stream
V/LVaporLiquidWater
Composition
H2O0.070.0693.02
H2S1.943.230.12
CO23.642.660.08
N25.200.720.00
C181.2927.170.00
C24.655.420.00
C6+0.2441.900.00
Aromatics0.022.690.00
Sulfur compound0.030.590.00
MEG0.000.006.78
Total flow (kg/h)1,419,247253,73416,286
Mol. Wt.19.975.821.1
Density (kg/m3)78.1653.21058
Viscosity (cp)0.0140.3343.40
Table 4. The measured mechanical properties of the tested samples.
Sample NameNon-CorrodedCorrodedStandard Values for X60 Steel [15]
T1(10−4 mm/s)T2T3T4T5T6
Yield Stress (Mpa)304.7298.16303.4325.9326.04333.16415–565
UTS (Mpa)457.9456.35465.24507.77511.99497.3520–760
% elongation38%40%39%23.60%29.90%36%17.5% minimum/29.9 as per test certificate of new material
For other tensile samples (T2–T6) Strain rate used was 10−3 mm/s
Table 5. Absorbed energy (as per Charpy test) for the tested samples.
Sample NumberWith Notch/WO NotchAbsorbed Energy (Joules) at Room Temp.Avg. Absorbed Energy for New API-5L-X60 Material at Room Temp
I1Standard samples with Notch60210.271 Joules [19]
169 Joules [20]
260 [at 50 °C, as per material test certificate of new API 5L-X60 material]
I261
I360
I4Corroded samples with pitted areas at the center (No notch)102
I5102
Table 6. The atomic concentration of various elements in tested specimens.
Sample No.Element Atomic Concentration
SFeOCCuZn
A16.933.3910.5268.368.480.19
A216.945.9810.9849.3813.360.15
A318.485.3111.8253.0910.340.69
B111.463.6813.458.819.740.35
B25.13.3412.8872.214.670.4
B31.851.577.4588.720.290
B47.39211.7271.865.010.23
Table 7. EIS Parameters for the two different samples.
Rs, Ω cm−2CPE1 × 10−6
sn Ω−1 cm−2
n1Rct, Ω cm−2
Uncorroded40.214780.56898.11
Corroded27.229460.59864.63
Publisher’s Note: MDPI stays neutral with regard to jurisdictional claims in published maps and institutional affiliations.

