
Analysis of Micro Value Flows in the Value Chain of Eco-Innovation in Agricultural Products


Faculty of Economics and Management, Business Administration, Xidian University, Xi’an 610116, China
*
Author to whom correspondence should be addressed.
Sustainability 2022, 14(13), 7971; https://doi.org/10.3390/su14137971
Submission received: 26 April 2022
/
Revised: 13 June 2022
/
Accepted: 14 June 2022
/
Published: 30 June 2022
Abstract
:The purpose of this research is to develop a value chain management model for agricultural eco-innovation that can encompass different aspects to create value. It employs the Graphical Evaluation and Review Technique (GERT), which translates the remanufacturing operational process into a stochastic network. A GERT network covers two main points: its probability component and its parameter component. With the function of the GERT network, it can accomplish a certain state transition, which is presented to the extent of randomness in the process of occurrence. For this system, the number of resources in the GERT network may serve as a reference throughout its entire transition phase in order to show the complete transmission relationship between each node. The main contribution of this research is: Instead of analyzing the value flow mechanism of the eco-innovation value chain of agricultural products, we provide a theoretical basis for the application of multi-objective planning in the value flow of agricultural green innovation, which is conducive to the long-term development of the value chain of agricultural eco-innovation.
1. Introduction
As a result of the simplification of modelling techniques, networks and network analysis play an important role in the description and evolution of complex systems. Thus, complicated systems can be investigated less inductively and may stimulate network analysis. Moreover, this provides a comprehensive breakthrough for simplifying the development of analytical procedures for larger networks. Graphical Evaluation and Review Techniques (GERT) allows analyzing networks consisting of different branches for their stochastic nature. Based on the GERT technique, all paths are explained in terms of their probability of being traversed and the cost of traversing them.
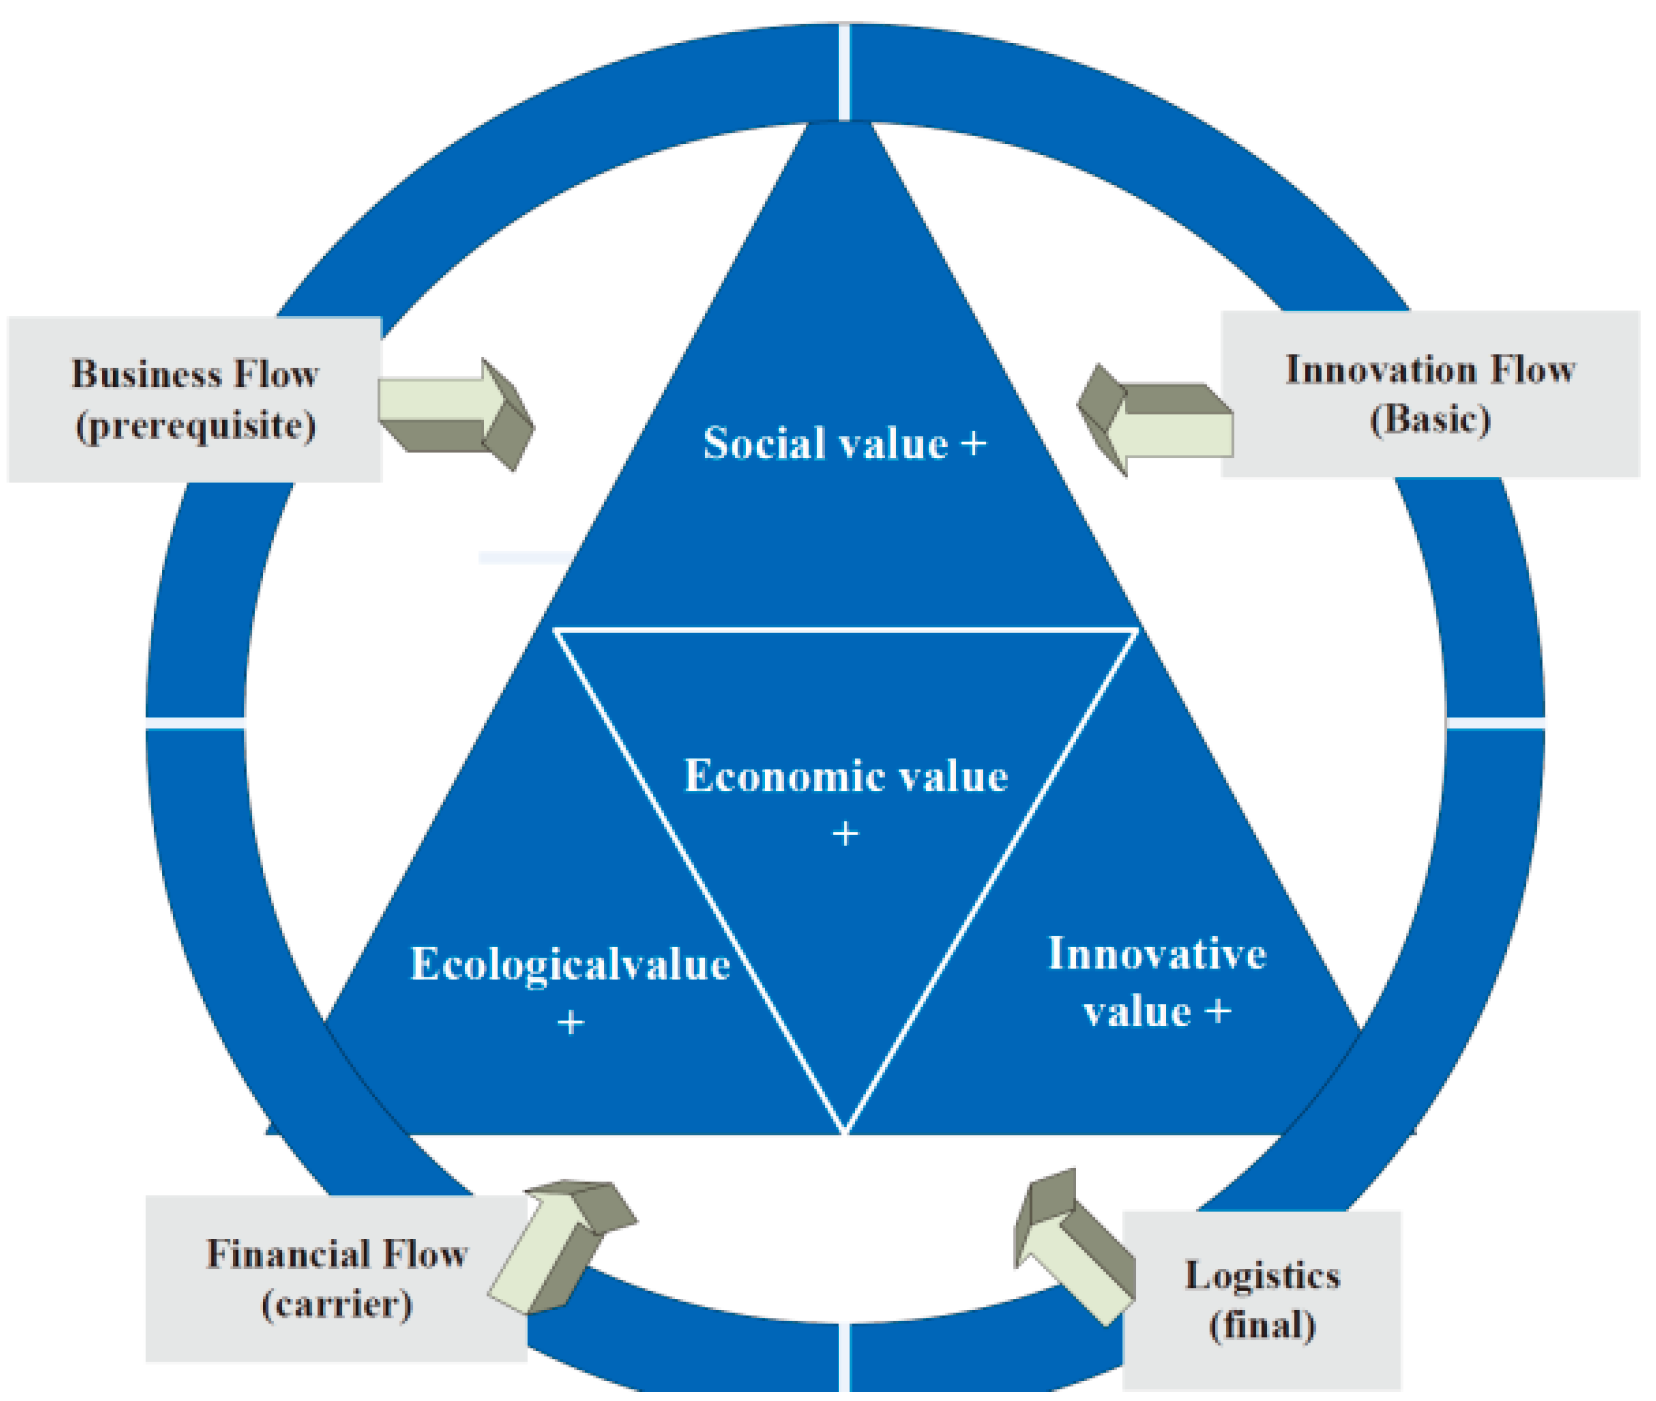
The value flow of the agricultural eco-innovation value chain is the result of the synergy of the “Four Streams”, innovation being the core, the innovation stream is an important part of its value flow activities, and the operation of commercial flow, capital flow and logistics is based on the transmission of the innovation stream. The distribution of value, the transformation of use value and value, is achieved through the flow of capital, which also forms part of the value stream. The innovation stream is certainly important in the operation of the value stream, but it is also inseparable from the collaboration of the other three links.
Therefore, the value flow of the eco-innovation value chain of agricultural products is embedded in the commercial flow, innovation flow, capital flow and logistics, and the “four flows” carry the corresponding functions in the process of value flow, and guide the value of the eco-innovation value chain of agricultural products to the path of positive utility increase in economic, social, ecological and innovation dimensions, so as to realize the value Orderly flow and rational distribution (see Figure 1).
This paper addresses the problem that incomprehensive innovation subject strategies such as inappropriate goal setting and eagerness for quick success create realistic barriers to value creation activities in the green innovation value chain of agricultural products by establishing a value flow GERT network to analyse the green innovation inputs of agricultural products due to goal setting. This more cumbersome need is facilitated by adopting a multi-objective planning theory based green innovation input value chain management decision, with in-line planning as a prerequisite, to be successfully satisfied. This paper addresses the question of how green innovation can be value created to achieve better results.
2. Related Work
2.1. The Meaning and Application of GERT
Graphical Evaluation and Review Technique is a new generalised stochastic network technique that combines theories and techniques from network theory, probability theory, simulation techniques and signal flow diagrams, and it can be analysed and studied using the tool of directed probability diagrams when it comes to problems with complex and variable project control and project planning.
By applying the GERT network description of WBS items of a product development project and used in the product development process, Yi-song [1] (2009) analyzed the logical relationship of WBS items. (todo bibtexYi-song, Z., Dong, L., & Feng, Z. (2009, October). Study on a GERT based method for hi-tech product development project planning. In Industrial Engineering and Engineering Management, 2009. IE&EM’09. 16th International Conference on (pp. 1022–1026). IEEE.)
In order to reduce over-costs and delays in weapon system development, Xu and Jia (2010) [2] proposed using the failure probability and multi-branch feedback of a weapon system into a GERT network. In addition, they developed a multibranch model based on GERT.
As part of their uncertainty management of remanufacturing, Li et al. (2011) [3] presented an analytical technique based on GERT. First, they proposed four stochastic Remanufacturing Process Routing (RPR) models based on GERT and analyzed a remanufacturing system composed of different process flows, where the probability of and the time associated with each process were measured.
Wang et al. (2011) [4] proposed a vague GERT for assessing wafer manufacturing yields and finishing times. In order to enhance more information for managers, they proposed a simple decision support system to handle complex calculation procedures. Also, the lithographic area was incorporated in order to enhance overall system performance.
Li et al. (2014) [5] investigated the characteristics of the cost distribution in multi-stage supply chains. On the basis of GERT, they proposed a stochastic network mathematical model for cost distribution analysis in multi-stage supply chain networks. The authors also proposed a concept of cost sensitivity and provided algorithms based on the proposed stochastic network model for analyzing the impacts of cost components, such as procurement, inventory, supply shortage, production and transportation costs, on the total supply chain operation cost. They developed algorithms for analyzing the cost performance of the supply chain robustness under various scenarios of order compensation ability.
Tao et al. (2017) [6] developed a GERT model using a characteristic function. Firstly, they implemented an inversion formula to extract data from the probability distribution of the completion time for product development. As a follow-up, they explored the utilization of late dates by introducing a metric of schedule risk to identify both loss and probability. Last but not least, they conducted an elasticity analysis to determine the network parameters that reduce schedule risk. Moreover, a case study was presented regarding the implementation of their methods in a high-tech company.
GERT network theory has been widely used in many research areas such as project management, value and knowledge flows, value of time and costs, regional road traffic and path selection, and has achieved good results.
2.2. Research on Green Innovation and Innovation Ecosystems
The term GreenInnovation (GI) first appeared in the 1970s in the context of sustainable development. As environmental issues have become more international, many scholars have studied green innovation in depth. Porter (1995) [7] argues that companies innovate by improving production levels, reducing resources and cutting costs, while Kemp (1998) [8] favours innovation in the form of technological and process changes that reduce environmental and resource losses. OduroS et al. (2021) [9] examined the status and evolution of green innovation research from 1948 to 2018. Bing-Yan Dong (2005) [10] argues that green innovation is in fact a new interpretation of technological innovation in the context of environmental protection and rational use of resources, and can also be considered as a new connotation of technological innovation in this context. Li Xu (2015) [11] suggests that based on the framework of motivation, process and outcome, green innovation can be divided into resource-saving, environment-friendly and hybrid green innovation. Therefore, on the basis of promoting inclusive innovation, the government should encourage enterprises to strengthen green innovation and promote the harmonious development of economy and ecology.
In the practical application of green innovation to specific industries, academics often focus on innovation ecosystems, which are a key component of green innovation. Innovation ecosystems were first introduced by Moore [12], who defined them in terms of “economic associations based on organisational interactions” that ultimately lead to economic benefits. Mercan et al. (2011) [13] argue for a symbiosis of participants within the ecosystem, with each link interdependent on the other, and Klotz et al. (2016) [14] suggest that innovation ecosystems are a collection of multilateral collaborations, with the Internet of Things and communication being the most important influencing factors. In terms of system composition, innovation agents and natural, social and economic elements form a close interactive network. adner (2016) [15] argues that innovation agents in the system are composed of core enterprises, suppliers, customers, etc., which form a complex connected network. this network provides a basis for cooperation among the various members of the system, and also prepares the prerequisites for flexible system design and relationship selection among innovation agents. GomesLAD (2021) [16] explores how firms cope with the propagation of uncertainty in the wider innovation environment through an inductive case study of innovation ecosystems, describing the phenomenon of innovation uncertainty propagation and the mechanisms by which entrepreneurs manage it. BreslinD et al. (2021) [17] view innovation ecosystems as complex adaptive systems in which patterns of change arise from micro-level co-evolutionary interactions among participants. Key theoretical and practical implications for understanding ecosystem participants, rules of interaction and the wider innovation ecosystem are explored. It is concluded that innovation sustains and drives change in innovation ecosystems by changing micro-level interaction rules and co-evolutionary relationships between participants.
At present, research on green innovation is still focused on the connotations of environmental innovation, green innovation, eco-innovation and sustainable innovation in academic research. Most of the previous stage of development was characterised by resource-consuming development with high consumption and waste, and most of the research focused on the concept and connotation of green innovation, or was conducted from the perspective of ecological and environmental economics. In the specific practice of innovation ecosystems, multidisciplinary studies have addressed the environmental aspects of innovation ecosystems due to the public nature of environmental issues. Existing studies have paid sufficient attention to the impact of green innovation on firms. However, not much research has been extended to include the value chain aspects of innovation. Nor is green innovation currently sufficiently mobilising the benefits of value chain operations. As a new economic form, it has to be integrated into the market system so that it becomes a spontaneous behaviour.
3. Related Conceptual and Methodological Foundations
3.1. Green Innovation
Green innovation has a very broad meaning, in the sense that it can be classified as green innovation if it has the novelty and value of innovation and can lead to resource savings and environmental improvements. Green innovation is also often referred to as ‘eco-innovation’, ‘environmental innovation’, ‘environmentally driven innovation’ and ‘sustainable innovation’. “etc. For example, Bernauer et al. (2006) [18] equate green innovation with environmental innovation and eco-innovation. The reason for the diversity of green innovation designations is that there is currently no academic definition of green innovation that is understood and widely accepted by the general public [19]. The literature suggests that research on green innovation will continue to grow and take its place in the field of economic management. However, research on green innovation in general has not yet reached a mature state. For innovation in general, green innovation must comply with environmental policy regulations, implement resource conservation requirements and uphold a good philosophy of continuous innovation with the long-term development of society and the economy as the ultimate goal.
3.2. Green Innovation Value Chain for Agricultural Products
Green innovation value chains for agricultural products are based on the theory of green innovation, value chains and innovation ecosystems. The green innovation value chain for agricultural products focuses on promoting the sustainable development of the agricultural products industry and achieving the maximum return for all subjects in the value chain. It relies on the scientific use of the environment and resources of the green innovation system to ensure that resources are maximally developed and ecologically recycled within the system, and that the maximum production potential of materials is maximised [20], thereby reducing the emergence of industrial waste. The fundamental aim is to maximise the market demand of agricultural consumers and to promote the green development of the agricultural industry. By absorbing the experience of the ecological cycle model and focusing on the cooperation and symbiosis of each value subject in the industrial value chain, the scientific allocation and rational operation of resources are achieved with the best combination of value chain operation activities, the innovative development of the value chain system is realised, the prosperous symbiosis of the industry with resources and the environment is achieved with the low carbon ecological cycle of resources and the lowest emission of waste, and finally the maximum value of agricultural products and derived products and services is realised, guaranteeing A dynamic cycle system with scientific value distribution and coordinated development with resources and the environment.
3.3. GERT Diagrammatic Review Method
GERT is a modern class of network technology that is not only closely related to network theory, but also to simulation techniques and probability theory, allowing for the use of directed probability diagrams as the primary means of carrying out investigations when faced with complex project plans. In 1962, a generalised network technique using ‘decision boxes’ emerged in people’s lives and work, in which each branch has its own conceptual variability, and these boxes use this variability as a reference point to clarify the subsequent course of action, essentially embodying the characteristics of a probabilistic branching network In 1964, S.E. Elmaghrab [21] developed a new way of thinking about this model, which led to the integration of algebraic and logical ideas. 1966 saw the emergence of the GERT network technique, which was optimised in part by A.A. BPritsker [22] and others to ensure its greater applicability, and which eventually contributed to the Apollo moon landing. The Apollo moon landing was the result of a number of measures developed by A. BPritsker and others to optimise this network technology and to ensure its greater applicability. At this stage, GERT network theory has been used as a major component of research in many areas, including project management, and the results have been satisfactory, demonstrating its theoretical characteristics.
4. Method of Value Flow GERT Network Model Construction
In the agricultural eco-innovation value chain, value flows make different innovation agents form a more complex GERT network value flow. The nodes of the value flow GERT network are composed of the innovation agents in the agricultural green innovation value chain, the edges of the value flow GERT network (directed edges, including self-loops and loops) are composed of the value flow relationships between the innovation agents, and the external key factors such as innovation demand, innovation technology and innovation environment act on the directed edges, and the internal key factors such as the innovation agents’ own demand, the game cooperation between innovation agents and the innovation potential of innovation agents act on the nodes. The value flow in the GERT network consists of value carriers such as innovation, capital and material, and the transfer of innovation value between innovation agents forms the innovation kinetic energy.
4.1. Value Flows GERT Network Model Key Influencing Factors
Zhang points out that the energy state according to eco-innovation integrates the three constituent elements of eco-innovation: quality, structure and quantity. Therefore, in the value chain of green innovation in agricultural products, there must be some differences in innovation quantity, innovation structure, innovation category, innovation quality and innovation complexity between innovation agents, and this difference is defined as innovation potential. Due to the existence of innovation potential energy, the normal flow of information between innovation agents is ensured. The fundamental reason for the flow of value is the difference in innovation potential between the various innovation agents, i.e., the one with the highest innovation concentration is the innovation supplier and the one with the lowest innovation concentration is the innovation demander, and the innovation potential is the difference in innovation concentration between them. In the process of innovation transmission, through the form of competition and game, the sharing of resources is realised and the value in the innovation resources is maximised. After the input of various elements, various knowledge and other innovations are generated and output, and the value creation and value addition is realised through the transmission of innovation.
Based on Song research findings, it can be seen that the degree of innovation sharing and innovation reception within the agricultural green innovation value chain will limit the trend of innovation diffusion and innovation potential difference, which in turn affects the amount of innovation flow. At the same time, key factors external to the agricultural green innovation value chain also influence the innovation flow among innovation agents and affect the fluidity of innovation flow.
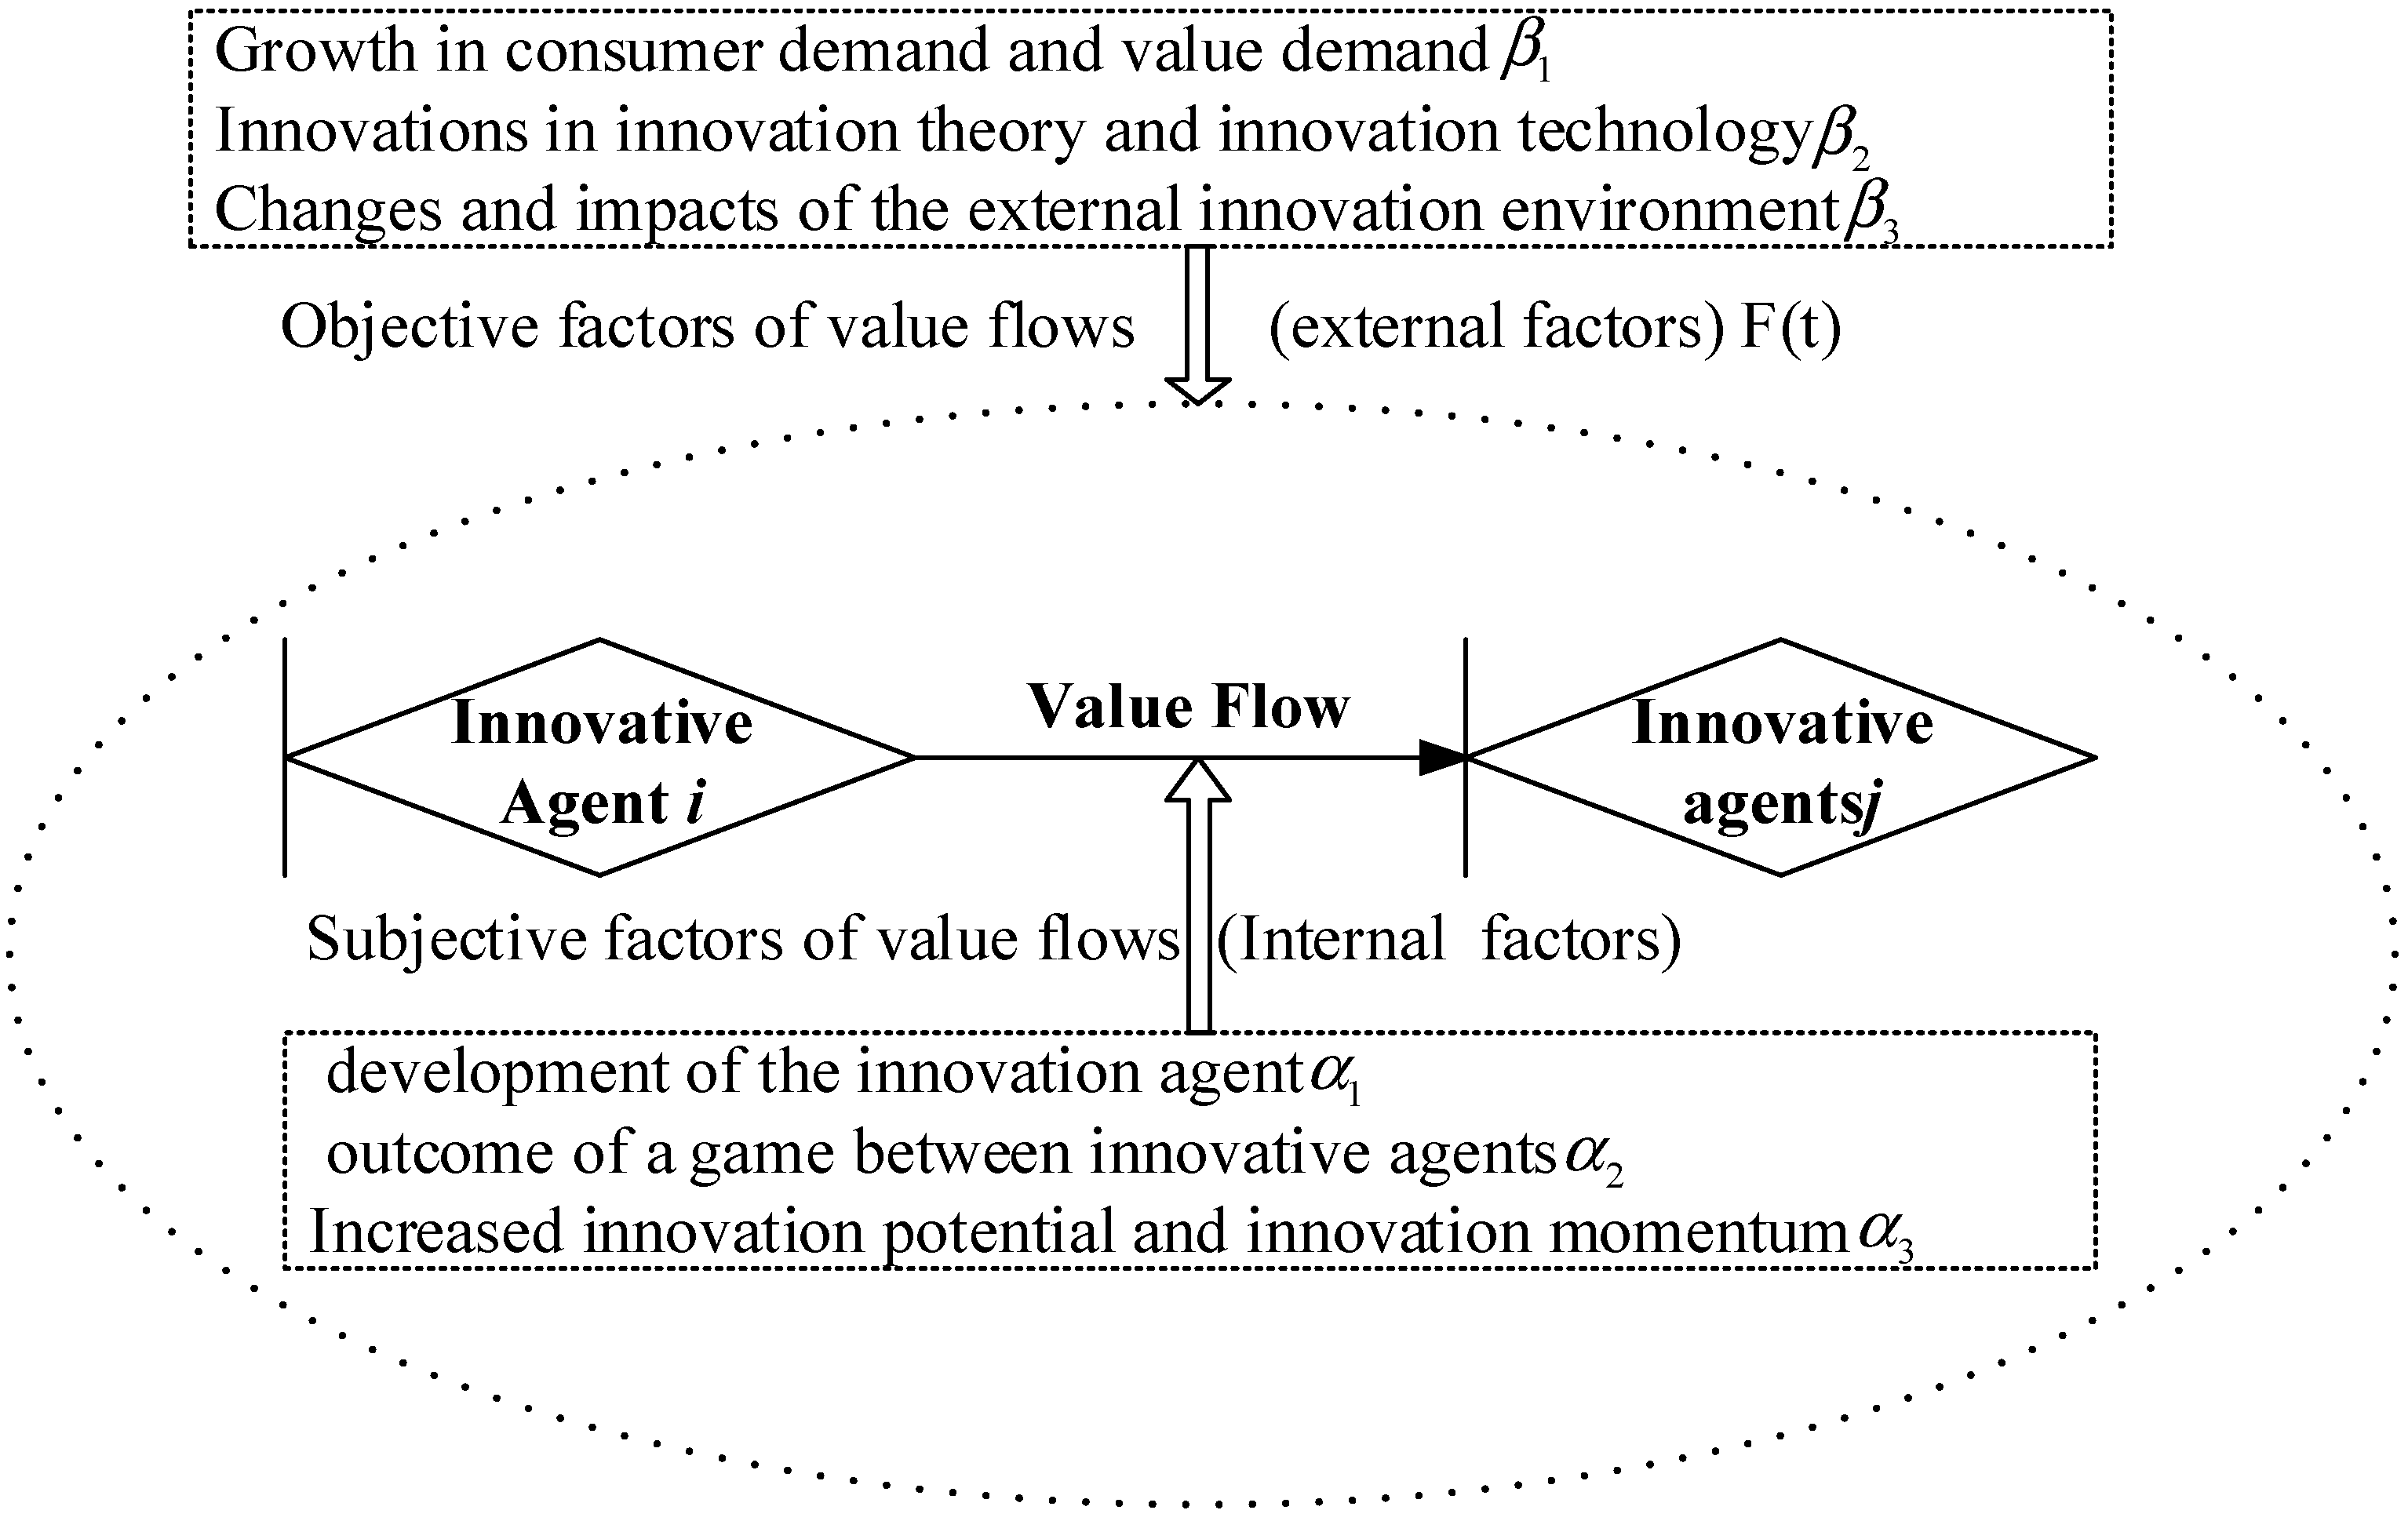
Through an in-depth analysis of the GERT network of the value flow of the green innovation value chain of agricultural products, it can be found that the subjective factors (internal factors) of the value flow of the green innovation value chain of agricultural products include: the needs of the innovation subjects’ own development, the results of the game between innovation subjects and the innovation potential (innovation concentration difference between innovation subjects) and innovation kinetic energy (innovation transmission power between innovation subjects) The increase of innovation potential (innovation concentration difference between innovation agents) and innovation kinetic energy (innovation transmission power between innovation agents), etc.
Not only do subjective factors (internal factors) influence the value flow of the agricultural eco-innovation value chain, but objective factors (external factors) also have a corresponding influence, so that the value flow of the agricultural green innovation value chain will develop in a more efficient and value-added direction.
The combined effect of key influences on value flows (see Figure 2).
It can be seen that in the GERT network of value flows in the agricultural green innovation value chain, the combined effect of internal key influencing factors on value flows is the product of individual subjective factors ; the combined effect of external key influencing factors on value flows shows a linear relationship .
4.2. Value Transfer Function Construction for the GERT Network Model of Value Flows
(1) The basic building blocks of the GERT network model of value flows
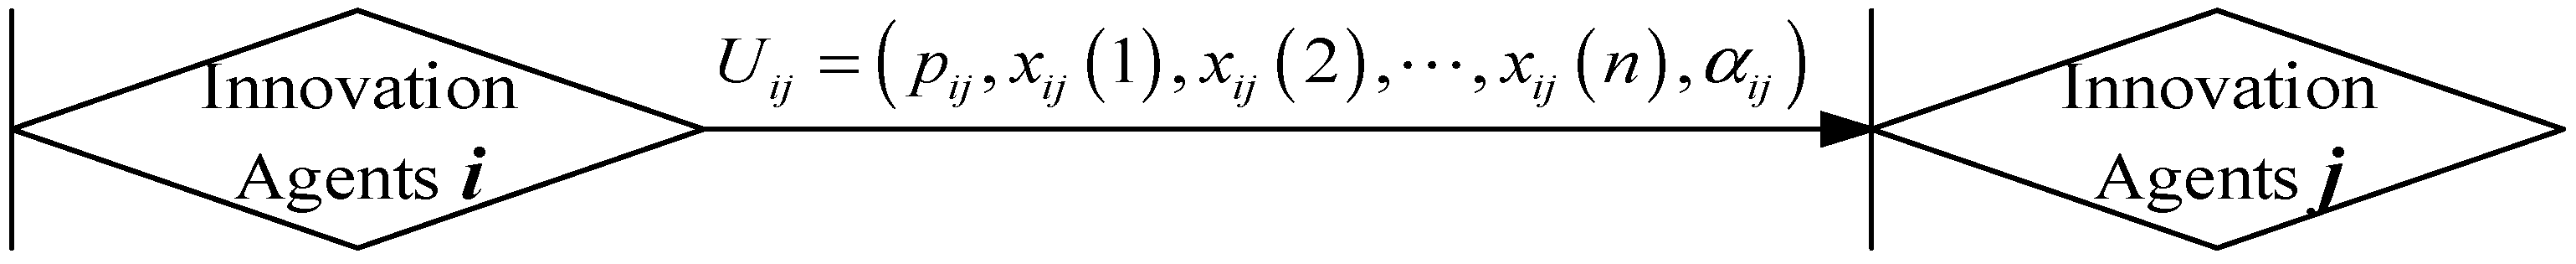
In the GERT network model, when the value flow is transmitted between any two nodes, and the value flow also includes a number of independent and different value parameters such as logistics, capital flow and innovation flow, are used to represent these value flows respectively, where: ; , at this time, the GERT network model is known as the value flow GERT network model. The basic constituent units of the GERT network model of the value flow of the agricultural green innovation value chain are shown in Figure 3.
In Figure 3, the probability that a value flow activity (value flow) can be achieved from the innovator to the innovator is represented by; the value flow from the innovator to the innovator is represented by. denotes the value parameters in the flow of value from the innovation agent to the innovation agent when the activity of transmitting value flows (value flows) takes place.
Two key values play an important role in the analysis of the model: one is the equivalence transfer probability, i.e., the probability of achieving the value flow between the innovation agents; the other is the equivalence moment mother function, i.e., the amount of value flow between the innovation agents. The construction of the value transfer function of the GERT network model of the value flow of the agricultural green innovation value chain is the core of the data quantification to represent the value flow relationship between the innovation agents.
(2) Value flow allocation rate
Assume that the matrix of value flows between the various innovation agents in the GERT network model of value flows in the agricultural green innovation value chain as follow:
The ratio of the amount of value flows between individual innovation agents to the total value flows of that innovation agent is then called the value flow allocation ratio.
Therefore, the matrix of value flow allocation rates between the various innovation agents as follow:
(3) Value flow value transfer relationship function
Assuming that is a different and independent value parameter in the value flow process from the innovation subject to the innovation subject in the agricultural green innovation value chain, the linear combination of each value parameter is: , where: is the constant coefficient and is the integration coefficient (i.e., the objective motive factor/external motive factor of value flow on the value flow process). At this point, the momentum function of each value parameter exists, and the probability that the value flow activity between innovation subjects can be realised is . The product of the momentum function of each value parameter and is called the value transfer function of the value flow activity between innovation subject and innovation subject .
Value flow equivalence transfer function
In the GERT network model of value flows in the agricultural green innovation value chain, assuming that (where, ) is the equivalent transfer function of the value flow path from innovation subject to innovation subject , and is the equivalent transfer coefficient of the ring in the order ring, then the equivalent transfer function from innovation subject to innovation subject as follow:
4.3. Determination of Equivalent Transfer Probabilities of Value Flows and the Establishment of Equivalent Moment Mother Functions
4.3.1. Equivalent Transmission Probability of Value Flows
In the GERT network model of value flows in agricultural green innovation value chains, the probability of achieving a value flow from innovation agent to innovation agent is expressed in terms of the probability of equivalent value flow transmission. Assuming that in the GERT network model of value flows in the agricultural green innovation value chain, (where: b ; ; ; ) is an equivalent transfer function from innovation subject to innovation subject , then the probability of equivalent value transfer from innovation subject to innovation subject is equal to the value in h that sets all to zero.
4.3.2. Value Flow Equivalence Moment Function
In the GERT network model of agricultural green innovation value chains, the magnitude of the value flow between the new subject and the innovative subject is represented by the equivalence moment function.
Assuming that all f in the value flow equivalence transfer function from innovation subject to innovation subject in the GERT network model of the agricultural green innovation value chain are set to zero, then according to the Mason formula, the value flow equivalence moment function from innovation subject to innovation subject is the ratio of its equivalence transfer function to its equivalence transfer probability.
4.3.3. Solution to Main Factors
- Parameter Solution Procedure
The solution of the main parameters of the GERT network model for the value flow of the agricultural green innovation value chain involves two main issues: firstly, the equivalence transfer probability, i.e., the probability of realising the value flow between the various innovation agents; secondly, the equivalence moment function, i.e., the number of value flows between the various innovation agents.
The process of solving for the main parameters in the GERT network model of value flows in the green innovation value chain for agricultural products, in the following steps.
- Based on the practical problems and basic characteristics related to the agricultural green innovation value chain, the GERT network model of the value flow of the agricultural green innovation value chain is constructed by structurally describing it, analysing the relationship between each innovation subject in it and the composition of each parameter of the value flow.
- Use the W function to combine the basic value parameters of each value flow activity in the value flow GERT network of the agricultural green innovation value chain obtained, and construct the value flow transfer relationship function of the value flow GERT network model of the agricultural green innovation value chain.
- Determine the value flow equivalence transfer function and equivalence transfer probability of the value flow GERT network model of the agricultural green innovation value chain, which can use the topological equation formula of the signal flow diagram (Mason diagram).
- According to the definition of the W function, the equivalence moment matrix of the GERT network model of the value flow of the agricultural green innovation value chain is determined.
- Using the equivalent moment matrix, derive the basic value parameters of each value flow activity in the GERT network model of the value flow of the agricultural green innovation value chain, and calculate the analytical solutions of the basic value parameters of each value flow activity.
- 2.
- Value added value flows and their variance solving
In the GERT network model of the value flow of the agricultural green innovation value chain, the value transfer relationship function from innovation subject to innovation subject is: , then the first order matrix of the covariates from innovation subject to innovation subject is equal to the value of to which all is set to 0 after taking partial derivatives of corresponding to covariate i.e., the value increment realized from innovation subject to innovation subject is The incremental value as follow:
Similarly, the second order matrix of the covariates from the innovation subject to the innovation subject can be obtained from , the equation as follow:
- 3.
- Value flow value added factor
The value-added coefficients for the GERT network model of value flows in the agricultural green innovation value chain are as follow:
In this paper, the total value of the GERT network model of value flows in the agricultural green innovation value chain is set to 1, so that the amount of value transfer of value flows is quantitatively equal to the equivalent transfer efficiency of value flows.
5. Experient of Green Innovation Input Optimization Program for Agricultural Product Value Chain
5.1. GERT Network Synergistic Organization Mechanism for Green Innovation Value Chain Value Flows
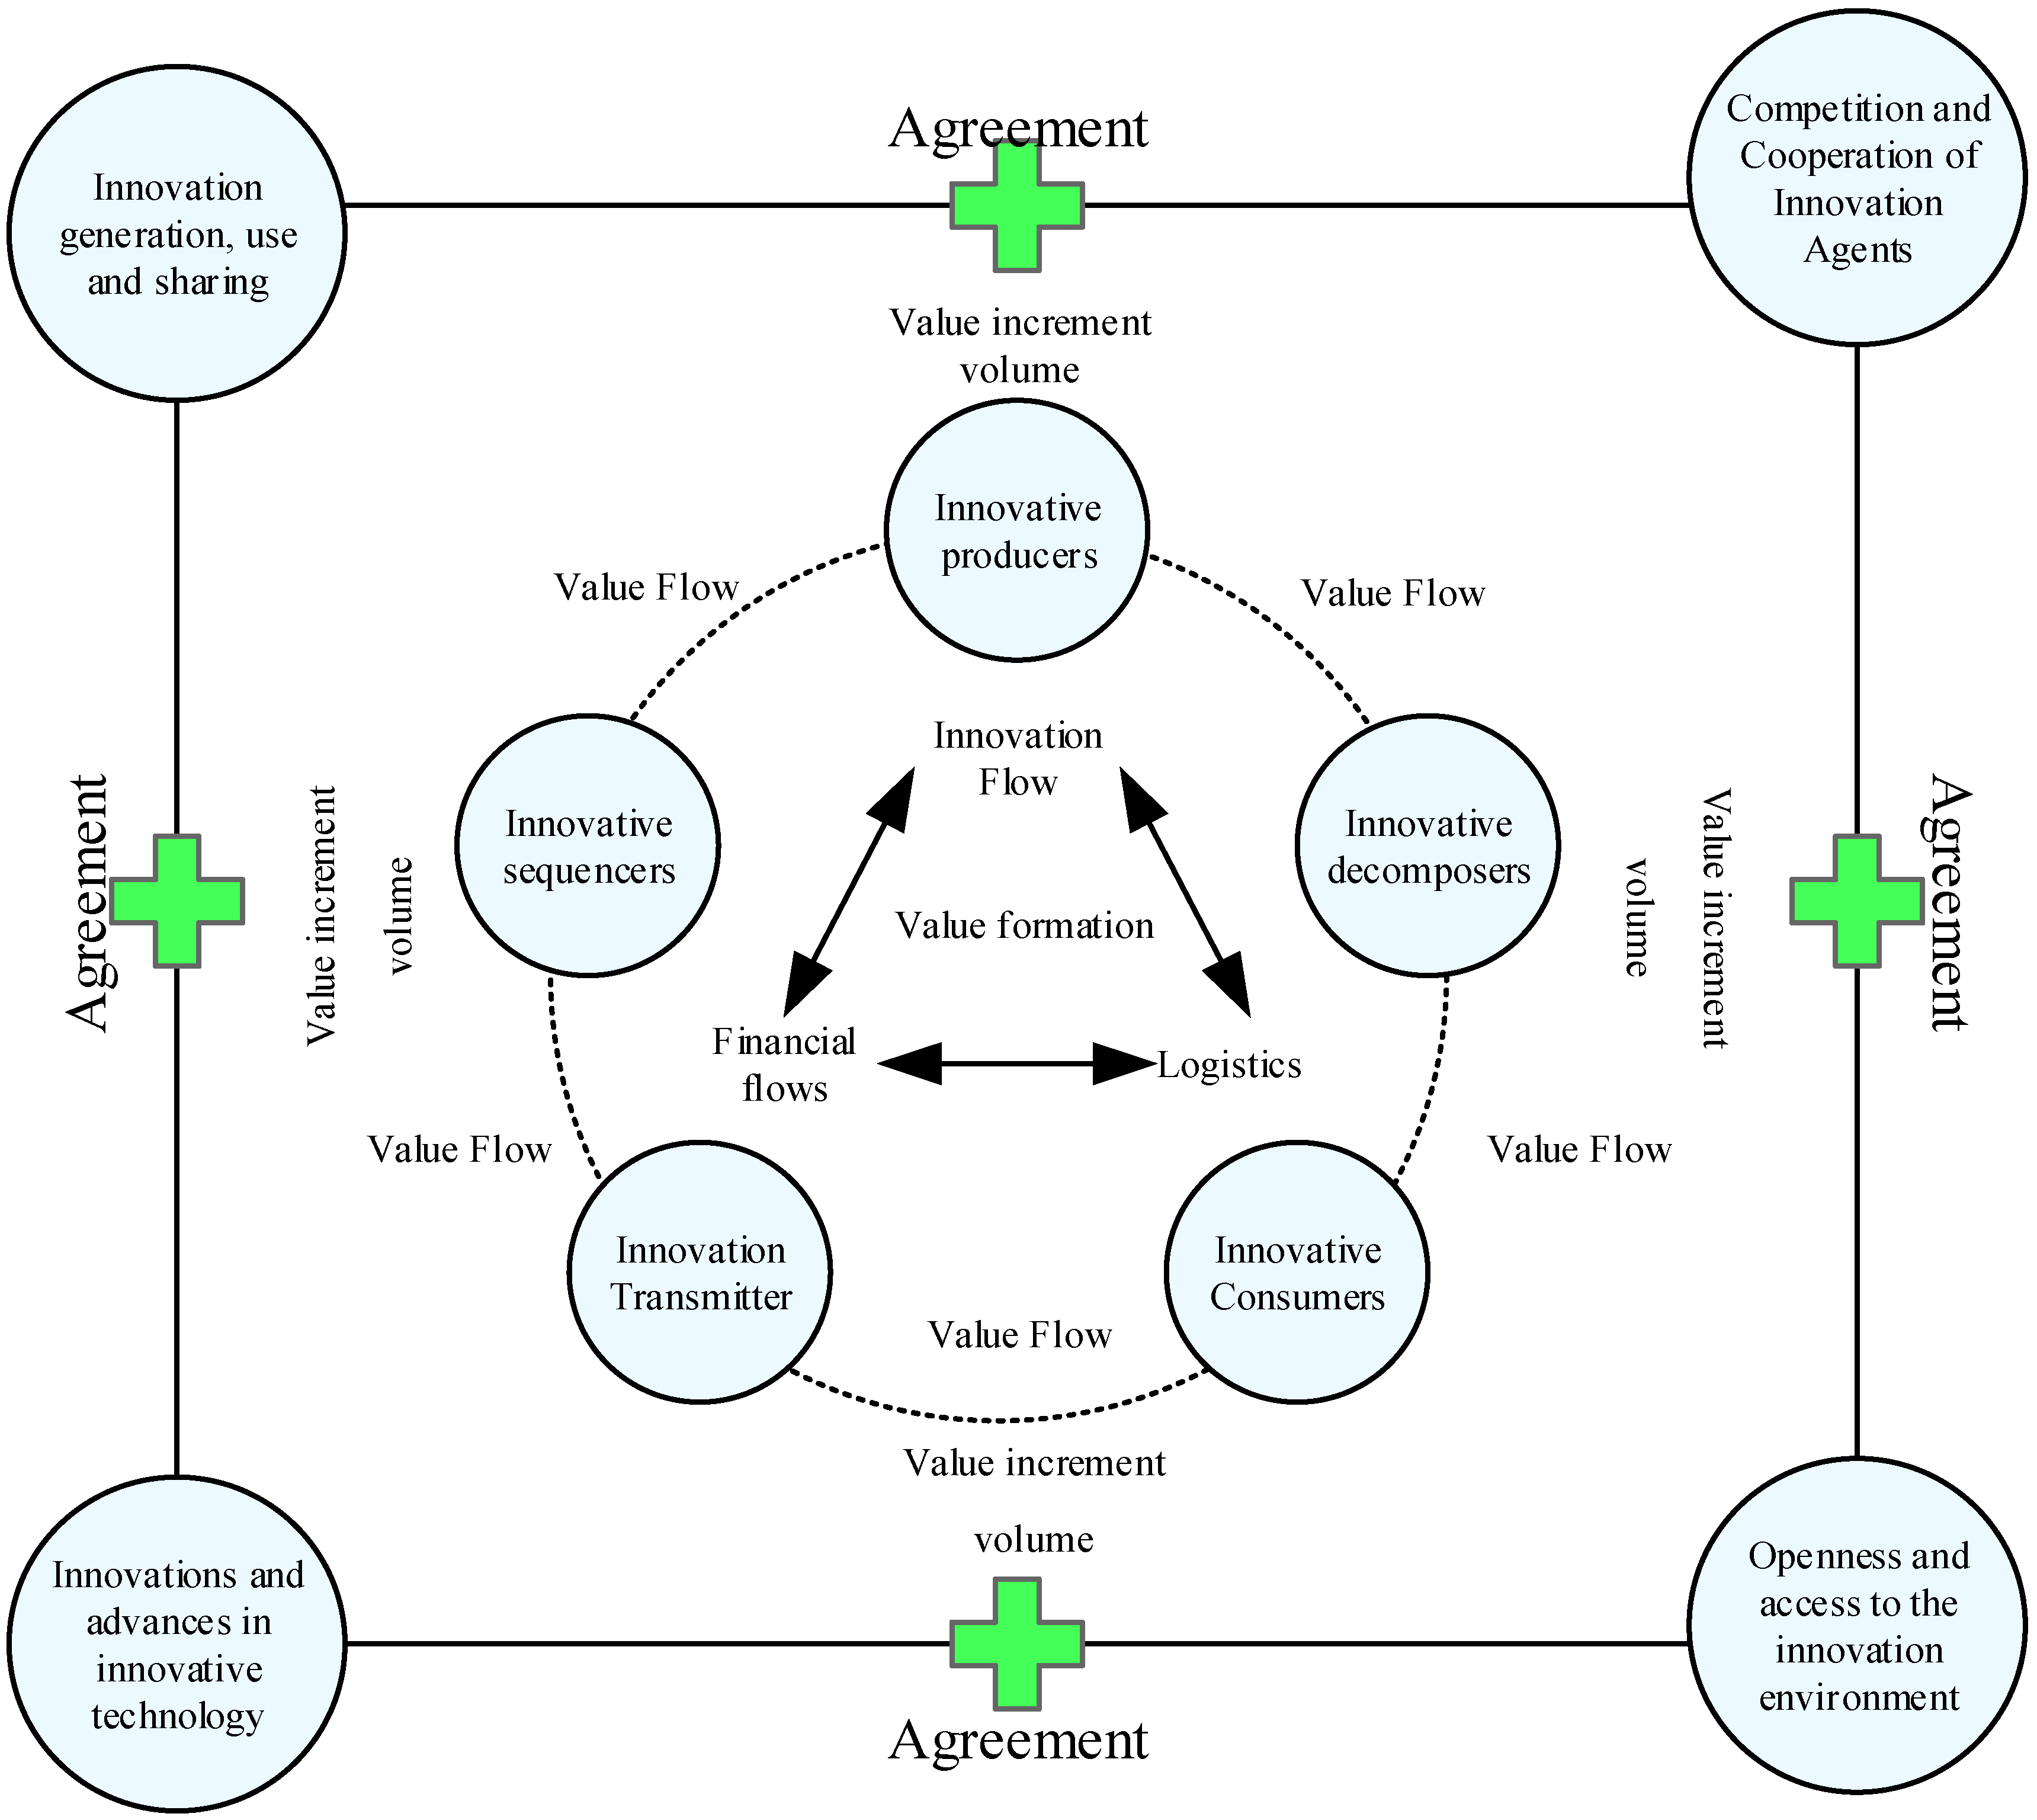
In the GERT network of value flow of agricultural green innovation value chain, three objectives need to be achieved, firstly, how each innovation subject can form value flow among each other driven by external key factors; then, how each innovation subject can form value creation among each other driven by internal key factors; finally, to achieve the value win-win situation of each node in the agricultural green innovation value chain and Finally, the ultimate goal of maximising the value of each node in the agricultural green innovation value chain is achieved. In order to achieve these three goals, with reference to the viewpoint of synergy theory, it can be seen that a capability of integrating each innovation subject with various value transfer parameters and internal and external key factors in the GERT network of agricultural green innovation value chain needs to be formed, and this capability is the synergistic organisation mechanism of the GERT network of agricultural green innovation value chain value flow, as shown in Figure 4.
5.2. Multi-Objective Planning Model Construction for Value Management of Green Innovation Value Chain of Agricultural Products
In the process of forming green innovation value chain of agricultural products, there are many value management objectives expected to be achieved depending on the purpose, according to the content of the previous chapter. It is considered that economic value, ecological value, innovation value and social value are the top priorities. The above four objectives stand in several positions to judge whether the future development prospect of green innovation value chain of agricultural products is broad or not. In order to avoid that each objective cannot be successfully realized, the importance of resource allocation should be increased and this work should be really put into practice. In the stage of value flow of value chain, the importance of different objectives is also different, and each objective has different degrees of connection. The main reason for setting up multi-objective value chain is to achieve more ideal comprehensive benefits of value management. The multi-objective planning is based on the prerequisite of linear planning, so that this more complicated need can be satisfied smoothly.
The mathematical model of multi-objective decision making shows certain peculiarities, and its objective function is not a single one, but a reflection of the main development indicators, thus measuring whether there are deficiencies in value creation and further improving innovation resources, and the components of its decision variables are more specific and related to many constraints. The general mathematical model of the multi-objective optimization decision problem is as follows.
In this paper, four indicators of economic value, ecological value, innovation value and social value are selected as the decision objectives for value creation of the whole green innovative value chain of agricultural products, thus, the multi-objective decision model for the optimization of green innovative inputs of agricultural products can be obtained by combining the above model as follows.
where Z is the decision variable; the decision function of four indicators: economic value, ecological value, innovation value and social value, respectively.
5.3. Agricultural Value Chain Green Innovation Input Optimization Implementation Plan
When multiple goals are set for value creation of green agricultural products, it is more important to maximize the use of limited and scarce resources to achieve each goal and obtain the highest comprehensive value, thus making the long-term development of the value chain of agricultural innovation and the rational allocation of resources more important. Although scholars have recognized that multi-objective planning plays an extremely crucial role to better optimize agricultural green innovation resources, it is still a challenge in this field to make the link between objective planning and value creation, and it is also very difficult to make planning theory provide effective help for agricultural green innovation practice, so this part will explore and elaborate the specific implementation plan of agricultural green innovation under multi-objective planning. Therefore, this section will explore and explain the specific implementation of investment optimization for agricultural green innovation under multi-objective planning.
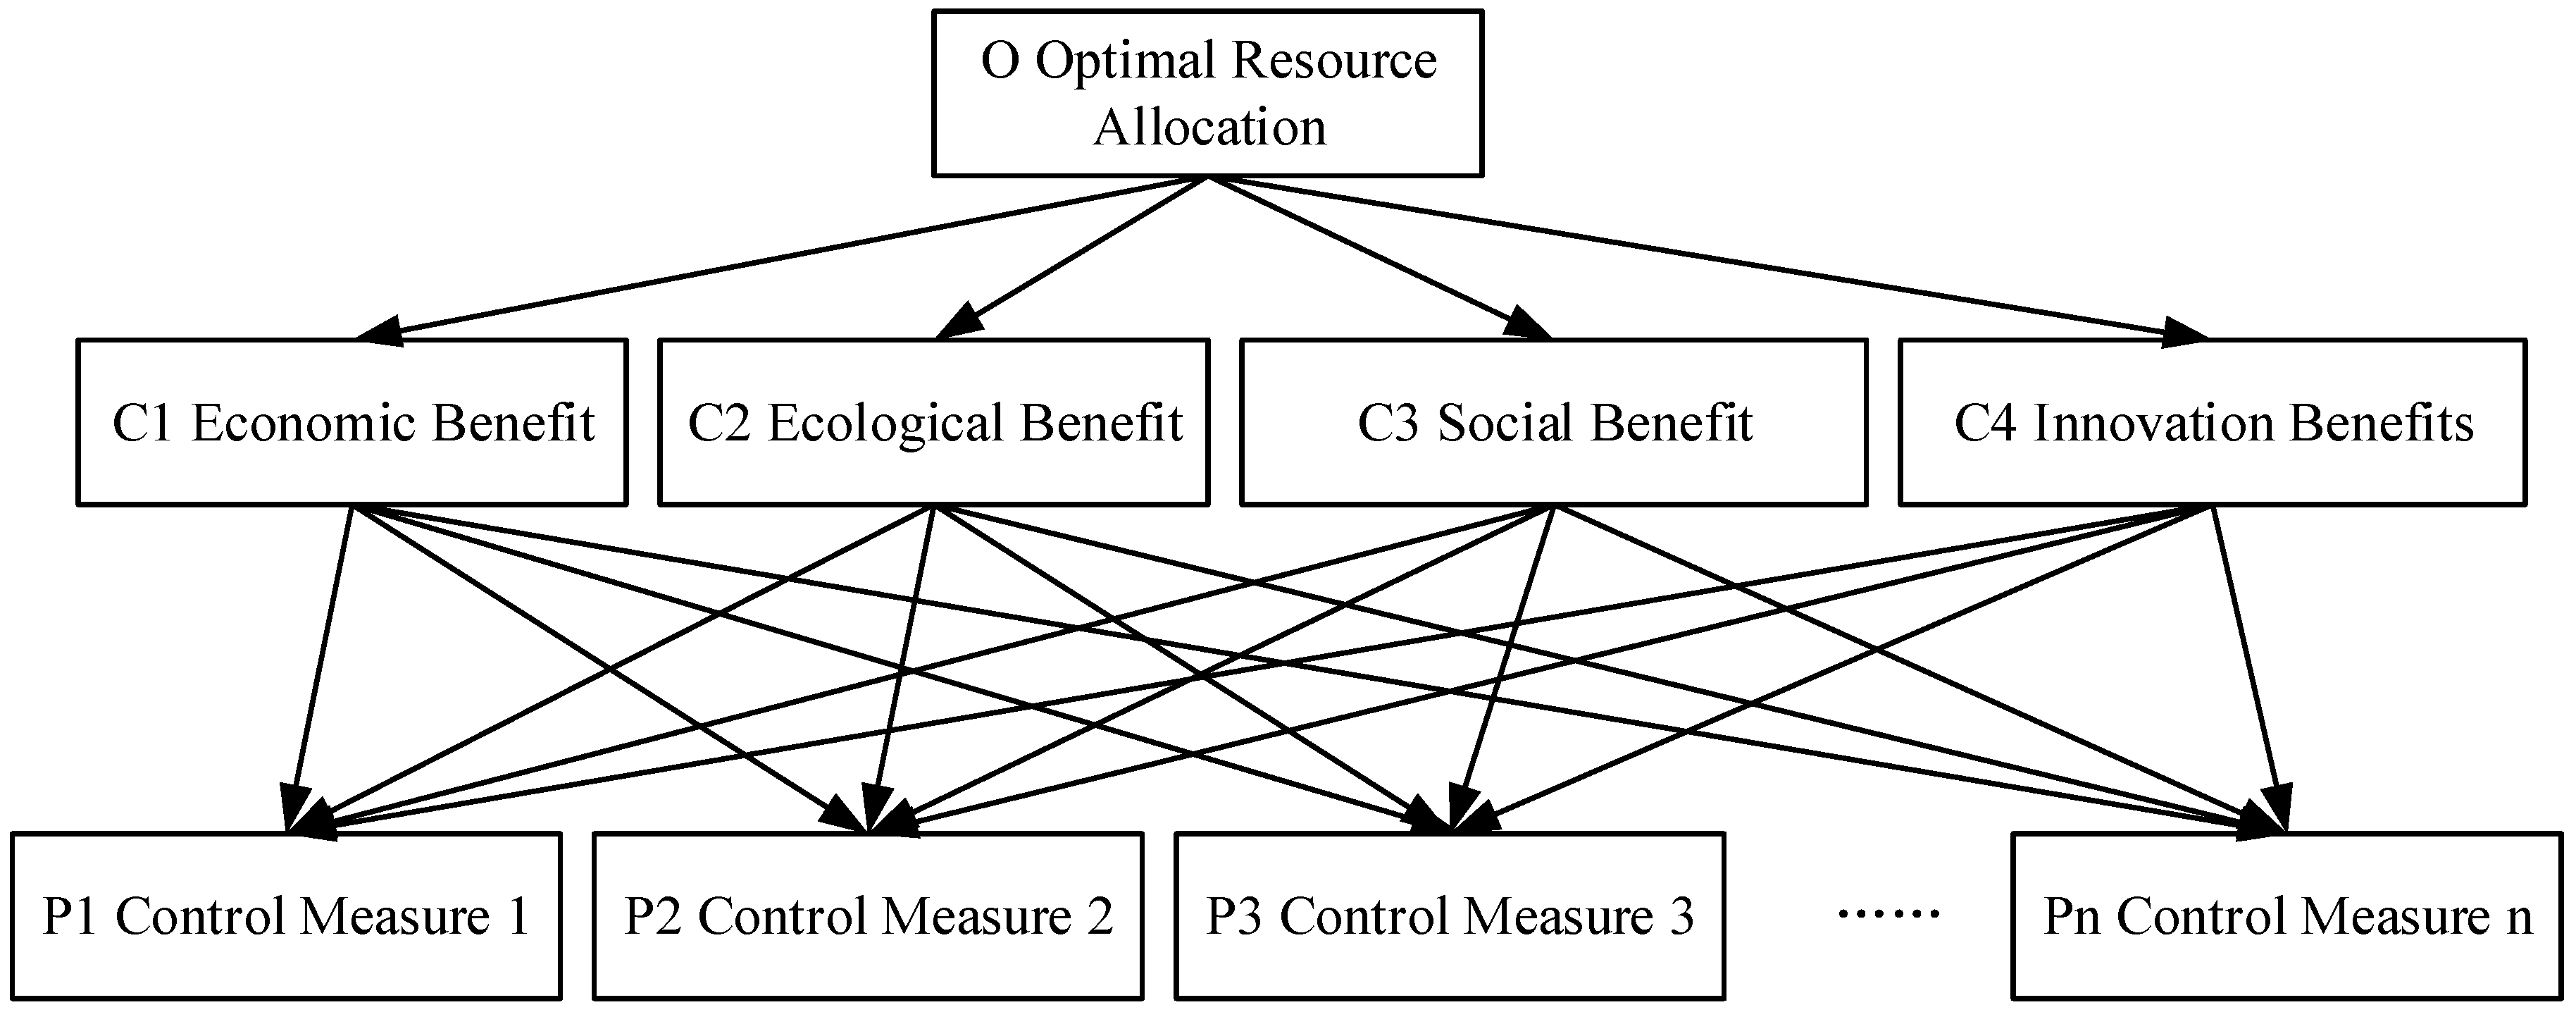
5.3.1. Configuration Goals
- Maximize the four goals of economic value, ecological value, innovation value and social value
- Maximize the integrated value of green innovation for agricultural products.
5.3.2. Configuration Method
The construction of the GERT network of agricultural green innovation value streams, through the implementation of different degrees of regulatory measures at key nodes (GERT network nodes with high value transfer efficiency, strong value stream facilitation and value-added capacity) to achieve resource allocation, while having a great impact on the success or failure of agricultural green innovation), for example, green agricultural products, in order to maximize their economic value, will increase the promotion of their products, by means of advertising, endorsement or promotion, etc. This paper calls them control measures. The corresponding control measures have different effects on the achievement of each goal. In order to achieve different development goals, different levels of control measures will be applied at key points, i.e., resource allocation.
The implementation of the control measures involves the allocation of resources. At each key node, different resource allocations lead to the achievement of different goals, which ultimately affects the integrated value of the innovation chain, as shown in Figure 5. With the disturbance of resource allocation, the transfer probability of nodes also cannot maintain the original stability. In the process of solving multi-objective problems, the application of fuzzy analysis is becoming more and more widespread, and the ranking weights for multiple solutions are more applicable. In this paper, from the perspective of fuzzy analysis, the ratio of importance of each regulation measure is calculated for multi-objective planning.
With the key points as the main operation content, the corresponding regulation and control program is implemented to provide favorable guarantee for the realization of optimal resource allocation, as follows.
Assume that the transfer probability at node is sequentially in the process of not yet implementing the regulation scheme and that the regulation will be imposed at node a critical node.
In the stage of carrying out resource allocation, if there is no clear target planning, the main means is usually the uniform allocation of each node. Let at this point, the probability of transmission at the above nodes becomes ,then there is , and the value of can be found.
Since single-objective planning cannot maintain the original stability in the stage of resource allocation, it also leads to different degrees of resource fluctuation, i.e., the allocation is done as much as possible in the field of achieving the set goal. Let at this time, the above node at the transmission probability becomes , then there is (let a node a significant allocation of resources), the value of can be found.
In the stage of implementing resource allocation, multi-objective planning will show itself at this time, taking the set multi-objective degree as the reference focus, so as to promote the real implementation of the comprehensive decision, avoiding the contradiction of the realization of each goal, and choosing the most applicable and feasible resource allocation plan. At this time, the transmission probability at the above node becomes , then there is , thus, the value of can be found. By implementing the hierarchical analysis method, we can find and finally determine the value of .
The role of the above-mentioned allocation methods and allocation steps is clearly visible, and they also produce very significant results. However, it is not clear at this point whether the allocation effect of the innovation resources is ideal or not, nor can it produce a clear understanding of the achievement of each goal, which needs to be done through further analysis.
6. Analysis of Green Innovation Input Optimization Scheme for Agricultural Product Value Chain
6.1. Evaluation Model Establishment
In order to judge whether the effect of agricultural green innovation input optimization scheme under multi-objective planning is ideal, so from the perspective of the comprehensive value assessment model of agricultural green innovation, a model is built for this aspect, in which the reference quantity is related to two elements, one of which is single-objective planning; the other is planning without explicit objectives.
Based on the research needs, the following basic assumptions were made as follow.
Propositions 1.
The cost of green agricultural technology innovation is denoted by C, which is always maintained in the original state throughout the stage of technology innovation.
Propositions 2.
If the target priority of planning is not clear, the failure rate of green agricultural technology innovation is
in the process of resource allocation,
in the process of resource allocation with single-goal planning, and
in the process of resource allocation with multi-goal planning.
Propositions 3.
In this paper, according to the final achievement of each objective combined with expert opinions, the corresponding weight a is assigned to the achievement of each objective.
Propositions 4.
Assume that the combined value that can be realized from a successful innovation is x.
Based on the above assumptions, the combined benefits of green innovation for agricultural products under different scenarios can be obtained as follows.
If there is a lack of clear target planning in carrying out the process of resource allocation, the comprehensive benefits of green innovation for agricultural products
In the whole phase of carrying out resource allocation, if single-objective planning is the main vehicle, then the comprehensive benefits of green innovation for agricultural products
When allocating resources based on multi-objective planning, the process of allocating innovation resources should uphold the concept of prudence and meticulousness, and conduct a multi-faceted analysis of the level of importance of the objectives and the comprehensive benefits of green innovation for agricultural products
6.2. Effectiveness of the Implementation of Green Innovation Input Optimization Program for Agricultural Products
According to the agricultural green innovation input optimization program implementation of innovation input optimization, for agricultural green innovation comprehensive benefit assessment model for careful analysis, as a premise, stand on a different position to analyze the program implementation effect.
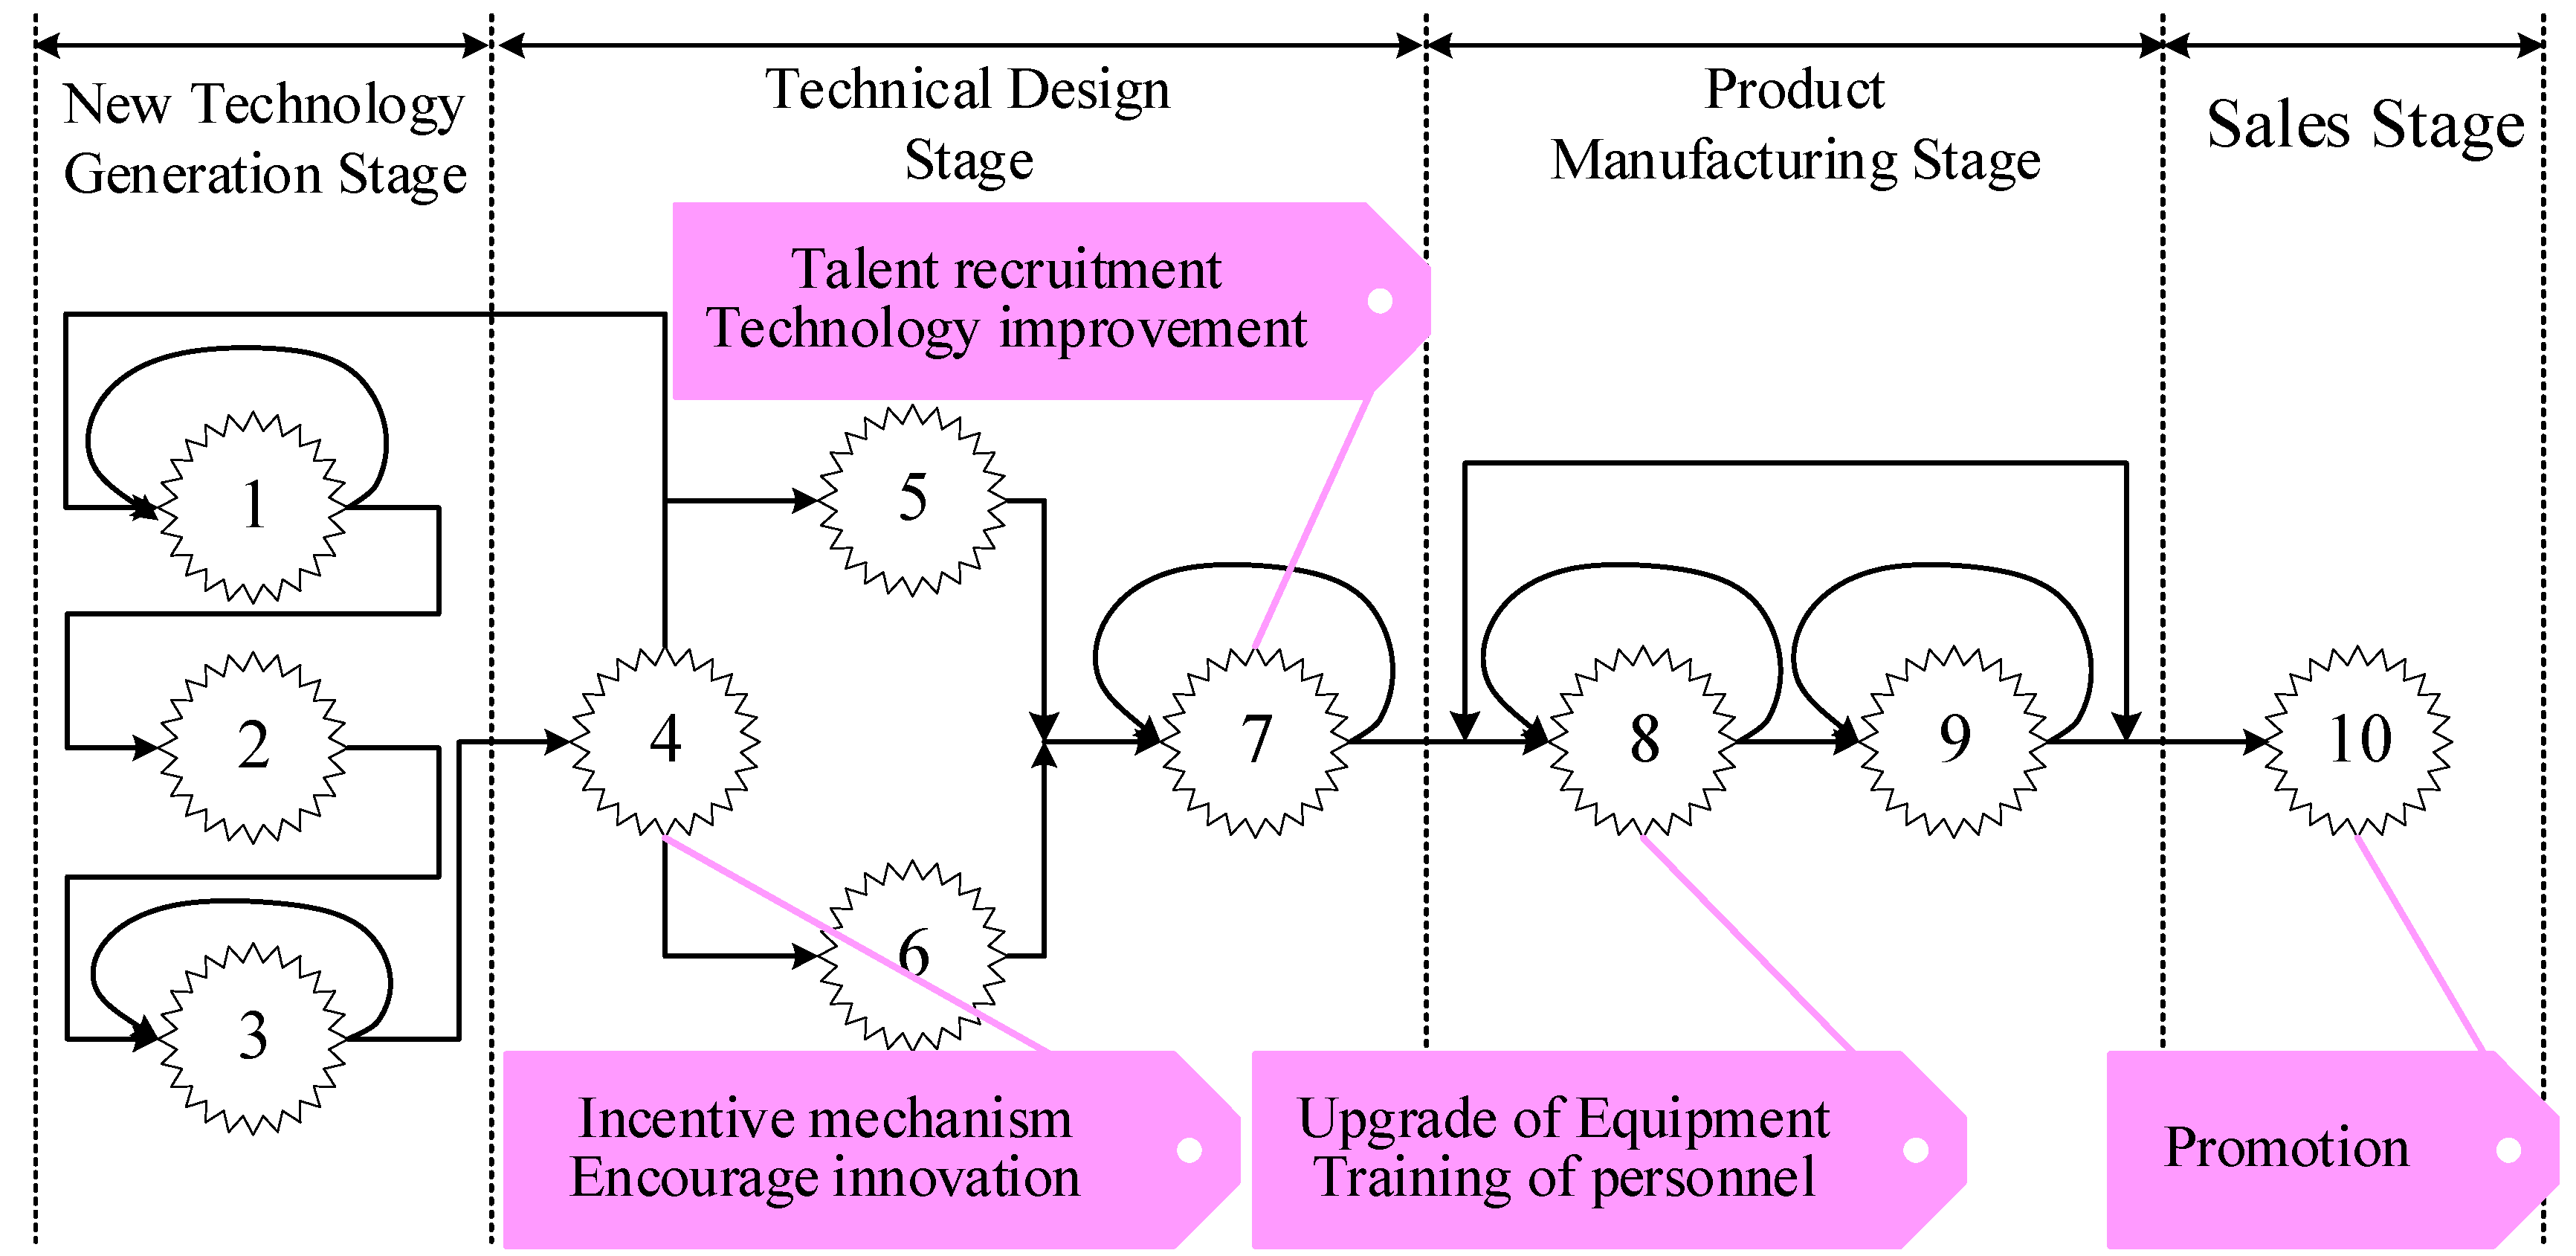
The Green Innovation Value Flow for Agricultural Products (GIVF-GERT) network model is shown in Figure 6. Nodes 1 to 10 in the figure represent: knowledge stock and technology development, new technology generation, new technology evaluation and decision making, incentive mechanism and encouraging innovation, market research and demand forecast, data collection and research, talent introduction and technology improvement, updating equipment and personnel training, raw material procurement and product manufacturing, and promotion.
In order to avoid the excessive complexity of the quantitative calculation of innovation value, this paper takes the value utility index as the main entry point to make it a quantitative indicator of innovation value, taking the value range 0–1, and assumes the transfer probability of each node and the role parameters of each technological innovation link through the current content related to the flow of green innovation value of agricultural products as shown in the Table 1 below.
For the key nodes, they not only have higher value transfer efficiency, but also can effectively promote the value flow and occupy obvious advantages in value-added capacity. In the process of really carrying out product innovation, we can understand that 4 7 8 10 are the key nodes for the value flow of agricultural innovation. In order to avoid the process of achieving the goal is more difficult, to increase the innovation resources invested in the key nodes as the main means. It is assumed that the way to increase the innovation resources invested at the key nodes is 4 7 8 10.
Then the optimized effects of green innovation inputs and the combined benefits of innovation for agricultural products under the three objective plans are as follows.
In the absence of clear goal planning (i.e., unclear order of goals and unknown intensity), the principle of even distribution of innovation resources is adopted at key nodes.
can be obtained. The parameters of each activity of the GERT network at this time are shown in the following Table 2.
GERT network activity parameters after implementation of moderation measures without explicit target planning. Similarly, the equivalence transfer probability can be calculated as follow.
Under single-objective planning (e.g., pursuing only economic value), the principle of focused resource allocation at key nodes is adopted at the major economic value enhancement nodes.
can be obtained. The parameters of each activity of the GERT network at this time are shown in the following Table 3.
Similarly, the equivalence transfer probability can be calculated as follow.
In the case of multi-objective planning, resources are allocated at key points, and the principle of proportional allocation is adopted according to the temporality of development goals and the intensity of the goals.
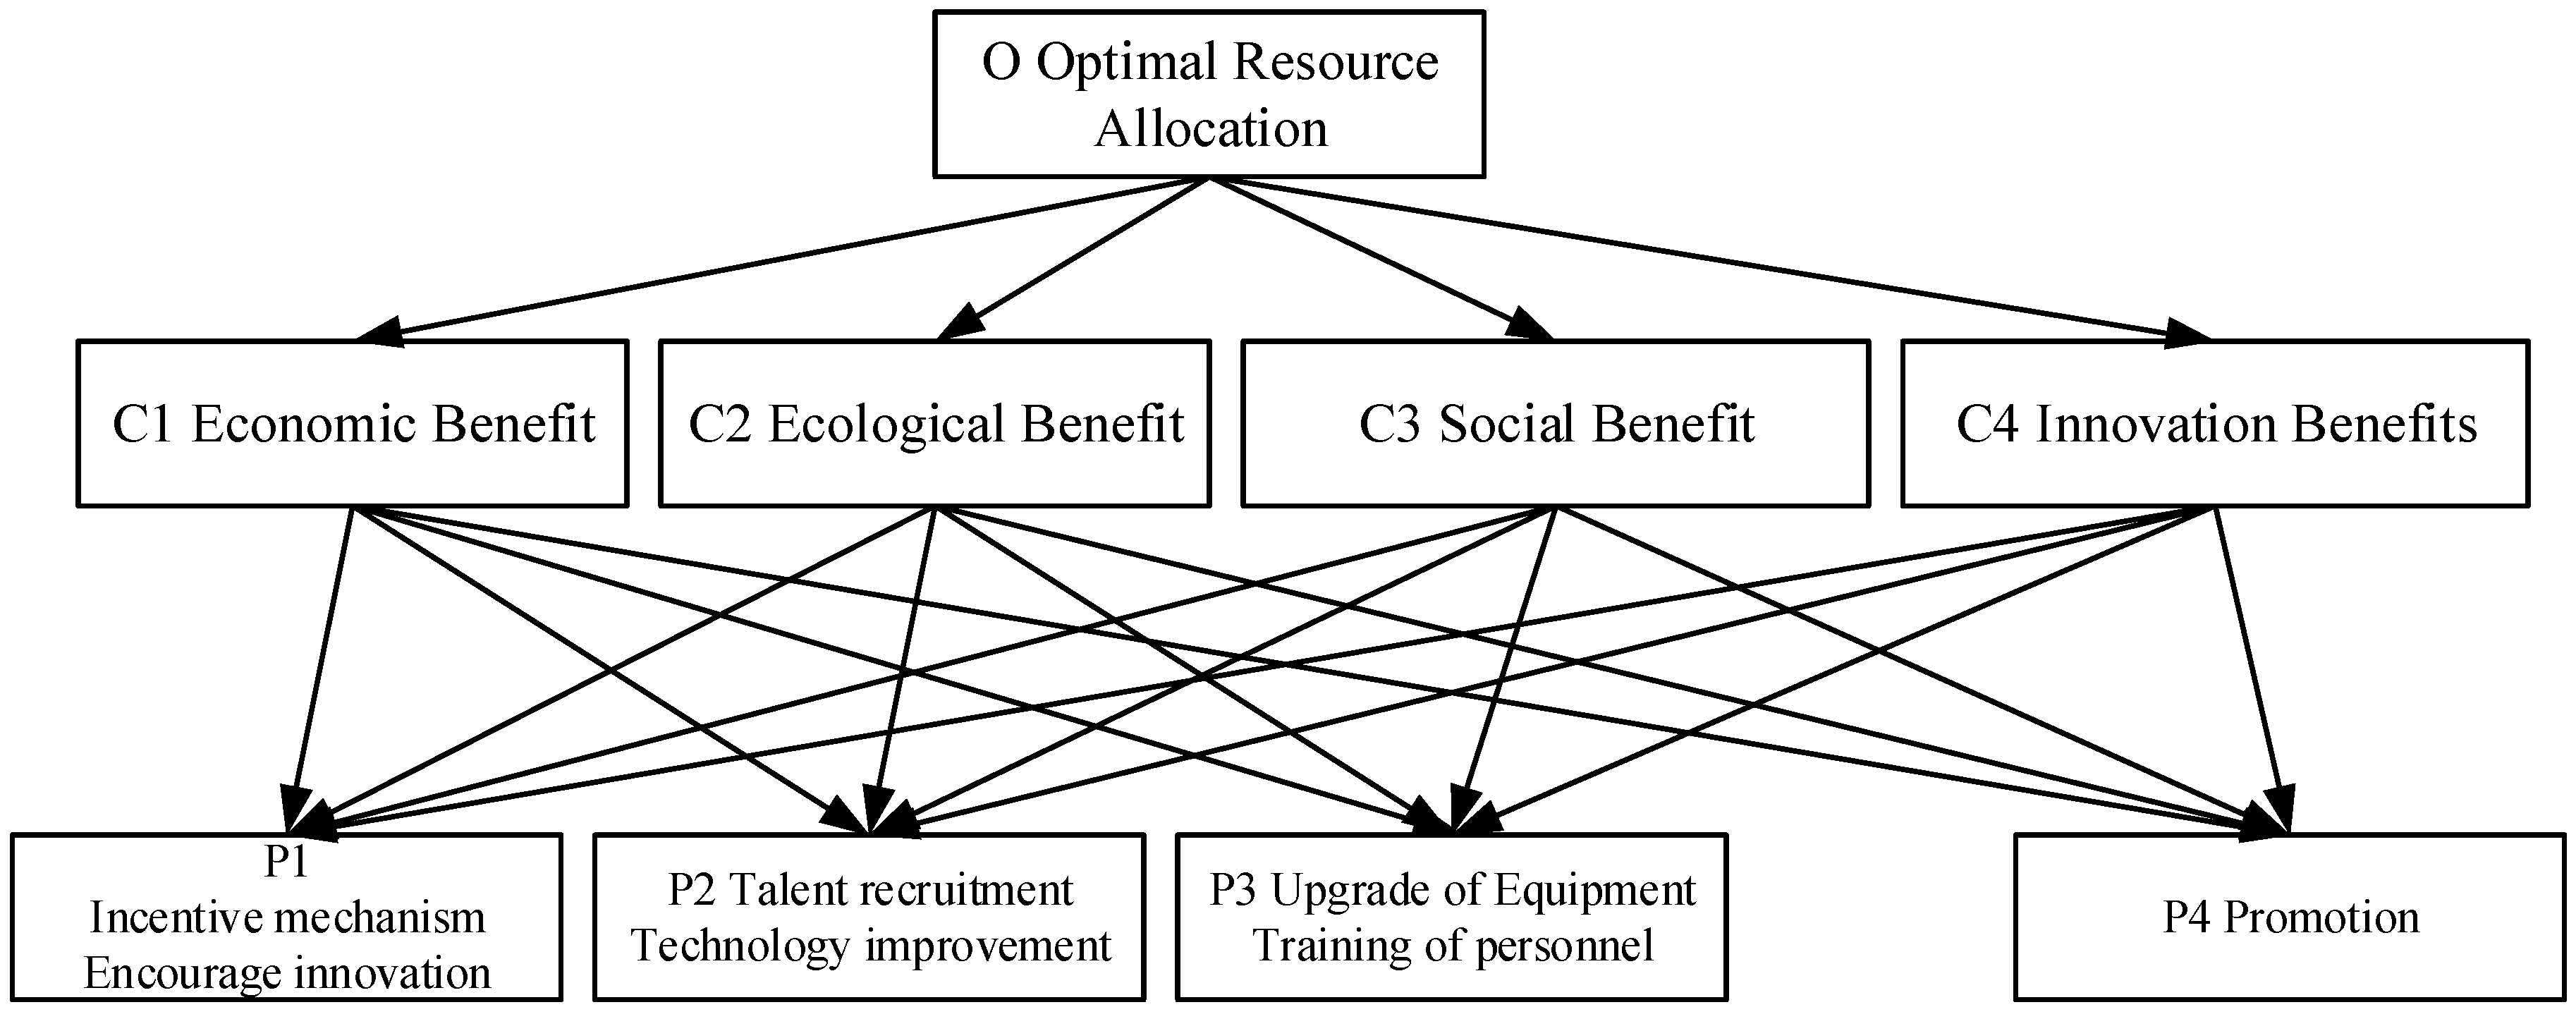
The first modeling is based on fuzzy evaluation, as shown in the following Figure 7. Weights are given according to the importance of the objectives, and set . Four control measures are used as the elements of the evaluation concentration.
If single-factor fuzzy evaluation is used to obtain its results, the fuzzy set is as follow.
The following fuzzy comprehensive evaluation matrix is obtained from the above fuzzy set.
Due to the different importance of the objectives, we give different weights to the four values, i.e., W1, W2, W3 and W4. This can be expressed as a fuzzy set as A = (5, 4, 3, 2), by measures such as actual inspection and expert evaluation.
The fuzzy comprehensive evaluation set B = A*R is thus obtained as follows.
That is, the ratio of the importance of the control measures: d1:d2:d3:d4 = 19: 20:24:19
can be obtained. The parameters of each activity of the GERT network at this time are shown in the following Table 4.
Similarly, the equivalent transfer probability can be calculated as .
From , we can see that in the process of resource allocation based on multi-objective planning, the amount of green innovation in agricultural products has the lowest failure rate.
The corresponding weight values of each objective are assigned according to the effect of achieving each objective of green agricultural product technology innovation under different objective planning (the proposed scoring range is 0~5). Then, after resource allocation based on planning without explicit objectives; . After resource allocation based on single-objective planning; . After resource allocation based on multi-objective planning, .
Based on the above data, the combined benefits of green agricultural technology innovation under the three main objective plans can be derived as shown in the following Table 5.
From , it is clear that the greatest combined benefit is achieved when the innovation resources are allocated based on multi-objective planning.
In summary, when multiple development goals are set, innovation inputs are optimized for the highest efficiency and the greatest overall benefit.
7. Conclusions
We combine multi-objective planning with innovation work, propose the optimal implementation plan of green innovation input of agricultural products value chain, and evaluate the implementation effect, improve it in time, so that it can add new vitality to the specific implementation plan, and measure the comprehensive benefits of green innovation of agricultural products according to the actual situation. The comprehensive benefits of green innovation in agricultural products are measured based on the actual situation, and finally it is concluded that the optimization of green innovation investment in agricultural products under multi-objective planning is more effective. It provides a theoretical basis for the application of multi-objective planning in the value flow of agricultural green innovation, which is beneficial to the long-term development of the value chain of agricultural green innovation.
Author Contributions
Writing—original draft, Y.W. (Yang Wang); Writing—review & editing, Y.W. (Yifeng Wang) and P.F. All authors have read and agreed to the published version of the manuscript.
Funding
This research received no external funding.
Informed Consent Statement
Not applicable.
Data Availability Statement
The study did not involve humans or animals. The study did not report any data.
Conflicts of Interest
The authors declare no conflict of interest.
References
- Yi-song, Z.; Dong, L.; Feng, Z. Study on a GERT based method for hi-tech product development project planning. In Proceedings of the 2009 16th International Conference on Industrial Engineering and Engineering Management, Beijing, China, 21–23 October 2009; pp. 1022–1026. [Google Scholar]
- Xu, Z.; Jia, Z.J. Assessment of technical risk for weapon system development project based on GERT simulation including multi-branch feedback. Comput. Integr. Manuf. Syst. 2010, 16, 636–642. [Google Scholar]
- Li, C.; Tang, Y.; Li, C. A GERT-based analytical method for remanufacturing process routing. In Proceedings of the 2011 IEEE International Conference on Automation Science and Engineering, Trieste, Italy, 24–27 August 2011; pp. 462–467. [Google Scholar]
- Wang, C.N.; Yang, G.K.; Hung, K.C.; Chang, K.H.; Chu, P. Evaluating the manufacturing capability of a lithographic area by using a novel vague GERT. Expert Syst. Appl. 2011, 38, 923–932. [Google Scholar] [CrossRef]
- Li, C. An analytical method for cost analysis in multi-stage supply chains: A stochastic network model approach. Appl. Math. Model. 2014, 38, 2819–2836. [Google Scholar] [CrossRef]
- Tao, L.; Wu, D.; Liu, S.; Lambert, J.H. Schedule risk analysis for new-product development: The GERT method extended by a characteristic function. Reliab. Eng. Syst. Saf. 2017, 167, 464–473. [Google Scholar] [CrossRef]
- Porter, M.E.; Van der Linde, C. Green and Competitive. Harv. Bus. Rev. 1995, 73, 120–134. [Google Scholar]
- Arundel, A.; Kemp, R.; Parto, S. Indicators for environmental innovation: What and how to measure. In International Handbook on Environmental Technology Management; Edward Elgar Publishing: Northampton, MA, USA, 2007; pp. 324–339. [Google Scholar]
- Oduro, S.; Maccario, G.; Nisco, A.D. Green innovation: A multidomain systematic review. Eur. J. Innov. Manag. 2021; ahead-of-print. [Google Scholar]
- Dong, B.; Jin, L. A preliminary study on the progress of green innovation in China. Sci. Technol. Manag. Res. 2005, 25, 62–64. [Google Scholar]
- Li, X. A review of green innovation-related research and prospects. Res. Dev. Manag. 2015, 27, 1–11. [Google Scholar]
- Moore, F. Predators and Prey: A New Ecology of Competition. Harv. Bus. Rev. 1993, 71, 75–86. [Google Scholar] [PubMed]
- Mercan, B.; Goktas, D. Components of Innovation Ecosystems: A Cross Country Study. Int. Res. J. Financ. Econ. 2011, 76, 102–112. [Google Scholar]
- Klotz, F. Navigating the Leadership Challenges of Innovation Ecosystems. MIT Sloan Manag. Rev. 2016, 58–59. Available online: https://sloanreview.mit.edu/article/navigating-the-leadership-challenges-of-innovation-ecosystems/ (accessed on 13 June 2022).
- Adner, R.; Kapoor, R. Innovation ecosystems and the pace of substitution: Re-exmining technology Scurves. Strateg. Manag. J. 2016, 37, 625–648. [Google Scholar] [CrossRef] [Green Version]
- Gomes, L.A.; Facin, A.F.F.; Salerno, M.S. Managing uncertainty propagation in innovation ecosystems. Technol. Forecast. Soc. Chang. 2021, 171, 120945. [Google Scholar] [CrossRef]
- Breslin, D.; Kask, J.; Schlaile, M.; Abatecola, G. Developing a coevolutionary account of innovation ecosystems. Ind. Mark. Manag. 2021, 98, 59–68. [Google Scholar] [CrossRef]
- Bernauer, T.; Engel, S.; Kammerer, D.; Nogareda, J.S. Explaining Green Innovation: Ten Years after Porter’s Win-Win Proposition: How to Study the Effects of Regulation on Corporate Environmental Innovation? Politische Vierteljahresschr. 2007, 39, 323–341. [Google Scholar]
- Charter, C. Sustainable Innovation: Key Conclusions from Sustainable Innovation. Conferences 2006 Organized by The Centre for Sustainable Development; University College for the Creative Arts: Farnham, UK, 2007. [Google Scholar]
- Bo, S.; Kexin, B. Open innovation mode of green innovation system for manufacturing industry. Mob. Inf. Syst. 2021, 2021, 9948683. [Google Scholar] [CrossRef]
- Elmaghraby, S.E. An algebra for the analysis of generalized activity networks. Manag. Sci. 1964, 10, 494–514. [Google Scholar] [CrossRef]
- Pritsker, A.A.B. GERT: Graphical Evaluation and Review Technique; Rand Corporation: Santa Monica, CA, USA, 1966. [Google Scholar]
Figure 1.
The value flow mechanism of agricultural value chain based on eco-innovation.

Figure 2.
Key to the GERT network model of value flows in the agricultural green innovation value chain Schematic diagram of the combined effect of influencing factors.
Figure 2.
Key to the GERT network model of value flows in the agricultural green innovation value chain Schematic diagram of the combined effect of influencing factors.

Figure 3.
The basic building blocks of the GERT network model of value flows.

Figure 4.
The value flow mechanism of agricultural value chain based on eco-innovation.

Figure 5.
Hierarchy diagram for optimal allocation of innovation resources under multi-objective decision making.
Figure 5.
Hierarchy diagram for optimal allocation of innovation resources under multi-objective decision making.

Figure 6.
Distribution of innovative resource optimisation control measures under multi-objective decision-making.
Figure 6.
Distribution of innovative resource optimisation control measures under multi-objective decision-making.

Figure 7.
A model for optimal allocation of green innovation resources under multi-objective decision making.
Figure 7.
A model for optimal allocation of green innovation resources under multi-objective decision making.


Table 1.
Agricultural Green Innovation Value Flow GERT Network Activity Parameters.
| Events | Probability | Related Parameters | ||
|---|---|---|---|---|
| (1, 1) | 0.1 | 0.28 | 0.48 | 0.28 |
| (1, 2) | 0.9 | 0.31 | 0.40 | 0.25 |
| (2, 3) | 1 | 0.16 | 0.55 | 0.31 |
| (3, 3) | 0.2 | 0.18 | 0.53 | 0.33 |
| (3, 4) | 0.8 | 0.57 | 0.38 | 0.35 |
| (4, 1) | 0.1 | 0.44 | 0.46 | 0.34 |
| (4, 5) | 0.45 | 0.35 | 0.42 | 0.32 |
| (4, 6) | 0.45 | 0.39 | 0.39 | 0.34 |
| (5, 7) | 1 | 0.32 | 0.44 | 0.38 |
| (6, 7) | 1 | 0.37 | 0.40 | 0.33 |
| (7, 7) | 0.3 | 0.35 | 0.38 | 0.36 |
| (7, 8) | 0.7 | 0.72 | 0.57 | 0.67 |
| (8, 8) | 0.2 | 0.48 | 0.41 | 0.49 |
| (8, 9) | 0.8 | 0.52 | 0.44 | 0.52 |
| (9, 9) | 0.3 | 0.38 | 0.46 | 0.35 |
| (9, 10) | 0.7 | 0.31 | 0.39 | 0.45 |
Table 2.
Moderation Measures Without Explicit Target Planning.
| Events | Probability | Events | Probability |
|---|---|---|---|
| (1, 1) | 0.1 | (5, 7) | 1 |
| (1, 2) | 0.9 | (6, 7) | 1 |
| (2, 3) | 1 | (7, 7) | 0.23 |
| (3, 3) | 0.2 | (7, 8) | 0.77 |
| (3, 4) | 0.8 | (8, 8) | 0.12 |
| (4, 1) | 0.495 | (8, 9) | 0.88 |
| (4, 5) | 0.495 | (9, 9) | 0.23 |
| (4, 6) | 0.01 | (9, 10) | 0.77 |
Table 3.
GERT network activity parameters after implementing moderation measures under single target planning.
Table 3.
GERT network activity parameters after implementing moderation measures under single target planning.
| Events | Probability | Events | Probability |
|---|---|---|---|
| (1, 1) | 0.1 | (5, 7) | 1 |
| (1, 2) | 0.9 | (6, 7) | 1 |
| (2, 3) | 1 | (7, 7) | 0.265 |
| (3, 3) | 0.2 | (7, 8) | 0.735 |
| (3, 4) | 0.8 | (8, 8) | 0.16 |
| (4, 1) | 0.473 | (8, 9) | 0.84 |
| (4, 5) | 0.473 | (9, 9) | 0.16 |
| (4, 6) | 0.054 | (9, 10) | 0.84 |
Table 4.
Moderation Measures Under Multi-Objective Planning.
| Events | Probability | Events | Probability |
|---|---|---|---|
| (1, 1) | 0.1 | (5, 7) | 1 |
| (1, 2) | 0.9 | (6, 7) | 1 |
| (2, 3) | 1 | (7, 7) | 0.23 |
| (3, 3) | 0.2 | (7, 8) | 0.77 |
| (3, 4) | 0.8 | (8, 8) | 0.104 |
| (4, 1) | 0.492 | (8, 9) | 0.896 |
| (4, 5) | 0.492 | (9, 9) | 0.233 |
| (4, 6) | 0.016 | (9, 10) | 0.767 |
Table 5.
Comparison table of comprehensive benefits of green agricultural technology innovation under different target planning.
Table 5.
Comparison table of comprehensive benefits of green agricultural technology innovation under different target planning.
| Comprehensive income |
Publisher’s Note: MDPI stays neutral with regard to jurisdictional claims in published maps and institutional affiliations. |
© 2022 by the authors. Licensee MDPI, Basel, Switzerland. This article is an open access article distributed under the terms and conditions of the Creative Commons Attribution (CC BY) license (https://creativecommons.org/licenses/by/4.0/).
Share and Cite
MDPI and ACS Style
Wang, Y.; Wang, Y.; Fan, P. Analysis of Micro Value Flows in the Value Chain of Eco-Innovation in Agricultural Products. Sustainability 2022, 14, 7971. https://doi.org/10.3390/su14137971
AMA Style
Wang Y, Wang Y, Fan P. Analysis of Micro Value Flows in the Value Chain of Eco-Innovation in Agricultural Products. Sustainability. 2022; 14(13):7971. https://doi.org/10.3390/su14137971
Chicago/Turabian StyleWang, Yang, Yifeng Wang, and Peng Fan. 2022. "Analysis of Micro Value Flows in the Value Chain of Eco-Innovation in Agricultural Products" Sustainability 14, no. 13: 7971. https://doi.org/10.3390/su14137971
Note that from the first issue of 2016, this journal uses article numbers instead of page numbers. See further details here.