
Frameworks for Urban Green Infrastructure (UGI) Indicators: Expert and Community Outlook toward Green Climate-Resilient Cities in Pakistan


Abstract
:1. Introduction and Background
1.1. Problem Statement and Intended Intervention
Aim and Research Questions
- RQ1. What are the main UGI indicators under MSEP?
- RQ2. What are the key UGS elements that can improve UGI resilience under SCRM?
- RQ3. What is the sustainable UGI indicator-based model needed to build a climate-resilient city?
2. Research Methodology
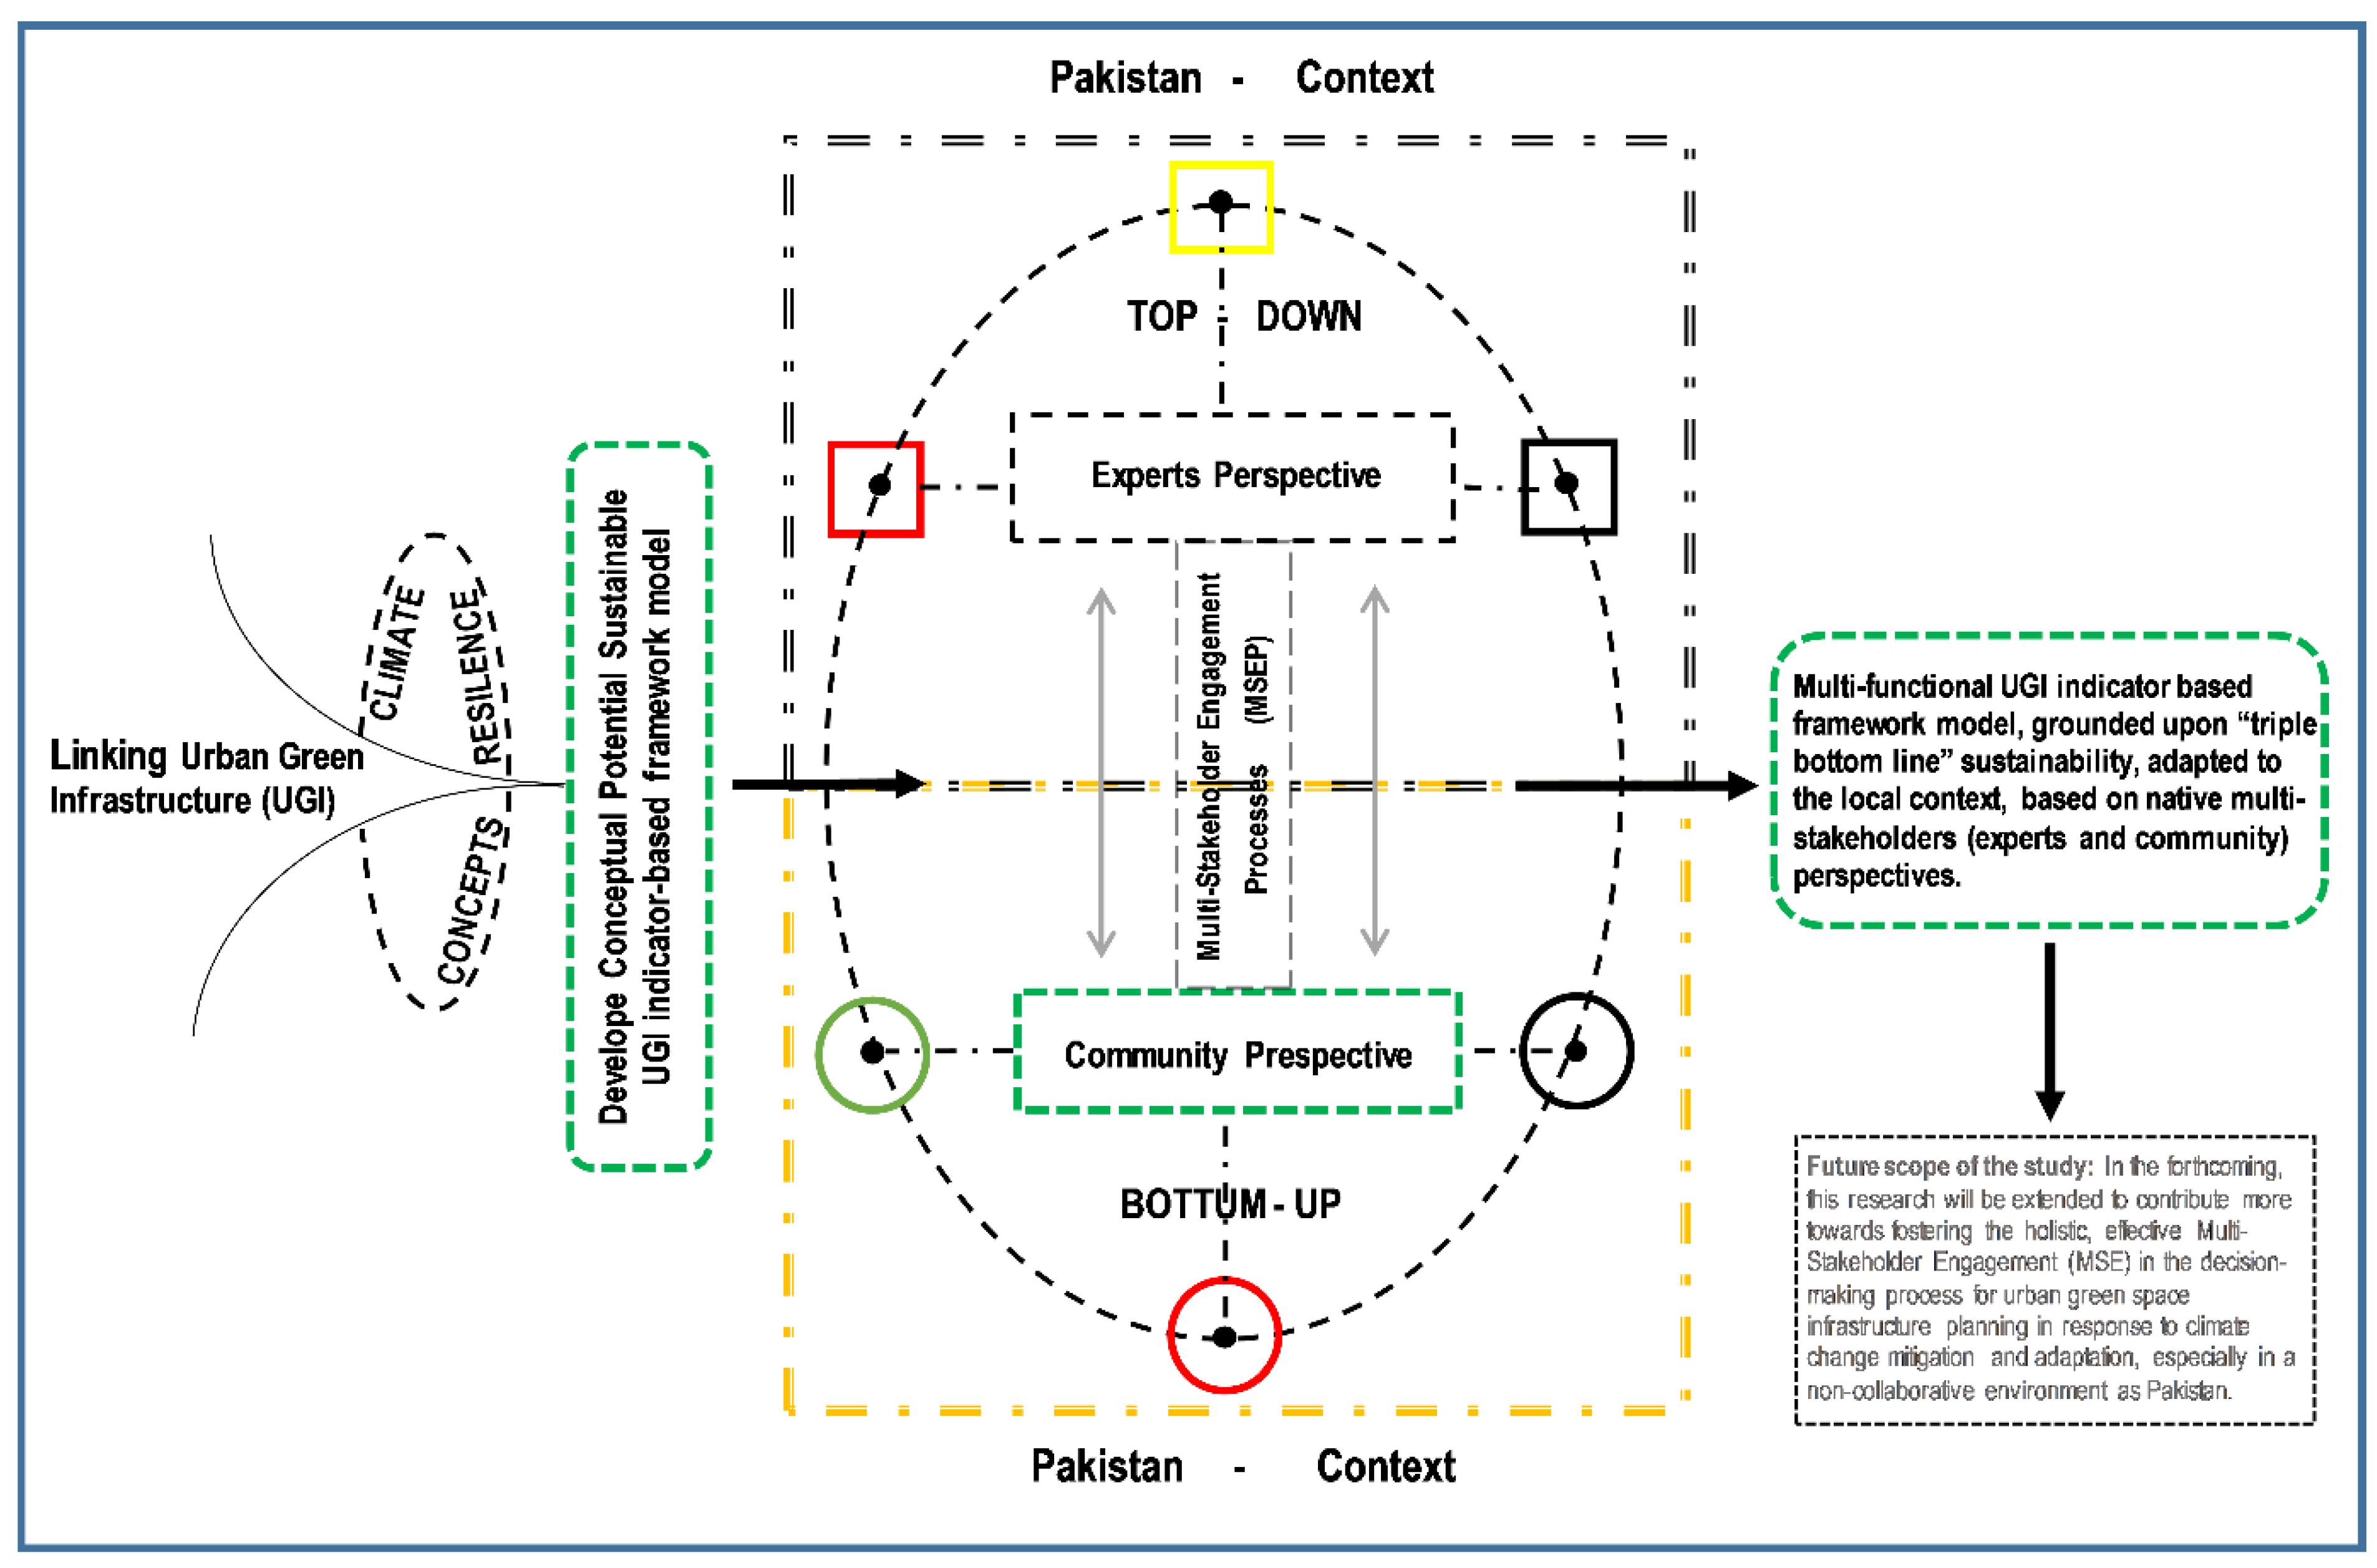
2.1. Probing the Potential UGI Indicator-Based Framework Model
2.2. Multi-Stakeholder Engagement Processes (MSEP)
2.3. Survey Design and Sampling Technique
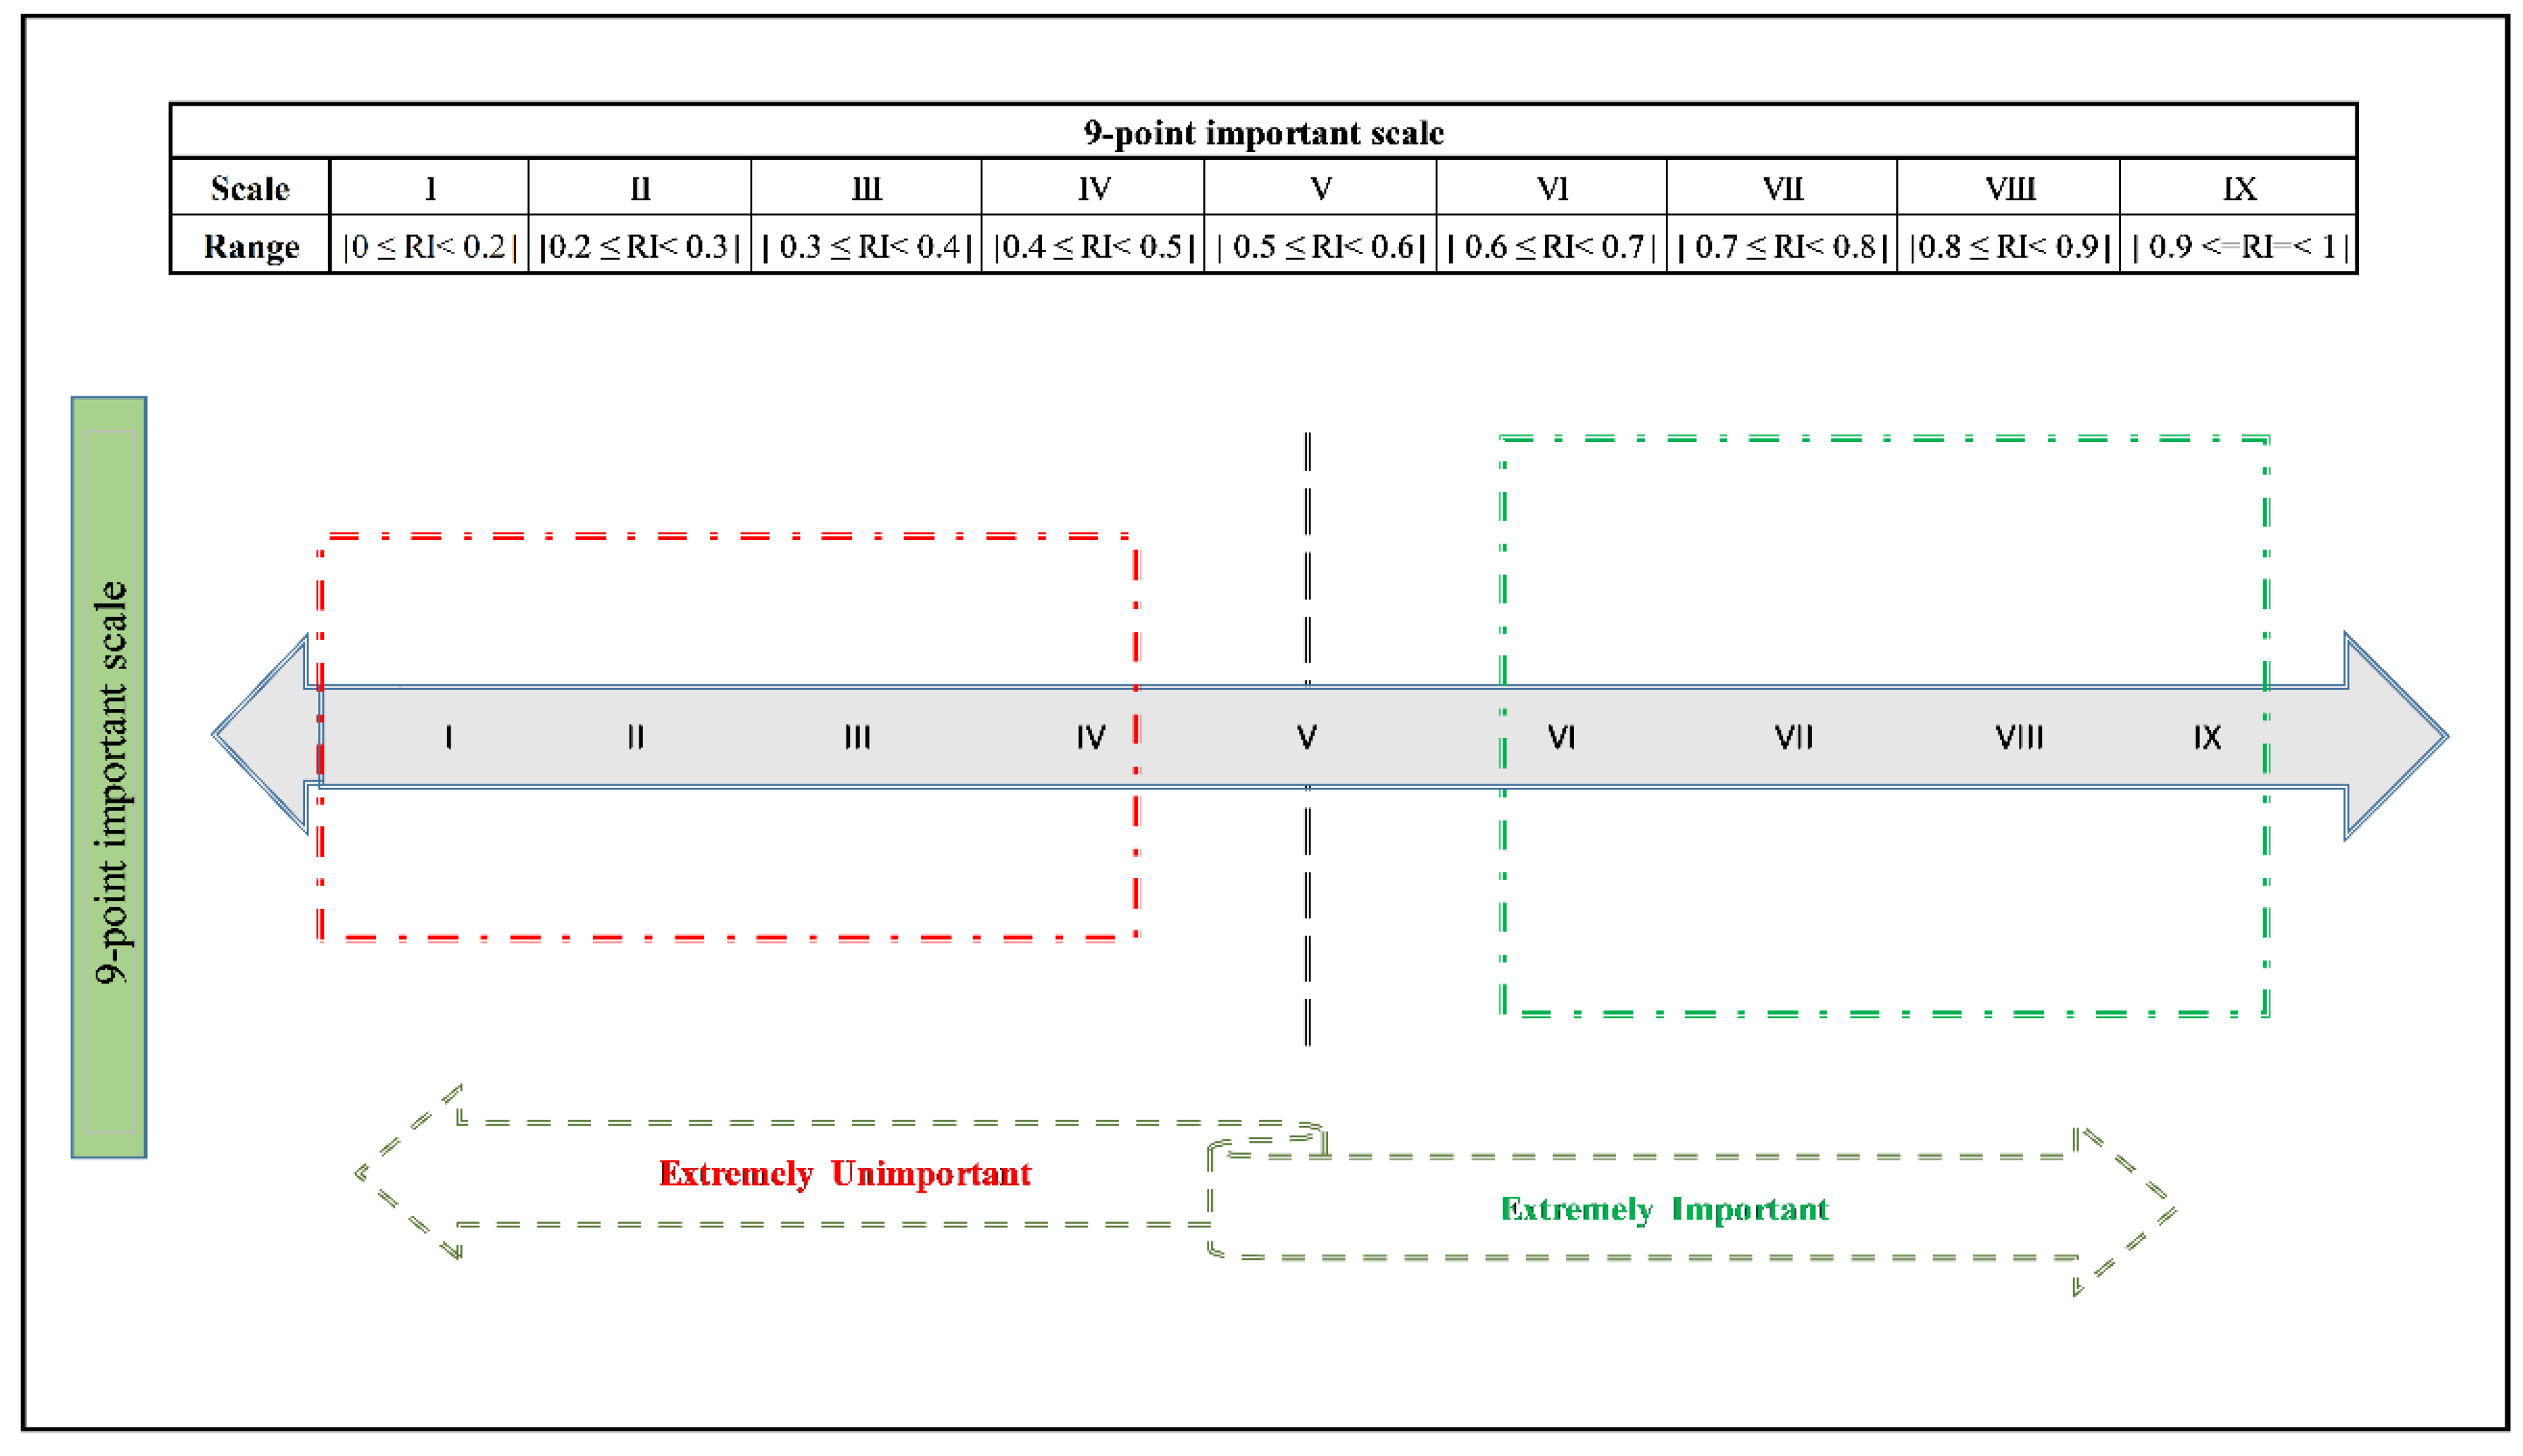
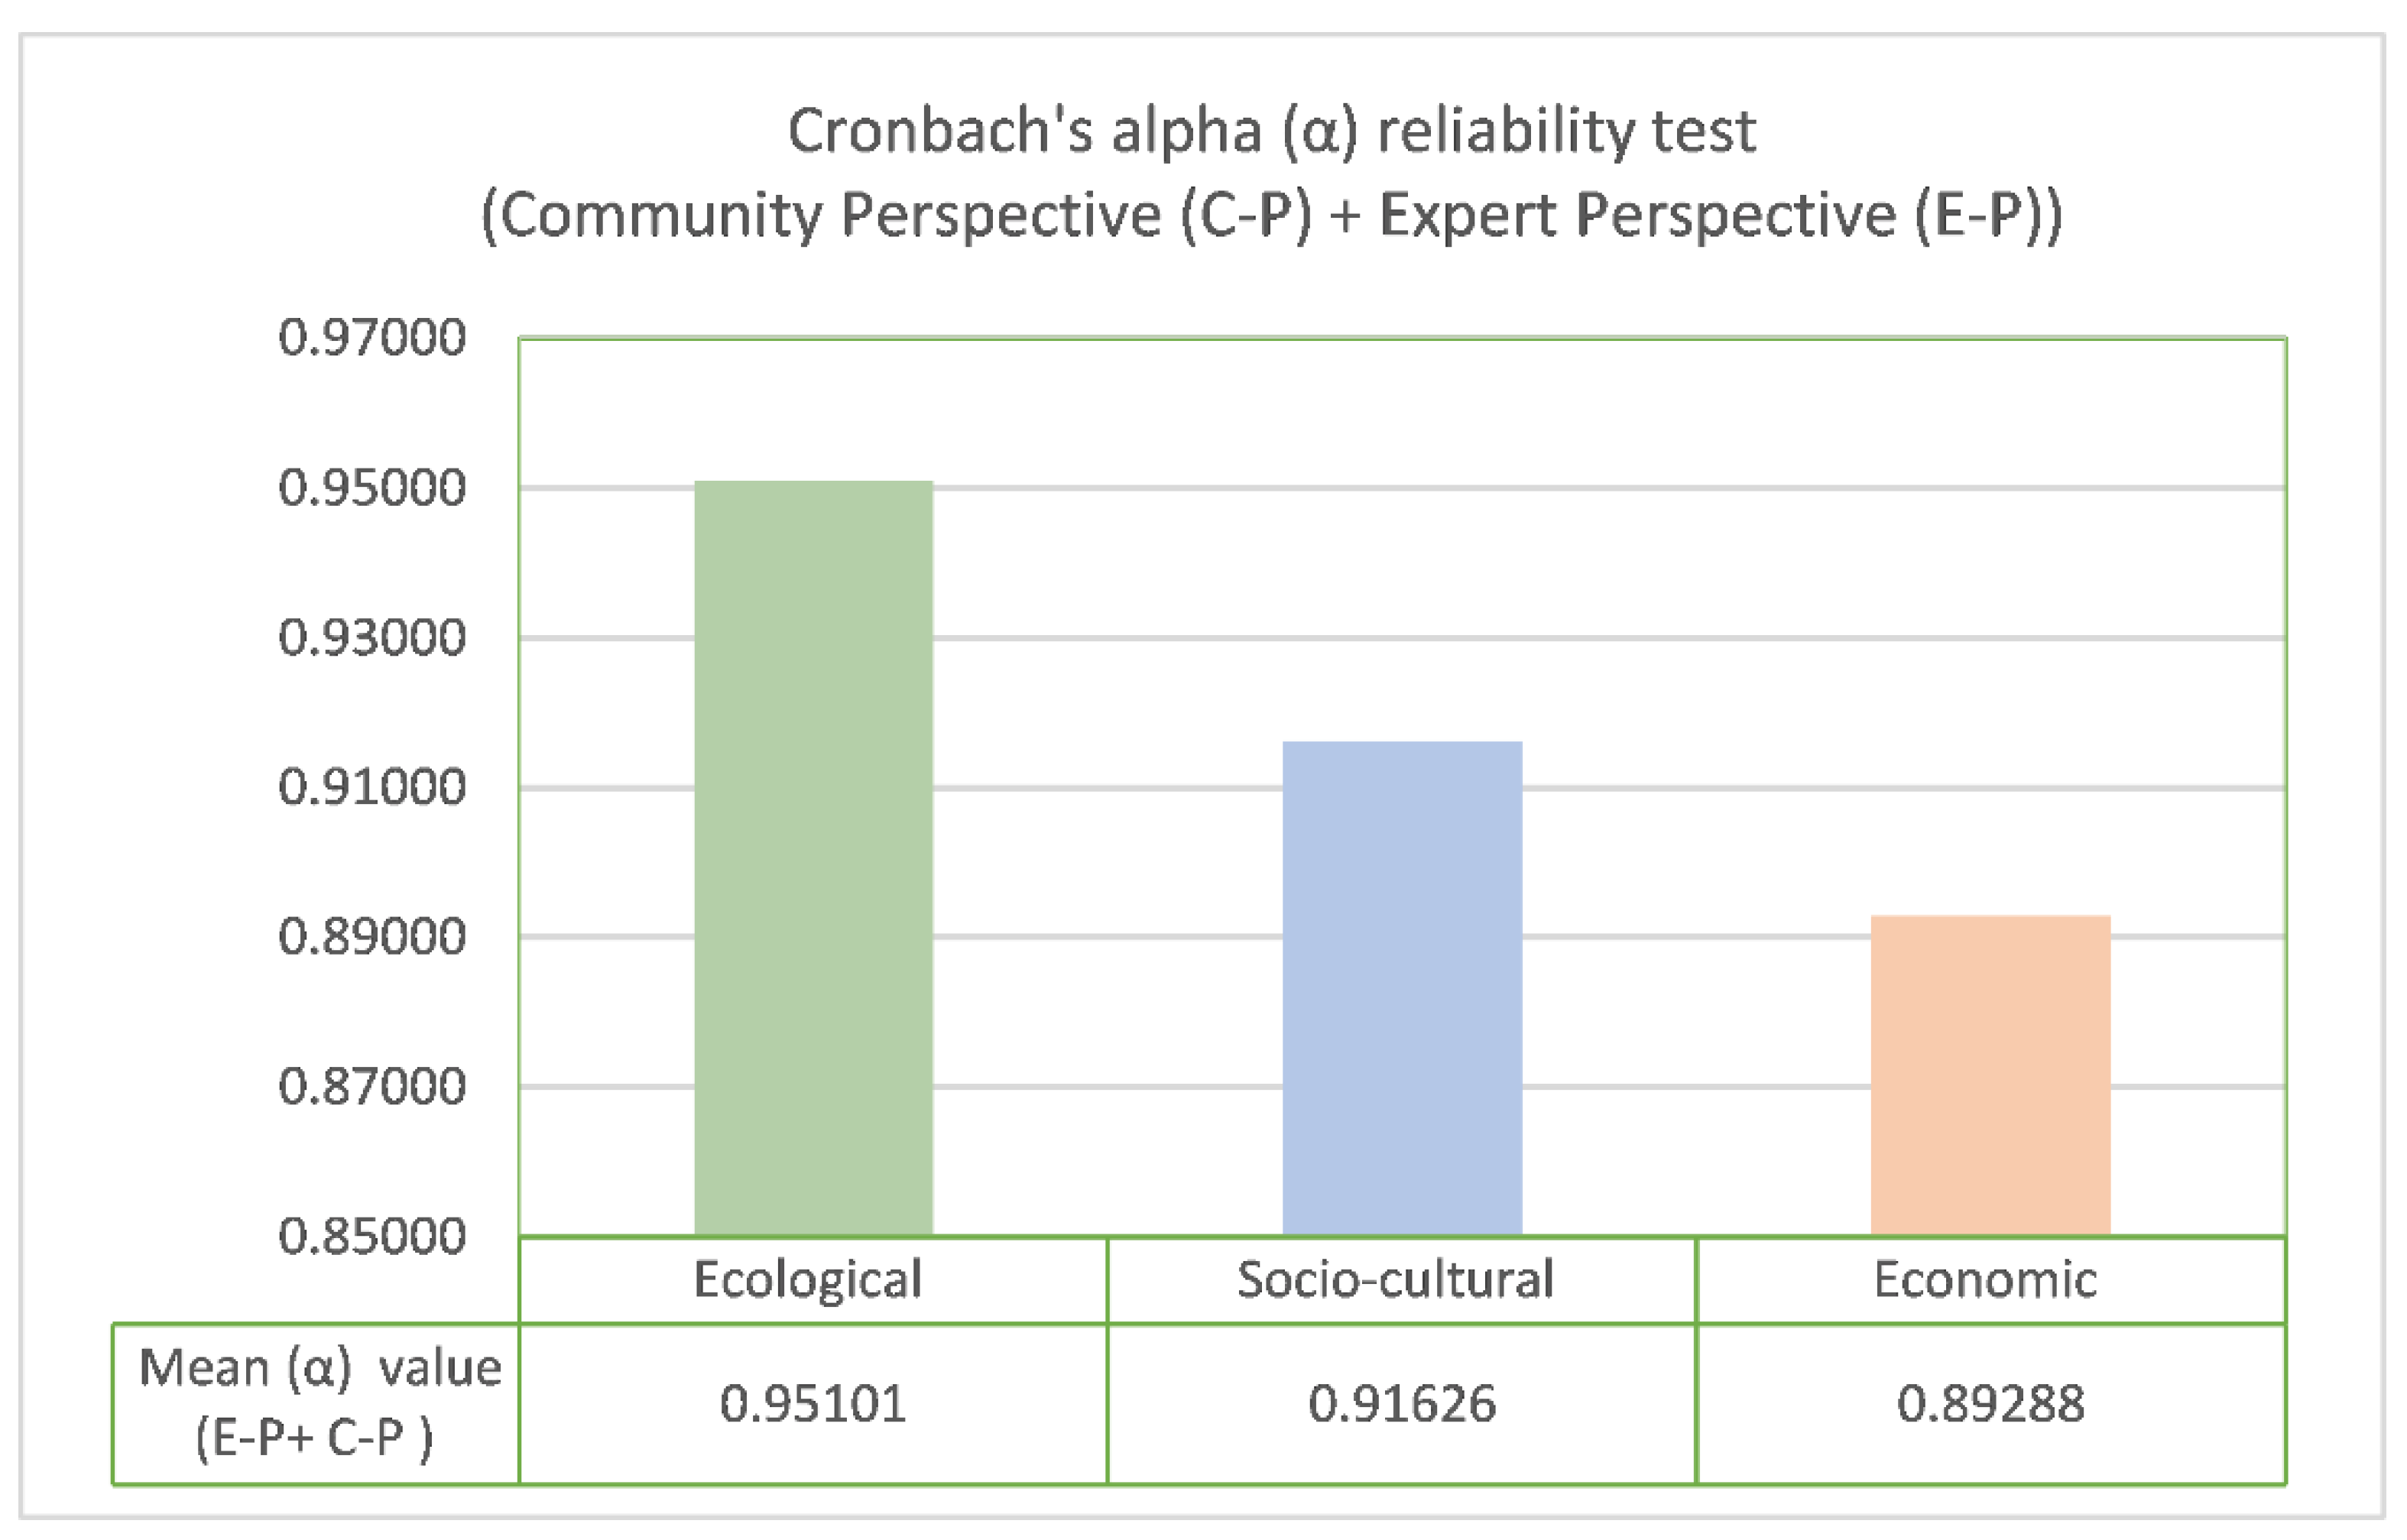
2.4. Data Analysis and Scoring
3. Results
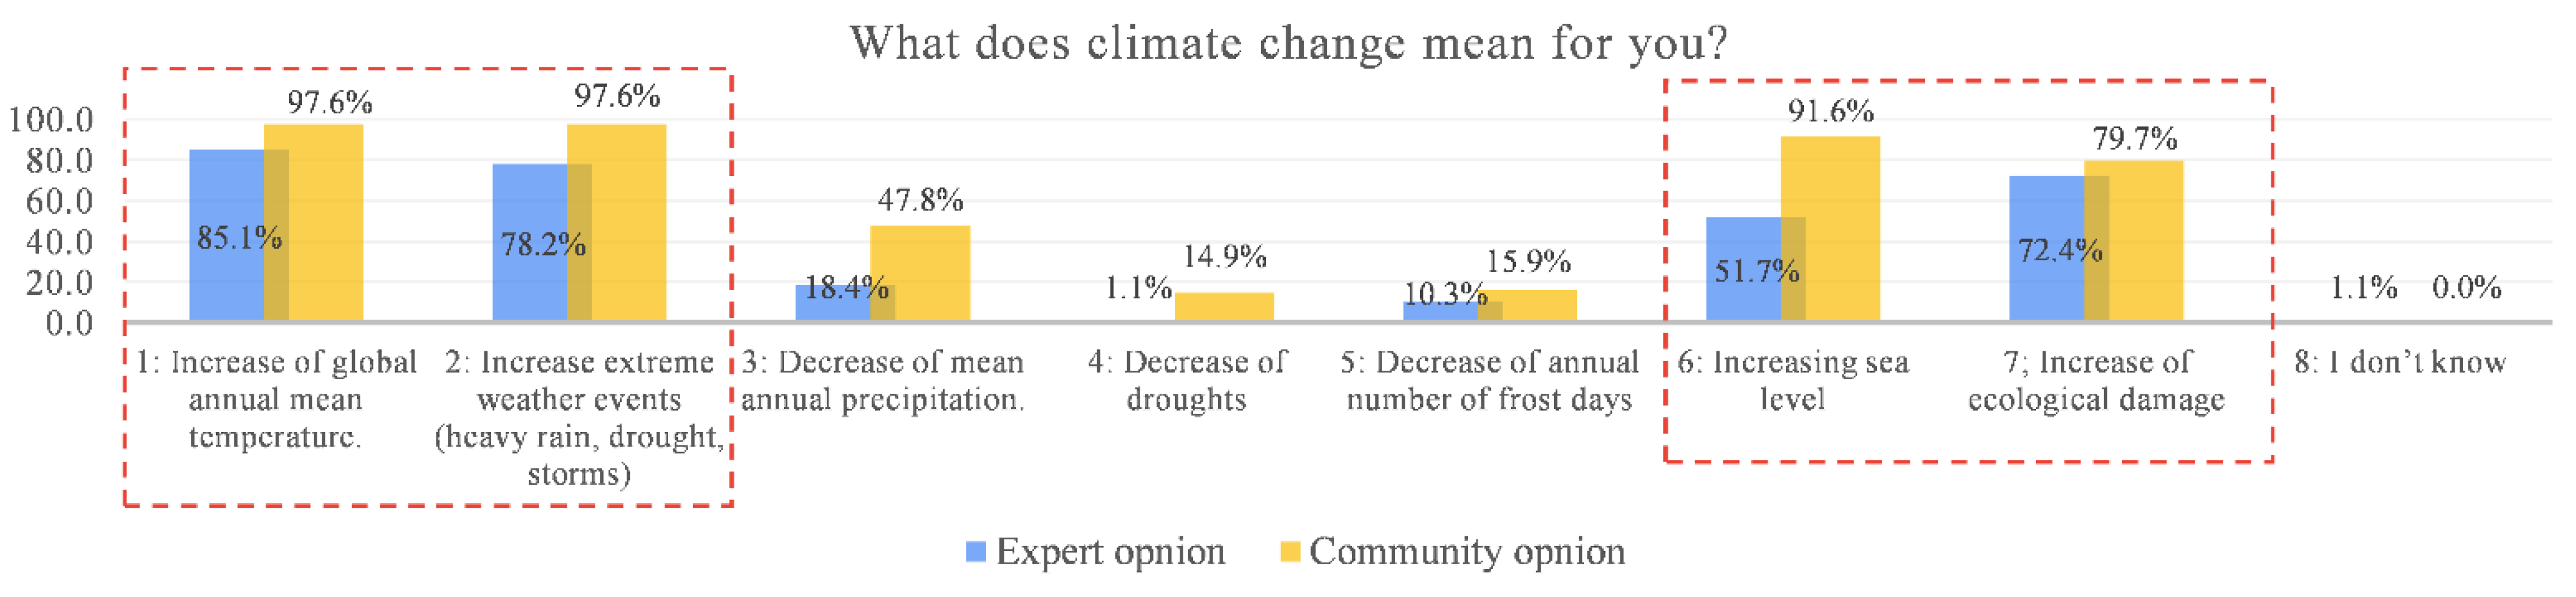
3.1. Experts’ and Community Perspectives on Multiple Cross-Cutting Themes
3.2. RII and UGI Indicators for UGS Elements
3.2.1. RII of Sustainable UGI Indicators (Experts and Community)
3.2.2. RII of UGS Elements with UGI Indicators (Experts and Community)
3.2.3. Vital Taxonomy of UGS Elements
4. Discussion
5. Conclusions and Policy Implications
Author Contributions
Funding
Institutional Review Board Statement
Informed Consent Statement
Data Availability Statement
Acknowledgments
Conflicts of Interest
Appendix A. Potential Urban Green Infrastructure (UGI) Indicator-Based Framework

| This Section Encompassed Questions with the Aim of Identifying UGI Indicators, Interlinked with Multiple GI Elements and Technologies for Resilient Land-Use Planning. Indicators Are Classified According to the “Triple Bottom Line” of Sustainability, Which Highlights the Importance of the Natural and Manmade Environment in Land-Use Planning. | ||||||||||||
|---|---|---|---|---|---|---|---|---|---|---|---|---|
| Categories | Green Infrastructure Indicators | Reference | Green Infrastructure Elements and Technologies. | |||||||||
| Please Rate Your Opinion between 1 and 10 on the Likert Scale. 1. Highly Insignificant, 2. Slightly Insignificant, 3. Moderately Insignificant. 4. Insignificant, 5. Neutral, 6. Not Sure, 7. Slightly Significant, 8. Moderately Significant, 9. Significant, 10. Highly Significant | ||||||||||||
| GI 1 | GI 2 | GI 3 | GI 4 | GI 5 | GI 6 | GI 7 | GI 8 | GI 9 | GI 10 | |||
| Ecological | 1. Optimizing storm-water management | |||||||||||
| Increasing pervious surfaces. | Green infrastructure is suitable for handling rainfall. (Buishand, 2007), [81] Increased rainwater retention and flooding. (Wise et al., 2010, [82] | |||||||||||
| Minimizing, retaining and organically purifying rainwater runoff. | ||||||||||||
| 2. Reducing the urban heat island effect | ||||||||||||
| Increasing the percentage of green surfaces. | Lowering the mean radiant temperature via trees and other plants. (Jacobs et al., 2015), [83] | |||||||||||
| Applying evaporative materials on roof, walls and ground surfaces. | ||||||||||||
| 3. Air quality improvement (e.g., pollutant removal, altering wind flow) | ||||||||||||
| Implementing green impermeable screens in a street canyon and planting a higher concentration of green trees. | (Nowak et al., 2006 and Yang et al., 2008), [84,85] Green screens reduce air pollution in urban environments. (Pugh et al., 2012; Wise et al., 2010), [82,86] | |||||||||||
| 4. Noise quality improvement | ||||||||||||
| Applying a green sound barrier for limited and higher noise reductions (i.e., for limiting noise, thick hedges with a small piece of grassland can be provided and for higher noise, broadleaved deciduous trees and a thick border of bamboo can be provided). | Dense vegetation structures reduce noise intensity. (Samara and Tsitsoni, 2011), [87] Limited noise reduction. (Van Renterghem et al., 2014) [88] | |||||||||||
| 5. Reduced carbon emissions (e.g., avoiding greenhouse gas emission through cooling) | ||||||||||||
| Planting a higher concentration of trees for shade and using evaporating material for hard landscaping. | Urban green spaces lower emissions. (Weilenmann et al., 2005) [89] | |||||||||||
| 6. Improve energy efficiency in buildings | ||||||||||||
| Optimize green energy0saving techniques. | Green roofs improve building energy consumption. (Mentens, 2006; Akbari and Taha, 1992), [90,91] | |||||||||||
| 7. Enhanced soil quality and erosion. | ||||||||||||
| Intensification of permeable surfaces and optimization of soil stability. | (McKinney, 2006), [92] | |||||||||||
| 8. Enhance and protect urban biodiversity | ||||||||||||
| Promote the connectivity and mobility between urban green spaces. | Biodiversity is the baseline component in GI planning. (Weber et al., 2006), [93] Promoting conservation. (Adam,1994), [94] | |||||||||||
| Socio-cultural | 1. Food production (e.g., urban agriculture, kitchen gardens, and community gardens) | Gardening offers relief from work stress. (Hartig et al.,2014), [95] Introducing urban food forestry. (Clark and Nicholas, 2013), [96] | ||||||||||
| 2. Improving social well-being. | ||||||||||||
| Optimizing the opportunities for recreation and social interaction and enhancing the attractiveness of the city. | Green spaces should be close to residences and enhance city attractiveness. (Giles-Corti et al., 2005), [97] Taking ownership of green spaces. (Weldon et al., 2007), [98] | |||||||||||
| Enhanced attractiveness of the city (diverse landscape features). | ||||||||||||
| 3. Improving physical and mental well-being (i.e., visual and physical access to green spaces have a positive relationship with stress reduction and anxiety). | Green exercise is more psychologically beneficial. (Pretty et al., 2005, Bratman et al., 2015), [99,100] Neighborhoods living with a higher density of trees (Kardan et al., 2017), [101] | |||||||||||
| 4. The provision of outdoor sites for education and research. | (McDonnell et al.,2008), [102] | |||||||||||
| 5. Improving accessibility and connectivity to encourage cycling and walking opportunities. | People walk 20% more in green spaces. (De Vries et al., 2010), [103] | |||||||||||
| Economic indicators | 1. Amplified property values. | (Shoup and Ewing 2010), [104] | ||||||||||
| 2. Savings in healthcare cost. | (Shoup and Ewing 2010), [104] | |||||||||||
| 3. Reduced energy consumption (e.g., cooling and heating demands). | (Weilenmann et al., 2005) (Mentens, 2006, Akbari and Taha, 1992), [89,90,91] | |||||||||||
| 4. Reduced risk of flood damage. | (Gordon-Walker et al., 2007; Wise et al., 2010). [82,105] | |||||||||||
| 5. Reducing private car use by increased walking and cycling (e.g., shifting travel mode). | (McPherson and Muchnick, 2005; De Vries et al., 2010), [103,106] | |||||||||||
| 6. Value of air pollutant removal/ avoidance. | (Pugh et al., 2012; Wise et al., 2010), [82,86] | |||||||||||
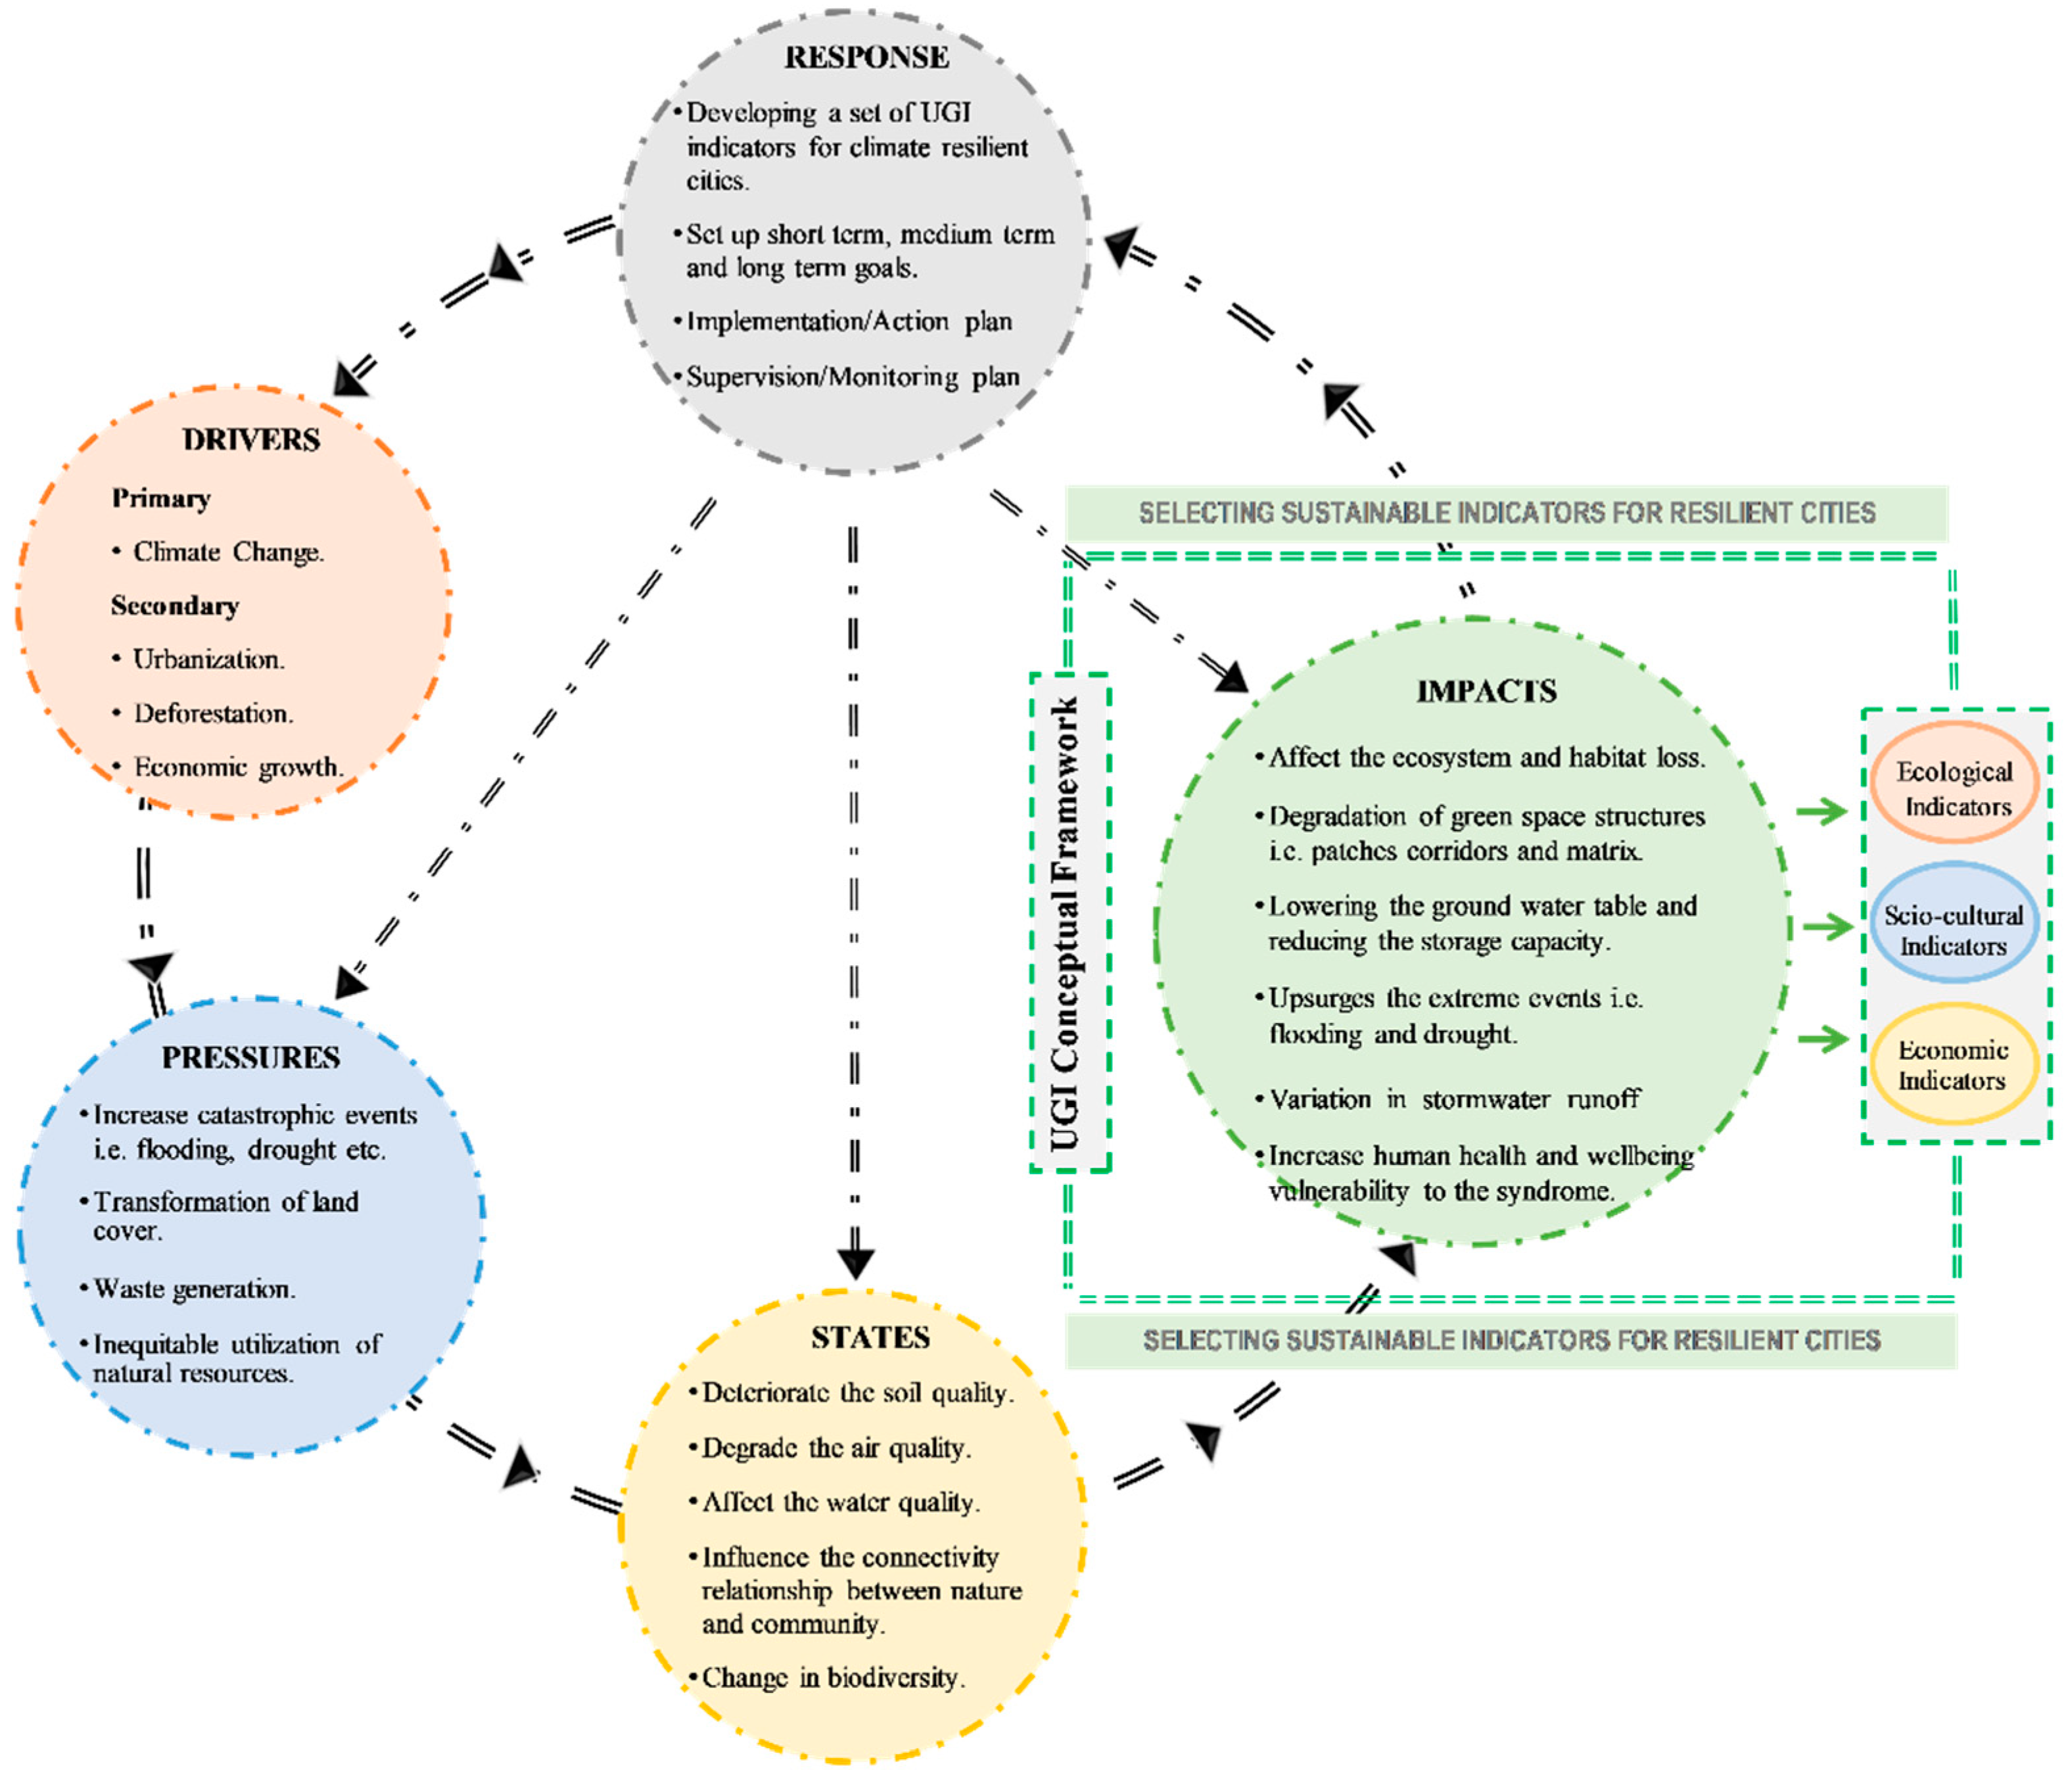
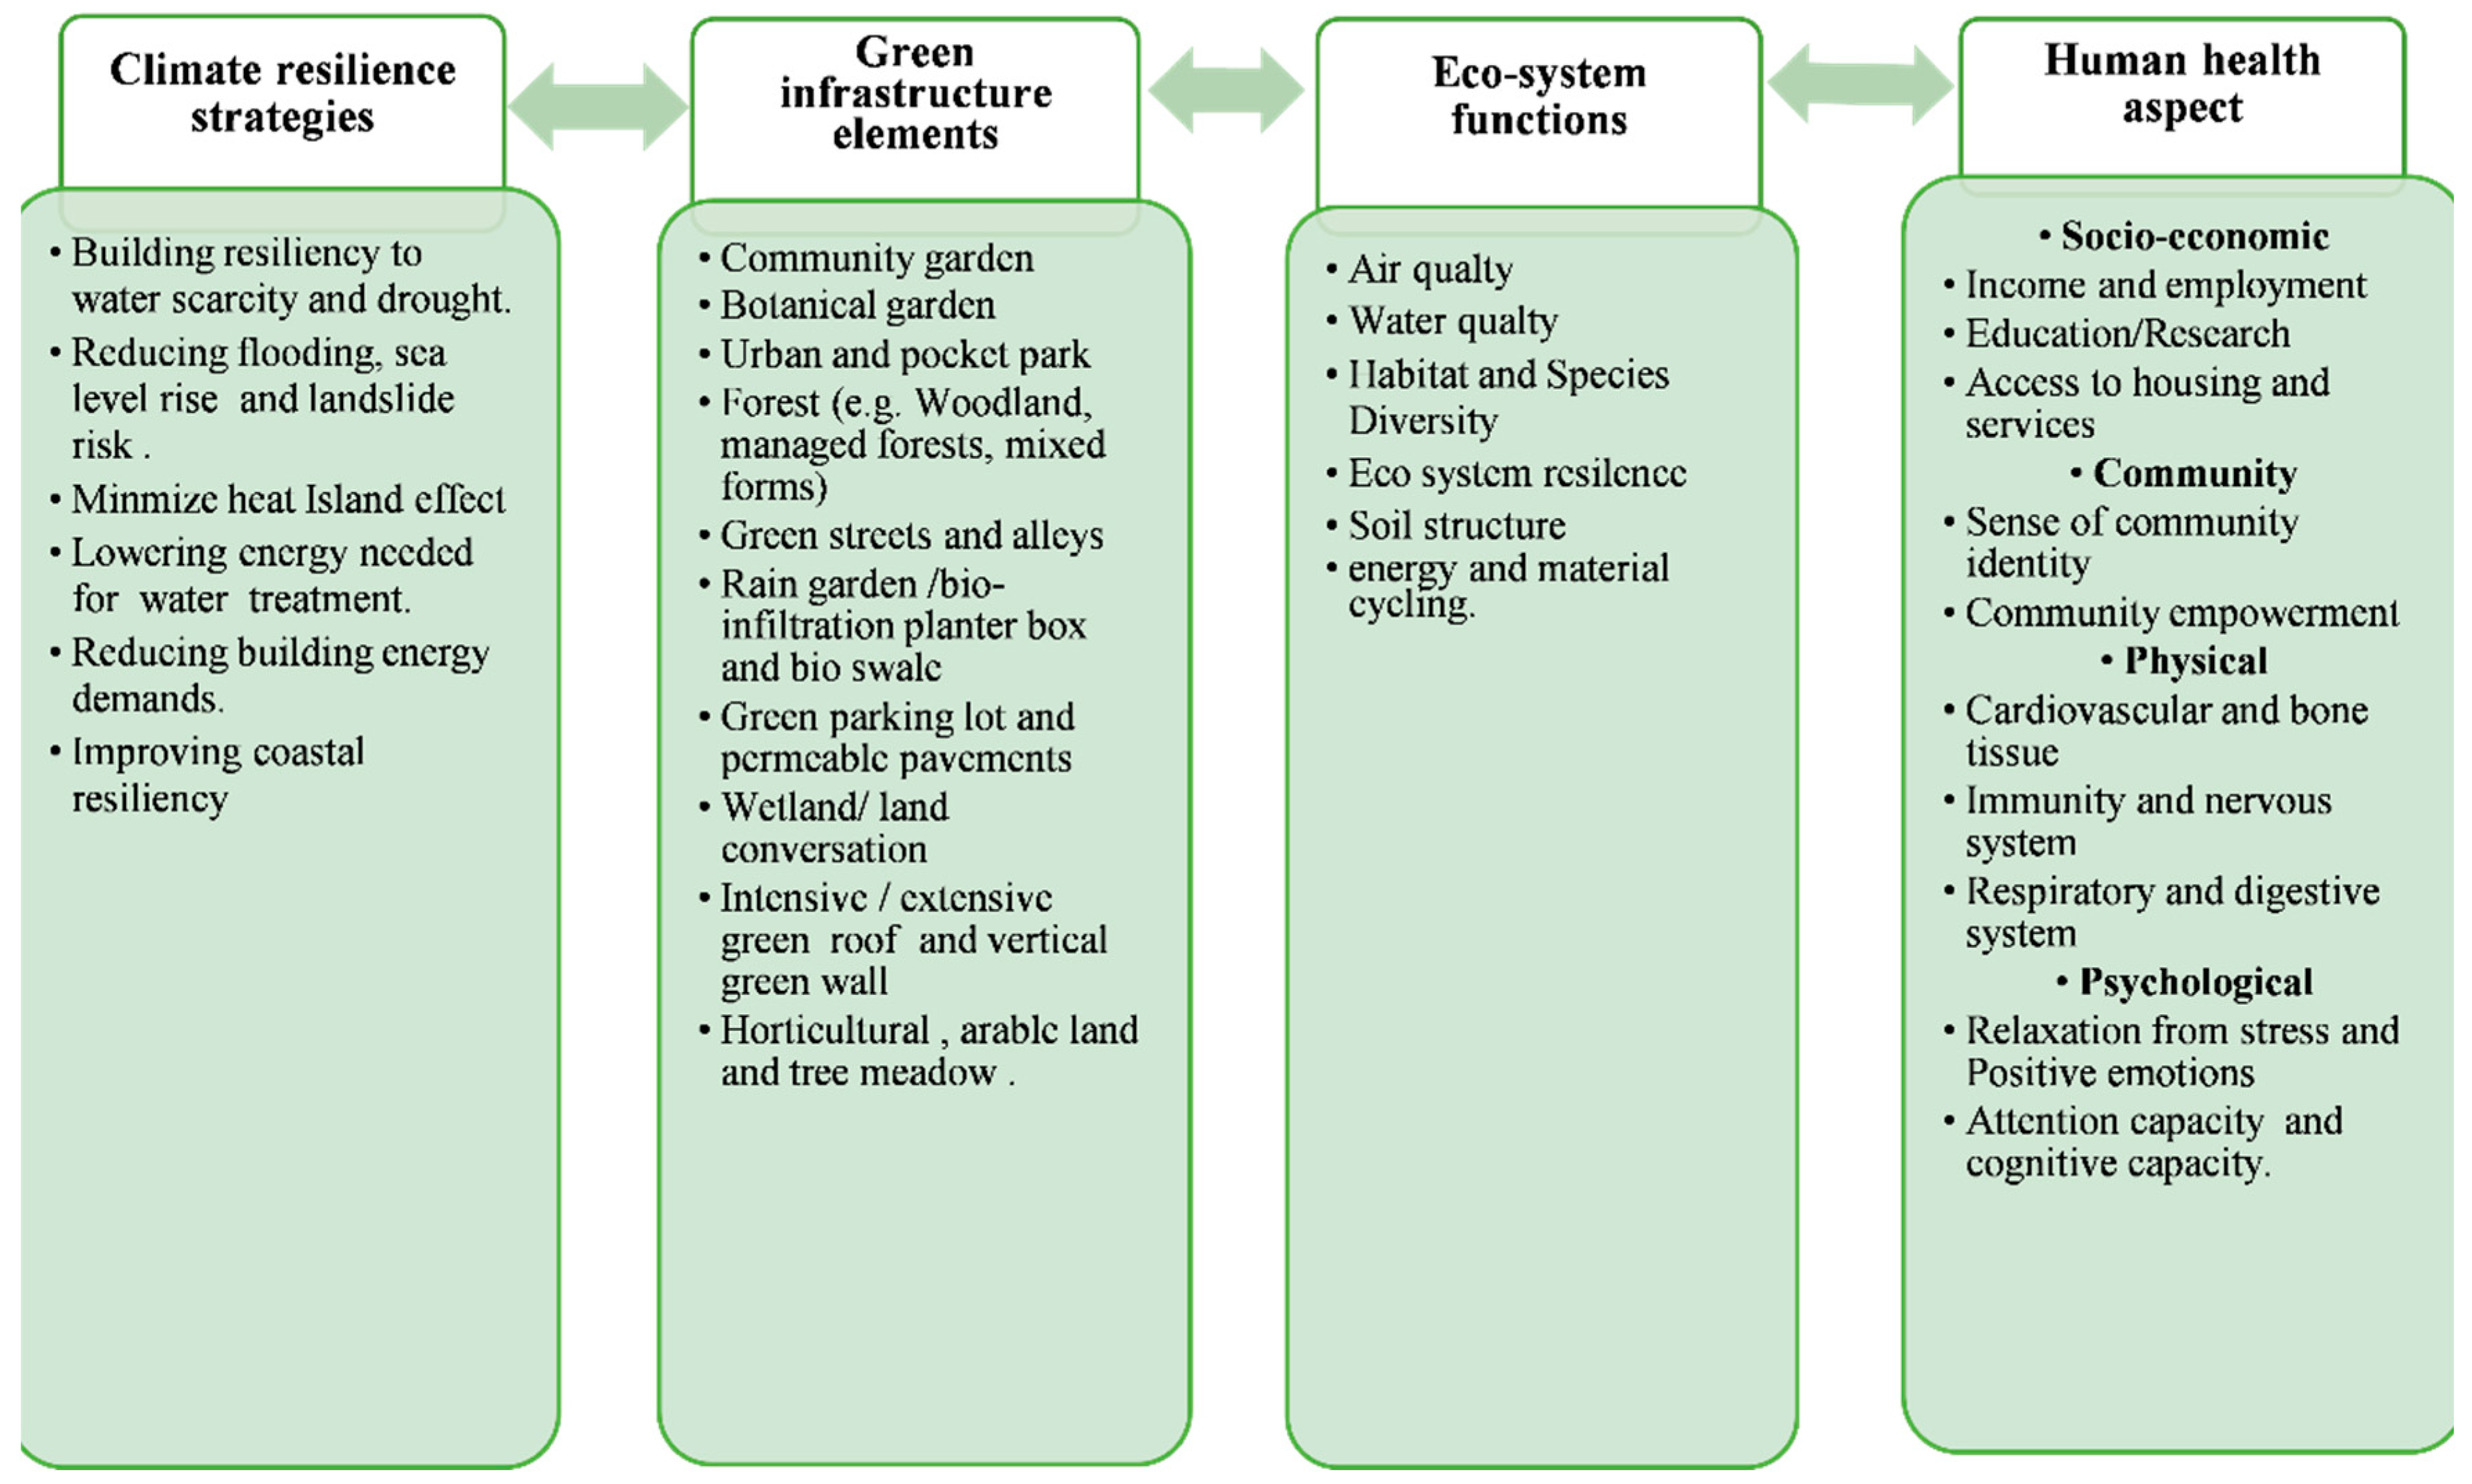
Appendix B. Development of Conceptual Base Frameworks


Appendix C

Appendix D

Appendix E
- “What does climate change mean for you”?
- “What does adaptation to climate change mean for you”?
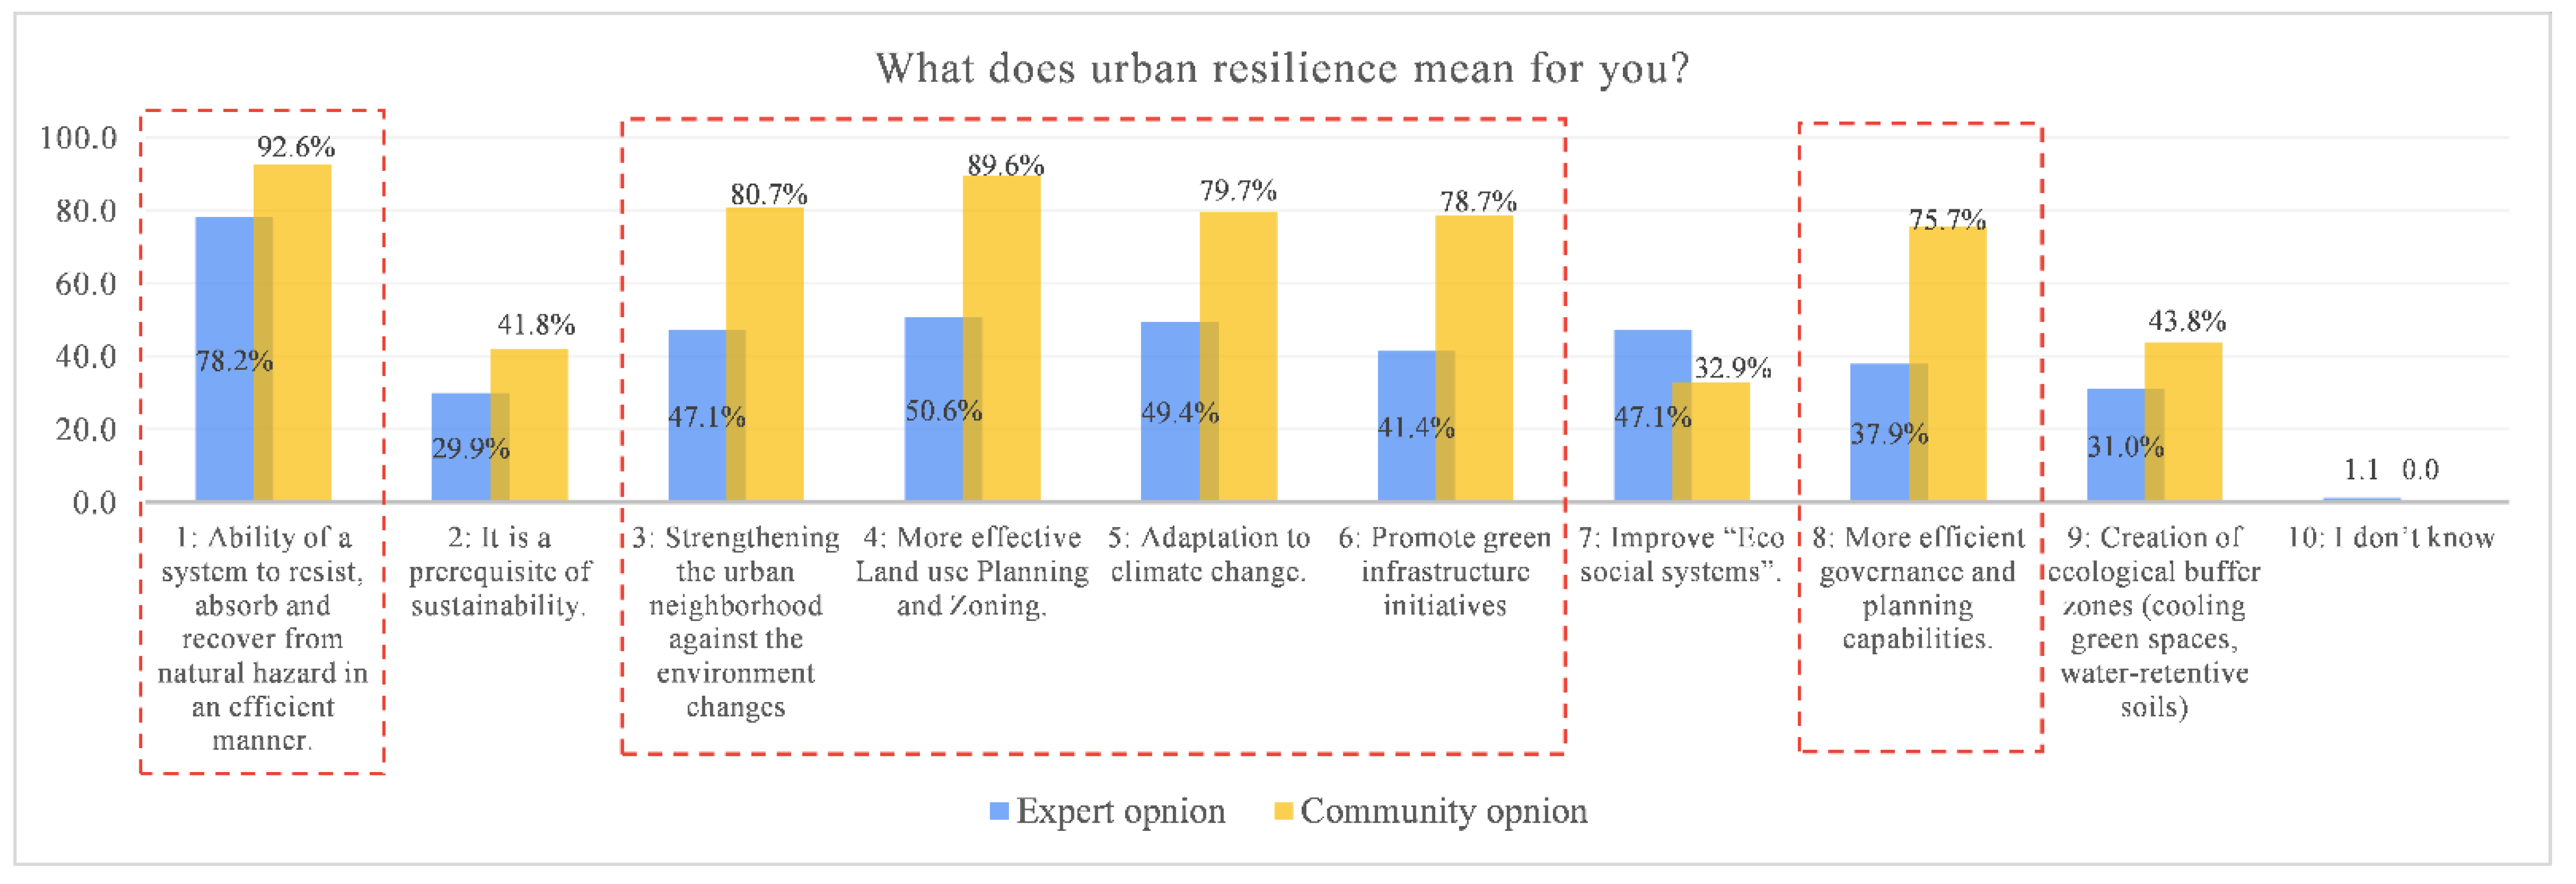
- “What does urban resilience mean for you”?
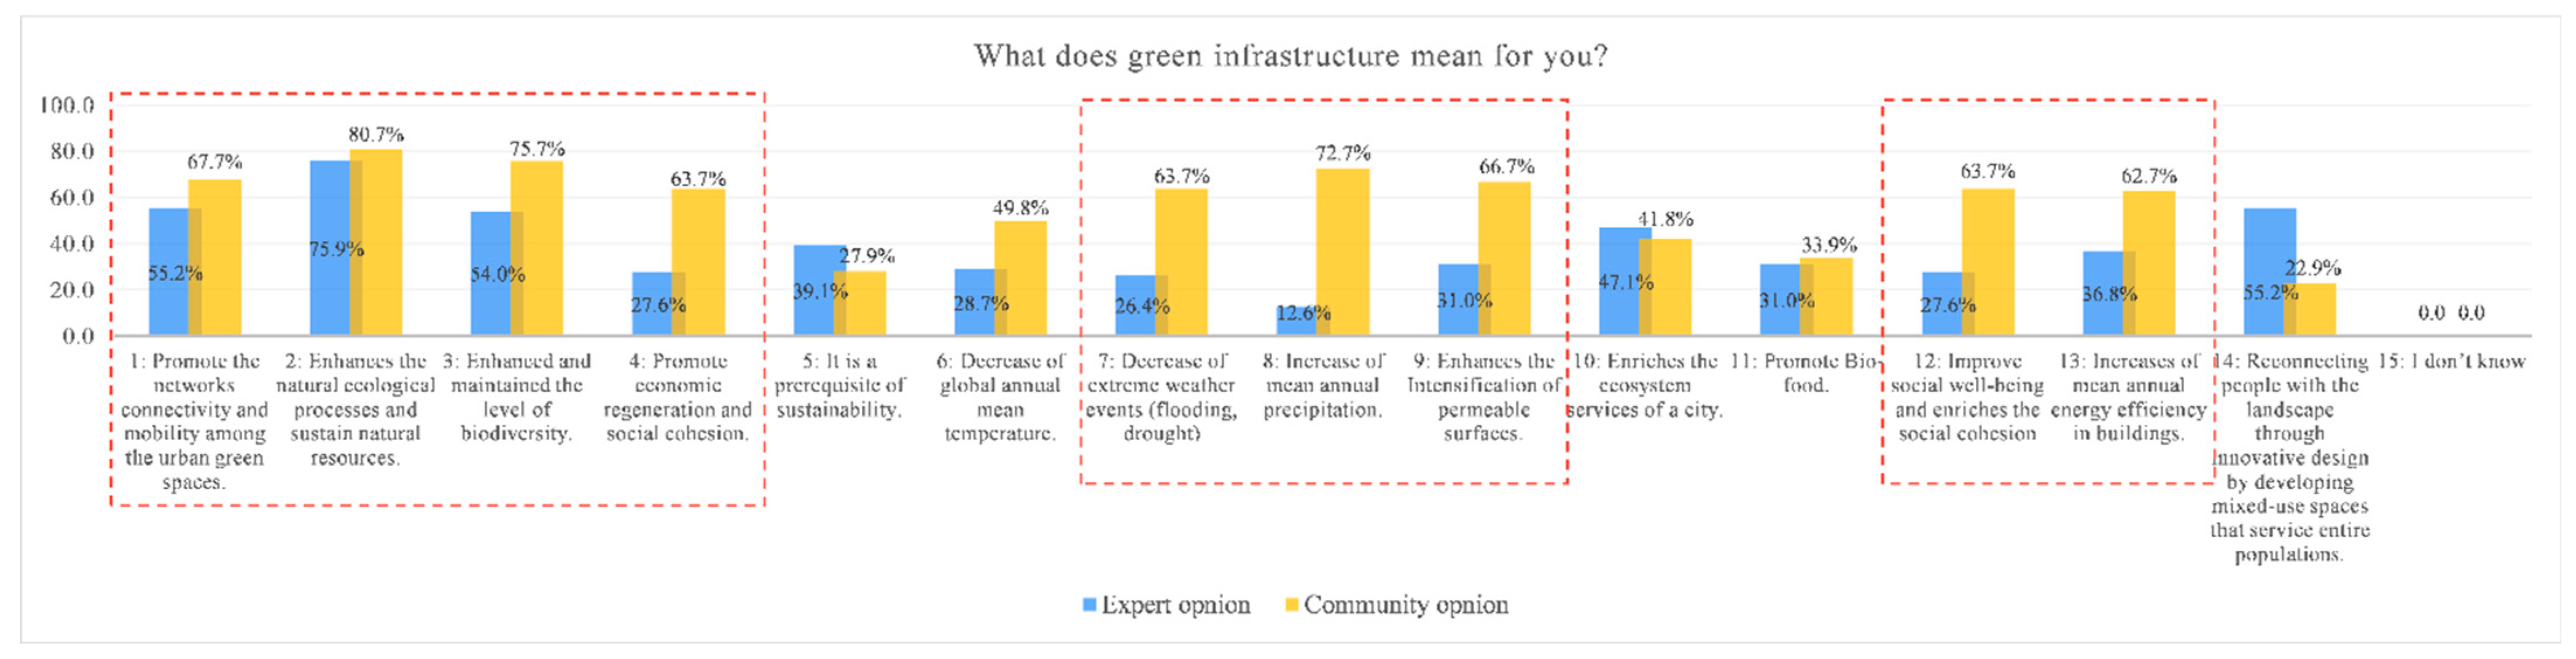
- “What does green infrastructure mean for you”?
Appendix F
| District | Tehsil (Selection Based on a High Urban Population) | Tehsil Population | Union Council Population (Selection Based on a High Urban Population with the Integration of the Interquartile Range Technique (IQR) | Sample size Population with 95 CI and + 5 Margins of Error | Average HH Size (Source: KP Bureau of Statistics) | HH Sample 399.6/6.2 399.5/7 339.7/5.6 |
|---|---|---|---|---|---|---|
| Mardan | Mardan | 1,403,394 | 411,148 | 399.6 | 6.2 | 64 |
| Charsadda | Charsadda | 804,194 | 350,483 | 399.5 | 7 | 57 |
| Peshawar | Town3 | 8,210,59 | 575,409 | 399.7 | 5.6 | 71 |
References
- EC-European Commission. Towards an EU Research and Innovation Policy Agenda for Nature-Based Solutions & Re-Naturing Cities, Final Report of the Horizon 2020 Expert Group on Nature-Based Solutions and Re-Naturing Cities; European Commission: Brussels, Belgium, 2015. [Google Scholar]
- European Union. Green Infrastructure (GI)–Enhancing Europe’s Natural Capital; European Commission: Brussels, Belgium, 2013. [Google Scholar]
- Mazza, L.; Bennett, G.; De Nocker, L.; van Diggelen, R. Green Infrastructure Implementation and Efficiency; Final Report for the European Commission, DG Environment on Contract ENV.B.2/SER/2010/0059; Institute for European Environmental Policy: Brussels, Belgium, 2011. [Google Scholar]
- Matthews, T.; Lo, A.Y.; Byrne, J.A. Reconceptualizing green infrastructure for climate change adaptation: Barriers to adoption and drivers for uptake by spatial planners. Landsc. Urban Plan. 2015, 138, 155–163. [Google Scholar] [CrossRef]
- USEPA. Green Infrastructure Case Studies: Municipal Policies for Managing Stormwater with Green Infrastructure; EPA (USA): Washington, DC, USA, 2010.
- Ahern, J. Green infrastructure for cities: The spatial dimension. In Cities of the Future: Towards Integrated Sustainable Water and Landscape Management; IWA Publishing: London, UK; Citeseer: Princeton, NJ, USA, 2007. [Google Scholar]
- IPCC. Managing the Risks of Extreme Events and Disasters to Advance Climate Change Adaptation Special, Managing the Risks of Extreme Events and Disasters to Advance Climate Change Adaptation: Special Report of the Intergovernmental Panel on Climate Change; Cambridge University Press: Cambridge, UK, 2012. [Google Scholar] [CrossRef] [Green Version]
- IPCC. Climate Change: Impacts, Adaptation and Vulnerability; Cambridge University Press: Cambridge, UK, 2014. [Google Scholar] [CrossRef] [Green Version]
- Desa, U.N. World Urbanization Prospects, the 2011 Revision, Population Division; Department of Economic and Social Affairs, United Nations Secretariat: New York City, NY, USA, 2014. [Google Scholar]
- Desa, U.N. World Urbanization Prospects 2018: Highlights (ST/ESA/SER. A/421)2019’; United Nations: New York City, NY, USA, 2019. [Google Scholar]
- Mell, I.; Allin, S.; Reimer, M.; Wilker, J. Strategic Green Infrastructure Planning in Germany and the UK: A Transnational Evaluation of the Evolution of Urban Greening Policy and Practice. Int. Plan. Studies. 2017, 22, 333–349. [Google Scholar] [CrossRef] [Green Version]
- Lafortezza, R.; Davies, C.; Sanesi, G.; Konijnendijk, C.C. Green Infrastructure as a tool to support spatial planning in European urban regions. Ifor.-Biogeosci. For. SISEF-Ital. Soc. Silvic. For. 2013, 6, 102–108. [Google Scholar] [CrossRef] [Green Version]
- Monteiro, R.; Ferreira, J.C. Green Infrastructure Planning as a Climate Change and Risk Adaptation Tool in Coastal Urban Areas. J. Coast. Res. 2020, 95, 889–893. [Google Scholar] [CrossRef]
- TEP. Advancing the Delivery of Green Infrastructure: Targeting Issues in England’s NorthWest; The Environment Partnership: Helston, UK, 2005. [Google Scholar]
- Benedict, M.A.; McMahon, E.T. Green Infrastructure: Linking Landscapes and Communities, Urban Land; Island Press: Washington, DC, USA, 2006. [Google Scholar]
- MacFarlane, R.; Davies, C.; Roe, M. Green Infrastructure and the City Regions, Discussion Paper; NECF: Dunston, UK, 2005. [Google Scholar]
- Davies, C.; Macfarlane, R.; Mcgloin, C.; Roe, M. Green Infrastructure Planning Guide, Project: Final Report; WWF: Gland, Switzerland, 2006. [Google Scholar]
- Weber, T.C.; Allen, W.L. Beyond On-Site Mitigation: An Integrated, Multi-Scale Approach to Environmental Mitigation and Stewardship for Transportation Projects, Landscape and Urban Planning; Elsevier: Amsterdam, The Netherlands, 2010. [Google Scholar]
- Gill, S.E.; Handley, J.F.; Ennos, A.R.; Pauleit, S. Adapting cities for climate change: The role of the green infrastructure. Built Environ. 2007, 33, 115–133. [Google Scholar] [CrossRef] [Green Version]
- Rayan, M.; Gruehn, D.; Khayyam, U. Green infrastructure indicators to plan resilient urban settlements in Pakistan: Local stakeholder’s perspective. Urban Clim. 2021, 38, 100899. [Google Scholar] [CrossRef]
- Naeem, S.; Cao, C.; Fatima, K.; Najmuddin, O.; Acharya, B.K. Landscape greening policies-based land use/land cover simulation for Beijing and Islamabad-An implication of sustainable urban ecosystems. Sustainability 2018, 10, 1049. [Google Scholar] [CrossRef] [Green Version]
- Waseem, S.; Khayyam, U. Loss of vegetative cover and increased land surface temperature: A case study of Islamabad, Pakistan. J. Clean. Prod. 2019, 234, 972–983. [Google Scholar] [CrossRef]
- Khayyam, U.; Waseem, S. Carbon emission as a result of forest land change in Islamabad, Pakistan. In Climate Change Science; Elsevier: Amsterdam, The Netherlands, 2021; pp. 41–57. [Google Scholar]
- Greiving, S.; Fleischhauer, M. Climate resilience and environmental justice: State of research and implementation in planning practice in Germany and beyond. Town Plan. Rev. 2022, 93, 111–137. [Google Scholar] [CrossRef]
- Kuhlicke, C.; Albert, C.; Bachmann, D.; Birkmann, J.; Borchardt, D.; Fekete, A.; Greiving, S.; Hartmann, T.; Hansjürgens, B.; Jüpner, R.; et al. Five Principles for Climate-Proof Municipalities and Cities. 2021. Available online: https://www.ufz.de/index.php?en=48382 (accessed on 3 June 2022).
- Greiving, S. Resilience/Robustness. 2018. Available online: https://nbn-resolving.org/urn:nbn:de:0156-559919109 (accessed on 3 June 2022).
- Greiving, S. Spatial planning and dealing with uncertainties associated with future disasters. In Spatial Planning and Resilience Following Disasters: International and Comparative Perspectives; Policy Press: Bristol, UK, 2016; p. 321. [Google Scholar]
- Baycan-Levent, T.; Van Leeuwen, E.; Rodenburg, C.; Nijkamp, P. Development and management of green spaces in European cities: A comparative analysis. Res. Memo. 2002, 2002, 25. [Google Scholar]
- CABE. Community-Led Spaces: A Guide for Local Authorities and Community Groups; CABE Space: London, UK, 2010. [Google Scholar]
- Davidson, S. Spinning the wheel of empowerment. Planning 1998, 1262, 14–15. [Google Scholar]
- Harnik, P. The excellent city park system: What makes it great and how to get there. In The Human Metropolis: People and Nature in the 21st-Century City; University of Massachusetts: Amherst, MA, USA, 2006. [Google Scholar]
- Kim, T.-B. Collaborative Governance for Sustainable Development in Urban Planning in South Korea; University of Birmingham: Birmingham, UK, 2010. [Google Scholar]
- Enger, S.C. Planning for Parks, Recreation, and Open Space in Your Community; Washington State Department of Community, Trade and Economic Development: Washington, DC, USA, 2005. [Google Scholar]
- Munir, R.; Khayyam, U.; Adil, I.H. Perceptions of Glacier Grafting: An Indigenous Technique of Water Conservation for Food Security in Gilgit-Baltistan, Pakistan. Sustainability 2021, 13, 5208. [Google Scholar] [CrossRef]
- Fors, H.; Molin, J.F.; Murphy, M.A.; van den Bosch, C.K. User participation in urban green spaces—For the people or the parks? Urban Urban Green 2015, 14, 722–734. [Google Scholar] [CrossRef] [Green Version]
- Rayan, M.; Khayyam, U.; Gruehn, D. Local Perspectives on Green Resilient Settlements in Pakistan. In CIGOS 2021, Emerging Technologies and Applications for Green Infrastructure. Lecture Notes in Civil Engineering; Ha-Minh, C., Tang, A.M., Bui, T.Q., Vu, X.H., Huynh, D.V.K., Eds.; Springer: Berlin/Heidelberg, Germany, 2022; Volume 203. [Google Scholar] [CrossRef]
- Khayyam, U. Floods: Impacts on livelihood, economic status and poverty in the north-west region of Pakistan. Nat. Hazards 2020, 102, 1033–1056. [Google Scholar] [CrossRef]
- Rayan, M.; Gruehn, D.; Khayyam, U. Green Infrastructure Planning. A Strategy to Safeguard Urban Settlements in Pakistan. In Planning in Germany and Iran. Responding Challenges of Climate Change through Intercultural Dialogue; Jafari, M., Gruehn, D., Sinemillioglu, H., Kaiser, M., Eds.; Mensch und Buch Verlag: Berlin, Germany, 2021; pp. 197–220. [Google Scholar]
- PBS. Pakistan Bureau of Statistics, Urban Demographic. 2018. Available online: http://www.pbs.gov.pk/ (accessed on 11 December 2020).
- Jan, B.; Iqbal, M. Urbanization trend and urban population projections of Pakistan using weighted approach. Sarhad J. Agric. 2008, 24, 173–180. [Google Scholar]
- Haider, M.; Badami, M.G. Urbanization and Local Governance Challenges in Pakistan. Environment and Urbanization ASIA; SAGE Publications: New Delhi, India, 2010; Volume 1, pp. 81–96. [Google Scholar]
- UN-OCHA. Pakistan Flood Relief and Early Recovery Response plan; United Nations Office for the Coordination of Humanitarian Affairs: New York, NY, USA, 2010. [Google Scholar]
- Khayyam, U.; Noureen, S. Assessing the adverse effects of flooding for the livelihood of the poor and the level of external response: A case study of Hazara Division, Pakistan. Environ. Sci. Pollut. Res. 2020, 27, 19638–19649. [Google Scholar] [CrossRef]
- Eckstein, D.; Künzel, V.; Schäfer, L. Global Climate Risk Index 2021. Who Suffers Most from Extreme Weather Events? Weather-Related Loss Events in 2019 and 2000–2019. 2020. Available online: http://germanwatch.org/en/download/8551.pdf (accessed on 11 June 2021).
- NDMA. National Disaster Management Authority, Annual Report 2010; NDMA: Islamabad, Pakistan, 2010. [Google Scholar]
- Khayyam, U.; Munir, R. Flood in mountainous communities of Pakistan: How does it shape the livelihood and economic status and government support? Environ. Sci. Pollut. Res. 2022, 29, 40921–40940. [Google Scholar] [CrossRef]
- Atta-ur-Rahman; Khan, A.N. Analysis of 2010-flood causes, nature and magnitude in the Khyber Pakhtunkhwa, Pakistan. Nat. Hazards 2013, 66, 887–904. [Google Scholar] [CrossRef]
- Khayyam, U. What (Not) Advances Effective Community-Driven Development? A Socio-Economic & Politico-Cultural Analysis of the Pashtun Ethnic Society of FATA, Pakistan. Ph.D. Thesis, Universität Münster, Münster, Germany, 2016. [Google Scholar]
- Alvi, S.; Khayyam, U. Mitigating and adapting to climate change: Attitudinal and behavioural challenges in South Asia. Int. J. Clim. Chang. Strateg. Manag. 2020, 12, 477–493. [Google Scholar] [CrossRef]
- Ahmad, N.; Anjum, G.A. Legal and institutional perplexities hampering the implementation of urban development plans in Pakistan. Cities 2012, 29, 271–277. [Google Scholar] [CrossRef]
- Hussnain, M.Q.; Anjum, G.A.; Wakil, K.; Tharanga, P.H. Improving Efficiency in Data Collection for Urban Development Plans through Information and Communication Technology. In Proceedings of the International Conference on Town Planning and Urban Management (ICTPUM), Lahore, Pakistan, 29–30 September 2014. [Google Scholar]
- Wakil, K.; Hussnain, M.Q.; Yusuf, A.; Abdul Jabbar, J. Project Report: Scenario Planning based Participatory Urban Growth Management Plans Using ICT. Islamabad. 2016. Available online: https://think-asia.org/handle/11540/7573 (accessed on 11 June 2022).
- Demuzere, M.; Orru, K.; Heidrich, O.; Olazabal, E.; Geneletti, D.; Orru, H.; Bhave, A.G.; Mittal, N.; Feliú, E.; Faehnle, M. Mitigating and adapting to climate change: Multi-functional and multi-scale assessment of green urban infrastructure. J. Environ. Manag. 2014, 146, 107–115. [Google Scholar] [CrossRef] [PubMed]
- MapAction, UN-OCHA. United Nations Office for the Coordination of Humanitarian Affairs New York: Pakistan / Kyber-Pakhtunkhwa: Flood Extent (2 Sept 2010) and Flood Affected. Available online: https://reliefweb.int/map/pakistan/pakistan-kyber-pakhtunkhwa-flood-extent-2-sept-2010-and-flood-affected-districts-31-aug (accessed on 11 December 2020).
- Sturiale, L.; Scuderi, A. The role of green infrastructures in urban planning for climate change adaptation. Climate 2019, 7, 119. [Google Scholar] [CrossRef] [Green Version]
- UN-SDG. The Sustainable Development Goals Report: United Nations Department of Economic and Social Affairs. 2019. Available online: https://www.un-ilibrary.org/content/books/9789210478878/read (accessed on 6 December 2021).
- Ahsan, A. Urban Flood Risk Management in Pakistan. Islamabad: Daily Times. 2018. Available online: https://dailytimes.com.pk/280433/urban-flood-risk-management-in-pakistan/ (accessed on 8 June 2021).
- Bano, R.; Khayyam, U. Industrial air pollution and self-reported respiratory and irritant health effects on adjacent residents: A case study of Islamabad Industrial Estate (IEI). Air Qual. Atmos. Health 2021, 14, 1709–1722. [Google Scholar] [CrossRef]
- Mensah, C.A. Destruction of urban green spaces: A problem beyond urbanization in Kumasi city (Ghana). Am. J. Environ. Prot. 2014, 3, 1–9. [Google Scholar] [CrossRef] [Green Version]
- Naveed, Z.; Khayyam, U. Smog and cognitive issues in the school going children of Lahore and Islamabad, Pakistan. Int. J. Environ. Sci. Technol. 2022, 1–16. [Google Scholar] [CrossRef]
- Ashfaque, R.; Awan, M. Final Report-Policy and Legal Reform Study (GEF-Protected Areas Management Project); Ministry of Environment, Government of Pakistan: Islamabad, Pkistan, 2015.
- Nizamani, A.A.; Shah, A.A. A review of forest policy trends for community participation in Pakistan. Policy Trend Rep. 2004, 2004, 28–34. [Google Scholar]
- Iqbal, N. Supreme Court Orders Equal Benefits for Transvestites. 2009. Available online: https://www.dawn.com/news/477909/supreme-court-orders-equal-benefits-for-transvestites (accessed on 13 May 2021).
- Guramani, N. National Assembly passes bill seeking protection of transgender rights. In: DAWN. 2018. Available online: https://www.dawn.com/news/1406400 (accessed on 13 May 2021).
- Guramani, N. Senate Unanimously Approves Bill Empowering Transgenders to Determine Their Own Identity. 2018. Available online: https://www.dawn.com/news/1393766 (accessed on 13 May 2021).
- Beattie, A.; Hek, G.; Ross, K.; Galvin, K. Future Career Pathways in Nursing and Midwifery. A Delphi Survey of Nurses and Midwives in South West England, NT Research; SAGE Publications: London, UK, 2004. [Google Scholar] [CrossRef]
- Monette, D.R.; Sullivan, T.J.; DeJong, C.R. Applied Social Research: A Tool for the Human Services; Nelson Education: Scarborough, ON, Canada, 2013. [Google Scholar]
- Wan, X.; Wang, W.; Liu, J.; Tong, T. Estimating the sample mean and standard deviation from the sample size, median, range and/or interquartile range. BMC Med. Res. Methodol. 2014, 14, 135. [Google Scholar] [CrossRef] [Green Version]
- Luo, D.; Wan, X.; Liu, J.; Tong, T. Optimally estimating the sample mean from the sample size, median, mid-range, and/or mid-quartile range. Stat. Methods Med. Res. 2016, 27, 1785–1805. [Google Scholar] [CrossRef] [Green Version]
- Chinyio, E.A.; Olomolaiye, P.O.; Corbett, P. Quantification of construction clients’ needs through paired comparisons. J. Manag. Eng. 1998, 14, 87–92. [Google Scholar] [CrossRef]
- Adetunji, I.O. Sustainable Construction: A Web-Based Performance Assessment Tool. Ph.D. Thesis, Loughborough University, Loughborough, UK, 2005. [Google Scholar]
- Gavu, E.K. Understanding Location and Neighbourhood Effects: An Analysis of the Housing Submarkets in Accra–Ghana; Technische Universität Dortmund: Dortmund, Germany, 2021. [Google Scholar]
- Braimah, N.; Ndekugri, I. Consultants’ Perceptions on Construction Delay Analysis Methodologies. J. Constr. Eng. Manag.-Asce 2009, 135, 1279–1288. [Google Scholar] [CrossRef]
- Akadiri, O.P. Development of a Multi-Criteria Approach for the Selection of Sustainable Materials for Building Projects; University of Wolverhampton: Wolverhampton, UK, 2011. [Google Scholar]
- Foster, J.; Lowe, A.; Winkelman, S. The value of green infrastructure for urban climate adaptation. Cent. Clean Air Policy 2011, 750, 1–52. [Google Scholar]
- Rouse, D.C.; Bunster-Ossa, I.F. Green Infrastructure: A Landscape Approach; American Planning Association: Chicago, IL, USA, 2013. [Google Scholar]
- Rayan, M.; Gruehn, D.; Khayyam, U. Planning for Sustainable Green Urbanism: An Empirical Communal-Based Study on Green Infrastructure Indicators in Pakistan. Land Use Policy 2022. under review. [Google Scholar]
- UNDP-Pakistan. Development Advocate Pakistan. Sustain. Urbanization. 2018. Available online: https://www.undp.org/pakistan/publications/sustainable-urbanization (accessed on 16 August 2021).
- UNDP-Pakistan. Development Advocate Pakistan, Population Growth: Implications for Human Development. 2019. Available online: https://www.pk.undp.org/content/pakistan/en/home/library/development_policy/dap-vol6-iss1-population-growth.html (accessed on 16 August 2021).
- Pauleit, S.; Ambrose-Oji, B.; Andersson, E.; Anton, B.; Buijs, A.; Haase, D.; Elands, B.; Hansen, R.; Kowarik, I.; Kronenberg, J.; et al. Advancing urban green infrastructure in Europe: Outcomes and reflections from the GREEN SURGE project. Urban For. Urban Green. 2019, 40, 4–16. [Google Scholar] [CrossRef]
- Buishand, A.; Wijngaard, J. Statistiek van Extreme Neerslag Voor Korte Neerslagduren; KNMI: De Bilt, The Netherlands, 2007.
- Wise, S.; Braden, J.; Ghalayini, D.; Grant, J.; Kloss, C.; MacMullan, E.; Morse, S.; Montalto, F.; Nees, D.; Nowak, D.; et al. Integrating valuation methods to recognize green infrastructure’s multiple benefits. In Low Impact Development 2010: Redefining Water in the City; ASCE Publications: Reston, VA, USA, 2010; pp. 1123–1143. [Google Scholar]
- Jacobs, C.; Elbers, J.; Brolsma, R.; Hartogensis, O.; Moors, E.; Márquez, M.T.R.-C.; van Hove, B. Assessment of evaporative water loss from Dutch cities. Build. Environ. 2015, 83, 27–38. [Google Scholar] [CrossRef]
- Nowak, D.J.; Crane, D.E.; Stevens, J.C. Air pollution removal by urban trees and shrubs in the United States. Urban For. Urban Green. 2006, 4, 115–123. [Google Scholar] [CrossRef]
- Yang, J.; Yu, Q.; Gong, P. Quantifying air pollution removal by green roofs in Chicago. Atmospheric Environ. 2008, 42, 7266–7273. [Google Scholar] [CrossRef]
- Pugh, T.A.M.; MacKenzie, A.R.; Whyatt, J.D.; Hewitt, C.N. Effectiveness of Green Infrastructure for Improvement of Air Quality in Urban Street Canyons. Environ. Sci. Technol. 2012, 46, 7692–7699. [Google Scholar] [CrossRef] [Green Version]
- Samara, T.; Tsitsoni, T. The effects of vegetation on reducing traffic noise from a city ring road. Noise Control Eng. J. 2011, 59, 68–74. [Google Scholar] [CrossRef]
- Van Renterghem, T.; Botteldooren, D.; Verheyen, K. Road traffic noise shielding by vegetation belts of limited depth. J. Sound Vib. 2012, 331, 2404–2425. [Google Scholar] [CrossRef] [Green Version]
- Weilenmann, M.F.; Vasic, A.-M.; Stettler, P.; Novak, P. Influence of Mobile Air-Conditioning on Vehicle Emissions and Fuel Consumption: A Model Approach for Modern Gasoline Cars Used in Europe. Environ. Sci. Technol. 2005, 39, 9601–9610. [Google Scholar] [CrossRef]
- Mentens, J.; Raes, D.; Hermy, M. Green roofs as a tool for solving the rainwater runoff problem in the urbanized 21st century? Landsc. Urban Plan. 2006, 77, 217–226. [Google Scholar] [CrossRef]
- Akbari, H.; Taha, H. The impact of trees and white surfaces on residential heating and cooling energy use in four Canadian cities. Energy 1992, 17, 141–149. [Google Scholar] [CrossRef]
- McKinney, M.L. Urbanization as a major cause of biotic homogenization. Biol. Conserv. 2006, 127, 247–260. [Google Scholar] [CrossRef]
- Weber, T.; Sloan, A.; Wolf, J. Maryland’s Green Infrastructure Assessment: Development of a comprehensive approach to land conservation. Landsc. Urban Plan. 2006, 77, 94–110. [Google Scholar] [CrossRef]
- Adams, L.W. In our own backyard. J. Urban For. 1994, 92, 24–25. [Google Scholar]
- Hartig, T.; Mitchell, R.; de Vries, S.; Frumkin, H. Nature and Health. Annu. Rev. Public Health 2014, 35, 207–228. [Google Scholar] [CrossRef] [Green Version]
- Clark, K.H.; Nicholas, K.A. Introducing urban food forestry: A multifunctional approach to increase food security and provide ecosystem services. Landsc. Ecol. 2013, 28, 1649–1669. [Google Scholar] [CrossRef] [Green Version]
- Giles-Corti, B.; Broomhall, M.H.; Knuiman, M.; Collins, C.; Douglas, K.; Ng, K.; Lange, A.; Donovan, R.J. Increasing walking: How important is distance to, attractiveness, and size of public open space? Am. J. Prev. Med. 2005, 28, 169–176. [Google Scholar] [CrossRef]
- Weldon, S.; Bailey, C.; O’Brien, E. New Pathways for Health and Well-Being in Scotland: Research to Understand and Overcome Barriers to Accessing Woodlands; Report to Forestry Commission Scotland: Edinburgh, UK, 2007.
- Pretty, J.; Peacock, J.; Sellens, M.; Griffin, M. The mental and physical health outcomes of green exercise. Int. J. Environ. Health Res. 2005, 15, 319–337. [Google Scholar] [CrossRef]
- Bratman, G.N.; Daily, G.C.; Levy, B.J.; Gross, J.J. The benefits of nature experience: Improved affect and cognition. Landsc. Urban Plan. 2015, 138, 41–50. [Google Scholar] [CrossRef]
- Kardan, O.; Gozdyra, P.; Misic, B.; Moola, F.; Palmer, L.J. Neighborhood greenspace and health in a large urban center. In Urban Forests; Apple Academic Press: New York, NY, USA, 2017; pp. 77–108. [Google Scholar]
- McDonnell, M.J.; Pickett, S.T.A.; Groffman, P.; Bohlen, P.; Pouyat, R.V.; Zipperer, W.C.; Parmelee, R.W.; Carreiro, M.M.; Medley, K. Ecosystem processes along an urban-to-rural gradient. In Urban Ecology; Springer: Boston, MA, 2008; pp. 299–313. [Google Scholar]
- De Vries, S.I.; Hopman-Rock, M.; Bakker, I.; HiraSing, R.A.; Van Mechelen, W. Built Environmental Correlates of Walking and Cycling in Dutch Urban Children: Results from the SPACE Study. Int. J. Environ. Res. Public Health 2010, 7, 2309–2324. [Google Scholar] [CrossRef] [PubMed] [Green Version]
- Shoup, L.; Ewing, R. The Economic Benefits of Open Space, Recreation Facilities and Walkable Community Design; A Research Synthesis; Active Living Research, a National Program of the Robert Wood Johnson Foundation: Princeton, NJ, USA, 2010. [Google Scholar]
- Gordon-Walker, S.; Harle, T.; Naismith, I. Cost-Benefit of SUDS Retrofit in Urban Areas; Environment Agency: Rotherham, UK, 2007.
- McPherson, E.G.; Muchnick, J. Effects Of Street Tree Shade On Asphalt Concrete Pavement Performance. Arboric. Urban For. 2005, 31, 303–310. [Google Scholar] [CrossRef]
- KPBOS. Khyber Paktunkhwa Bureau of Statistics. 2018. Available online: https://kpbos.gov.pk/ (accessed on 11 December 2020).


| Gender | Percentage (%) |  |
| Male | 54.1 | |
| Female | 45.9 | |
| Education | ||
| Primary education and below | 0 | |
| Secondary education | 0 | |
| Higher Secondary education | 0 | |
| Tertiary/Higher education | 93 | |
| Other | 7 | |
| Expertise | ||
| Building/Architecture | 40.1 | |
| Infrastructure | 11.0 | |
| Landscape planning | 9.3 | |
| Urban planning | 19.8 | |
| Horticulture/Arboriculture | 1.7 | |
| Climate change/Ecology | 8.1 | |
| Economy | 2.9 | |
| Sociology | 3.5 | |
| Other | 3.5 | |
| Professional Experience | ||
| Less than five years | 30.8 | |
| Five to ten years | 37.2 | |
| Eleven to fifteen years | 20.9 | |
| More than fifteen years | 11.0 |
| Gender | Percentage (%) |
|---|---|
| Masculine | 65.6 |
| Feminine | 22.4 |
| Diverse | - |
| Prefer not to say | 12 |
| Literacy | |
| No Education to Elementary | 0 |
| Secondary Education (SSC) | 7.3 |
| Intermediate | 19.3 |
| Higher Education | 73.4 |
| Other (informal) | 2.6 |
| Age | |
| Fifteen to twenty years old | 0 |
| Twenty to thirty years old | 34.4 |
| Thirty to forty years old | 43.8 |
| Forty to fifty years old | 21.9 |
| More than fifty years old | 7.3 |
| W = Likert scale weights: assigned by participants to each indicator (1 to 9). |
| N = Total number of samples |
| A = The highest value on a Likert scale. |
| RII = (9 × 74) + (8 × 26) + (7 × 47) + (6 × 22) + (5 × 10) + (−4 × 6) + (−3 × 3) + (−2 × 1) + (−1 × 3)/(192 × 9) = 0.780 |
| (as rated by a community member) |
| RII = (9 × 59) + (8 × 26) + (7 × 47) + (6 × 22) + (5 × 10) + (−4 × 2) + (−3 × 3) + (−2 × 0) + (−1 × 3)/(172 × 9) = 0.795 |
| (as rated by planning experts) |
| Categories | Urban Green Infrastructure Indicators | Community Members Prespective (C-P) (Group A) | Community Members’ + Planning Experts’ Prespectives | Planning Experts Prespective (E-P) (Group B) | |||||||
|---|---|---|---|---|---|---|---|---|---|---|---|
| Participants (N) | Overall Weight (W) | RII = Σ W/(N * A) | Mean (RII) (C-P + E-P) | UGI Indicator of ImportanceLevel | RII Average (Section-Wise) | Sustainability Dimension Importance Level | RII = Σ W/(N * A) | Total Weighted (W) | Respondents (N) | ||
| Ecological | i. Optimize storm water management. | ||||||||||
| Increasing pervious surfaces | 192 | 1441 | 0.834 | 0.836 | IMP | 0.835 | IMP | 0.837 | 1296.00 | 172.00 | |
| Minimizing, retaining and organically purifying rainwater runoff. | 192 | 1364 | 0.789 | 0.798 | M-IMP | 0.807 | 1250.00 | 172.00 | |||
| ii. Decreasing the impact of urban heat islands | |||||||||||
| Enhancing the quantity of the green spaces. | 192 | 1517 | 0.878 | 0.890 | IMP | 0.903 | 1398.00 | 172.00 | |||
| Use of evaporative materials on the roofs, walls, and floors. | 192 | 1287 | 0.745 | 0.742 | M-IMP | 0.740 | 1145.00 | 172.00 | |||
| iii. Enhancing air quality (e.g., extracting impurities). | |||||||||||
| Growing more green trees and installing a green barrier in a roadway. | 192 | 1339 | 0.775 | 0.787 | M-IMP | 0.800 | 1238.00 | 172.00 | |||
| iv. Enhancing noise quality | |||||||||||
| Use a green sonic wall to reduce the minimum and maximum noise pollution (i.e., thick hedges could be provided with a small meadow for minimum noise and, for maximum noise reduction, wide borders of bamboo and deciduous trees could be provided). | 192 | 1347 | 0.780 | 0.787 | M-IMP | 0.795 | 1230.00 | 172.00 | |||
| v. Lower emissions of carbon (e.g., elimination of greenhouse gas emissions via greenery) | |||||||||||
| Grow a greater density of trees for shade and use evaporating fabric for the paved surfaces. | 192 | 1513 | 0.876 | 0.890 | IMP | 0.904 | 1400.00 | 172.00 | |||
| vi. Enhancing building energy performance. | |||||||||||
| Promote green energy-saving strategies. | 192 | 1581 | 0.915 | 0.925 | E-IMP | 0.935 | 1448.00 | 172.00 | |||
| vii. Improved soil fertility and degradation condition. | |||||||||||
| Increase existing areas and plant trees to enhance soil stabilization. | 192 | 1473 | 0.852 | 0.859 | IMP | 0.865 | 1339.00 | 172.00 | |||
| viii. Improve and safeguard the urban ecology | |||||||||||
| Improve and strengthen urban green network connectivity. | 192 | 1428 | 0.826 | 0.833 | IMP | 0.840 | 1301.00 | 172.00 | |||
| Socio- cultural | i. Agri-production (e.g., home gardening; urban farming; and community farming) | 192 | 1411 | 0.817 | 0.819 | IMP | 0.795 | M-IMP | 0.822 | 1273.00 | 172.00 |
| ii. Enhancing social wellness. | |||||||||||
| Optimizing recreation and socialization activities. | 192 | 1402 | 0.811 | 0.825 | IMP | 0.839 | 1299.00 | 172.00 | |||
| Improving the city’s appeal (through various green elements). | 192 | 1275 | 0.738 | 0.758 | M-IMP | 0.778 | 1205.00 | 172.00 | |||
| iii. Enhancing the mental and physical health of inhabitants (e.g., visual and physical exposure to open green areas has a beneficial effect on stress and anxiety reduction). | 192 | 1509 | 0.873 | 0.872 | IMP | 0.870 | 1347.00 | 172.00 | |||
| iv. Providing ecological areas for research and education. | 192 | 1304 | 0.755 | 0.758 | M-IMP | 0.762 | 1180.00 | 172.00 | |||
| v. Enhancing the connectivity of green areas to promote walking and biking opportunities. | 192 | 1287 | 0.745 | 0.739 | M-IMP | 0.733 | 1134.00 | 172.00 | |||
| Economic indicators | i. Enhance the value of property | 192 | 1244 | 0.720 | 0.713 | M-IMP | 0.807 | IMP | 0.705 | 1092.00 | 172.00 |
| ii. Minimize healthcare expense | 192 | 1369 | 0.792 | 0.806 | IMP | 0.820 | 1269.00 | 172.00 | |||
| iii. Decrease energy use (e.g., heating and cooling requirements. | 192 | 1448 | 0.838 | 0.848 | IMP | 0.858 | 1328.00 | 172.00 | |||
| iv. Minimize the risk of flood disasters. | 192 | 1544 | 0.894 | 0.907 | E-IMP | 0.920 | 1424.00 | 172.00 | |||
| v. Decrease the utilization of private cars by encouraging walking and biking opportunities (i.e., changing modes of transportation). | 192 | 1377 | 0.797 | 0.802 | IMP | 0.806 | 1248.00 | 172.00 | |||
| vi. Show the value of eliminating air pollutants. | 192 | 1331 | 0.770 | 0.768 | M-IMP | 0.766 | 1186.00 | 172.00 | |||
| (a) | |||||||||||
|---|---|---|---|---|---|---|---|---|---|---|---|
| Categories | Urban Green Infrastructure Indicators | Relative Index (RII) of UGS Elements (Community Prespective (C-P) + Experts Prespective (E-P)) RII = Σ W/(N * A) | |||||||||
| CG Mean Value (C-P + E-P) | BG Mean Value (C-P + E-P) | UP Mean Value (C-P + E-P) | FO Mean Value (C-P + E-P) | GS Mean Value (C-P + E-P) | RG Mean Value (C-P + E-P) | GPA Mean Value (C-P + E-P) | WL Mean Value (C-P + E-P) | GRW Mean Value (C-P + E-P) | HO Mean Value (C-P + E-P) | ||
| Ecological | i. Optimizing storm-water management. | ||||||||||
| Increasing pervious surfaces | 0.71 | 0.73 | 0.79 | 0.90 | 0.73 | 0.83 | 0.66 | 0.85 | 0.65 | 0.65 | |
| Minimizing, retaining and organically purifying rainwater runoff. | 0.66 | 0.70 | 0.67 | 0.84 | 0.81 | 0.92 | 0.72 | 0.94 | 0.71 | 0.67 | |
| ii. Decreasing the impact of urban heat islands (i.e., enhancing the number of green spaces and using evaporative materials on the roofs, walls and floors. | 0.72 | 0.74 | 0.81 | 0.92 | 0.77 | 0.61 | 0.51 | 0.66 | 0.75 | 0.74 | |
| iii. Enhancing air quality (e.g., extracting impurities). | |||||||||||
| Growing more green trees and installing a green barrier in a roadway. | 0.69 | 0.70 | 0.75 | 0.89 | 0.80 | 0.52 | 0.60 | 0.71 | 0.76 | 0.68 | |
| iv. Enhancing noise quality. | |||||||||||
| Use a green sonic wall to reduce the maximum noise pollution (i.e., thick hedges could be provided with a small meadow for minimum noise and, for maximum noise reduction, wide borders of bamboo and deciduous trees could be provided). | 0.70 | 0.72 | 0.80 | 0.92 | 0.79 | 0.47 | 0.54 | 0.68 | 0.76 | 0.65 | |
| v. Lower emissions of carbon (e.g., elimination of greenhouse gas emissions via greenery). | |||||||||||
| Grow a greater density of trees for shade and use evaporating fabric for the paved surfaces. | 0.73 | 0.76 | 0.80 | 0.93 | 0.80 | 0.49 | 0.56 | 0.69 | 0.78 | 0.69 | |
| vi. Enhancing building energy performance. | |||||||||||
| Promote green energy-saving strategies. | 0.59 | 0.55 | 0.61 | 0.65 | 0.62 | 0.45 | 0.44 | 0.52 | 0.91 | 0.55 | |
| vii. Improved soil fertility and degradation condition. | |||||||||||
| Increase existing areas and plant trees to enhance soil stabilization. | 0.75 | 0.76 | 0.77 | 0.91 | 0.73 | 0.68 | 0.61 | 0.77 | 0.64 | 0.72 | |
| viii. Improved and safeguard urban ecology | |||||||||||
| Improve and strengthen the urban green network connectivity. | 0.72 | 0.82 | 0.79 | 0.93 | 0.73 | 0.51 | 0.56 | 0.77 | 0.74 | 0.73 | |
| Socio- cultural | i. Agri-production (e.g., home gardening; urban farming; and community farming). | 0.88 | 0.66 | 0.63 | 0.75 | 0.56 | 0.37 | 0.38 | 0.50 | 0.68 | 0.87 |
| ii. Enhancing social wellness. | |||||||||||
| Optimizing recreation and socialization activities. | 0.77 | 0.83 | 0.86 | 0.85 | 0.82 | 0.52 | 0.51 | 0.76 | 0.79 | 0.72 | |
| Improving the city’s appeal (through various green elements). | 0.81 | 0.77 | 0.85 | 0.80 | 0.80 | 0.70 | 0.70 | 0.77 | 0.83 | 0.72 | |
| iii. Enhancing the mental and physical health of inhabitants (e.g., visual and physical exposure to open green areas has a beneficial effect on stress and anxiety reduction). | 0.86 | 0.77 | 0.85 | 0.90 | 0.77 | 0.47 | 0.54 | 0.80 | 0.70 | 0.68 | |
| iv. Providing ecological areas for research and education. | 0.79 | 0.85 | 0.74 | 0.89 | 0.70 | 0.58 | 0.53 | 0.81 | 0.76 | 0.82 | |
| v. Enhancing the connectivity of green areas to promote walking and biking opportunities. | 0.71 | 0.75 | 0.85 | 0.88 | 0.85 | 0.38 | 0.50 | 0.75 | 0.58 | 0.63 | |
| Economic indicators | i. Enhance the value of property. | 0.80 | 0.80 | 0.89 | 0.67 | 0.77 | 0.60 | 0.62 | 0.61 | 0.87 | 0.71 |
| ii. Minimize healthcare expenses. | 0.86 | 0.78 | 0.84 | 0.90 | 0.79 | 0.49 | 0.51 | 0.70 | 0.71 | 0.75 | |
| iii. Decrease energy use (e.g., heating and cooling requirements). | 0.71 | 0.70 | 0.79 | 0.81 | 0.72 | 0.58 | 0.53 | 0.65 | 0.91 | 0.67 | |
| iv. Minimize the risk of flood disasters. | 0.70 | 0.71 | 0.77 | 0.96 | 0.78 | 0.82 | 0.68 | 0.89 | 0.63 | 0.63 | |
| v. Decrease the utilization of private cars by encouraging walking and biking opportunities (i.e., changing modes of transportation). | 0.69 | 0.76 | 0.81 | 0.84 | 0.86 | 0.44 | 0.53 | 0.75 | 0.42 | 0.52 | |
| vi. Show the value of eliminating air pollutants. | 0.73 | 0.78 | 0.83 | 0.94 | 0.83 | 0.52 | 0.57 | 0.73 | 0.84 | 0.71 | |
| (b) | |||||||||||
| Categories | Urban Green Infrastructure Indicators | Interquartile Range (IQR) Methodology | Cut-Off Point. | Approved Number of UGS Elements (RII ≥ 0.77) | Approved Urban Green Space (UGS) Elements | ||||||
| Q1 | Q3 | IQR = (Q3−Q1) (Median) | Mean | ||||||||
| Ecological | i. Optimize storm-water management. | ||||||||||
| Increasing pervious surfaces. | 0.68 | 0.82 | 0.73 | 0.77 | 0.77 | 4 | UP; FO; RG; WL | ||||
| Minimizing, retaining and organically purifying rainwater runoff. | 0.67 | 0.83 | 0.71 | 0.77 | 0.77 | 4 | F0; GE; RG; WL | ||||
| ii. Decreasing the impact of urban heat islands (i.e., enhanced the quantity of the green spaces and using of evaporative materials on the roofs, walls and floors. | 0.67 | 0.76 | 0.74 | 0.77 | 0.77 | 3 | UP; FO; GS | ||||
| iii. Enhancing air quality (e.g., extracting impurities). | |||||||||||
| Growing more green trees and installing a green barrier in a roadway. | 0.68 | 0.76 | 0.71 | 0.77 | 0.77 | 2 | FO; GS | ||||
| iv. Enhancing noise quality. | |||||||||||
| Use a green sonic wall to reduce the maximum noise pollution (i.e., thick hedges could be provided with a small meadow for minimum noise and, for maximum noise reduction, wide borders of bamboo and deciduous trees could be provided). | 0.65 | 0.78 | 0.71 | 0.77 | 0.77 | 3 | UP; FO;GS | ||||
| v. Lower emissions of carbon (e.g., elimination of greenhouse gas emissions through greenery). | |||||||||||
| Grow a greater density of trees for shade and use evaporating fabric for the paved surfaces. | 0.69 | 0.79 | 0.74 | 0.77 | 0.77 | 4 | UP; FO; GS;GRW | ||||
| vi. Enhancing building energy performance. | |||||||||||
| Promote green energy-saving strategies. | 0.53 | 0.62 | 0.57 | 0.77 | 0.77 | 1 | GRW | ||||
| vii. Improved soil fertility and degradation condition. | |||||||||||
| Increase existing areas and plant trees to enhance soil stabilization. | 0.69 | 0.77 | 0.74 | 0.77 | 0.77 | 3 | UP; FO; WL | ||||
| viii. Improved and safeguard urban ecology | |||||||||||
| Improve and strengthen the urban green network connectivity. | 0.72 | 0.79 | 0.79 | 0.77 | 0.77 | 4 | BG; UP; FO; WL | ||||
| Socio- cultural | i. Agri-production (e.g., home gardening; urban farming; and community farming). | 0.52 | 0.73 | 0.73 | 0.77 | 0.77 | 2 | CG; HO | |||
| ii. Enhancing social wellness. | |||||||||||
| Optimizing the recreation, and socialization activities. | 0.73 | 0.83 | 0.83 | 0.77 | 0.77 | 6 | CG; BG; UP; FO; GS; GRW | ||||
| Improving the city’s appeal (through various green elements). | 0.73 | 0.81 | 0.81 | 0.77 | 0.77 | 7 | CG; BG; UP; FO; GS; WL; GRW | ||||
| iii. Enhancing the mental and physical health of inhabitants (e.g., visual and physical exposure to open green areas has a beneficial effect on stress and anxiety reduction). | 0.68 | 0.83 | 0.83 | 0.77 | 0.77 | 6 | CG; BG; UP; FO; GS; WL | ||||
| iv. Provide ecological areas for research and education. | 0.71 | 0.82 | 0.82 | 0.77 | 0.77 | 5 | CG; BG; FO; WL; HO | ||||
| v. Enhance the connectivity of green areas to promote walking and biking opportunities. | 0.59 | 0.82 | 0.82 | 0.77 | 0.77 | 3 | UP; FO; GS | ||||
| Economic indicators | i. Enhance the value of property. | 0.63 | 0.80 | 0.80 | 0.77 | 0.77 | 5 | CG; BG; UP; GS; GRW | |||
| ii. Minimize healthcare expense. | 0.70 | 0.82 | 0.82 | 0.77 | 0.77 | 5 | CG; BG; UP; FO; GS | ||||
| iii. Decrease energy use (e.g., heating and cooling requirements). | 0.65 | 0.77 | 0.77 | 0.77 | 0.77 | 3 | UP, FO; GRW | ||||
| iv. Minimize the risk of flood disasters. | 0.69 | 0.81 | 0.81 | 0.77 | 0.77 | 5 | UP; FO; GS; RG; WL | ||||
| v. Decrease the utilization of private cars by encouraging walking and biking opportunities (i.e., changing modes of transportation). | 0.52 | 0.80 | 0.80 | 0.77 | 0.77 | 3 | UP; FO; GS | ||||
| vi. Show the value of eliminating air pollutants. | 0.71 | 0.83 | 0.83 | 0.77 | 0.77 | 5 | BG; UP; FO; GS;GRW | ||||
Publisher’s Note: MDPI stays neutral with regard to jurisdictional claims in published maps and institutional affiliations. |
© 2022 by the authors. Licensee MDPI, Basel, Switzerland. This article is an open access article distributed under the terms and conditions of the Creative Commons Attribution (CC BY) license (https://creativecommons.org/licenses/by/4.0/).
Share and Cite
Rayan, M.; Gruehn, D.; Khayyam, U. Frameworks for Urban Green Infrastructure (UGI) Indicators: Expert and Community Outlook toward Green Climate-Resilient Cities in Pakistan. Sustainability 2022, 14, 7966. https://doi.org/10.3390/su14137966
Rayan M, Gruehn D, Khayyam U. Frameworks for Urban Green Infrastructure (UGI) Indicators: Expert and Community Outlook toward Green Climate-Resilient Cities in Pakistan. Sustainability. 2022; 14(13):7966. https://doi.org/10.3390/su14137966
Chicago/Turabian StyleRayan, Muhammad, Dietwald Gruehn, and Umer Khayyam. 2022. "Frameworks for Urban Green Infrastructure (UGI) Indicators: Expert and Community Outlook toward Green Climate-Resilient Cities in Pakistan" Sustainability 14, no. 13: 7966. https://doi.org/10.3390/su14137966