
Spatio-Temporal Distribution of Tourism Flows and Network Analysis of Traditional Villages in Western Hunan

1
College of Geographical Sciences, Hunan Normal University, Changsha 410081, China
2
Key Laboratory of Geospatial Big Data Mining and Application, Changsha 410081, China
*
Author to whom correspondence should be addressed.
Sustainability 2022, 14(13), 7943; https://doi.org/10.3390/su14137943
Submission received: 30 May 2022
/
Revised: 22 June 2022
/
Accepted: 27 June 2022
/
Published: 29 June 2022
(This article belongs to the Section Tourism, Culture, and Heritage)
Abstract
:Traditional village tourism is an effective path to rural revitalization and an excellent way to preserve traditional sceneries and cultural heritage. However, research on the subject matter has been limited. To address some of the current research gaps, this study used 2372 online travelogues from popular travel websites to explore the spatio-temporal distribution and network structure of the tourism flow in traditional villages in western Hunan using ArcGIS and social network analysis. The main findings are as follows: (1) In terms of time distribution, the tourism flow in traditional villages in Western Hunan is dominated by short-term tourism and shows significant seasonal differences. (2) The spatial distribution forms a double-core and multipoint spatial pattern with “Fenghuang Ancient City—Zhangjiajie National Forest Park” as core. (3) The network of traditional villages in Western Hunan exhibits a “core-periphery” hierarchical structure, with a network density of 0.275. Aside from the attraction and appeal of the twin cores, Furong Town and Tianmen Mountain constitute the core points of the network structure, and the radiation drive of the core nodes is not pronounced.
1. Introduction
The direction for the conservation and development of China’s traditional villages has been indicated with the introduction of policies, such as the rural revitalization strategy. As an important tool to expand the social, economic, cultural, and ecological functions of traditional villages, rural tourism provides multiple opportunities for the transformation and development of traditional villages and is gradually being recognized by everyone [1,2,3]. Traditional villages combine unique architectural features, colorful ethnic customs, and beautiful natural scenery, providing an important resource base for tourism development and gradually turning into popular rural tourism destinations [4,5]. During the National Day in 2021, Phoenix County in Xiangxi Prefecture received a total of 757,900 tourists, of which 242,500 were welcomed by traditional village tourism [6]. Traditional village tourism has become a more active constituent element of the tourism economic system. The analysis and study of the spatial structure characteristics of traditional village tourism flow in typical areas can provide practical guidance for the rapid development of traditional village tourism, as well as theoretical support for implementing the national strategy of tourism-led rural revitalization and the sustainable development of traditional villages.
Understanding tourism flow can help accurately grasp the spatio-temporal distribution and flow mechanisms of tourists at the microlevel and guide the planning and design of tourism routes, service facilities, and the diversion of tourists during peak periods [7,8]. With people’s preference for traditional village tourism, a closer network of tourism flow relationships has gradually formed between traditional villages, and the important value and academic significance of traditional village tourism flows have begun to emerge. Understanding the Spatio-temporal trajectories and network structure characteristics of tourism flows between traditional villages, and promoting traditional village tourism development and innovative conservation, has become an urgent scientific problem to be solved.
Early studies on tourism flows relied mainly on questionnaire surveys and statistical yearbooks, making it difficult to obtain data, especially for traditional villages. Research on traditional village tourism has therefore focused on the value and conservation of tourism resources, tourism development, tourism impact and management, and tourism problems and countermeasures [9,10,11,12,13]. In recent years, information and communication technology has developed rapidly, and the Internet has become an important platform for users to obtain and share travel information. According to the 49th Statistical Report on the Development of the Internet in China released by the China Internet Network Information Centre (CNNIC), as of December 2021, the size of China’s Internet users was 1.032 billion, and the Internet penetration rate reached 73%. The scale of online travel booking users reached 397 million, accounting for 38.5% of the overall Internet users. This has made it possible to use web data to study tourism phenomena, and diverse data such as microblog check-in data, web travelogues, and web ticketing data have been widely used by scholars to study tourism flows at regional and city scales, with good results [14,15,16,17,18]. Among them, the online travelogues not only record the travel dates and lengths of tourists but also their trajectories, which can reflect a comprehensive range of information and bring new opportunities for the study of traditional village tourism flows. Compared with traditional questionnaire data collection, online travelogues are more convenient and quicker to obtain, and the sample size is sufficient.
Taking the Western Hunan region as the research area, this paper analyzed the spatial and temporal distribution of tourism flow in traditional Chinese villages using digital tourism footprints. With the help of social network analysis techniques, the spatial relationship between the tourism nodes in traditional Chinese villages was constructed to explore the structural characteristics of the tourism flow network. The results from this study provide theoretical and practical references for the management, protection, planning, and policy development of tourism in traditional villages.
2. Literature Review
Tourism flow has a broad sense and a narrow sense. The broad definition of tourism flow includes capital flow, material flow, information flow, cultural flow, and many other aspects, while the narrow sense of tourism flow only refers to tourism passenger flow [19,20]. Tourism flow is the link between the origin and destination and is at the core of tourism research. Scholars from different fields, such as tourism, geography, and sociology, have conducted numerous discussions on it, and the relevant studies have mainly focused on the flow prediction of tourism flow [21,22,23], spatial distribution [24,25], influencing factors [26,27], network structure [28,29], tourism destination management [30], and tourist behavioral perceptions [31]. Research scales focus on large spatial scales such as international, regional, provincial, and intra-city levels [32,33,34,35,36,37], and research methods such as GIS analysis and social network analysis are widely used in tourism flow research [38,39]. Data sources are mainly divided into two categories: statistical data and digital footprint. Statistical information, such as those from statistical yearbooks and questionnaire surveys, may fail to reflect the characteristics of tourist flows or have insufficient sample sizes [40,41,42]. The other is tourism digital footprint, which includes mobile phone signaling, online reviews, online travelogues, location check-in data, online photos, tourist call records, messages sent, and other online information systems after the tour [43].
In the early days, due to the difficulty of obtaining static data, there was a lack of research on tourism flows in villages, especially traditional villages, which remained at the level of using questionnaire data to analyze the temporal distribution characteristics of tourism flows, and relevant research needs to be further strengthened [44]. Currently, social networking platforms and online travel software are well developed, providing a source of data for conducting research on tourism flows in traditional villages. Travelogues recorded by tourists on personal social networking platforms or travel websites contain a large amount of spatio-temporal information about tourists’ past travels, offering new possibilities for location-based analysis. There have been many studies applying online travelogue data to study tourism. For example, Leung et al. (2012) used travelogues from six tourism websites to explore changes in the attractiveness of tourist attractions to inbound tourists in Beijing [45], and Ma, Yang, Xu, and Tai (2018) used Ctrip travelogues to study the movement patterns of inbound tourists in Taiwan [46]. With the popularity of social network analysis methods in tourism research, scholars at home and abroad have constructed spatial networks of tourism flows based on network data and used social network analysis to study the structural characteristics of tourism destination networks, spatial networks of tourism economic linkages, and tourism stakeholder network relationships [47,48,49,50,51]. There is still a lack of network structure analysis of traditional village tourism flows, while traditional village tourism nodes, as the core attraction of tourism destinations, are important places for carrying out tourism activities. Studying the network results of traditional village tourism flows can clarify the links between the nodes and provide theoretical and practical support for the linkage protection and development of regional traditional villages.
Based on this, this study took the western Hunan region as an example and focused on the scientific issue of “spatio-temporal characteristics and network structure of traditional village tourism flows”, trying to study the following aspects: (1) How can network data be used to scientifically measure the flow intensity and direction of traditional village tourism flows in the information age? (2) What are the spatial and temporal flow patterns of traditional village tourism as a special form of tourism? (3) What is the structure of the network of traditional village tourism flows? What are the reasons for its formation?
3. Study Area and Methods
3.1. Study Area
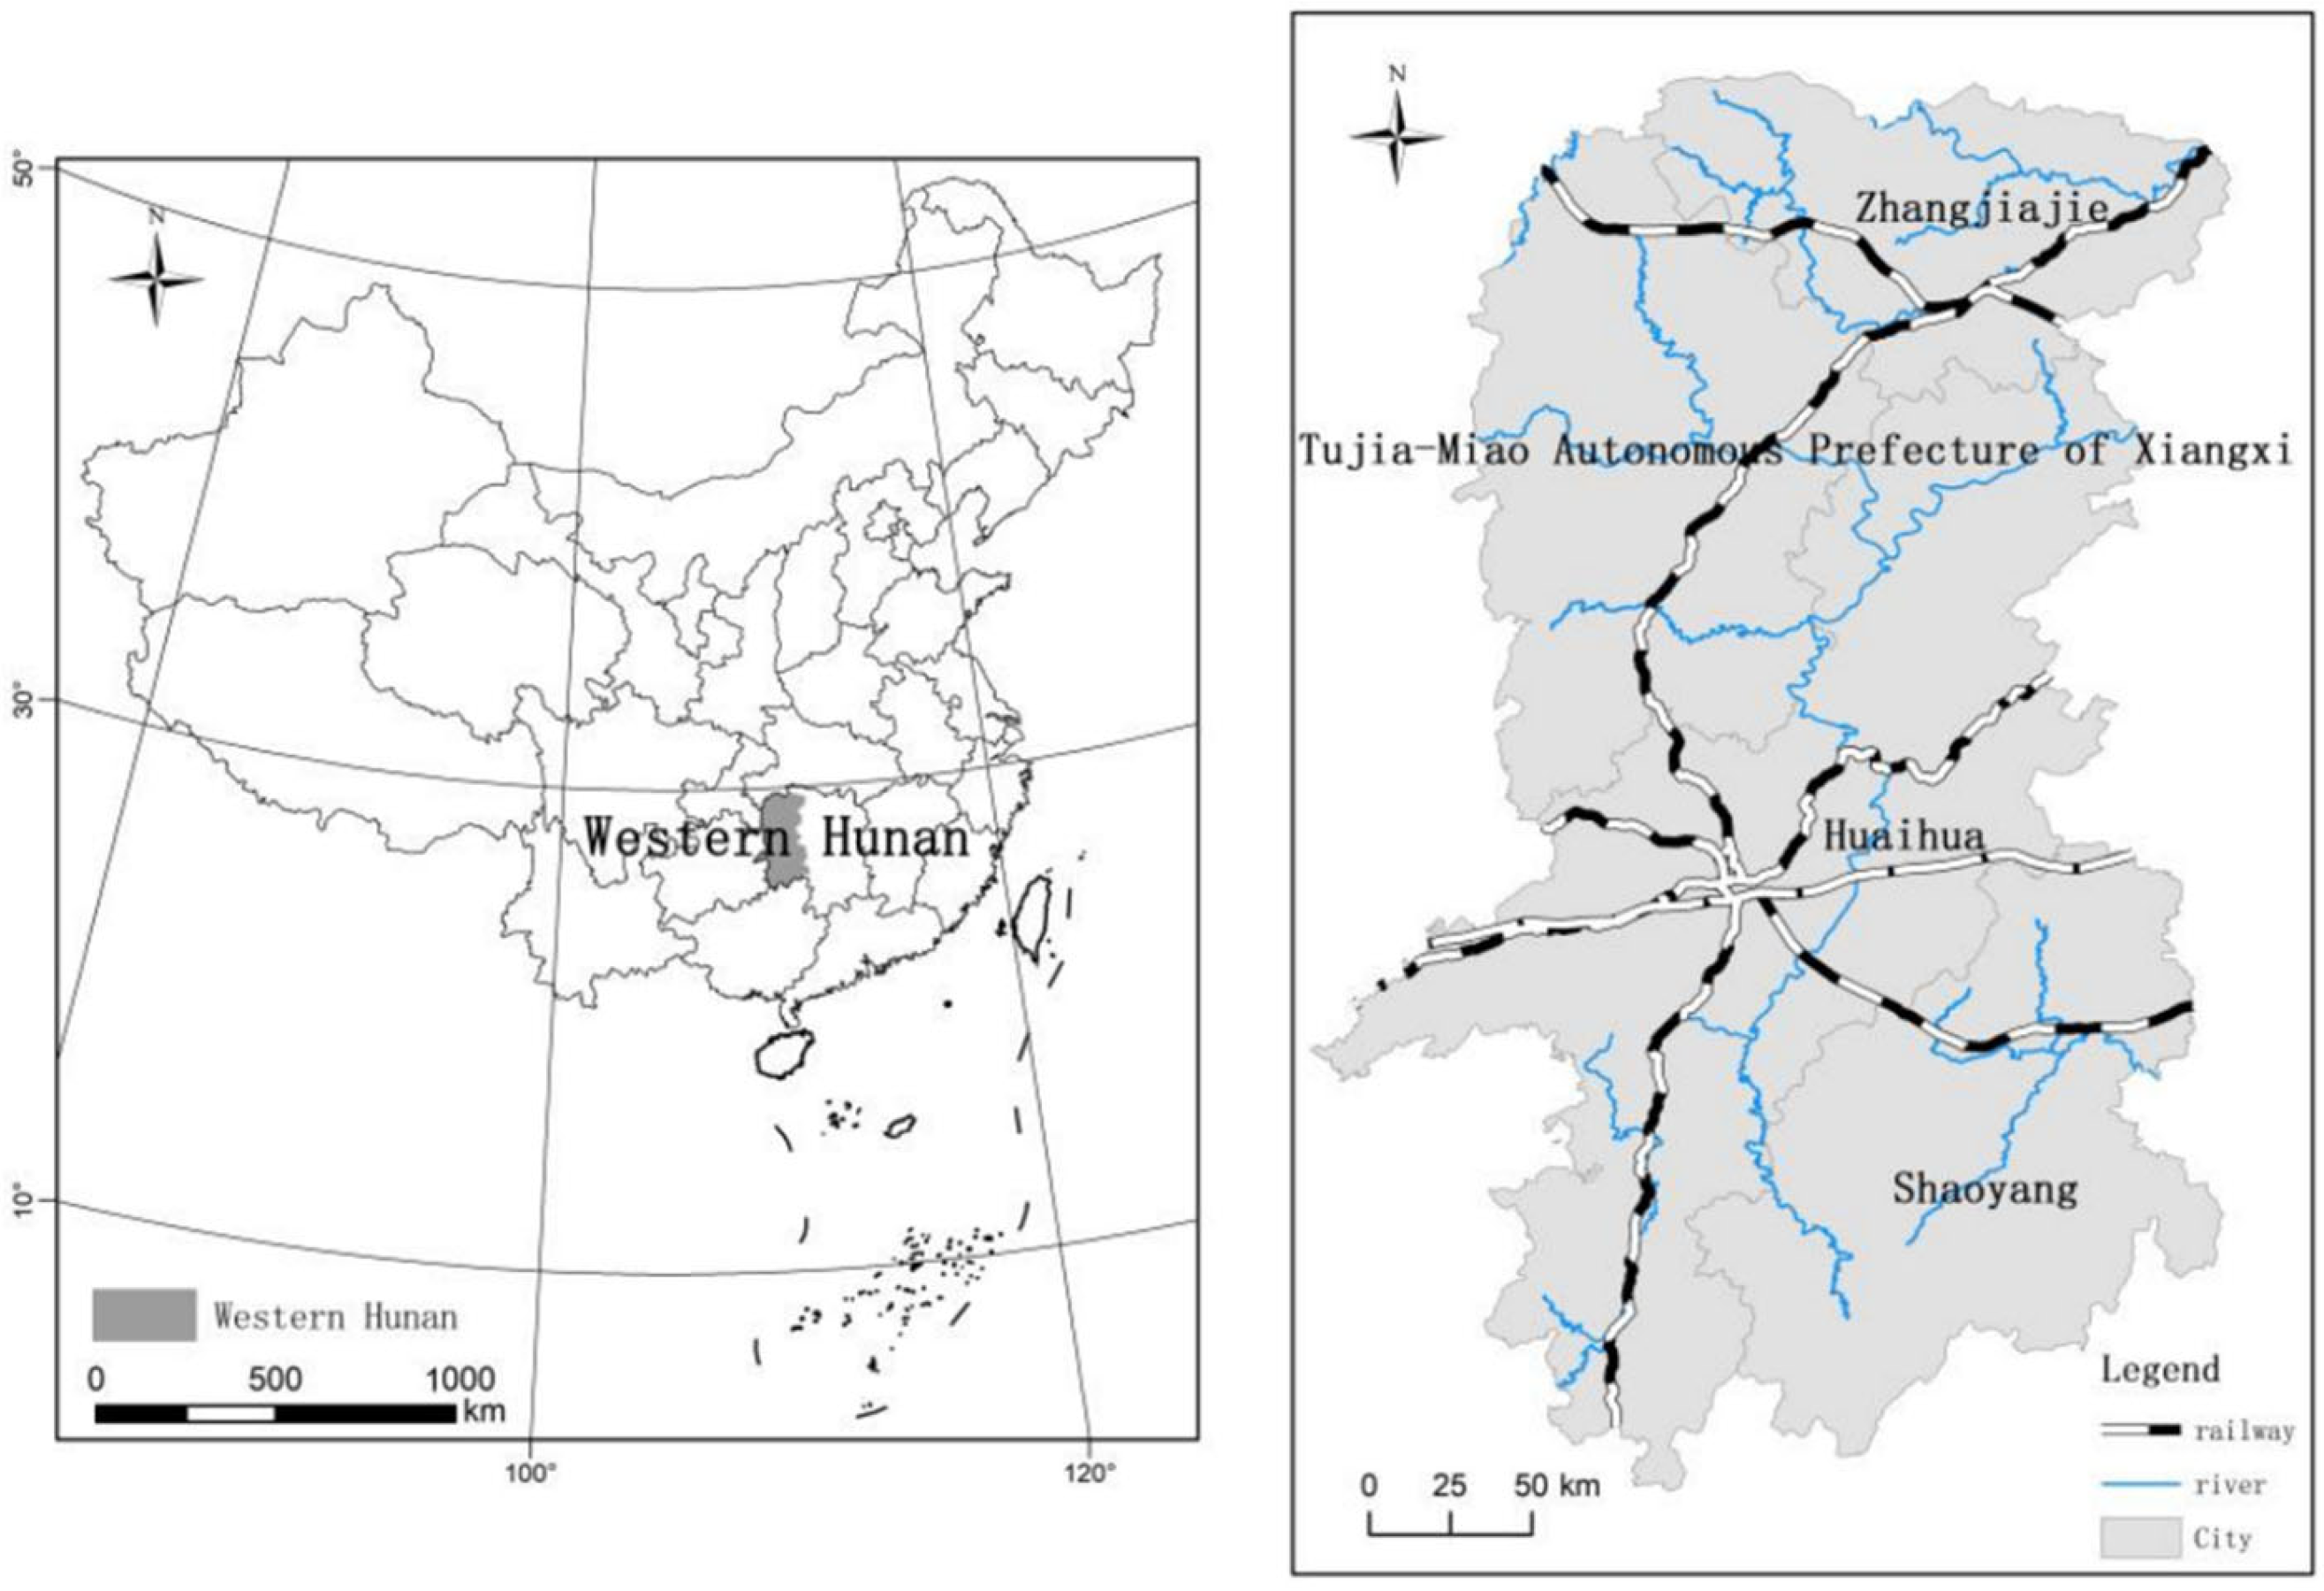
Xiangxi, the western region of Hunan Province, China, contains Zhangjiajie City, Xiangxi Tujia and Miao Autonomous Prefecture, Huaihua City and Wugang City, Chengbu Miao Autonomous County, Dongkou County, Suining County, Longhui County, and Xinning County in western Shaoyang City [52]. Because of its unique geographical features, strong ethnicity, and abundant historical and cultural landscapes, 86 rural scenic spots have been upgraded to 4A level tourism spots or provincial-level tourism demonstration areas. Numerous rural villages and high-end bed-and-breakfasts have been successfully created to cater to tourists. Many tourism commodities, cultural and creative products, and performing arts programs have also been developed in the region. Since 2015, more than 10 million people have experienced the Great Western Hunan Fine Route Tour, generating more than 80 billion yuan in tourism revenue.
Xiangxi is inhabited by the Tujia, Miao, and other ethnic groups and is a multi-ethnic area rich in traditional villages [53] (Figure 1). The abundance of traditional villages in Xiangxi has been tapped for tourism development. The region has been selected as one of China’s priority areas in tourism for two consecutive years, using the tourism slogan “Divine Rhythm of Xiangxi” [54]. Traditional villages are crucial to the region’s tourism industry, with about 56% (370/658) of Hunan’s nationally recognized traditional villages found in Xiangxi. Understanding the tourism flow of Xiangxi’s traditional villages would help the region’s tourism industry and support the protection, management, and sustainable development of its traditional villages.
3.2. Collection, Sorting and Arrangement of Data
We ranked the different online travel websites to select which ones to use for the study. After comparing their travelogue information, we decided to use Ctrip and Go.com for the data sources, given their large number of users and strong online presence. Using “Xiangxi” as search field, 5397 travelogues were generated in the Octopus information collector (search date: 28 February 2022). We then filtered the list and removed those that met one of the following conditions: (1) of a marketing or strategy nature; (2) do not record complete travel itineraries or do not contain traditional village travel nodes; or (3) with invalid users and identical travelogues posted by a single user on different websites.
Some samples in the dataset also had to be modified. For example, a number of travelogues recorded only part of the scenic spots, so these scattered spots had to be merged (e.g., Yangjiajie, Yuanjiajie, and Ten Mile Gallery were combined into Zhangjiajie National Forest Park). Some areas were geographically proximate and had to be grouped (e.g., Nanhua Mountain and Fenghuang Ancient City). In addition, we revised the names of some tourist nodes that were incompletely (or incorrectly) labeled (e.g., Furong to Furong Town, Jidou Village to Jidou Miao Village, Dayong City to Dayong Ancient City). The final valid population size was 2372 travelogues for the research period 2001–2022.
We then extracted the high-frequency attractions and designated the top 16 in terms of visit frequency (ignoring those with visit rates lower than 0.01%) as the tourist nodes. Note that while Zhangjiajie National Forest Park and Tianmen Mountain are not traditional village tourism nodes, their scenic spots contain many ancient villages rich in ethnic customs (such as Longwei Village, Hanjiagou, and Sanjia Village). Therefore, to study the movement pattern of traditional village tourism flow in the regional context, these spots were also entered into the database and were grouped with other tourist attractions as “traditional village tourism nodes” (see Table 1).
3.3. Study Methods
3.3.1. Kernel Density Estimation
In the ArcGIS software, the kernel density estimation method was used to analyze the concentration of traditional village tourism flows at each tourism node [55]. The kernel density for traditional village streams () is calculated using the formula:
where is the search radius (km), i.e., bandwidth; is the number of point elements whose distance from the spatial locationis less than or equal to radius r; refers to the spatial weight function; and is the point distance between the current point element and the spatial location.
3.3.2. Social Network Analysis
Social Network Analysis (SNA) is a method used to map and measure relationships and flows between people, groups, organizations, and other connected information entities. Based on graph theory, SNA can strip individual, local, and holistic properties in complex systems [47,56]. With the help of Ucinet and Netdraw software, it is possible to comprehensively analyze and visualize the spatial layout patterns of tourist flows, the network structure, and the role status of nodes.
- (1)
- Relationship matrix construction. Before using UCINET to analyze the network tour data, the flow direction matrix is constructed according to the identified 16 tour nodes to establish the quantitative flow relationship between nodes. After comparing and testing the network structure under different flow controls, we used 3 as the breakpoint value for binarization and converted the matrix into 0 and 1. The 16 × 16 multi-valued directed relationship matrix is shown in Equation (2) [18,57]. This matrix was then used to characterize the tourism flow network structure for traditional villages.
- (2)
- Network characteristics analysis. The network scale, density, centrality, central potential, and other indicators were used to characterize the network structure and node linkage relationships of the tourism flow for traditional villages. The relevant calculation formulas are summarized in Table 2.
3.3.3. Core-Edge Model
In order to reflect the position (or importance) of a tourism node in the network more clearly, the core-edge model was constructed using the core-edge module in the UCINET (version 6.560) software, which was developed by the University of California at Irvine, CA, USA.
4. Analysis of Spatio-Temporal Characteristics of Tourism Flow
4.1. Temporal Characteristics
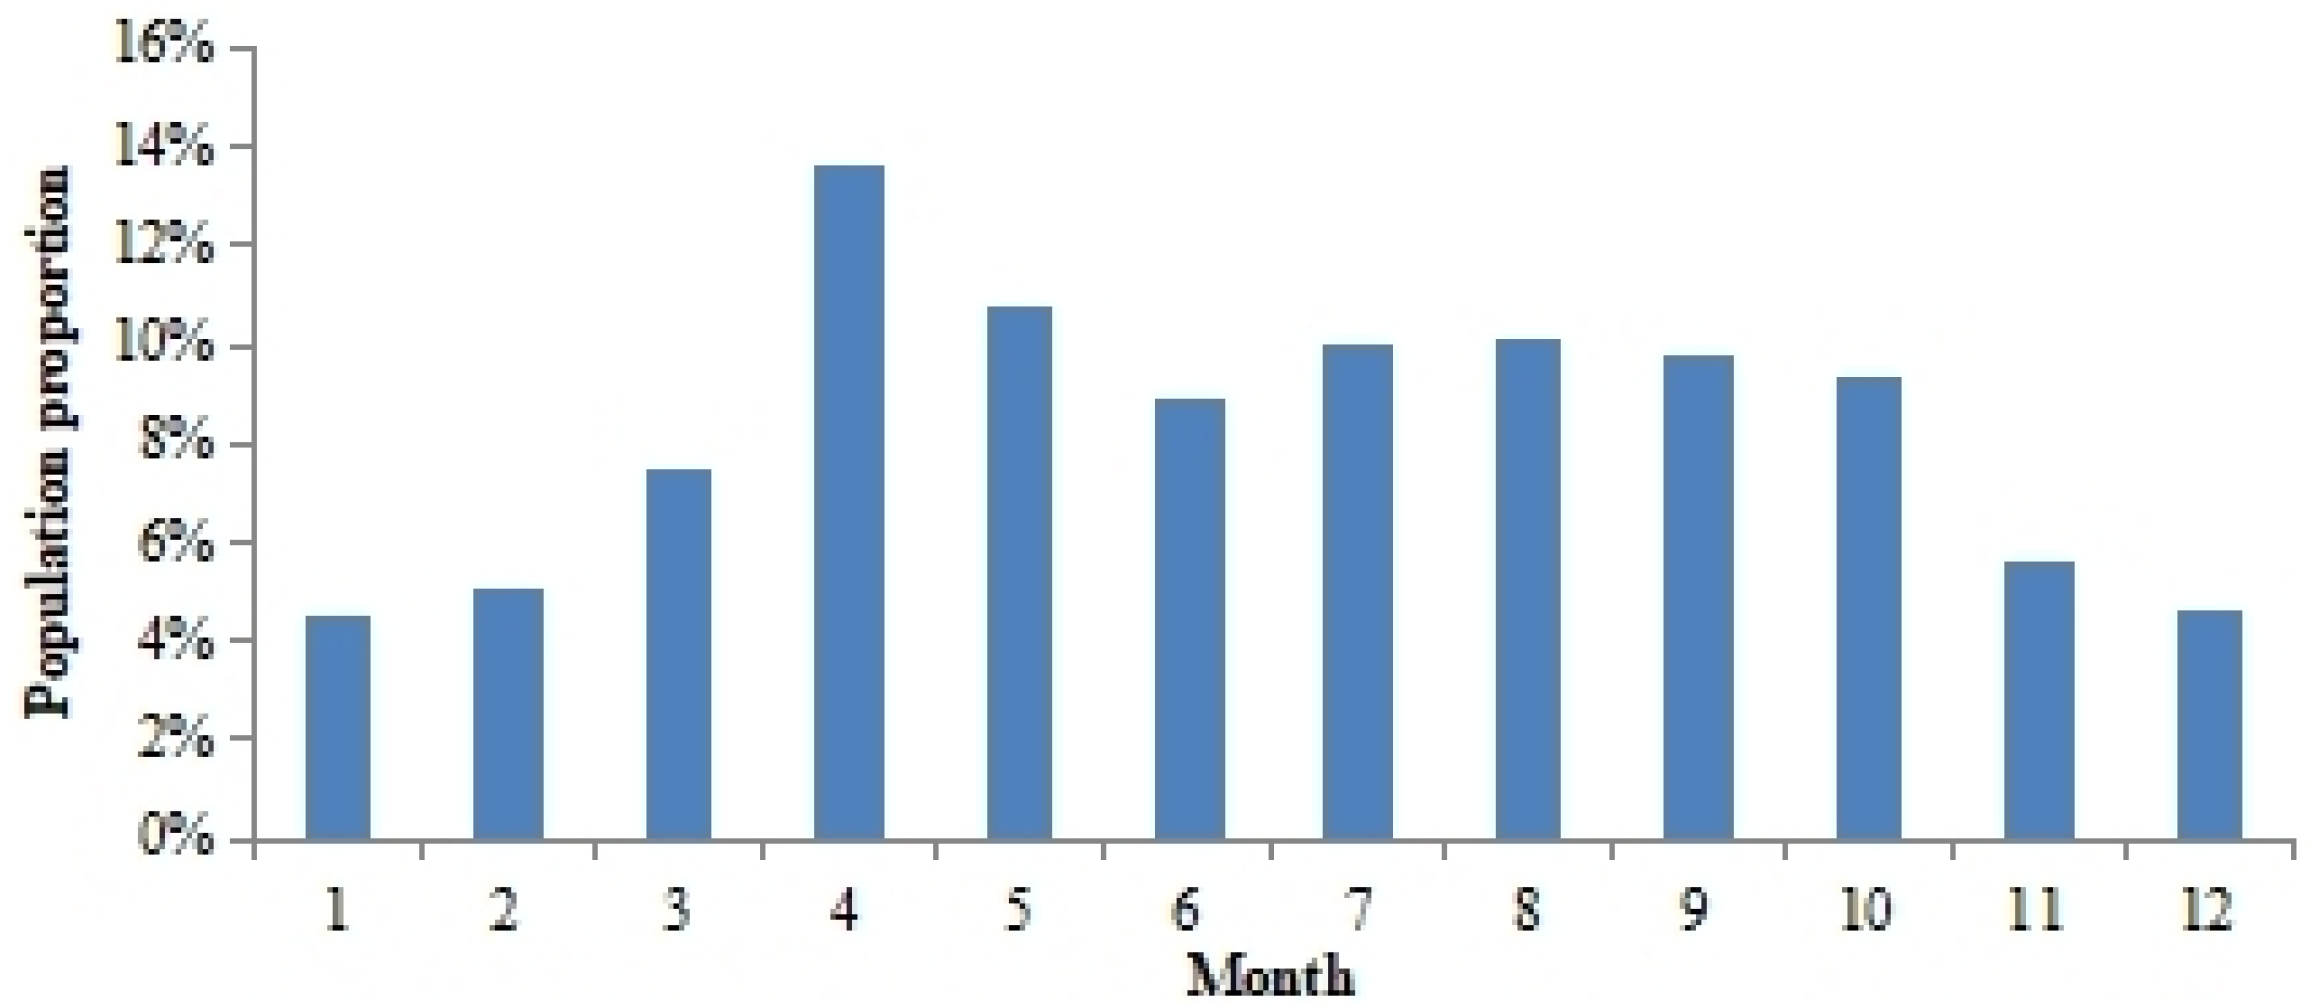
Tourist departure time and linger time were extracted from the valid travelogues, generating sample sizes of 2525 and 2835, respectively (see Figure 2 and Figure 3). From the data distribution, Xiangxi’s traditional village tourism has seasonal fluctuations. More tourists visit from April to October, especially in April and May, compared with the rest of the year. This is due to the region’s subtropical monsoonal humid climate having large inter-annual thermal variations. In April, the temperature gradually increases, which would more likely encourage people to partake in outdoor recreational activities. The Hinging Festival and Labour Day holidays in April also positively affect domestic tourism in Xiangxi. Since June has fewer holidays, the number of visitors also declines.
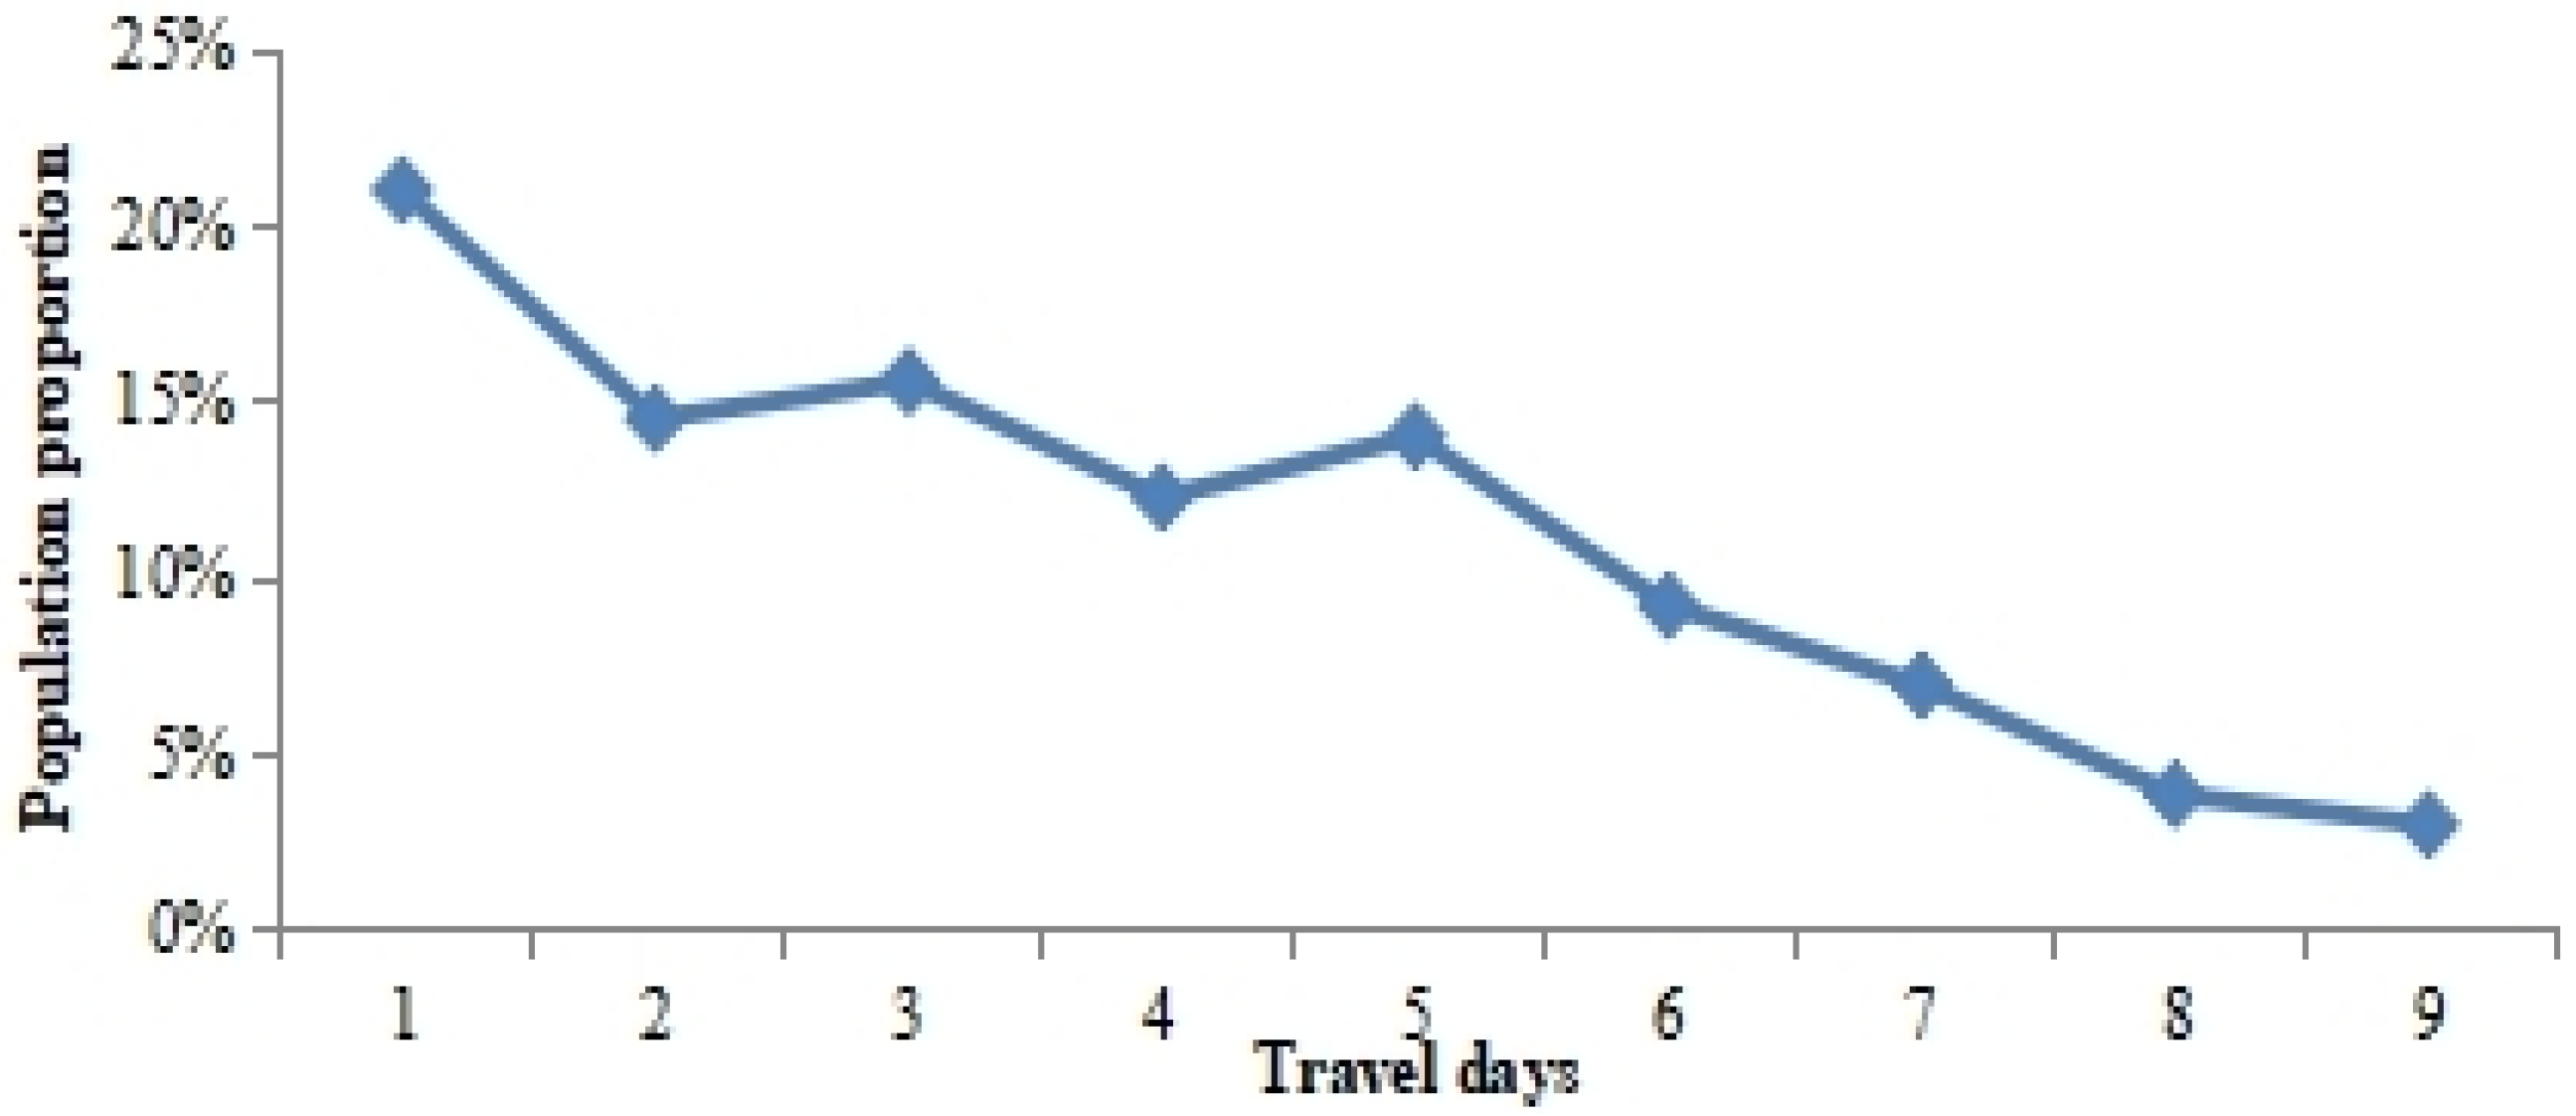
Using the linger time data, the tourists’ length of stay was found to range from 1 to 9 days. As the travel time increased, the number of tourists gradually decreased. About 77% of the tourists had five days or shorter length of stay, indicating that short-term tourism was the preferred option. Since most of Xiangxi’s tourists are working-class people who do not have many holidays, their length of stay would generally be less than seven days.
The use of holidays and weekends to travel has become mainstream, and the travel market has customized many short-term travel products to address such demand. The most popular product was the one-day tour package, which accounted for 20.95%. The three-day tour package came in second, accounting for 15.52%, followed by two-day and five-day packages, each accounting for more than 13%. While lengths of stay of more than five days were not as popular, the data show that some patronized these tourism products. This suggests that Xiangxi’s traditional villages have a market for long-term tourists.
4.2. Spatial Characteristics
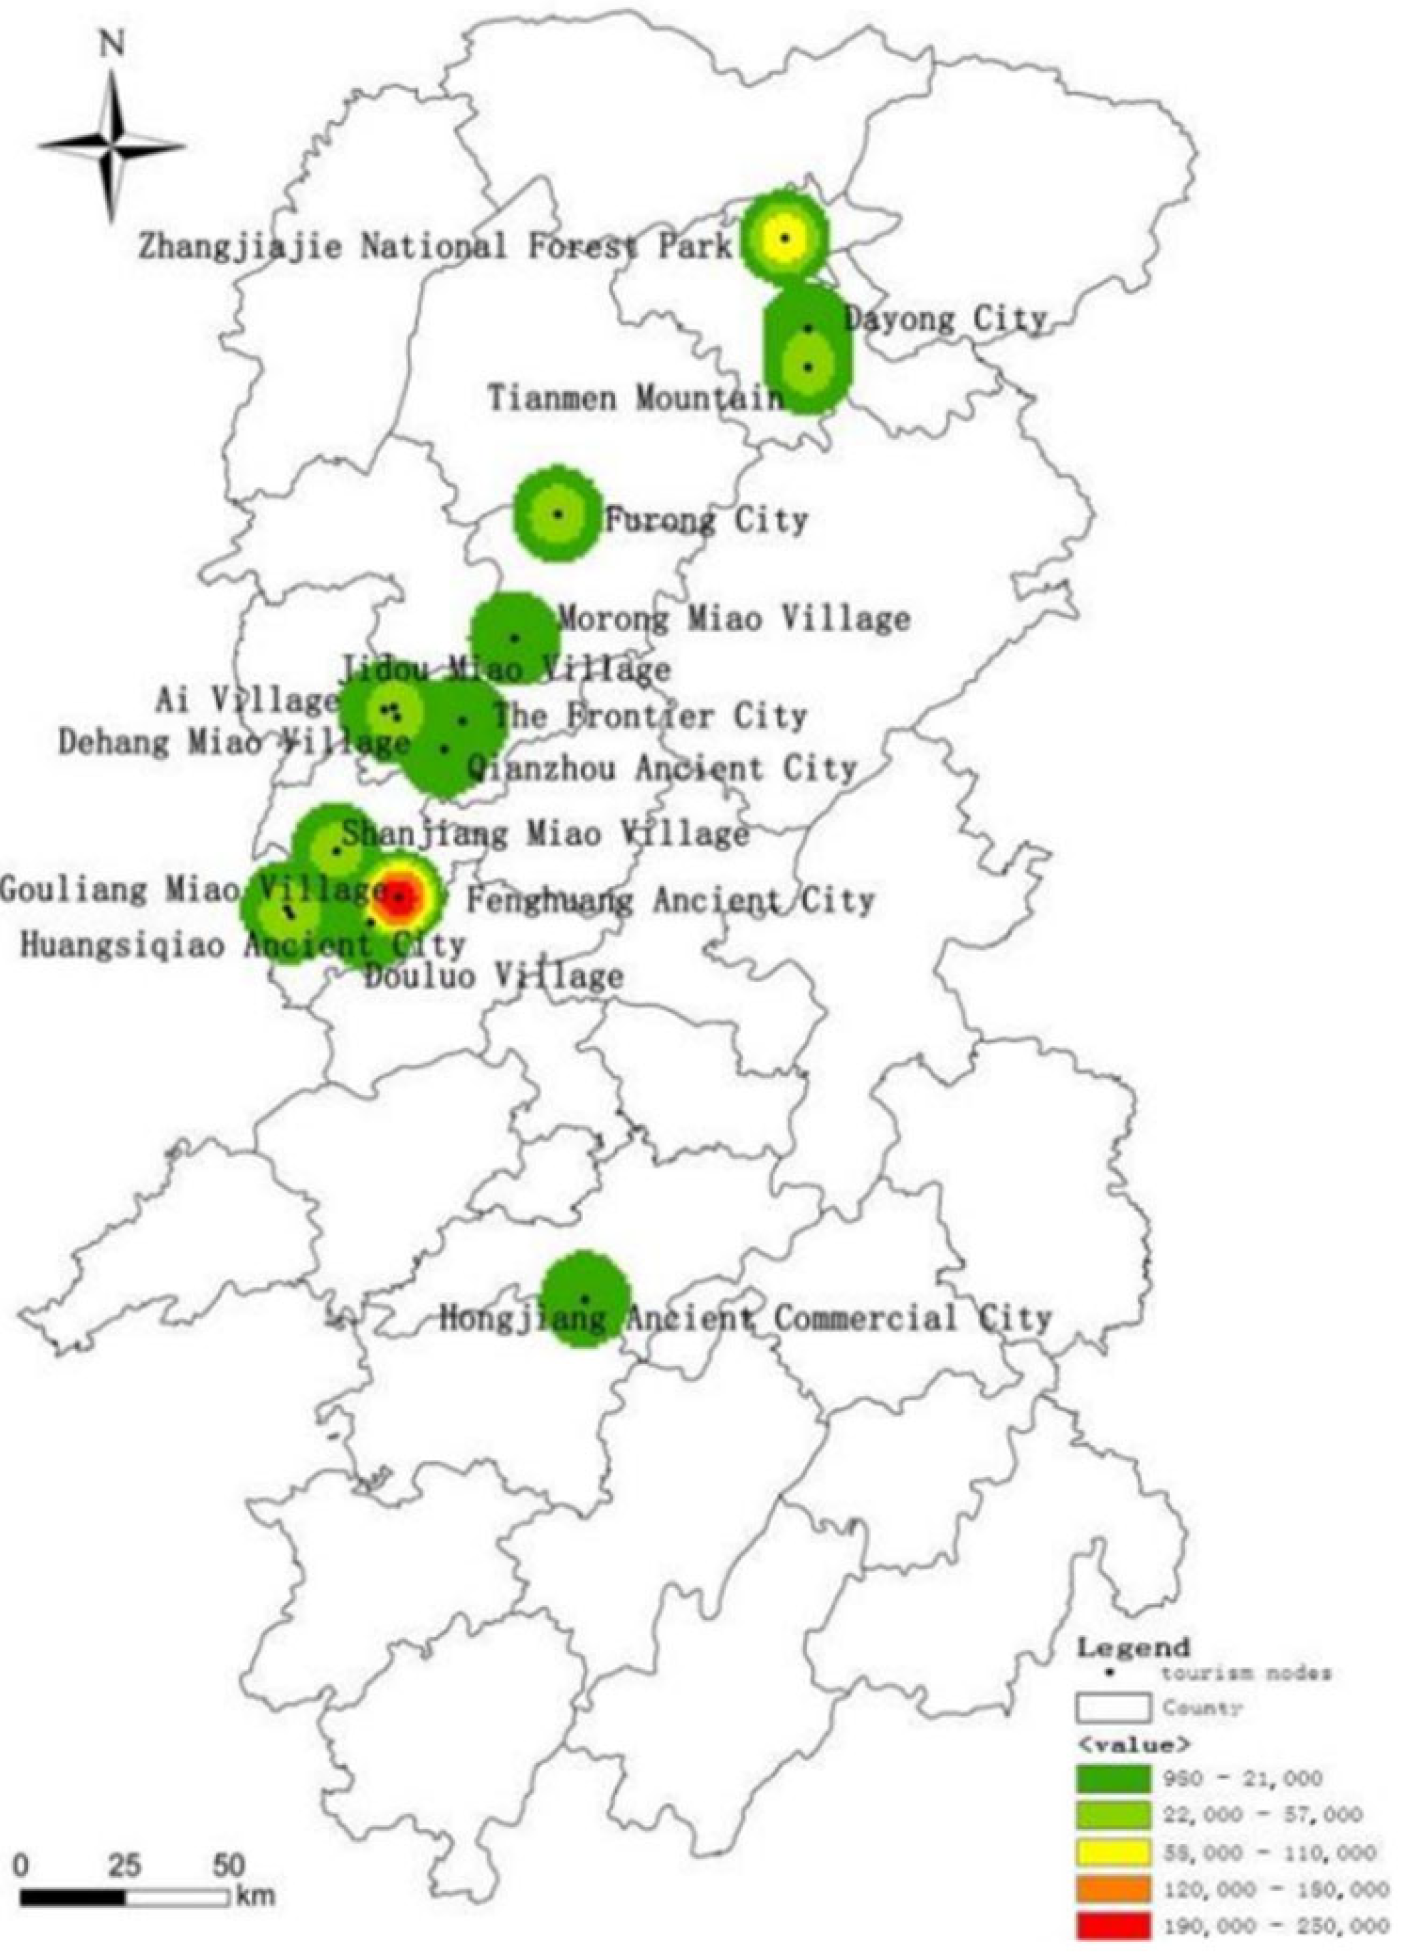
The kernel density method was used to analyze the spatial distribution of tourism flows. The kernel density values were calculated at different search radii ranging from 0.1 km to 1 km at 0.1 intervals. The spatial variability of tourism flows was most significant at the 0.1 km search radius, which was then used in visualizing the kernel density map for tourism in the traditional villages (see Figure 4). The map shows a spatial distribution pattern of “double core and multiple points”, with pronounced hierarchical differentiation characteristics. The tourists’ travel behavior showed considerable affinity for the Fenghuang Ancient City scenic area and the Zhangjiajie National Forest Park, areas showing strong clustering characteristics and serving as the core for the traditional village tourism flow in Western Hunan. These places are also national 4A and 5A scenic spots, with high tourism resource value and external visibility.
5. Analysis of the Structural Features of the Tourism Flow Network
5.1. Flow Network Structure
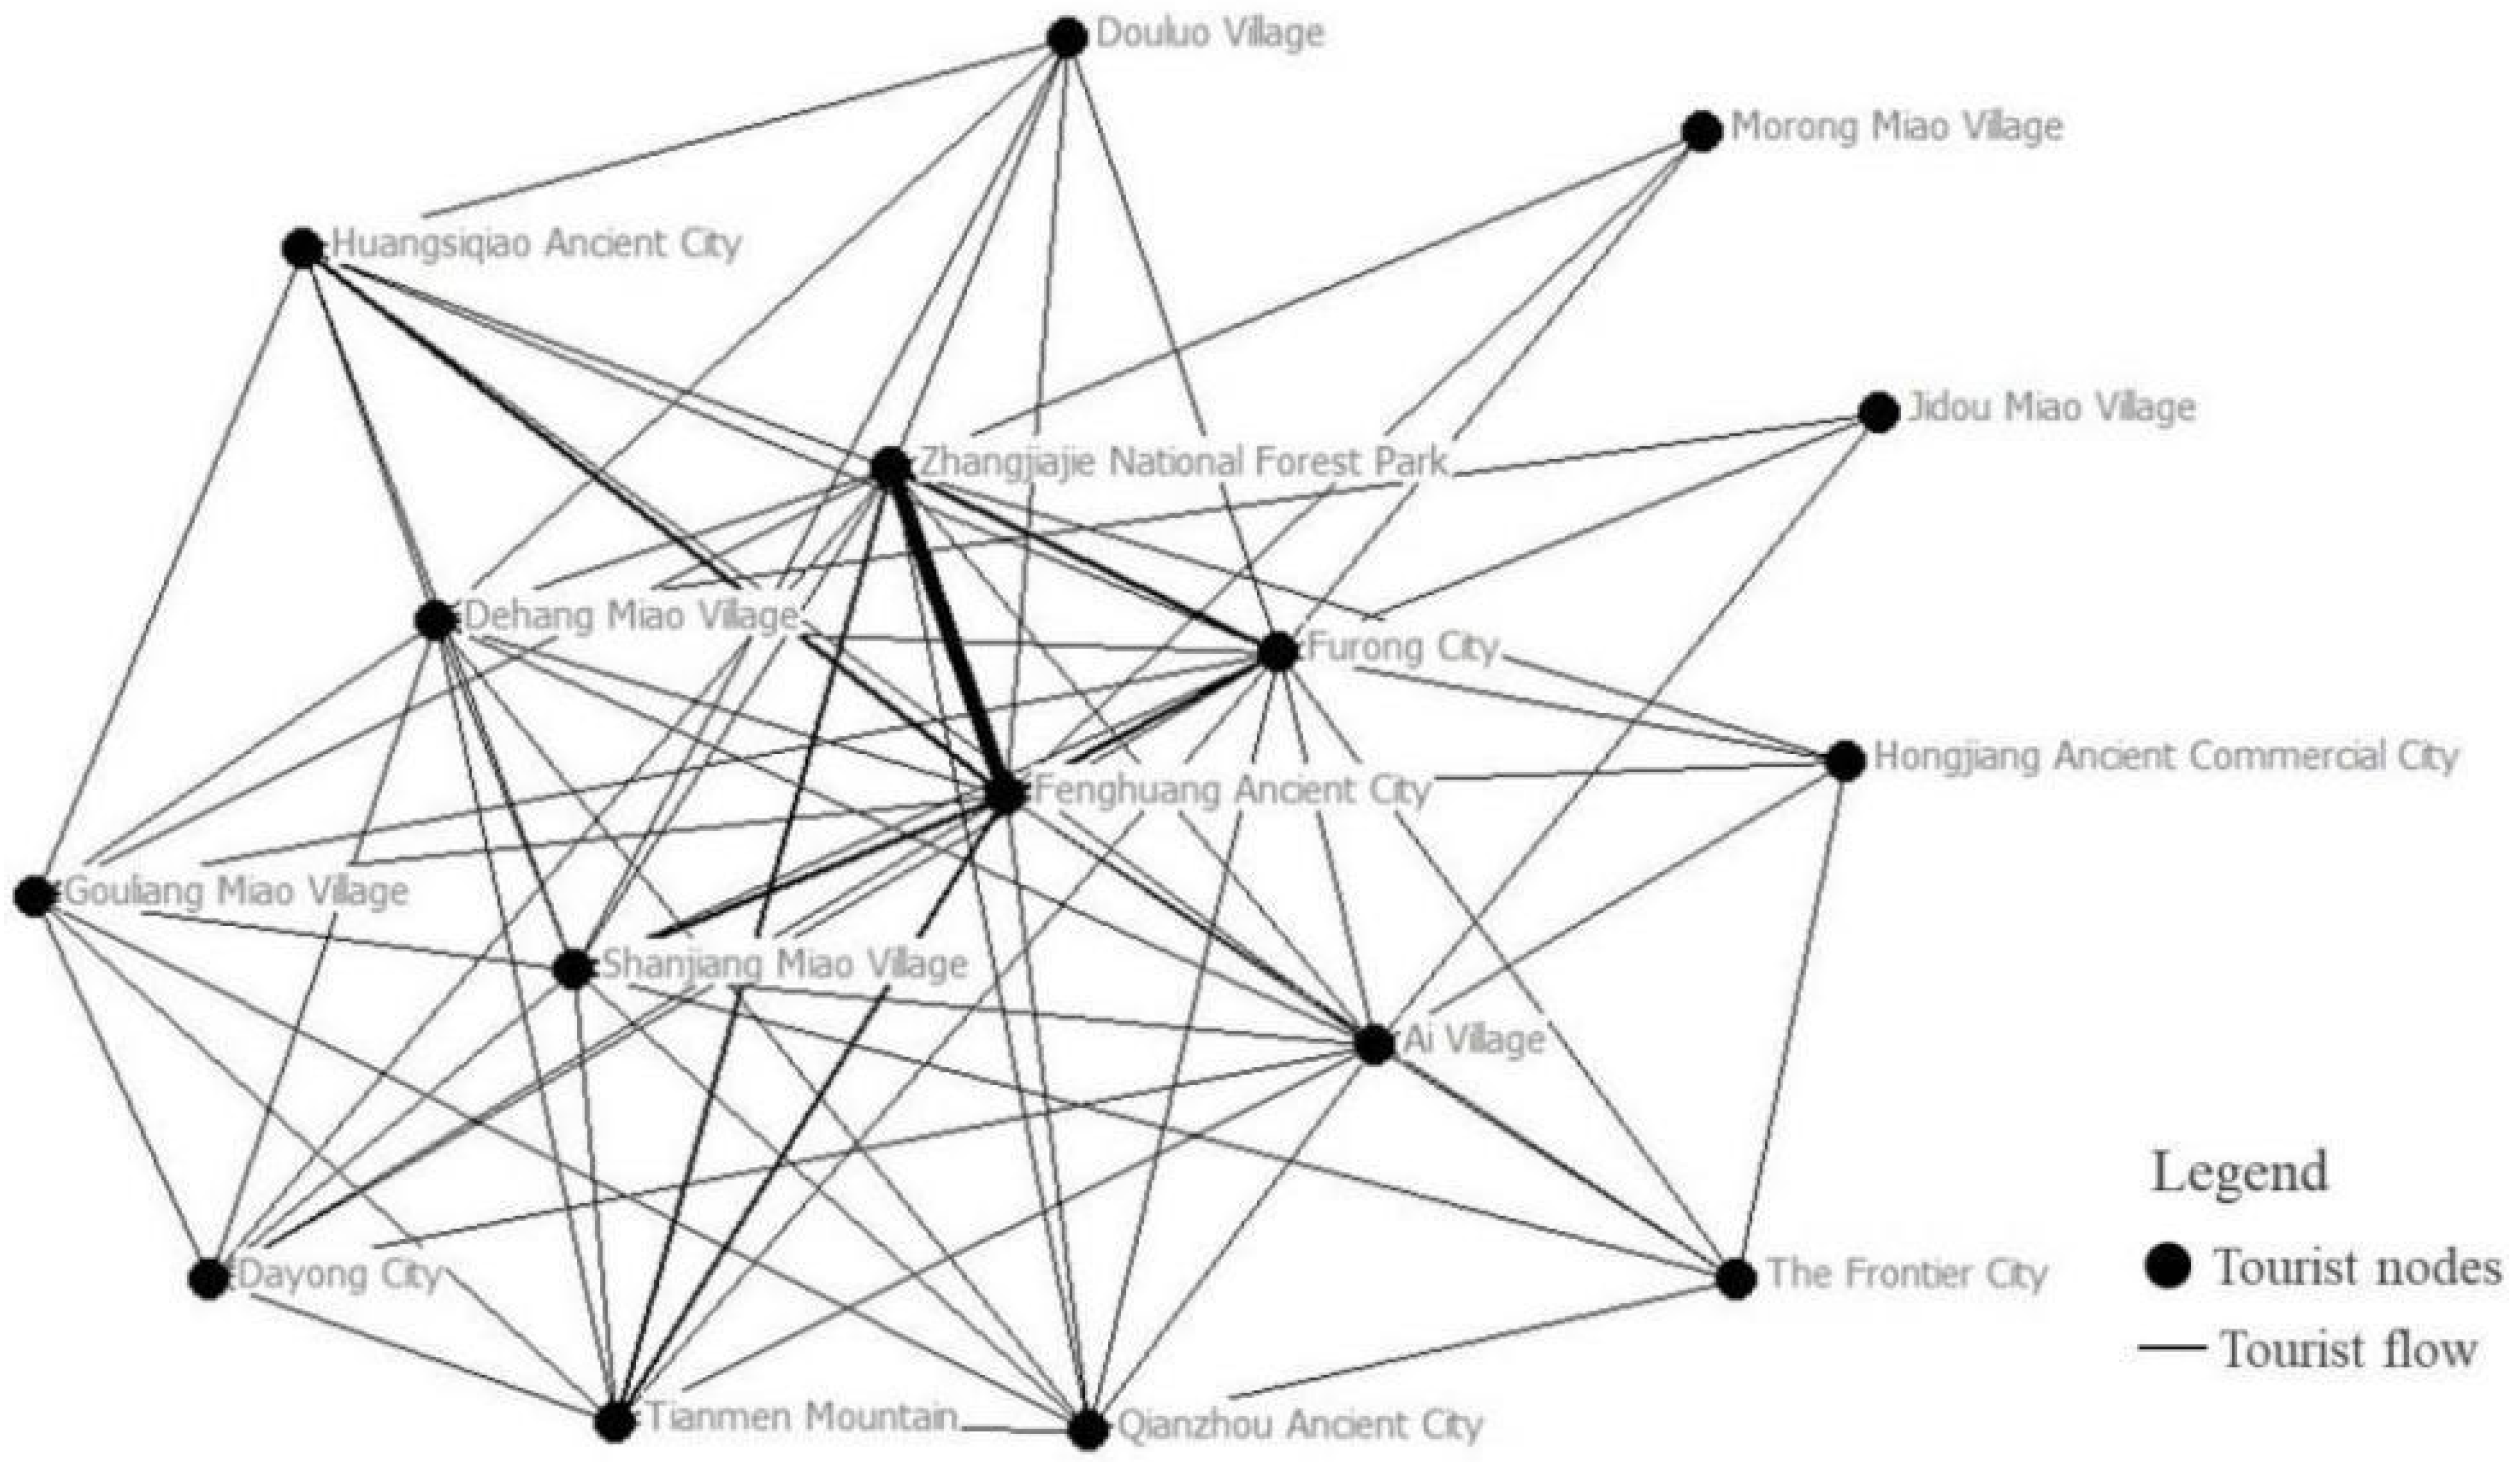
The traditional village tourism routes in Western Hunan reflect the interconnection between tourism nodes and constitute a particular network structure. Hierarchizing and visualizing traffic between tourism nodes would reflect the spatial trajectory of tourists and show the attributes and interconnectedness of tourism activities. The dichotomous matrix data were imported into NetDraw, and the attribute text was added to specify the passenger flow between nodes and highlight the network core. The thickness of lines between tour nodes was then modified to generate the network structure of tourism flows in traditional villages. The thicker the line, the higher the flow.
As shown in Figure 5, the nodes with high tourism flows were Fenghuang Ancient City, Zhangjiajie National Forest Park, Furong Town, and Tianmen Mountain. These nodes are the core points of the tourism flow network system [52] and have more interactive links with other nodes. The node pairs with the highest passenger flows were Fenghuang Ancient City–Zhangjiajie National Forest Park, Zhangjiajie National Forest Park–Tianmen Mountain, Phoenix Ancient City–Furong Town, and Phoenix Ancient City–Tianmen Mountain. The ancient city of Fenghuang occupies a central position in the network, assuming a tourism distribution function and serving as a first-class distribution center for the development of traditional villages tourism in Western Hunan. Hongjiang Ancient Commercial City, Jidou Miao Village, Morong Miao Village, and other tourist nodes are less connected to other scenic spots and have been developed independently.
5.2. Flow Network Characteristics
5.2.1. Scale and Density
Network scale can reflect the number of all possible relationships in the directed tourism network graph, while network density can indicate the closeness of node connections. Theoretically, the maximum number of node links in the tourism network is 240; however, only 134 were observed. The low number of node links in the network and the low network density (0.275) mean poor network effects. The results suggest that the connection between the traditional village tourism nodes in Xiangxi is not strong, and the overall tourism route is less.
5.2.2. Centrality Analysis
Centrality analysis can quantitatively measure node position to reflect its relative importance in the network structure and includes node centrality and network centralization. Node centrality indicates the central location of a single tourism node. It can be further divided into degree centrality (identifying tourism nodes at the network core), closeness centrality (expressing the network position of a tourism node in terms of its distance to other tourism nodes), and betweenness centrality (measuring the control and dependence of tourism nodes on other nodes). Network centralization reflects the centrality of the entire network [14,57].
In Table 3, the mean value for centrality of all the nodes in the tourism flow network was calculated to be 4.12. This means that, on average, each tourism node has a connection and distribution relationship with at least four other nodes. Fenghuang Ancient City, Zhangjiajie National Forest Park, and Furong Town have the highest centrality among all the tourism nodes and have the strongest connection and distribution functions in the overall network. The degree of inward centralization was 63%, while the degree of outward centralization was 56%. These values indicate some level of unevenness in the network. In particular, Zhangjiajie National Forest Park, Fenghuang Ancient City, Furong Town, Ai Village, Dehang Miao Village, and Shanjiang Miao Village had above average inward and outward centrality values and exhibited stronger agglomeration and radiation capacities compared with other nodes.
In terms of closeness centrality (see Table 3), the average outward closeness centrality was 34.65, while the average inward closeness centrality was 27.30. Based on the closeness centrality values, the tourism nodes can be grouped into three. The first group comprises nodes with “double high” closeness centrality and includes the Zhangjiajie National Forest Park, Fenghuang Ancient Town, Furong Town, Ai Village, Tianmen Mountain, Dehang Miao Village, Shanjiang Miao Village, and Huangsiqiao Ancient City. These nodes have outward and inward closeness centrality indices higher than the average, indicating that they are well connected to other tourism nodes and are at the center of the entire social network. The second group comprises nodes with high inward and low outward closeness centrality and includes Biancheng and Jidou Miao Village. The nodes in the second group have large differences between the outward and inward closeness centrality, with the inward values higher than the outward. These nodes have a weak ability to spread to other nodes but a strong ability to agglomerate. The third category is composed of nodes with low inward and high outward closeness centrality and includes the Morong Miao Village. The outward closeness centrality of these nodes is much higher than their inward values, indicating a stronger ability to spread to other nodes. The nodes are directly connected to core nodes, are less dependent on other nodes, and have weak agglomeration ability, as shown in Figure 5. For instance, Morong Miao Village is directly connected to the core points, Fenghuang Ancient City, Zhangjiajie National Forest Park, and Furong Town.
In terms of betweenness centrality (see Table 3), the mean value for all nodes was 9, indicating that, on average, each tourism node acts as an intermediary for about nine tourism flows. The betweenness centrality index for the ancient city of Fenghuang was 94.783, much higher compared to other nodes, which suggests that this tourism node has the strongest control over other nodes. The betweenness centrality for Biancheng, Douluozhai, Jidou Miao Village, and Dayong Ancient City was 0, indicating that these nodes have minimal control and dependence on other tourism nodes. The network betweenness centralization was 43.57%, which is relatively low, meaning that more tourism nodes are connected through core nodes [18].
The network node distribution of traditional village tourism flows in Xiangxi is generally uneven; more tourism nodes would have to be linked to core nodes. The prominent core nodes are Fenghuang Ancient City, Zhangjiajie National Forest Park, and Furong Town. They have pronounced structural advantages and play important roles as gathering, radiation, and intermediary points. Some core tourism nodes, such as Biancheng, Jidou Miao Village, and Qianzhou Ancient City, have few links connecting them with other tourism nodes. To improve their tourism potential, tourism routes that would integrate these points with other core nodes should be developed, and their transport facilities should be improved to encourage tourist traffic.
5.2.3. Cohesive Subgroups Analysis
Using tourist route data in UCINET, along the Network → Roles&Positions → Structural → CONCOR path, the cohesive subgroup analysis was carried out to explore the substructure within the network and analyze tourist preference for portfolio routes [58]. Eight cohesive subgroups and their density data were obtained and are summarized in Table 4. The internal connection for subgroup 1 was extremely close (tightness of 1) and much higher than the overall tourism flow network density.
The results show that subgroup 1 has a correlation effect with other subgroups except with subgroup 2 and had the highest connection density with subgroup 7. The tourism nodes Zhangjiajie National Forest Park and Phoenix Ancient City in subgroup 1 served as the core nodes in the centrality analysis. Subgroup 2 was very poorly connected internally, with a density of 0, and had no connection with other subgroups. Subgroup 3 was most closely linked to subgroup 4, followed by subgroups 1 and 8, valued at 0.75; its correlation with subgroup 6 was weak at 0.25. Subgroup 4 was more closely connected with subgroups 1, 2, and 3. The subgroup 5 nodes Biancheng, Morong Miao Village, and Hongjiang Ancient Commercial City were in the marginal position in the centrality analysis and exhibited weak connections with other subgroups. Subgroup 6 was moderately connected to subgroups 1, 3, and 8 with decreasing density. Subgroup 7 was closely linked to subgroup 8 at 0.75 density, while subgroup 8 was more closely connected to subgroups 1, 3, and 7. The results from the tabular data feature analysis of the corresponding point clusters (see Table 3) indicate strong geographical proximity of traditional village paths in Western Hunan.
The cohesive subgroup analysis shows that subgroup 1 is at the core of Xiangxi’s tourism flow network of traditional villages and has high connection density with nearby subgroups. The most popular routes for tourists were Zhangjiajie National Forest Park and Fenghuang Ancient City in subgroup 1, Furong Town and Dehang Miao Village in subgroup 3, Tianmen Mountain and Dayong Ancient City in subgroup 6, Douluozhai and Gouliang Miao Village in subgroup 7, Ai Village and Qianzhou Ancient City in subgroup 4, and Biancheng in subgroup 5.
5.2.4. Core-Edge Analysis
The core-edge structure is a special configuration consisting of several interconnected elements with a tightly linked center and dispersed peripheral coefficients. The core-edge model can be used to determine whether the tourism node is in the core or edge position in the overall network. Discrete core edge analysis was performed using the Network → Core/Periphery → Categorical path to obtain the constituent nodes and density matrix of core edges (Table 5).
The identified core nodes were Zhangjiajie National Forest Park, Furong Town, Fenghuang Ancient City, Tianmen Mountain, Dehang Miao Village, Huangsiqiao Ancient City, and Shanjiang Miao Village, while the rest were edge nodes, similar to the results of previous analyses. As shown in Table 5, the density between core nodes was 0.762, much higher than the overall network density (0.275). The density between the core and edge nodes is close to the overall network density. The results indicate that the core nodes have a particular driving influence on the edge nodes but that this role may gradually weaken as the distance increases. The density between edge nodes was 0.042, indicating a clear structural stratification in the tourism network. The strong connectivity between core nodes helps strengthen their competitive advantage to the detriment of the edge tourism nodes. Therefore, it is very necessary to promote the linked development of the core and periphery by optimizing transport infrastructure and planning tourism routes to enhance the overall competitiveness of traditional village tourism in western Hunan.
6. Conclusions and Recommendations
6.1. Conclusions
Using travelogue data from popular online travel websites, the ArcGIS spatial analysis and the social network analysis were used to analyze the spatio-temporal distribution and network structure of the tourism flow for traditional villages in Western Hunan. The main conclusions are as follows:
- (1)
- April to October is the peak period of tourism flow in traditional villages in Western Hunan, particularly in the months of April and May. The least passenger flow occurs during winter, while the other seasons have little overall variability. Largely influenced by holidays and weather conditions, short-term tourism is more preferred, with one-day and three-day tour packages accounting for the highest percentage.
- (2)
- The tourism flow in Xiangxi’s traditional villages is characterized by a “double core and multiple points” spatial distribution pattern, with Fenghuang Ancient Town and Zhangjiajie National Forest Park as core and pronounced concentration of high-grade tourism scenic spots.
- (3)
- In terms of network structure, the overall density of the tourism flow network of traditional villages in Western Hunan is low, with relatively few tourism routes between nodes. Eight cohesive subgroups were identified in the network. Four were found to be closely connected internally, providing clues for the organization of tourism routes, particularly the development of tourism products. The tourism flow network shows a “core-edge” hierarchical structure; Fenghuang Ancient City, Zhangjiajie National Forest Park, and Furong Town are prominent core nodes, and Hongjiang Ancient Commercial City and Morong Miao Village are edge nodes. The core nodes do not have a significant driving effect on the edge nodes.
There are a few main reasons that could explain the research findings. First, the visibility of tourism nodes can significantly alter preference and create (or boost) tourism demand. Many tourists are influenced by the available information about their surroundings, and tourist areas with high visibility are often able to generate high tourist traffic intensity. Social media have also become important sources of information that can significantly alter tourist travel choices and enhance a destination’s reputation. Tianmen Mountain and Zhangjiajie National Forest Park are famous 5A-class attractions, and Fenghuang Ancient City is a world-class historical and cultural tourist attraction, which has strong competitiveness in the network of traditional village tourism streams in western Hunan, and these tourism nodes tend to attract more tourists compared with the limited popularity of Jidou Miao Village, Douluo Miao Village and Gouliang Miao Village, which have a smaller number of tourism flows.
Second is the accessibility of tourism nodes. There is a positive correlation between accessibility and the node’s radiation agglomeration function and tourism flow; the higher the accessibility, the stronger the radiation agglomeration function and the larger the tourism flow, and, on the contrary, poor accessibility may make it difficult to effectively use the high quality tourism resources, and also limit the connection with other nodes and become a network isolated point. For example, Zhangjiajie Railway Station has a direct bus to Zhangjiajie National Forest Park, and the entrance of Tianmen Mountain Scenic Area is near the railway station, which is convenient for tourists to enter, thus promoting tourism development. The lack of mutual direct bus transportation between tourism nodes such as Duoluozhai, Gouliang Miaozhai, and Huangsiqiao Ancient City, and the accessibility of tourism transportation is relatively poor, so it is difficult for tourists to tour western Hunan within a limited period of time.
Location proximity is another important aspect of tourism in Xiangxi’s traditional villages. Tourism nodes in geographical proximity have the advantage of co-development and can form a two-way flow of tourism. For example, Zhangjiajie National Forest Park and Tianmen Mountain are only 32 km away from each other, about 30 min by car, which is convenient for sending each the other’s visitors, thus increasing each their tourist flow and promoting common development, and are in the core position in the overall network; while Hongjiang Ancient Commercial City is geographically distant from other nodes and not closely enough connected. Coupled with its own limited attractiveness, it is in the edge position in the overall network.
Fourth, product homogeneity can significantly affect tourist preferences. If the nodes in the region have strong substitution in tourism resources, it will form a competitive relationship. For example, Fenghuang Ancient City and Hongjiang Ancient Commercial City, tourism projects are based on traditional architecture sightseeing, and there is a certain homogeneity in the sense that the tourism experience does not differ much; tourists prefer the high visibility, accessibility, and tourism services and facilities of Fenghuang Ancient City, and it is thus more unfavorable to the development of similar edge nodes such as Hongjiang Ancient Commercial City.
6.2. Recommendations
In order to further promote the high-quality development of tourism in traditional villages in Western Hunan, the following policy recommendations are proposed.
- (1)
- Thematic tourism products should be cultivated and diversified to meet the needs of different seasons and holidays and to guide off-season consumption. Given the climate of Western Hunan, tourism officials and decision-makers should focus on developing short-distance flower viewing that would stimulate tourism flow in the spring lull period. They should also consider creating short-distance mountain fog and snow viewing to generate tourism in the winter lull period.
- (2)
- Accelerate the construction of core scenic spots and give full play to the role of radiation drive. Relying on Zhangjihuai high-speed railway, focus on the integration of the construction of Zhangjiajie National Forest Park, Tianmen Mountain, Furong Town, and Fenghuang Ancient City four core attractions, open up Zhangjiajie National Forest Park—Dayong Ancient City—Tianmen Mountain—Furong Town—Fenghuang Ancient City and Furong Town—Border Town—Shanjiang Miao Village—Fenghuang Ancient City—Hongjiang Ancient Commercial City, two traditional villages boutique tourism route, drive the development of the surrounding nodes such as Ai Village, Gouliang Miao Village, and Douluo Miao Village.
- (3)
- The transportation infrastructure and accessibility of marginal nodes, such as Morong Miao Village and Hongjiang Ancient Commercial City, should be upgraded and expanded to help stimulate tourism intensity. Broadcast media and different social media platforms should be tapped to advertise less-publicized nodes to improve their tourism intensities and highlight their unique appeal. Tourism resources should be allocated prudently in strategies and construction that would enable the integrated development of traditional village tourism in Western Hunan.
- (4)
- Investments in tourism product research, development, innovation, and branding should be increased to address the changes in consumer preference and variations in market demands. For example, attractions such as Jidou Miao Village and Shanjiang Miao Village can repackage and redesign the ethnic diet and launch special Miao rice, and hold do-it-yourself competitions for Miao handicrafts to give traditional handicrafts new connotation and modern flavor and increase tourists’ sense of participation and experience.
Based on network travel data and with the help of social network theory, this paper explored the spatio-temporal characteristics and network structure of traditional village tourism flows, expanding new data sources and analytical tools for the study of traditional village tourism flows and making up for the shortcomings of quantitative research on traditional village tourism flows. This helps explore the flow patterns of traditional village tourism flows and discover the differences in the spatial and temporal distribution of traditional village tourism flows, network connections, and influencing factors. The results provide specific reference values for traditional village tourism development, scenic area planning, construction, and marketing and have important practical significance for the regional coordination and sustainable development of traditional village tourism.
However, it should be noted that this study only selected the top 16 traditional village nodes in terms of visitation rate from two websites, Ctrip and Where to go, in building the tourism flow network structure. The sample selection has certain limitations, and the online travelogues belong to the tourists’ recollection of the tourism activity process, which may deviate from the real situation. In addition, the factors influencing the tourism flow characteristics of traditional villages were mainly analyzed in four aspects: tourism node popularity, tourism node accessibility, location proximity, and product homogeneity, which are insufficient to illustrate all phenomena of the tourism flow system.
As big data continues to be used in tourism research and practice, the fusion of multiple sources of data and the use of mixed research methods will become a trend in future tourism flow research. Future research can fuse multi-source data types (e.g., network data and statistical data), select a wider range of tourism nodes, explore the flow patterns of traditional village tourism flows, and further explore the impact mechanisms of traditional village tourism flows for more comprehensive and objective analyses and discussion.
Author Contributions
Conceptualization, C.L. and Y.Q.; methodology, Y.Q.; software, Y.W. and Y.Y.; validation, Y.Q. and G.L.; formal analysis, C.L. and Y.Q.; investigation, C.L.; resources, C.L.; writing—original draft preparation, Y.Q. and C.L.; writing—review and editing, C.L. and G.L.; visualization, Y.Q.; supervision, C.L.; project administration, C.L.; funding acquisition, C.L. All authors have read and agreed to the published version of the manuscript.
Funding
This research was funded by the Natural Science Foundation of Hunan Province (2022JJ30388), the Scientific Research Project of Hunan Provincial Department of Education (20B362), the Project of Hunan Provincial Social Science Achievement Review Committee (XSP21YBC106), and the Construction Project of First-class Discipline of Geography in Hunan Province (Geography-5010002).
Institutional Review Board Statement
Not applicable.
Informed Consent Statement
Not applicable.
Data Availability Statement
The data that support the findings of this study are available from the corresponding author upon reasonable request.
Conflicts of Interest
The authors declare no conflict of interest.
References
- Wu, B. Traditional village conservation and revitalisation based on rural tourism. Soc. Sci. 2016, 2, 7–9. (In Chinese) [Google Scholar]
- Lu, L.; Ren, Y.; Zhu, D.; Cheng, J.M.; Yang, X.; Yang, Z.; Yao, J.M. The research framework and prospect of rural revitalization led by rural tourism. Geogr. Res. 2019, 38, 102–118. (In Chinese) [Google Scholar]
- Lu, L.; Ren, Y.; Xu, Y. Theoretical framework and research prospect of “ruralismecology”space of urban agglomeration constructed by tourism. Acta Geogr. Sin. 2019, 74, 1267–1278. (In Chinese) [Google Scholar]
- Gao, J.; Wu, B. Revitalizing traditional villages through rural tourism: A case study of Yuanjia Village, Shaanxi Province, China. Tour. Manag. 2017, 63, 223–233. [Google Scholar] [CrossRef]
- Lihua, G. Research on the Protection and Tourism Development Strategy of the Traditional Village. Agro Food Ind. Hi-Tech 2017, 28, 1127–1131. [Google Scholar]
- Wu, D.L.; Xiangxi Tujia and Miao Autonomous Prefecture Government Website. Fenghuang County: National Day Holiday Received 757,900 Visitors. 2021. Available online: http://www.xxz.gov.cn/zwyw/zwlb/xsdt/202110/t20211011_1831748.html (accessed on 24 March 2022).
- Tang, S.; Guo, L. Research on tourism flow system. Tour. Trib. 1998, 3, 38–41. (In Chinese) [Google Scholar]
- Woosnam, K.M.; Shafer, C.S.; Scott, D.; Timothy, D.J. Tourists’ perceived safety through emotional solidarity with residents in two Mexico–United States border regions. Tour. Manag. 2015, 46, 263–273. [Google Scholar] [CrossRef]
- Wu, W.; Zhang, L.; Qiu, F. Determinants of tourism ticket pricing for ancient villages and towns: Case studies from Jiangsu, Zhejiang, Shanghai and Anhui provinces. Tour. Manag. 2017, 58, 270–275. [Google Scholar] [CrossRef]
- Munjal, P.G. Enhancing heritage tourism in small and medium towns by leveraging their cultural heritage, traditional knowledge and skills. Worldw. Hosp. Tour. Themes 2019, 11, 87–98. [Google Scholar] [CrossRef]
- Xi, J.; Wang, X.; Kong, Q.; Nan, Z. Spatial morphology evolution of rural settlements induced by tourism:A comparative study of three villages in Yesanpo tourism area, China. Acta Geogr. Sin. 2015, 25, 497–511. [Google Scholar]
- Hu, I.-L.; Chang, C.-C.; Lin, Y.-H. Using big data and social network analysis for cultural tourism planning in Hakka villages. Tour. Hosp. Res. 2021, 21, 99–114. [Google Scholar] [CrossRef]
- Bucurescu, I. Managing tourism and cultural heritage in historic towns: Examples from Romania. J. Herit. Tour. 2015, 10, 248–262. [Google Scholar] [CrossRef]
- Liu, F.; Zhang, J.; Zhang, J.; Chen, D.; Liu, Z.; Lu, S. Roles and functions of tourism destinations in tourism region of south anhui: A tourist flow network perspective. Chin. Geogr. Sci. 2012, 22, 755–764. [Google Scholar] [CrossRef]
- Zhang, Y.; Li, J.; Yang, M. The Tourism Flow Network Structure of Xi’an Based on Tourism Digital Footprint. Hum. Geogr. 2014, 29, 111–118. (In Chinese) [Google Scholar]
- Chua, A.; Servillo, L.; Marcheggiani, E.; Moere, A.V. Mapping Cilento: Using geotagged social media data to characterize tourist flows in southern Italy. Tour. Manag. 2016, 57, 295–310. [Google Scholar] [CrossRef]
- Salas-Olmedo, M.H.; Moya-Gómez, B.; García-Palomares, J.C.; Gutiérrez, J. Tourists’ digital footprint in cities: Comparing Big Data sources. Tour. Manag. 2018, 66, 13–25. [Google Scholar] [CrossRef] [Green Version]
- Yang, X.; Gu, C.; Wang, Q. Urban tourism flow network structure construction in Nanjing. Acta Geogr. Sin. 2007, 62, 609–620. (In Chinese) [Google Scholar]
- Chen, C.; Ma, H.; Chen, N.; Chen, H. The evolution of network gravity center for rural residents tourist flow in China. Geogr. Res. 2014, 33, 1306–1314. [Google Scholar]
- Li, S.; Du, S. An Empirical Study on the Coupling Coordination Relationship between Cultural Tourism Industry Competitiveness and Tourism Flow. Sustainability 2021, 13, 5525. [Google Scholar] [CrossRef]
- Chen, R.; Liang, C.Y.; Hong, W.C.; Gu, D.X. Forecasting holiday daily tourist flow based on seasonal support vector regression with adaptive genetic algorithm. Appl. Soft Comput. 2015, 26, 435–443. [Google Scholar] [CrossRef]
- Gustavsson, P.; Nordströrm, J. The impact of seasonal unit roots and vector ARMA modelling on forecasting monthly tourism flows. Tour. Econ. 2001, 7, 117–134. [Google Scholar] [CrossRef]
- Kim, J.H.; Ngo, M.T. Modelling and forecasting monthly airline passenger flows among three major Australian cities. Tour. Econ. 2001, 7, 397–412. [Google Scholar] [CrossRef]
- Connell, J.; Page, S.J. Exploring the spatial patterns of car-based tourist travel in Loch Lomond and Trossachs National Park, Scotland. Tour. Manag. 2008, 29, 561–580. [Google Scholar] [CrossRef] [Green Version]
- Wang, D. Impact of Beijing-Shanghai high-speed railway on the spatial and temporal distribution of tourism flows at major stations. Tour. Trib. 2014, 1, 75–82. (In Chinese) [Google Scholar]
- Hamilton, J.M.; Maddison, D.J.; Tol, R.S.J. Effects of climate change on international tourism. Clim. Res. 2005, 29, 245–254. [Google Scholar] [CrossRef] [Green Version]
- Prideaux, B. Factors affecting bilateral tourism flows. Ann. Tour. Res. 2005, 32, 780–801. [Google Scholar] [CrossRef]
- Li, A.; Mou, N.; Zhang, L.; Yang, T.; Liu, W.; Liu, F. Tourism Flow Between Major Cities During China’s National Day Holiday: A Social Network Analysis Using Weibo Check-in Data. IEEE Access 2020, 8, 225675–225691. [Google Scholar] [CrossRef]
- Zeng, B. Pattern of Chinese tourist flows in Japan: A Social Network Analysis perspective. Tour. Geogr. 2018, 20, 810–832. [Google Scholar] [CrossRef]
- Raun, J.; Ahas, R.; Tiru, M. Measuring Tourism Destinations Using Mobile Tracking Data. Tour. Manag. 2016, 57, 202–212. [Google Scholar] [CrossRef]
- Zhang, K.; Chen, Y.; Li, C. Discovering the Tourists’Behaviors and Perceptions in a Tourism Destination by Analyzing Photos’ Visual Content with a Computer Deep Learning Model: The Case of Beijing. Tour. Manag. 2019, 75, 595–608. [Google Scholar] [CrossRef]
- Hwayoon, S.; George, A.; Barnett; Yoonjae, N. A Social Network Analysis of International Tourism Flow. Qual. Quant. 2021, 55, 419–439. [Google Scholar]
- Jansen-Verbeke, M.; Spee, R. A regional analysis of tourist flows within Europe. Tour. Manag. 1995, 16, 73–82. [Google Scholar] [CrossRef]
- Wang, D.; Chen, T.; Lu, L.; Wang, L.; Alan, A.L. Mechanism and HSR effect of spatial structure of regional tourist flow: Case study of Beijing-Shanghai HSR in China. J. Geogr. 2015, 70, 214–233. (In Chinese) [Google Scholar]
- Mou, N.; Zheng, Y.; Makkonen, T.; Yang, T.; Tang, J.J.; Song, Y. Tourists’ digital footprint: The spatial patterns of tourist flows in Qingdao, China. Tour. Manag. 2020, 81, 104151. [Google Scholar] [CrossRef]
- Ta, V.D.; Liu, C.M.; Nkabinde, G.W. Big data stream computing in healthcare real-time analytics. In Proceedings of the 2016 IEEE International Conference on Cloud Computing and Big Data Analysis (ICCCBDA), Chengdu, China, 5–7 July 2016; pp. 5–15. [Google Scholar]
- Jia, T.; Junyi, L. Spatial network of urban tourist flow in Xi’an based on microblog big data. J. China Tour. Res. 2016, 12, 5–23. [Google Scholar]
- Wang, J.; Wang, G.; Liu, Y. Spatio-temporal distribution and network structure of red tourism flow in Jinggangshan. J. Nat. Resour. 2021, 36, 1777–1791. (In Chinese) [Google Scholar] [CrossRef]
- Wang, J.; Hu, J.; Jia, Y.Y.; Liu, D.J.; Xu, X.T.; Zhu, L. City Tourism Flow Network Structure and Transportation Mode-Taking Wuhan DIY Tourists for Example. Econ. Geogr. 2016, 36, 176–184. (In Chinese) [Google Scholar]
- Lew, A.; McKercher, B. Modeling tourist movements: A local destination analysis. Ann. Tour. Res. 2006, 33, 403–423. [Google Scholar] [CrossRef]
- Asakura, Y.; Iryo, T. Analysis of tourist behaviour based on the tracking data collected using a mobile communication instrument. Transp. Res. Part A Policy Pract. 2007, 41, 684–690. [Google Scholar] [CrossRef]
- Mou, N.; Yuan, R.; Yang, T.; Zhang, H.; Tang, J.J.; Makkonen, T. Exploring spatio-temporal changes of city inbound tourism flow: The case of Shanghai, China. Tour. Manag. 2020, 76, 103955. [Google Scholar] [CrossRef]
- Xu, X.; Yang, H.; Li, C. Theoretical Model and Actual Characteristics of Air Pollution Affecting Health Cost: A Review. Int. J. Environ. Res. Public Health 2022, 19, 3532. [Google Scholar] [CrossRef] [PubMed]
- Lu, S.; Lu, L.; Wang, L.; Wang, Y. Temporal Characteristics of Tourist Flows to Ancient Villages-A Case Study of Two World Cultural Heritages Xidi Village and Hongcun Village. Sci. Geogr. Sin. 2004, 2, 250–256. (In Chinese) [Google Scholar]
- Leung, X.Y.; Wang, F.; Wu, B.; Bai, B.; Stahura, K.A.; Xie, Z. A social networkanalysis of overseas tourist movement patterns in Beijing: The impact of the Olympic Games. Int. J. Tour. Res. 2012, 14, 469–484. [Google Scholar] [CrossRef]
- Ma, Y.; Yang, W.; Xu, G.; Tai, X. Multilevel visualization of travelogue trajectory data. ISPRS Int. J. Geo-Inf. 2018, 7, 12. [Google Scholar] [CrossRef] [Green Version]
- Shih, H.Y. Network Characteristics of Drive Tourism Desti- nations: An Application of Network Analysis in Tourism. Tour. Manag. 2006, 27, 1029–1039. [Google Scholar] [CrossRef]
- Fu, Q.; Liu, D.; Hu, J.; Xie, S.; Gong, J.; Chen, X. Network Structure and Optimization Research on the Hubei Province Tourist Flow. Econ. Geogr. 2015, 35, 191–196. (In Chinese) [Google Scholar]
- Liu, X.; Shi, P.; Zhao, R. Spatial network structure and optimization of self—help tourism in Gansu-Qinghai-Ningxia region. J. Arid. Land Resour. Environ. 2018, 32, 197–203. (In Chinese) [Google Scholar]
- Shi, Q.B.; Xie, Y.S.; Han, Z.L.; Liu, T.B.; Liu, G.C.; Du, P. Spatial Structure and Spatial Development Patterns of Urban Tourism Economic Connections in Northeast China. Econ. Geogr. 2018, 38, 211–219. (In Chinese) [Google Scholar]
- Dong, Z.; Li, X.; Li, C. Evolvement and Driving Mechanism of Tourism Economic Network Structure in Xinjiang. Areal Res. Dev. 2018, 37, 106–111. [Google Scholar]
- Fu, J.; Zhou, J.; Deng, Y. Heritage values of ancient vernacular residences in traditional villages in Western Hunan, China: Spatial patterns and influencing factors. Build. Environ. 2021, 188, 107473. [Google Scholar] [CrossRef]
- Chunla, L.; Mei, X.; Peilin, L.; Fanchao, Z. Cultural landscape protection compensation model of traditional villages and its application in Xiangxi. Acta Geogr. Sin. 2020, 75, 382–397. (In Chinese) [Google Scholar]
- Hunan Provincial Development and Reform Commission. Notice on the Issuance of the “Fourteenth Five-Year” Cultural and Ecological Tourism in the Greater Western Hunan Area Brand Quality Upgrade Project Implementation Plan. 2021. Available online: http://fgw.hunan.gov.cn/fgw/xxgk_70899/gzdtf/gzdt/202111/t20211102_20964237.html (accessed on 22 March 2022).
- Rong, H.; Tao, Z. Hotspot identification and cause analysis of rural tourism based on website data: Take Jiangsu province as an example. J. Nat. Resour. 2020, 35, 2848–2861. (In Chinese) [Google Scholar]
- Hou, H.; Wang, J.; Ren, W.; Jia, S. Research on Characteristics of Tourism Flow Networks of A-level Scenic Spots in Henan Province Based on Digital Footprint. Areal Res. Dev. 2022, 41, 91–97. (In Chinese) [Google Scholar]
- Liu, F.; Zhang, J.; Chen, D. Net structure characters and causes of China’s inbound tourism. Acta Geogr. Sin. 2010, 65, 1013–1024. (In Chinese) [Google Scholar]
- Liu, J. Introduction to Social Network Analysis; Social Science Literature Press: Shanghai, China, 2004; pp. 92–101. (In Chinese) [Google Scholar]
Figure 1.
Location of the study area.

Figure 2.
Time variation of traditional village tourists.

Figure 3.
Duration of stay of traditional village tourists.

Figure 4.
Nuclear density of traditional village tourism flow.

Figure 5.
Network structure of tourist flows in traditional villages in Western Hunan.


Table 1.
Traditional village tourist nodes in Western Hunan.
| Serial Number | Tourism Nodes | Visit Rate |
|---|---|---|
| 1 | Fenghuang Ancient City | 36.67% |
| 2 | Zhangjiajie National Forest Park | 15.16% |
| 3 | Furong Town | 8.00% |
| 4 | Shanjiang Miao Village | 6.70% |
| 5 | Tianmen Mountain | 6.59% |
| 6 | Huangsiqiao Ancient City | 6.52% |
| 7 | Dehang Miao Village | 4.67% |
| 8 | Ai Village | 3.39% |
| 9 | Gouliang Miao Village | 2.58% |
| 10 | Dayong Ancient City | 2.14% |
| 11 | Douluo Village | 1.29% |
| 12 | Qianzhou Ancient City | 0.88% |
| 13 | The Frontier City | 0.48% |
| 14 | Hongjiang Ancient Commercial City | 0.29% |
| 15 | Jidou Miao Village | 0.22% |
| 16 | Morong Miao Village | 0.18% |
Table 2.
Indexes of the tourism network and its calculation formula.
| Indicator | Formula | Explanation |
|---|---|---|
| Network size | The number of all possible relation-ships in the travel network, is the number of travel nodes. | |
| Density | The ratio of the number of relationships in the tourism network to the number of relationships that could theoretically exist [0, 1]. If there is a direct connec-tion between two nodes i and j, ; otherwise, 0. | |
| Centrality | is the centrality of attraction is the centrality of the whole network, and are the in and out degrees of attraction i, respectively | |
| Centralization |
Table 3.
Indicators of network centralization.
| Tourism Nodes | Degree Centrality | Closeness Centrality | Betweenness Centrality | ||
|---|---|---|---|---|---|
| Out-Degree | In-Degree | Out-Degree | In-Degree | ||
| Zhangjiajie National Forest Park | 7 | 5 | 40.541 | 28.302 | 4.5 |
| Furong Town | 8 | 6 | 41.667 | 28.846 | 9.05 |
| Fenghuang Ancient City | 12 | 13 | 46.875 | 33.333 | 94.783 |
| Biancheng | 0 | 1 | 6.25 | 34.884 | 0 |
| Ai Village | 6 | 5 | 39.474 | 28.302 | 16.15 |
| Tianmen Mountain | 6 | 4 | 38.462 | 27.778 | 2.983 |
| Douluo Village | 3 | 2 | 34.884 | 26.786 | 0 |
| Jidou Miao Village | 0 | 1 | 6.25 | 29.412 | 0 |
| Dehang Miao Village | 5 | 7 | 38.462 | 29.412 | 7.467 |
| Gouliang Miao Village | 2 | 4 | 34.091 | 27.778 | 0.25 |
| Shanjiang Miao Village | 5 | 6 | 37.5 | 28.846 | 4.95 |
| Qianzhou Ancient City | 3 | 3 | 36.585 | 25 | 0 |
| Dayong City | 2 | 3 | 34.091 | 27.273 | 0 |
| Huangsiqiao Ancient City | 5 | 5 | 37.5 | 28.302 | 3.867 |
| Hongjiang Ancient Commercial City | 1 | 1 | 33.333 | 26.316 | 0 |
| Morong Miao Village | 1 | 0 | 48.387 | 6.25 | 0 |
| Mean | 4.125 | 4.125 | 34.647 | 27.301 | 9 |
| S.D. | 3.16 | 3.059 | 11.484 | 5.92 | 22.576 |
| Sum | 66 | 66 | 554.35 | 436.818 | 144 |
| centralization/% | 56 | 63.11 | - | - | 43.57 |
Table 4.
Density matrix of cohesive subgroup.
| Subgroup | 1 | 2 | 3 | 4 | 5 | 6 | 7 | 8 |
|---|---|---|---|---|---|---|---|---|
| 1 | 1 | 0 | 1 | 0.5 | 0.333 | 1 | 0.75 | 0.5 |
| 2 | 0 | 0 | 0 | 0 | 0 | 0 | 0 | 0 |
| 3 | 0.75 | 0 | 1 | 1 | 0 | 0.25 | 0 | 0.75 |
| 4 | 0.75 | 0.5 | 0.75 | 1 | 0 | 0 | 0 | 0 |
| 5 | 0.333 | 0 | 0 | 0 | 0 | 0 | 0 | 0 |
| 6 | 1 | 0 | 1 | 0.5 | 0.333 | 1 | 0.75 | 0.5 |
| 7 | 0 | 0 | 0 | 0 | 0 | 0 | 0 | 0 |
| 8 | 0.75 | 0 | 1 | 1 | 0 | 0.25 | 0 | 0.75 |
Note: R-squared = 0.660. 1 subgroup: Zhangjiajie National Forest Park, Fenghuang Ancient City; 2 subgroup: Jidou Miao Village; 3 subgroup: Furong Town, Dehang Miao Village; 4 subgroup: Qianzhou Ancient City, Ai Village; 5 subgroup: Biancheng, Morong Miao Village, Hongjiang Ancient Commercial City; 6 subgroup: Dayong Ancient City, Tianmen Mountain; 7 subgroup: Douluo Village, Gouliang Miao Village; 8 subgroup: Shanjiang Miao Village, Huangsiqiao Ancient City.
Table 5.
Core-edge density matrix.
| Core | Edge | |
|---|---|---|
| Core | 0.762 | 0.270 |
| Edge | 0.222 | 0.042 |
Note: Figure 5 shows the topology diagram. The node city locations are not related to the actual geographical location.
Publisher’s Note: MDPI stays neutral with regard to jurisdictional claims in published maps and institutional affiliations. |
© 2022 by the authors. Licensee MDPI, Basel, Switzerland. This article is an open access article distributed under the terms and conditions of the Creative Commons Attribution (CC BY) license (https://creativecommons.org/licenses/by/4.0/).
Share and Cite
MDPI and ACS Style
Liu, C.; Qin, Y.; Wang, Y.; Yu, Y.; Li, G. Spatio-Temporal Distribution of Tourism Flows and Network Analysis of Traditional Villages in Western Hunan. Sustainability 2022, 14, 7943. https://doi.org/10.3390/su14137943
AMA Style
Liu C, Qin Y, Wang Y, Yu Y, Li G. Spatio-Temporal Distribution of Tourism Flows and Network Analysis of Traditional Villages in Western Hunan. Sustainability. 2022; 14(13):7943. https://doi.org/10.3390/su14137943
Chicago/Turabian StyleLiu, Chunla, Yingjie Qin, Yufei Wang, Yue Yu, and Guanghui Li. 2022. "Spatio-Temporal Distribution of Tourism Flows and Network Analysis of Traditional Villages in Western Hunan" Sustainability 14, no. 13: 7943. https://doi.org/10.3390/su14137943
Note that from the first issue of 2016, this journal uses article numbers instead of page numbers. See further details here.