
A Review on Supply Costs and Prices of Residual Biomass in Techno-Economic Models for Europe


1
Deutsches Biomasseforschungszentrum Gemeinnützige GmbH—DBFZ, 04347 Leipzig, Germany
2
Helmholtz Center for Environmental Research—UFZ, 04318 Leipzig, Germany
3
Faculty of Economic Science, University of Leipzig, 04103 Leipzig, Germany
*
Author to whom correspondence should be addressed.
Sustainability 2022, 14(12), 7473; https://doi.org/10.3390/su14127473
Submission received: 28 March 2022
/
Revised: 10 June 2022
/
Accepted: 17 June 2022
/
Published: 19 June 2022
Abstract
:This review paper aims to investigate the supply costs and prices for biogenic residues, wastes and by-products for Europe that are used as key economic parameters for techno-economic analyses in the relevant literature. The scope of the paper is to show: (i) which information on costs and prices is used in techno-economic models; (ii) which sources these monetary values are based on; and (iii) whether these values are able to be compared and classified. The methodology employed in this review paper is a systematic evaluation of the supply costs and prices for residual biomass used as the basis for techno-economic analyses in the literature. Three evaluation criteria (COST TYPE, TIME PERIOD and COST SCOPE) are used to operationalise the scope of the delivery, the time frame and the spatial resolution of the monetary values. The pricing and cost variables UNIT and BIOMASS are also studied. The results show that the supply costs and pricing differ in terms of the units used, the scope of the delivery and the spatial scale, making it difficult to compare individual studies or transfer the findings to other use cases. The costs and pricing examined range from 0.00 EUR/Mg (dm) for “bio-waste from private households” to a regional value of 1097.02 EUR/Mg (dm) for “woody biomass from vineyards”. They are rarely based on cost calculations or price analyses over a period of several years, and more than half of the literature sources examined do not take into account regional differences. The findings suggest that the input data on costs and prices are not always of sufficient quality. For that reason, in the future, the data on supply costs and prices that are provided for processing should have a more detailed temporal and spatial resolution.
1. Introduction
Using low-emission biogenic raw materials is an important step in achieving Europe’s climate and emissions targets and is necessary to achieve the transformation from a conventional economy to a climate-neutral one [1]. Biogenic raw materials are also an important part of national bioeconomy strategies aimed at achieving an economy that is sustainable and circular [2]. Biogenic residues, wastes and by-products are of particular interest and have been chosen as the subjects of this review because, unlike cultivated biomasses, they are not in direct competition with the production of food and animal feed [3]. Based on their multiple conversion options, e.g., into advanced biofuels, they can help to achieve the EU’s greenhouse gas emission reduction targets [4]. Techno-economic analyses are used, among other things, to evaluate whether it is economically feasible to employ products made from biogenic raw materials. The studies by Lepage et al., Schubert, and De Jong et al. show that the input variables used in the analyses for the costs and prices of supplying the biogenic raw materials can have a significant influence on the models’ findings [5,6,7]. For that reason, it is important for techno-economic models to use data on supply costs and prices for biogenic raw materials that are valid and fit the context of the research.
On a European level, projects are already up and running that produce reports and online tools dealing with the costs and prices of supplying a wide range of residues, wastes and by-products, including all EU-28 countries, and depending on the project, other neighbouring regions such as the Western Balkans. For example, the Biomass Futures project [8] is investigating the role that biomass can play in achieving the EU’s climate targets. The project’s focus is on the energy sector as a target market for biomass-based value chains. Another project, the JRC-EU-TIMES model [9], is investigating the contributions that individual energy technologies make to meeting the EU climate goals and is not only restricted to biomass. The report Bioenergy Potentials for EU and Neighbouring Countries [10] details the costs and prices for biogenic raw materials that form the basis of the JRC-EU-TIMES model. Meanwhile, the S2Biom project [11] and its accompanying online tool [12] describe information on biomass potential and costs along the entire supply chain of lignocellulosic biomass at the regional level in Europe. The object is to develop strategies for the future sustainable supply of biogenic raw materials. These three EU projects form the basis for the upcoming review paper and are referred to as “EU cost projects” in the following paper.
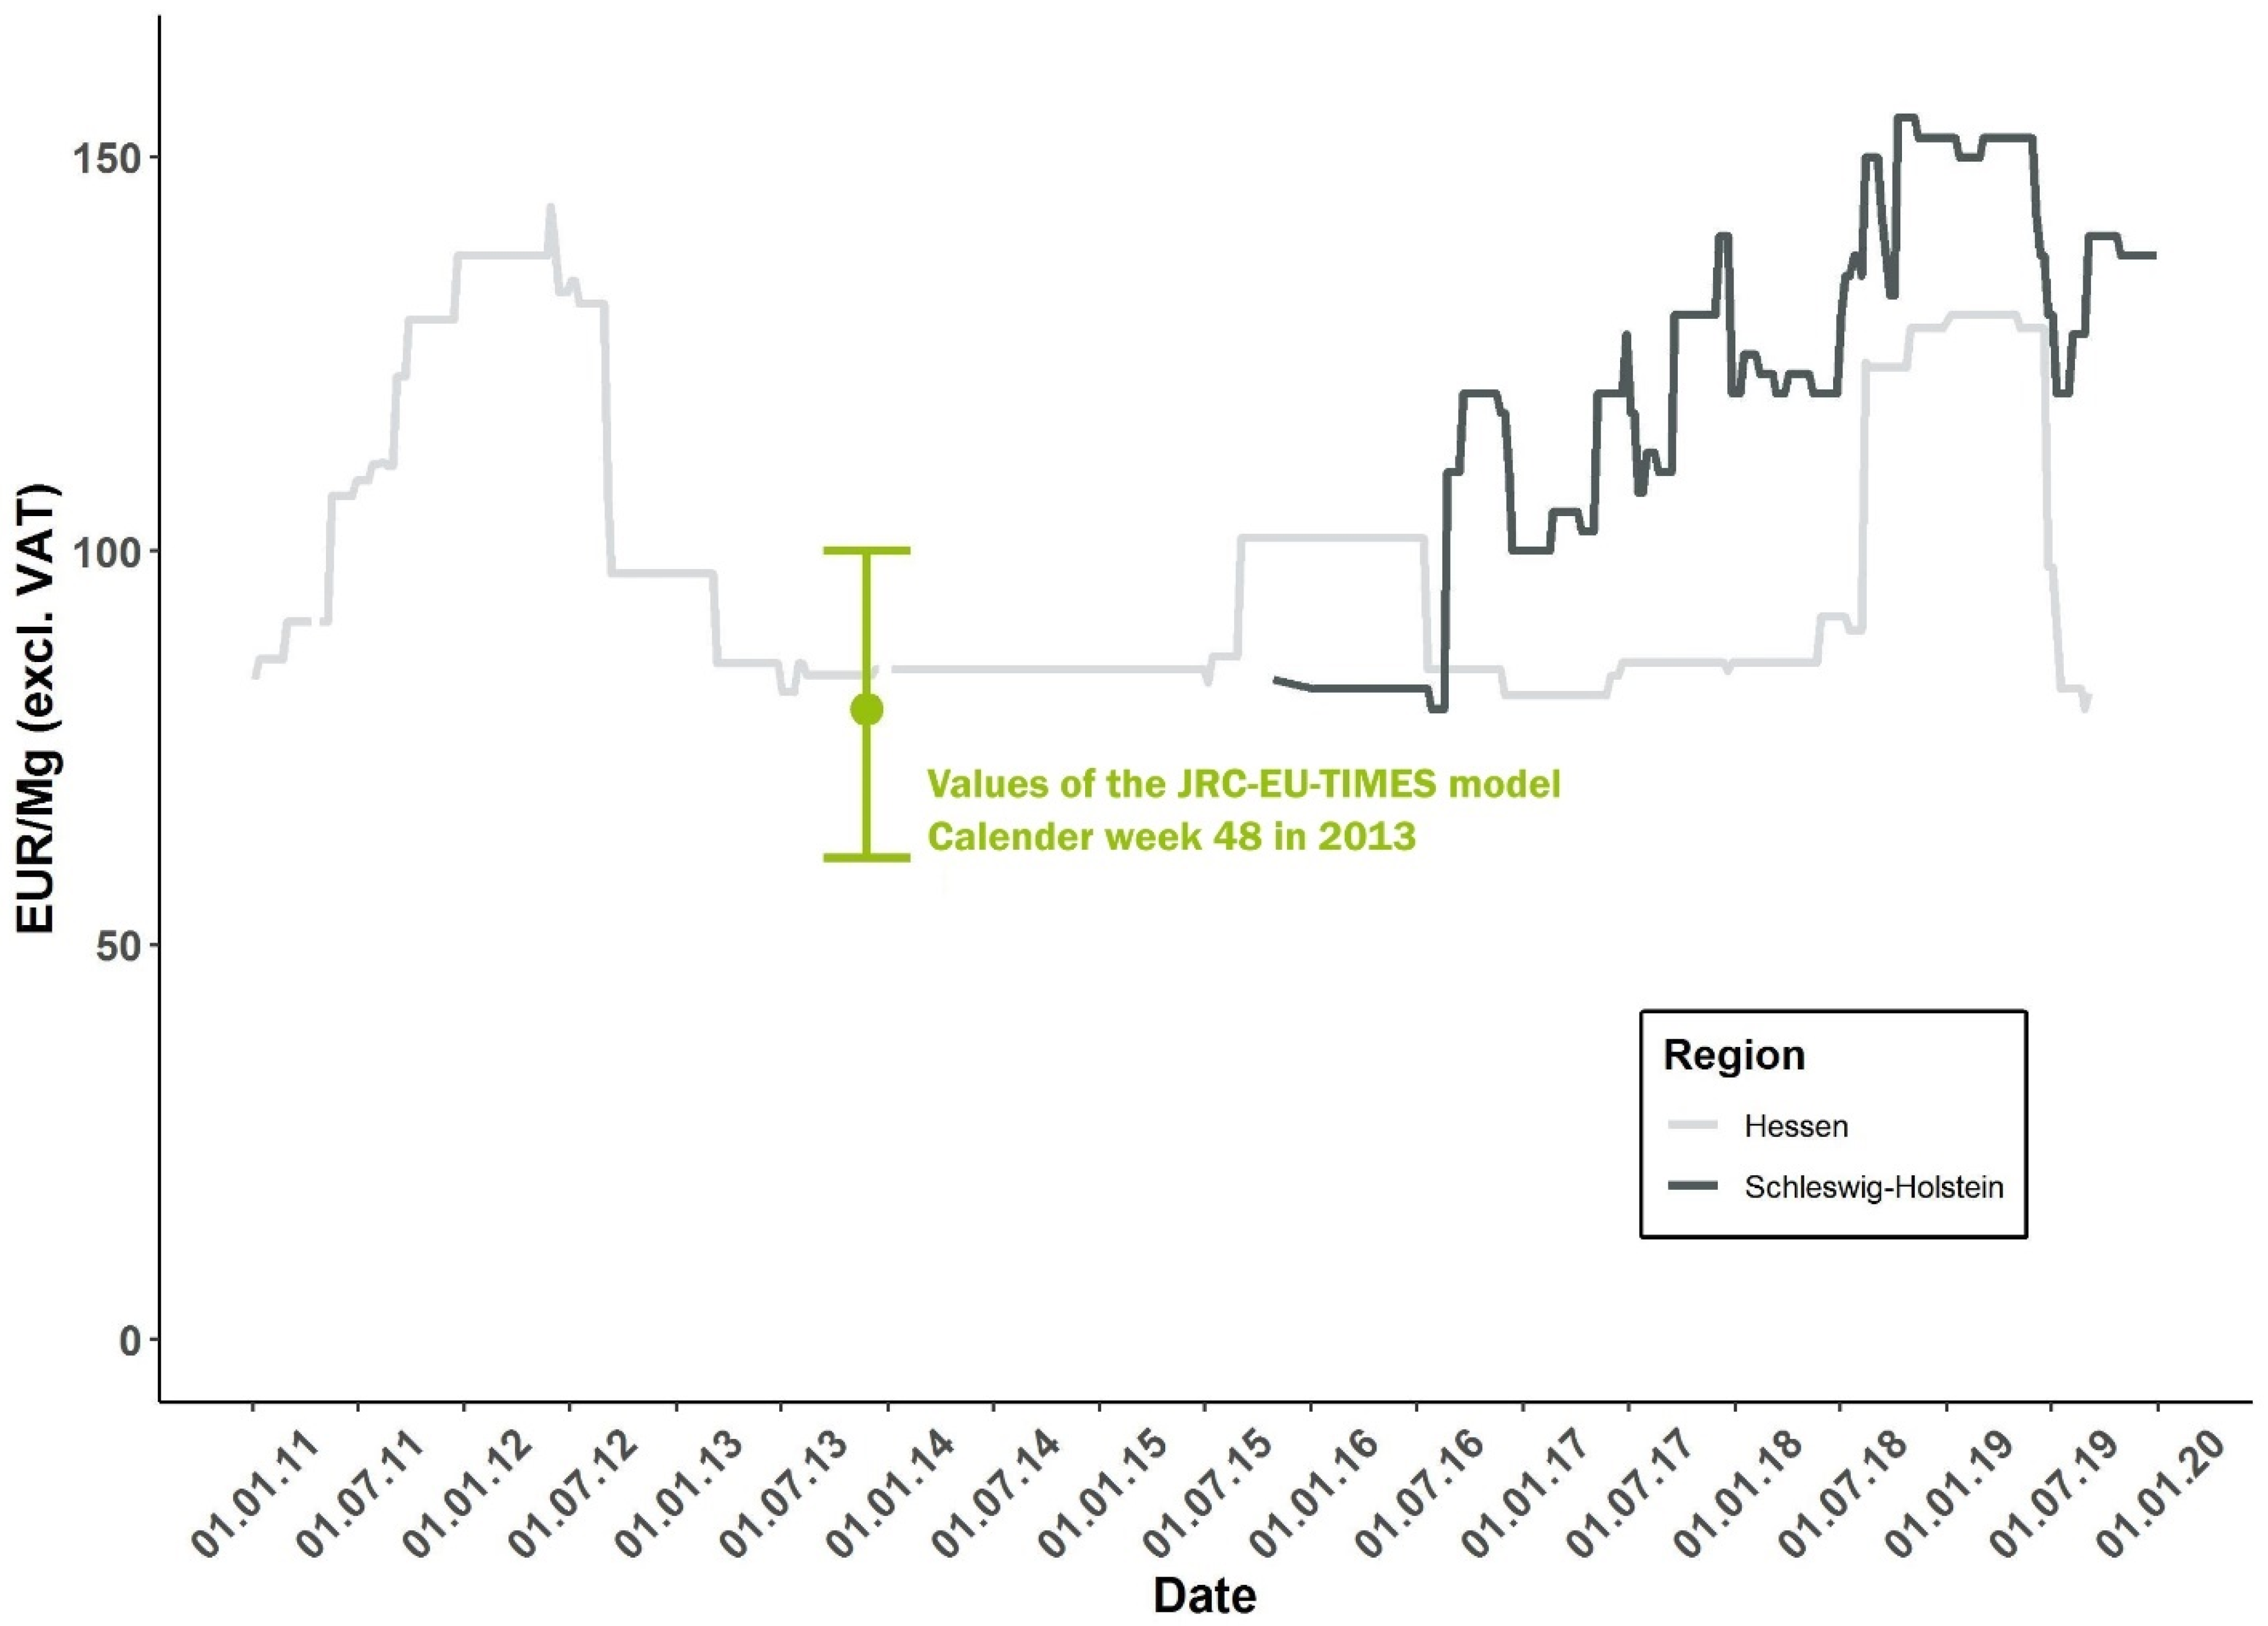
Initial scrutiny of the EU cost projects already revealed that some of the cited sources for the costs and prices do not fit the context of the research. For example, the straw prices for Germany given in the JRC-EU-TIMES model [10] are based on regional data provided by Landesbetrieb Landwirtschaft Hessen [13] and cover a single calendar week. Figure 1 shows that the straw prices in Germany vary regionally and over time, meaning that the price of straw in Hesse for one calendar week is not representative of the straw price in Germany or a suitable source in the JRC-EU-TIMES model. This leads to the assumption that current techno-economic assessments lack appropriate cost or price information as input data.
In order to investigate these assumptions, the review aims to show which information on costs and prices is used in techno-economic models and which sources these monetary values are based on. Additionally, this review paper will estimate the comparability and transferability of the costs and prices used in the reviewed studies. Previous reviews have examined the supply costs for individual sectors, such as in the review by Erber and Kühmaier [14,15], analysing the economic influences of different elements of the supply chain, including biogenic residues, wastes, and by-products from forestry. Visser et al. [16] investigated the supply cost data used in the current literature on the production of pellets from agricultural and forestry residues, identifying the drivers behind the supply costs. The current review examines the supply costs for a range of sectors and biomasses, focusing on how the supply costs and prices are used in techno-economic analyses and if they match according to the respective scope of the assessment.
Figure 1.
Comparison of two federal straw prices in Germany based on data of Ruiz et al., 2015 [10]; State Office for Agriculture Hesse, 2020 [13] and Chamber of Agriculture Schleswig-Holstein, 2020 [17].

To this end, a systematic two-step literature review is carried out. The first step involves pinpointing the most relevant residues, wastes and by-products in Europe so that the review concentrates on their costs and prices. The second step consists of a systematic survey of studies containing quantifiable information on costs and prices for the residues, wastes and by-products to discover which prices and costs are used in the literature. In order to assess the identified literature sources, criteria are defined to operationalise the supply costs and prices so that they can be systematically evaluated. The presented results provide an overview of the most relevant residues, wastes and by-products in Europe (step 1) and the characteristics of the supply costs and prices used in terms of the evaluation criteria and variables selected (step 2). The results are discussed according to the review goals. We determine the extent to which costs and prices are used (i) and which sources they are based on (ii) to verify the assumption of a lack of suitable cost and price information in techno-economic assessments. Additionally, we consider if these values are able to be compared and classified (iii). We follow up with the requirements for data on supply costs and prices to be used in future models.
2. Methodology
2.1. Approach Used to Identify Relevant Literature
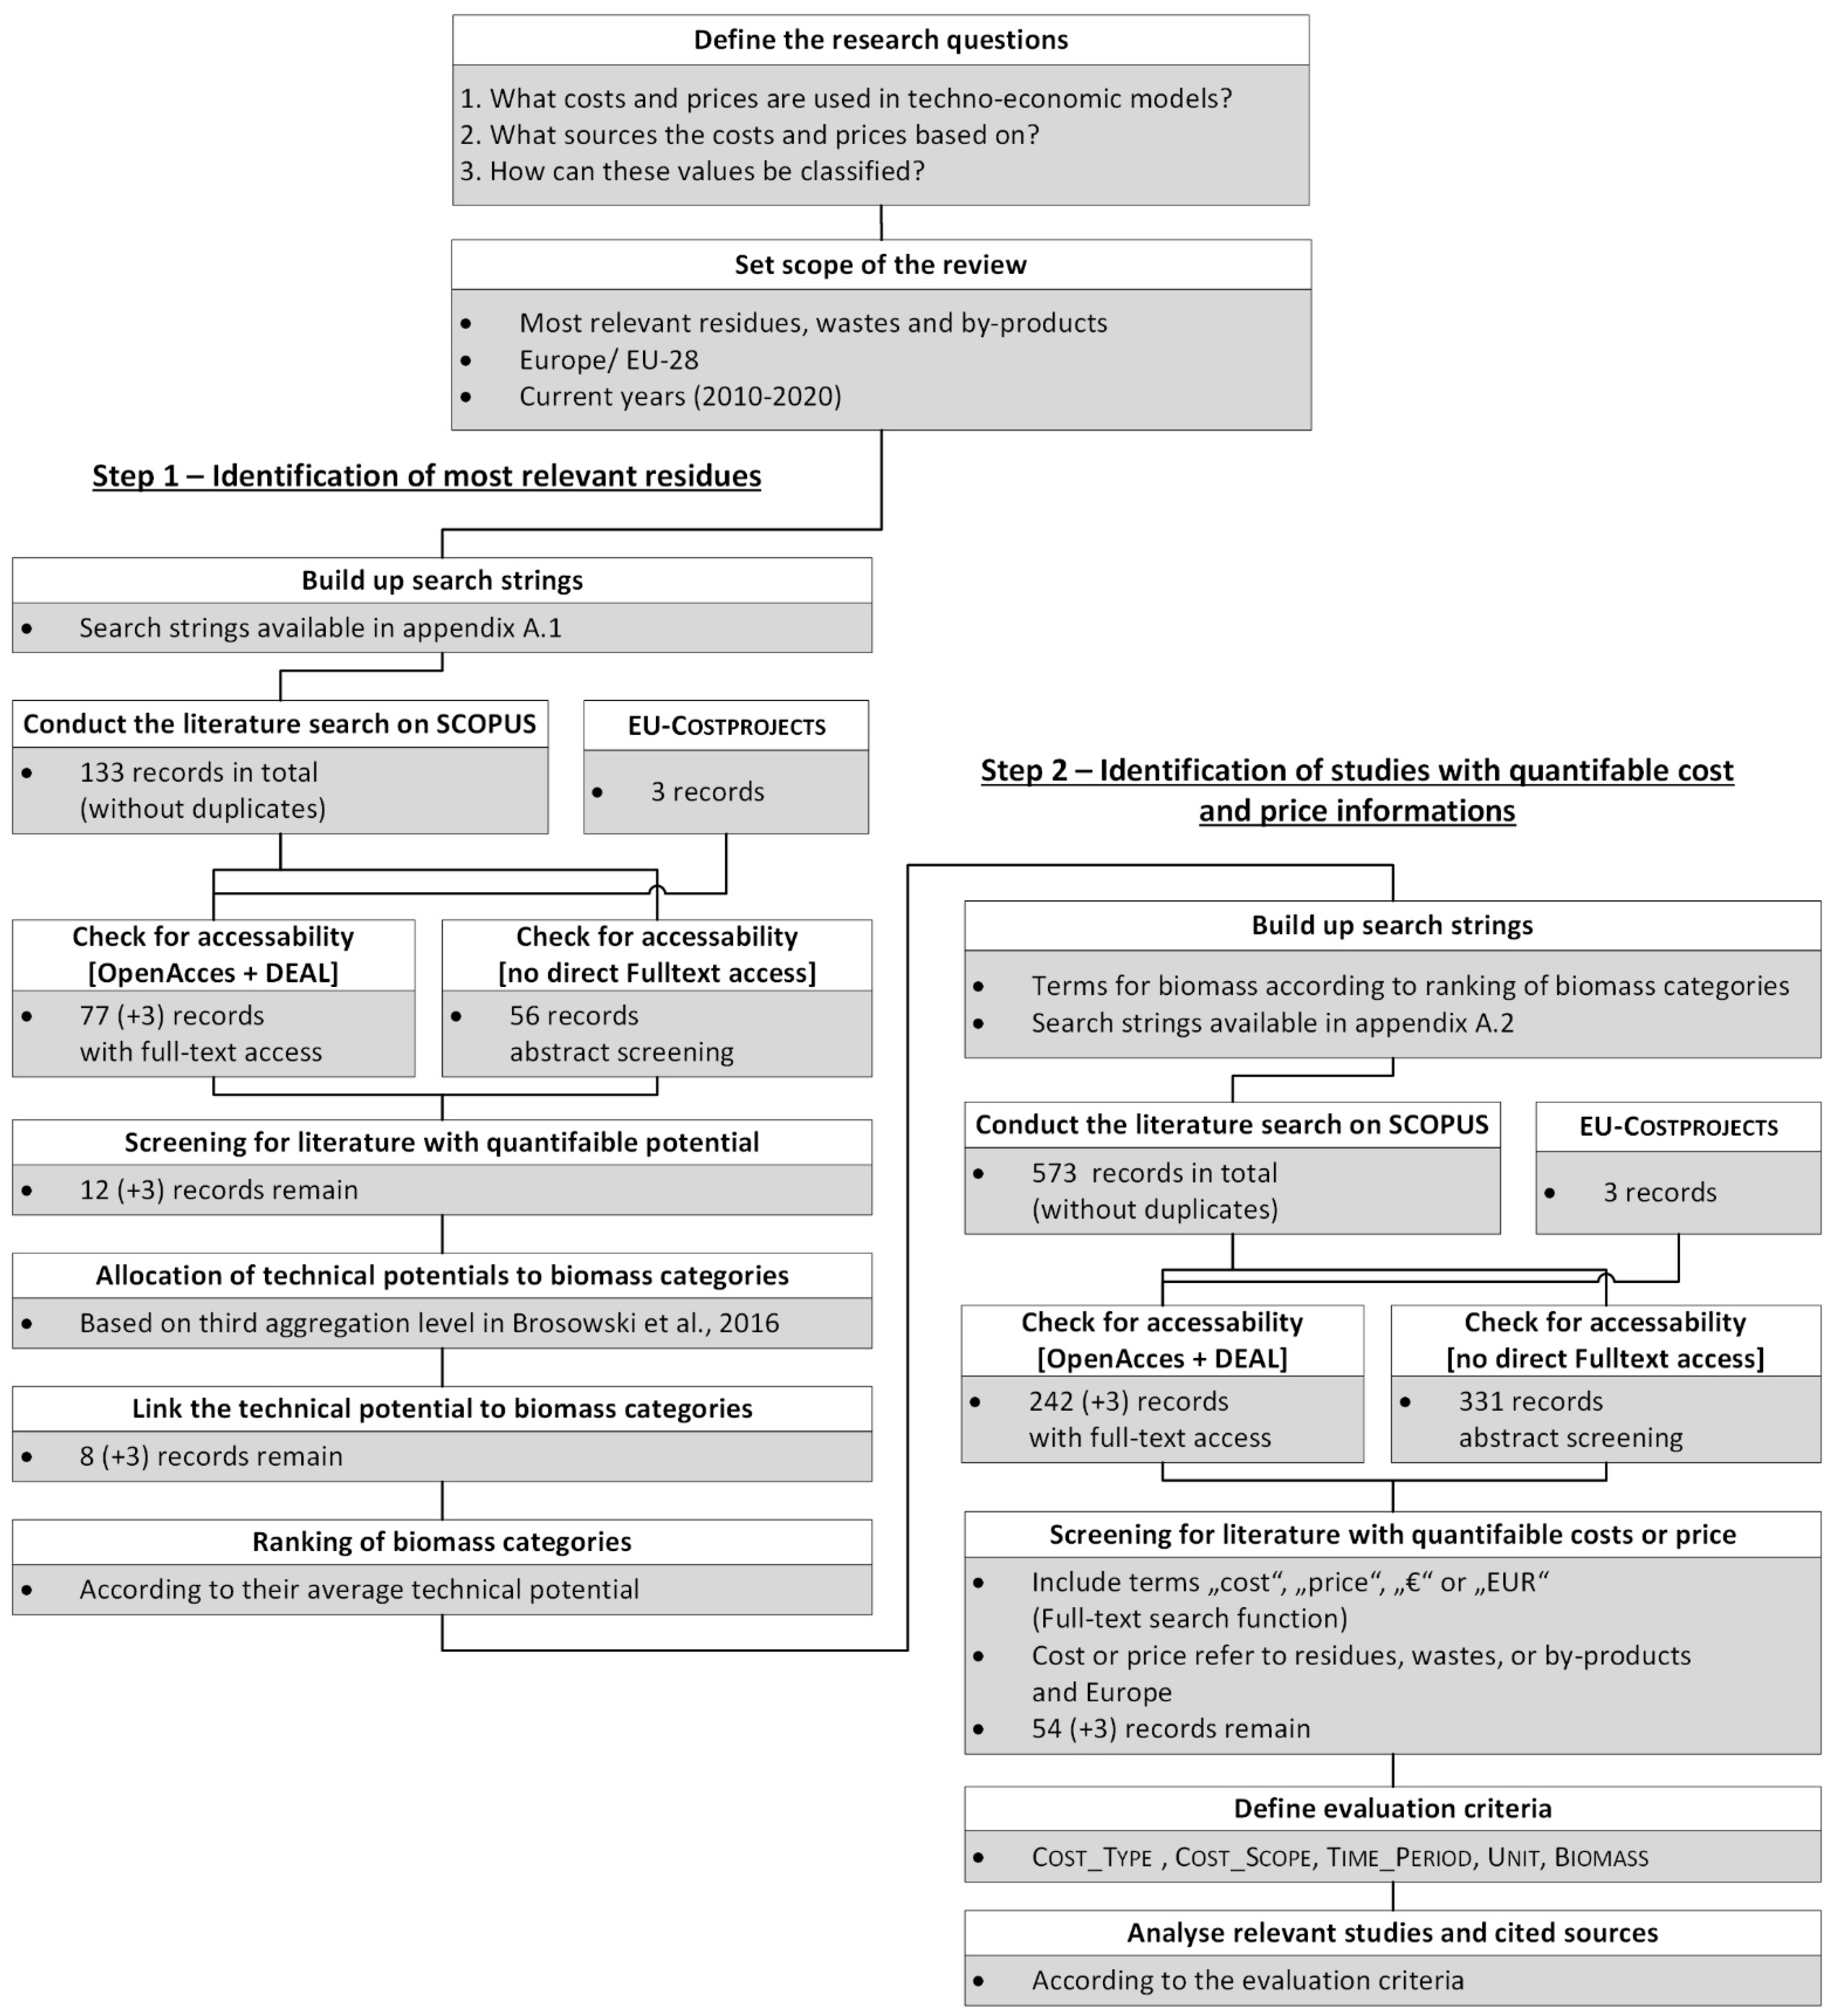
The EU cost projects were used as the basis for the literature survey. Further relevant literature is identified using a systematic two-step survey of the literature. This literature review is based on the systematic approach adopted by Moher et al. [18], who provide a protocol listing the criteria used to identify and select the literature. Figure 2 sets out the protocol for this review.
The literature search was carried out in Elsevier’s SCOPUS database, which enables individual search strings to be created to search for publications based on selected system boundaries and parameters. The terms “eu-28” and “europe” were used in the search string to limit the review to literature from EU-28 countries. The publication period was limited to the years 2010 to 2020 [“pubyear aft 2009”]. The search was also narrowed down to biogenic residues, wastes and by-products, and the document types “Article”, “Review”, “Conference paper”, and “Conference review”. The individual search strings of step 1 and step 2, including the number of records, are listed in Appendix A.
The records from SCOPUS contain, on the one hand, literature with full-text access, due to being open access publications or national transformation agreements, such as the German DEAL agreement [19], as well as literature whose access is blocked by a paywall. For full-text accessible literature, the entire text was searched for relevant information. For those publications that require a subscription, the abstract was screened to check whether the study had been purchased in order to perform a full-text search.
2.1.1. Relevant Residues, Wastes and by-Products—Step 1
In the first step of the review process, the biogenic residues, wastes and by-products are narrowed down further based on their relevance. Relevance is determined by the technical potential. The technical potential is defined, as described by Kaltschmitt et al., as the part of the theoretical potential that can be put to use, taking into account technical restrictions [20]. The keywords “technical potential”, “potential assessment”, and “biomass potential” are integrated into the search string as terms referring to potential (for more detail, see Appendix A.1). The biogenic residues, wastes and by-products are represented in the search string by the keyword “residues”. Additionally, the term “biomass” is used in the literature search on the SCOPUS database. The literature identified is selected based on its quantifiable technical potential, as shown in Figure 2.
All the information on technical potential is converted into petajoules (PJ) for comparability. Where units are mass-specific, the lower heating values provided in the studies are used to determine the energy-specific potential. If the studies did not explicitly indicate the lower heating values, the conversion is carried out using the lower heating values in the Phyllis database [21]. In order to make the different terms for individual residues, wastes and by-products and the associated technical potential values comparable, the categorisation process developed by Brosowski et al. [22] is used. This covers a total of 77 individual biogenic residues, wastes and by-products, sorted into four levels aggregating the individual biomass types. The residues, wastes and by-products identified in step 1 of the review are categorised as the biomass types in the third aggregation level described by Brosowski et al. If the terms from the relevant literature do not belong to a category in the third aggregation level described by Brosowski et al., then the technical potential cannot be taken into account.
The means of the technical potential values given in the literature for these biomass categories are calculated and ranked to show which residues, wastes and by-products are the most relevant in Europe. In the second step of the review process, these are then integrated into the search strings as keywords.
2.1.2. Quantifiable Supply Costs and Prices—Step 2
The costs and prices, represented by the keywords “cost” or “price”, are integrated into the search strings for the SCOPUS database. The keywords for the biogenic residues, wastes and by-products are taken from the results of the first step of the review. The categories identified as relevant from the third aggregation level defined by Brosowski et al. [22] for the residues, wastes and by-products are converted into keywords and integrated into the search string (for more details, see Appendix A.2). The literature identified in the database is further narrowed down in terms of its accessibility and the quantifiable information on costs and prices. The remaining publications identified from the SCOPUS database and the EU cost projects are used as the basis for the present literature review.
2.2. Criteria Used to Analyse the Data on Supply Costs and Prices
The literature identified as the basis for the review in Section 2.1 (step 2) is systematically captured in a MS Access database. The database is then analysed using Version 4.04 of the statistics software “R”, and the results are visualised. The introduced variables and evaluation criteria, which operationalise the cost and price information to make them comparable, are described below.
2.2.1. Biomass
The different terms used in the literature for the biogenic residues, wastes and by-products are assigned to the 77 individual biomass types according to Brosowski et al. [22]. The biomass types are not subsumed under an aggregation level as in Brosowski et al.
2.2.2. Unit
Units are identified that indicate quantifiable monetary values. Additionally, we checked whether the studies provide any information about possible conversion factors. The aim is to give the units and related information on costs and prices in EUR/Mg (dm), i.e., in relation to the dry matter (dm). Costs and prices relating to the fresh matter [fm] of the biomass are adjusted to relate to the dry matter using the content of water or dry matter reported in the respective study. If the costs or prices are given in energy units, the respective study is searched for details for a “calorific value” or “lower heating value”, and this is also added to the database. Therefore, the energy-specific units can be converted into mass-specific units.
2.2.3. Cost_Scope
The Cost_Scope is introduced to cover the spatial dimensions of the costs and prices. On the one hand, the reference country is recorded. On the other hand, the spatial resolution of the monetary values is determined. For this purpose, five values are introduced under the Cost_Scope criterion. The spatial resolution values are:
- Local—the spatial resolution of the costs relates to the NUTS3 level or a smaller spatial unit;
- Federal—the spatial resolution of the costs relates to the NUTS1 level;
- National—the spatial resolution of the costs relates to the NUTS0 level;
- Multi-national—the spatial resolution of the costs relates to several countries;
- EU-wide—the spatial resolution of the costs relates to the entire EU or to the countries identified as being in Europe in the study;
- Not available—the spatial resolution for the costs cannot be determined.
During this process, the spatial context from the literature is determined following the principle of the “lowest” spatial resolution. This means that if a study provides data on costs for several countries in Europe at local resolution, then the monetary values are listed under the “local” Cost_Scope.
2.2.4. Cost_Type
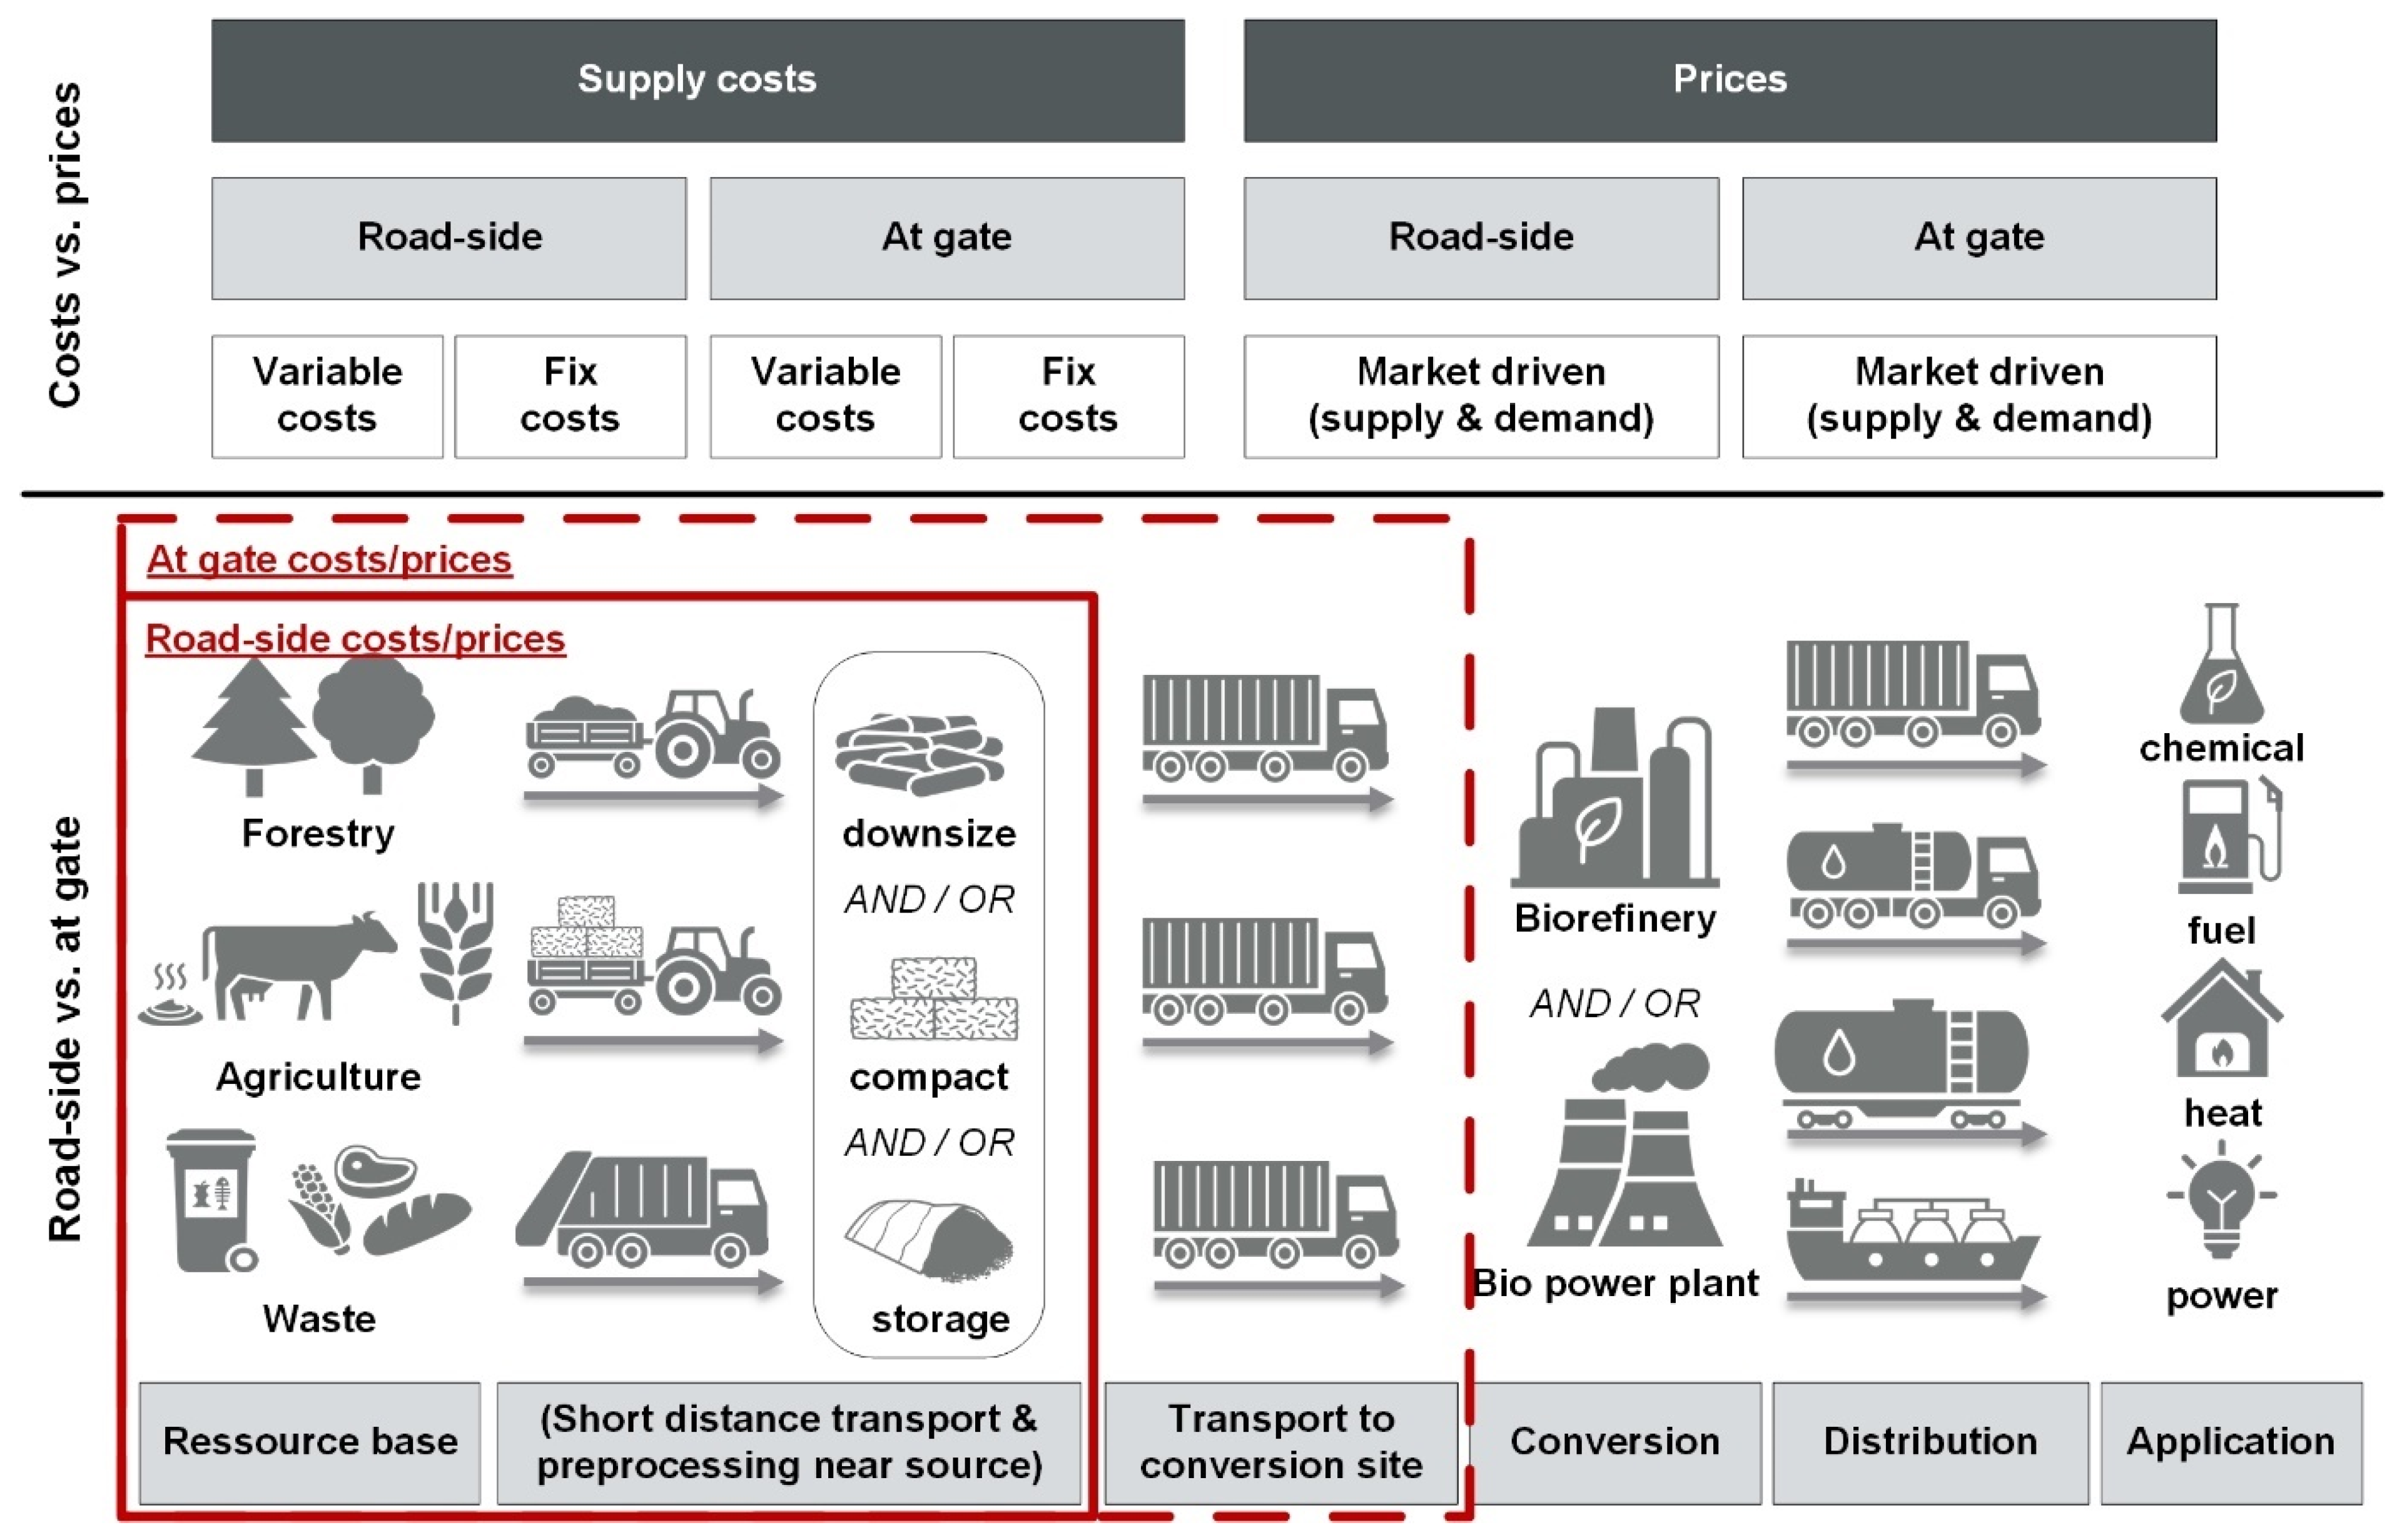
The values in the studies can be divided into costs and prices according to the scope of the delivery. Figure 3 shows how this review differentiates between costs and prices and the scope of delivery. Costs are understood as actual expenditures that can be broken down into variable and fixed components. Prices reflect the market value, which results from the supply and demand, and can differ from the costs. When examining the supply costs and prices for biogenic residues, wastes and by-products, further differentiation is made depending on the scope of delivery. The raw materials are either delivered to the “producer’s” roadside or to the conversion plant gate. “At gate” delivery includes next to harvesting or collection of the biomass, as well as transport to the conversion plant.
In order to analyse the scope of delivery and the costs or prices, the Cost_Type criterion is introduced. This is divided into the four values “roadside cost”, “roadside price”, “at-gate cost”, and “at-gate price”. The Cost_Type indicated for each monetary value provided is assigned to one of these values. If this is not possible to unambiguously identify the Cost_Type, “not available” is entered into the MS Access database.
2.2.5. Time_Period
The evaluation of the temporal components in the studies includes the extraction of the reference years to which the monetary values relate. The quantifiable monetary values are determined using a price index [23] for the base year 2019 to enable a comparison of the different costs and prices. In addition, the period of observation for costs and prices is recorded in order to determine whether seasonal or multi-year effects are taken into account. This review distinguishes between the following five time_period values:
- Single date—the costs or prices are not related to a specific time frame or relate to a single selected reference date;
- Week—the costs or prices are described on a weekly basis;
- Month—the costs and prices are given as monthly values;
- Year—the costs and prices are for an entire year;
- Multi-year—the costs and prices in the studies are given for a period of several years;
- Not clearly specified—it is not possible to clearly identify the temporal resolution of the costs and prices.
2.2.6. Sources
The determination of the above-mentioned evaluation criteria (Cost_Type, Cost_Scope, Time_Periode) is not limited to the costs and prices found in the literature. Additionally, the sources these studies cite are investigated to trace the history of the cited costs and prices. In the case of the sources, the cascades in the cited biomass supply costs and prices are also included.
3. Results
3.1. Results of the Systematic Literature Review
3.1.1. Relevant Residues—Step 1
The SCOPUS database was systematically searched for the period from 16–22 April 2020 using the keyword combinations from Section 2.1.1. In step one of the review (Figure 2), 133 studies were identified, 77 of which offered access to the full text to search for relevant information on technical potential. A total of 32% of the 133 studies provided information on biomass potential, and another 22% focused on means of putting biomass to use, offering technical descriptions or techno-economic analyses. A total of 8% examined the underlying political circumstances and 6% the environmental impacts of biomass. The remaining 32% were made up of various topics found in the available literature. Of the 133 studies, 12 relevant studies remained that reported a quantifiable technical potential within the scope of the review examined here. The data on potential given in the EU cost projects were also used.
There were difficulties in assigning the data on the technical potential found in the studies to the categories of the third aggregation level described by Brosowski et al. [22]. Cintas et al. [24], for example, provided data on the technical potential but only distinguished between residues, wastes and by-products from agriculture and forestry, meaning the data could not be assigned to the third aggregation level. In the end eleven studies remained to determine the most relevant residues, wastes and by-products.
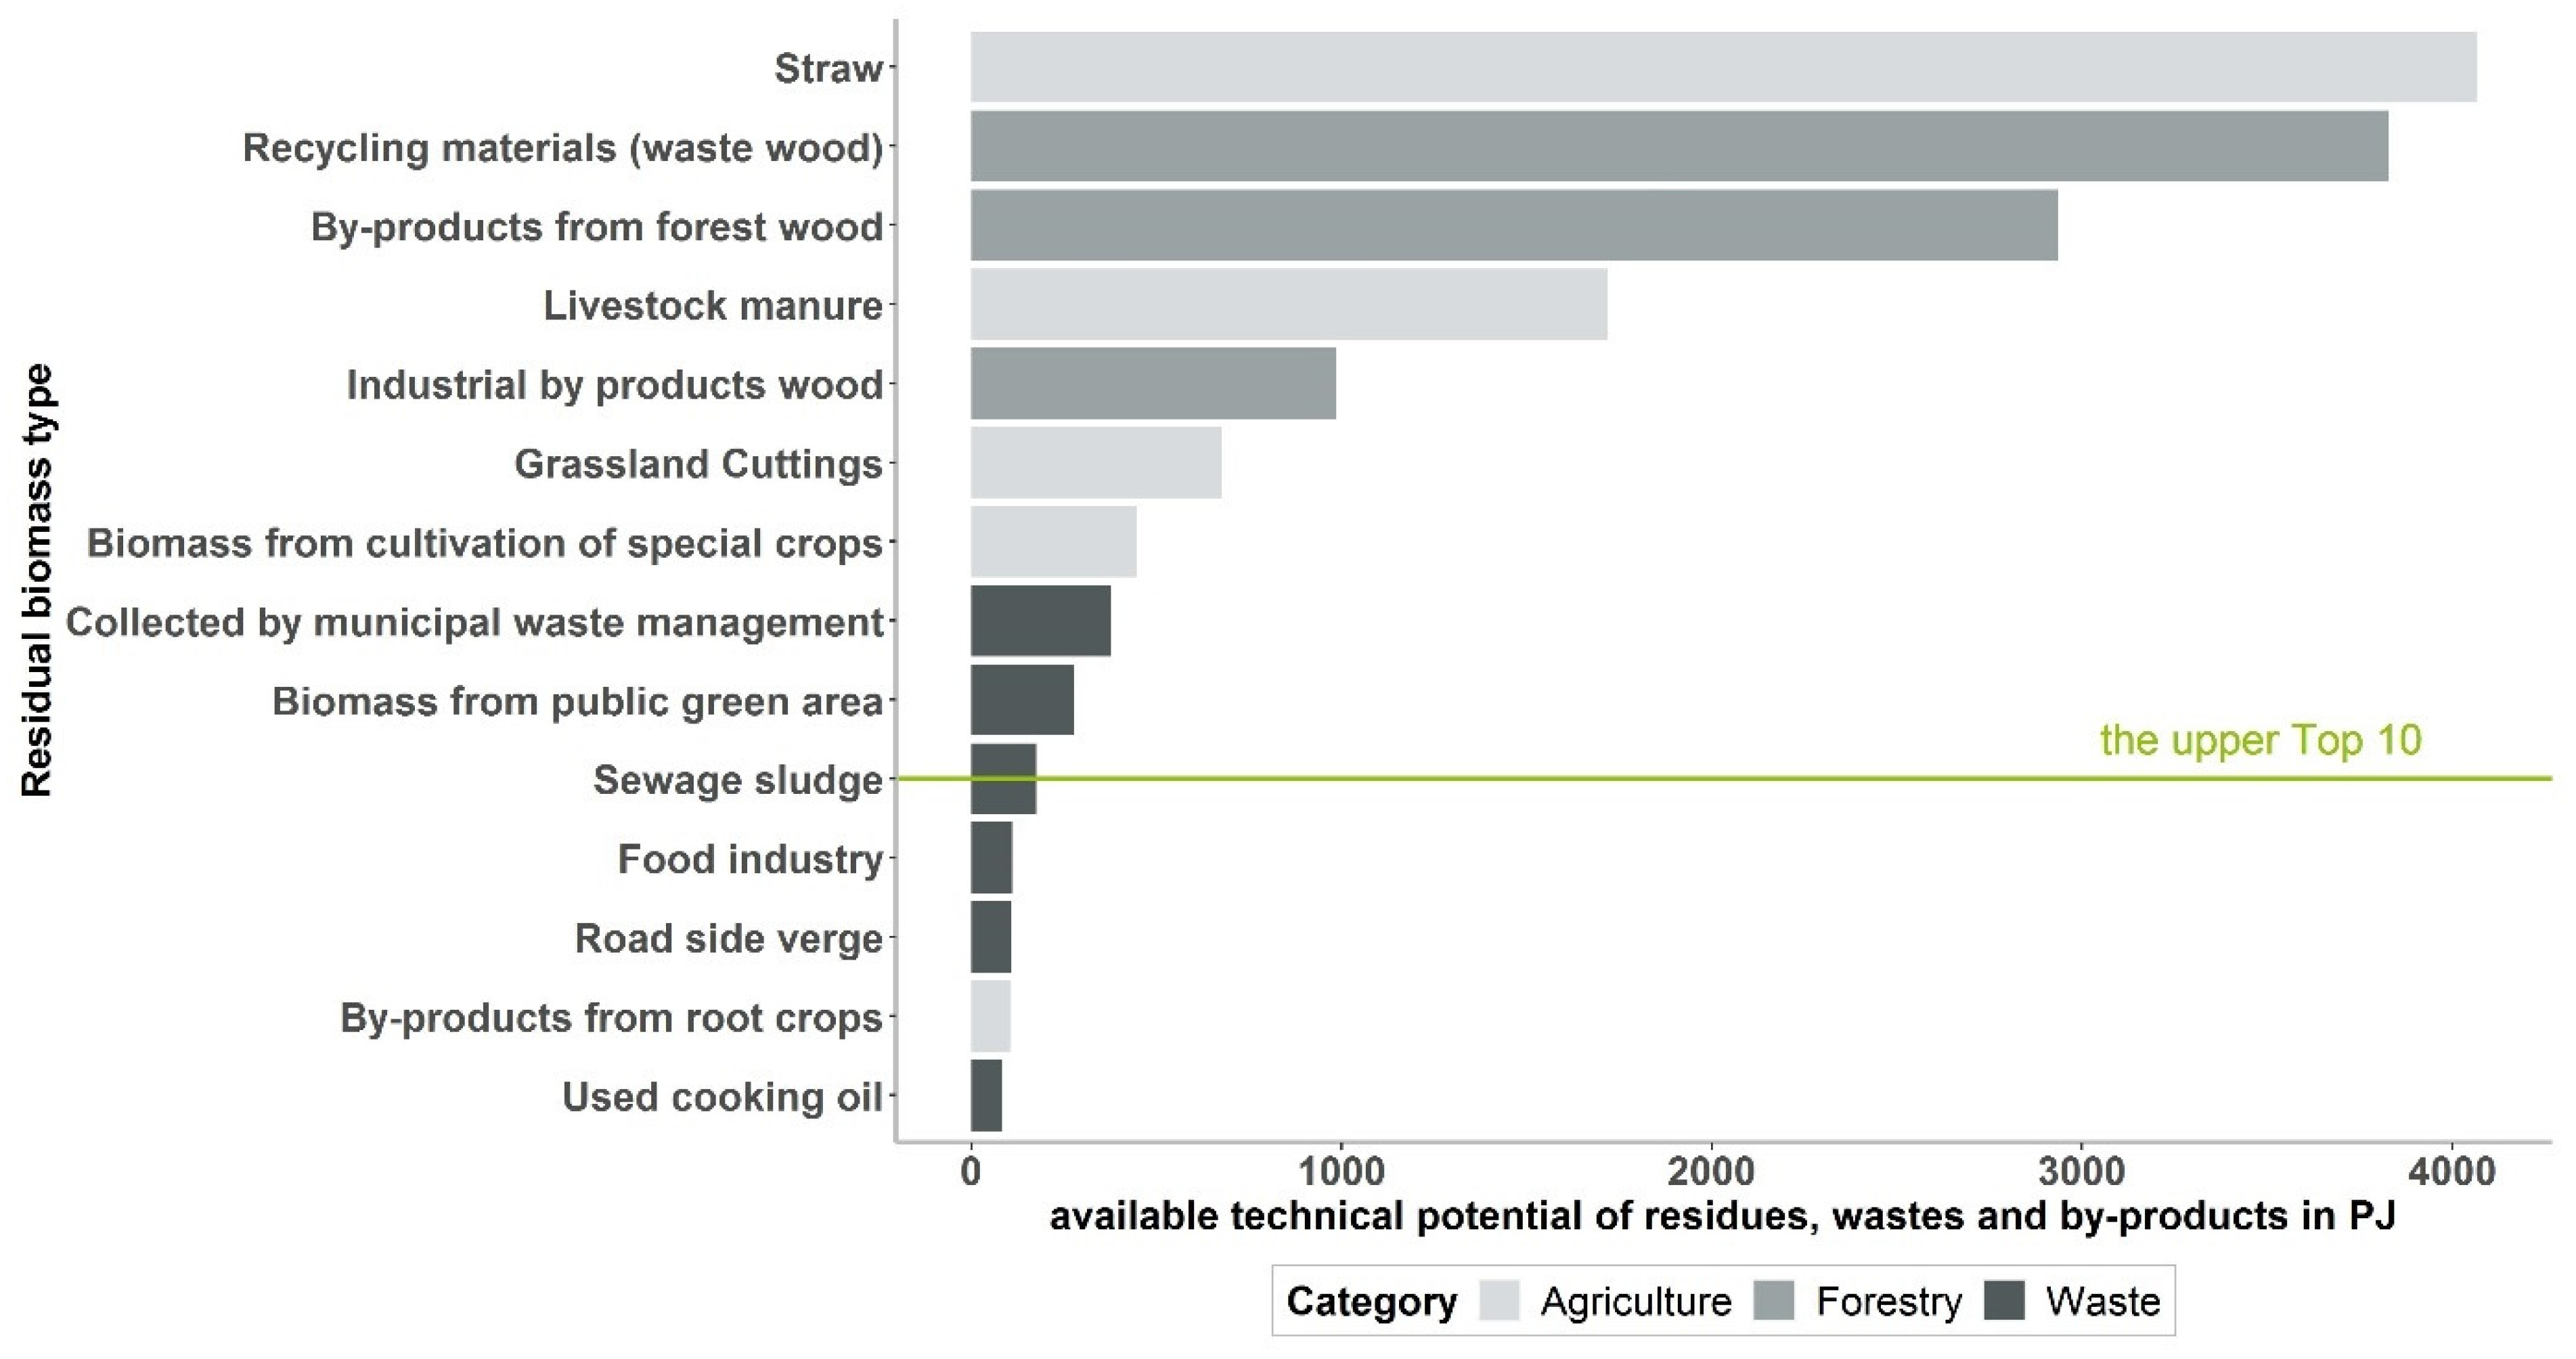
The ranked averages from the data on technical potential are shown in Figure 4. It was possible to make statements on the technical potential for 14 different categories of raw materials. The technical potential of the five most important raw material categories accounted for 85.1% of the total technical potential of the raw materials examined. For the 10 most relevant raw material categories, from “straw” to “sewage sludge”, the figure was 97.4%.
3.1.2. Quantifiable Supply Costs and Prices—Step 2
In addition to the three EU COST PROJECTS, a further 54 relevant literature sources were identified out of 573 total records on SCOPUS on 10–11 June 2020 in accordance with the logic of step two in Section 2.1.2 (see Figure 2). Combinations of the variables “literature” (57 values); biomass (10 categories at the third aggregation level generated 40 possible values for individual biomass types at the first aggregation level defined by Brosowski et al. [22]); countries (28 possible values); and the evaluation criteria Cost_Scope, Cost_Type and Time_Period with their respective values, produced source data comprising 2744 individual data sets.
Table 1 offers an overview of the relevant literature forming the basis of the review. The 57 publications examined in the review mainly consisted of techno-economic assessments (in the narrow sense), assessments of potential (some including cost-supply curves) and life cycle assessments.
3.2. Evaluation of the Information on Costs and Prices
3.2.1. Biomass
Altogether, supply costs or prices were charted for 38 individual biomass types at the first aggregation level defined by Brosowski et al. [22]. The by-product “cereal straw” appeared 23 times in the literature studied. Followed by the raw materials “logging residues (coniferous)” and “logging residues (deciduous)”, each found in 21 studies. “Cattle liquid manure” was examined in eleven studies. The three EU cost projects should be emphasised as they deal with a large number of residues, wastes and by-products.
3.2.2. Unit
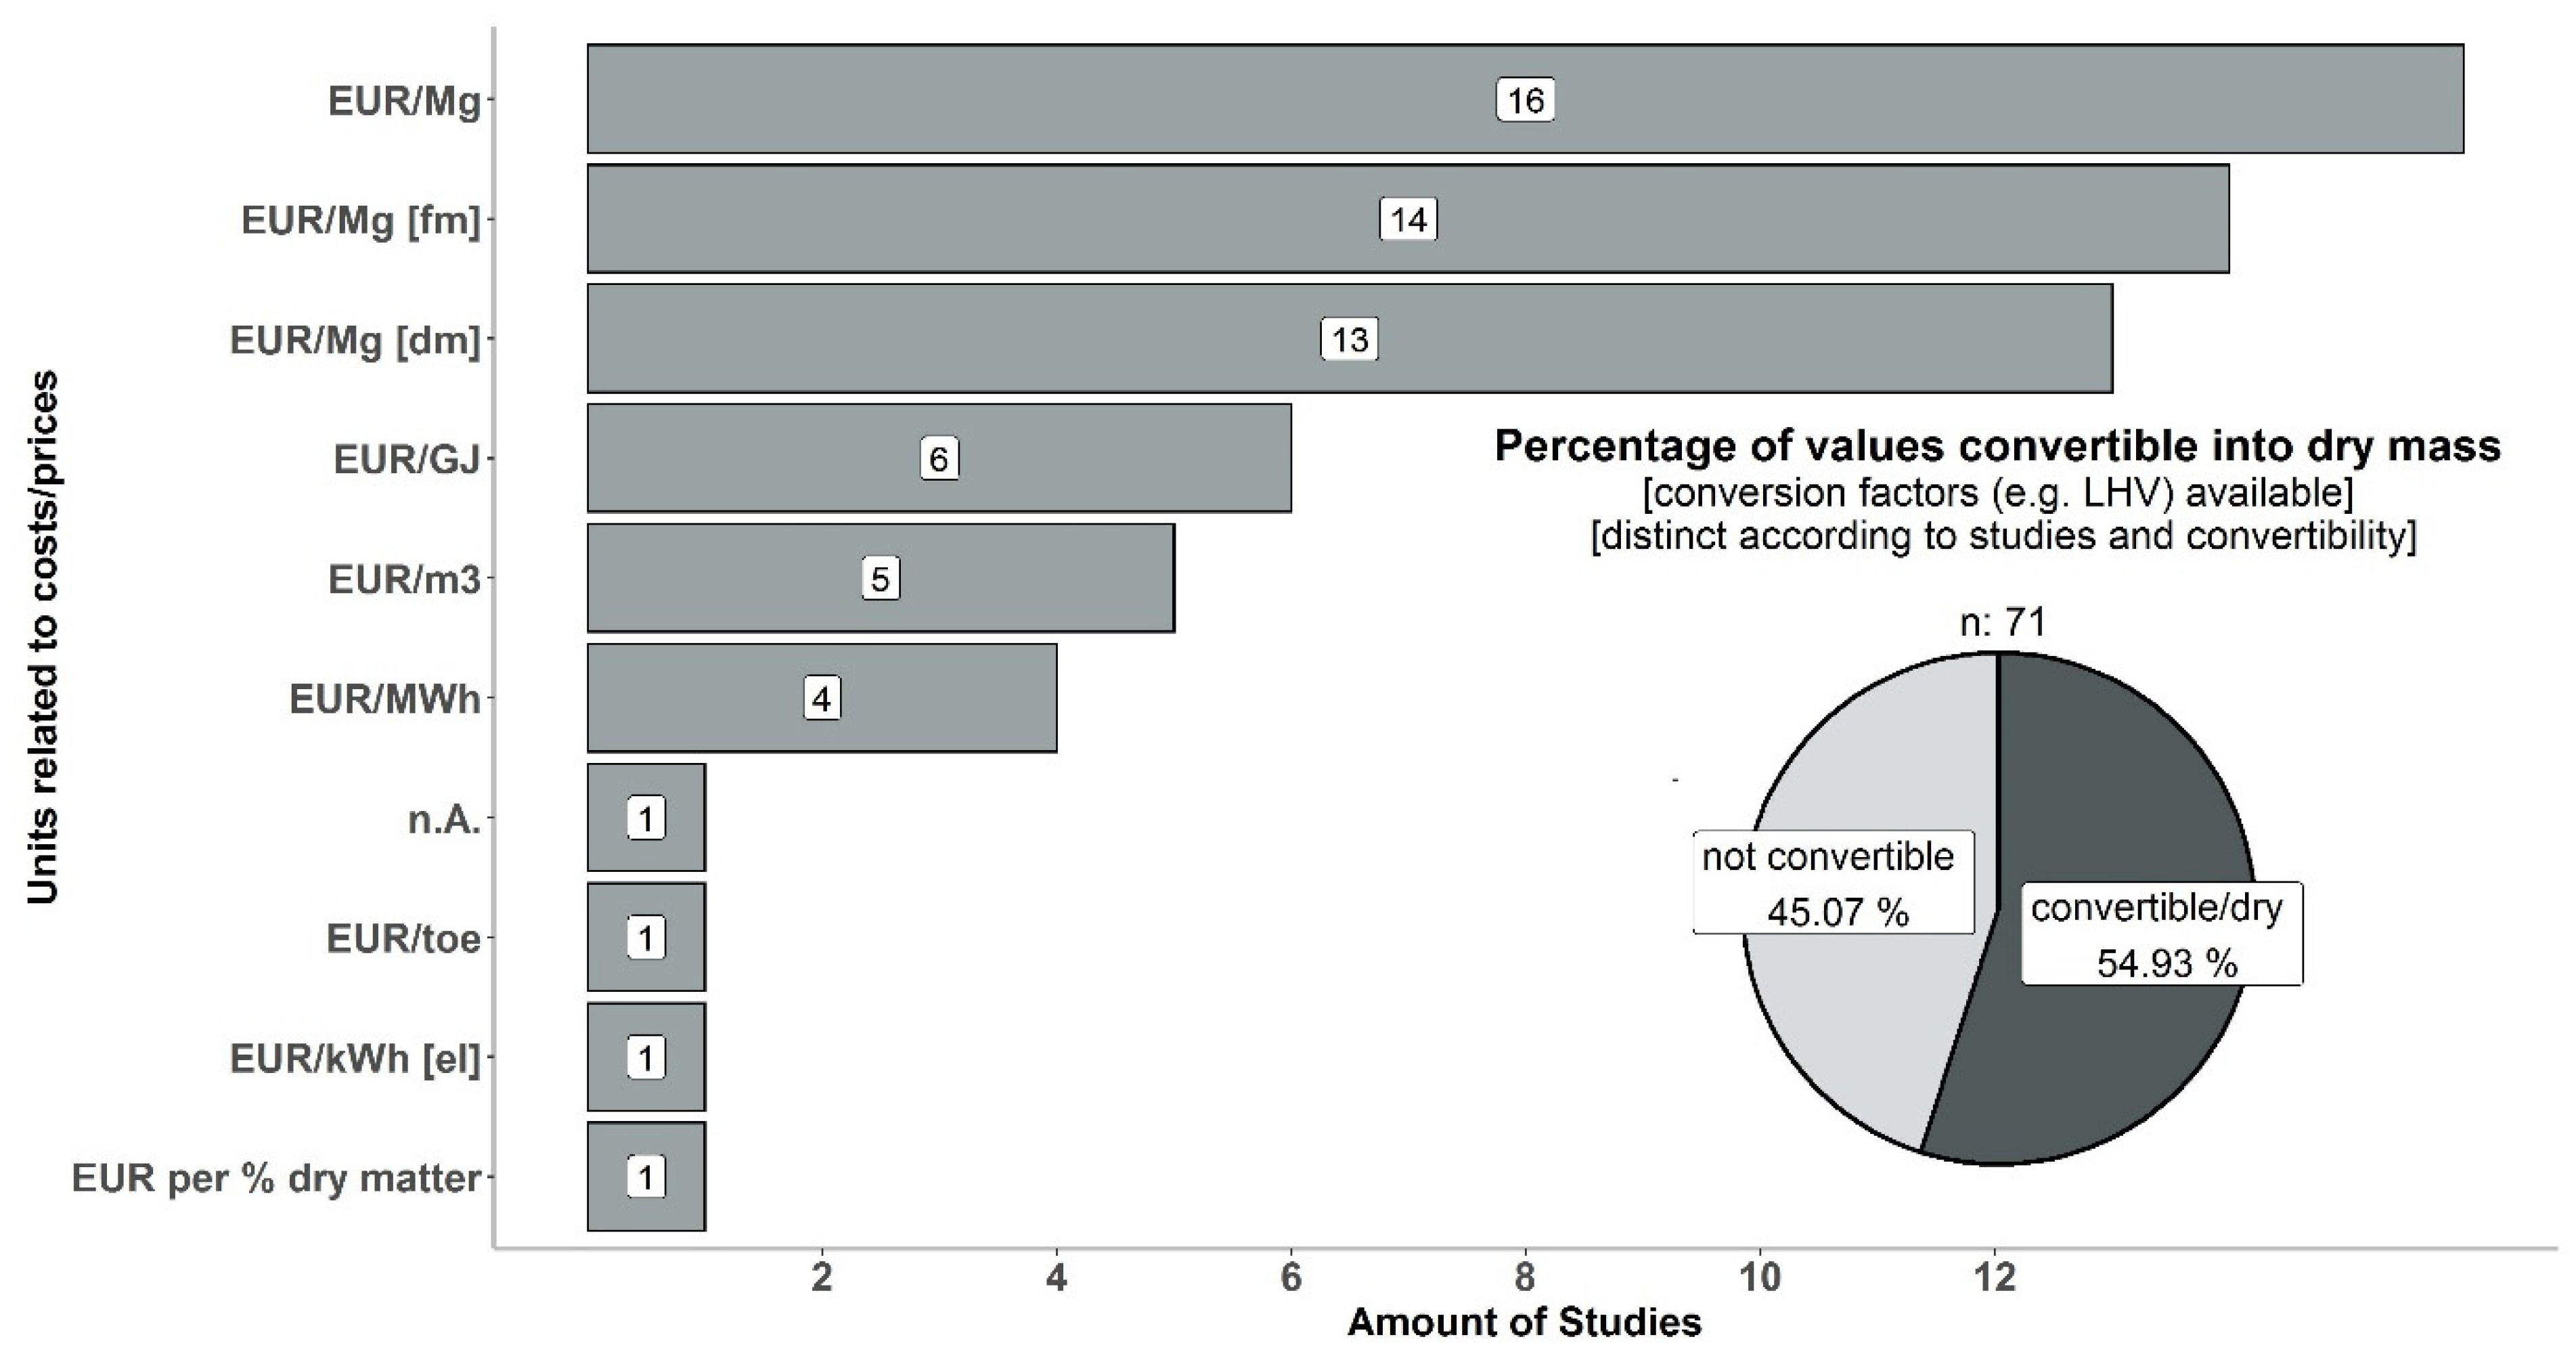
In the literature examined, nine different units were identified as being used to measure the monetary value of the biogenic residues, wastes and by-products. This figure does not include different currencies, which were converted into euros in advance using the exchange rate for the specific year [85,86]. From the bar chart in Figure 5, it can be seen that mass-specific units were primarily used in the studies. Of the studies with mass-specific units, more than one-third did not indicate the supply costs or prices in relation to dry or fresh matter. Whether energy-specific units or mass-specific units were used, the conversion into EUR/Mg (dm) requires conversion factors (e.g., the lower heating value or water content), which had to be specified in the studies. This was not always the case in the studies examined; thus, only about 55% of the costs and prices found could be converted into the unit EUR/Mg (dm).
When assessing the data falling within the evaluation criteria, only the data sets were studied that differed in terms of an evaluation criterion so that the effect of double counting did not influence the results. For the units, this meant that 71 data sets were included in the convertibility analysis. These data sets differed in terms of the units they used and the possibility of converting them. For the following evaluation criteria, the number of data sets used varied between 57 and 91.
3.2.3. Cost_Type
The extracted cost and price information was matched to the cost types. The cost type on which the value from the study was based was identified if the terms costs and prices were used mixedly in the literature. For example, depending on the context, market prices of waste material or by-products were sometimes included and named as variable costs in the economic assessment, as in the studies by De Jong et al., Leponiemi and Kalinichenko and Havrysh [7,43,44]. If an unambiguous assignment was not possible, the attribute “not available” was assigned. Some of the studies also included the transport cost per kilometre to determine the “at-gate” costs or prices, as in the study by Aalto et al. [75]. The transport cost per kilometre depended on the logistics concepts used and was not taken into account for this review.
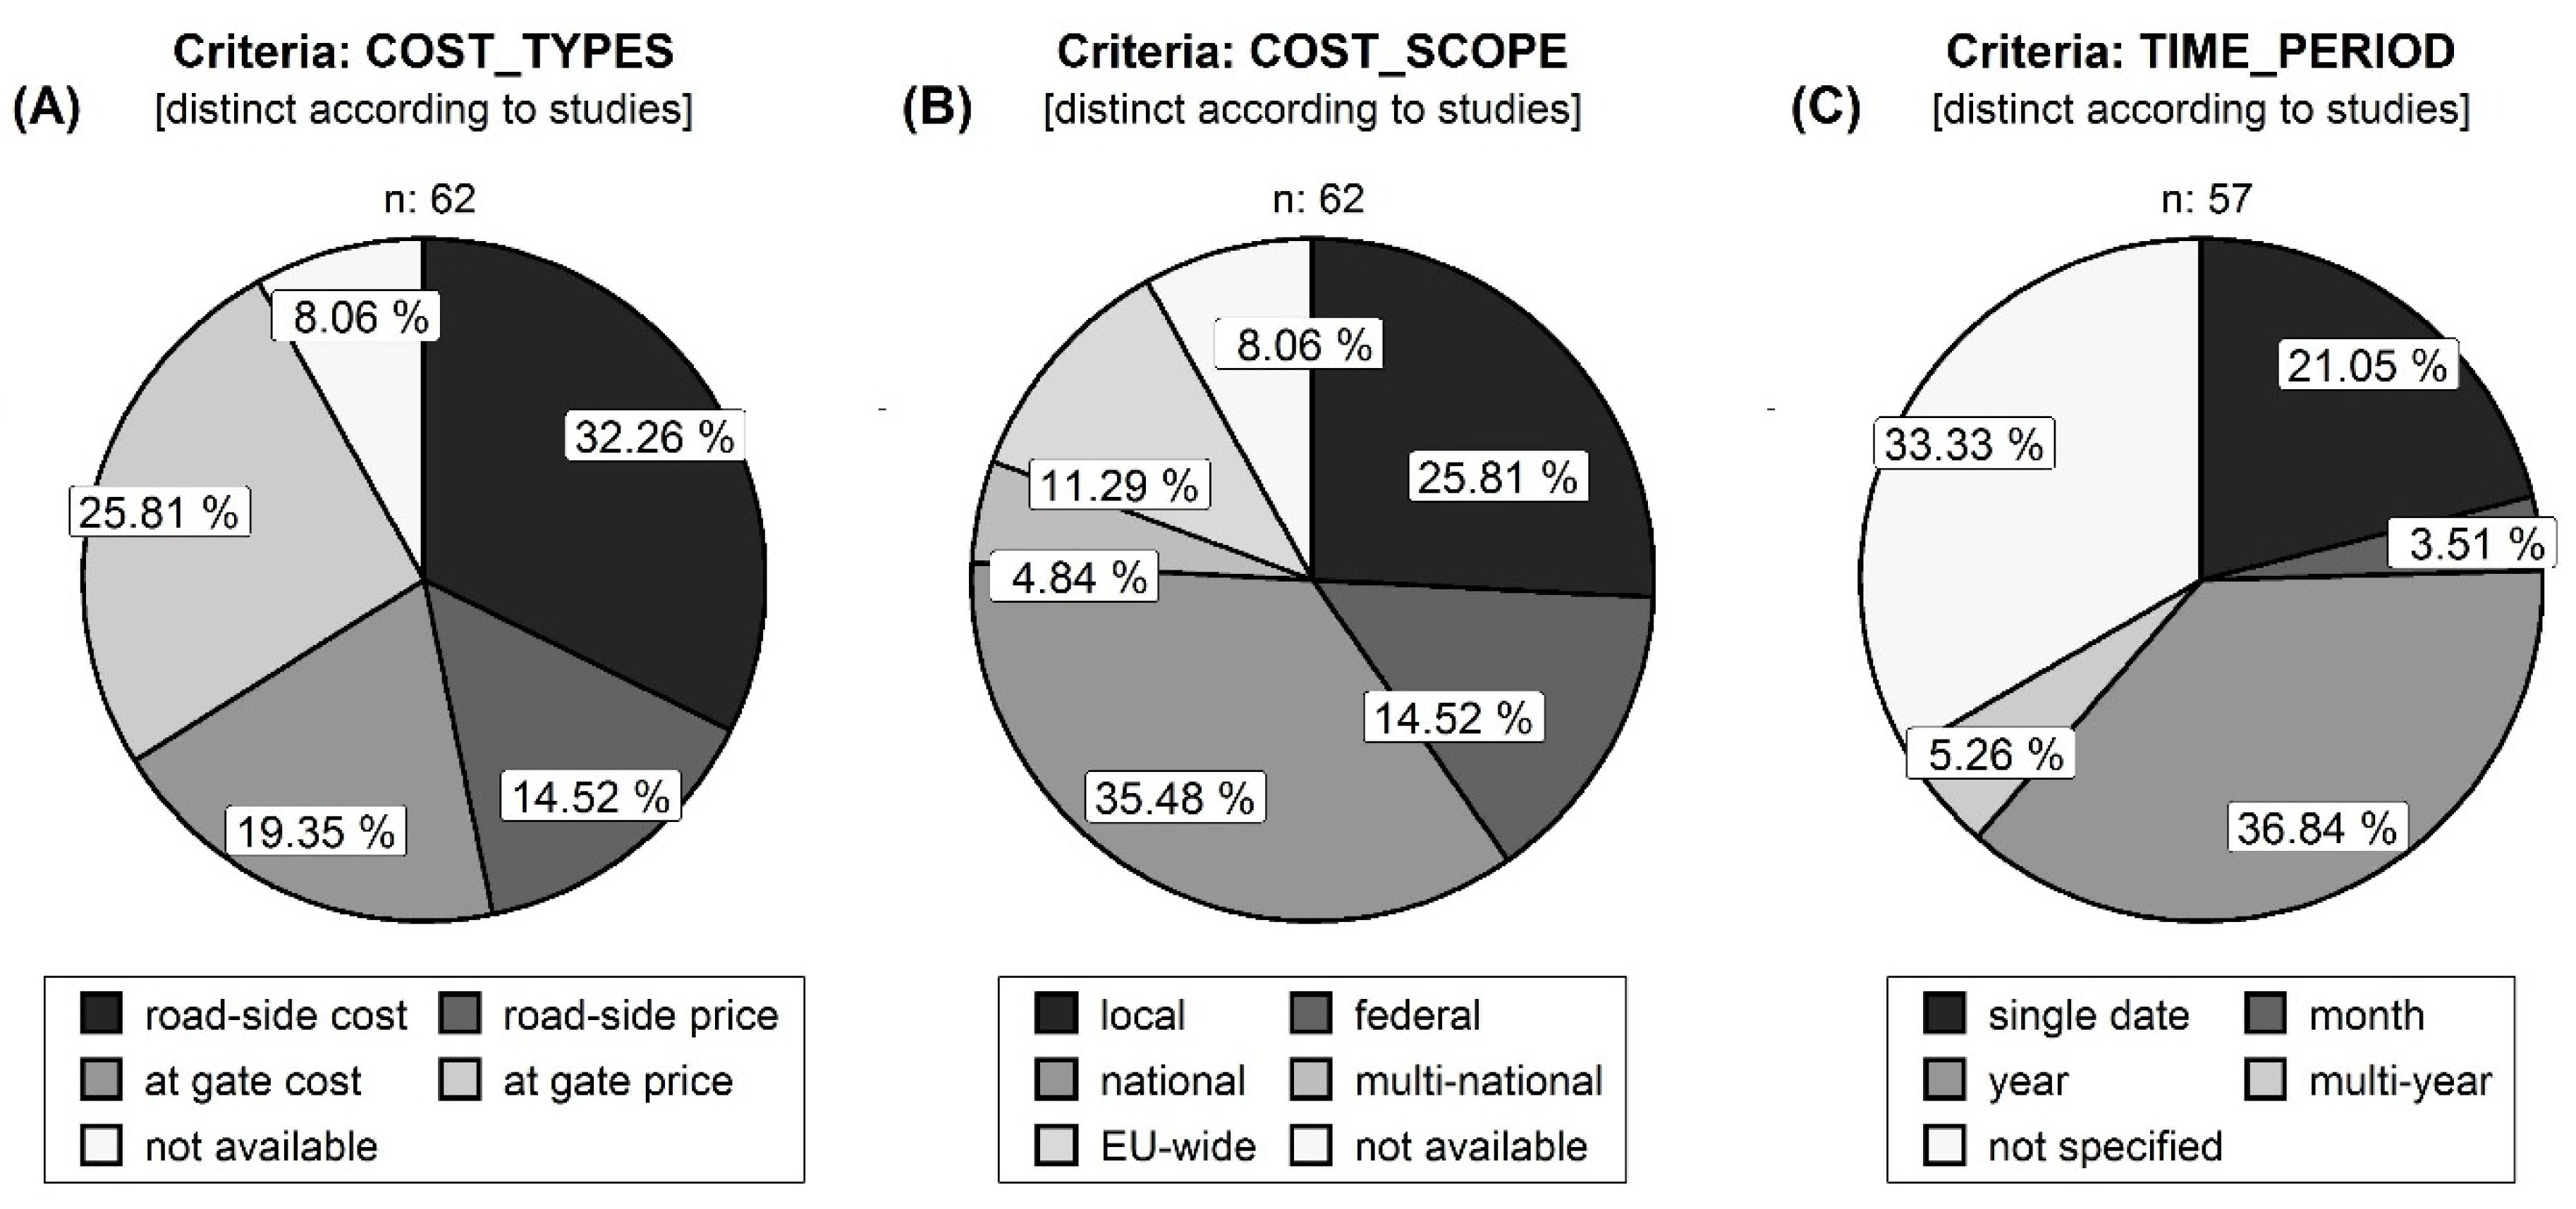
Diagram 6A in Figure 6 shows the Cost_Type distribution, revealing that roadside costs slightly dominated the other Cost_Types. A comparison of the use of costs or prices showed that data on costs made up 50% of the Cost_Types, while around 40% of the data sets used data on prices. When the Cost_Type was analysed, no preferences were found in the relevant literature for using costs or prices in relation to individual biomass types or subject areas.
3.2.4. Cost_Scope
Figure 6B shows that in 35% of studies, costs or prices were based on national values, followed by the 26% of studies in which costs or prices were found at local resolution. In this context, the S2Biom online tool [11] presented the “road-side” costs for biomass supply at high spatial resolution (NUTS3 level) for EU-28 states.
3.2.5. Time_Period
In one-third of the studies examined, it was not possible to clearly identify the time period, as shown in Diagram 6C. In these cases, the attribute “not available” was assigned. Most biomass supply costs and prices are related to annual values. Multi-year data on costs or prices were underrepresented in the literature, indicating that long-term effects were only rarely taken into consideration. The EU cost projects, for example, provided supply costs or prices for a period of several years. The “Biomass Futures” project [8] contained data for the years 2010, 2020 and 2030, with the costs being calculated for the years 2020 and 2030 using inflation factors. In the case of S2Biom [11], the costs from 2012 were kept constant for the years 2020 and 2030 for modelling purposes. These values were assigned to the annual values because only annual data served as the basis for the multi-year values.
3.2.6. Sources
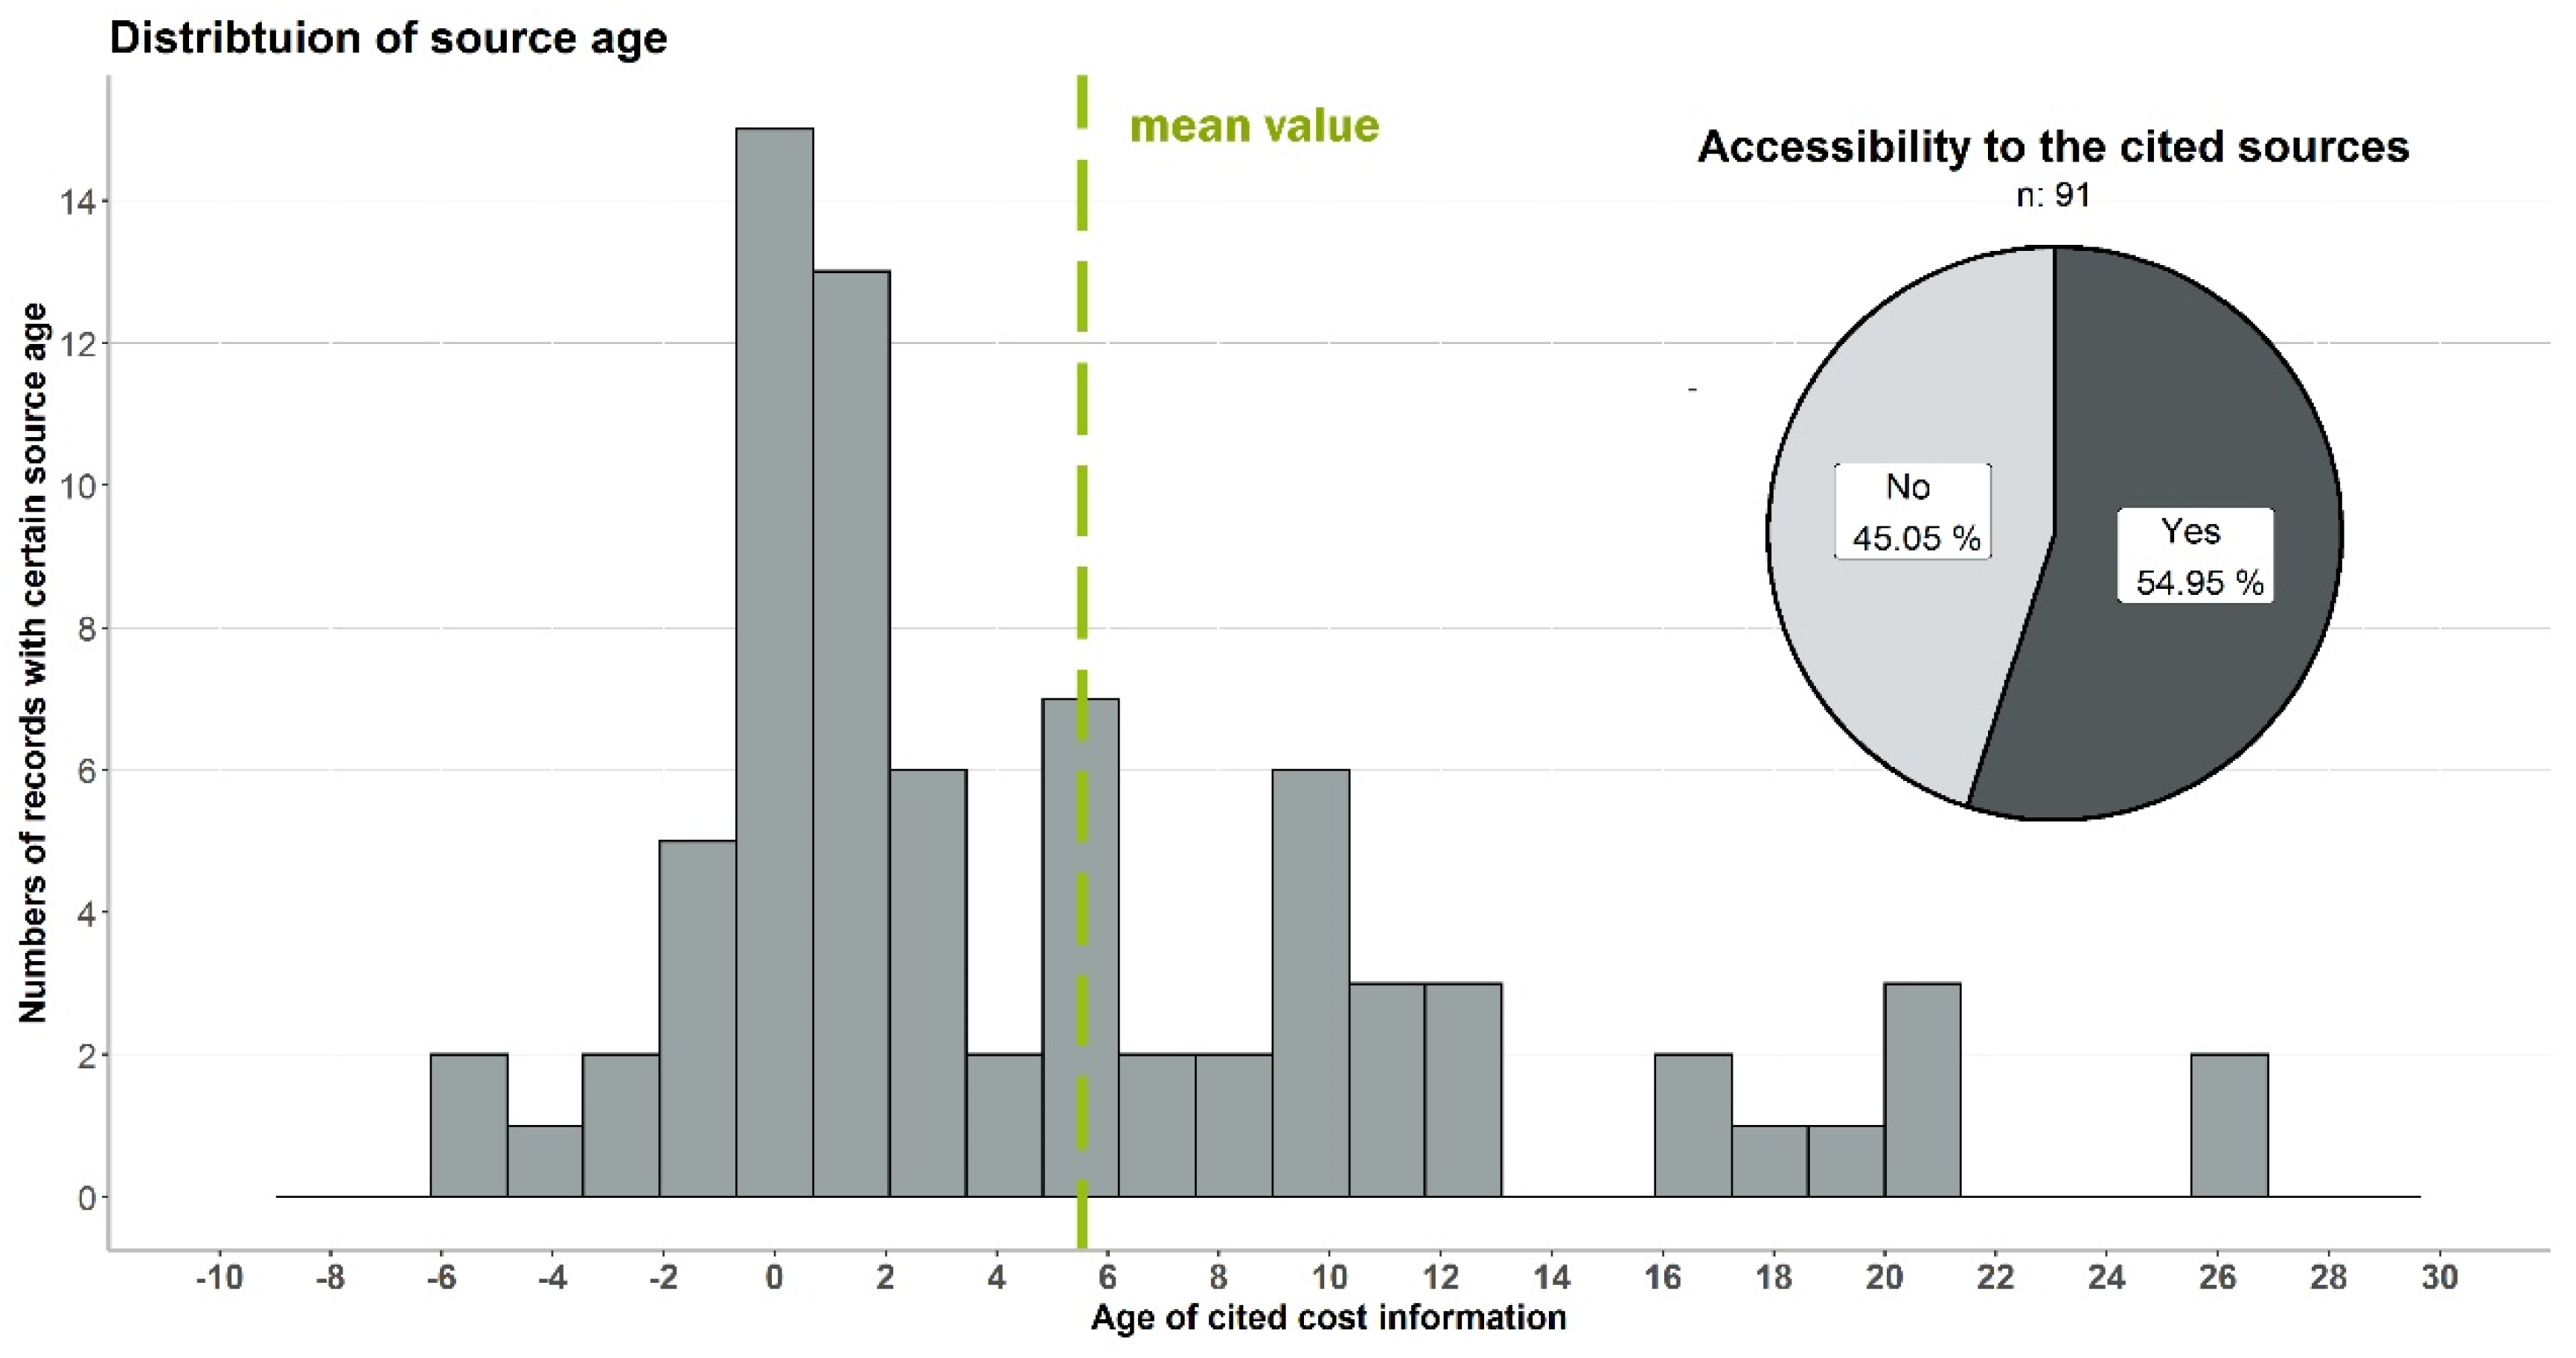
The pie chart in Figure 7 shows that 55% of the sources cited were accessible. Altogether, 49% of the reviewed publications provided no sources for the supply costs or prices of biogenic residues, wastes and by-products. In 35% of the publications, researchers asked plant operators directly about their costs for biogenic residues, wastes, and by-products or calculated the supply costs themselves. In 14% of the publications examined, they used their own assumptions or expert assessments, which could not be traced. The histogram in Figure 7 depicts the time elapsed between the information in the source being cited and the figures being used in the literature. The 91 data sets came from the unambiguous studies and the uniquely identified sources. On average, there was a difference of almost five years, although there were outliers such as the study by López-Rodríguez et al. [65], which contained data on costs going back 26 years; this was because the cited source [87] by Graham, from the year 2000, is indexed to 1993. One point that stood out was that the EU project “Biomass Futures” [8] occasionally used 20-year-old data from several cascades. The reason for this is that “Biomass Futures” indexed the supply costs to the year 2020, while the sources were from the year 2000. This resulted in a time period of 20 years due to the evaluation logic applied. In the case of the costs and prices used as the basis for the JRC-EU-TIMES model [10], this effect was not as obvious, although the figures for “other industrial waste wood”, to give an example, drew upon those from “Biomass Futures”. As the costs and prices were indexed to 2010 in the JRC-EU-TIMES model, the calculations made the costs that were used 10 years “younger”.
The data points in the histogram that showed a negative time period resulted from the procedure of the index year for the data on costs and prices being identified from the studies and sources. This led to the circumstances for the JRC-EU-TIMES model [10], where the supply prices for “solid manure” were indexed to the year 2010, but the associated source [88] given by Loncaric et al. indexed the mentioned supply prices for “solid manure” to 2013. This resulted in prices out of the source, which were three years “younger” than in the corresponding study.
3.2.7. Comparison of Studies and Sources
Identifying the Cost_Scope and Time_Period in the cited sources with the same possible values as in the relevant literature made it possible to carry out a comparative analysis of the spatial and temporal resolution. With regard to the Time_Period criterion, it was not possible to identify the time period in more than 40% of the studies investigated that indicated a source, as neither the source nor the study contained information that clearly fitted the selected values for that criterion. The proportion of cited sources that were not accessible was not taken into account in the analysis. For one-third of the studies evaluated, the same temporal relationship between the study and the cited source was found. In just under one-fifth of the evaluable studies, the time periods for the costs or prices from the sources in the studies were “extended”. That means monetary values given for a certain year of a study seem to take into account variations during that year. On closer examination of the source, it became clear that the values given for a year, in fact, came from a single period in that year. Therefore, no effects over the course of a year were taken into consideration. One example is the JRC-EU-TIMES model [10], which gives a straw price that is described as being for Germany and the year 2010. However, according to the source (Landesbetrieb Hessen [13]), it relates to week 48 of the year 2013 in the state of Hesse. In the JRC-EU-TIMES model, the price range for straw in Germany is specified as being between 61.00 EUR and 100.00 EUR/Mg [fm], while the mean value for week 48 is given as 80.00 EUR/Mg [fm]. Comparing this information on prices with the prices for straw in Hessen over a longer period, as shown in Figure 1, it became clear that a temporal resolution of at least a year is required, and if possible, a resolution at the monthly level, to depict seasonal effects. In 5% of the literature examined, the sources cited related to a longer period than stated in the study.
In the case of the Cost_Scope, for half of all cases, the same spatial scales were found in the studies and the associated source. In one-third of the data sets, the spatial resolution used was higher in the study than in the sources cited. This led to regional differences not being taken into account, as in the JRC-EU-TIMES model [10], which used state-specific price data from Chambre d’Agriculture du Nord-Pas de Calais [89] and Landesbetrieb Landwirtschaft Hessen [13] for the national French and German straw prices. In the study by Wit and Faaij [67], national prices from the quoted source by Karjalainen [90] were extended to several countries in the study, meaning that national differences in prices were not shown. When the spatial scale was smaller than in the sources cited, as in 5% of the studies analysed, it also led to spatial cost or price differences not being taken into account in the study. For example, for their assessment of biotechnologies’ life cycles, Vega et al. [73] required information on costs and prices for two selected states in Germany and Italy. The sources they used, among others, included Dutch prices from Wageningen University’s “Agro and Food Portal” [91].
3.2.8. Cost and Price Values
Table A21, Table A22, Table A23 and Table A24 of the appendix contain the minimum, mean and maximum values for the individual biomass types, sorted by Cost_Type, which can be given in EUR/Mg (dm). One aspect of the review that made it problematic to directly compare the quantifiable monetary values was the different attributes inside the variables and evaluation criteria. If the used units could not be converted into the unit EUR/Mg (dm), then they could not be compared. The differentiation between costs and prices and the scope of delivery also made it harder to contrast the different monetary values. Another distinguishing attribute was the spatial scale of the cost and price information. Comparability was also only possible to a limited extent if the costs or prices could not be indexed to the same base year because the index years were not indicated. Thus, for example, it was possible in only six of the 57 studies to identify roadside supply costs for Germany that could be expressed in EUR/Mg (dm). Moreover, it was only possible to depict the supply costs in Germany for 10 out of the 38 identified residues, wastes and by-products.
Altogether, 33 of the 38 residues, wastes and by-products were quantified in EUR/Mg (dm). The five biomass types for which no costs or prices could be expressed in EUR/Mg (dm) were, in line with the first aggregation level defined by Brosowski et al. [22], “biogenic share of waste water of anaerobic treatment”, “sewage sludge from public wastewater treatment plants”, “black liquor”, “stalks from landscape management” and “waste paper”. For the remaining 33 biogenic residues, wastes and by-products, 30% of them included only one study, where the costs and prices could be described in EUR/Mg (dm).
There were sometimes very large ranges in the minimum and maximum values shown in Table A21, Table A22, Table A23 and Table A24 between individual studies and individual countries. In the case of “woody biomass from vineyards”, there was a conversion factor of 48.31 (22.71–1097.00 EUR/Mg (dm)). In general, animal residues such as liquid and solid manures were the residues with the lowest costs or prices, followed by “bio-waste from private households”. In some cases, no supply costs were assumed, so costs and prices were set to EUR 0.00. The highest supply costs and widest ranges within a single biomass type were found for “stalks and woody biomass from orchards and vineyards”.
4. Discussion
This review proposes an approach for systematically recording and evaluating the supply costs and prices currently used in techno-economic analyses. The findings showed that there are considerable differences in the costs and prices for supplying individual biomass types. Even within individual types of residual biomass, differences could be made out in costs and prices between different studies and also within individual studies between different regions.
The differentiations used in the evaluation criteria meant that the information on costs and prices could only be compared to a limited extent. On the one hand, this was due to a lack of information in the studies. Quantifiable costs and prices could not be converted into the same units or base year because conversion factors or index years were not provided. On the other hand, differentiating between prices and costs and between the different scopes of delivery prevented the monetary values from being directly compared. This suggests that in the context of techno-economic analyses of biogenic supply chains of raw materials, no standard procedure indicates how to deal with supply costs and prices. Instead, the costs and prices used as input variables were adapted individually to suit each research context. This meant that postulations made in the literature could only be transferred to new situations to a limited extent. Additional effort is required to harmonise the assessments due to missing data or assumptions, as Esteban and Carrasco [63] also note.
An analysis of the sources cited showed that the spatial resolution used in the sources did not always fit the scope of the literature studied. This supports the assumption that suitable information on biomass supply costs or prices is not always available for use as input variables in the models, although assumptions about underlying supply costs and prices have a significant impact on model results [5,6,7]. Therefore, supply costs or prices are influenced by spatial effects, such as the amount of available biomass, as Brown et al. [62] mentioned. The spatial effects were shown by the S2Biom-project [12] and Yazan et al. [81] in their studies.
Operationalising the evaluation criteria made it possible to identify spatial and temporal differences between the cited sources and the literature examined. In the analysis, the Cost_Type criterion, differentiating between costs and prices, did not reveal any clear trends, suggesting that no certain type of biomass or study tended to use either costs or prices. The question, thus, remains of whether it is worth differentiating between supply costs and prices. A question for the future might be whether there are any differences between biomass supply costs and prices, and if so, how great they are. The present review was unable to answer that question due to the poor comparability described above.
Recording the different biomass types using the categorisation system developed by Brosowski et al. [22] made it easier to compare the residues, wastes and by-products with one another. However, when recording the costs, this led to imprecision; for example, the costs for “manure” described by D’Alpos [37] were not specified in any great detail. Therefore, these costs were ascribed to all biomass types at the first aggregation level, which were placed in the “manure” category.
The keywords chosen for the individual types of biomass and to restrict the spatial context to EU countries using the keywords “Europe” and “EU-28” may not have identified all of the relevant studies in the SCOPUS database. It is, thus, conceivable that by varying the keywords “Europe” and “EU-28” using country-specific keywords, further studies could be found. Neither the studies nor the sources they cited were always accessible. Accordingly, if the studies and sources had been freely available, a more extensive analysis would have been possible. One goal should, thus, be to increase accessibility.
In the future, suitable spatial and temporal initial data will help to improve and extend further assessments [75] and should include an investigation of feedstock prices or costs [36,45]. Additionally, in future studies, more attention needs to be paid to the selection of matching cost or price information in techno-economic models. In order to ensure that the input costs or prices are transferable, a reference year needs to be provided, and the factors that are used to convert the units need to be named. Precisely citing the sources used to determine the supply costs and prices also increases the reproducibility and transparency of the data. In order to ensure that others can generally use the selected input data, access to the publications should be improved using open-access schemes.
5. Conclusions
With this study, we provided a review of supply costs and prices used in the literature. The aim was to assess the quality of input data for techno-economic assessments because supply costs or prices have a significant influence on techno-economic model results. For this purpose, we operationalised the spatial and temporal references of the cost and price information. When collecting monetary values from the literature, we found inconsistencies between the spatial and temporal scope of the studies and their cited sources. The review, thus, supports the assumption that supply costs and prices are not always available in the suitable spatial and temporal resolution. We found that the use of outdated sources to determine the supply costs in techno-economic models confirms that need. Additionally, the reviewed studies used different units and scopes of supply, making it difficult to compare costs and price information. Due to different units (e.g., mass-based vs. energy-based units or units referred to dry vs. wet biomass) and partially missing conversion factors, no comparison was possible.
Due to the significant influence of supply costs and prices as input variables in techno-economic assessments, resilient supply costs and prices are needed in research to come up with a robust and realistic assessment and modelling results. Therefore, future evaluations need to be based on detailed cost and price data. These must contain a clear definition of the spatial and temporal context to match the individual assessment scopes. In order to achieve this, the authors recommend an open access monitoring system for supply costs be established over a period of several years with a local resolution.
A monitoring system should indicate the costs or prices in mass-based units with information on water content to map different competing uses. This would also enable the different types of biomass to be compared.
In further steps, when using supply costs and prices in techno-economic analysis, information on their drivers will be useful to dedicate the future development of the costs and prices. This will enable the development of scenarios for the techno-economic analysis, which assess the valorisation of biogenic residues, wastes and by-products.
Author Contributions
Conceptualisation, T.K., A.B. and D.T.; methodology, T.K.; validation, T.K.; formal analysis, T.K.; Literature Search, T.K.; writing—original draft preparation, T.K.; writing—review and editing, T.K., A.B. and D.T.; visualisation, T.K.; supervision, A.B. and D.T.; project administration, T.K.; All authors have read and agreed to the published version of the manuscript.
Funding
This study was funded by DBFZ—Deutsches Biomasseforschungszentrum gGmbH.
Institutional Review Board Statement
Not applicable.
Data Availability Statement
Base data are available on request.
Conflicts of Interest
The authors declare no conflict of interest.
Appendix A. Search Strings Used in SCOPUS—Database
Appendix A.1. Step 1—Relevant Residues

Table A1.
Overview—Records of literature search contain biomass potential.
| Terms “Potential” | Terms “Europe” | Scopus No. Paper | Full-Text No. Paper | Paywall No. Paper | Relevant No. Paper |
|---|---|---|---|---|---|
| “Potential” and “biomass” | EU-28 | 62 (62) | 38 | 24 | 7 |
| “technical potential” and biomass | EU-28 | 0 (4) | 0 | 0 | 0 |
| “technical potential” | EU-28 | 8 (15) | 4 | 4 | 0 |
| “potential assessment” and “biomass” | EU-28 | 0 (2) | 0 | 0 | 0 |
| “potential” and “biomass” and “EU-28” (Fulltext) | Europe | 4 (48) | 3 | 1 | 0 |
| “technical potential” and “biomass” | Europe | 34 (39) | 18 | 16 | 3 |
| “potential assessment” and “biomass” | Europe | 24 (32) | 13 | 11 | 1 |
| Further literature out of References | 1 | 1 | 0 | 1 | |
| all terms [∑] | 133 (202) | 77 | 56 | 11 + 1 | |
The total number of records found for the search strings is listed in parentheses. They contain duplicates between the combinations of the “Europe terms” and the “potential terms”.
Table A2.
Records literature search contain biomass potential for the terms “potential”, “biomass” and “EU-28”.
Table A2.
Records literature search contain biomass potential for the terms “potential”, “biomass” and “EU-28”.
| Terms “Potential” | Terms “Europe” | Scopus No. Paper | Full-Text No. Paper | Paywall No. Paper | Relevant No. Paper |
|---|---|---|---|---|---|
| “Potential” and “biomass” | EU-28 | 62 (62) | 38 | 24 | 7 |
Scopus search string—Residues [16 April 2020]
- ALL(“EU-28” AND (“biomass” W/3 “potential”) AND “residues”) AND PUBYEAR AFT 2009 AND DOCTYPE(ar OR re OR cp OR cr)
- ALL(“potential”) AND TITLE-ABS-KEY(“residues” AND “EU-28”) AND PUBYEAR AFT 2009 AND DOCTYPE(ar OR re OR cp OR cr)
Scopus search string—Biomass [16 April 2020 ]
- 3.
- ALL(“EU-28” AND (“biomass” W/3 “potential”) AND “biomass”) AND PUBYEAR AFT 2009 AND DOCTYPE(ar OR re OR cp OR cr)
- 4.
- ALL(“potential”) AND TITLE-ABS-KEY(“biomass” AND “EU-28”) AND PUBYEAR AFT 2009 AND DOCTYPE(ar OR re OR cp OR cr)
Table A3.
Records literature search contain biomass potential for the terms “technical potential”, “biomass” and “EU-28”.
Table A3.
Records literature search contain biomass potential for the terms “technical potential”, “biomass” and “EU-28”.
| Terms “Potential” | Terms “Europe” | Scopus No. Paper | Full-Text No. Paper | Paywall No. Paper | Relevant No. Paper |
|---|---|---|---|---|---|
| “technical potential” and biomass | EU-28 | 0 (4) | 0 | 0 | 0 |
Scopus search string—Residues [22 April 2020]
- ALL(“EU-28” AND (“biomass” W/3 “technical potential”) AND “residues”) AND PUBYEAR AFT 2009 AND OCTYPE(ar OR re OR cp OR cr)
- ALL(“technical potential”) AND TITLE-ABS-KEY(“residues” AND “EU-28”) AND PUBYEAR AFT 2009 AND DOCTYPE(ar OR re OR cp OR cr)
Scopus-Searchstring—Biomass [22 April 2020]
- 3.
- A ALL(“EU-28” AND (“biomass” W/3 “technical potential”) AND “biomass”) AND PUBYEAR AFT 2009 AND DOCTYPE(ar OR re OR cp OR cr)
- 4.
- ALL(“technical potential”) AND TITLE-ABS-KEY(“biomass” AND “EU-28”) AND PUBYEAR AFT 2009 AND DOCTYPE(ar OR re OR cp OR cr)
Table A4.
Records literature search contain biomass potential for the terms “technical potential” and “EU-28”.
Table A4.
Records literature search contain biomass potential for the terms “technical potential” and “EU-28”.
| Terms “Potential” | Terms “Europe” | Scopus No. Paper | Full-Text No. Paper | Paywall No. Paper | Relevant No. Paper |
|---|---|---|---|---|---|
| “technical potential” | EU-28 | 8 (15) | 4 | 4 | 0 |
Scopus search string—Residues [22 April 2020]
- ALL(“EU-28” AND (“technical potential”) AND “residues”) AND PUBYEAR AFT 2009 AND DOCTYPE(ar OR re OR cp OR cr)
- ALL(“technical potential”) AND TITLE-ABS-KEY(“residues” AND “EU-28”) AND PUBYEAR AFT 2009 AND DOCTYPE(ar OR re OR cp OR cr)
Scopus search string—Biomass [22 April 2020]
- 3.
- ALL(“EU-28” AND (“technical potential”) AND “biomass”) AND PUBYEAR AFT 2009 AND DOCTYPE(ar OR re OR cp OR cr)
- 4.
- ALL(“technical potential”) AND TITLE-ABS-KEY(“biomass” AND “EU-28”) AND PUBYEAR AFT 2009 AND DOCTYPE(ar OR re OR cp OR cr)
Table A5.
Records literature search contain biomass potential for the terms “potential assessmen”, “biomass” and “EU-28”.
Table A5.
Records literature search contain biomass potential for the terms “potential assessmen”, “biomass” and “EU-28”.
| Terms “Potential” | Terms “Europe” | Scopus No. Paper | Full-Text No. Paper | Paywall No. Paper | Relevant No. Paper |
|---|---|---|---|---|---|
| “potential assessment” and “biomass” | EU-28 | 0 (2) | 0 | 0 | 0 |
Scopus search string—Residues [22 April 2020]
- ALL(“EU-28” AND (“biomass” W/3 “Potential assessment”) AND “residues”) AND PUBYEAR AFT 2009 AND DOCTYPE(ar OR re OR cp OR cr)
- ALL(“Potential assessment”) AND TITLE-ABS-KEY(“residues” AND “EU-28”) AND PUBYEAR AFT 2009 AND DOCTYPE(ar OR re OR cp OR cr)
Scopus search string—Biomass [22 April 2020]
- 3.
- ALL(“EU-28” AND (“biomass” W/3 “Potential assessment”) AND “biomass”) AND PUBYEAR AFT 2009 AND DOCTYPE(ar OR re OR cp OR cr)
- 4.
- ALL(“Potential assessment”) AND TITLE-ABS-KEY(“biomass” AND “EU-28”) AND PUBYEAR AFT 2009 AND DOCTYPE(ar OR re OR cp OR cr)
Table A6.
Records literature search contain biomass potential for the terms “potential”, “biomass”, “EU-28” and “Europe”.
Table A6.
Records literature search contain biomass potential for the terms “potential”, “biomass”, “EU-28” and “Europe”.
| Terms “Potential” | Terms “Europe” | Scopus No. Paper | Full-Text No. Paper | Paywall No. Paper | Relevant No. Paper |
|---|---|---|---|---|---|
| “potential” and “biomass” and “EU-28” (Fulltext) | Europe | 4 (48) | 3 | 1 | 0 |
Scopus search string—Residues [22 April 2020]
- ALL(“EUROPE” AND (“biomass” W/3 “potential”) AND “residues” AND “EU-28”) AND PUBYEAR AFT 2009 AND DOCTYPE(ar OR re OR cp OR cr)
- ALL(“potential” AND “EU-28”) AND TITLE-ABS-KEY(“residues” AND “EUROPE”) AND PUBYEAR AFT 2009 AND DOCTYPE(ar OR re OR cp OR cr)
Scopus search string—Biomass [22 April 2020]
- 3.
- ALL(“EUROPE” AND (“biomass” W/3 “potential”) AND “biomass” AND “EU-28”) AND PUBYEAR AFT 2009 AND DOCTYPE(ar OR re OR cp OR cr)
- 4.
- ALL(“potential” AND “EU-28”) AND TITLE-ABS-KEY(“biomass” AND “EUROPE”) AND PUBYEAR AFT 2009 AND DOCTYPE(ar OR re OR cp OR cr)
Table A7.
Records literature search contain biomass potential for the terms “technical potential”, “biomass” and “Europe”.
Table A7.
Records literature search contain biomass potential for the terms “technical potential”, “biomass” and “Europe”.
| Terms “Potential” | Terms “Europe” | Scopus No. Paper | Full-Text No. Paper | Paywall No. Paper | Relevant No. Paper |
|---|---|---|---|---|---|
| “technical potential” and “biomass” | Europe | 34 (39) | 18 | 16 | 3 |
Scopus search string—Residues [22 April 2020]
- ALL(“EUROPE” AND (“biomass” W/3 “technical potential”) AND “residues”) AND PUBYEAR AFT 2009 AND DOCTYPE(ar OR re OR cp OR cr)
- ALL(“technical potential”) AND TITLE-ABS-KEY(“residues” AND “EUROPE”) AND PUBYEAR AFT 2009 AND DOCTYPE(ar OR re OR cp OR cr)
Scopus search string—Biomass [22 April 2020]
- 3.
- ALL(“EUROPE” AND (“biomass” W/3 “technical potential”) AND “biomass”) AND PUBYEAR AFT 2009 AND DOCTYPE(ar OR re OR cp OR cr)
- 4.
- ALL(“technical potential”) AND TITLE-ABS-KEY(“biomass” AND “EUROPE”) AND PUBYEAR AFT 2009 AND DOCTYPE(ar OR re OR cp OR cr)
Table A8.
Records literature search contain biomass potential for the terms “potential assessment”, “biomass” and “Europe”.
Table A8.
Records literature search contain biomass potential for the terms “potential assessment”, “biomass” and “Europe”.
| Terms “Potential” | Terms “Europe” | Scopus No. Paper | Full-Text No. Paper | Paywall No. Paper | Relevant No. Paper |
|---|---|---|---|---|---|
| “potential assessment” and “biomass” | Europe | 24 (32) | 13 | 11 | 1 |
Scopus search string—Residues [22 April 2020]
- ALL(“EUROPE” AND (“biomass” W/3 “Potential assessment”) AND “residues”) AND PUBYEAR AFT 2009 AND DOCTYPE(ar OR re OR cp OR cr)
- ALL(“Potential assessment”) AND TITLE-ABS-KEY(“residues” AND “EUROPE”) AND PUBYEAR AFT 2009 AND DOCTYPE(ar OR re OR cp OR cr)
Scopus search string—Biomass [22 April 2020]
- 3.
- ALL(“EUROPE” AND (“biomass” W/3 “Potential assessment”) AND “biomass”) AND PUBYEAR AFT 2009 AND DOCTYPE(ar OR re OR cp OR cr)
- 4.
- ALL(“Potential assessment”) AND TITLE-ABS-KEY(“biomass” AND “EUROPE”) AND PUBYEAR AFT 2009 AND DOCTYPE(ar OR re OR cp OR cr)
Appendix A.2. Step 2—Cost and Price Information
Table A9.
Overview—Records literature search contain cost and price information.
| Terms “Residues” | Scopus No. Paper | Full-Text No. Paper | Paywall No. Paper | Relevant No. Paper |
|---|---|---|---|---|
| “residual biomass” | 25 (25) | 14 | 11 | 5 |
| “waste biomass” | 34 (35) | 14 | 20 | 4 |
| “straw” | 165 (188) | 75 | 90 | 18 |
| “wood * residues” | 17 (25) | 7 | 10 | 3 |
| “forest * residues” | 37 (62) | 14 | 23 | 10 |
| “manure” | 117 (172) | 50 | 67 | 7 |
| “pruning” | 34 (49) | 19 | 15 | 2 |
| “grassland cutting” | 0 (0) | 0 | 0 | 0 |
| “landscape care” | 0 (0) | 0 | 0 | 0 |
| “municipal waste” | 25 (30) | 13 | 12 | 1 |
| “sludge” | 119 (159) | 43 | 76 | 4 |
| all terms [∑] | 573 (745) | 249 | 324 | 54 |
The total number of records found for the search strings is listed in parentheses. They contain duplicates between the “residues terms”. * The symbol is used as a wildcard into the logic of building up search strings in SCOPUS-Database.
Table A10.
Records literature search contain cost and price information for residual biomass.
| Terms “Residues” | Scopus No. Paper | Full-Text No. Paper | Paywall No. Paper | Relevant No. Paper |
|---|---|---|---|---|
| “residual biomass” | 25 (25) | 14 | 11 | 5 |
Scopus search string [10 June 2020]
- ALL((“EU-28” OR “europe”) AND (“cost” OR “price”) W/4 “feedstock” AND “residual biomass”) AND PUBYEAR AFT 2009 AND DOCTYPE(ar OR re OR cp OR cr)
- ALL(“cost” OR “price”) AND TITLE-ABS-KEY(“residual biomass” AND (“EU-28” OR “europe”)) AND PUBYEAR AFT 2009 AND DOCTYPE(ar OR re OR cp OR cr)
Table A11.
Records literature search contain cost and price information for waste biomass.
| Terms “Residues” | Scopus No. Paper | Full-Text No. Paper | Paywall No. Paper | Relevant No. Paper |
|---|---|---|---|---|
| “waste biomass” | 34 (35) | 14 | 20 | 4 |
Scopus search string [10 June 2020]
- ALL((“EU-28” OR “europe”) AND ((“cost” OR “price”) W/4 “feedstock”) AND “waste biomass”) AND PUBYEAR AFT 2009 AND DOCTYPE(ar OR re OR cp OR cr)
- ALL(“cost” OR “price”) AND TITLE-ABS-KEY(“waste biomass” AND (“EU-28” OR “europe”)) AND PUBYEAR AFT 2009 AND DOCTYPE(ar OR re OR cp OR cr)
Table A12.
Records literature search contain cost and price information for straw.
| Terms “Residues” | Scopus No. Paper | Full-Text No. Paper | Paywall No. Paper | Relevant No. Paper |
|---|---|---|---|---|
| “straw” | 165 (188) | 75 | 90 | 18 |
Scopus search string [10 June 2020]
- ALL((“EU-28” OR “europe”) AND ((“cost” OR “price”) W/4 “feedstock”) AND “straw”) AND PUBYEAR AFT 2009 AND DOCTYPE(ar OR re OR cp OR cr)
- ALL(“cost” OR “price”) AND TITLE-ABS-KEY(“straw” AND (“EU-28” OR “europe”)) AND PUBYEAR AFT 2009 AND DOCTYPE(ar OR re OR cp OR cr)
Table A13.
Records literature search contain cost and price information for woody residues.
| Terms “Residues” | Scopus No. Paper | Full-Text No. Paper | Paywall No. Paper | Relevant No. Paper |
| “wood * residues” | 17 (25) | 7 | 10 | 3 |
* The symbol is used as a wildcard into the logic of building up search strings in SCOPUS-Database.
Scopus search string [10 June 2020]
- ALL((“EU-28” OR “europe”) AND (“cost” OR “price”) W/4 “feedstock” AND “wood* residu*”) AND PUBYEAR AFT 2009 AND DOCTYPE(ar OR re OR cp OR cr)
- ALL(“cost” OR “price”) AND TITLE-ABS-KEY(“wood* residu*” AND (“EU-28” OR “europe”)) AND PUBYEAR AFT 2009 AND DOCTYPE(ar OR re OR cp OR cr)
Table A14.
Records literature search contain cost and price information for forestry residues.
| Terms “Residues” | Scopus No. Paper | Full-Text No. Paper | Paywall No. Paper | Relevant No. Paper |
|---|---|---|---|---|
| “forest * residues” | 37 (62) | 14 | 23 | 10 |
* The symbol is used as a wildcard into the logic of building up search strings in SCOPUS-Database.
Scopus search string [10 June 2020]
- ALL((“EU-28” OR “europe”) AND (“cost” OR “price”) W/4 “feedstock” AND “forest residu*”) AND PUBYEAR AFT 2009 AND DOCTYPE(ar OR re OR cp OR cr)
- ALL(“cost” OR “price”) AND TITLE-ABS-KEY(“forest residu*” AND (“EU-28” OR “europe”)) AND PUBYEAR AFT 2009 AND DOCTYPE(ar OR re OR cp OR cr)
Table A15.
Records literature search contain cost and price information for manure.
| Terms “Residues” | Scopus No. Paper | Full-Text No. Paper | Paywall No. Paper | Relevant No. Paper |
|---|---|---|---|---|
| “manure” | 117 (172) | 50 | 67 | 7 |
Scopus search string [10 June 2020]
- ALL((“EU-28” OR “europe”) AND (“cost” OR “price”) W/4 “feedstock” AND “manure”) AND PUBYEAR AFT 2009 AND DOCTYPE(ar OR re OR cp OR cr)
- ALL((“EU-28” OR “europe”) AND (“cost” OR “price”) W/4 “feedstock” AND “manure”) AND PUBYEAR AFT 2009 AND DOCTYPE(ar OR re OR cp OR cr)
Table A16.
Records literature search contain cost and price information for pruning.
| Terms “Residues” | Scopus No. Paper | Full-Text No. Paper | Paywall No. Paper | Relevant No. Paper |
|---|---|---|---|---|
| “pruning” | 34 (49) | 19 | 15 | 2 |
Scopus search string [10 June 2020]
- ALL((“EU-28” OR “europe”) AND (“cost” OR “price”) W/4 “feedstock” AND “pruning”) AND PUBYEAR AFT 2009 AND DOCTYPE(ar OR re OR cp OR cr)
- ALL(“cost” OR “price”) AND TITLE-ABS-KEY(“pruning” AND (“EU-28” OR “europe”)) AND PUBYEAR AFT 2009 AND DOCTYPE(ar OR re OR cp OR cr)
Table A17.
Records literature search contain cost and price information for grassland cutting.
| Terms “Residues” | Scopus No. Paper | Full-Text No. Paper | Paywall No. Paper | Relevant No. Paper |
|---|---|---|---|---|
| “grassland cutting” | 0 (0) | 0 | 0 | 0 |
Scopus search string [10 June 2020]
- ALL((“EU-28” OR “europe”) AND (“cost” OR “price”) W/4 “feedstock” AND “grassland cutting”) AND PUBYEAR AFT 2009 AND DOCTYPE(ar OR re OR cp OR cr)
- ALL(“cost” OR “price”) AND TITLE-ABS-KEY(“grassland cutting” AND (“EU-28” OR “europe”)) AND PUBYEAR AFT 2009 AND DOCTYPE(ar OR re OR cp OR cr)
Table A18.
Records literature search contain cost and price information for landscape care residues.
Table A18.
Records literature search contain cost and price information for landscape care residues.
| Terms “Residues” | Scopus No. Paper | Full-Text No. Paper | Paywall No. Paper | Relevant No. Paper |
|---|---|---|---|---|
| “landscape care” | 0 (0) | 0 | 0 | 0 |
Scopus search string [10 June 2020]
- ALL((“EU-28” OR “europe”) AND (“cost” OR “price”) W/4 “feedstock” AND “landscape care”) AND PUBYEAR AFT 2009 AND DOCTYPE(ar OR re OR cp OR cr)
- ALL(“cost” OR “price”) AND TITLE-ABS-KEY(“landscape care” AND (“EU-28” OR “europe”)) AND PUBYEAR AFT 2009 AND DOCTYPE(ar OR re OR cp OR cr)
Table A19.
Records literature search contain cost and price information for municipal waste.
| Terms “Residues” | Scopus No. Paper | Full-Text No. Paper | Paywall No. Paper | Relevant No. Paper |
|---|---|---|---|---|
| “municipal waste” | 25 (30) | 13 | 12 | 1 |
Scopus search string [10 June 2020]
- ALL((“EU-28” OR “europe”) AND (“cost” OR “price”) W/4 “feedstock” AND “municipal waste”) AND PUBYEAR AFT 2009 AND DOCTYPE(ar OR re OR cp OR cr)
- ALL(“cost” OR “price”) AND TITLE-ABS-KEY(“municipal waste” AND (“EU-28” OR “europe”)) AND PUBYEAR AFT 2009 AND DOCTYPE(ar OR re OR cp OR cr)
Table A20.
Records literature search contain cost and price information for sludge.
| Terms “Residues” | Scopus No. Paper | Full-Text No. Paper | Paywall No. Paper | Relevant No. Paper |
|---|---|---|---|---|
| “sludge” | 119 (159) | 43 | 76 | 4 |
Scopus search string [10 June 2020]
- ALL((“EU-28” OR “europe”) AND (“cost” OR “price”) W/4 “feedstock” AND “sludge”) AND PUBYEAR AFT 2009 AND DOCTYPE(ar OR re OR cp OR cr)
- ALL(“cost” OR “price”) AND TITLE-ABS-KEY(“sludge” AND (“EU-28” OR “europe”)) AND PUBYEAR AFT 2009 AND DOCTYPE(ar OR re OR cp OR cr)
Appendix B. Minimum, Average and Maximum Values per Cost_Type
Table A21.
Cost values for road-side costs in EUR/Mg (dm).
| Biomass Type | Source Min | Country Min | Min Value | Ave Value | Max Value | Country Max | Source Max | Change Factor |
|---|---|---|---|---|---|---|---|---|
| Beet leaves | [12] | RO | 21.59 | 65.21 | 221.16 | MT | [12] | 10.24 |
| Bio-waste from private households | [54] | AT | 73.3 | 95.65 | 137.5 | AT | [54] | 1.88 |
| By-products of wood processing industries and wood shavings | [61] | ES | 20 | 60.26 | 60.58 | ES | [61] | 3.03 |
| Cattle liquid manure | [38] | PL | 0 | 0 | 0 | PL | [38] | n.A. |
| Cereal straw | [24] | BG | 10 | 30.37 | 187.88 | MT | [12,75] | 18.79 |
| Grain corn straw | [24] | BG | 10 | 19.37 | 34.5 | DK | [24] | 3.45 |
| Grassland Cuttings | [12] | RO | 13.51 | 37.07 | 95.97 | UK | [12] | 7.1 |
| Logging residues (coniferous) | [24] | BG | 7.8 | 34.64 | 112.13 | IT | [12] | 14.38 |
| Logging residues (deciduous) | [24] | BG | 7.8 | 29.38 | 86.96 | ES | [12] | 11.15 |
| Other industrial waste wood | [61] | ES | 20 | 60.26 | 60.58 | ES | [61] | 3.03 |
| Rapeseed straw | [12,75] | RO | 10.08 | 29.97 | 135.74 | MT | [12,75] | 13.47 |
| Stalks from orchards | [40] | PL | 74.7 | 97.9 | 121.1 | PL | [40] | 1.62 |
| Stalks from roadside greenery | [62] | UK | 1.2 | 56.64 | 101.68 | DK | [12] | 84.73 |
| Sunflower straw | [12,75] | RO | 9.83 | 34.01 | 166.36 | MT | [12,75] | 16.92 |
| Waste wood | [61] | ES | 20 | 60.26 | 60.58 | ES | [61] | 3.03 |
| Woody biomass from orchards | [64] | ES | 22.71 | 184.74 | 932.22 | DK | [12] | 41.05 |
| Woody biomass from vineyards | [64] | ES | 22.71 | 280.21 | 1097.02 | DE | [12] | 48.31 |
Table A22.
Price values for road-side price in EUR/Mg (dm).
| Biomass Type | Source Min | Country Min | Min Value | Ave Value | Max Value | Country Max | Source Max | Change Factor |
|---|---|---|---|---|---|---|---|---|
| Cereal straw | [66] | PL | 25.6 | 33 | 51.42 | DE | [47] | 2.01 |
| Logging residues (coniferous) | [82] | SE | 72.88 | 72.88 | 72.88 | SE | [82] | 1 |
| Logging residues (deciduous) | [82] | SE | 72.88 | 72.88 | 72.88 | SE | [82] | 1 |
Table A23.
Price values for at gate price in EUR/Mg (dm).
| Biomass Type | Source Min | Country Min | Min Value | Ave Value | Max Value | Country Max | Source Max | Change Factor |
|---|---|---|---|---|---|---|---|---|
| Bark | [33] | SE | 67.17 | 77.12 | 90.56 | SE | [33] | 1.35 |
| By-products of wood processing industries and wood shavings | [53] | RO | 11.45 | 11.45 | 11.45 | RO | [53] | 1 |
| Cattle liquid manure | [78] | HR, HU | 0.75 | 0.92 | 1.1 | PL | [59] | 1.47 |
| Cattle slurry | [78] | HR, HU | 0.16 | 0.63 | 1.1 | PL | [59] | 6.88 |
| Cereal straw | [68] | HU | 23.2 | 188.28 | 286.5 | MT | [7] | 12.35 |
| Logging residues (coniferous) | [10] | RO | 20.59 | 79.63 | 154.87 | MT | [7] | 7.52 |
| Logging residues (deciduous) | [10] | RO | 20.59 | 79.63 | 154.87 | MT | [7] | 7.52 |
| Pig slurry | [78] | HR, HU | 0.08 | 0.59 | 1.1 | PL | [59] | 13.75 |
Table A24.
Cost values for at gate costs in EUR/Mg (dm).
| Biomass Type | Source Min | Country Min | Min Value | Ave Value | Max Value | Country Max | Source Max | Change Factor |
|---|---|---|---|---|---|---|---|---|
| Bio-waste from private households | [8] | BE | 9.2 | 15.8 | 23.9 | PL | [8] | 2.6 |
| By-products of wood processing industries and wood shavings | [8] | RO | 23.85 | 38.99 | 72.06 | IE | [8] | 3.02 |
| Cattle liquid manure | [8] | DK | 0 | 1.47 | 9 | DE, IT | [73] | 9 |
| Cereal straw | [67] | RO | 13.59 | 45.78 | 92.34 | IE | [67] | 6.79 |
| Chicken liquid manure | [73] | DE, IT | 5 | 5 | 5 | DE, IT | [73] | 1 |
| Goat manure | [8] | DK | 0 | 0.87 | 1.13 | AT | [8] | 1.13 |
| Grain corn straw | [67] | RO | 13.59 | 45.78 | 92.34 | IE | [67] | 6.79 |
| Grassland Cuttings | [8] | LT | 26.81 | 40.97 | 62.6 | NL | [8] | 2.33 |
| Logging residues (coniferous) | [8] | SE | 48.92 | 65.45 | 116.35 | IE | [8] | 2.38 |
| Logging residues (deciduous) | [8] | SE | 48.92 | 67 | 116.35 | IE | [8] | 2.38 |
| Other industrial waste wood | [61] | ES | 24.39 | 43.59 | 72.06 | IE | [8] | 2.95 |
| Pig liquid manure | [8] | DK | 0 | 2.14 | 18 | DE, IT | [73] | 18 |
| Pig slurry | [51] | DK | 0.03 | 0.05 | 0.07 | DK | [51] | 2.33 |
| Poultry manure (others) | [8] | DK | 0 | 0.87 | 1.13 | AT | [8] | 1.13 |
| Rapeseed straw | [67] | RO | 13.59 | 46.03 | 92.34 | IE | [67] | 6.79 |
| Residues from vegetable processing | [73] | DE, IT | 150 | 150 | 150 | DE, IT | [73] | 1 |
| Residues from winemaking | [73] | DE, IT | 150 | 150 | 150 | DE, IT | [73] | 1 |
| Sheep manure | [8] | DK | 0 | 0.87 | 1.13 | AT | [8] | 1.13 |
| Stalks from orchards | [8] | CZ | 13.28 | 27.23 | 63.99 | FR, DE, ES | [41] | 4.82 |
| Stalks from roadside greenery | [8] | BE | 8 | 8.9 | 9.95 | PL | [8] | 1.24 |
| Stalks from vineyards | [8] | CZ | 13.28 | 27.37 | 60 | DE, IT | [73] | 4.52 |
| Sunflower straw | [67] | RO | 13.59 | 46.03 | 92.34 | IE | [67] | 6.79 |
| Waste wood | [8] | RO | 6.12 | 21.68 | 66.57 | ES | [61] | 10.88 |
| Wooden materials from landscape management | [8] | CZ | 9.2 | 16.62 | 34.1 | IE | [8] | 3.71 |
| Woody biomass from orchards | [8] | CZ | 13.28 | 27.23 | 63.99 | FR, DE, ES | [41] | 4.82 |
| Woody biomass from roadside greenery | [8] | BE | 8 | 8.9 | 9.95 | PL | [8] | 1.24 |
| Woody biomass from vineyards | [8] | CZ | 13.28 | 25.04 | 50.22 | IE | [8] | 3.78 |
References
- Euopean Commision. The European Green Deal; COM 640 Final No. 640; Euopean Commision: Brussels, Belgium, 2019; Available online: https://eur-lex.europa.eu/resource.html?uri=cellar:b828d165-1c22-11ea-8c1f-01aa75ed71a1.0002.02/DOC_1&format=PDF (accessed on 25 February 2021).
- Federal Ministry of Education and Research; Federal Ministry of Food and Agriculture. National Bioeconomy Strategy; Federal Ministry of Education and Research: Berlin, Germany; Federal Ministry of Food and Agriculture: Berlin, Germany, 2020; Available online: https://www.bmbf.de/upload_filestore/pub/BMBF_Nationale_Biooekonomiestrategie_Langfassung_deutsch.pdf (accessed on 25 February 2021).
- Zörb, C.; Lewandowski, I.; Kindervater, R.; Göttert, U.; Patzelt, D. Biobased Resources and Value Chains. In Bioeconomy: Shaping the Transition to a Sustainable, Biobased Economy; Lewandowski, I., Ed.; Springer Nature: Cham, Switzerland, 2018; pp. 75–95. ISBN 978-3-319-68152-8. [Google Scholar]
- European Parliament; European Council. Directives on the Promotion of the Use of Energy from Renewable Sources: RED II; European Parliament: Strasbourg, France; European Council: Brussels, Belgium, 2018. [Google Scholar]
- Lepage, T.; Kammoun, M.; Schmetz, Q.; Richel, A. Biomass-to-hydrogen: A review of main routes production, processes evaluation and techno-economical assessment. Biomass Bioenergy 2021, 144, 105920. [Google Scholar] [CrossRef]
- Schubert, T. Production routes of advanced renewable C1 to C4 alcohols as biofuel components—A review. Biofuels Bioprod. Biorefining 2020, 14, 845–878. [Google Scholar] [CrossRef]
- De Jong, S.; Hoefnagels, R.; Faaij, A.; Slade, R.; Mawhood, R.; Junginger, M. The feasibility of short-term production strategies for renewable jet fuels—A comprehensive techno-economic comparison. Biofuels Bioprod. Biorefining 2015, 9, 778–800. [Google Scholar] [CrossRef]
- Elbersen, B.; Startisky, I.; Hengeveld, G.; Schelhaas, M.-J.; Naeff, H.; Böttcher, H. Atlas of EU Biomass Potentials—Deliverable 3.3: Spatially Detailed and Quantified Overview of EU Biomass Potential Taking into Account the Main Criteria Determining Biomass Availability from Different Sources; Biomass Futures Project; Alterra/IIASA: Wageningen, The Netherlands, 2012. [Google Scholar]
- Simoes, S.; Nijs, W.; Ruiz, P.; Sgobbi, A.; Radu, D.; Bolat, P.; Thiel, C.; Peteves, S. The JRC-EU-TIMES Model: Assessing the Long-Term Role of the SET Plan Energy Technologies; Publications Office of the European Union: Luxembourg, 2013. [Google Scholar]
- Ruiz, P.; Sgobbi, A.; Nijs, W.; Thiel, C.; Dalla Longa, F.; Kober, T.; Elbersen, B.; Hengeveld, G. The JRC-EU-TIMES Model: Bioenergy Potentials for EU and Neighbouring Countries; JRC Science for Policy Report; Publications Office of the European Union: Luxembourg, 2015. [Google Scholar]
- Dees, M.; Datta, P.; Höhl, M.; Fitzgerald, J.; Verkerk, H.; Zudin, S.; Lindner, M.; Forsell, N.; Leduc, S.; Elbersen, B.; et al. Atlas with Regional Cost Supply Biomass Potentials for EU-28, Western Balkan Countries, Moldova, Turkey and Ukraine: Project Report–D1.8; S2BIOM Grant Agreement n°608622; Euopean Commision: Brussels, Belgium, 2017. [Google Scholar]
- S2BIOM-Project. S2BIOM Cost Supply. Available online: https://s2biom.wenr.wur.nl/web/guest/data-downloads (accessed on 20 December 2019).
- State Office for Agriculture Hesse. Hay & Straw: Market Information & Prices; Price in Euro/ton without VAT in the Market Region Hesse [Provision of Time Series–Personal Request]; State Office for Agriculture Hesse: Kassel, Germany, 2020; Available online: https://llh.hessen.de/unternehmen/marktinformation-und-preise/futtermittel/futtermittel-heu-stroh/ (accessed on 10 January 2020).
- Erber, G.; Kühmaier, M. Research Trends in European Forest Fuel Supply Chains: A Review of the Last Ten Years (2007–2017)—Part One: Harvesting and Storage. Croat. J. For. Eng. 2017, 38, 269–278. [Google Scholar]
- Kühmaier, M.; Erber, G. Research Trends in European Forest Fuel Supply chains: A Review of the Last Ten Years (2007–2016)—Part Two: Comminution, Transport & Logistics. Croat. J. For. Eng. 2017, 39, 139–152. [Google Scholar]
- Visser, L.; Hoefnagels, R.; Junginger, M. Wood pellet supply chain costs—A review and cost optimization analysis. Renew. Sustain. Energy Rev. 2020, 118, 109506. [Google Scholar] [CrossRef]
- Chamber of Agriculture Schleswig-Holstein. Straw Prices: LKSH—Market; [Provision of Time Series—Personal Request]; Chamber of Agriculture Schleswig-Holstein: Rendsburg, Germany, 2020; Available online: https://www.lksh.de/landwirtschaft/markt/ (accessed on 17 January 2020).
- Moher, D.; Liberati, A.; Tetzlaff, J.; Altman, D.G. Preferred reporting items for systematic reviews and meta-analyses: The PRISMA statement. BMJ 2009, 339, b2535. [Google Scholar] [CrossRef] [Green Version]
- Projekt DEAL. About DEAL. Available online: https://www.projekt-deal.de/about-deal/ (accessed on 15 February 2022).
- Kaltschmitt, M.; Hartmann, H.; Hofbauer, H. Energie aus Biomasse: Grundlagen, Techniken und Verfahren, 3rd ed.; Springer: Berlin/Heidelberg, Germany, 2016; ISBN 978-3-662-47438-9. [Google Scholar]
- TNO. Phyllis2: Database for (Treated) Biomass, Algae, Feedstocks for Biogas Production and Biochar. Available online: https://phyllis.nl/ (accessed on 8 June 2020).
- Brosowski, A.; Thrän, D.; Mantau, U.; Mahro, B.; Erdmann, G.; Adler, P.; Stinner, W.; Reinhold, G.; Hering, T.; Blanke, C. A review of biomass potential and current utilization—Status quo for 93 biogenic wastes and residues in Germany. Biomass Bioenergy 2016, 95, 257–272. [Google Scholar] [CrossRef] [Green Version]
- EUROSTATS. HICP (2015 = 100)—Annual Data (Average Index and Rate of Change): Item: Annual Average Index—CP045 Electricity, Gas and Other Fuels. Available online: https://appsso.eurostat.ec.europa.eu/nui/show.do?dataset=prc_hicp_aind&lang=en (accessed on 30 October 2020).
- Cintas, O.; Berndes, G.; Englund, O.; Cutz, L.; Johnsson, F. Geospatial supply–demand modeling of biomass residues for co-firing in European coal power plants. GCB Bioenergy 2018, 10, 786–803. [Google Scholar] [CrossRef]
- Dyjakon, A.; García-Galindo, D. Implementing agricultural pruning to energy in Europe: Technical, economic and implementation potentials. Energies 2019, 12, 1513. [Google Scholar] [CrossRef] [Green Version]
- Achinas, S.; Euverink, G.J.W. Consolidated briefing of biochemical ethanol production from lignocellulosic biomass. Electron. J. Biotechnol. 2016, 23, 44–53. [Google Scholar] [CrossRef] [Green Version]
- Verkerk, P.J.; Fitzgerald, J.B.; Datta, P.; Dees, M.; Hengeveld, G.M.; Lindner, M.; Zudin, S. Spatial distribution of the potential forest biomass availability in europe. For. Ecosyst. 2019, 6, 5. [Google Scholar] [CrossRef]
- Bedoić, R.; Ćosić, B.; Duić, N. Technical potential and geographic distribution of agricultural residues, co-products and by-products in the European Union. Sci. Total Environ. 2019, 686, 568–579. [Google Scholar] [CrossRef] [PubMed]
- Hamelin, L.; Borzęcka, M.; Kozak, M.; Pudełko, R. A spatial approach to bioeconomy: Quantifying the residual biomass potential in the EU-27. Renew. Sustain. Energy Rev. 2019, 100, 127–142. [Google Scholar] [CrossRef]
- Monforti, F.; Bódis, K.; Scarlat, N.; Dallemand, J.-F. The possible contribution of agricultural crop residues to renewable energy targets in Europe: A spatially explicit study. Renew. Sustain. Energy Rev. 2013, 19, 666–677. [Google Scholar] [CrossRef]
- Scarlat, N.; Fahl, F.; Lugato, E.; Monforti-Ferrario, F.; Dallemand, J.F. Integrated and spatially explicit assessment of sustainable crop residues potential in Europe. Biomass Bioenergy 2019, 122, 257–269. [Google Scholar] [CrossRef]
- Bentsen, N.S.; Felby, C.; Thorsen, B.J. Agricultural residue production and potentials for energy and materials services. Prog. Energy Combust. Sci. 2014, 40, 59–73. [Google Scholar] [CrossRef]
- Ahlström, J.M.; Alamia, A.; Larsson, A.; Breitholtz, C.; Harvey, S.; Thunman, H. Bark as feedstock for dual fluidized bed gasifiers—Operability, efficiency, and economics. Int. J. Energy Res. 2019, 43, 1171–1190. [Google Scholar] [CrossRef]
- Alloul, A.; Ganigué, R.; Spiller, M.; Meerburg, F.; Cagnetta, C.; Rabaey, K.; Vlaeminck, S.E. Capture-Ferment-Upgrade: A Three-Step Approach for the Valorization of Sewage Organics as Commodities. Environ. Sci. Technol. 2018, 52, 6729–6742. [Google Scholar] [CrossRef]
- Bühler, F.; Nguyen, T.-V.; Elmegaard, B. Sustainable production of asphalt using biomass as primary process fuel. Chem. Eng. Trans. 2016, 52, 685–690. [Google Scholar] [CrossRef]
- Coelho, B.; Schwarzbözl, P.; Oliveira, A.; Mendes, A. Biomass and central receiver system (CRS) hybridization: Volumetric air CRS and integration of a biomass waste direct burning boiler on steam cycle. Sol. Energy 2012, 86, 2912–2922. [Google Scholar] [CrossRef]
- D’Alpaos, C. Methodological approaches to the valuation of investments in biogas production plants: Incentives vs. Market prices in Italy. Valori E Valutazioni 2017, 19, 53–64. [Google Scholar]
- Dach, J.; Boniecki, P.; Przybył, J.; Janczak, D.; Lewicki, A.; Czekała, W.; Witaszek, K.; Rodríguez Carmona, P.C.; Cieślik, M. Energetic efficiency analysis of the agricultural biogas plant in 250 kWe experimental installation. Energy 2014, 69, 34–38. [Google Scholar] [CrossRef]
- Dimitriou, I.; Rosenqvist, H. Sewage sludge and wastewater fertilisation of Short Rotation Coppice (SRC) for increased bioenergy production-Biological and economic potential. Biomass Bioenergy 2011, 35, 835–842. [Google Scholar] [CrossRef]
- Dyjakon, A. Harvesting and baling of pruned biomass in apple orchards for energy production. Energies 2018, 11, 1680. [Google Scholar] [CrossRef] [Green Version]
- García-Galindo, D.; López, E.; Gómez, M.; Sebastián, F.; Gebresenbet, G.; Jirjis, R.; Kern, J.; Germer, S.; Pari, L.; Suardi, A.; et al. Europruning project: Summary of final results. Eur. Biomass Conf. Exhib. Proc. 2016, 2016, 89–102. [Google Scholar]
- Güsewell, J.; Härdtlein, M.; Eltrop, L. A plant-specific model approach to assess effects of repowering measures on existing biogas plants: The case of Baden-Wuerttemberg. GCB Bioenergy 2019, 11, 85–106. [Google Scholar] [CrossRef] [Green Version]
- Kalinichenko, A.; Havrysh, V. Feasibility study of biogas project development: Technology maturity, feedstock, and utilization pathway. Arch. Environ. Prot. 2019, 45, 68–83. [Google Scholar] [CrossRef]
- Leponiemi, A. Fibres and Energy from Wheat Straw by Simple Practice: VTT Publications 767. Ph.D. Thesis, Aalto University, Espoo, Finland, 2012. [Google Scholar]
- Littlewood, J.; Murphy, R.J.; Wang, L. Importance of policy support and feedstock prices on economic feasibility of bioethanol production from wheat straw in the UK. Renew. Sustain. Energy Rev. 2013, 17, 291–300. [Google Scholar] [CrossRef]
- Nati, C.; Montorselli, N.B.; Olmi, R. Wood biomass recovery from chestnut orchards: Results from a case study. Agrofor. Syst. 2018, 92, 1129–1143. [Google Scholar] [CrossRef]
- Petig, E.; Rudi, A.; Angenendt, E.; Schultmann, F.; Bahrs, E. Linking a farm model and a location optimization model for evaluating energetic and material straw valorization pathways—A case study in Baden-Wuerttemberg. GCB Bioenergy 2019, 11, 304–325. [Google Scholar] [CrossRef]
- Spinelli, R.; Pari, L.; Magagnotti, N. New biomass products, small-scale plants and vertical integration as opportunities for rural development. Biomass Bioenergy 2018, 115, 244–252. [Google Scholar] [CrossRef]
- Stürmer, B. Feedstock change at biogas plants—Impact on production costs. Biomass Bioenergy 2017, 98, 228–235. [Google Scholar] [CrossRef]
- Zbytek, Z.; Dach, J.; Pawłowski, T.; Smurzyńska, A.; Czekała, W.; Janczak, D. Energy and economic potential of maize straw used for biofuels production. In Proceedings of the MATEC Web Conferences, Amsterdam, The Netherlands, 23–25 March 2016; Volume 60. [Google Scholar] [CrossRef] [Green Version]
- Boldrin, A.; Baral, K.R.; Fitamo, T.; Vazifehkhoran, A.H.; Jensen, I.G.; Kjærgaard, I.; Lyng, K.-A.; van Nguyen, Q.; Nielsen, L.S.; Triolo, J.M. Optimised biogas production from the co-digestion of sugar beet with pig slurry: Integrating energy, GHG and economic accounting. Energy 2016, 112, 606–617. [Google Scholar] [CrossRef] [Green Version]
- Cieślik, M.; Dach, J.; Lewicki, A.; Smurzyńska, A.; Janczak, D.; Pawlicka-Kaczorowska, J.; Boniecki, P.; Cyplik, P.; Czekała, W.; Jóźwiakowski, K. Methane fermentation of the maize straw silage under meso- and thermophilic conditions. Energy 2016, 115, 1495–1502. [Google Scholar] [CrossRef]
- Fogarasi, S.; Cormos, C.-C. Technico-economic assessment of coal and sawdust co-firing power generation with CO2 capture. J. Clean. Prod. 2015, 103, 140–148. [Google Scholar] [CrossRef]
- Lindorfer, J.; Schwarz, M.M. Site-specific economic and ecological analysis of enhanced production, upgrade and feed-in of biomethane from organic wastes. Water Sci. Technol. 2013, 67, 682–688. [Google Scholar] [CrossRef]
- Monteiro, E.; Mantha, V.; Rouboa, A. Portuguese pellets market: Analysis of the production and utilization constrains. Energy Policy 2012, 42, 129–135. [Google Scholar] [CrossRef]
- Paredes-Sánchez, J.P.; García-Elcoro, V.E.; Rosillo-Calle, F.; Xiberta-Bernat, J. Assessment of forest bioenergy potential in a coal-producing area in Asturias (Spain) and recommendations for setting up a Biomass Logistic Centre (BLC). Appl. Energy 2016, 171, 133–141. [Google Scholar] [CrossRef]
- Paredes-Sánchez, J.P.; López-Ochoa, L.M.; López-González, L.M.; Las-Heras-Casas, J.; Xiberta-Bernat, J. Energy utilization for distributed thermal production in rural areas: A case study of a self-sustaining system in Spain. Energy Convers. Manag. 2018, 174, 1014–1023. [Google Scholar] [CrossRef]
- Poeschl, M.; Ward, S.; Owende, P. Prospects for expanded utilization of biogas in Germany. Renew. Sustain. Energy Rev. 2010, 14, 1782–1797. [Google Scholar] [CrossRef]
- Sliz-Szkliniarz, B.; Vogt, J. A GIS-based approach for evaluating the potential of biogas production from livestock manure and crops at a regional scale: A case study for the Kujawsko-Pomorskie Voivodeship. Renew. Sustain. Energy Rev. 2012, 16, 752–763. [Google Scholar] [CrossRef]
- Tsupari, E.; Arponen, T.; Hankalin, V.; Kärki, J.; Kouri, S. Feasibility comparison of bioenergy and CO2 capture and storage in a large combined heat, power and cooling system. Energy 2017, 139, 1040–1051. [Google Scholar] [CrossRef]
- Paredes-Sánchez, J.P.; Conde, M.; Gómez, M.A.; Alves, D. Modelling hybrid thermal systems for district heating: A pilot project in wood transformation industry. J. Clean. Prod. 2018, 194, 726–734. [Google Scholar] [CrossRef]
- Brown, A.E.; Ford, J.S.; Bale, C.S.E.; Camargo-Valero, M.A.; Cheffins, N.J.; Mason, P.E.; Price-Allison, A.M.; Ross, A.B.; Taylor, P.G. An assessment of road-verge grass as a feedstock for farm-fed anaerobic digestion plants. Biomass Bioenergy 2020, 138, 105570. [Google Scholar] [CrossRef]
- Esteban, L.S.; Carrasco, J.E. Biomass resources and costs: Assessment in different EU countries. Biomass Bioenergy 2011, 35, S21–S30. [Google Scholar] [CrossRef]
- Gómez, A.; Rodrigues, M.; Montañés, C.; Dopazo, C.; Fueyo, N. The potential for electricity generation from crop and forestry residues in Spain. Biomass Bioenergy 2010, 34, 703–719. [Google Scholar] [CrossRef]
- López-Rodríguez, F.; Sanz-Calcedo, J.G.; Moral-García, F.J. Spatial analysis of residual biomass and location of future storage centers in the southwest of Europe. Energies 2019, 12, 1978. [Google Scholar] [CrossRef] [Green Version]
- Marks-Bielska, R.; Bielski, S.; Novikova, A.; Romaneckas, K. Straw stocks as a source of renewable energy. A case study of a district in Poland. Sustainability 2019, 11, 4714. [Google Scholar] [CrossRef] [Green Version]
- de Wit, M.; Faaij, A. European biomass resource potential and costs. Biomass Bioenergy 2010, 34, 188–202. [Google Scholar] [CrossRef]
- Bai, A.; Durkó, E.; Tar, K.; Tóth, J.B.; Lázár, I.; Kapocska, L.; Kircsi, A.; Bartók, B.; Vass, R.; Pénzes, J.; et al. Social and economic possibilities for the energy utilization of fitomass in the valley of the river Hernád. Renew. Energy 2016, 85, 777–789. [Google Scholar] [CrossRef]
- Alakangas, E.; Junginger, M.; van Dam, J.; Hinge, J.; Keränen, J.; Olsson, O.; Porsö, C.; Martikainen, A.; Rathbauer, J.; Sulzbacher, L.; et al. EUBIONET III—Solutions to biomass trade and market barriers. Renew. Sustain. Energy Rev. 2012, 16, 4277–4290. [Google Scholar] [CrossRef]
- Bertanza, G.; Canato, M.; Heimersson, S.; Laera, G.; Salvetti, R.; Slavik, E.; Svanström, M. Techno-economic and environmental assessment of sewage sludge wet oxidation. Environ. Sci. Pollut. Res. Int. 2015, 22, 7327–7338. [Google Scholar] [CrossRef] [PubMed] [Green Version]
- Giuntoli, J.; Boulamanti, A.K.; Corrado, S.; Motegh, M.; Agostini, A.; Baxter, D. Environmental impacts of future bioenergy pathways: The case of electricity from wheat straw bales and pellets. GCB Bioenergy 2013, 5, 497–512. [Google Scholar] [CrossRef] [Green Version]
- Parajuli, R.; Knudsen, M.T.; Dalgaard, T. Multi-criteria assessment of yellow, green, and woody biomasses: Pre-screening of potential biomasses as feedstocks for biorefineries. Biofuels Bioprod. Biorefining 2015, 9, 545–566. [Google Scholar] [CrossRef]
- Vega, G.C.; Voogt, J.; Sohn, J.; Birkved, M.; Olsen, S.I. Assessing new biotechnologies by combining TEA and TM-LCA for an efficient use of biomass resources. Sustainability 2020, 12, 3676. [Google Scholar] [CrossRef]
- Wang, L.; Littlewood, J.; Murphy, R.J. Environmental sustainability of bioethanol production from wheat straw in the UK. Renew. Sustain. Energy Rev. 2013, 28, 715–725. [Google Scholar] [CrossRef] [Green Version]
- Aalto, M.; Korpinen, O.-J.; Ranta, T. Biomass demand point location analyzer at regional level agent-based simulation. In Proceedings of the 26th European Biomass Conference and Exhibition, Stockholm, Sweden, 12–15 June 2017. [Google Scholar]
- Böttcher, H.; Freibauer, A.; Scholz, Y.; Gitz, V.; Ciais, P.; Mund, M.; Wutzler, T.; Schulze, E.-D. Setting priorities for land management to mitigate climate change. Carbon Balance Manag. 2012, 7, 5. [Google Scholar] [CrossRef]
- Marques, A.; Rasinmäki, J.; Soares, R.; Amorim, P. Planning woody biomass supply in hot systems under variable chips energy content. Biomass Bioenergy 2018, 108, 265–277. [Google Scholar] [CrossRef]
- Topić, D.; Barukčić, M.; Mandžukić, D.; Mezei, C. Optimization model for biogas power plant feedstock mixture considering feedstock and transportation costs using a differential evolution algorithm. Energies 2020, 13, 1610. [Google Scholar] [CrossRef] [Green Version]
- Townsend, T.J.; Sparkes, D.L.; Wilson, P. Food and bioenergy: Reviewing the potential of dual-purpose wheat crops. GCB Bioenergy 2017, 9, 525–540. [Google Scholar] [CrossRef]
- Wetterlund, E.; Leduc, S.; Dotzauer, E.; Kindermann, G. Optimal use of forest residues in Europe under different policies-second generation biofuels versus combined heat and power. Biomass Convers. Biorefinery 2013, 3, 3–16. [Google Scholar] [CrossRef]
- Yazan, D.M.; Fraccascia, L.; Mes, M.; Zijm, H. Cooperation in manure-based biogas production networks: An agent-based modeling approach. Appl. Energy 2018, 212, 820–833. [Google Scholar] [CrossRef]
- Bryngemark, E. Second generation biofuels and the competition for forest raw materials: A partial equilibrium analysis of Sweden. For. Policy Econ. 2019, 109, 102022. [Google Scholar] [CrossRef]
- Panoutsou, C. Supply of Solid Biofuels: Potential Feedstocks, Cost and Sustainability Issues in EU27. In Solid Biofuels for Energy: A Lower Greenhouse Gas Alternative; Grammelis, P., Ed.; Springer: London, UK, 2011; pp. 1–20. ISBN 978-1-84996-392-3. [Google Scholar]
- Sigurnjak, I.; Vaneeckhaute, C.; Michels, E.; Ryckaert, B.; Ghekiere, G.; Tack, F.M.G.; Meers, E. Fertilizer performance of liquid fraction of digestate as synthetic nitrogen substitute in silage maize cultivation for three consecutive years. Sci. Total Environ. 2017, 599, 1885–1894. [Google Scholar] [CrossRef]
- European Central Bank. Euro Foreign Exchange Reference Rate of the ECB/EUR 1 = GBP/United Kingdom: BBEX3.A.GBP.EUR.BB.AC.A04. Available online: https://www.bundesbank.de/dynamic/action/en/statistics/time-series-databases/time-series-databases/743796/743796?statisticType=BBK_ITS&treeAnchor=WECHSELKURSE (accessed on 28 October 2020).
- European Central Bank. Euro Foreign Exchange Reference Rate of the ECB/EUR 1 = USD/United States: BBEX3.A.USD.EUR.BB.AC.A04. Available online: https://www.bundesbank.de/dynamic/action/en/statistics/time-series-databases/time-series-databases/743796/743796?statisticType=BBK_ITS&treeAnchor=WECHSELKURSE (accessed on 28 October 2020).
- Graham, R.L.; English, B.C.; Noon, C.E. A Geographic Information System-based modeling system for evaluating the cost of delivered energy crop feedstock. Biomass Bioenergy 2000, 18, 309–329. [Google Scholar] [CrossRef]
- Loncaric, R.; Kanisek, J.; Loncaric, Z. Mineral or organic fertilization: Financial aspects. Eur. Sci. J. 2014, 9, 133. [Google Scholar] [CrossRef]
- Chambre D’agriculture Nord-Pas De Calais. Prix de la paille et Des Fourrages. Link with Prices of 2013 Isn’t Available Anymore. Available online: https://nord-pas-de-calais.chambre-agriculture.fr/paille-fourrage/ (accessed on 17 February 2021).
- Karjalainen, T. Estimation of Energy Wood Potential in Europe; Working papers of the Finnish Forest Research Institute; Finnish Forest Research Institute: Helsinki, Finland, 2004. [Google Scholar]
- Wageningen Economic Research. Agricultural Prices: Agro & Food Portal. Wageningen University & Research. Available online: https://agrimatie.nl/Prijzen.aspx?ID=15125 (accessed on 17 February 2021).
Figure 2.
Review protocol—schematic illustration of the approach used to identify relevant literature for the review.
Figure 2.
Review protocol—schematic illustration of the approach used to identify relevant literature for the review.

Figure 3.
Definition of the scope of delivery and “costs” vs. “price”; Authors’ own illustration.

Figure 4.
Most relevant biogenic residues, waste and by-products in Europe according to their technical potential. Based on the data of Elbersen et al., 2012 [8]; Ruiz et al., 2015 [10]; Dees et al., 2017 [11]; Dyjakon and Garcia-Galindo, 2019 [25]; Achinas and Euverink, 2016 [26]; Verkerk et al., 2019 [27]; Bedoic et al., 2019 [28]; Hamelin et al., 2019 [29]; Monforti et al., 2013 [30]; Scarlat et al., 2019 [31] and Bentsen et al., 2014 [32].

Figure 5.
Units and convertibility of different units into EUR/Mg (dm).

Figure 6.
Distribution of evaluation criteria Cost_Types (A), Cost_Scope (B) and Time_Period (C) across 41 reviewed studies.
Figure 6.
Distribution of evaluation criteria Cost_Types (A), Cost_Scope (B) and Time_Period (C) across 41 reviewed studies.

Figure 7.
Source age of cost or price information as calculated differences between reference year in the literature and reference year in cited source, as well as the accessibility of the cited source.
Figure 7.
Source age of cost or price information as calculated differences between reference year in the literature and reference year in cited source, as well as the accessibility of the cited source.

Table 1.
Literature included for cost and price assessment in relation to subject area.
| Subject Area | Techno-Economic Assessment | Biomass Potential Assessment | Life Cycle Assessment | Other |
|---|---|---|---|---|
| Proportion | 52.6% | 21.1% | 8.8% | 17.5% |
| Ref. No. | [7,33,34,35,36,37,38,39,40,41,42,43,44,45,46,47,48,49,50,51,52,53,54,55,56,57,58,59,60,61] | [8,10,12,24,62,63,64,65,66,67,68,69] | [70,71,72,73,74] | [75,76,77,78,79,80,81,82,83,84] |
Publisher’s Note: MDPI stays neutral with regard to jurisdictional claims in published maps and institutional affiliations. |
© 2022 by the authors. Licensee MDPI, Basel, Switzerland. This article is an open access article distributed under the terms and conditions of the Creative Commons Attribution (CC BY) license (https://creativecommons.org/licenses/by/4.0/).
Share and Cite
MDPI and ACS Style
Karras, T.; Brosowski, A.; Thrän, D. A Review on Supply Costs and Prices of Residual Biomass in Techno-Economic Models for Europe. Sustainability 2022, 14, 7473. https://doi.org/10.3390/su14127473
AMA Style
Karras T, Brosowski A, Thrän D. A Review on Supply Costs and Prices of Residual Biomass in Techno-Economic Models for Europe. Sustainability. 2022; 14(12):7473. https://doi.org/10.3390/su14127473
Chicago/Turabian StyleKarras, Tom, André Brosowski, and Daniela Thrän. 2022. "A Review on Supply Costs and Prices of Residual Biomass in Techno-Economic Models for Europe" Sustainability 14, no. 12: 7473. https://doi.org/10.3390/su14127473
Note that from the first issue of 2016, this journal uses article numbers instead of page numbers. See further details here.