
Combining Canopy Coverage and Plant Height from UAV-Based RGB Images to Estimate Spraying Volume on Potato


1
College of Mechanical and Electrical Engineering, Hunan Agricultural University, Changsha 410128, China
2
School of Agricultural Engineering and Food Science, Shandong University of Technology, Zibo 255049, China
3
Graduate School of Agricultural and Life Sciences, The University of Tokyo, Tokyo 113-0033, Japan
4
Hunan Agricultural Equipment Research Institute, Hunan Academy of Agricultural Sciences, Changsha 410125, China
*
Author to whom correspondence should be addressed.
Sustainability 2022, 14(11), 6473; https://doi.org/10.3390/su14116473
Submission received: 28 April 2022
/
Revised: 19 May 2022
/
Accepted: 23 May 2022
/
Published: 25 May 2022
(This article belongs to the Special Issue Big Data, Information and AI for Smart Urban)
Abstract
:Canopy coverage and plant height are the main crop canopy parameters, which can obviously reflect the growth status of crops on the field. The ability to identify canopy coverage and plant height quickly is critical for farmers or breeders to arrange their working schedule. In precision agriculture, choosing the opportunity and amount of farm inputs is the critical part, which will improve the yield and decrease the cost. The potato canopy coverage and plant height were quickly extracted, which could be used to estimate the spraying volume using the evaluation model obtained by indoor tests. The vegetation index approach was used to extract potato canopy coverage, and the color point cloud data method at different height rates was formed to estimate the plant height of potato at different growth stages. The original data were collected using a low-cost UAV, which was mounted on a high-resolution RGB camera. Then, the Structure from Motion (SFM) algorithm was used to extract the 3D point cloud from ordered images that could form a digital orthophoto model (DOM) and sparse point cloud. The results show that the vegetation index-based method could accurately estimate canopy coverage. Among EXG, EXR, RGBVI, GLI, and CIVE, EXG achieved the best adaptability in different test plots. Point cloud data could be used to estimate plant height, but when the potato coverage rate was low, potato canopy point cloud data underwent rarefaction; in the vigorous growth period, the estimated value was substantially connected with the measured value (R2 = 0.94). The relationship between the coverage area of spraying on potato canopy and canopy coverage was measured indoors to form the model. The results revealed that the model could estimate the dose accurately (R2 = 0.878). Therefore, combining agronomic factors with data extracted from the UAV RGB image had the ability to predict the field spraying volume.
1. Introduction
1.1. Background and Motivation
Potato (Solanum tuberosum) is a staple food [1] and a high-value crop that is one of the highest-producing crops among staple foods. To reach the demand for high-yielding crops, it requires an adequate amount of fertilizer to be grown and sufficient agrochemicals in controlling pests and diseases. Both under- or over-fertilization and pesticide use cause trouble with the economic benefits as fertilizers and pesticides can all be provided by way of spraying, and the arrangement of the spraying schedule is dependent on the situation of the potato plant. In precision agriculture, the farm inputs were decided by the crop data from the field condition, which included crop growth state, pests, and different diseases, but farmers often took precautions or routine measures for field management that would cause inefficient use or overuse of pesticides [2]. For these reasons, a reasonable dosage management and spraying schedule is needed to ensure control of inputs while obtaining a higher yield.
1.2. Related Work
Previous studies have proved that the estimation of spraying volume was determined by the canopy parameters, and the estimation method on the tree was Tree Row Volume (TRV), which was based on a standard crop spraying volume to estimate the united surface of the tree canopy volume [3]. Another method used in vineyards is called Unit Canopy Row (URV), which was somewhat simpler than TRV, and both of these methods were appropriate for the stable canopy size or shape [4]. Some other studies tried to spray different volumes on the plants and determined the spraying volume by the spray deposition effect, which becomes troublesome when the crop canopy changes. Therefore, efficient evaluation of canopy parameters of potato was particularly important for field management [5].
The development of the measurement method has generally been divided into four kinds, including visual estimation, sampling, calculation by instrument, and remote sensing [6,7]. The field measurement method, including visual estimation and sampling, was inefficient and the accuracy was greatly affected by detectors. Sensing technologies used for crop growth information and agricultural monitoring include sensing devices mounted on satellites, airplanes, or unmanned aerial vehicles (UAVs) and tractors [8]. Satellite-based remote sensing technology is capable of monitoring large areas at once and has made great developments in recent years, particularly with the introduction of low-orbit satellites equipped with high-resolution cameras. Despite this, it typically is lacking in the spatial resolution required for precise and thorough canopy information in small plots. Satellites are very easily influenced by cloud covering and data collection in specific periods [9]. Remote sensing based on unmanned aerial vehicle (UAV) technology has been widely applied in several industries, including agriculture [10,11], forestry [12], and resource exploration [13,14]. Because the flight height of UAVs is less than 3 km, this remote sensing is classified as low-altitude remote sensing technology, which is unaffected by climatic factors in image acquisition, and it also has the advantage of low expense, high resolution, and ease of operation, all of which are unmatched with traditional remote sensing technologies [15]. The grayscale or color photos obtained by UAV equipment employing digital cameras were utilized to assess crop height, leaf angle distribution, lodging, and leaf color, among other things [16,17,18]. RGB sensors allow for not only visual evaluation of the sampled area, but also assessment of plant development features such as leaf color, plant height, canopy coverage, and 3D canopy structure utilizing point cloud data. A Structure from Motion (SfM) approach has been used to examine plant growth and development using photographs obtained by UAV remote sensing. [19]. In the monitoring of crop growth process, UAV remote sensing technology has also played a role. Qiu et al. [20] demonstrated a link between multi-stage vegetation indices extracted from UAV data and rice growth stage indicators for accurate rice production management. Jin et al. [21] developed a method for plant density estimation in wheat crops based on UAV imagery. Li et al. [22] proposed a method for assessing potato crop development at the emergence stage by using UAV images. This brief review showed that UAV remote sensing had the potential for crop growth information and canopy parameter monitoring. Thus, it is critical to assess the feasibility of utilizing an RGB sensor to estimate crop canopy coverage, which may then be used to alter the spraying amount in cereal crops.
In order to estimate spraying volume through canopy parameters, the parameters must be rapidly and accurately obtained. Canopy parameters such as canopy coverage and plant height most obviously reflect crop growth, which was traditionally measured by hand. Canopy coverage [23,24] is an important characteristic that could qualitatively reflect the growing trend of potato plant populations; therefore, studying the canopy coverage of potatoes was of great significance in increasing yield and improving field management [25]. Canopy coverage refers to the ratio of the vertical projection of plant canopy in the observation area and total soil area. Canopy coverage is an indicator of agronomy and ecology [26], and the traditional measurements have been time-consuming in the past. To obtain the canopy coverage in the images, non-canopy pixels should be removed to reduce the impact on estimation accuracy. The vegetation index method could easily enhance the plant canopy and distinguish crops from the background or other interferences. Many studies have indicated that the vegetation index method based on RGB images extracting canopy coverage obtained similar results with a vegetation index calculated from multispectral cameras [27]. Plant height is a critical agronomic and phenotypic trait of crops, and it has a close relationship with canopy coverage [28]. Traditional rulers have been used to measure plant height, although this approach is impractical and vulnerable to human error. Plant height might be measured using color point cloud data produced by the SfM algorithm, depending on the advancement of photogrammetric techniques, computer vision methods, and 3D point cloud. The point cloud data at different heights from the ground were utilized to estimate the plant height, which could achieve a higher accuracy [29].
1.3. Contribution
Because of the close links between canopy coverage, plant height, and plant development and agronomic processes [30,31], canopy coverage and plant height are essential agronomy variables in field management. Canopy coverage has been employed as a biophysical indicator of a crop’s potential to intercept radiation [32], as well as to estimate the quantity of spray solution collected by plants [33]. Farmers frequently adjust the spraying volume based on the stage of growth of the potato plant, supposing that the canopy coverage has risen over the season. The hypothesis in this study was that the canopy coverage and plant height can be used to evaluate the spraying volume for potato plants. The innovation of this study lies in: (1) obtaining the canopy coverage and plant height by using UAV-based RGB images; (2) evaluating the relationship between canopy coverage and the spraying volume for potato plants; and (3) developing an equation that uses canopy coverage and plant height to calculate an ideal spraying volume that will obtain the best deposition in each layer of the potato crop.
2. Data and Methods
2.1. Data and Test Site
The field tests were conducted from 12 to 21 April 2022 in Changsha County, the experimental base of the Hunan Academy of Agricultural Science (Figure 1), and Changsha, Hunan Province of South China. The experiment base is in a humid subtropical monsoon climate area with a mean annual temperature of 17.5 °C and mean annual precipitation of 1368 mm. The rainy season is between March and June, and the weather needs to be checked when the test is carried out because the field photos need to be obtained on a sunny day.
2.2. Acquisition and Pretreatment of Imagery
An RGB camera was mounted on a UAV platform (a four-rotor unmanned aerial vehicle Mavic air, produced by DJI (https://www.dji.com/cn, accessed on 24 October 2019), which is portable and has steady flying characteristics that are suitable for field testing). Specifications for UAV and the camera are shown in Table 1. From 12 to 21 April 2022, all UAV operations were conducted in test plots under steady ambient light conditions (between 10:00–12:00). The UAV was flown at a height of 30 m, and the flying mission was programmed using an app called Pix4Dcapture (Pix4Inc., Prilly, Switzerland, https://www.pix4d.com, accessed on 24 October 2019). Because of the size of the test plot, the double grid model (Figure 2) of the plan mission was selected, which could fly closer to objects to capture more vertical details. After preprocessing, stitching, and ortho correction by Pix4Dmapper (Pix4Inc., Prilly, Switzerland, https://www.pix4d.com, accessed on 24 October 2019), the potato field orthophotos and point cloud data of the test plots were obtained.
2.3. Canopy Coverage and Plant Height Extraction
Before the process of segmentation of canopy coverage and background, the vegetation index was calculated to highlight the canopy pixels in an image. The maximum between-class variance method (Otsu) [34] was used, which could automatically calculate and select the threshold to realize image binarization. Then, the noise of the binary image was reduced, and the number of potato pixels was obtained in the research area. According to the spectral characteristics of the vegetation, the R, G, and B channels of the visible light image were calculated to make the vegetation more prominent in the image, and threshold segmentation would achieve better separation of vegetation coverage. The commonly used vegetation index [35] was selected, and the calculation formulas are shown below:
R, G, and B are the brightness levels of the image’s red, green, and blue channels.
After the process of the vegetation index method and segmentation, the canopy coverage could be calculated by the ratio of plant pixels and total pixels.
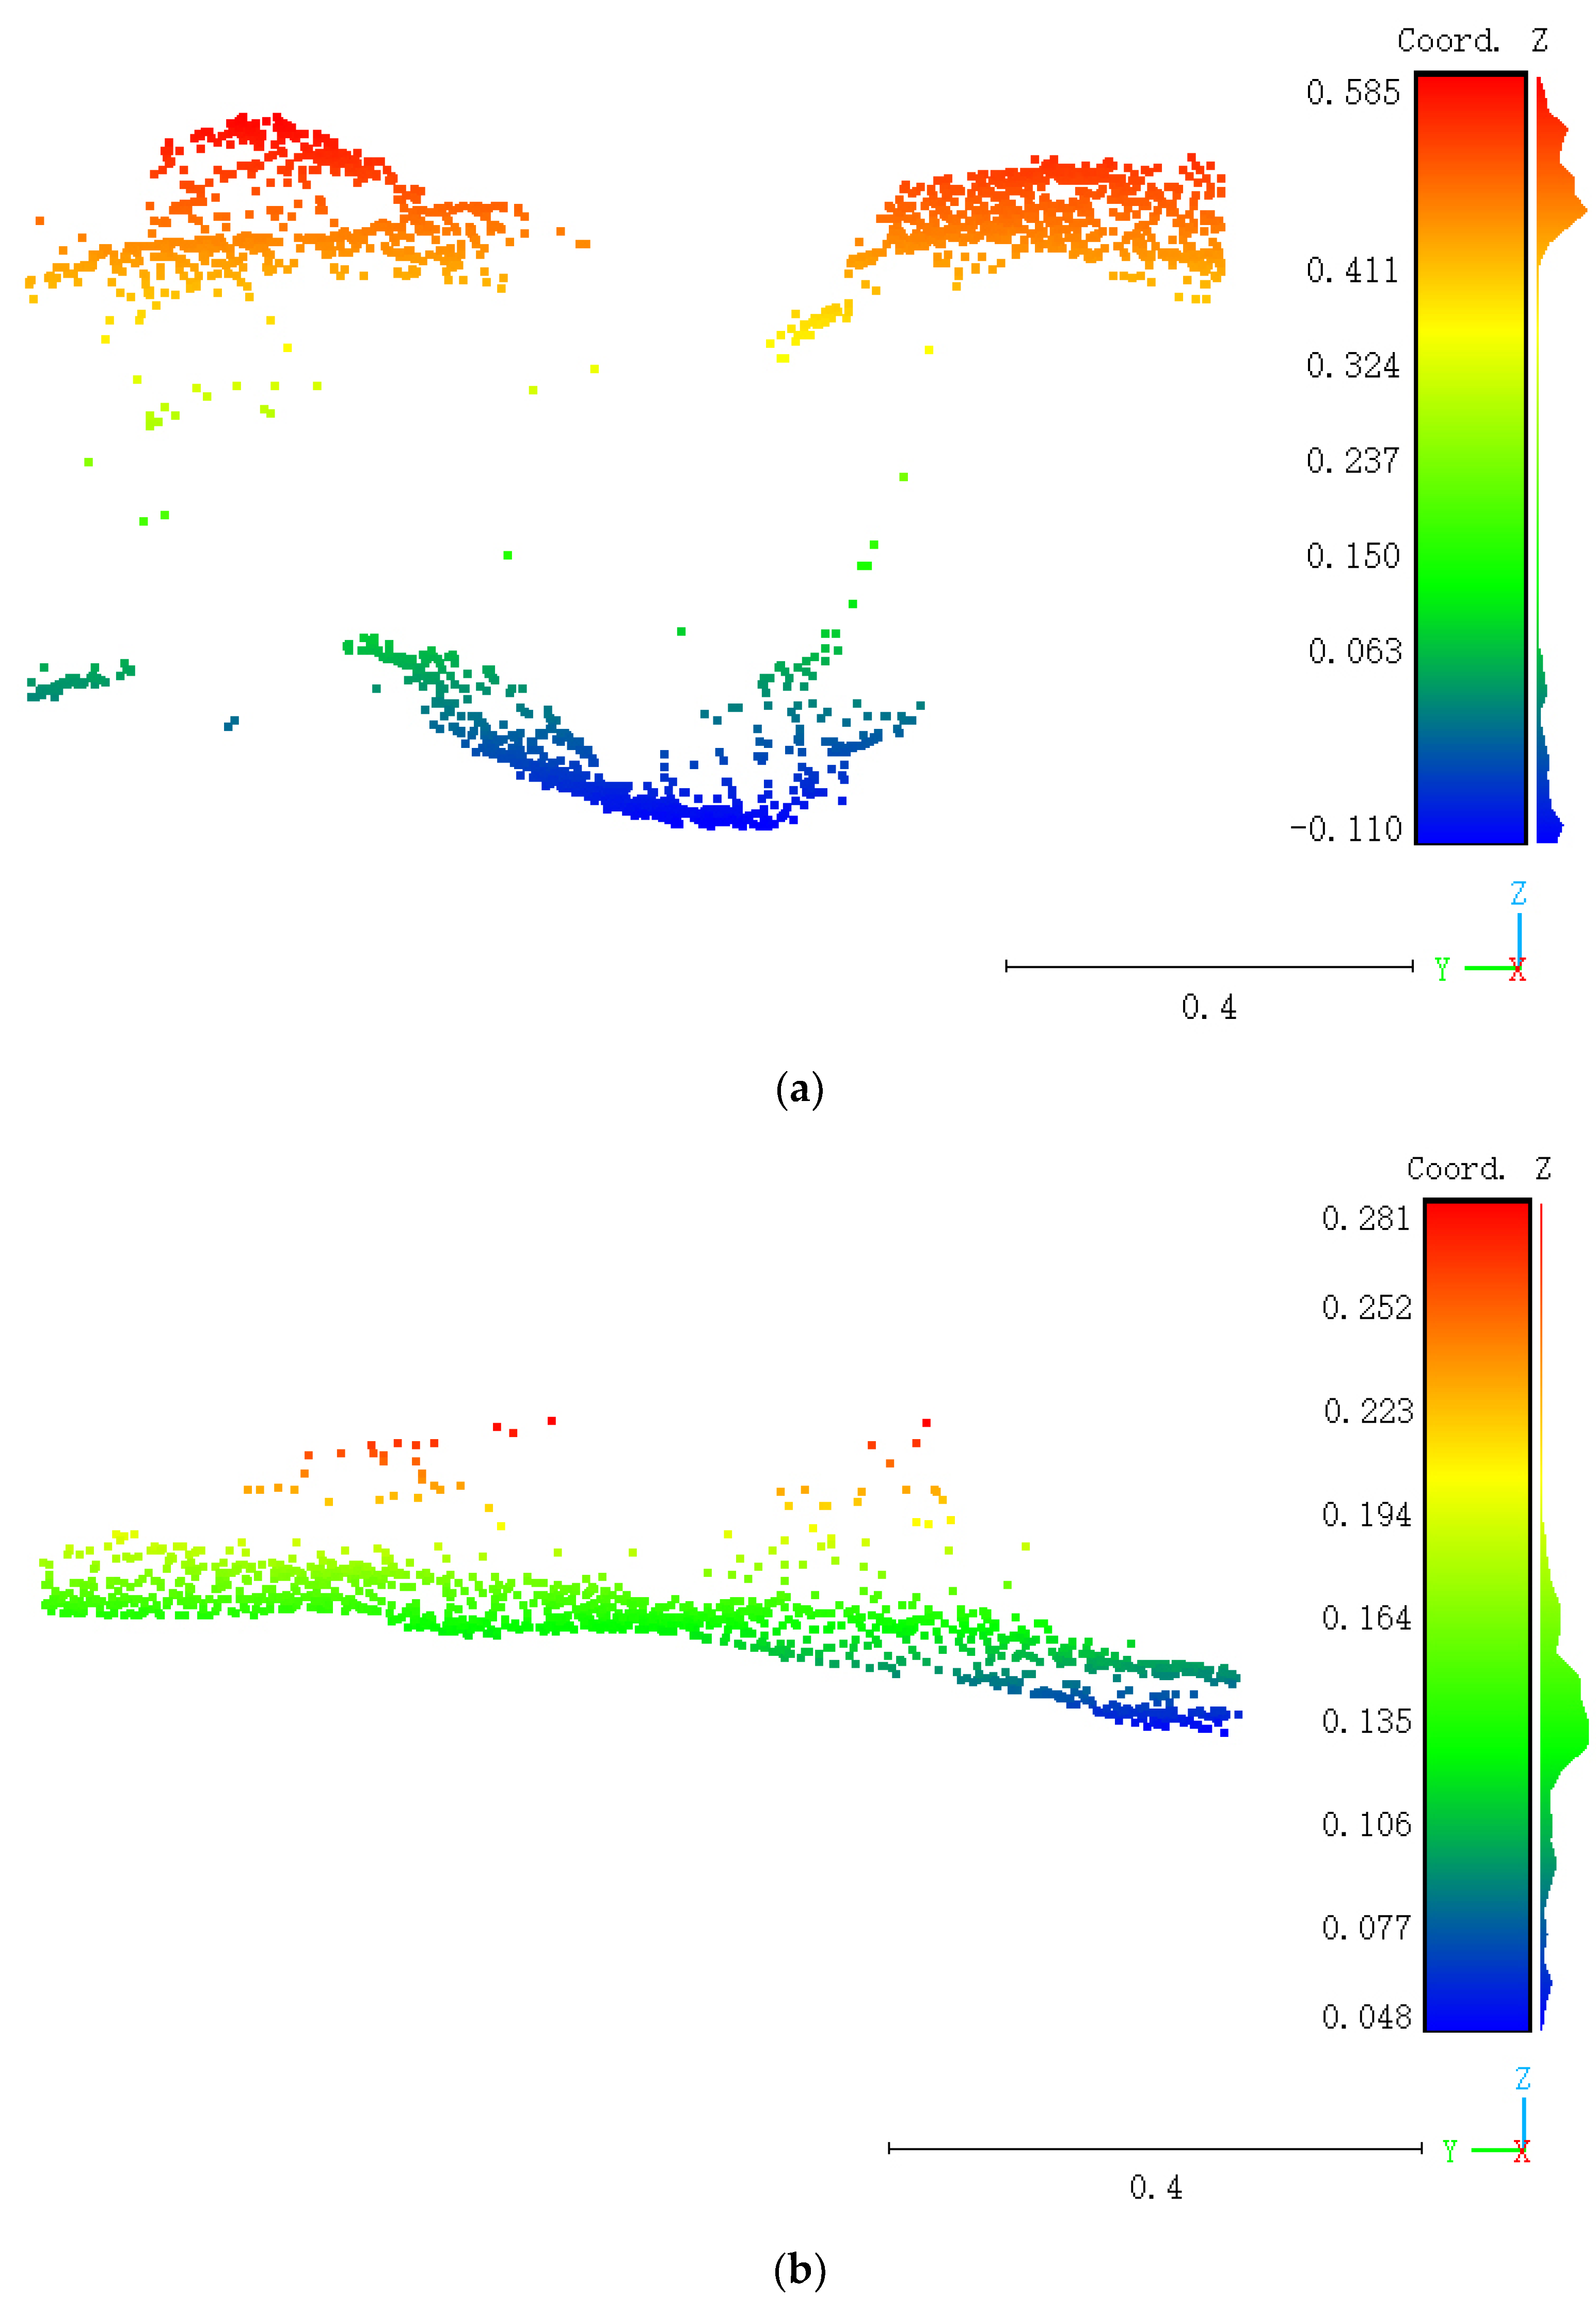
The potato plant height was determined using the point cloud method, and point cloud data were retrieved by Pix4Dmapper (Pix4Inc., Prilly, Switzerland, https://www.pix4d.com, accessed on 24 October 2019); Cowell F. et al. (2021) [8] provided a full processing sequence. Figure 3 shows the point cloud data from different regions of the test plots that reflect different heights of the potato canopy. For comparison, terrestrial data were acquired on the same day as UAV data. In randomly selected plots, plant height was measured proximally with a ruler. The highest contract point of the plant was recorded for each of the ten plants in the test plot. The results were compared to the plant height calculated using UAV data.
2.4. Evaluation of the Spraying Application Volume
The five spraying application volumes (0.48 mL, 0.96 mL, 1.44 mL, 1.92 mL, and 2.4 mL) were sprayed on the potato canopy using a vertical spraying boom sprayer. Spraying was performed using Teejet TVK-4, and the sprayer was adjusted to the different volumes by changing the opening time of the electromagnetic valve, which was controlled by a PLC. The test was launched in an indoor environment to avoid the influence of environmental factors.
An artificial sample approach was used to assess the droplet deposition on the leaves of potato plants. The sampling paper was Mylar card, which is the most sensitive collector to represent the droplet density [36]. The collection cards were 3 cm wide and 5 cm long, and they were stuck on the leaves of potatoes before the test began. Using a flatbed scanner C100 (WinMageInc, Beijing, China), individual collectors were scanned into the computer. The images were analyzed by ImageJ software (ImageJ 1.52a, Wayne Rasband, NIH, Bethesda, MD, USA). The background region of the sprayed collector picture was eliminated, and the image was converted to binary mode, which renders the image black and white and allows coverage to be assessed [37]. To determine the total number of droplets on the collector, the droplet number density was estimated using ImageJ’s particle analysis algorithm [38]. This figure was multiplied by 15 (the area in cm2 of each collector) to find the droplets’ cm−2.
2.5. Evaluation Method
Regression analysis is a statistical tool for examining the statistical connection between a dependent variable and one or more independent variables. Its major role is to apply an acceptable approach to produce parameters with statistical properties, such as the intercept and slope in a linear regression. Using data from the 2021 indoor test, linear aggression models were utilized to assess the link between canopy coverage and spraying volume. The canopy coverage data from the test plot field were used to estimate the spraying volume in field conditions. The coefficient of determination (R2) was used to quantify the performance of spraying volume model functions. The significance of the difference in potato canopy coverage and plant height among the tests was analyzed by Pearson correlation coefficient. The value of the correlation coefficient is usually between around −1 and 1, and when the absolute value is between 0.8 and 1, that proved a significant correlation of the data.
3. Results
3.1. Relationship between Different Types of Vegetation Index Methods in Estimated Canopy Coverage
By obtaining the potato image information of different experimental plots, the vegetation index method was used to extract the canopy coverage of potato. The extraction results show that EXG was suitable for different plots and densities and had a good extraction effect. Compared with other vegetation indexes, the extraction effect of EXR was similar to that of EXG, and the R2 was up to 0.99 (shown in Figure 4). However, when threshold segmentation was carried out, different channel information in RGB stack mode could obtain different coverage extraction effects, while in Lab mode, the extraction effect of different vegetation indexes varies greatly, which indicated that selecting appropriate color space was beneficial to improving the image segmentation effect.
3.2. Relationship between the Measured and Estimated Plant Height
The plant height measured from the field was compared with the point cloud data based on UAV imaging. To estimate the plant height, the maximum height of the point cloud based on RGB images was employed, and all of the point cloud data are given in Figure 5.
Figure 6 depicts the link between measured and estimated plant height. When test plot 1 was shot, it was already in a closed state, and the field coverage had reached the maximum amount that could obtain sufficient plant height point cloud data. The estimated plant height at the highest point, 90% and 85%, had a high correlation with the measured value. The minimum R2 was 0.812 and the maximum was 0.8912, indicating that the dense point cloud plant height estimation for shrub crops was accurate. In test plot 2, the potato plant height is low, and there is no closure on each row of potatoes. At that time, the obtained plant height point cloud data were lower, and the correlation between the estimated plant height and the measured value at the highest point, 90% and 85%, is low. The minimum R2 is 0.4729, and the maximum is 0.7229 at 85%. This shows that more plant height point cloud data can be obtained at 85% below the top of the canopy under the condition of unenclosed plants. At this time, the point cloud data at 85% can be used for plant height estimation, which is also in line with the situation of the top of the crop at this time. In test plot 3, the potato is in the middle stage of growth, the canopy coverage is about 70%, and the sealing has not been completed. At the highest position of the point cloud, the estimated value of plant height has the best correlation with the predicted value, R2 is 0.9445, and R2 is 0.8962 at 85%, indicating that the crop top cover is relatively dense during this growing period, and a relatively sufficient canopy top point cloud can be collected. The data provided the possibility for plant height estimation. Therefore, color point cloud data from the UAV RGB camera can be utilized to determine the potato plant height at different growth stages. When the canopy coverage is less than 20%, the quality of the point cloud data must be improved to produce better estimation results. There was a strong correlation between measured plant height and estimated plant height using the color point cloud approach, according to the linear regression model. In plot 1, plot 2, and plot 3, the R2 of the measured and estimated values were 0.89, 0.72 and 0.94, respectively.
3.3. Relationship between Canopy Coverage and Spraying Volume
The most significant droplet deposition coverage occurred when the highest spraying volume was used. The largest numbers of droplets were collected by artificial collectors at the top of the canopy when canopy coverage area and spraying volume increased (Figure 7). The droplet deposition coverage at the top of the potato canopy was over half of the total deposition coverage, and it showed that crop canopy coverage would determine the spraying volume and droplet deposition inside the canopy.
From the relationship between the sampler coverage rate (the sampling area divided by canopy coverage area) and coverage area of droplets (Figure 8), it is indicated that the spraying volume and coverage area followed the exponential model, which was fitted to an exponential increase model of the form:
where q is spraying volume at the canopy coverage area, Q is the initial spraying volume, c is the coefficient, and St is the top of canopy coverage area.
4. Discussion
4.1. Estimation of Canopy Coverage and Plant Height
The RGB camera-based UAV remote sensing platform is convenient and cost-effective, and it has great application potential in estimating canopy coverage [39] and plant height [40]. It has been successfully applied to many crops, including maize, wheat, and rice. The vegetation index method is commonly used to extract crop canopy coverage from photographs, and different vegetation indexes have varying impacts on vegetation extraction. EXG, EXR and other regularly used vegetation indices have been utilized to extract the canopy coverage of cotton [41] and wheat [42] with improved extraction accuracy. To investigate changes in canopy coverage throughout growth stages, EXG, EXR, and RGBVI were used to extract potato canopy coverage, with EXG achieving higher extraction accuracy in all three experimental plots, demonstrating that EXG has strong adaptability. As a result, the extraction findings of vegetation indices such as CIVE and GLI deviate significantly from EXG.
The point cloud approach was employed in this work to assess potato plant height. The results indicated that the height of the highest point cloud, 90%, and 85% on the three test plots produced distinct results. The 90% height of the point cloud was the optimal height for plant height extraction when the canopy coverage was more than 90%. When the canopy coverage was 70~80%, the highest point cloud was the best height for plant height extraction; when canopy coverage was 20~40%, the optimal height for plant height extraction was 85% height of the point cloud. This result differs slightly from wheat and maize plant height point cloud estimate results. The difference in canopy structure between potato and wheat and maize might be the explanation. In the early stages of development, there are few stems and leaves at the top of the canopy, and the distribution of point clouds at the top is sparse. The top of the plant is ringed by stems and leaves when the structure is finished, providing a dense canopy cover. The dispersion of point clouds grows thicker at this point, making plant height estimation easier.
4.2. Estimation of Spraying Volume
The estimation of spraying amount is usually based on the amount per hectare, and the crop row [43] and canopy volume [4] are often used as estimation units. During the growing phase, however, crops such as potatoes, rice, and wheat exhibit significant changes in the canopy. Varied canopy shapes will be generated based on different agronomic requirements, affecting spray volume estimation and droplet deposition effects. This research investigates the relationship model between canopy droplet coverage and canopy area when the canopy area varies, and estimates are based on this dosage, using the coverage of droplets in the canopy of potato plants under varied spraying volumes. The results revealed that they are comparable to those obtained by Rojo [44]. Therefore, canopy coverage may be used to predict crop row and plot area application rates, and the droplets in the total canopy structure can also be connected to canopy coverage.
5. Conclusions
This study proved that potato canopy coverage could be quickly extracted from the images obtained by UAV, and the color point cloud data from images by SfM algorithm could be used to estimate plant height. Rapidly and accurately obtaining canopy parameters was successfully achieved to estimate the spraying volume on the potato plants. Specific findings include:
- (1)
- EXG was suitable for potato canopy coverage extraction, and compared with other vegetation indices, such as EXR, RGBVI, GLI, and CIVE, the EXR and RGBVI had similar results to EXG (R2 = 0.98). However, under different color spaces, the correlation decreased to 0.68 for RGBVI, which showed that color space was another influencing factor for extracting canopy coverage.
- (2)
- Plant height of potato was estimated by color point data from images based on UAV. The estimated height and measured height received different correlations when different point cloud height percentages were used. The max point cloud height achieved higher R2 (0.89 and 0.94) in plot 1 and plot 3 when the canopy coverage was more that 70%; the 90% point cloud height was slight worse (R2 = 0.84 and 0.89); the 85% point cloud height achieved a lower R2 in plot 1 and plot 3, but obtained higher R2 (0.72) in plot 2, which also needs to be improved.
- (3)
- The spraying volume was positively correlated with canopy parameters, such as canopy coverage and plant height. The droplet coverage rate and the canopy coverage follow exponential models, with the highest correlation (R2 = 0.87) at the spraying volume of 0.1 s and 0.5 s, which showed that the spraying volume can be estimated by canopy coverage.
With the development of precision agriculture, crop field management and agricultural inputs need to be quantified. It is especially important to achieve rapid and real-time collection of crop information. The key to enhancing precision agriculture is to obtain crop growth statistics, define the schedule of field management, and predict the quantity of herbicides and fertilizers.
Author Contributions
Conceptualization, J.X. and Z.Z.; methodology, M.L.; software, L.Z.; validation, J.X. and Z.Z.; formal analysis, H.Z.; investigation, Z.Z.; resources, J.X.; data curation, L.Z.; writing—original draft preparation, J.X.; writing—review and editing, H.Z.; visualization, L.Z.; supervision, M.L.; project administration, M.L.; funding acquisition, M.L. All authors have read and agreed to the published version of the manuscript.
Funding
This research was funded by the National Key R&D Program, grant number 2018YFD020080107, and the NKRD was funded by the Science & Technology Department of China; Hunan Agricultural Science and Technology Innovation Fund Project, grant number Xiangcainongzhi [2020] No. 13. The HNASTI was funded by Department of Agriculture and Rural Affairs of Hunan Province; Hunan Provincial Key R&D Program, grant number 2018GK2013, and the HNKRD was funded by the Science & Technology Department of Hunan Province; Hunan Provincial Science and Technology Department Platform Construction Project, grant number Hunan Section [2018] No. 111. The HNSTPC was funded by the Science & Technology Department of Hunan Province, Natural Science Foundation of Changsha, grant number kq2014174, and the NSFC was funded by the Science & Technology Department of Changsha.
Institutional Review Board Statement
Not applicable.
Informed Consent Statement
Not applicable.
Data Availability Statement
The raw/processed data required to reproduce these findings cannot be shared at this time as the data also forms part of an ongoing study.
Acknowledgments
The authors would like to thank Yuan Lin and Xinxi Hu for providing the information on the test plots, and Limin Yao, Jingjing Huang, and Jinqi Huang for providing the device and guidance on software.
Conflicts of Interest
The authors declare no conflict of interest.
References
- Birch, P.R.; Bryan, G.; Fenton, B.; Gilroy, E.M.; Hein, I.; Jones, J.T.; Prashar, A.; Taylor, M.A.; Torrance, L.; Toth, I.K. Crops that feed the world 8: Potato: Are the trends of increased global production sustainable? Food Secur. 2012, 4, 477–508. [Google Scholar] [CrossRef]
- Martinez-Guanter, J.; Agüera, P.; Agüera, J.; Pérez-Ruiz, M. Spray and economics assessment of a UAV-based ultra-low-volume application in olive and citrus orchards. Precis. Agric. 2020, 21, 226–243. [Google Scholar] [CrossRef]
- Byers, R.E.; Hickey, K.D.; Hill, C.H. Base gallonage per acre. Va. Fruit 1971, 60, 19–23. [Google Scholar]
- Furness, G.O.; Magarey, P.A.; Miller, P.M.; Drew, H.J. Fruit tree and vine sprayer calibration based on canopy size and length of row: Unit canopy row method. Crop Prot. 1998, 17, 639–644. [Google Scholar] [CrossRef]
- Yang, B.; Wang, M.; Sha, Z.; Wang, B.; Chen, J.; Yao, X.; Cheng, T.; Cao, W.; Zhu, Y. Evaluation of aboveground nitrogen content of winter wheat using digital imagery of unmanned aerial vehicles. Sensors 2019, 19, 4416. [Google Scholar] [CrossRef] [Green Version]
- Wang, X.; Wang, M.; Wang, S.; Wu, Y. Extraction of vegetation information from visible unmanned aerial vehicle images. Trans. CSAE 2015, 31, 152–159. [Google Scholar]
- Zhichao, W.; Changchun, L.; Haikuang, F.; Liting, Z.; Daoyong, W.; Guijun, Y. Potato Coverage Extraction Method Based on Digital Image. Trans. Chin. Soc. Agric. Machi. 2020, 51, 164–169. [Google Scholar]
- Colwell, F.D.J.; Souter, J.; Bryan, G.J.; Compton, L.J.; Boonham, N.; Prashar, A. Development and Validation of Methodology for Estimating Potato Canopy Structure for Field Crop Phenotyping and Improved Breeding. Front. Plant Sci. 2021, 12, 139. [Google Scholar]
- Matese, A.; Toscano, P.; Di Gennaro, S.F.; Genesio, L.; Vaccari, F.P.; Primicerio, J.; Belli, C.; Zaldei, A.; Bianconi, R.; Gioli, B. Intercomparison of UAV, Aircraft and Satellite Remote Sensing Platforms for Precision Viticulture. Remote Sens. 2015, 7, 2971–2990. [Google Scholar] [CrossRef] [Green Version]
- Müller, K.; Böttcher, U.; Meyer-Schatz, F.; Kage, H. Analysis of vegetation indices derived from hyperspectral reflection measurements for estimating crop canopy parameters of oilseed rape (Brassica napus L.). Biosyst. Eng. 2008, 101, 172–182. [Google Scholar] [CrossRef]
- Torres-Sánchez, J.; Pena, J.M.; de Castro, A.I.; López-Granados, F. Multi-temporal mapping of the vegetation fraction in early-season wheat fields using images from UAV. Comput. Electron. Agric. 2014, 103, 104–113. [Google Scholar] [CrossRef]
- Guimarães, N.; Pádua, L.; Marques, P.; Silva, N.; Peres, E.; Sousa, J.J. Forestry remote sensing from unmanned aerial vehicles: A review focusing on the data, processing and potentialities. Remote Sens. 2020, 12, 1046. [Google Scholar] [CrossRef] [Green Version]
- Zhang, X.; Zhang, F.; Qi, Y.; Deng, L.; Wang, X.; Yang, S. New research methods for vegetation information extraction based on visible light remote sensing images from an unmanned aerial vehicle (UAV). Int. J. Appl. Earth Obs. 2019, 78, 215–226. [Google Scholar] [CrossRef]
- Guo, Z.C.; Wang, T.; Liu, S.L.; Kang, W.P.; Chen, X.; Feng, K.; Zhang, X.Q.; Zhi, Y. Biomass and vegetation coverage survey in the Mu Us sandy land-based on unmanned aerial vehicle RGB images. Int. J. Appl. Earth Obs. 2021, 94, 102239. [Google Scholar] [CrossRef]
- Goodbody, T.R.H.; Coops, N.C.; White, J.C. Digital aerial photogrammetry for updating area-based forest inventories: A review of opportunities, challenges, and future directions. Curr. For. Rep. 2019, 5, 55–75. [Google Scholar] [CrossRef] [Green Version]
- Ballesteros, R.; Ortega, J.F.; Hernández, D.; Moreno, M.A. Applications of georeferenced high-resolution images obtained with unmanned aerial vehicles. Part I: Description of image acquisition and processing. Precis. Agric. 2014, 15, 579–592. [Google Scholar] [CrossRef]
- Bendig, J.; Bolten, A.; Bennertz, S.; Broscheit, J.; Eichfuss, S.; Bareth, G. Estimating biomass of barley using crop surface models (CSMs) derived from UAV-based RGB imaging. Remote Sens. 2014, 6, 10395–10412. [Google Scholar] [CrossRef] [Green Version]
- Chapman, S.C.; Merz, T.; Chan, A.; Jackway, P.; Hrabar, S.; Dreccer, M.F.; Holland, E.; Zheng, B.; Ling, T.J.; Jimenezberni, J.A. Pheno-copter: A low-altitude, autonomous remote-sensing robotic helicopter for high-throughput field-based phenotyping. Agronomy 2014, 4, 279–301. [Google Scholar] [CrossRef] [Green Version]
- Chang, A.; Jung, J.; Maeda, M.M.; Landivar, J. Crop height monitoring with digital imagery from Unmanned Aerial System (UAS). Comput. Electron. Agric. 2017, 141, 232–237. [Google Scholar] [CrossRef]
- Qiu, Z.; Xiang, H.; Ma, F.; Du, C. Qualifications of rice growth indicators optimized at different growth stages using unmanned aerial vehicle digital imagery. Remote Sens. 2020, 12, 3228. [Google Scholar] [CrossRef]
- Jin, X.; Liu, S.; Baret, F.; Hemerlé, M.; Comar, A. Estimates of plant density of wheat crops at emergence from very low altitude UAV imagery. Remote Sens. Environ. 2017, 198, 105–114. [Google Scholar] [CrossRef] [Green Version]
- Li, B.; Xu, X.; Han, J.; Zhang, L.; Bian, C.; Jin, L.; Liu, J. The estimation of crop emergence in potatoes by UAV RGB imagery. Plant Methods 2019, 15, 1–13. [Google Scholar] [CrossRef] [PubMed] [Green Version]
- Cai, L.; Zhao, Y.; Huang, Z.; Gao, Y.; Li, H.; Zhang, M. Rapid Measurement of Potato Canopy Coverage and Leaf Area Index Inversion. Appl. Eng. Agric. 2020, 36, 557–564. [Google Scholar] [CrossRef]
- Dammer, K.H.; Dworak, V.; Selbeck, J. On-the-go Phenotyping in Field Potatoes Using Camera Vision. Potato Res. 2016, 59, 113–127. [Google Scholar] [CrossRef]
- Bojacá, C.R.; García, S.J.; Schrevens, E. Analysis of potato canopy coverage as assessed through digital imagery by nonlinear mixed effects models. Potato Res. 2011, 54, 237–252. [Google Scholar] [CrossRef]
- Purevdorj, T.S.; Tateishi, R.; Ishiyama, T.; Honda, Y. Relationships between percent vegetation cover and vegetation indices. Int. J. Remote Sens. 1998, 19, 3519–3535. [Google Scholar] [CrossRef]
- Prey, L.; von Bloh, M.; Schmidhalter, U. Evaluating RGB imaging and multispectral active and hyperspectral passive sensing for assessing early plant vigor in winter wheat. Sensors 2018, 18, 2931. [Google Scholar] [CrossRef] [Green Version]
- Hassan, M.A.; Yang, M.; Fu, L.; Rasheed, A.; Zheng, B.; Xia, X.; Xiao, Y.; He, Z. Accuracy assessment of plant height using an unmanned aerial vehicle for quantitative genomic analysis in bread wheat. Plant Methods 2019, 15, 37. [Google Scholar] [CrossRef] [Green Version]
- Wang, X.; Zhang, R.; Song, W.; Han, L.; Liu, X.; Sun, X.; Luo, M.; Chen, K.; Zhang, Y.; Yang, H.; et al. Dynamic plant height QTL revealed in maize through remote sensing phenotyping using a high-throughput unmanned aerial vehicle (UAV). Sci. Rep. 2019, 9, 3458. [Google Scholar] [CrossRef] [Green Version]
- Hu, P.; Chapman, S.C.; Zheng, B. Coupling of machine learning methods to improve estimation of ground coverage from unmanned aerial vehicle (UAV) imagery for high-throughput phenotyping of crops. Funct. Plant Biol. 2021, 48, 766–779. [Google Scholar] [CrossRef]
- Wan, L.; Zhu, J.; Du, X.; Zhang, J.; Han, X.; Zhou, W.; Li, X.; Liu, J.; Liang, F.; He, Y.; et al. A model for phenotyping crop fractional vegetation cover using imagery from unmanned aerial vehicles. J. Exp. Bot. 2021, 72, 4691–4707. [Google Scholar] [CrossRef] [PubMed]
- Stewart, A.M.; Edmisten, K.L.; Wells, R.; Collins, G.D. Measuring canopy coverage with digital imaging. Commun. Soil Sci. Plan. 2007, 38, 895–902. [Google Scholar] [CrossRef]
- Becker, F.A.; Klein, A.W.; Winkler, R.; Jung, B.; Bleiholder, H.; Schmider, F. The degree of ground coverage by arable crops as a help in estimating the amount of spray solution intercepted by the plants. Nachr. Dtsch. Pflanzenschutzd. 1999, 51, 237–242. [Google Scholar]
- Netto, A.F.A.; Martins, R.N.; de Souza, G.S.A.; de Moura Araújo, G.; de Almeida, S.L.H.; Capelini, V.A. Segmentation of RGB images using different vegetation indices and thresholding methods. Nativa 2018, 6, 389–394. [Google Scholar] [CrossRef]
- De Swaef, T.; Maes, W.H.; Aper, J.; Baert, J.; Cougnon, M.; Reheul, D.; Steppe, K.; Roldán-Ruiz, I.; Lootens, P. Applying RGB-and Thermal-Based Vegetation Indices from UAVs for High-Throughput Field Phenotyping of Drought Tolerance in Forage Grasses. Remote Sens. 2021, 13, 147. [Google Scholar] [CrossRef]
- Ferguson, J.C.; Hewitt, A.J.; O’Donnell, C.C.; Kruger, G.R. Comparison of water-sensitive paper, Kromekote and Mylar collectors for droplet deposition with a visible fluorescent dye solution. J. Plant Prot. Res. 2020, 60, 98–105. [Google Scholar]
- Ferguson, J.C.; Chechetto, R.G.; Hewitt, A.J.; Chauhan, B.S.; Adkins, S.W.; Kruger, G.R.; O’Donnell, C.C. Assessing the deposition and canopy penetration of nozzles with different spray qualities in an oat (Avena sativa L.) canopy. Crop. Prot. 2016, 81, 14–19. [Google Scholar] [CrossRef] [Green Version]
- Arena, E.T.; Rueden, C.T.; Hiner, M.C.; Wang, S.; Yuan, M.; Eliceiri, K.W. Quantitating the cell: Turning images into numbers with ImageJ: Quantitating with ImageJ. Wiley Interdiscip. Rev. Dev. Biol. 2016, 6, e260. [Google Scholar] [CrossRef]
- Zhao, J.; Yang, H.; Yubin, L.; Liqun, L.; Peng, J.; Zhiming, L. Extraction Method of Summer Corn Vegetation Coverage Based on Visible Light Image of Unmanned Aerial Vehicle. Trans. Chin. Soc. Agric. Mach. 2019, 50, 232–240. [Google Scholar]
- Malambo, L.; Popescu, S.C.; Murray, S.C.; Putman, E.; Pugh, N.A.; Horne, D.W.; Richardson, G.; Sheridan, R.; Rooney, W.L.; Avant, R.; et al. Multitemporal field-based plant height estimation using 3D point clouds generated from small unmanned aerial systems high-resolution imagery. Int. J. Appl. Earth Obs. 2018, 64, 31–42. [Google Scholar] [CrossRef]
- Ashapure, A.; Jung, J.; Chang, A.; Oh, S.; Maeda, M.; Landivar, J. A comparative study of RGB and multispectral sensor-based cotton canopy cover modelling using multi-temporal UAS data. Remote Sens. 2019, 11, 2757. [Google Scholar] [CrossRef] [Green Version]
- Schirrmann, M.; Giebel, A.; Gleiniger, F.; Pflanz, M.; Lentschke, J.; Dammer, K.-H. Monitoring agronomic parameters of winter wheat crops with low-cost UAV imagery. Remote Sens. 2016, 8, 706. [Google Scholar] [CrossRef] [Green Version]
- Richardson, B.; Newton, M. Spray deposition within plant canopies. N. Z. Plant Prot. 2000, 53, 248–252. [Google Scholar] [CrossRef] [Green Version]
- Baio, F.H.R.; Silva, E.E.; Vrech, M.A.; Souza, F.H.Q.; Zanin, A.R.; Teodoro, P.E. Vegetation Indices to Estimate Spray Application Rates of Crop Protection Products in Corn. Agron. J. 2018, 110, 1254–1259. [Google Scholar] [CrossRef]
Figure 1.
Overview of the testing sites.

Figure 2.
UAV image collection. (a,b) is the flight planning mission in Pix4Dcapture: (a) is the start of the mission, and (b) is the end of the mission.
Figure 2.
UAV image collection. (a,b) is the flight planning mission in Pix4Dcapture: (a) is the start of the mission, and (b) is the end of the mission.


Figure 3.
The point cloud data at different test plot at Z coordinate. (a) shows the point cloud of canopy height in test plot 1; (b) shows the point cloud of canopy height in test plot 2; (c) shows the point cloud of canopy height in test plot 3.
Figure 3.
The point cloud data at different test plot at Z coordinate. (a) shows the point cloud of canopy height in test plot 1; (b) shows the point cloud of canopy height in test plot 2; (c) shows the point cloud of canopy height in test plot 3.


Figure 4.
Relationship between different types of vegetation indices and test plots. (a) uses the Lab stack model; (b) uses the RGB stack model.
Figure 4.
Relationship between different types of vegetation indices and test plots. (a) uses the Lab stack model; (b) uses the RGB stack model.

Figure 5.
Overall point cloud data of test plots. (a) shows the overall point cloud of canopy height in test plot 1; (b) shows the overall point cloud of canopy height in test plot 2; (c) shows the overall point cloud of canopy height in test plot 3.
Figure 5.
Overall point cloud data of test plots. (a) shows the overall point cloud of canopy height in test plot 1; (b) shows the overall point cloud of canopy height in test plot 2; (c) shows the overall point cloud of canopy height in test plot 3.


Figure 6.
Relationship between measured and estimated plant height. (a) shows the results in test plot 1; (b) shows the results in test plot 2; (c) shows the results in test plot 3.
Figure 6.
Relationship between measured and estimated plant height. (a) shows the results in test plot 1; (b) shows the results in test plot 2; (c) shows the results in test plot 3.

Figure 7.
Droplet deposition at different parts of potato canopy. The sampler position was from the top of canopy to the inside. No. 7 was at the top of canopy, and No. 1 was at the lowest petiole of potato.
Figure 7.
Droplet deposition at different parts of potato canopy. The sampler position was from the top of canopy to the inside. No. 7 was at the top of canopy, and No. 1 was at the lowest petiole of potato.

Figure 8.
Relationship between coverage area of droplets and sampling area rate on canopy coverage.


Table 1.
UAV parameters.
| Technical Name | Parameter |
|---|---|
| Drone name | DJI Mavic Air |
| Takeoff weight | 430 g |
| Dimensions (length × width × height) | 168 mm × 184 mm × 64 mm |
| Image sensor | 1/2.3 inch, 12 million pixels |
| Lens focal length | 24 mm |
| Maximum photo size | 4056 × 3040 pixels |
| Single flight duration | 21 min |
Publisher’s Note: MDPI stays neutral with regard to jurisdictional claims in published maps and institutional affiliations. |
© 2022 by the authors. Licensee MDPI, Basel, Switzerland. This article is an open access article distributed under the terms and conditions of the Creative Commons Attribution (CC BY) license (https://creativecommons.org/licenses/by/4.0/).
Share and Cite
MDPI and ACS Style
Xie, J.; Zhou, Z.; Zhang, H.; Zhang, L.; Li, M. Combining Canopy Coverage and Plant Height from UAV-Based RGB Images to Estimate Spraying Volume on Potato. Sustainability 2022, 14, 6473. https://doi.org/10.3390/su14116473
AMA Style
Xie J, Zhou Z, Zhang H, Zhang L, Li M. Combining Canopy Coverage and Plant Height from UAV-Based RGB Images to Estimate Spraying Volume on Potato. Sustainability. 2022; 14(11):6473. https://doi.org/10.3390/su14116473
Chicago/Turabian StyleXie, Jingxin, Zhongrui Zhou, Hongduo Zhang, Liang Zhang, and Ming Li. 2022. "Combining Canopy Coverage and Plant Height from UAV-Based RGB Images to Estimate Spraying Volume on Potato" Sustainability 14, no. 11: 6473. https://doi.org/10.3390/su14116473
Note that from the first issue of 2016, this journal uses article numbers instead of page numbers. See further details here.