Article

Soils of the Ribeira Valley (Brazil) as Environmental Protection Barriers: Characterization and Adsorption of Lead and Cadmium

by
Jéssica Pelinsom Marques
1,
Carlos Manoel Pedro Vaz
2,
Joel Barbujiani Sígolo
3 and
Valéria Guimarães Silvestre Rodrigues
1,*
1
Department of Geotechnical Engineering, São Carlos School of Engineering, University of São Paulo, São Carlos 13566-590, Brazil
2
Embrapa Instrumentation, São Carlos 13560-970, Brazil
3
Institute of Geosciences, University of São Paulo, São Paulo 05508-080, Brazil
*
Author to whom correspondence should be addressed.
Sustainability 2022, 14(9), 5135; https://doi.org/10.3390/su14095135
Submission received: 24 March 2022 / Revised: 20 April 2022 / Accepted: 22 April 2022 / Published: 24 April 2022

Abstract

:
In waste disposal areas, soils can be used as environmental protection barriers to retain potentially toxic metals. Although most studies focus on lateritic soils, it is still of interest to evaluate other soil types, aiming to select the best materials among those available near the contamination area, reducing costs and construction efforts. This paper characterizes and evaluates the behavior of 13 soil materials collected in a region (Ribeira Valley, Brazil) with a history of improper mining waste disposal for the retention of lead (Pb) and cadmium (Cd) and their possible use as environmental protection barriers. All soils were acidic, kaolinitic, with negatively charged particles. Soils were grouped into three classes according to soil properties, such as particle size distribution, cation exchange capacity (CEC), and specific surface area (SSA), using cluster and principal component analysis. The Pb and Cd adsorption capacities ranged from 288 to 479 µg g−1 and 207 to 326 µg g−1, respectively, obtained from batch equilibrium tests. In general, all soils presented suitable characteristics for the retention of Pb and Cd, but four of them (1 to 4) showed the highest adsorption capacities, probably due to their larger SSA, CEC and percentage of fines (clay + silt).

1. Introduction

Soil, water, and sediment contamination by potentially toxic metals is a global problem that can be caused by the inadequate disposal of waste from several anthropic activities. High concentrations of metals and metalloids such as arsenic (As), cadmium (Cd), copper (Cu), chromium (Cr), lead (Pb), and zinc (Zn) are reported in several regions [1,2,3,4,5,6,7]. For instance, As concentrations of 350 mg L−1 and 860 mg kg−1 were found in water and sediments, respectively, in the Iron Quadrangle (Minas Gerais, Brazil), which is related to the release from mining tailings into the water bodies [1]. A meta-analysis based on studies published between 2008 and 2018 addressing toxic metals concentrations in soils near coal mining activity across 23 countries in Asia, Europe, Africa, and America reported up to 708 mg kg−1 of Cr (in Greece), 680 mg kg−1 of Pb, and 770 mg kg−1 of Zn (in Bosnia and Herzegovina) [2]. Concentrations up to 378 mg kg−1 of Cd in the soil and 51 µg L−1 of Cd in the groundwater of an area near a landfill in Egypt were also reported [3]. In Adrianópolis (southeastern Brazil), concentrations up to 28,585 mg kg−1 of Pb, 99,568 mg kg−1 of Zn, and 30 mg kg−1 of Cd were found in a mining waste disposal area [4]. This improper disposal caused contamination, and concentrations of up to 33.4 of Pb [5] and 15.8 of As [6] were found in sediments of the Cananéia–Iguape estuarine complex. Health authorities throughout the world are concerned with the effects of these contaminants on human health and the environment [8].
Soil constituents interact with contaminants and can detain their transport and mitigate contamination. This depends on the soil and contaminant characteristics and the environmental conditions. Factors such as soil texture and mineralogy, cation exchange capacity (CEC), pH, oxidation-reduction potential (Eh), ionic strength, and organic matter content can exert a significant influence on the soil–contaminant interaction [9,10].
In this context, soils can play an important role in contaminant attenuation and can be used as environmental protection barriers, i.e., as an interface between a contaminated material and the surrounding environment. For instance, they can be used as bottom liners in landfills or treatment ponds, cover systems at waste disposal areas, and vertical barriers to encapsulate contaminated areas, preventing the spread of the contaminant to the environment. The design of bottom liners and impermeable layers of cover systems is usually based on obtaining a low hydraulic conductivity (≤10−9 m s−1) [11,12]. In the literature, we found recommendations for soils to reach this objective, such as minimum clay content of 20% and a plasticity index greater than 7% [11,12]. However, in recent years, there was growing interest in the ability to attenuate contamination through processes such as adsorption, precipitation, degradation, filtration, and cation exchange [13]. The term environmental protection barrier encompasses not only the liner layers but all functions of a barrier, including the retention of contaminants. Therefore, the chemical and mineralogical characteristics of the soil also become criteria for choosing the barrier material.
For the construction of environmental protection barriers, it is necessary to study different types of soil, especially those available near the contaminated area, which represent a lower cost. The choice of which soil to use as environmental protection barriers must be conscious and based on the studied soil characteristics and environmental properties.
Thus, it is essential to characterize the soils of the areas of interest. Additionally, multivariate statistical techniques can support data interpretation and decisions. Principal component analysis (PCA) aims to reduce the dimensionality of a dataset and identify correlated variables and hidden patterns [14]. Cluster analysis arranges the data to group objects according to their characteristics, forming homogeneous clusters [15]. These techniques are used for several applications, including the analysis of soil characteristics. For instance, some studies use PCA and cluster analysis to evaluate the variability of physical and chemical attributes of soils under different land uses or managements [16,17,18,19,20] or to assess the quality of soils concerning potentially toxic metals and identify factors conditioning the contamination [21,22,23]. Especially for soils that are heterogeneous materials, these analyses are important to ensure the reliability of research data and provide better conclusions, supporting decision making satisfactorily.
The Ribeira Valley, in southeastern Brazil, is known for its intense mining activity. Residues generated by Pb beneficiation and smelting processes were released for five decades directly into the Ribeira de Iguape river and onto the soil surface. There are numerous well-documented studies highlighting the contamination of soils, sediments, water, and biota in the region by metals such as Pb, Cd, Cu, Zn, Cr, and nickel (Ni) released from mining waste [24,25,26,27,28,29,30,31,32].
In 1995, the processing and smelting of Pb ore from the Ribeira Valley mines ceased due to economic depletion. However, no recovery plan was carried out for the area, and the residues remained improperly disposed of on the soil surface. In 2006, the mining waste was transferred to a landfill near the industrial plant (in Adrianópolis municipality) and covered with a heterogeneous 5 to 10 cm layer of uncompacted soil. Since then, the area was abandoned and has presented a series of limitations (such as lack of identification and erosion by rain), which makes the contamination problem persistent [28]. Even today, it is essential to study alternatives for the adequate disposal of mining waste, mainly with low-cost and local materials. Furthermore, in addition to contributing to the local problem, the study of soils for potentially toxic metal retention in this region is relevant since the management of abandoned mines and mining waste deposits is a global problem [33,34,35]. This study is an example that can be adopted for other abandoned mining areas, aiming to use local soils.
The purpose of this research is to characterize different soils collected in the Ribeira Valley, aiming for the retention of Pb and Cd to be used as environmental protection barriers, and to indicate which are the most suitable soil(s) for this application based on their characteristics using statistical analysis (PCA and cluster analysis).

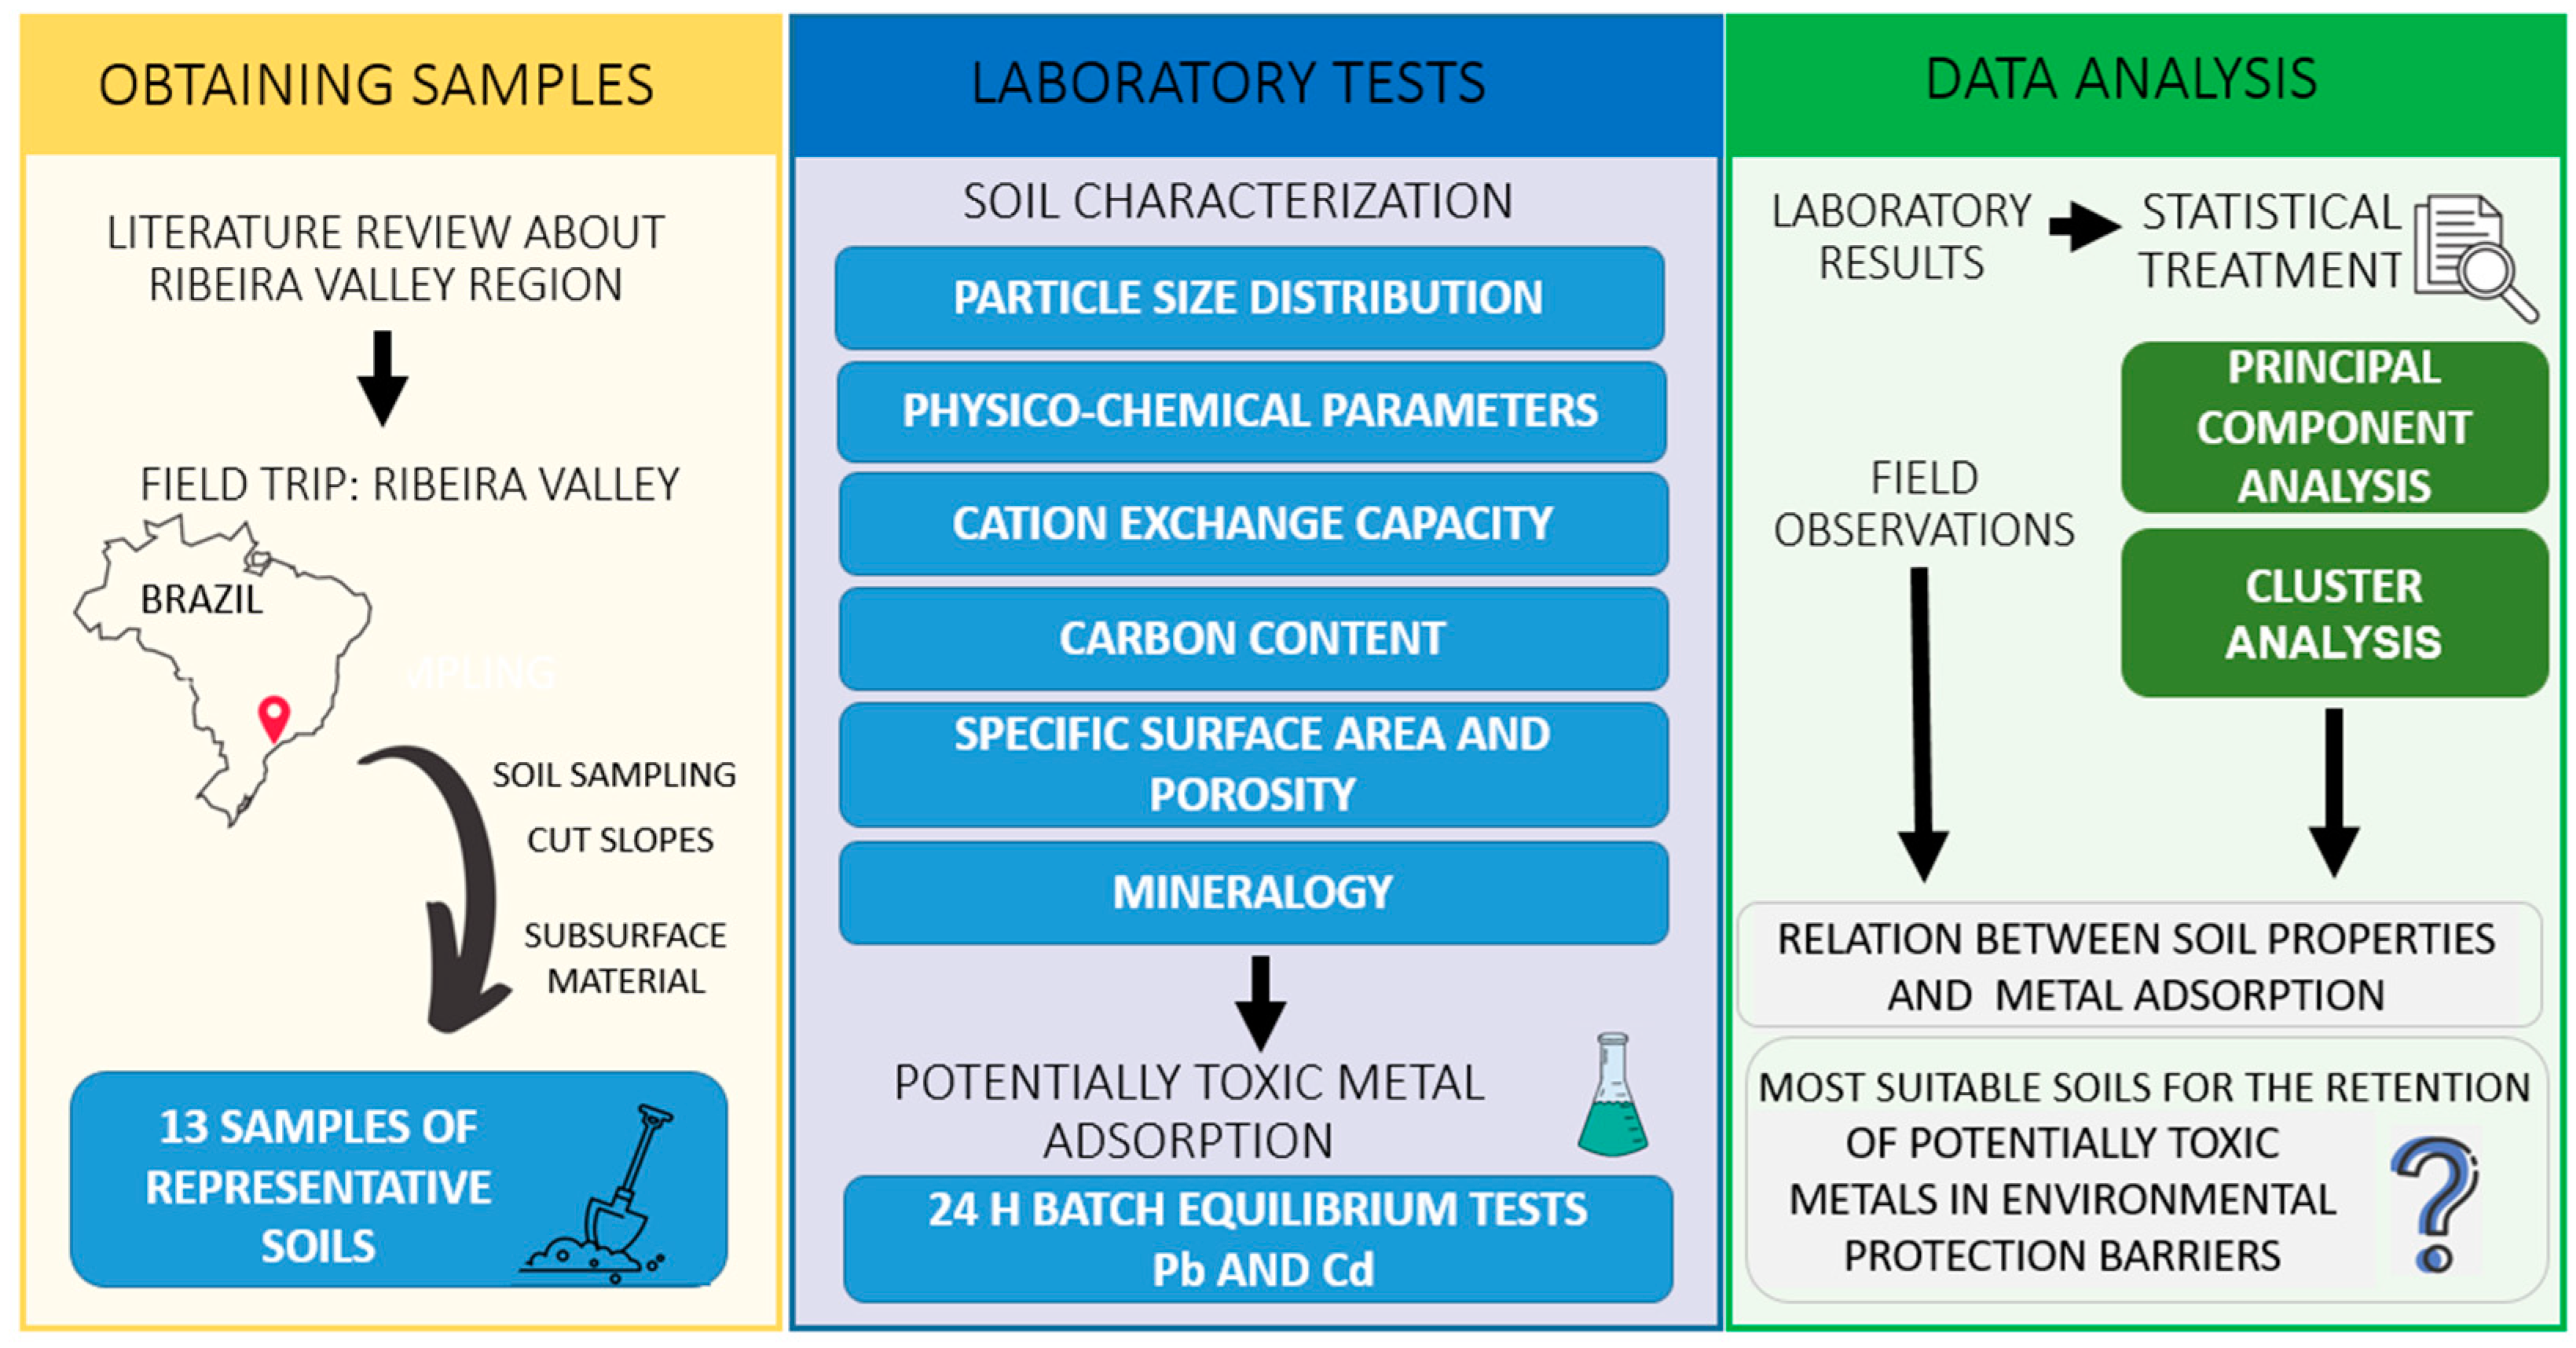
2. Materials and Methods
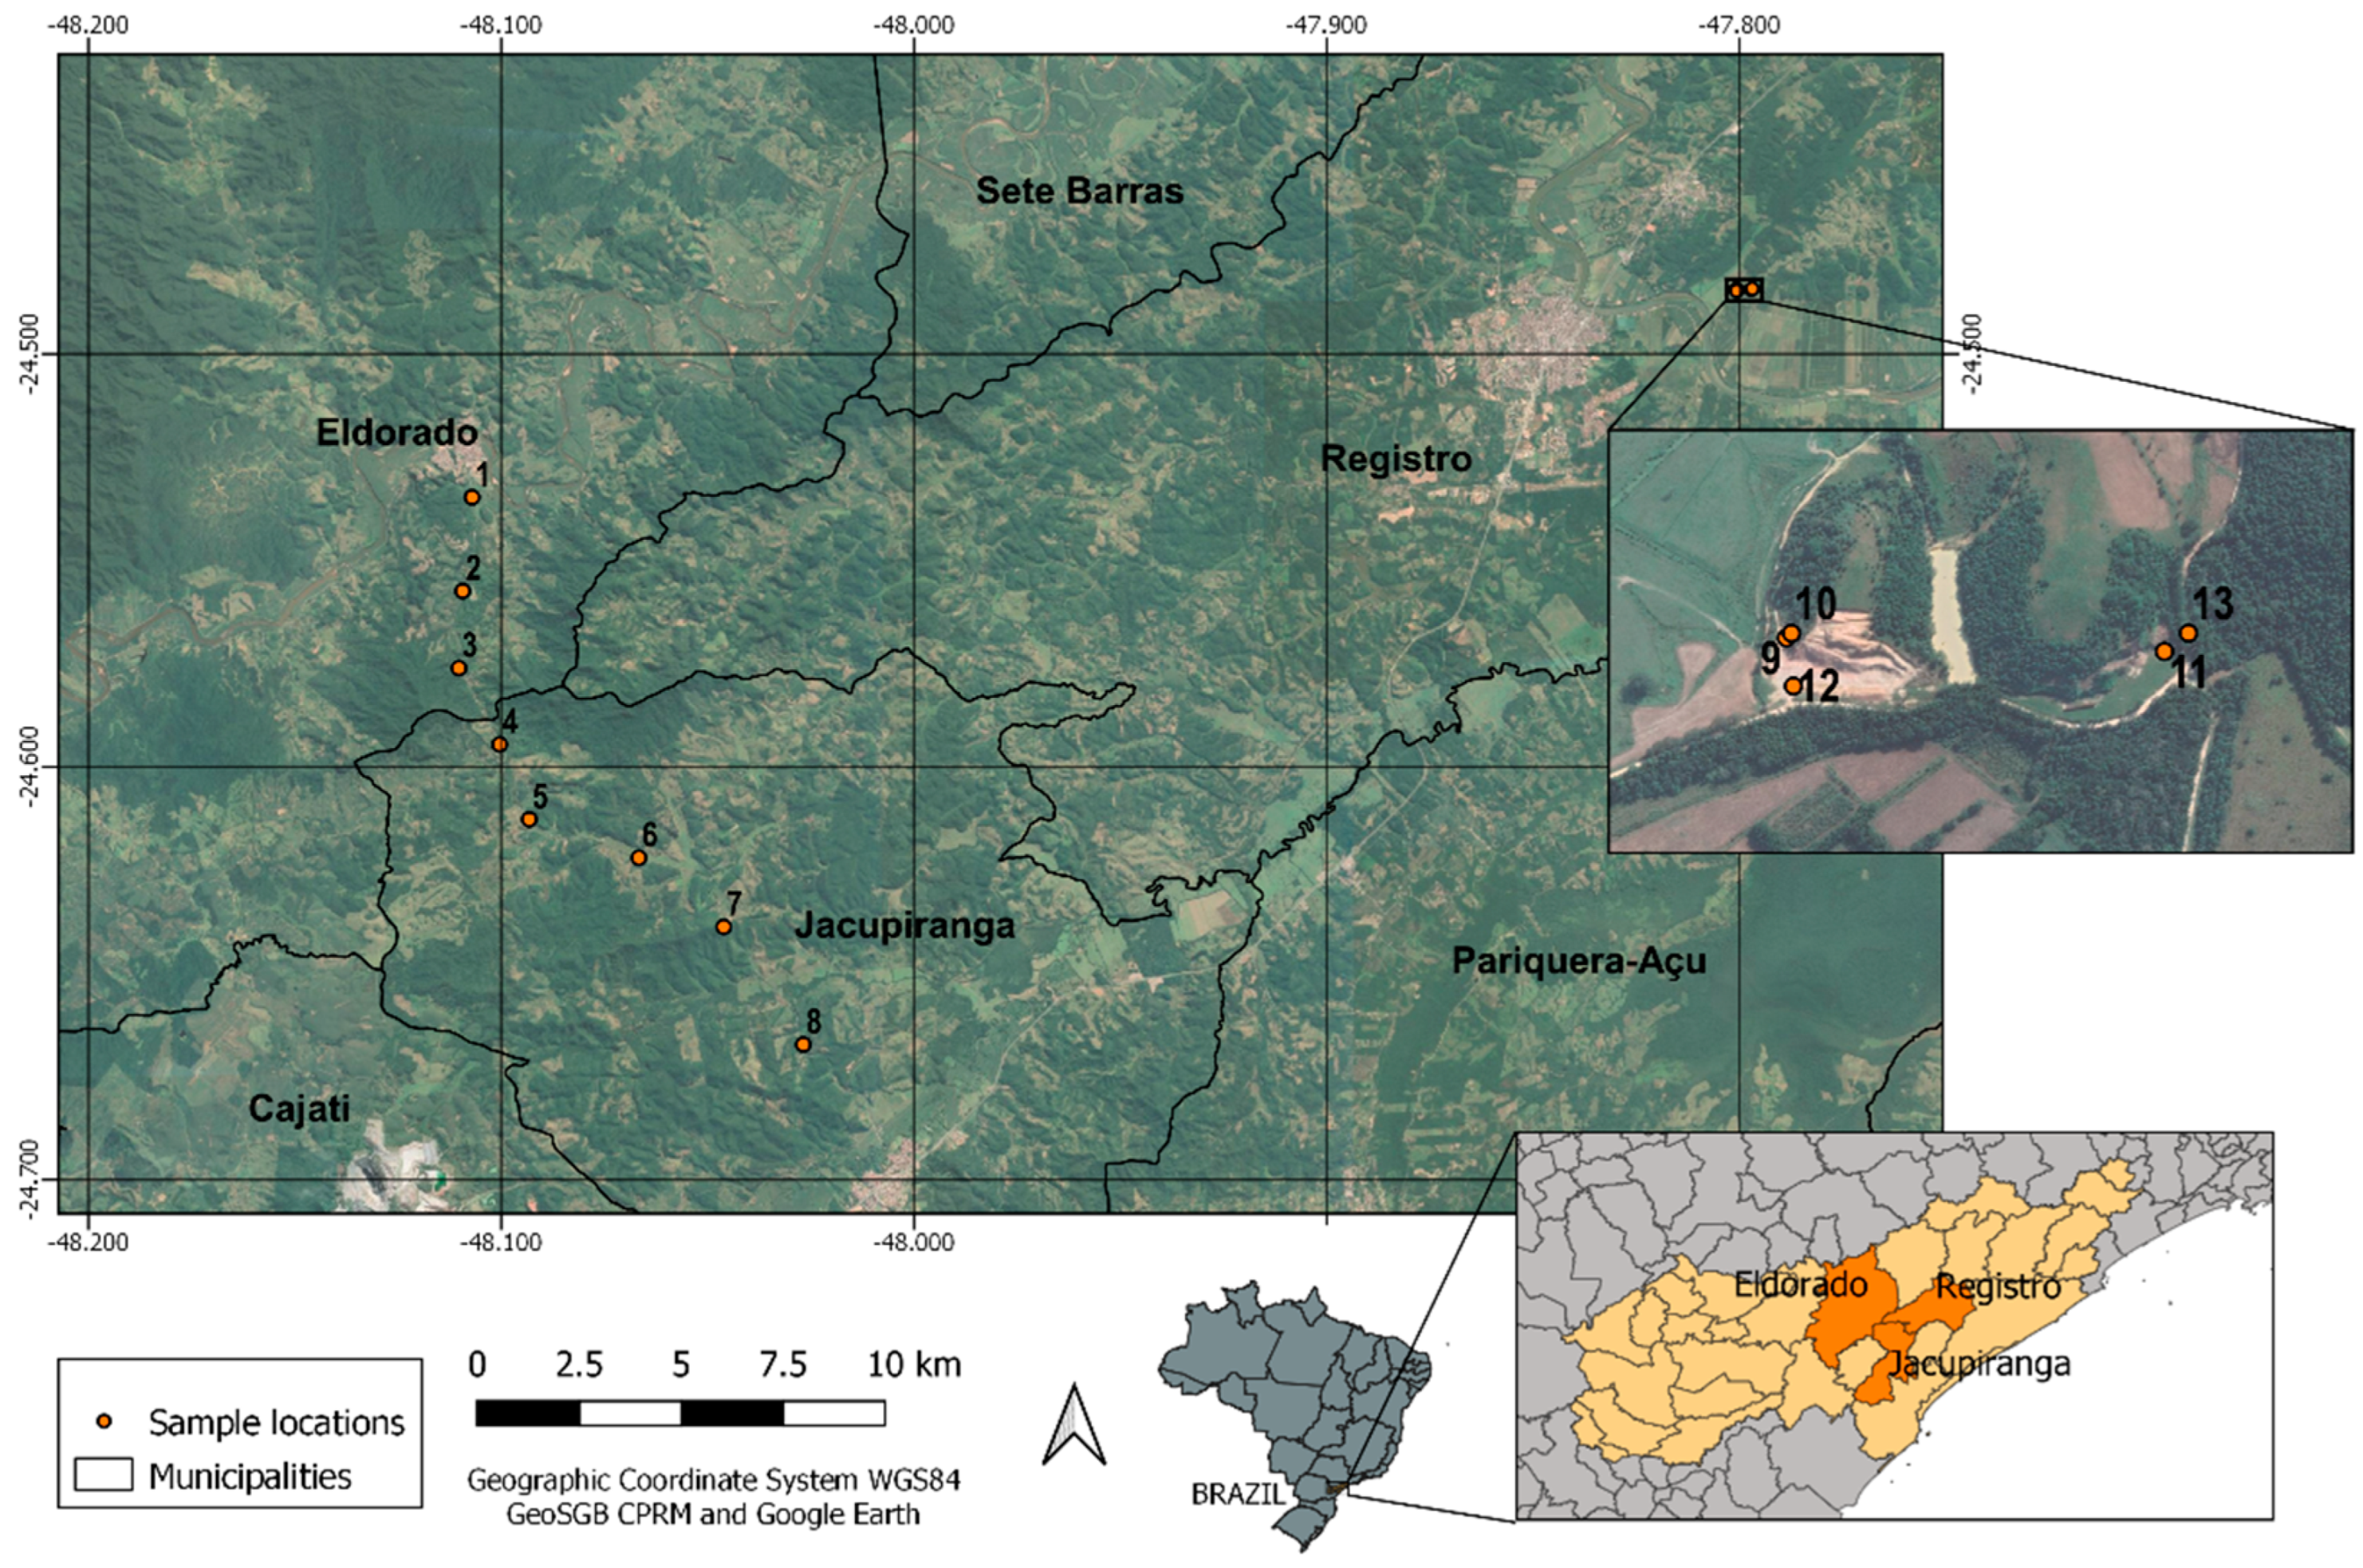
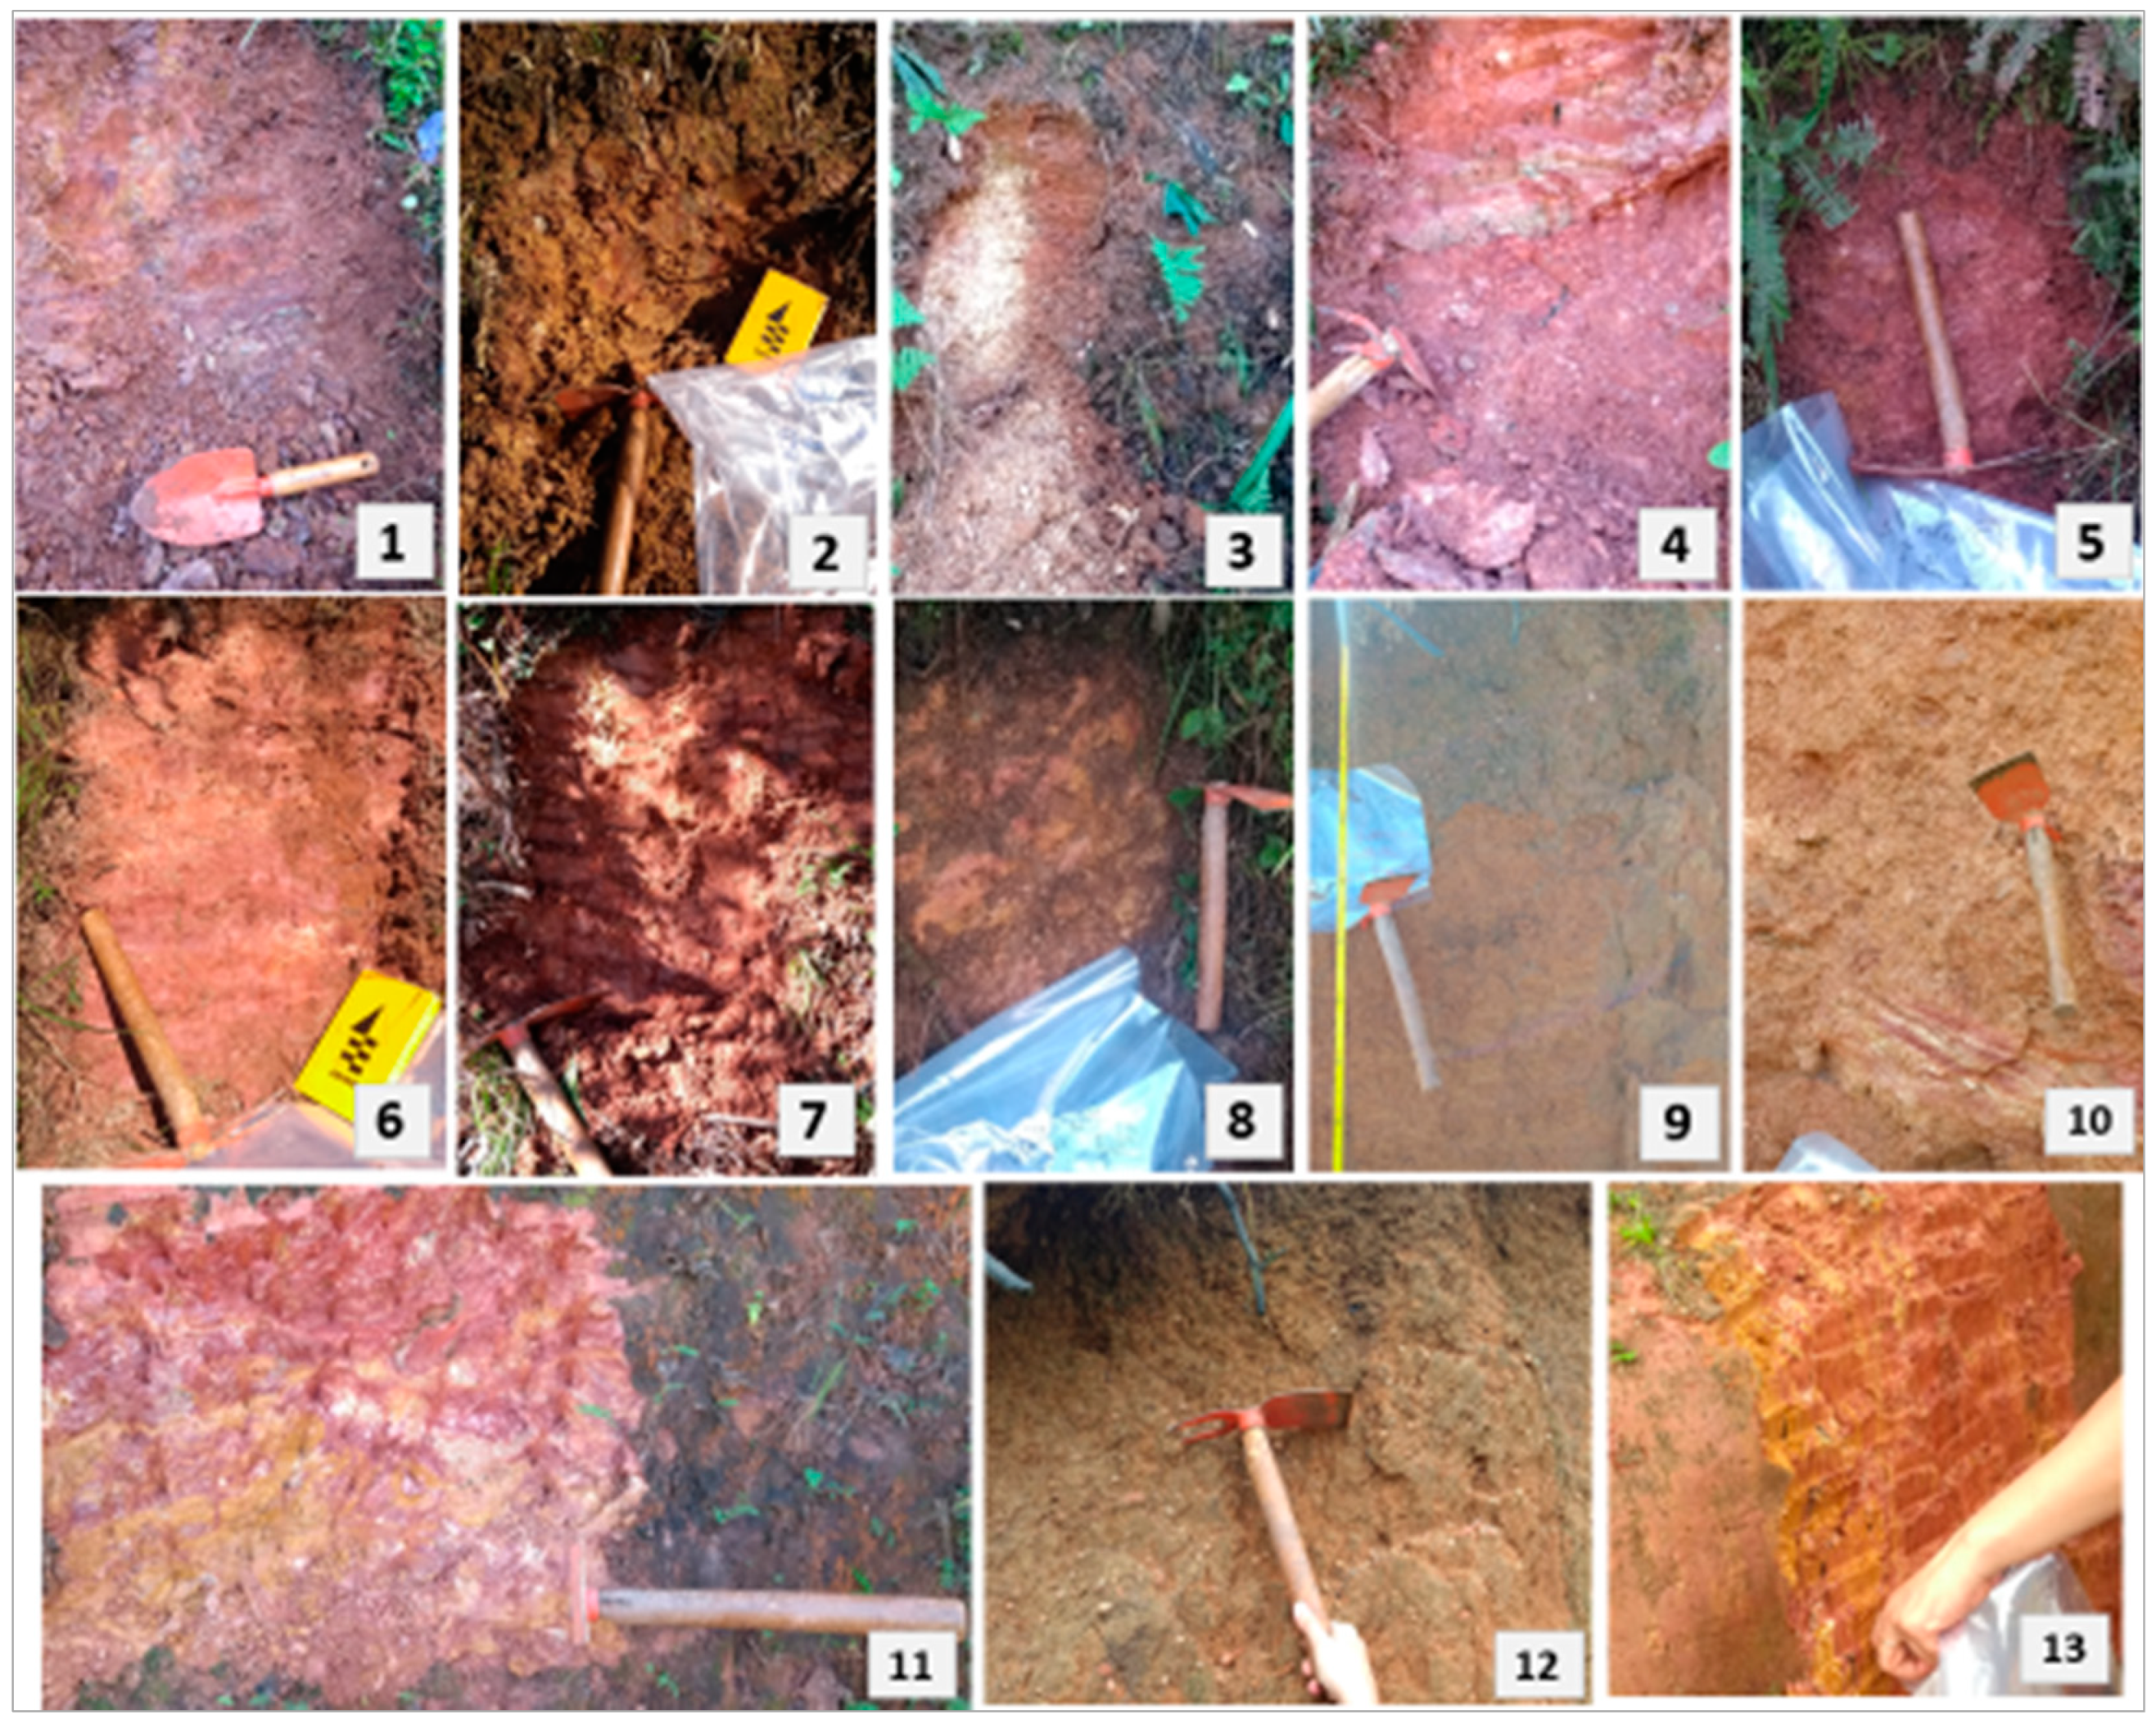
Figure 1 present an explanatory scheme of the approach used in this research. First, a field visit in the Ribeira Valley region was carried out to collect soils samples. The collected soils are from uncontaminated areas (region of the lower course of the Ribeira de Iguape River), without the influence of contamination caused by the inadequate disposal of mining waste (region of the upper course of the Ribeira de Iguape River). Then, in the characterization step, we aimed to determine the physical, chemical, and mineralogical attributes of the soils. Such characteristics were chosen because they are relevant to predicting how soil particles interact with potentially toxic metal cations in solution [9,36,37,38]. In the third step, adsorption tests were performed, aiming to compare the Pb and Cd adsorption capacities of each soil. In addition to being found in several types of mining and industrial waste, these metals are relevant to the study area. Pb is the metal found in the highest concentration (28,585 mg kg−1) in the soils of the abandoned mining waste disposal area in the Ribeira Valley [4]. Additionally, Cd, despite being found in lower concentrations, presents the greatest ecological risk for the area. It presents the highest percentage in mobile fractions (an average of 26.4% of total Cd is in exchangeable and carbonate fractions) [4]. Thus, this paper focused on the capacity of contaminant attenuation by the environmental protection barrier and not on the geotechnical aspects. Then, statistical tools were used to support data analysis. Finally, we discussed the relationships between soil characteristics and their ability to adsorb metals, indicated the soils that would be most favourable for the desired application, and pointed out potential future studies.

2.1. Soils

Soil samples were collected at 13 different locations in the municipalities of Eldorado, Jacupiranga, and Registro, in the Ribeira Valley (lower course of Ribeira de Iguape River), Brazil. The samples were identified with numbers from 1 to 13, as shown in Figure 2. These points were selected because they are representative of the soils from that region [38,39] and because they are in a portion of the Ribeira Valley that was not contaminated by potentially toxic metals. Previous research studied other soils from the same area and reported concentrations up to 0.08 mg kg−1 of Cd and 16.5 mg kg−1 of Pb [40]. Metal concentrations in soils from that area are used as background for the assessment of the contamination in Ribeira Valley [27].
Soils 1 to 8, collected along the road between Eldorado and Jacupiranga, are Red Yellow Argisols; and soils 9 to 13, collected in the rural area of Registro, are Fluvic Cambisols [38,39] (see Table S1 for more details). A single portion of the soil was collected for each point on cut slopes using a shovel. The collected samples are mainly of subsurface residual material. Surface organic material was not collected. Figure 3 present the images of all sample locations. In the laboratory, the soils were air-dried at room temperature, crushed, passed through a sieve (2 mm), and homogenized.

2.2. Characterization Tests

Particle size distribution was determined using an analyzer developed by Vaz et al. [41], based on the gamma-ray attenuation principle and the sedimentation of a particle in a liquid medium according to Stokes Law. A mass of 40 g of oven-dried soil was mixed with 40 mL of sodium hexametaphosphate solution at 105 °C for 24 h. The suspension was stirred for 16 h. Then, the dispersed sample was transferred to a rectangular acrylic container (5 × 5 × 20 cm3), where water was added to a complete height of 16 cm (100 g L−1). The equipment performs measurements of radiation attenuation, for previously defined time intervals, at different heights of the container and time of sedimentation [42].
Soil pH was determined according to the procedure of Embrapa [43]. It was measured in deionized water (pHH2O) and 1M KCl solution (pHKCl). The difference between the two measurements of pH was used to calculate ΔpH (pHKCl-pHH2O). The suspension of soil with deionized water used for the determination of pH was also used for the determination of the oxidation-reduction potential (Eh), performed with a platinum ring electrode connected to a Digimed pHmeter, reference electrode Ag/ClAg. The electrical conductivity (EC) was determined in 1:1 soil-deionized water suspensions [44].
Soil CEC was calculated from the sum of exchangeable bases [45]. Carbon (C), Hydrogen (H), and Nitrogen (N) contents were measured using the method of dry combustion with a Perkin Elmer model 2400 elemental analyzer, with a detection limit of 0.3%. Soil particle porosity was analyzed using the nitrogen adsorption/desorption technique at 77 K, with a porosimeter model ASAP 2020 (Micromeritics, Norcross, GA, USA). Specific surface area (SSA) was calculated using the Brunauer, Emmett, and Teller equation (BET) and the pore volume (Vpores) was calculated using the t-plot method [46].
X-ray Diffraction (XRD) and Differential Thermal Analysis (DTA) were carried out as complementary techniques to identify the mineralogy of the soils. For these analyses, we used only the soil particles <0.038 mm, in order to focus on the clay minerals. After separating the fine fraction of each soil, one portion of the sample was used for XRD of oriented aggregate mounts, and the other portion was oven-dried at 50–60 °C for 24 h for the DTA measurements. For XRD, three slides were prepared for each soil: natural air-dried, treated with ethylene glycol, and heated at 550 °C for 1.5 h in a muffle furnace [47]. Analysis was performed in a Rigaku Ultima lV diffractometer with a copper tube, screening from 5 to 80 degrees at 2 degrees per minute. DTA was performed using BP Engenharia equipment, reaching a temperature of 1000 °C at a heating rate of 12.5 °C per minute. We used alumina as the inert material.

2.3. Adsorption Tests

Batch equilibrium tests were performed according to the method of the United States Environmental Protection Agency [48] to evaluate the Pb and Cd adsorption capacities of the soils (in monoelementary systems). First, Pb and Cd solutions at 100 mg L−1 were prepared using a standard salt of lead chloride (PbCl2), Merck, having 98.0% purity and salt of cadmium chloride hemipentahydrate (CdCl2.2⅟2H2O), Sigma-Aldrich, having 79.5–81.0% purity.
The air-dried soil samples (final water content of 5.7%) were carefully ground (only to break up clods, without influencing the particle size distribution), weighed, and put in contact with each solution in glass erlenmeyers, following a soil:solution ratio of 1:5 (10 g of soil and 50 mL of solution). The samples were shaken on a Solab SL183 horizontal shaker at 120 rpm for 24 h. Samples were then transferred to 50 mL Falcon tubes, and the solid and liquid phases were separated by centrifugation (Novatécnica NT 810 Centrifuge at 2500 rpm for 10 min) and filtration (Unifil qualitative filter paper with a weight of 80 g m−2). The physicochemical parameters (pH, Eh, and EC) were measured in the solutions at the beginning (after soil-contaminant contact) and the end of the test (post-filtration). The concentrations of Pb and Cd in the solutions were determined directly (without dilution) using an inductively coupled plasma optical emission spectrometer (ICP OES), with a quantification limit of 0.01 mg L−1 for both metals.
The amount of metal adsorbed by each soil was calculated from the difference between the initial concentration (C0, µg mL−1) and the equilibrium concentration at the end of the test (Ce, µg mL−1), according to Equation (1), where qe (µg g−1) is the mass of contaminant adsorbed by the soil mass, Vsol (mL) is the volume of solution, and Msoil (g) is the soil mass [48].
qe = Vsol (C0 − Ce)/Msoil

2.4. Statistical Treatment

The statistical analyses were carried out using the software R and RStudio. Variables related to soil characteristics and adsorption capacity were analyzed in pairs to calculate Pearson’s correlation coefficient r, considering a significance level of 5% (p ≤ 0.05). Principal Component Analysis (PCA) was performed using the FactoMineR and factoextra packages in RStudio. All 13 soils and 10 variables were considered (pHH2O, Eh, EC, clay content, CEC, SSA, Vpores, Dpores, qePb and qeCd). Finally, Cluster Analysis was performed. The Partitioning Clustering approach was chosen, using the function k-means [14,15].

3. Results and Discussion

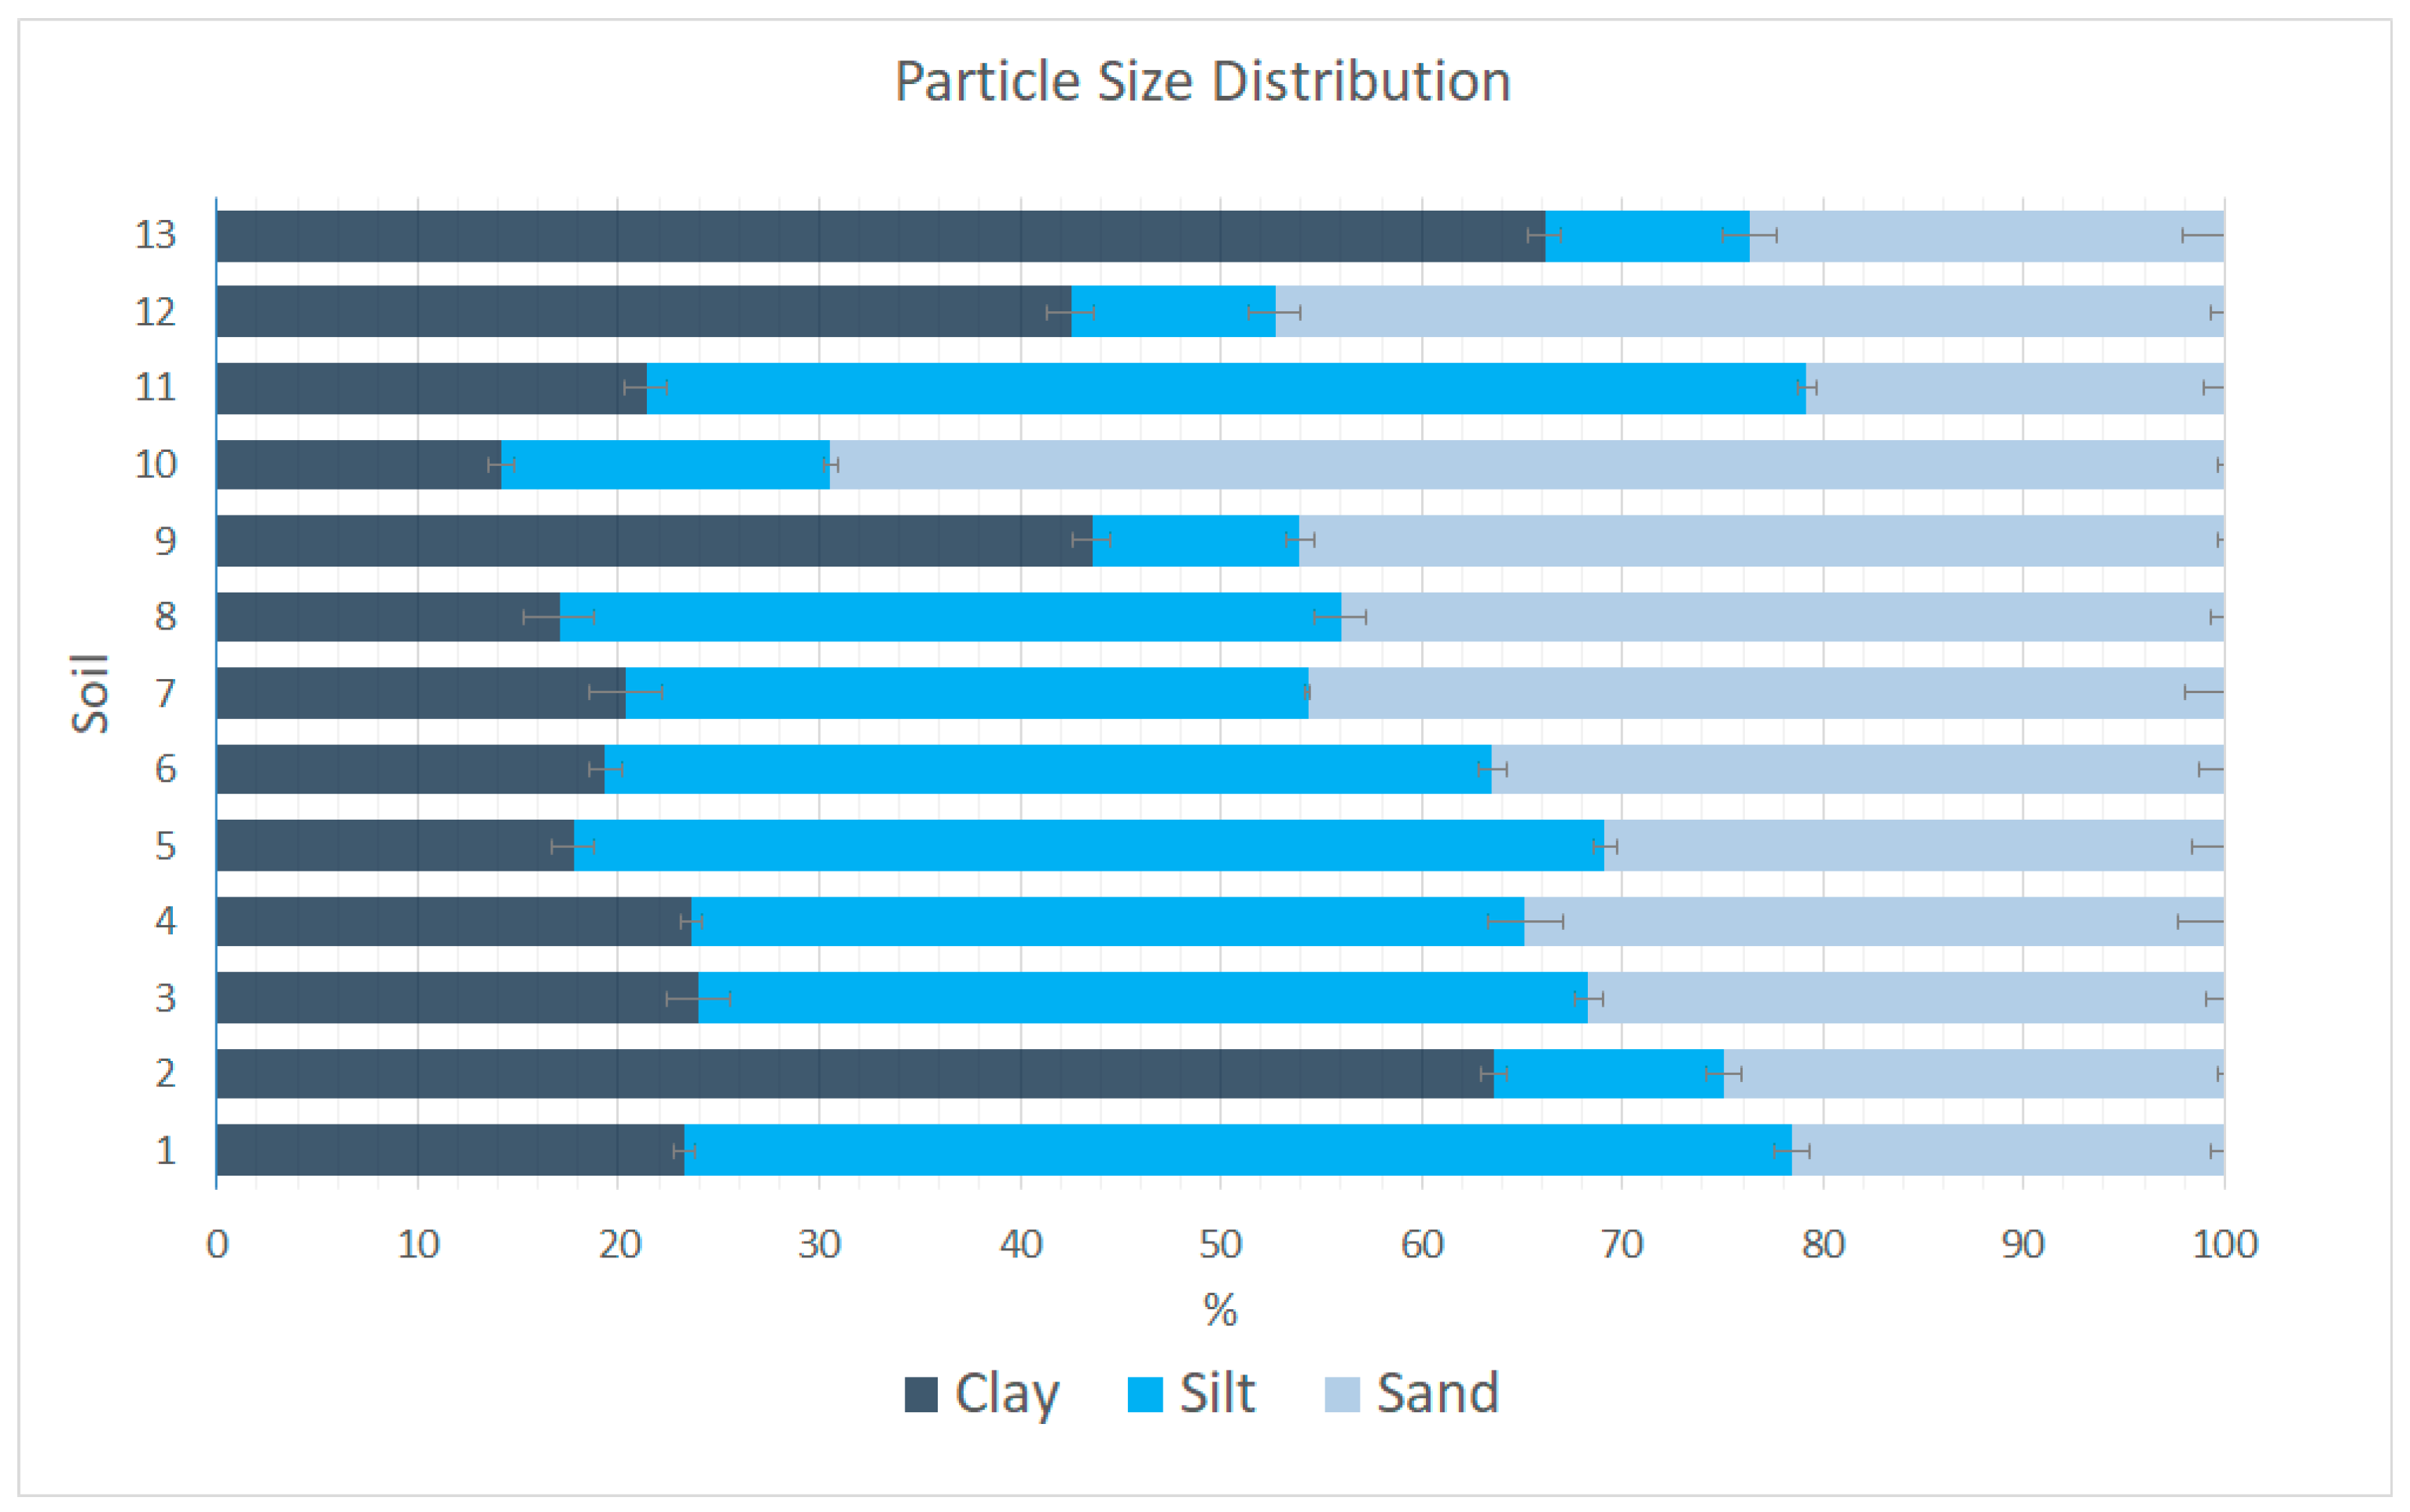
3.1. Soil Characterization

Figure 4 present the average contents of clay, silt, and sand of each soil. The 13 soils presented different textures, but, in general, they could be divided into three groups: a group of soils with a higher proportion of clay (soils 2, 9, 12, and 13), a sandy soil (soil 10), and the others with a medium texture (soils 1, 3, 4, 5, 6, 7, 8, and 11).
The most clayey soils are soils 2 and 13, which presented 63.6% and 63.1% of clay, respectively. The sand and silt contents in soil 2 were 24.9% and 11.4%, in due order. Soil 13 contained 23.6% sand and 10.2% silt. Both soils have a very similar particle size distribution, mainly if one considers the standard deviation. After soils 2 and 13, those with the highest percentage of clay were soils 9 and 12, also with a very similar particle size distribution. Soil 9 had 45.6% clay, 10.3% silt, and 46.1% sand, and soil 12 had 45.5% clay, 10.2% silt, and 47.3% sand. The clay fraction of the other materials varied between 14.2% (soil 10) and 24.0% (soil 3). Soil 10 was the most sandy (69.4% sand). Soils 1 and 11 also had a similar particle size distribution. They presented 55.2% and 57.8% of silt, respectively. The other soils presented significant content of fines (clay + silt): between 54.3% (soil 7) and 69.1% (soil 5); even the soils with lower percentages of clay had large proportions of silt.
For a good performance as a bottom liner or a liner layer of a cover system at waste disposal areas, it was recommended that the soils must contain a minimum of 20% clay [11]. Soils 5, 8, and 10 were not in accordance with this recommendation. Furthermore, soil 6 was at the limit because it presented an average of 19.4% clay, with a standard deviation of 0.8. On the other hand, Benson, Zhai, and Wang [49] proposed a less conservative criterion for using soils as liners: a minimum of 15% clay and 30% fines. All soil samples were in accordance with this recommendation. Only soil 10 was not, although it was very close: 14.2% clay and 30.5% fines.
Table 1 present the physicochemical parameters of the soils (pHH2O, pHKCl, ΔpH, Eh, and EC), as well as their C content. All soils were acidic, with pHH2O within the range of 4.2 (soil 12) to 5 (soil 2). Soils can be classified into weakly acidic (pH between 6 and 7), moderately acidic (pH between 5.5 and 6), strongly acidic (pH between 5 and 5.5), very acidic (pH between 4.5 and 5), or extremely acidic (pH less than 4.5) [50]. According to this classification, soils 1, 6, 11, and 12 were extremely acidic, and the others were very acidic. Such property is commonly observed in tropical soils. Similar pH values were found for soils from different regions of Brazil (pH ranging between 4.2 and 5.2) [51], for Amazonian soils (pH from 3.9 to 5.5) [52], and for soils in the state of São Paulo, Brazil (25 of the 30 soils studied by these authors had a pH between 4.0 and 5.8) [53]. Similar values were also found in previous studies for other residual soils from the Ribeira Valley: pH of 4.5 and 4.6 [54,55]. This characteristic can negatively affect contaminant retention. A number of metals, including Pb and Cd, tend to remain soluble at low pH, which favors their availability and transport. For instance, Kabata-Pendias [56] highlighted that there is a critical acidity (pH range between 4.0 and 4.5) at which the decrease of 0.2 in pH value can lead to an increase in Cd labile pool in an order of three to five times.
The pHKCl ranged between 3.7 and 3.9. All the pHKCl values were lower than pHH2O. Thus, ΔpH was negative (from −0.4 to −1.0), which indicated the predominance of negative charges on the surface of colloidal particles. This is probably related to the presence of clay minerals, and it is an important factor that influences the transport of contaminants in soils. The negative charges can favor the physicochemical processes that retain metallic cations [57].
The soil with the lowest Eh was soil 3 (+321.4 mV), and the soil with the highest Eh was soil 6 (+390.0 mV). All Eh values were positive, which indicated an oxidizing media, contributing to the retention of metals. It is complex to quantify the influence of Eh on the behavior of potentially toxic metals; however, in general, an oxidizing media favors the occurrence of precipitation and adsorption of metals onto iron (Fe) and manganese (Mn) oxides [57]. The electrical conductivity of the soils varied from 51.3 µS cm−1 (soil 10) to 143.5 µS cm−1 (soil 6) and can be related to the dissolved salts in the soil and to the mineralogy.
Carbon content varied from values below the detection limit (for soils 4, 5, 7, 8, 10, and 11) to 0.58% (soil 9), which means that all soils had small amounts of organic matter. Soil organic matter favors the retention of metal cations due to their high specific surface area (between 800 m2 g−1 [37]) and high CEC (from 150 to 300 cmolc kg−1 [57]), mainly due to the dissociation of H from functional groups such as carboxyls and phenolic hydroxyls [58]. Due to the low carbon content, the influence of organic matter on soil CEC and adsorption of cations by the soils studied in this research are probably not significant, and mineralogy has a more relevant role.
Table 2 show the results obtained from the sum of exchangeable bases and the nitrogen adsorption/desorption technique. Soil CEC varied between 29.5 mmolc dm−3 (soil 10) and 199.8 mmolc dm−3 (soil 12). Soils 9 and 13 also presented high CEC (179.3 mmolc dm−3 and 173.6 mmolc dm−3, respectively). This is probably due to its high clay content. However, soil 2, which was also rich in clay (particle size distribution very similar to soil 13), had one of the lowest CEC (61.2 mmolc dm−3). A possible explanation for this difference may be related to the soil’s mineralogy.
It is important to highlight the role of soil CEC in the retention of potentially toxic metals through ion exchange since the metals can be in the form of metallic cations when in solution. It is also apparent from Table 2 that most part of the CEC is due to the potential acidity of all 13 soils. Base saturation was between 0 and 6.3%, which means that the vast majority of negative charges in soil colloids are being neutralized by H+ and Al3+ and not by bases. These results are in accordance with the fact that the materials are residual, acidic soils with low organic matter contents.
The materials with the highest SSA were soil 13 (30.05 m2 g−1), soil 12 (24.85 m2 g−1), and soil 9 (21.57 m2 g−1) (Table 2). They were also those with higher clay content and higher CEC. The soils with the lowest SSA were soil 10 (5.68 m2 g−1) and 6 (6.59 m2 g−1), which were also those with the lowest CEC. The other soils presented SSA values ranging from 8.38 m2 g−1 to 13.23 m2 g−1. SSA is important for metal retention because it represents the size of the area that is exposed for reactions to occur. Therefore, it is expected that a higher SSA leads to a higher CEC and greater metal retention.
In general, for the soils with a larger SSA, we observed higher total pore volumes (for instance, soils 9, 12, and 13). Soil 10 (which had a low CEC) presented the lowest pore volume (0.015 cm3 g−1). On the other hand, this trend did not apply to soil 2. This soil had a smaller specific surface area than soils 9 and 12 but a greater total pore volume (0.093 cm3 g−1). This is probably due to the difference in the size of the pores. The average pore diameter of all soils ranged between 150.6 Å (soil 5) and 433.6 Å (soil 2). Thus, in all cases, this average value corresponded to the size of a mesopore, according to the International Union of Pure and Applied Chemistry (IUPAC) classification [59], which considers mesopores those with 20 to 500 Å of diameter. For soil 2, despite having a total pore volume that was comparable to those of the other clayey soils, the diameters of the pores seemed to be bigger, so the SSA was smaller.
DTA curves (Figure 5) show small peaks at temperatures lower than 200 °C, which is probably associated with water loss. All soils presented a major endothermic peak in the region of 590 to 600 °C of the curves and an exothermic peak close to 950 to 970 °C. These peaks are typical of kaolinite. The first is probably a peak of combined water removal (dehydroxylation), and the second can be associated with the formation of cristobalite or mullite or with a structural rearrangement of kaolinite [60]. Kaolinite is a 1:1 clay mineral formed by a tetrahedral layer of silicon and oxygen and an octahedral layer of aluminum and hydroxyl (Al4Si4O10(OH)8). It is formed from the feldspars weathering and is very common in tropical soils [61].
The DTA curves of soils 1 and 8 also exhibited an endothermic peak at around 325 °C. Gibbsite (Al(OH)3) and goethite (FeO(OH)) can present peaks in this region of the DTA curve. Mackenzie [60] explained that gibbsite generates a strong endothermic peak in the curve between 320 and 330 °C. However, almost without exception, smaller peaks also appear around 250 to 300 °C and 525 °C, which was not observed in the curves of soils 1 and 8. Goethite generates an endothermic peak that varies in the region of 300 to 400 °C, and samples with coarser particles present peaks at higher temperatures compared to those with finer particles [60]. Thus, the peaks found in the curves of soils 1 and 8 are more likely indicative of the presence of goethite. Goethite is one of the most common iron oxides found in soils and gives them their brown or ocher color. It is also very common in the tropics on strongly weathered soils [62].
The diffractograms obtained in the XRD analysis are shown in Figures S1–S13. Kaolinite seems to predominate in all samples. The characteristic peak of this mineral (at about 7.2 Å) appears in the diffractograms of the natural and ethylene glycol-treated samples but not in the diffractograms of 550 °C heated samples. This is because heating makes kaolinite amorphous. With the exception of soils 1 and 6, all soils presented peaks that are characteristic of illite (about 10.0 Å and 5.0 Å). The peak of approximately 4.18 Å, characteristic of goethite, was observed again in the diffractograms of most soils (1, 3, 4, 5, 7, 8, and 11).
Therefore, based on the results of mineralogical analyses, in addition to quartz, all soils showed a predominance of kaolinite in their clay fraction, and there were indications of the presence of illite and goethite in some of the samples. Regarding the chemical aspect, the predominance of kaolinite indicates a rapid rate of ion exchange because, for this clay mineral, the reaction occurs only on external sites [57]. However, kaolinite presents low CEC (generally from 50 to 150 mmolc dm−3 [63]), with variable charges (pH-dependent). Thus, limited adsorption is expected, and changes in pH are more relevant because they can lead to a release of the adsorbed cations. Special attention should be given to potential desorption [57].
Concerning the application as compacted soil liners, kaolinite and illite can be efficiently compacted and consolidated to achieve hydraulic conductivity values from 10−8 to 10−10 m s−1 [11]. Although limited retarding capacity is expected from kaolinite, it is inactive and relatively immune to damage by several chemicals [11], which is also a factor to consider in environmental protection barriers.
No indications of expansive clay minerals were found, which favors the performance of the soils as a compacted liner. Although expansive clay is expected to have greater attenuation capacity, they are difficult to control and can cause problems in the structure of the barrier [11].

3.2. Pb and Cd Adsorption

Figure S14 show the variation of the physicochemical parameters (pH, EC, and Eh) measured during the adsorption tests. The initial pH of all soil samples in the adsorption test was within the range between 4.1 and 4.7. This acidic environment is unfavorable for the precipitation of metals [10]. The pH of all samples decreased during the test. The difference between initial pH and equilibrium pH varied from 0.5 to 1.0. This is probably related to the release of H+ ions by soils, which suggests that ion exchange was one of the sorption mechanisms.
The initial EC ranged from 167.7 to 191.6 µS cm−1 for the tests with Pb and from 230.7 to 257.0 µS cm−1 for the tests with Cd. These values increased after 24 h in all samples. One can also notice that initial Eh varied from +243.8 to +358.7 mV. In general, these values increased or remained constant until the equilibrium. During the entire test, Eh was positive, which indicates an oxidizing environment.
Figure 6 show the results of the adsorption tests. In terms of Pb removal efficiency (Figure 6A), the soils with the best performance were soil 1 (97.2 ± 0.2%), soil 2 (94.5 ± 0.1%), soil 4 (92.1 ± 0.9%), and soil 3 (93.0 ± 1.1%). On the other hand, the materials with the lowest Pb removal efficiency were soil 10 (58.1 ± 1.5%) and soil 6 (75.9 ± 1.4%). The Cd removal efficiency (Figure 6A) ranged from 39.6% to 62.5%. Soils 2, 1, and 4 showed higher efficiency (62.5 ± 2.1%, 61.9 ± 3.4%, and 58.6 ± 2.6%, respectively), and soils 10 and 6 were the least efficient materials (39.6 ± 1.3% and 43.1 ± 1.0%, respectively).
Regarding the adsorption capacity (µg g−1) shown in Figure 6B, the results were similar. The soils with the highest Pb adsorption capacity were soil 1 (479.2 ± 2.6 µg g−1), soil 2 (465.9 ± 4.6 µg g−1), soil 3 (461.6 3 ± 6.0 µg g−1), and soil 4 (460.9 ± 7.6 µg g−1). The soil with the lowest Pb adsorption capacity was soil 10 (288.0 ± 7.8 µg g−1). Ranking the 13 soils according to their Pb adsorption capacity, we obtained the sequence: 1 > 2 > 3 > 4 > 13 > 7 > 5 > 11 > 9 > 8 > 12 > 6 > 10.
The materials with the highest Cd adsorption capacity were soil 2 (325.62 ± 2.1 µg g−1), soil 1 (323.4 ± 17.5 µg g−1), and soil 4 (306.9 ± 13.2 µg g−1). Those with the lowest capacity were soil 10 (206.5 ± 7.4 µg g−1) and 6 (225.5 ± 5.4 µg g−1). Ordering the soils according to their Cd adsorption capacity, we obtained 2 > 1 > 4 > 3 > 5 > 13 > 7 > 11 > 8 > 9 > 12 > 6 > 10.
Thus, the soils with the best performance for adsorption of both Pb and Cd were soils 1 and 2, followed by soils 3 and 4. On the other hand, soils 10 and 6 had the worst performance.
All soils had a greater affinity for Pb when compared to Cd. Such behavior was already reported in the literature. Fontes and Gomes [64] and Pierangeli et al. [65] observed that Cd adsorption capacities were lower than Pb adsorption capacities for different Brazilian soils. Araujo [66] and Marques et al. [54] reported this same difference when analyzing soils in the Ribeira Valley. According to Kabata-Pendias [56], Cd has a smaller ionic radius and a different electronic configuration than Pb, which influences adsorption.

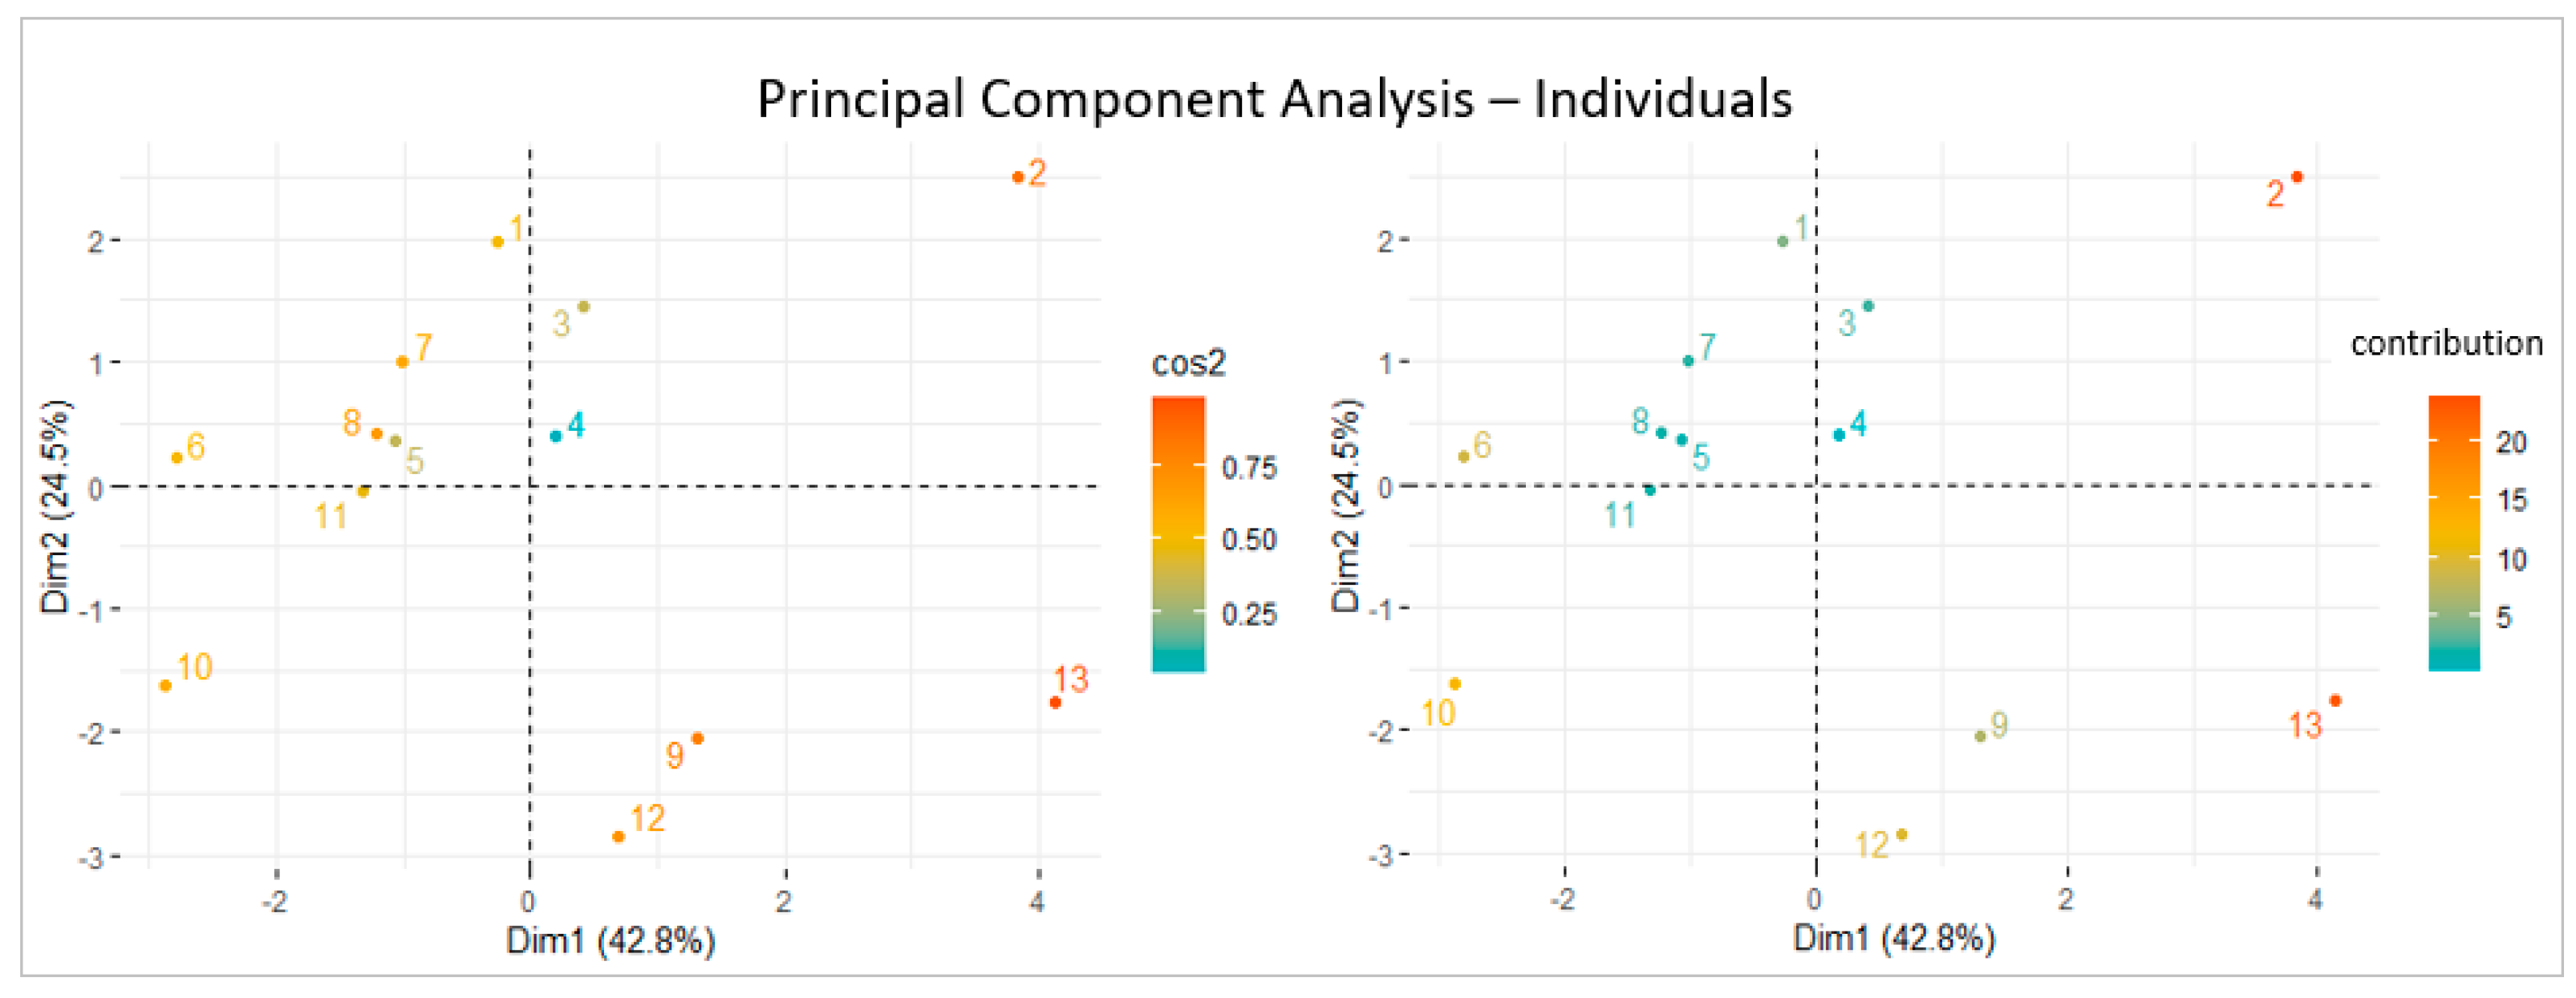
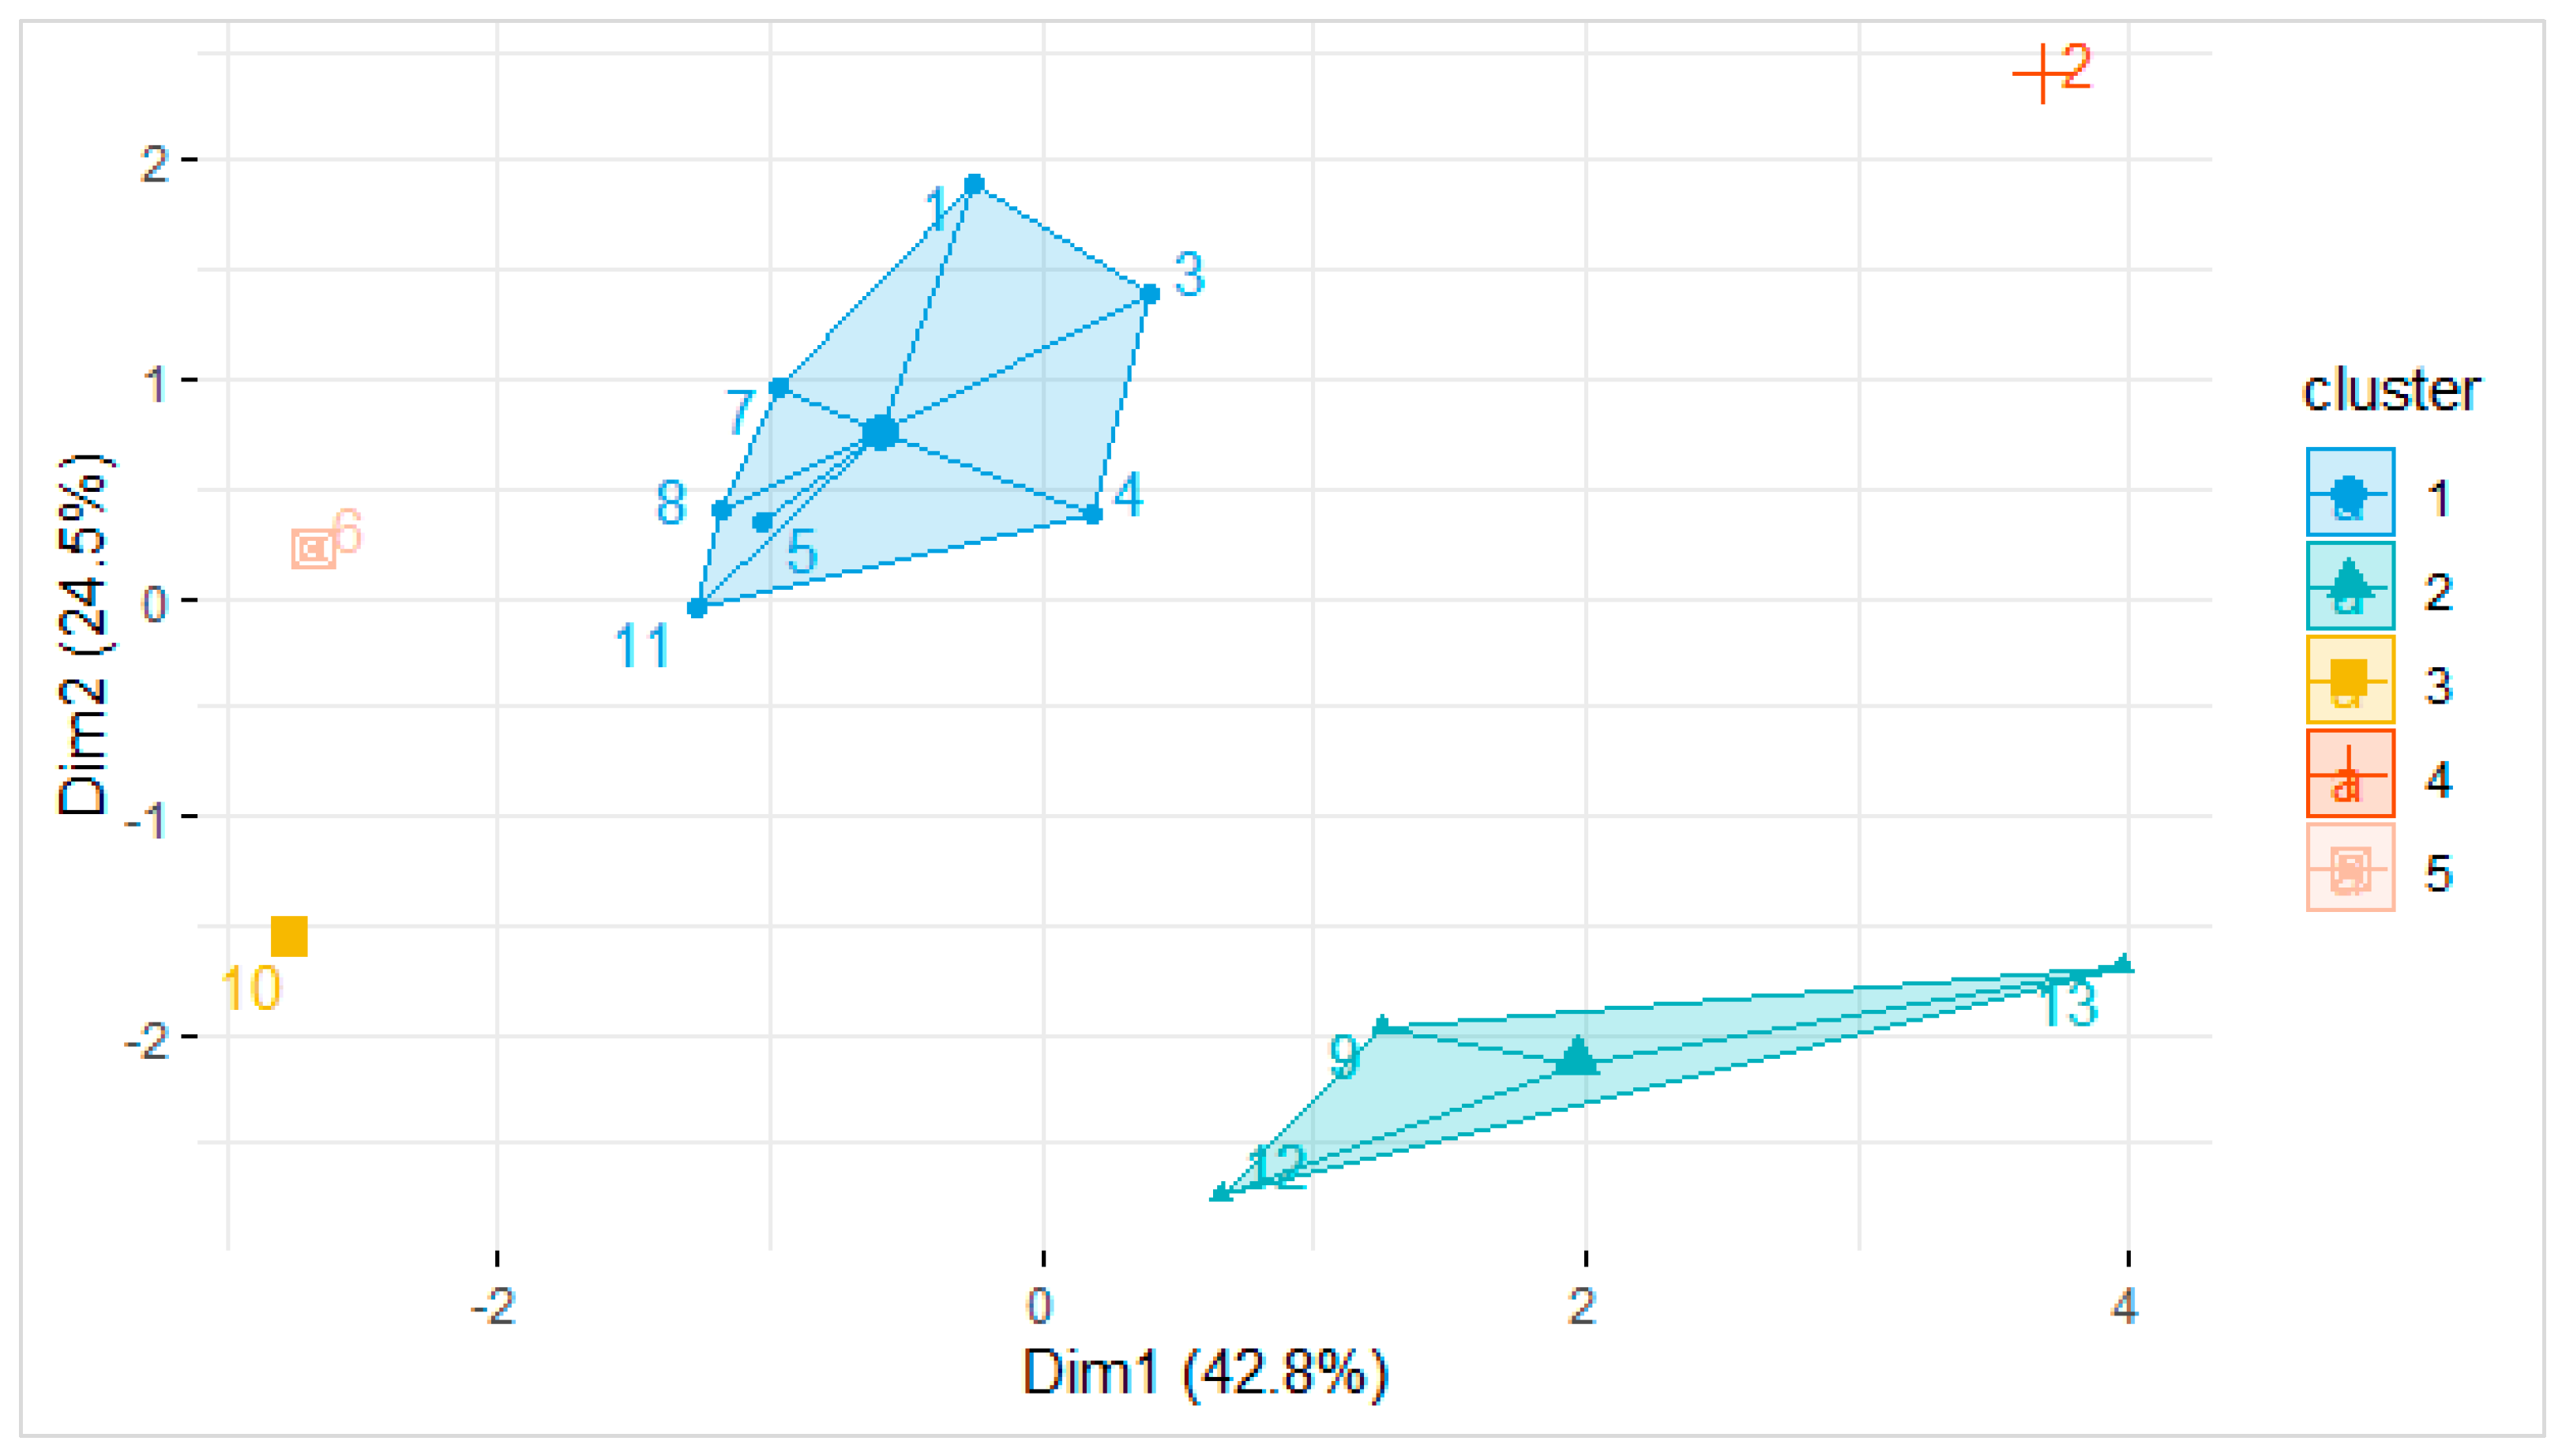
3.3. Statistical Treatment

Figure 7 show the Pearson correlation matrix considering soil characterization variables and their Pb and Cd adsorption capacities, with a significance level of p ≤ 0.05. There was a positive correlation between clay content and the total volume of pores (r = 0.98). The clay content was also positively correlated with the SSA (r = 0.84) and the CEC, although with a lower coefficient (r = 0.63). The characteristics of clay, such as the small size and presence of negative charges at their surface, can explain the higher volume of pores, SSA, and CEC in soils that present a large proportion of clay [61].
Regarding the adsorption capacity, there is a positive correlation between qePb and qeCd (r = 0.92) since the order of affinity of the different soils with both Pb and Cd was similar. A negative correlation between Pb and Cd adsorption capacities and the sand content in soils was also observed (r = −0.79 for qePb, and r = −0.73 for qeCd). Similar results were reported by Moreira [67] when evaluating the competitive adsorption of Cd, Cu, Ni, and Zn in 14 representative soils of the state of São Paulo, Brazil. The author observed a negative correlation between the maximum Cd adsorption and the sand content of the soils, considering a significance level of 5% (r = −0.64).
The negative correlation between adsorption capacity and sand content was caused by the strong affinity of Pb and Cd with soil fine particles (clay + silt) since no or very little adsorption was expected by the sand particles (mainly quartz). Indirectly, this indicates the higher the fines content (clay + silt) of the soil, the greater the adsorption. However, in this study, no positive correlation was observed between the adsorption capacities and the clay content. Therefore, it seems that, for these soils, the relevance of fines content is greater than the relevance of clay content for the adsorption. Probably, particles in the silt fraction are as important for adsorption as particles in the clay fraction. This would explain the higher adsorption capacity of soils 1 to 4 compared to the clayey soils. Despite having lower clay contents, soils 1 to 4 present a percentage of fines ranging from 65.2% to 78.4%. Other soils with a higher percentage of clay have low silt content; therefore, they have a lower fraction of fine particles. For example, soils 9 and 12 (that are in the group of clayey soils) only had 53.9 and 52.7% of fines (cay + silt), which is significantly lower than soils 1 to 4.
No positive correlation was observed between adsorption capacities and soil C content, which differs from some other studies in the literature. For instance, Khodaverdiloo and Samadi [68] reported a positive correlation between the total amount of Cd adsorbed by soil and the organic carbon content (r = 0.57, p ≤ 0.05). Nascimento and Fontes [69] studied the adsorption of Cu and Zn in soils from Minas Gerais (Brazil) and found a correlation between the clay content and the parameters Kf from the Freundlich equation (r = 0.61 and 0.51, respectively, p ≤ 0.10). These results can be related to the very low C contents of the soils from the Ribeira Valley and the little importance of their organic matter for adsorption. Clay minerals and iron oxides are more relevant in this case.
Figure 8 show the variables correlation circle of PCA, in which the positively correlated variables are closer, and the negatively correlated variables are positioned in opposite quadrants. The variables are also colored according to their quality of representation (cos2) and their contribution to the principal dimensions. The variables with the best quality of representation and biggest contribution were clay content, SSA, and pore volume, followed by CEC and qeCd. EC and Eh had the smaller contribution and the lowest cos2 values. There was a positive correlation between clay content and pore volume and between CEC and SSA. The Pb and Cd adsorption capacities (qePb and qeCd) were also positively correlated. There was also a negative correlation between Eh and pH. All of these observations are in accordance with Pearson’s correlation matrix. Figure 9 show the distribution of the 13 soils in the factor map of PCA. Soils 13, 9, and 2 presented the highest values of cos2 (highest quality of representation) and the biggest contribution to the principal components.
The results of the Cluster analysis are presented in Figure 10. The soils were divided into five clusters. One of the groups (green in Figure 10) included soils 9, 12, and 13, which are the soils with the highest clay contents, SSA, CEC, and pore volumes. Soil 2 was not included in any group and is represented in red in Figure 10. This soil had high clay content, with a particle size distribution comparable to that of the soils in the first group; however, what makes it different is its lower CEC, SSA, and higher average pore diameter. Soils 10 and 6 were also isolated, constituting two groups (in yellow and pink, respectively). Both differ from the rest due to their low clay contents, lower CEC, smaller SSA, and lower Cd and Pb adsorption capacities. There is still another group (in blue) consisting of soils 1, 3, 4, 5, 7, 8 and 11, which are those with a medium texture, with similar clay contents (between 17.1 and 24.0%) and SSA (between 9.2 and 13.2 m2 g−1).
Despite being grouped together, soils 1, 3, 4, 5, 7, 8, and 11 differed in some aspects and did not have similar performances in the adsorption of Pb and Cd. Cluster analysis grouped these soils because the most considered variables were clay content, SSA, and pore volume. Some characteristics that differentiate them, such as adsorption capacities, have smaller contributions to the definition of the principal components. The soil fine fraction (clay + silt), which proved to be relevant for adsorption, was not considered in this analysis. Another limitation is that soils 4, 5, 7, and 8 are not well represented in the factor map (low cos2 values), and this must be taken into account when interpreting the results.
Among soils 1 to 4, which are those with the best performance of Pb and Cd adsorption, soils 1, 3, and 4 were grouped in the same cluster, as they are similar concerning those variables that had the greatest contribution in the two dimensions of PCA (clay content, CEC, SSA). However, soil 2, despite having an adsorption capacity similar to those of soils 1, 3, and 4, does not belong to the same group because it has different characteristics. This may suggest that the adsorption of Pb and Cd in soil 2 occurred on different constituents or by different mechanisms than in soils 1, 3, and 4. Furthermore, although soil 2 has a higher clay content than soils 1, 3, and 4, the percentage of fines (clay + silt) is similar. The statistical analyzes showed that the percentage of fines was more important than the clay content for the adsorption.

4. Conclusions

The aim of this paper was to characterize different tropical soils from the Ribeira Valley and evaluate their capacity to adsorb Pb and Cd to be used as environmental protection barriers. In general, the 13 soils differ mainly regarding particle size distribution, CEC (from 30.3 to 199.8 cmolc dm−3), and SSA (from 5.68 to 30.05 m2 g−1). However, they have some common characteristics, such as acidity (pH between 4.2 and 5), the presence of negative charges on the surface of the particles (ΔpH negative), oxidizing environment (Eh positive), low C content (<0.58%), and predominance of kaolinite, a clay mineral with low activity. Under the described laboratory conditions, the adsorption capacity of Pb in the soils ranged from 288.0 to 479.2 µg g−1, and the adsorption capacity of Cd ranged from 206.5 to 325.7 µg g−1. The most efficient soils for removing both Pb and Cd from solutions were soils 1, 2, 3, and 4. Among these soils, the most different was soil 2 (higher clay content, lower CEC and SSA). The adsorption of Pb and Cd in soil 2 occurred on different constituents or by different mechanisms than in soils 1, 3, and 4. Statistical analysis facilitated an understanding of the variability of soil characteristics and the parameters that were most important for adsorption. The results suggest that fines content (clay + silt) is more relevant to adsorption than only clay content, and the influence of organic matter was insignificant. Despite the suitable adsorption capacity, future tests are necessary to verify the possibility of release of Pb and Cd back to the environment as a result of changes in pH, for instance, due to exposure to acid rain.
This paper contributes to the study of tropical soils and provides available and low-cost alternatives for environmental protection barriers to minimize potentially toxic metal contamination. Beyond the local issue, this research can be adopted as a model approach for other abandoned mining areas since the management of these areas is a global problem. However, our focus was on the chemical aspects. Future work is necessary to understand the geotechnical characteristics, such as Atterberg limits, compaction parameters, shear strength, and hydraulic conductivity. It is also recommended to study how plants and microbiota could contribute to the retention of potentially toxic metals and how bioremediation or phytoremediation could be associated with complementing the environmental strategy in the waste disposal area.

Supplementary Materials

The following supporting information can be downloaded at: https://www.mdpi.com/article/10.3390/su14095135/s1, Table S1: Information about soil samples. a Information retrieved from the Litoestratigrafic Units Map, database of the Geologic Service of Brazil–GEOSBG, 1:250000 (GEOSBG, 2021). b Information retrieved from Soil Maps, database of Brazilian Institute of Geography and Statistics–IBGE, 1:250000 (IBGE, 2021), according the Brazilian System of Soil Classification (EMBRAPA, 2018); Figure S1. X-ray Diffraction (XRD) of soil 1; Figure S2. X-ray Diffraction (XRD) of soil 2; Figure S3. X-ray Diffraction (XRD) of soil 3; Figure S4. X-ray Diffraction (XRD) of soil 4; Figure S5. X-ray Diffraction (XRD) of soil 5; Figure S6. X-ray Diffraction (XRD) of soil 6; Figure S7. X-ray Diffraction (XRD) of soil 7; Figure S8. X-ray Diffraction (XRD) of soil 8; Figure S9. X-ray Diffraction (XRD) of soil 9; Figure S10. X-ray Diffraction (XRD) of soil 10; Figure S11. X-ray Diffraction (XRD) of soil 11; Figure S12. X-ray Diffraction (XRD) of soil 12; Figure S13. X-ray Diffraction (XRD) of soil 13; Figure S14. Variation of the physicochemical parameters (pH, EC and Eh) measured during (A) Pb adsorption tests; (B) Cd adsorption tests.

Author Contributions

Conceptualization: J.P.M., V.G.S.R. and C.M.P.V.; Methodology: J.P.M. and V.G.S.R.; Investigation: J.P.M., V.G.S.R., C.M.P.V. and J.B.S.; Writing—original draft preparation: J.P.M.; Writing—review and editing: J.P.M., V.G.S.R. and C.M.P.V.; Resources: V.G.S.R.; Supervision, V.G.S.R. All authors have read and agreed to the published version of the manuscript.

Funding

The authors are grateful to the National Council for Scientific and Technological Development (CNPq) for providing a PhD scholarship (140124/2019-5) and Research Productivity Fellowship (310989/2020-5).

Data Availability Statement

Not applicable.

Conflicts of Interest

The authors declare no conflict of interest.

References

  1. Matschult, J.; Borba, R.; Deschamps, E.; Figueiredo, B.R.; Gabrio, T.; Schwenk, M. Human and Environmental contamination in the Iron Quadrangle, Brazil. Appl. Geochem. 2000, 15, 181–190. [Google Scholar] [CrossRef]
  2. Xiao, X.; Zhang, J.; Wang, H.; Han, X.; Ma, J.; Ma, Y.; Luan, H. Distribution and health risk assessment of potentially toxic elements in soils around coal industrial areas: A global meta-analysis. Sci. Total Environ. 2020, 713, 135292. [Google Scholar] [CrossRef] [PubMed]
  3. Kubier, A.; Wilkin, R.T.; Pichler, T. Cadmium in soils and groundwater: A review. Appl. Geochem. 2019, 108, 104388. [Google Scholar] [CrossRef]
  4. Kasemodel, M.C. Avaliação Integrada da Contaminação por Metais Potencialmente Tóxicos em Área de Disposição de Resíduo de Mineração de Chumbo—Adrianópolis (PR). Ph.D. Thesis, University of São Paulo, São Paulo, Brazil, 2017. [Google Scholar]
  5. Campos, B.G.; Cruz, A.C.F.; Buruaem, L.M.; Rodrigues, A.P.C.; Machado, W.T.V.; Abessa, D.M.S. Using a tiered approach based on ecotoxicological techniques to assess the ecological risks of contamination in a subtropical estuarine protected área. Sci. Total Environ. 2016, 544, 564–573. [Google Scholar] [CrossRef] [Green Version]
  6. Perina, F.C.; Abessa, D.M.S. Contamination and toxicity in a subtropical Estuarine Protected Area influenced by former mining activities. Ocean Coast. Res. 2020, 68, e20313. [Google Scholar] [CrossRef]
  7. Luo, X.; Wu, C.; Lin, Y.; Li, W.; Deng, M.; Tan, J.; Xue, S. Soil heavy metal pollution from Pb/Zn smelting regions in China and the remediation potential of biomineralization. J. Environ. Sci. 2022, 125, 662–677. [Google Scholar] [CrossRef]
  8. Bolan, N.; Kunhikrishnam, M.B.; Kumpiene, J.; Park, J.; Makino, T.; Kirkham, M.B.; Scheckel, K. Remediation of heavy metal(loid)s contaminated soils—To mobilize or to imobilize? J. Hazard Mater. 2014, 266, 141–166. [Google Scholar] [CrossRef]
  9. Sposito, G. The Surface Chemistry of Soils, 3rd ed.; University Press: Oxford, UK, 1984. [Google Scholar]
  10. Yong, R.N.; Mulligan, C.N. Natural and Enhanced Attenuation of Contaminants in Soils, 2nd ed.; Taylor & Francis: Boca Raton, FL, USA, 2019; 325p. [Google Scholar]
  11. Rowe, R.K.; Quigley, R.M.; Brachman, R.W.I.; Booker, J.R. Clayey Barrier Systems for Waste Disposal Facilities; Taylor & Francis: London, UK, 1995; 405p. [Google Scholar]
  12. Bonaparte, R.; Daniel, D.E.; Koerner, R.M. Assessment and Recommendations for Improving the Performance of Waste Containment Systems; United States Environmental protection Agency (USEPA): Cincinnati, OH, USA, 2002.
  13. Voudrias, E.A. The concept of a sorption chemical barrier for improving effectiveness of landfill liners. Waste Manag. Res. 2002, 20, 251–258. [Google Scholar] [CrossRef]
  14. Kassambara, A. Practical Guide to Principal Component Methods in R—Multivariative Analysis II. PCA, (M)CA, FAMD, MFA, HCPC, Factoextra, 1st ed.; Statistical Tools for High-Throughput Data Analysis (STHDA), 2017; 205p. [Google Scholar]
  15. Kassambara, A. Practical Guide to Cluster Analysis in R—Multivatiative Analysis, I. Unsupervised Machine Learning, 1st ed.; Statistical Tools for High-Throughput Data Analysis (STHDA), 2017; 187p. [Google Scholar]
  16. Gomes, J.B.V.; Curi, N.; Motta, P.E.F.; Ker, J.C.; Marques, J.J.G.S.M.; Schulze, D.G. Análise de componentes principais de atributos físicos, químicos e mineralógicos de solos do Bioma Cerrado. Rev. Bras. De Ciência Do Solo 2004, 28, 137–153. [Google Scholar] [CrossRef] [Green Version]
  17. Silva, S.A.; Lima, J.S.S.; Xavier, A.C.; Teixeira, M.M. Variabilidade espacial de atributos químcios de um latossolo vermelho-amarelo húmiuco cultivado com café. Rev. Bras. De Ciência Do Solo 2010, 34, 15–22. [Google Scholar] [CrossRef]
  18. Santi, A.L.; Amado, T.J.C.; Cherubin, M.R.; Martin, T.N.; Pires, J.L.; Flora, L.P.D.; Basso, C.J. Análise de componentes principais de atributos químicos e físicos do solo limitantes à produtividade de grãos. Pesqui. Agropecuária Bras. 2012, 47, 1346–1357. [Google Scholar] [CrossRef] [Green Version]
  19. Freitas, L.; Casagrande, J.C.; Oliveira, I.A.; Souza Junior, P.R.; Campos, M.C.C. Multivariative analyzes of soil chemical atributes for characterization of environments. Agro@mbiente On-Line 2014, 8, 155–164. [Google Scholar] [CrossRef] [Green Version]
  20. Oliveira, I.A.; Campos, M.C.C.; Freitas, L.; Soares, M.D.R. Caracterização de solos sob diferentes usos na região sul do Amazonas. Acta Amaz. 2015, 45, 1–12. [Google Scholar] [CrossRef] [Green Version]
  21. Kummer, L.; Melo, V.F.; Barros, Y.J.; Azevedo, J.C.R. Use of Principal Component Analysis for grouping soil samples based on particle size and chemical and mineralogical characteristics. Sci. Agrar. 2010, 11, 469–480. [Google Scholar]
  22. Kasapoe, R.W.; Amuah, E.E.Y.; Dankwa, P.; Ibrahim, K.; Mville, B.N.; Abubakari, S.; Bawa, N. Compositional and source patterns of potentially toxic elements (PTEs) in soils in southwestern Ghana using robust compositional contamination index (RCCI) and k-means cluster analysis. Environ. Chall. 2021, 5, 100248. [Google Scholar] [CrossRef]
  23. Xu, H.; Croot, P.; Zhang, C. Discovering hidden spatial patterns and their associations with controlling factors for pottentially toxic elements in topsoil using hot spot analysis and K-means clustering analysis. Environ. Int. 2021, 151, 106456. [Google Scholar] [CrossRef]
  24. Bosso, S.T.; Enzweiller, J. Evaluation of heavy metal removal from aqueous solution onto scolecite. Water Res. 2002, 36, 4795–4800. [Google Scholar] [CrossRef]
  25. Guimarães, V. Resíduos de Mineração e Metalurgia: Efeitos Poluidores em Sedimentos e Em Espécie Biomonitora Rio Ribeira de Iguap—SP. Ph.D. Thesis, University of São Paulo, São Paulo, Brazil, 2007. [Google Scholar]
  26. Kummer, L.; Melo, V.F.; Barros, Y.J.; Azevedo, J.C. Sequential extraction of lead and zinc from soils of heavy metal mining and processing area. Braz. J. Soils Sci. 2011, 35, 2005–2018. [Google Scholar]
  27. Kasemodel, M.C.; Lima, J.Z.; Sakamoto, I.K.; Varesche, M.B.A.; Rodrigues, V.G.S. Soil contaminantion assessment for Pb, Zn and Cd in a slag disposal área using the integration of geochemical and microbiological data. Environ. Monit. Assess. 2016, 188, 124. [Google Scholar] [CrossRef]
  28. Kasemodel, M.C.; Papa, T.B.R.; Sígolo, J.B.; Rodrigues, V.G.S. Assessment of the mobility, bioaccessibility, and ecological risk of Pb and Zn on a dirt road located in a former mining área—Ribeira Valley—Brazil. Environ. Monit. Assess. 2019, 191, 15. [Google Scholar] [CrossRef]
  29. Cruz, A.C.F.; Gusso-Choueri, P.; Araujo, G.S.; Campos, B.G.; Abessa, D.M. Levels of metals and toxicity in sediments from a Ramsar site influenced by former mining activities. Ecotoxicol. Environ. Saf. 2019, 171, 162–172. [Google Scholar] [CrossRef] [PubMed]
  30. Vedolin, M.C.; Trevizani, T.H.; Angeli, J.L.F.; Petti, M.A.V.; Figueira, R.C.L. Assessment of metal concentration in Goniopsis cruentata (Latreille, 1803) (Decapoda, Grapsidae) from two Brazilian mangroves under different anthropogenic influences. Reg. Stud. Mar. Sci. 2020, 36, 101305. [Google Scholar] [CrossRef]
  31. Araujo, G.S.; Cruz, A.C.F.; Gusso-Choueri, P.K.; Saint’pierre, T.D.; Hauser-Davis, R.A.; Martins, C.C.; Abessa, D.M.S. Sediment quality of a Ramsar site assessed by chemical and ecotoxicological approaches. Reg. Stud. Mar. Sci. 2020, 35, 101145. [Google Scholar] [CrossRef]
  32. Salgado, L.D.; Marques, A.E.M.L.; Kramer, R.D.; Oliveira, F.G.; Moretto, S.L.; Lima, B.A.; Prodocimo, M.M.; Cestari, M.M.; Azevedo, J.C.R.; Assis, H.C.S. Sediment contamination and toxic effects on Violet Goby fish (Gobioides broussonnetii—Gobiidae) from a marine protected área in South Atlantic. Environ. Res. 2021, 195, 110308. [Google Scholar] [CrossRef]
  33. Gutierrez, M.; Mickus, K.; Camacho, L.M. Abandoned Pb-Zn mining wastes and their mobility as proxy to toxicity: A review. Sci. Total Environ. 2016, 5656, 392–400. [Google Scholar] [CrossRef]
  34. Cornelissen, H.; Watson, I.; Adam, E.; Malefetse, T. Challenges and strategies of abandoned mine rehabilitation in South Africa: The case of asbestos mine rehabilitation. J. Geochem. Explor. 2019, 205, 106354. [Google Scholar] [CrossRef]
  35. Reyes, A.; Cuevas, J.; Fuentes, B.; Fernandez, E.; Arce, W.; Guerrero, M.; Leteller, M.V. Distribution of toxic elements in soils surrounding abandoned mining waste located in Taltal, Northern Chile. J. Geochem. Explor. 2021, 220, 106653. [Google Scholar] [CrossRef]
  36. Langmuir, D. Aqueous Environmental Geochemistry; Prentice Hall: Hoboken, NJ, USA, 2018. [Google Scholar]
  37. Mohamed, A.-M.O.; Paleologos, E.K.; Rodrigues, V.G.S.; Singh, D.N. Fundamentals of Geoenvironmental Engineering: Understanding Soil, Water, and Pollutant Interaction and Transport; Butterworth-Heineman: Oxford, UK, 2018. [Google Scholar]
  38. Vettorazi, C.A.; Angulo Filho, R. Caracterização de Solos do Vale do Ribeira de Iguape no Estado de São Paulo através de Índices de relevo. ESA Luiz Queiroz 1986, 43, 517–536. [Google Scholar] [CrossRef] [Green Version]
  39. Instituto Brasileiro de Geologia e Estatística (IBGE). Mapa Pedológico 1:250000. Folha Curitiba SG.22 e Folha Iguape SG.23. Available online: https://dados.gov.br/dataset/cren_pedologiasg23 (accessed on 3 September 2021).
  40. Marques, J.P. Caracterização Geológica-Geotécnica de Solo Residual de Eldorado Paulista (SP) Para uso Como Barreira Selante. Undergraduate Thesis, São Carlos School of Engineering, University of São Paulo, São Carlos, Brazil, 2014. [Google Scholar]
  41. Vaz, C.M.P.; Oliveira, J.C.M.; Reichardt, K.; Crestana, S.; Cruvinel, P.E.; Bacchi, O.O.S. Soil mechanical analysis through gamma ray attenuation. Soil Technol. 1992, 5, 319–325. [Google Scholar]
  42. Naime, J.M.; Vaz, C.M.P.; Macedo, A. Automated soil particle size analyzer based on gamma-ray attenuation. Comput. Eletron. Agric. 2001, 31, 295–304. [Google Scholar] [CrossRef]
  43. Empresa Brasileira De Pesquisa Agropecuári—EMBRAPA. Manual de Métodos de Análise de Solo; EMBRAPA: Rio de Janeiro, Brazil, 2011. [Google Scholar]
  44. Camargo, O.A.; Moniz, A.C.; Jorge, J.A.; Valadares, J.M.A.S. Métodos de Análise Química, Mineralógica e Física de Solos do Instituto Agronômico de Campinas; Instituto Agronômico: Campinas, Brazil, 2009. [Google Scholar]
  45. Raij, B.V.; Andrade, J.C.; Cantarella, H.; Quaggio, J.A. Análise Química Para Avaliação da Fertilidade de Solos Tropicais; Instituto Agronômico: Campinas, Brazil, 2001. [Google Scholar]
  46. Greg, S.J.; Sing, K.S.W. Adsorption, Surface Area and Porosity; Academic Press: London, UK, 1982; 313p. [Google Scholar]
  47. Poppe, L.J.; Paskevich, V.P.; Hathaway, J.C.; Blackwood, D.S. A Laboratory Manual for X-ray Powder Diffraction; United States Geological Survey (USGS) Report 01–041; United States Geological Survey (USGS): Woods Hole, MA, USA, 2002.
  48. Roy, W.R.; Krapac, I.G.; Chou, S.F.J.; Griffin, R.A. Batch Type Procedures for Estimating Soil Adsorption of Chemicals; United States Environmental Protection Agency (USEPA): Cincinnati, OH, USA, 1992.
  49. Benson, C.H.; Zhai, H.; Wang, X. Estimating Hydraulic Conductivity of Compacted Clay Liners. J Geotech. Eng. 1994, 120, 366–387. [Google Scholar] [CrossRef]
  50. Fageria, N.K.; Stone, L.F. Manejo da Acidez dos Solos de Cerrado e de Várzea do Brasil; Embrapa Arroz e Feijão: Santo Antônio de Goiás, Brazil, 1999. [Google Scholar]
  51. Silva, M.L.N.; Curi, N.; Marques, J.J.G.S.M.; Guilherme, L.R.G.; Lima, M.N. Ponto de efeito salino nulo e suas relações com propriedades mineralógicas e químicas de latossolos brasileiros. Pesqui. Agropecuária Bras. 1996, 31, 663–671. [Google Scholar]
  52. Braz, A.M.; Fernandes, A.R.; Ferreira, J.R.; Alleoni, L.R.F. Prediction of the distribution coefficients of metals in Amazonian soils. Ecotoxicol. Environ. Saf. 2013, 94, 212–220. [Google Scholar] [CrossRef]
  53. Soares, M.R.; Sarkis, J.E.S.; Alleoni, L.R.F. Proposal of new distribution coefficients (Kd) of potentially toxic elements in soils for improving environmental assessment in the State of São Paulo, southeastern Brazil. J. Environ. Manag. 2021, 285, 112044. [Google Scholar] [CrossRef] [PubMed]
  54. Marques, J.P.; Silva, E.A.F.; Patinha, C.; Kasemodel, M.C.; Rodrigues, V.G.S. Adsorption of lead (Pb) in weathered tropical soil (Ribeira Valley region—Brazil). Earth Sci. Res. J. 2019, 23, 385–395. [Google Scholar]
  55. Marques, J.P.; Rodrigues, V.G.S.; Raimondi, I.M.; Lima, J.Z.L. Increase in Pb and Cd Adsorption by the Application of Peat in a Tropical Soil. Water Air Soil Pollut. 2020, 231, 136. [Google Scholar] [CrossRef]
  56. Kabata-Pendias, A. Trace Elements in Soils and Plants, 4th ed.; CRC Press: Boca Raton, FL, USA, 2011. [Google Scholar]
  57. Sparks, D.L. Environmental Soil Chemistry; Academic Press: London, UK, 1995. [Google Scholar]
  58. Dick, D.P.; Novotny, E.H.; Dieckow., J.; Bayer, C. Química da matéria orgânica do solo. In Química e Mineralogia do Solo Parte II—Aplicações; Melo, V.F., Alleoni, L.R.F., Eds.; Sociedade Brasileira de Ciência do Solo (SBCS): Viçosa, Brazil, 2016. [Google Scholar]
  59. Rouquerol, J.; Avnir, D.; Fairbridge, C.W.; Everett, D.H.; Haynes, J.H.; Pernicone, N.; Ramsay, J.D.F.; Sing, K.S.; Unger, K.K. Recommendations for the characterization of Porous Solids. Pure Appl. Chem. 1994, 66, 1739–1758. [Google Scholar] [CrossRef]
  60. Mackenzie, R.C. The Differential Thermal Investigation of Clays; Mineralogical Society: London, UK, 1957. [Google Scholar]
  61. Grim, R.E. Clay Mineralogy; McGraw-Hil: New York, NY, USA, 1953. [Google Scholar]
  62. Schulze, D.G. An introduction to soil mineralogy. In Minerals in Soil Environments, 2nd ed.; Dixon, J.B., Weed, S.B., Eds.; Soil Science Society of America: Madison, WI, USA, 1989; pp. 11–34. [Google Scholar]
  63. Ronquim, C.C. Conceitos de Fertilidade do Solo e Manejo Adequado Para as Regiões Tropicais; Empresa Brasileira de Pesquisa Agropecuária: Campinas, Brazil, 2010. [Google Scholar]
  64. Fontes, M.P.F.; Gomes, P.C. Simultaneous competitive adsorption of heavy metals by the mineral matrix of tropical soils. J. Appl. Geochem. 2003, 18, 795–804. [Google Scholar] [CrossRef]
  65. Pierangeli, M.A.P.; Guilherme, L.R.G.; Curi, N.; Silva, M.L.N.; Oliveira, L.R.; Lima, J.M. Efeito do pH na adsorção-dessorção de chumbo em latossolos brasileiros. Rev. Bras. De Ciência Do Solo 2001, 25, 269–277. [Google Scholar] [CrossRef] [Green Version]
  66. Araújo, H.A.S. Estudo da Adsorção de Pb, Zn e Cd por Material Inconsolidado Transportado da Região do Vale do Ribeira (SP). Undergraduate Thesis, São Carlos School of Engineering, University of São Paulo, São Carlos, Brazil, 2015. [Google Scholar]
  67. Moreira, C. Adsorção Competitiva de Cádmio, Cobre, Níquel e Zinco em Solos. Master’s Thesis, Univeristy of São Paulo, Piracicaba, Brazil, 2004. [Google Scholar]
  68. Khodaverdillo, H.; Samadi, A. Batch equilibrium study on sorption, desorption, and immobilisation of cádmium in some semi-arid zone soils as affected by soil properties. Soil Res. 2011, 49, 444–454. [Google Scholar] [CrossRef]
  69. Nascimento, C.W.A.; Fontes, R.L.F. Correlação entre Características de Latossolos e Parâmetros de equações de Adsorção de Cobre e Zinco. Rev. Bras. De Ciência Do Solo 2004, 28, 965–971. [Google Scholar] [CrossRef] [Green Version]
Figure 1. Explanatory scheme of the methodology and approach used in this research.
Sustainability 14 05135 g001
Figure 2. Soil sample locations in the municipalities of Eldorado, Registro and Jacupiranga in Ribeira Valley (southeastern Brazil).
Sustainability 14 05135 g002
Figure 3. Soils collected in Ribeira Valley region (Brazil), identified with numbers from (113) according to the sample location.
Sustainability 14 05135 g003
Figure 4. Particle size distribution—Percentage of clay, silt, and sand in the soils from Ribeira Valley region (Brazil).
Sustainability 14 05135 g004
Figure 5. Thermal Differential Analysis (TDA) of the soils (113) (soil samples passed a 400# sieve and were put in an oven at 50–60 °C for 24 h).
Sustainability 14 05135 g005
Figure 6. Adsorption of Pb and Cd by the soils in monoelementary systems, (A) Percentage of Pb and Cd adsorbed by each soil; (B) Pb and Cd adsorbed capacity in µg g−1.
Sustainability 14 05135 g006
Figure 7. Pearson’s correlation matrix for soil characteristics and Pb and Cd adsorption capacity (significance level p lower than or equal to 5%). pH: pH measured in deionized water; Eh: oxidation-reduction potential; EC: electric conductivity; %clay: percentage of clay in the particle size distribution; %silt: percentage of silt in the particle size distribution; %sand: percentage of sand in the particle size distribution; C: carbon content; CEC: Cation exchange capacity; SSA: Specific surface area; Vpores: Total pore volume; Dpores: Average diameter of the soil pores; qePb: Pb adsorption capacity; qeCd: Cd adsorption capacity. Red numbers depict negative correlations, and blue numbers depict positive correlations. Only correlations with a significance level (p) lower than or equal to 5% were considered. The numbers crossed out with an X are the correlations that showed higher p values.
Sustainability 14 05135 g007
Figure 8. Variables correlation circle of Principal Component Analysis.
Sustainability 14 05135 g008
Figure 9. Distribution of the 13 soils in the factor map of Principal Component Analysis.
Sustainability 14 05135 g009
Figure 10. Cluster analysis of the 13 soils.
Sustainability 14 05135 g010
Table 1. Physicochemical parameters and carbon (C) contents of the soils.
SoilpHH2OpHKClΔpHEh (mV)EC (µS cm−1)C (%)
14.4 ± 0.33.9 ± 0.0−0.4 ± 0.3+370.2 ± 30.2107.8 ± 15.30.35 ± 0.03
25.0 ± 0.13.9 ± 0.0−1.0 ± 0.0+324.0 ± 5.486.2 ± 4.10.38 ± 0.01
34.7 ± 0.03.8 ± 0.0−0.9 ± 0.0+321.4 ± 5.498.3 ± 14.20.34 ± 0.01
44.7 ± 0.13.7 ± 0.0−0.9 ± 0.1+368.9 ± 10.762.5 ± 8.5<DL
54.6 ± 0.03.8 ± 0.0−0.7 ± 0.0+376.1 ± 7.367.1 ± 5.7<DL
64.3 ± 0.13.8 ± 0.0−0.5 ± 0.0+390.0 ± 1.2143.5 ± 1.60.31
74.6 ± 0.03.8 ± 0.0−0.8 ± 0.0+376.6 ± 9.976.0 ± 4.0<DL
84.5 ± 0.13.9 ± 0.0−0.6 ± 0.0+349.7 ± 3.594.6 ± 6.0<DL
94.6 ± 0.13.7 ± 0.0−0.9 ± 0.2+371.2 ± 6.265.1 ± 2.10.58 ± 0.03
104.5 ± 0.03.9 ± 0.0−0.7 ± 0.0+360.1 ± 7.651.3 ± 5.2<DL
114.2 ± 0.03.8 ± 0.0−0.5 ± 0.0+353.2 ± 3.7113.2 ± 6.9<DL
124.2 ± 0.03.7 ± 0.0−0.5 ± 0.0+357.4 ± 6.2101.9 ± 1.80.39 ± 0.03
134.6 ± 0.03.7 ± 0.0−1.0 ± 0.0+333.3 ± 3.061.1 ± 4.30.42 ± 0.03
pHH2O: pH measured in deionized water; pHKCl: pH measured in KCl 1M solution; ΔpH = (pHKCl-pHH2O); Eh: oxidation-reduction potential; EC: electric conductivity; DL: detection limit (0.3%).
Table 2. Potential acidity, sum of exchangeable bases, cation exchange capacity, specific surface area, pore volume, and average diameter of soil pores.
SoilH + Al
(mmolc dm−3)
SB
(mmolc dm−3)
CEC
(mmolc dm−3)
SSA
(m2 g−1)
Vpores
(cm3 g−1)
Dpores
(A)
150.3 ± 2.92.4 ± 0.152.7 ± 3.013.230.022315.6
258.0 ± 0.03.2 ± 1.061.2 ± 1.015.890.093433.6
356.0 ± 3.51.7 ± 0.057.7 ± 3.59.220.037178.4
4125.7 ± 8.11.7 ± 0.0127.4 ± 8.111.810.026163.8
545.3 ± 2.92.0 ± 0.647.3 ± 2.611.010.024150.6
628.0 ± 3.01.5 ± 0.629.5 ± 3.56.590.030279.3
738.0 ± 0.02.0 ± 0.540.7 ± 0.58.380.024218.2
854.0 ± 3.51.6 ± 1.055.6 ± 3.69.340.022213.8
9178.7 ± 11.00.6 ± 0.6179.3 ± 10.421.570.072161.1
1030.0 ± 1.70.3 ± 0.130.3 ± 1.85.680.015100.2
1150.3 ± 2.90.2 ± 0.050.5 ± 2.911.940.031156.7
12199.3 ± 24.80.4 ± 0.1199.8 ± 24.824.850.066148.8
13172.3 ± 11.01.3 ± 0.0173.6 ± 11.030.050.117193.6
H + Al: Potential acidity; SB: Sum of exchangeable bases; CEC: Cation exchange capacity; SSA: Specific surface area; Vpores: Total pore volume; Dpores: Average diameter of the soil pores.
Publisher’s Note: MDPI stays neutral with regard to jurisdictional claims in published maps and institutional affiliations.

