
Impact of COVID-19 on the Tourism Industry in Taiwan


Institute of National Development, National Taiwan University, Taipei 10617, Taiwan
*
Author to whom correspondence should be addressed.
Sustainability 2022, 14(8), 4864; https://doi.org/10.3390/su14084864
Submission received: 30 January 2022
/
Revised: 28 March 2022
/
Accepted: 14 April 2022
/
Published: 18 April 2022
(This article belongs to the Special Issue Economic and Social Consequences of the COVID-19 Pandemic)
Abstract
:The initial outbreak of the coronavirus disease 2019 (COVID-19) pandemic occurred at the end of 2019. Globally, the COVID-19 pandemic has halted the tourism industry, which is facing a critical moment of survival due to the government restrictions and tourism warnings in various countries. In Taiwan, despite effective epidemic prevention measures, the pandemic has significantly affected the country’s tourism industry, particularly the travel industry. This study provides an overview of the impact of COVID-19 on the travel industry and discusses the fiscal stimulus measures and vaccinations provided by the Taiwan government to ensure the sustainability of the tourism industry in Taiwan from the start of 2020 to the end of 2021.
1. Introduction
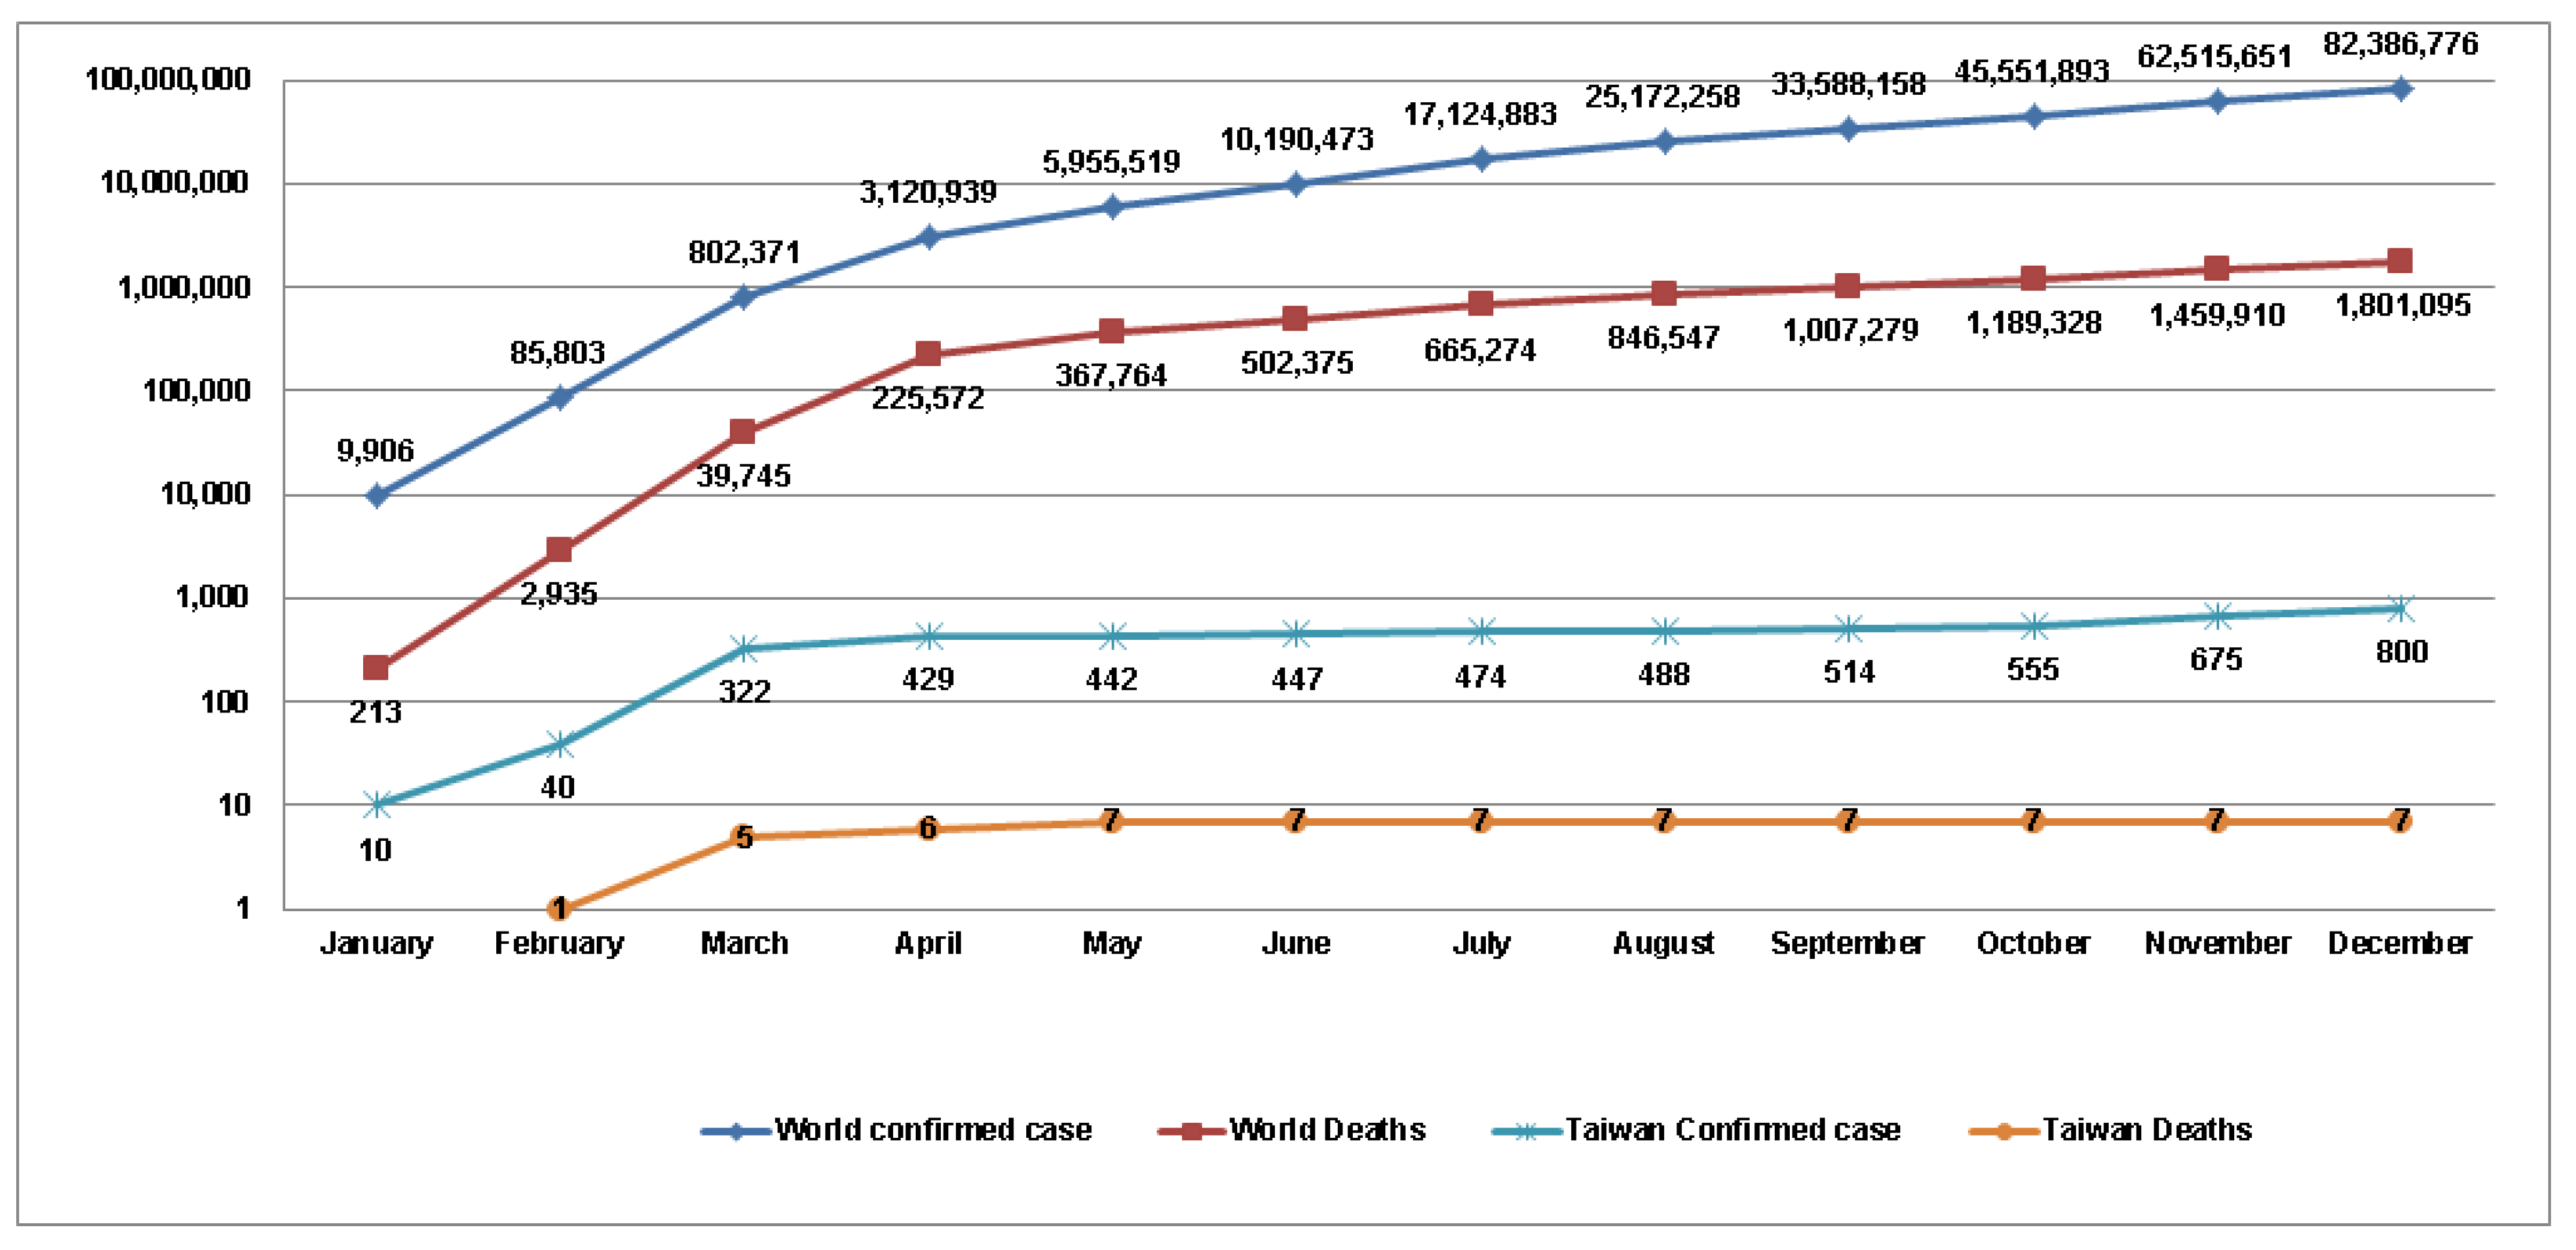
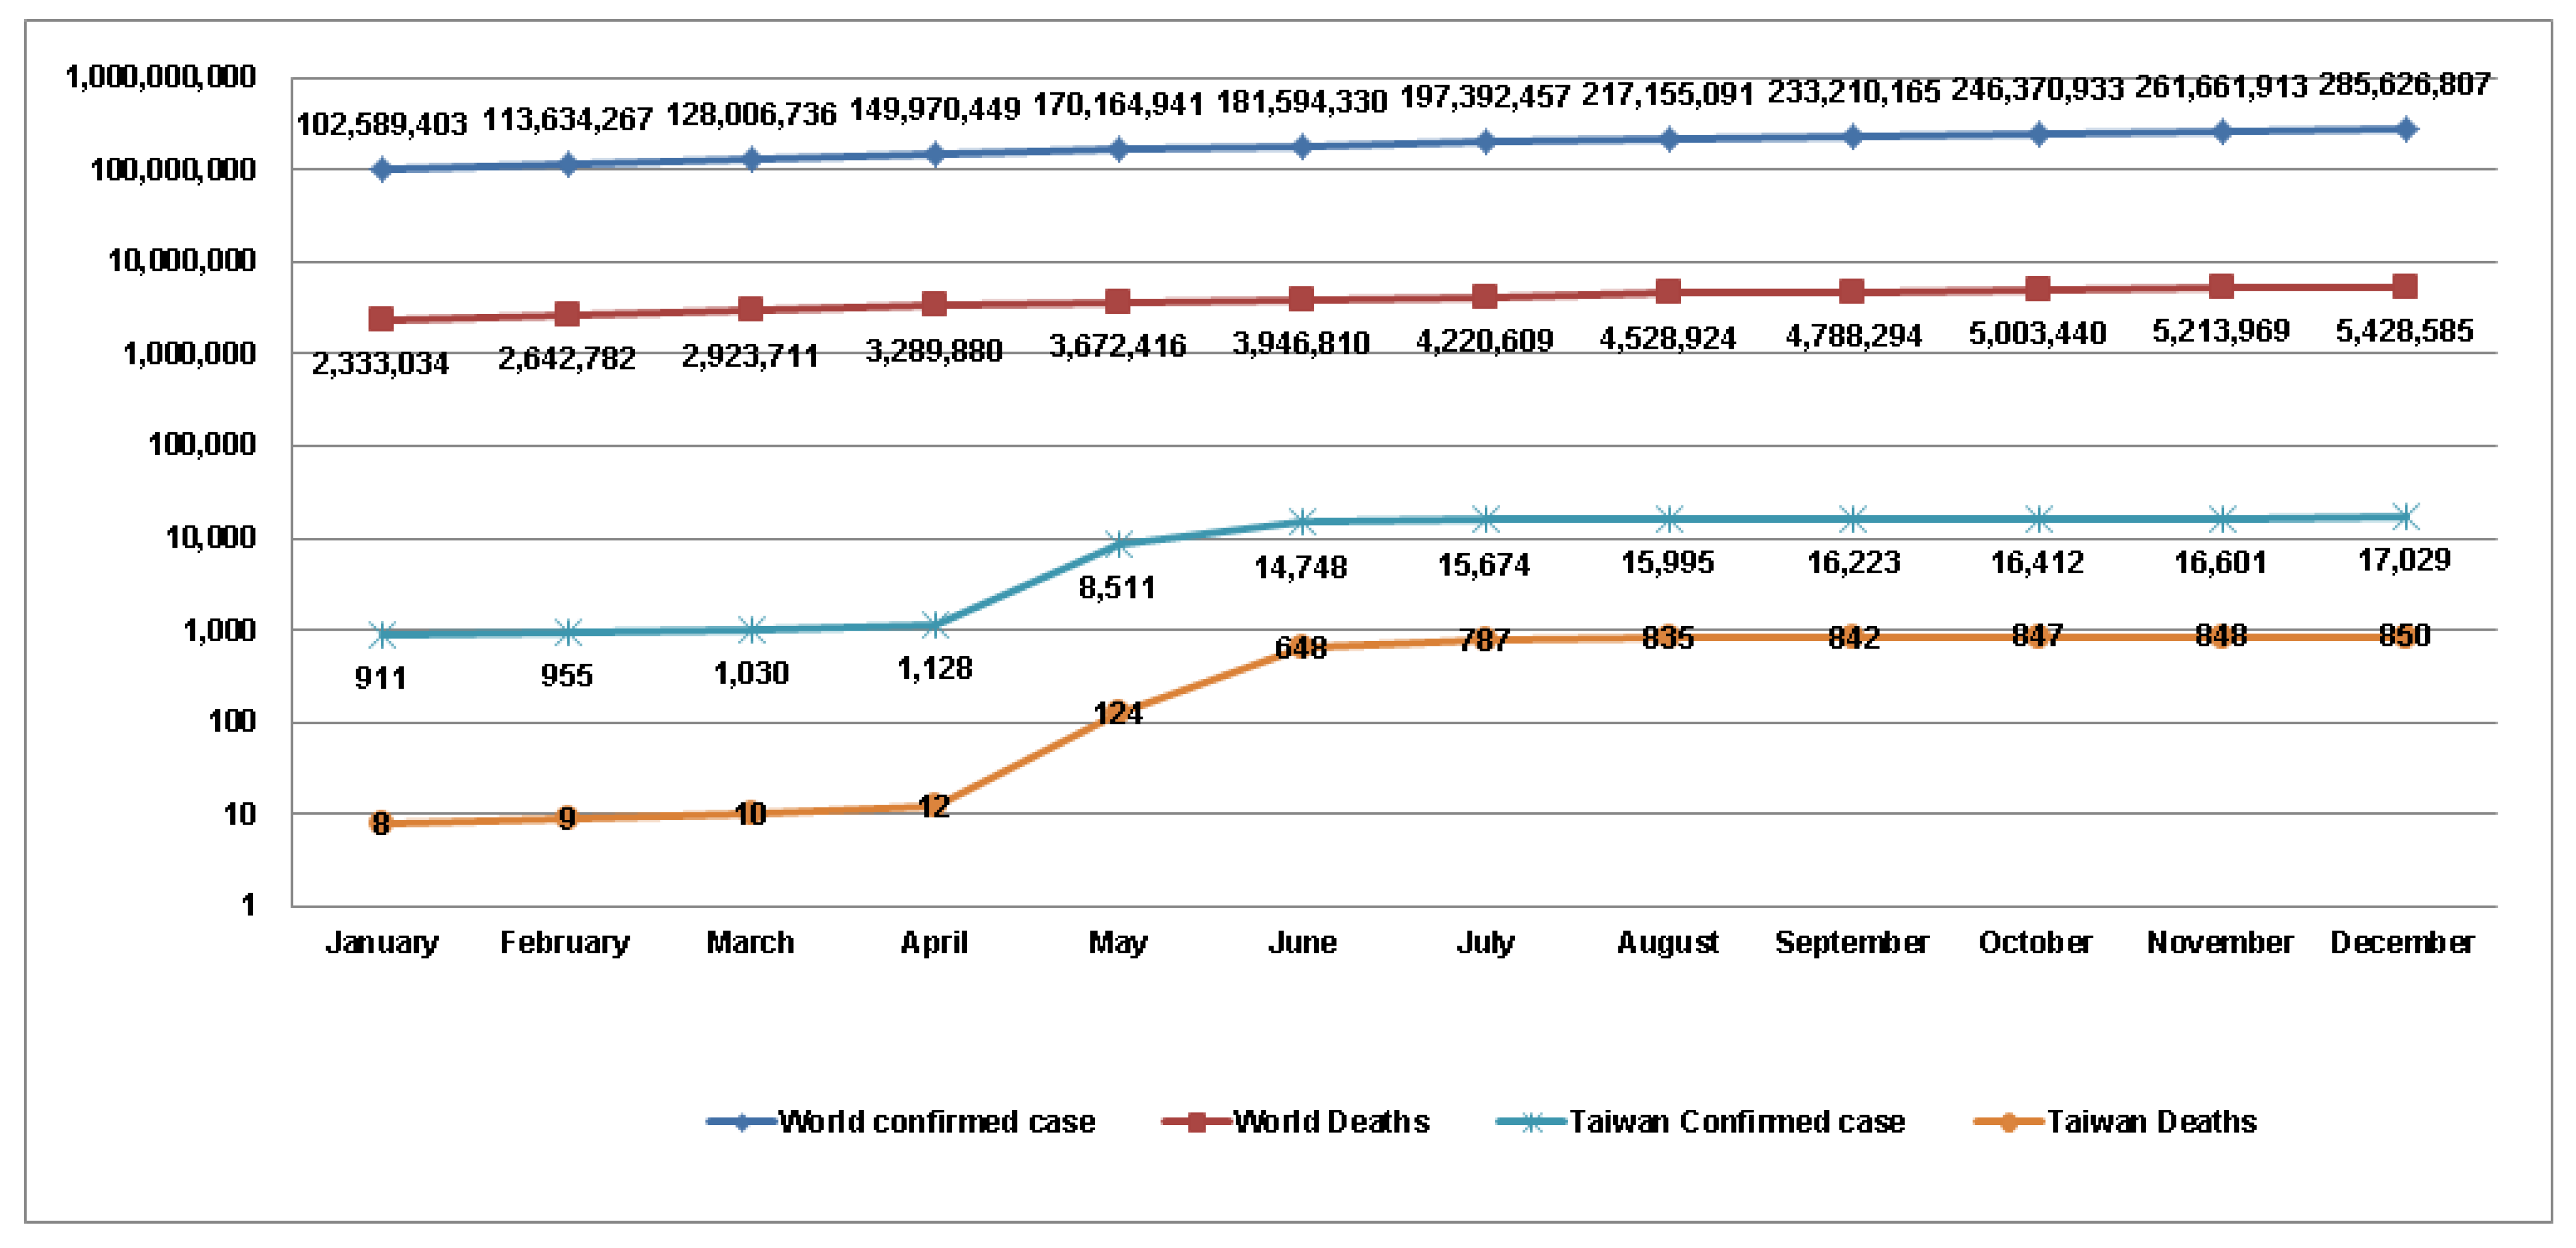
The first case of COVID-19 was reported in China in December 2019. Subsequently, the World Health Organization (WHO) declared the COVID-19 outbreak to be a public health emergency of international concern on 31 January 2020 [1]. On 21 January 2020, Taiwan confirmed its first COVID-19 case, which entered Taiwan on 20 January 2020 [2]. The patient was a 50-year-old woman living in southern Taiwan who had been working in Wuhan, China. Of a total population of approximately 23 million [3], Taiwan had reported 799 COVID-19 infections and 7 deaths by the end of 2020, then 17,029 COVID-19 infections and 850 deaths by the end of 2021 [4]. Of the total world population of approximately 7.733 billion in 2020 and 7.87 billion in 2021 [5], the WHO had reported 82,386,776 confirmed COVID-19 cases and 1,801,095 related deaths by the end of 2020, then 285,626,807 confirmed COVID-19 cases and 5,428,585 related deaths by the end of 2021 [6]. This study focusses on these statistics to assess whether the confirmed COVID-19 incidence rate and the death rate were lower in Taiwan than worldwide (see Table 1 and Table 2 and Figure 1 and Figure 2). However, the COVID-19 pandemic and COVID-19-related epidemic prevention measures have had a considerable impact on the tourism industry in Taiwan. The research motivations are that the tourism industry is facing a critical moment of survival and significant impact due to COVID-19 pandemic prevention measures, such as the government restrictions and tourism warnings of various countries. This necessitates the tourism industry’s sustainable development. According to the United Nations World Tourism Organization’s data, the number of international tourist arrivals in 2020 and 2021 had declined by 74% and 72%, respectively, compared with the pre-pandemic 2019 levels [7,8].
2. Literature Review
It has been more than 2 years since the COVID-19 epidemic broke out at the end of 2019. It has had a significant impact on the tourism industry. Research related to the COVID-19 epidemic’s impact on the tourism industry has been put forward. Some compares the impacts of COVID-19 to previous epidemic/pandemics and other types of global crises, and explores how the pandemic may change society, the economy, and tourism [9]. Some studies the experience of live virtual tours [10] or the public’s attitudes towards virtual tourism [11]. Some discuss the fact that governments have made available temporary financial support for tourism enterprises and workers [12], the role of the government and what public tourism policies have been implemented under the epidemic [13], or the government’s policy on tourism recovery [14]. Some explore the impact of regional cultural tourism [15], the impact of tourism consumption [16], the impact of tourists’ willingness to pay [17], or the tourism industry’s cash-driven resilience capabilities [18]. Conceptual models for managing tourism crises [19] or existing crisis disaster theories can explain the current tourism phenomenon [20]. Others discuss the public’s choice of domestic rural tourism [21,22], public views and responses to tourism demand [23,24], or residents’ travel expectations [25] during the epidemic.
Although the confirmed COVID-19 rate and death rate were lower in Taiwan than worldwide, COVID-19-related epidemic prevention measures have been enforced, such as border controls, blockades, isolation and travel warnings in various countries. This has had a significant impact on the tourism industry in Taiwan. This has meant that, in a country such as Taiwan, where the confirmed COVID-19 rate and death rate have been lower than those worldwide, it has still had a considerable impact on the tourism industry. This study provides an overview of the impact of COVID-19 on the travel industry, and discusses the fiscal stimulus measures and vaccinations provided by the Taiwan government to ensure the sustainability of the tourism industry in Taiwan from the beginning of 2020 to the end of 2021. We rely on and make reference to other research performed on the tourism industry in various countries around the world.
3. Materials and Methods
The American social scientist Yin (1994) pointed out that a case study is a kind of practical research [26]. It is mainly applicable in the study of phenomena or events in real life situations. The focus is on the why and how questions, and the researcher has no control over the events or the behavior of the subjects. Since this research focuses on the impact of COVID-19 on the tourism industry in Taiwan, it is suitable to perform a case study. This study combines literature research, official database analysis and direct observations. Therefore, on the whole, the purpose of case study is to conduct an in-depth discussion and analysis of the research phenomenon, rather than a hypothesis-testing analysis.
Research reliability refers to the dependability or consistency of research data analysis, and research validity refers to the truthfulness of research data analysis [27]. Triangulation, refers to the use of multiple methods or data sources to develop a comprehensive understanding of phenomena [28]. This study collects multiple data sources, which are checked and confirmed jointly by various researchers, refers to relevant literature data, and facilitates discussions and analyses among research teams during the research period from 2020 to 2021 to ensure the reliability and validity of this study.
The statistical method we used include descriptive statistics, comparative means, paired-sample T tests, and Cohen’s d and trend analyses. Descriptive statistics tests are used for describing or summarizing observation bases case. Comparative means and paired-sample T tests are for comparing the means of two variables in a single group and calculating the difference [29]. Cohen’s d is used to assess the degree of effect difference between means; effect sizes of 0.2, 0.5 and 0.8 represent small, medium and large effects, respectively [30]. Trend analysis is used to observe trends in relevant data over time. This study uses SPSS 25 and Excel to perform the related statistical analysis.
sample size;
= standard deviation of the differences between samples;
= estimated standard error of the mean;
p-value = 2 min{Pr(T ≥ t)|Ho, Pr(T ≤ t)|Ho};
If the p-value < 0.05, the difference is significant.
The Cohen’s d formula is as below:
= mean;
S = standard deviation;
n = number of subjects;
t = treatment condition;
c = comparison condition.
Cohen’s d values of 0.2, 0.5 and 0.8 represent small, medium and large effects, respectively.
4. Results and Discussion
4.1. Impact on the Tourism Industry
4.1.1. Impact on Tourism Worldwide
Although the end of 2019 marked the beginning of the COVID-19 outbreak, the resulting pandemic has not yet been completely mitigated and controlled; this has had a major impact on global economic and social activities, particularly in the tourism sector, which has been almost entirely suspended. According to United Nations World Tourism Organization data, the number of international cross-border passengers in 2020 had declined by 74% compared with that in 2019, with international tourism revenue loss amounting to approximately USD 1.3 trillion [7]. In 2020, the Asia-Pacific region was the first to be affected by the COVID-19 pandemic, which resulted in an 84% reduction in cross-border travelers, followed by Africa and the Middle East, with a 75% reduction, Europe with a 70% reduction, and the Americas with a 69% reduction. The number of international cross-border passengers in the first three quarters of 2021 had declined by 76% compared with that in the same period of 2019. Revenues from international tourism could reach USD 700–800 billion in 2021, a small improvement from 2020, but less than half the USD 1.7 trillion of 2019. [8].
The number of worldwide international passengers has been about 1 billion fewer in 2020–2021 than in 2019, due to an unprecedented fall in demand and widespread travel restrictions. This has had a significant impact on the world tourism industry so far.
4.1.2. Impact on Tourism in Taiwan
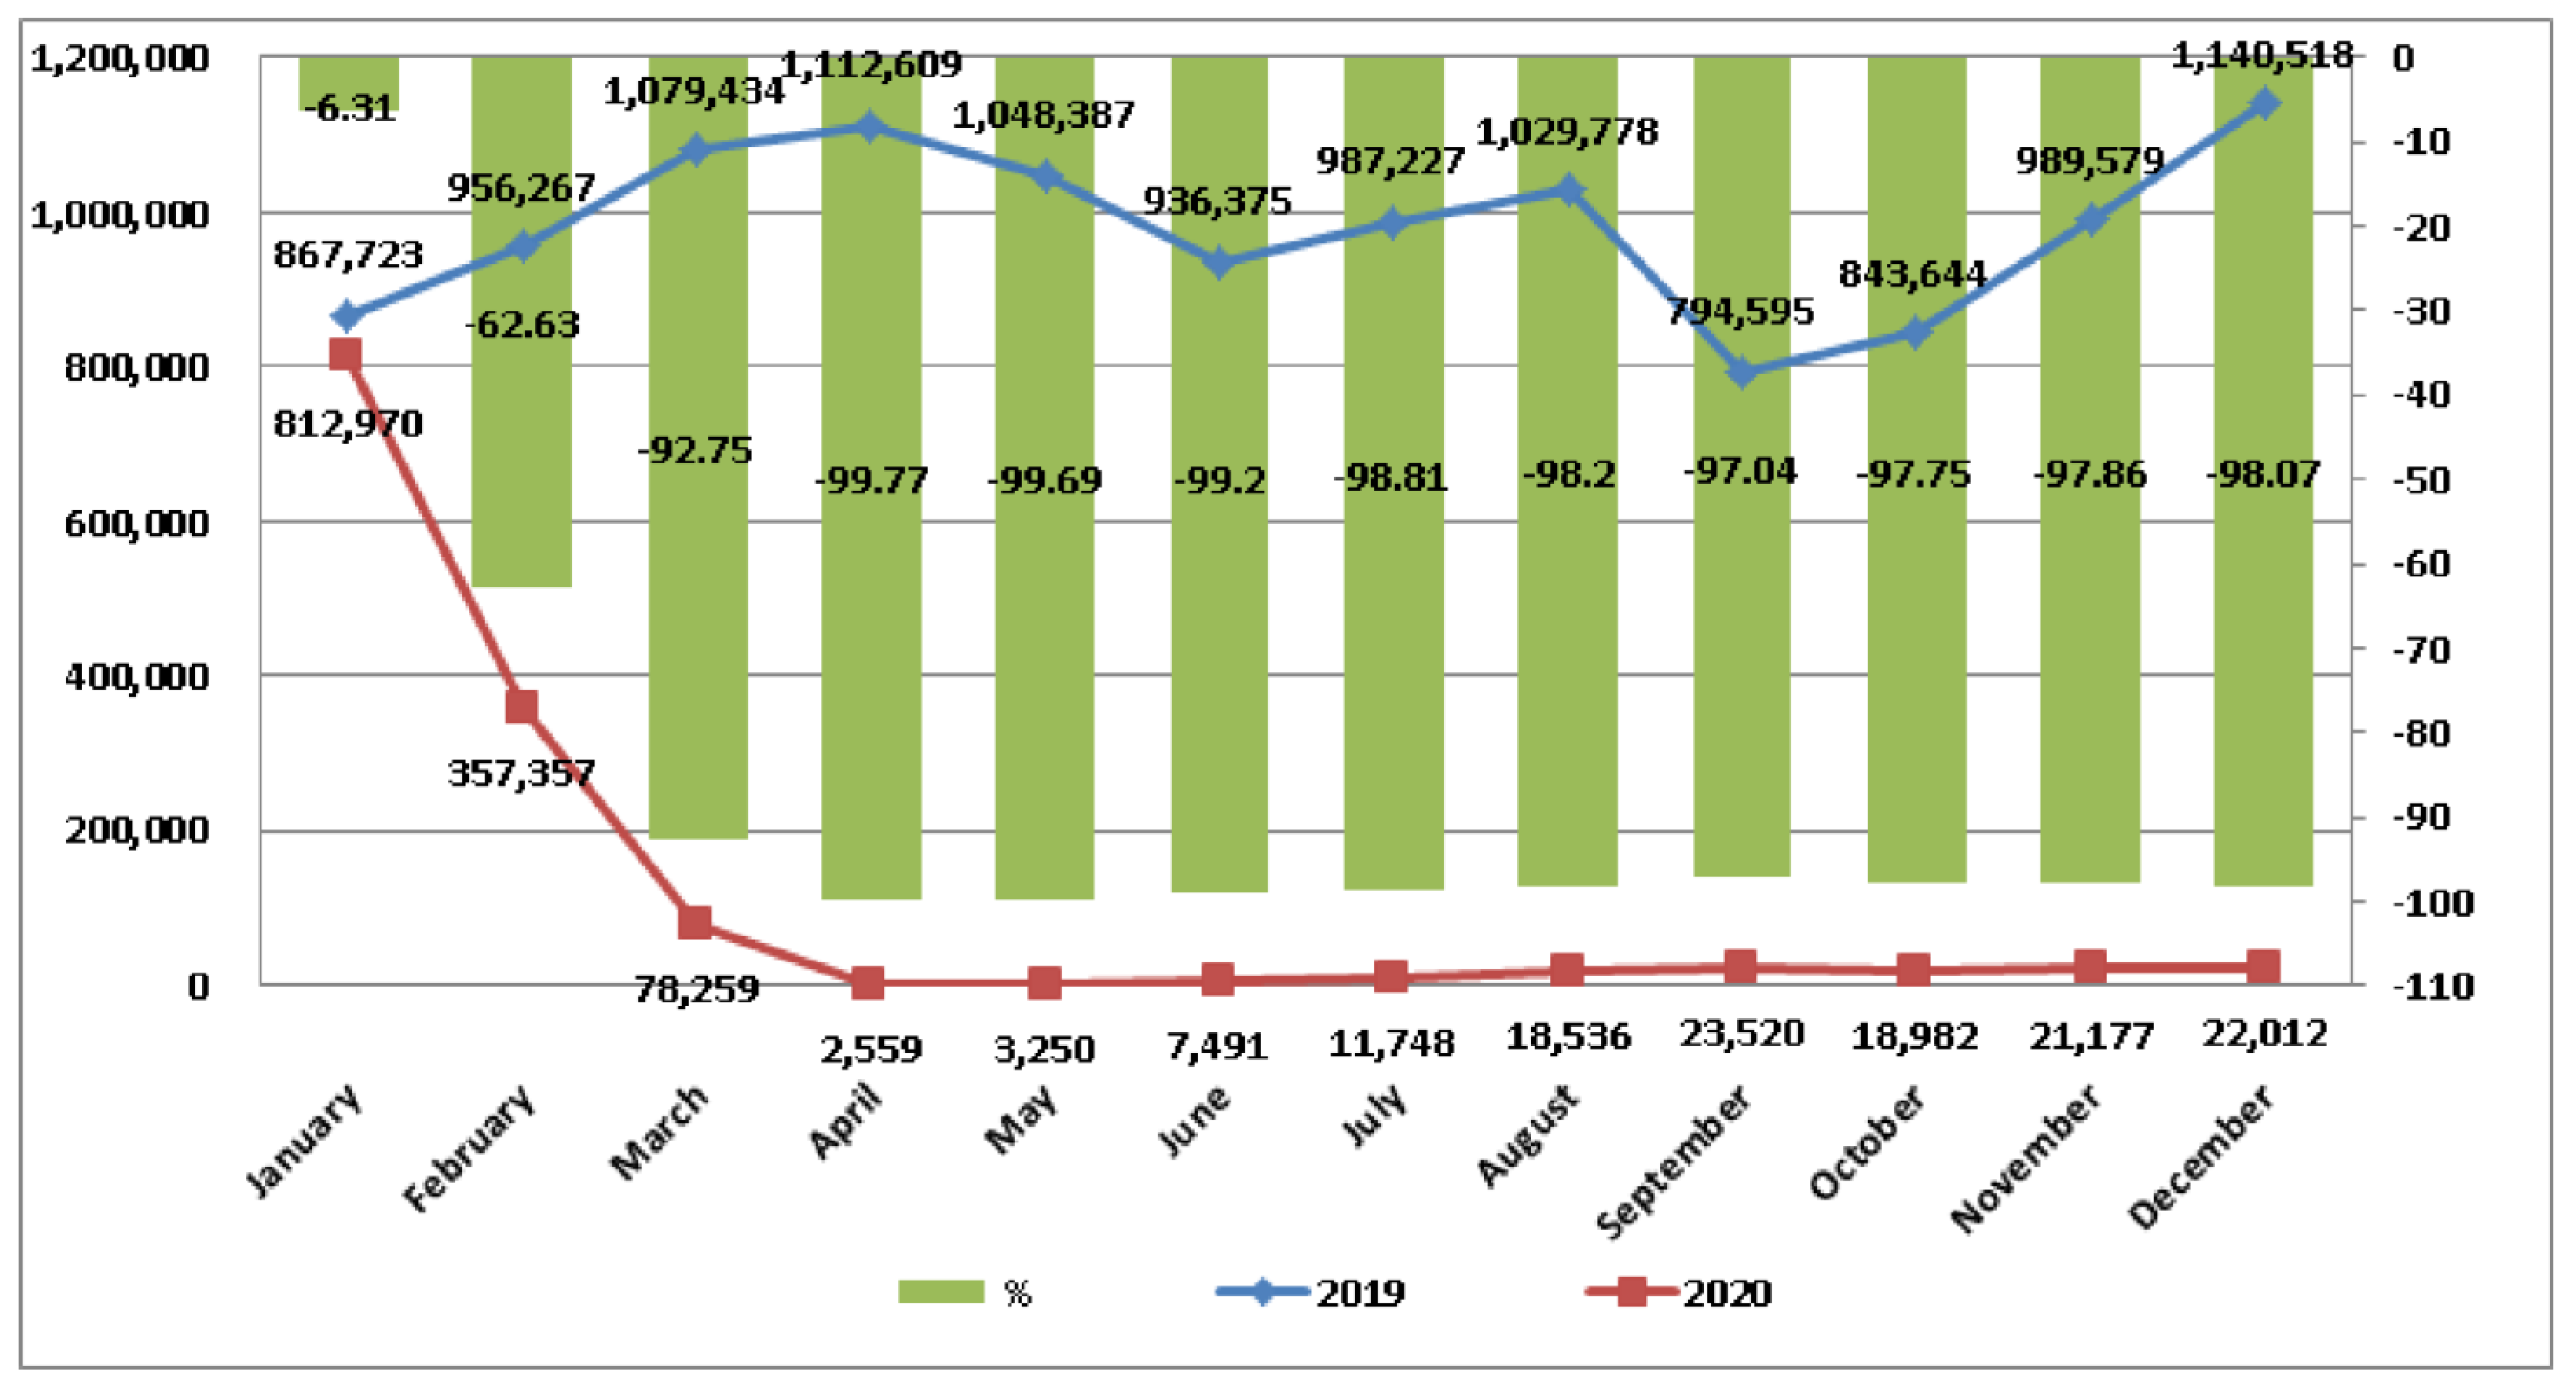
Before the outbreak of the COVID-19 pandemic, the influx of visitors to Taiwan was steady. However, after the outbreak of the COVID-19 pandemic, the number of inbound passengers has been decreasing. With an overview of the tourism market’s statistical database [33], this study analyzes the number of visitors entering Taiwan in January, February, March, April, May, June, July, August, September, October, November and December 2020, showing negative growth of 6.31%, 62.63%, 92.75%, 99.77%, 99.69%, 99.20%, 98.81%, 98.20%, 97.04%, 97.75%, 97.86%, and 98.07% compared with the trends for the same periods in 2019, respectively (see Table 3 and Figure 3). Bases on our statistical analysis, the p = 0.000000628 < 0.05 and Cohen’s d = 4.644 > 0.8. This is a significant difference with a large effect.
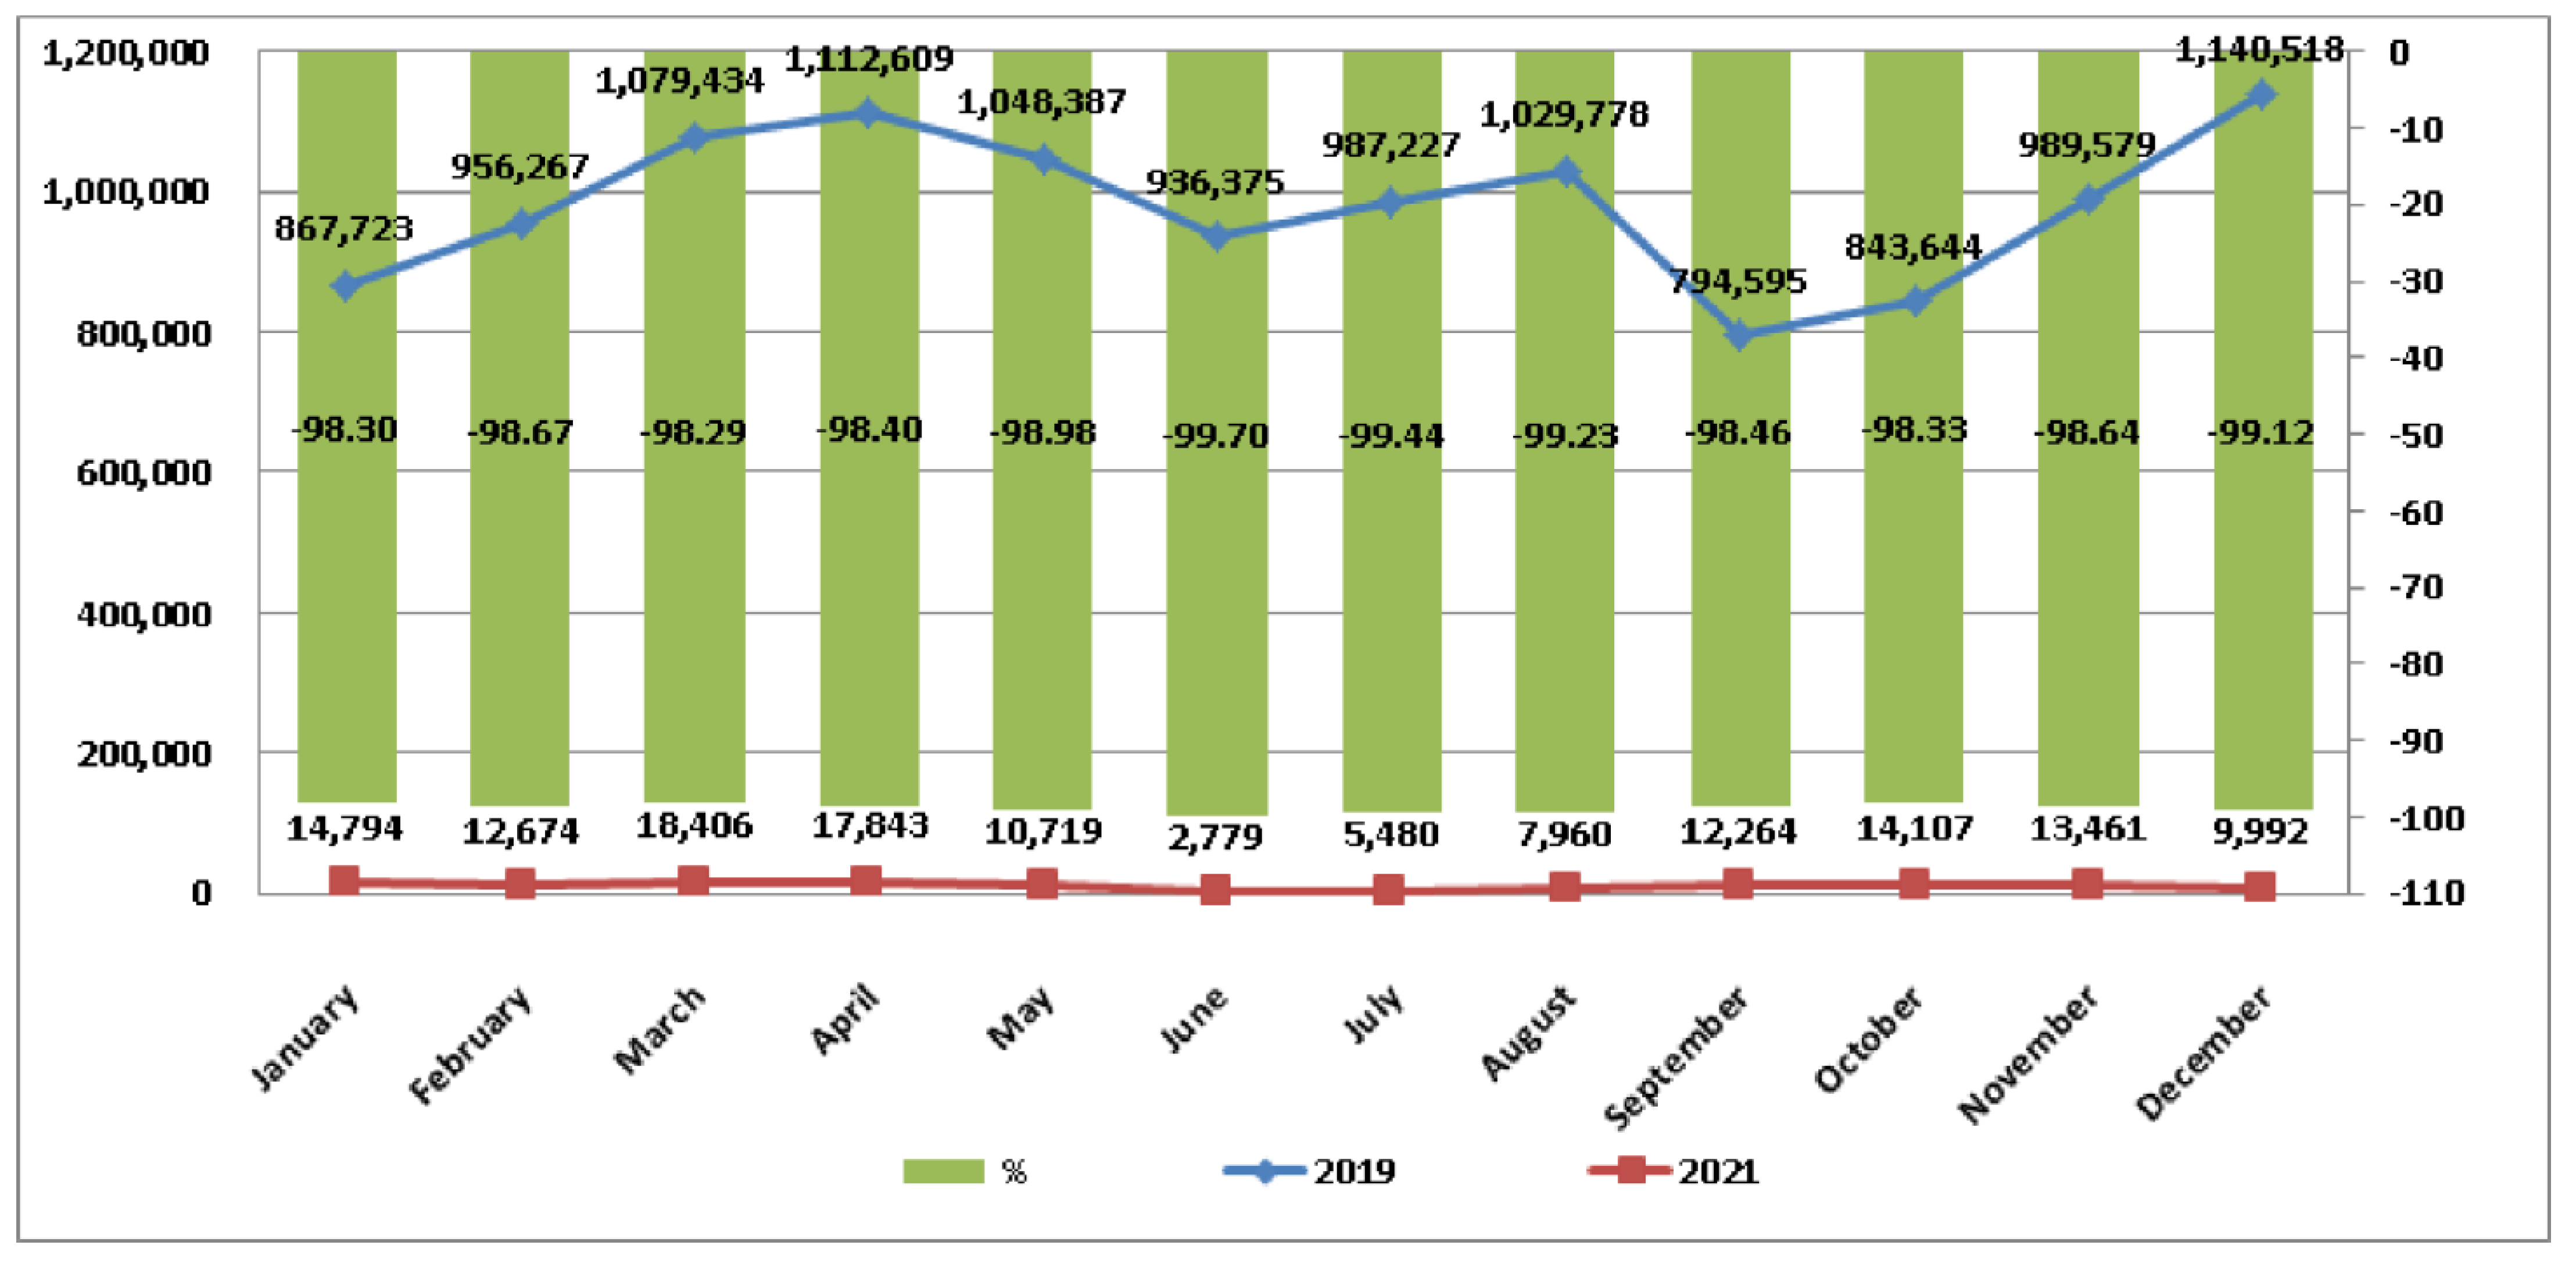
Via an overview of the tourism market’s statistical database [33], this study analyzes the number of visitors entering Taiwan in January, February, March, April, May, June, July, August, September, October, November and December 2021, displaying negative growth values of 98.30%, 98.67%, 98.29%, 98.40%, 98.98%, 99.70%, 99.44%, 99.23%, 98.46%, 98.33%, 98.64%, and 98.12%, respectively, compared with the trends for the same periods in 2019 (see Table 4 and Figure 4). Based on a statistical analysis, the p = 0.00000000000436 < 0.05 and Cohen’s d = 12.685 > 0.8. This is a significant difference with a large effect.
According to our overview of tourism market’s statistical database [33], the study analyzed the number of travelers who went abroad from Taiwan in January, February, March, April, May, June, July, August, September, October, November, and December 2020, displaying a negative growth of 8.66%, 58.93%, 92.75%, 99.21%, 98.80%, 98.84%, 98.22%, 97.45%, 97.70%,98.00%, 98.24%, and 98.29%, respectively, compared with the trends for the same periods in 2019 (see Table 5 and Figure 5). Based on our statistical analysis, the p = 0.00000169 < 0.05 and Cohen’s d = 4.02 > 0.8. This is a significant difference and a large effect.
With an overview of the tourism market’s statistical database [33], this study has analyzed the number of travelers who went abroad from Taiwan in January, February, March, April, May, June, July, August, September, October, November, and December 2021, with negative growth of 97.58%, 96.15%, 96.78%, 97.63%, 97.66%, 96.04%, 96.26%, 96.17%, 96.46%, 96.93%, 97.74%, and 97.66%, respectively, compared with the trends for the same periods in 2019 (see Table 6 and Figure 6). Based on our statistical analysis, the p = 0.000000000000107 < 0.05 and Cohen’s d = 17.265 > 0.8. This is a significant difference and a large effect.
After the outbreak of the COVID-19 pandemic, the number of visitors who entered Taiwan and the number of travelers who went abroad both significantly decreased, and there were large effects due to travel restrictions and concerns regarding contracting the disease. In March 2020, the United States, the European Union, and other major countries imposed travel restrictions and strengthened inbound controls. Finally, the travel rate declined by >90% globally, which significantly affected the tourism industry in Taiwan. Moreover, compared with the conditions seen during the SARS epidemic, the duration of the COVID-19 pandemic has been longer, accompanied by a greater decline in the number of travelers worldwide. Although some countries have gradually adjusted the ban throughout 2021, the numbers of people entering Taiwan and going aboard are still small because the mutation of the virus and the number of confirmed cases are still difficult to control.
4.2. Impact on the Travel Industry
The travel industry is a for-profit business, focused on designing and arranging travel plans and accommodations and providing other related services to domestic and foreign travelers. According to the tourism policy white paper from the Taiwan Ministry of Transport and Communication [34], Taiwan’s travel industry can be traced back to the “China Travel Service” company established in 1927; this company was renamed the “Taiwan China Travel Service” company in 1951. In May 1960, the Taiwan government opened the travel industry business to private citizens. On 1 January 1979, the Taiwan government began allowing Taiwanese citizens to travel abroad. The main goal of the early travel industry was to attract international tourists to Taiwan for recreation. In allowing domestic travelers to go abroad for recreation, Taiwan was converted to a two-way business model, serving both international tourists visiting Taiwan and Taiwanese travelers going abroad. The travel industry in Taiwan has since flourished.
The number of travel agencies in Taiwan increased from 2898 at the end of 2010 to 3982 by the end of 2019 [35]. However, due to the COVID-19 pandemic, this number had decreased by 48 by the end of 2020, and by 79 by the end of 2021. Figure 7 displays the trend in the numbers of Taiwanese travel agencies from 2010 to 2021.
According to an analysis of the accumulated revenue report database of the main listed travel agencies in Taiwan from January to December 2020 [36], “Lion Travel”, “Phoenix Tours”, “Richmond”, “Life Travel”, “Star Travel”, and “Ezfly” reported significant declines in revenue of 78.30%, 83.95%, 80.72%, 83.31%, 90.55%, and 56.43%, respectively, compared with the trends seen in the same periods in 2019 (see Table 7).
From January to December 2021 [36], “Lion Travel”, “Phoenix Tours”, “Richmond”, “Life Travel”, “Star Travel”, and “Ezfly” reported significant declines in revenue of 94.16%, 95.15%, 96.08%, 98.25%, 97.11%, and 79.64%, respectively, compared with the trends seen in the same periods in 2019 (see Table 8).
Moreover, according to analyses of Taiwan’s Tourism Bureau database, the number of people employed in the travel industry significantly decreased from 43,019 in 2019 to 36,129 in 2020—a reduction of nearly 7000 employees within 1 year. This number then decreased from 43,019 in 2019 to 31,953 in 2021—a reduction of nearly 11,000 employees within 2 years. In summary, this indicates a significant impact on the travel industry in Taiwan.
4.3. Taiwan’s Fiscal Stimulus Package
The Taiwan government released several stimulus packages to provide respite to stakeholders severely affected by the pandemic, and particularly stakeholders in the tourism industry. Taiwan promulgated the “Special Act for Prevention, Relief and Revitalization Measures for Severe Pneumonia with Novel Pathogens” on 25 February 2020. On the basis of epidemic prevention and financing legal enforcement, the Executive Yuan compiled a budget of TWD 60 billion (Relief measures 1.0) in accordance with this special regulation. Then, an additional special budget of TWD 150 billion (Relief measures 2.0) was added in April, and about TWD 210 billion (Relief measures 3.0) was added in October 2020 [37]. A further additional special budget of about TWD 260 billion (Relief measures 4.0) was added in June 2021 [38]. The main fiscal stimulus packages included financing assistance, loan interest subsidies, tax incentives, tourism industry relief plans, and revitalization recovery plans.
The government provided TWD 750 billion in loans to assist enterprises and workers. These loans subsidized 40% of salaries for struggling enterprises on a monthly basis, helping individuals to avoid unemployment and helping the tourism industry to survive the financial crisis [37]. Table 9 lists the features of Taiwan’s main fiscal stimulus package for the tourism industry.
Accordingly, the travel industry is shifting toward domestic tourism in order to offset losses due to the lack of international tourists. To bolster domestic tourism, Taiwan’s Tourism Bureau has enacted several new measures. For example, travel agencies can apply for a subsidy of up to TWD 30,000 per travel group, for up to 35 groups; moreover, one night’s accommodation can be discounted by up to TWD 1000 per traveler [39].
4.4. The Actual Effect of Government Initiatives
A benefit evaluation has been performed on cases of subsidies given by the Ministry of Transportation to non-governmental organizations and individuals [40]. Through statistical analyses, this study summarizes the relevant effects on the tourism industry (see Table 10). There are about 2800 travel agencies whose employees’ salaries are subsidized, totaling approximately TWD 3175 million. This helps relieve the pressure of hiring employees in the tourism industry, and reduces unemployment, while enabling employees to maintain their work income and a certain quality of life. The government is subsidizing more than 400 travel agencies, with a total operating cost of approximately TWD 1024 million; this is enabling them to maintain their operations. The government is subsidizing about 3000 land value tax accounts, totaling about TWD 1450 million, which is reducing the industry’s tax burden. The government is subsidizing about 9500 tour guides (totaling about TWD 284 million) to prevent them from losing their jobs. The effect of government initiatives is to ensure the sustainability of the tourism industry in Taiwan.
The revitalization measures taken by various ministries and associations have effectively strengthened domestic consumer confidence and their willingness to maintain a positive cycle of demand in the domestic demand. This has involved the strict control of border risks, and the loosening of domestic restrictions. It has enabled 18.42 million domestic trips, and yielded tourism benefits of TWD 67.4 billion [37]. It has helped to alleviate unemployment and other significant issues in the tourism industry related to the COVID-19 pandemic.
Because of these measures, the number of travel agencies has only decreased by about 80, and the number of travel agency employees has only decreased by about 11,000, since the outbreak of the COVID-19 epidemic (from the start of 2020 to the end of 2021). This has eased the impact on the travel agency industry and enabled its survival.
4.5. The Stimulus Provided by Vaccination
Taiwan began vaccinating medical institution personnel on 22 March 2021, and vaccinations have since been arranged according to the order of priority. According to the COVID-19 vaccine statistics, as of 3 January 2022, first-dose vaccine coverage has reached 80%, and second-dose vaccine coverage has reached 69.3% [41]. In response to the severe domestic epidemic of COVID-19 and the lack of universal vaccination, Taiwan raised the national epidemic alert to its third level on 19 May 2021 [42]. As of 27 July 2021, it has been reduced to Level 2 [43]. With the increase in vaccination rate and the easing of the local epidemic, domestic tourism has gradually recovered. The number of tourists visiting major domestic tourist attractions increased from more than 3 million in June to more than 19 million in October [44]. This is because vaccination reduces the risk of severe illness or death, and increases people’s safety and confidence when traveling.
However, relevant anti-epidemic measures, such as border control, wearing masks, etc., still continue. In order to effectively respond to the threat posed by the COVID-19 virus variant “Omicron”, and ensure medical and epidemic prevention capacity, the third dose of the COVID-19 vaccine has been available since 2 December 2021 in Taiwan [45]. As the virus continues to mutate, the effectiveness of existing vaccines requires further observation.
4.6. Discussion
Based on the above statistical and analytical results, this study provides several discussion points.
- The COVID-19 epidemic had a significant and large impact on tourism from 2019 to 2021. We can expect that the tourism industry will continue to be affected until the COVID-19 epidemic and its variants are under control.
- Taiwan’s main travel agencies’ revenues declined by about 80% in 2020, and by about 90% in 2021. However, it can see the “Ezfly” travel agency’s revenue only declined by about 56% in 2020, and by about 79% in 2021. It has mainly provided travel services through its website since 1999, and was the first provider of online travel services in Taiwan [46].
- The Taiwanese government provides a fiscal stimulus package for the tourism industry. The main purpose of this is to mitigate the impact of COVID-19, and make the travel industry sustainable. The number of travel agencies only decreased by 79 by the end of 2021, compare with the end of 2019. Some studies also confirm that the government’s financial measures or policies could help the tourism industry under epidemic conditions [10,11,12].
4.7. Research Limitations and New Lines
This research has certain limitations, mainly because the COVID-19 measures and impact-related data are based on Taiwan. Nevertheless, this study has provided background information regarding the COVID-19 pandemic, and examined the impact of the pandemic on Taiwan’s tourism industry, particularly the travel industry. In Taiwan, even though the confirmed COVID-19 rate and the death rate are lower than those worldwide, they have still had a considerable impact on the tourism industry. The Taiwanese government’s fiscal stimulus measures and vaccinations have ensured the sustainability of the tourism industry in Taiwan. Our findings are relevant to other tourism industries in various countries around the world.
Other lines of research can be pursued on this subject. It is recommended to conduct further research on other industries, such as the hotel industry, the transportation industry, the catering industry, etc. These are worthy of being studied, and the findings should be shared for everyone to make use of. In addition, surveys should be carried out on the public’s satisfaction with relevant government measures. This will help the government to contrast relevant policies and measures. In addition, the impacts of individual companies can also be studied on a case-by-case basis, illuminating why, for example, companies who provide online travel services have shown a revenue decline that is lower than others’.
5. Conclusions
This study provides background information regarding the COVID-19 pandemic, and examines the impact of the pandemic on Taiwan’s tourism industry, particularly the travel industry. The results indicate that COVID-19 has caused significant and adverse effects on Taiwan’s tourism industry, because tourists worldwide cancelled or delayed travel plans to Taiwan due to travel restrictions and concerns about contracting the disease. Although the confirmed COVID-19 rate and death rate are lower in Taiwan than elsewhere in the world, the tourism industry in Taiwan has been significantly affected. The research shows that the numbers of tourists who entered Taiwan and who went abroad from Taiwan in 2020 and 2021, respectively, are over 90% lower than those seen in 2019. The number of travel agencies in Taiwan was 3982 by the end of 2019, but this had decreased by 48 by the end of 2020, and by 79 by the end of 2021. The main travel agencies’ revenues declined by about 80% in 2020, and about 90% in 2021. The number of people employed in the travel industry significantly decreased, from 43,019 in 2019 to 31,953 in 2021—a reduction of nearly 11,000 employees within 2 years.
The Taiwan government has consequently released several fiscal stimulus packages, including financial assistance packages, loan interest subsidies, tax incentives, tourism industry relief plans, and revitalization recovery plans. These packages have been aimed at providing respite to stakeholders severely affected by the COVID-19 pandemic, and particularly those in the tourism industry. There are about 2800 travel agencies whose employees’ salaries are subsidized, with a total cost of approximately TWD 3175 million. This helps relieve the pressure of hiring employees in the tourism industry, and reduced unemployment. It also enables employees to maintain their work income and quality of life. The government subsidizes more than 400 travel agencies, with a total operating cost of approximately TWD 1024 million, helping them to maintain their operations and avoid closure. This has eased the impact on the travel agency industry and ensured its survival.
Moreover, the number of tourists has declined substantially due to various international travel restrictions. Despite recent improvements, the imbalances in worldwide vaccination rates and new COVID-19 strains could impact the already slow and fragile recovery. The Taiwanese government is focusing on the strict control of borders, the loosening of domestic restrictions, and increases in vaccination rates; as of 3 January 2022, first-dose vaccine coverage reached 80%, and second-dose vaccine coverage has reached 69.3%. As such, the travel industry has shifted its focus towards domestic tourism to offset the losses due to the lack of international tourists. To bolster domestic tourism, several measures have been taken, including travel subsidies and accommodation discounts, which have resulted in 18.42 million domestic trips; the tourism industry has been given TWD 67.4 billion to help alleviate unemployment and other significant effects caused by the COVID-19 pandemic. These fiscal stimulus measures, along with vaccination, have ensured the sustainability of Taiwan’s tourism industry.
Author Contributions
Conceptualization, methodology, supervision—H.-W.C.; methodology, literature review, database analysis, calculations, writing, and editing—C.-T.C. All authors have read and agreed to the published version of the manuscript.
Funding
This article was subsidized for English editing by the National Taiwan University under the Excellence Improvement Program for Doctoral Students (grant number 108-2926-I-002-002-MY4), sponsored by the Ministry of Science and Technology, Taiwan.
Institutional Review Board Statement
Not applicable.
Informed Consent Statement
Not applicable.
Data Availability Statement
The data presented in this study are available on request from the correspondence author.
Conflicts of Interest
The authors declare no conflict of interest.
References
- World Health Organization (WHO). Novel Coronavirus (2019-nCoV). 2020. Available online: https://www.who.int/emergencies/diseases/novel-coronavirus-2019 (accessed on 10 February 2020).
- Ministry of Health and Welfare (MOHW). In My Country, the First Case of Severe and Special Infectious Pneumonia Imported from Wuhan, China Was Immediately Detected through Boarding Quarantine. The Command Center Upgraded the Travel Epidemic Advice of Wuhan, China to the Third Level Warning. 2020. Available online: https://www.mohw.gov.tw/cp-4636-51189-1.html (accessed on 10 February 2020).
- Taiwan National Statistic. Population. 2021. Available online: https://www.stat.gov.tw/point.asp?index=9 (accessed on 25 December 2021).
- Centers for Disease Control (CDC). Taiwan National Infectious Disease Statistics System. 2022. Available online: https://nidss.cdc.gov.tw/nndss/disease?id=19CoV (accessed on 5 January 2022).
- United States Census Bureau. U.S. and World Population Clock. 2021. Available online: https://www.census.gov/popclock/ (accessed on 31 December 2021).
- World Health Organization (WHO). Coronavirus (COVID-19). 2022. Available online: https://covid19.who.int/ (accessed on 5 January 2022).
- United Nations World Tourism Organization (UNWTO). 2020: Worst Year in Tourism History with 1 Billion Fewer International Arrivals. 2021. Available online: https://www.unwto.org/news/2020-worst-year-in-tourism-history-with-1-billion-fewer-international-arrivals (accessed on 25 March 2022).
- United Nations World Tourism Organization (UNWTO). Tourism Grows 4% in 2021 but Remains Far below Pre-Pandemic Levels. 2022. Available online: https://www.unwto.org/taxonomy/term/347 (accessed on 25 March 2022).
- Gössling, S.; Scott, D.; Hall, C.M. Pandemics, tourism and global change: A rapid assessment of COVID-19. J. Sustain. Tour. 2020, 29, 1–20. [Google Scholar] [CrossRef]
- Mastroberardino, P.; Calabrese, G.; COrtese, F.; Petracca, M. New perspectives of experiential tourism: An exploratory analysis of live virtual tours during the COVID-19 outbreak. TQM J. 2021. [Google Scholar] [CrossRef]
- Zhang, S.N.; Li, Y.Q.; Ruan, W.Q.; Liu, C.H. Would you enjoy virtual travel? The characteristics and causes of virtual tourists’ sentiment under the influence of the COVID-19 pandemic. Tour. Manag. 2022, 88, 104429. [Google Scholar] [CrossRef]
- Williams, C.C. Impacts of the coronavirus pandemic on Europe’s tourism industry: Addressing tourism enterprises and workers in the undeclared economy. Int. J. Tour. Res. 2021, 23, 79–88. [Google Scholar] [CrossRef]
- Apaza-Panca, C.M.; Arevalo, J.; Maquera-Luque, P.J.; Ticona-Carrizales, L. Rethinking Tourism Public Policies to mitigate the effects of COVID-19. Cuest. Políticas 2020, 38, 119–133. [Google Scholar] [CrossRef]
- Shao, Y.H.; Hu, Z.Y.; Luo, M.Z.; Huo, T.T.; Zhao, Q.X. What is the policy focus for tourism recovery after the outbreak of COVID-19? A co-word analysis. Curr. Issues Tour. 2020, 24, 899–904. [Google Scholar] [CrossRef]
- Flew, T.; Kirkwood, K. The impact of COVID-19 on cultural tourism: Art, culture and communication in four regional sites of Queensland, Australia. Media Int. Aust. 2021, 178, 16–20. [Google Scholar] [CrossRef]
- Chung-Wei, K. Can We Return to Our Normal Life When the Pandemic Is under Control? A Preliminary Study on the Influence of COVID-19 on the Tourism Characteristics of Taiwan. Sustainability 2021, 13, 9589. [Google Scholar] [CrossRef]
- Chang-Young, J.; Hee-Won, Y. The Impact of the COVID-19 Pandemic on Tourists’ WTP: Using the Contingent Valuation Method. Int. J. Environ. Res. Public Health 2021, 18, 8605. [Google Scholar] [CrossRef]
- Wieczorek-Kosmala, M. A study of the tourism industry’s cash-driven resilience capabilities for responding to the COVID-19 shock. Tour. Manag. 2022, 88, 104396. [Google Scholar] [CrossRef]
- Herrera, M.R.G.; Hernandez, J.A.A.; Herrera, L.D.A.; Legarreta, J.M.L. Response to the Crisis Generated by the Covid-19 Pandemic in Tourism. From the Global to the Local: Ciudad Juarez (Mexico). Tur.-Estud. E Prat. 2020, 9, covidwho-755073. [Google Scholar]
- Zenker, S.; Kock, F. The coronavirus pandemic—A critical discussion of a tourism research agenda. Tour. Manag. 2020, 81, 104164. [Google Scholar] [CrossRef] [PubMed]
- Vaishar, A.; Stastna, M. Impact of the COVID-19 pandemic on rural tourism in Czechia Preliminary considerations. Curr. Issues Tour. 2020, 25, 187–191. [Google Scholar] [CrossRef]
- Hui, Z.; Fumin, D. How to Influence Rural Tourism Intention by Risk Knowledge during COVID-19 Containment in China: Mediating Role of Risk Perception and Attitude. Int. J. Environ. Res. Public Health 2021, 17, 3514. [Google Scholar] [CrossRef]
- Madani, A.; Boutebal, S.E.; Benhamida, H.; Bryant, C.R. The Impact of COVID-19 Outbreak on the Tourism Needs of the Algerian Population. Sustainability 2020, 12, 8856. [Google Scholar] [CrossRef]
- Chang-Young, J.; Hee-Won, Y. The structural changes of a local tourism network: Comparison of before and after COVID-19. Curr. Issues Tour. 2021, 24, 3324–3338. [Google Scholar] [CrossRef]
- Couto, G.; Castanho, R.; Pimentel, P.; Carvalho, C.; Sousa, A.; Santos, C. The Impacts of COVID-19 Crisis over the Tourism Expectations of the Azores Archipelago Residents. Sustainability 2020, 12, 7612. [Google Scholar] [CrossRef]
- Yin, R.K. Case Study Research: Design and Methods; Sage Publications: Thousand Oaks, CA, USA, 1994. [Google Scholar]
- Neuman, W.L. Social Research Methods: Qualitative and Quantitative Approaches; Allyn & Bacon: Boston, MA, USA, 2011. [Google Scholar]
- Denzin, N.K. Sociological Methods: A Sourcebook; McGraw-Hill: New York, NY, USA, 1978. [Google Scholar]
- IBM. SPSS Statistics. 2022. Available online: https://www.ibm.com/docs/zh-tw/spss-statistics/25.0.0?topic=tests-paired-samples-t-test (accessed on 6 February 2022).
- Cohen, J. Statistical Power Analysis for the Behavioral Sciences; Lawrence Erlbaum Associates: Hillsdale, NJ, USA, 1988. [Google Scholar]
- Kent State University. SPSS Tutorials: Paired Samples T Test. 2021. Available online: https://libguides.library.kent.edu/spss/pairedsamplesttest (accessed on 24 March 2022).
- Wikipedia. p-Value. 2022. Available online: https://en.wikipedia.org/wiki/P-value (accessed on 24 March 2022).
- Tourism Bureau. Overview of Tourism Market Statistics. 2022. Available online: https://admin.taiwan.net.tw/ActivitiesListC003320.aspx?appname=ActivitiesListC003320 (accessed on 29 January 2022).
- Taiwan Ministry of Transport and Communications (MOTC). Ministry of Transport Tourism Policy White Paper. 2020. Available online: https://twinfo.ncl.edu.tw/sgp/hypage.cgi?HYPAGE=search/detail.hpg&dtd_id=22&sysid=00002281 (accessed on 5 February 2021).
- Tourism Bureau. Statistics of the Number of Travel Industry. 2022. Available online: https://admin.taiwan.net.tw/FileUploadCategoryListC003330.aspx?CategoryID=b701d7ba-2e01-4d0c-9e16-67beb38abd2f&appname=FileUploadCategoryListC003330 (accessed on 29 January 2022).
- Taiwan Stock Exchange. Market Observation Post System. 2022. Available online: https://mops.twse.com.tw/mops/web/t05st10_ifrs (accessed on 25 January 2022).
- Executive Yuan. Outcomes of Relief Measures (1.0–3.0). 2021. Available online: https://www.ey.gov.tw/Page/5A8A0CB5B41DA11E/3910401a-4202-411a-9877-bba04d10a1df (accessed on 10 December 2021).
- Executive Yuan. Relief Measures (4.0). 2021. Available online: https://www.ey.gov.tw/Page/5A8A0CB5B41DA11E/190318be-c51b-43b5-91ba-5623b242335f (accessed on 10 December 2021).
- Tourism Bureau. Relief, Recovery and Revitalization Plan for the Tourism Industry in Response to COVID-19. 2020. Available online: https://admin.taiwan.net.tw/FileUploadCategoryListC003220.aspx?CategoryID=a5052129-4bc1-4e94-a835-47ba66c8c6e9&appname=FileUploadCategory5110 (accessed on 15 December 2020).
- Taiwan Ministry of Transport and Communications (MOTC). Subsidy. 2021. Available online: https://admin.taiwan.net.tw/FileUploadCategoryListC003400.aspx?CategoryID=5211aaef-40de-48e8-93c5-a0970442231c&appname=FileUploadCategory3406 (accessed on 15 December 2021).
- Centers for Disease Control (CDC). COVID-19 Vaccine Statistics. 2022. Available online: https://www.cdc.gov.tw/Category/Page/9jFXNbCe-sFK9EImRRi2Og (accessed on 25 January 2022).
- Centers for Disease Control (CDC). In Response to the Continuing Severity of the Local Epidemic, the Command Center will Raise the National Epidemic Alert to the Third Level from now until May 28. All Localities Have Simultaneously Tightened and Increased Epidemic Prevention Restrictions, and Strictly Adhered to Community Defense Lines. 2021. Available online: https://www.cdc.gov.tw/Bulletin/Detail/abDtRS-xzztQeAchjX9fqw?typeid=9 (accessed on 15 August 2021).
- Centers for Disease Control (CDC). The Command Center Lowered the Epidemic Alert Standard from July 27 to August 9 to the Second Level. People Are Requested to Continue to Cooperate with Epidemic Prevention Measures to Protect each other’s Health. 2021. Available online: https://www.cdc.gov.tw/Bulletin/Detail/e0v8zImE3rGJ0072A86NHA?typeid=9 (accessed on 15 August 2021).
- Taiwan Ministry of Transport and Communications (MOTC). Tourism Business Statistics. 2021. Available online: https://admin.taiwan.net.tw/FileUploadCategoryListC003330.aspx?Pindex=1&CategoryID=3afda5d8-b1ac-4bf4-b732-d2f35e37c7f2&appname=FileUploadCategoryListC003330 (accessed on 15 December 2021).
- Centers for Disease Control (CDC). In Response to the Outbreak of Omicron Variant Strains, People Who Have Been Fully Vaccinated against COVID-19 and Who Have Been Vaccinated for 5 Months Will Be Offered a Booster Dose of COVID-19 Vaccine from Now on. 2021. Available online: https://www.cdc.gov.tw/Bulletin/Detail/798cb1f2X8khkCiLzskCRA?typeid=9 (accessed on 25 January 2022).
- Ezfly. Company Profile. 2022. Available online: https://www.ezfly.com/info/ (accessed on 6 March 2022).
Figure 1.
The 2020 COVID-19 trends in Taiwan and worldwide.

Figure 2.
The 2021 COVID-19 trends in Taiwan and worldwide.

Figure 3.
Trend in the number of visitors who entered Taiwan in 2020 versus that in 2019.

Figure 4.
Trend in the number of visitors who entered Taiwan in 2021 versus that in 2019.

Figure 5.
Trend in the number of travelers who went abroad in 2020 versus that in 2019.

Figure 6.
Trend in the number of travelers who went abroad in 2021 versus that in 2019.

Figure 7.
Trend for the number of Taiwanese travel agencies over 2010–2021.


Table 1.
Number of COVID-19 cases in Taiwan and worldwide in 2020.
| World Cumulative Case | World Population (Per Million) | Taiwan Cumulative Case | Taiwan Population (Per Million) | |||||
|---|---|---|---|---|---|---|---|---|
| Date Reported: 2020 | Confirmed Case | Deaths | Confirmed Rate | Death Rate | Confirmed Case | Deaths | Confirmed Rate | Death Rate |
| January | 9906 | 213 | 1.281003492 | 0.027544291 | 10 | 0 | 0.434782609 | 0 |
| February | 85,803 | 2935 | 11.09569378 | 0.379542222 | 40 | 1 | 1.739130435 | 0.043478261 |
| March | 802,371 | 39,745 | 103.7593431 | 5.139661192 | 322 | 5 | 14 | 0.217391304 |
| April | 3,120,939 | 225,572 | 403.5870943 | 29.17005043 | 429 | 6 | 18.65217391 | 0.260869565 |
| May | 5,955,519 | 367,764 | 770.1434114 | 47.55773956 | 442 | 7 | 19.2173913 | 0.304347826 |
| June | 10,190,473 | 502,375 | 1317.790379 | 64.9650847 | 447 | 7 | 19.43478261 | 0.304347826 |
| July | 17,124,883 | 665,274 | 2214.519979 | 86.03051856 | 474 | 7 | 20.60869565 | 0.304347826 |
| August | 25,172,258 | 846,547 | 3255.173671 | 109.4720031 | 488 | 7 | 21.2173913 | 0.304347826 |
| September | 33,588,158 | 1,007,279 | 4343.483512 | 130.2572094 | 514 | 7 | 22.34782609 | 0.304347826 |
| October | 45,551,893 | 1,189,328 | 5890.584896 | 153.7990431 | 555 | 7 | 24.13043478 | 0.304347826 |
| November | 62,515,651 | 1,459,910 | 8084.268848 | 188.789603 | 675 | 7 | 29.34782609 | 0.304347826 |
| December | 82,386,776 | 1,801,095 | 10,653.92163 | 232.9102548 | 800 | 7 | 34.7826087 | 0.304347826 |
Note: Confirmed rate = confirmed case/population; death rate = deaths/population.
Table 2.
Number of COVID-19 cases in Taiwan and worldwide in 2021.
| World Cumulative Case | World Population (Per Million) | Taiwan Cumulative Case | Taiwan Population (Per Million) | |||||
|---|---|---|---|---|---|---|---|---|
| Date Reported: 2021 | Confirmed Case | Deaths | Confirmed Rate | Death Rate | Confirmed Case | Deaths | Confirmed Rate | Death Rate |
| January | 102,589,403 | 2,333,034 | 13,035.50229 | 296.4465057 | 911 | 8 | 39.60869565 | 0.347826087 |
| February | 113,634,267 | 2,642,782 | 14,438.91576 | 335.8045743 | 955 | 9 | 41.52173913 | 0.391304348 |
| March | 128,006,736 | 2,923,711 | 16,265.1507 | 371.5007624 | 1030 | 10 | 44.7826087 | 0.434782609 |
| April | 149,970,449 | 3,289,880 | 19,055.96557 | 418.0279543 | 1128 | 12 | 49.04347826 | 0.52173913 |
| May | 170,164,941 | 3,672,416 | 21,621.97471 | 466.6348158 | 8511 | 124 | 370.0434783 | 5.391304348 |
| June | 181,594,330 | 3,946,810 | 23,074.24778 | 501.5006353 | 14,748 | 648 | 641.2173913 | 28.17391304 |
| July | 197,392,457 | 4,220,609 | 25,081.63367 | 536.2908513 | 15,674 | 787 | 681.4782609 | 34.2173913 |
| August | 217,155,091 | 4,528,924 | 27,592.76887 | 575.4668361 | 15,995 | 835 | 695.4347826 | 36.30434783 |
| September | 233,210,165 | 4,788,294 | 29,632.80368 | 608.4236341 | 16,223 | 842 | 705.3478261 | 36.60869565 |
| October | 246,370,933 | 5,003,440 | 31,305.07408 | 635.7611182 | 16,412 | 847 | 713.5652174 | 36.82608696 |
| November | 261,661,913 | 5,213,969 | 33,248.01944 | 662.5119441 | 16,601 | 848 | 29.34782609 | 0.304347826 |
| December | 285,626,807 | 5,428,585 | 36,293.11398 | 689.7820839 | 17,029 | 850 | 34.7826087 | 0.304347826 |
Note: Confirmed rate = confirmed case/population; death rate = deaths/population.
Table 3.
Visitors inbound to Taiwan in 2019 and 2020.
| Month | 2019 | 2020 | % | |
|---|---|---|---|---|
| January | 867,723 | 812,970 | −6.31 | |
| February | 956,267 | 357,357 | −62.63 | |
| March | 1,079,434 | 78,259 | −92.75 | |
| April | 1,112,609 | 2559 | −99.77 | |
| May | 1,048,387 | 3250 | −99.69 | |
| June | 936,375 | 7491 | −99.2 | |
| July | 987,227 | 11,748 | −98.81 | |
| August | 1,029,778 | 18,536 | −98.2 | |
| September | 794,595 | 23,520 | −97.04 | |
| October | 843,644 | 18,982 | −97.75 | |
| November | 989,579 | 21,177 | −97.86 | |
| December | 1,140,518 | 22,012 | −98.07 | |
| Descriptive statistics: | ||||
| Year | Minimum | Maximum | Average | Standard Deviation |
| 2019 | 794,595 | 1,140,518 | 982,178 | 108,091 |
| 2020 | 2559 | 812,970 | 114,822 | 241,009 |
Note: Comparative means and paired-sample T test: p = 0.000000628 < 0.05. (α = 0.05). This is a significant difference. Cohen’s d = 4.644 > 0.8. This is a large effect. Value % = (2020 Value − 2019 Value)/2019 Value × 100%.
Table 4.
Visitors inbound to Taiwan in 2019 and 2021.
| Month | 2019 | 2021 | % | |
|---|---|---|---|---|
| January | 867,723 | 14,794 | −98.30 | |
| February | 956,267 | 12,674 | −98.67 | |
| March | 1,079,434 | 18,406 | −98.29 | |
| April | 1,112,609 | 17,843 | −98.40 | |
| May | 1,048,387 | 10,719 | −98.98 | |
| June | 936,375 | 2779 | −99.70 | |
| July | 987,227 | 5480 | −99.44 | |
| August | 1,029,778 | 7960 | −99.23 | |
| September | 794,595 | 12,264 | −98.46 | |
| October | 843,644 | 14,107 | −98.33 | |
| November | 989,579 | 13,461 | −98.64 | |
| December | 1,140,518 | 9992 | −99.12 | |
| Descriptive statistics: | ||||
| Year | Minimum | Maximum | Average | Standard Deviation |
| 2019 | 794,595 | 1,140,518 | 982,178 | 108,091 |
| 2021 | 2779 | 18,406 | 114,822 | 11,707 |
Note: Comparative means and paired-sample T test: p = 0.00000000000436 < 0.05. (α = 0.05). This is a significant difference. Cohen’s d = 12.685 > 0.8. This is a large effect. Value % = (2021 Value − 2019 Value)/2019 Value × 100%.
Table 5.
Travelers who went abroad from Taiwan in 2019 and 2020.
| Month | 2019 | 2020 | % | |
|---|---|---|---|---|
| January | 1,299,669 | 1,412,220 | 8.66 | |
| February | 1,468,739 | 603,211 | −58.93 | |
| March | 1,396,097 | 101,217 | −92.75 | |
| April | 1,413,671 | 11,168 | −99.21 | |
| May | 1,467,583 | 17,611 | −98.8 | |
| June | 1,573,190 | 18,249 | −98.84 | |
| July | 1,578,989 | 28,106 | −98.22 | |
| August | 1,481,804 | 37,786 | −97.45 | |
| September | 1,374,870 | 31,622 | −97.7 | |
| October | 1,519,500 | 30,390 | −98 | |
| November | 1,344,659 | 23,666 | −98.24 | |
| December | 1,188,187 | 20,318 | −98.29 | |
| Descriptive statistics: | ||||
| Year | Minimum | Maximum | Average | Standard Deviation |
| 2019 | 1,188,187 | 1,578,989 | 1,425,580 | 114,126 |
| 2020 | 11,168 | 1,412,220 | 114,822 | 194,630 |
Note: Comparative means and paired-sample T test: p = 0.00000169 < 0.05. (α= 0.05). This is a significant difference. Cohen’s d = 4.02 > 0.8. This is a large effect. Value % = (2021 Value − 2019 Value)/2019 Value × 100%.
Table 6.
Travelers who went abroad from Taiwan in 2019 and 2021.
| Month | 2019 | 2021 | % | |
|---|---|---|---|---|
| January | 1,299,669 | 20,969 | −98.39 | |
| February | 1,468,739 | 36,861 | −97.49 | |
| March | 1,396,097 | 34,733 | −97.51 | |
| April | 1,413,671 | 26,318 | −98.14 | |
| May | 1,467,583 | 24,495 | −98.33 | |
| June | 1,573,190 | 37,120 | −97.64 | |
| July | 1,578,989 | 36,951 | −97.66 | |
| August | 1,481,804 | 39,423 | −97.34 | |
| September | 1,374,870 | 28,132 | −97.95 | |
| October | 1,519,500 | 25,928 | −98.29 | |
| November | 1,344,659 | 22,401 | −98.33 | |
| December | 1,188,187 | 26,646 | −97.76 | |
| Descriptive statistics: | ||||
| Year | Minimum | Maximum | Average | Standard Deviation |
| 2019 | 1,188,187 | 1,578,989 | 1,425,580 | 114,126 |
| 2021 | 20,969 | 39,423 | 29,998 | 6549 |
Note: Comparative means and paired-sample T test: p = 0.000000000000107 < 0.05. (α = 0.05). This is a significant difference. Cohen’s d = 17.265 > 0.8. This is a large effect. Value % = (2021 Value − 2019 Value)/2019 Value × 100%.
Table 7.
Taiwan’s main travel agency revenue in 2019 and 2020.
| Travel Agency | 2019 | 2020 | % |
|---|---|---|---|
| Lion Travel | 30,160,396 | 6,545,203 | −78.30 |
| Phoenix Tours | 3,004,699 | 496,551 | −83.95 |
| Richmond | 5,160,082 | 994,747 | −80.72 |
| Life Travel | 6,303,998 | 1,052,255 | −83.31 |
| Star Travel | 1,696,772 | 160,292 | −90.55 |
| Ezfly | 975,051 | 424,819 | −56.43 |
Note: Value % = (2020 Value − 2019 Value)/2019 Value × 100%.
Table 8.
Taiwan’s main travel agencies’ revenue in 2019 and 2021.
| Travel Agency | 2019 | 2021 | % |
|---|---|---|---|
| Lion Travel | 30,160,396 | 1,762,421 | −94.16 |
| Phoenix Tours | 3,004,699 | 145,711 | −95.15 |
| Richmond | 5,160,082 | 202,102 | −96.08 |
| Life Travel | 6,303,998 | 109,981 | −98.25 |
| Star Travel | 1,696,772 | 49,003 | −97.11 |
| Ezfly | 975,051 | 198,567 | −79.64 |
Note: Value % = (2021 Value − 2019 Value)/2019 Value × 100%.
Table 9.
Taiwan’s main fiscal stimulus package for the tourism industry.
|
Table 10.
The actual effect of government initiatives for the tourism industry.
|
Publisher’s Note: MDPI stays neutral with regard to jurisdictional claims in published maps and institutional affiliations. |
© 2022 by the authors. Licensee MDPI, Basel, Switzerland. This article is an open access article distributed under the terms and conditions of the Creative Commons Attribution (CC BY) license (https://creativecommons.org/licenses/by/4.0/).
Share and Cite
MDPI and ACS Style
Chan, C.-T.; Chen, H.-W. Impact of COVID-19 on the Tourism Industry in Taiwan. Sustainability 2022, 14, 4864. https://doi.org/10.3390/su14084864
AMA Style
Chan C-T, Chen H-W. Impact of COVID-19 on the Tourism Industry in Taiwan. Sustainability. 2022; 14(8):4864. https://doi.org/10.3390/su14084864
Chicago/Turabian StyleChan, Ching-Tang, and Hsien-Wu Chen. 2022. "Impact of COVID-19 on the Tourism Industry in Taiwan" Sustainability 14, no. 8: 4864. https://doi.org/10.3390/su14084864
Note that from the first issue of 2016, this journal uses article numbers instead of page numbers. See further details here.