
Comprehensive Energy Consumption of Elevator Systems Based on Hybrid Approach of Measurement and Calculation in Low- and High-Rise Buildings of Tropical Climate towards Energy Efficiency

 ,
,  ,
,  ,
,
Abstract
:1. Introduction
1.1. Determination of Elevator Energy Consumption
1.2. Current Situation, Research Gaps, and the Aim of the Current Study
2. Methods
2.1. Characteristics of the Selected Buildings and the Elevator System
2.2. Field Data Collection
2.3. Elevator Energy Consumption Analysis
2.4. Elevator Energy Efficiency Analysis
2.5. Elevator Carbon Emissions Analysis
3. Results and Discussion
3.1. Energy Consumption and Energy Efficiency of the Elevator Systems
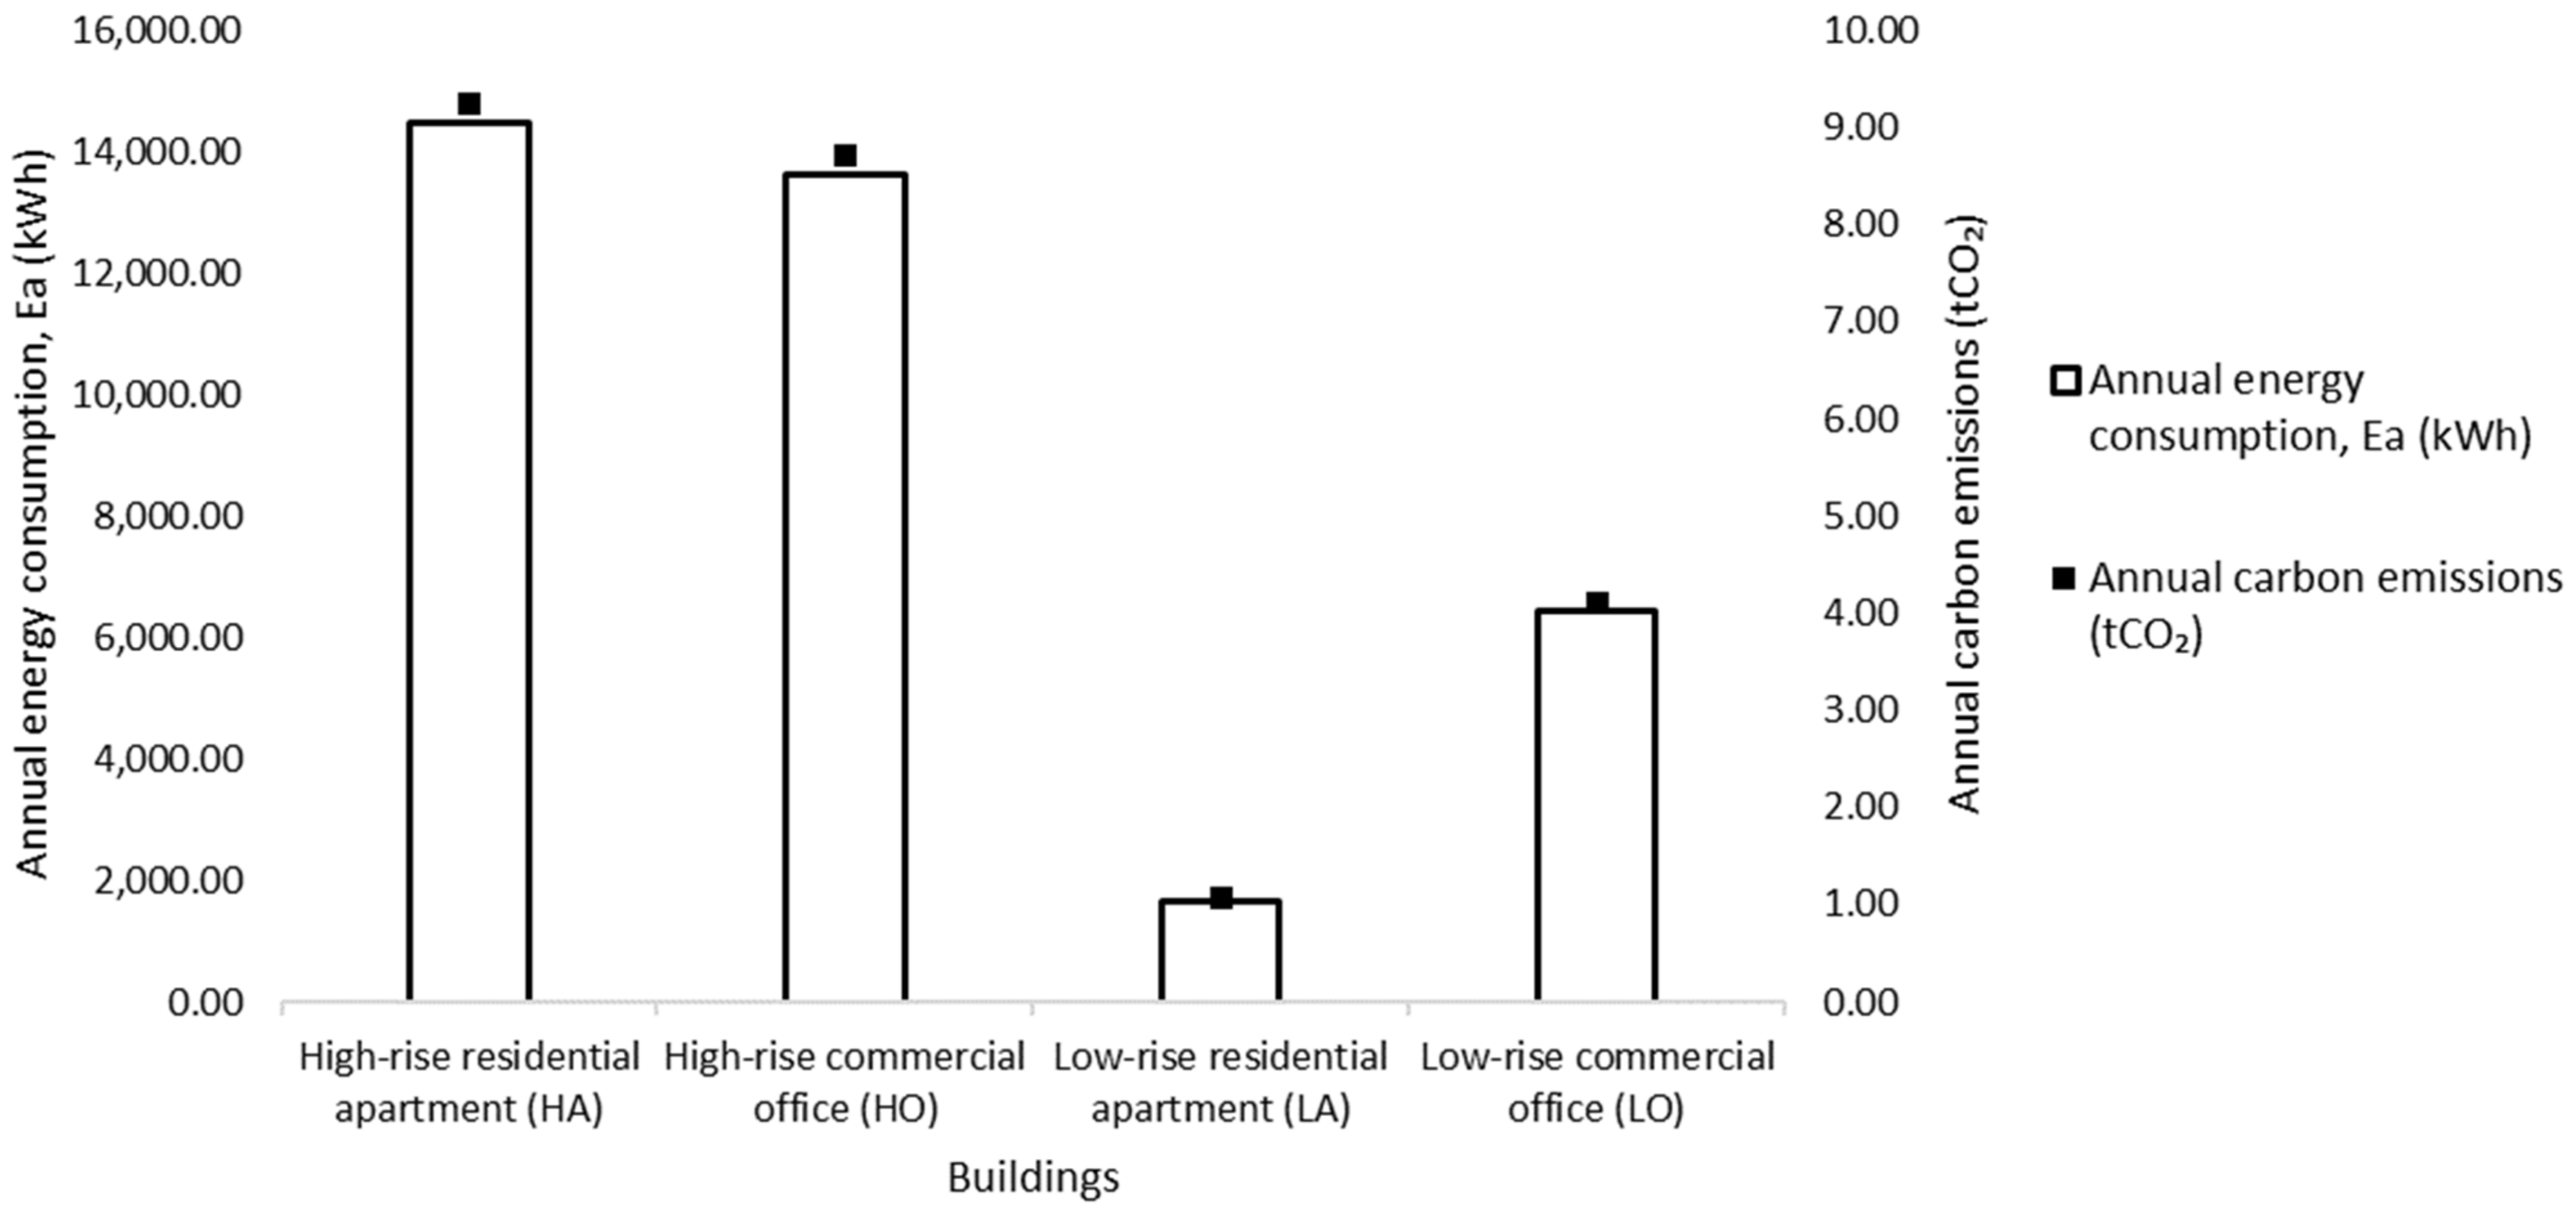
3.2. Carbon Emissions of the Elevator System
3.3. Limitations of the Studied Elevator Systems in the Buildings and Recommendations
4. Conclusions
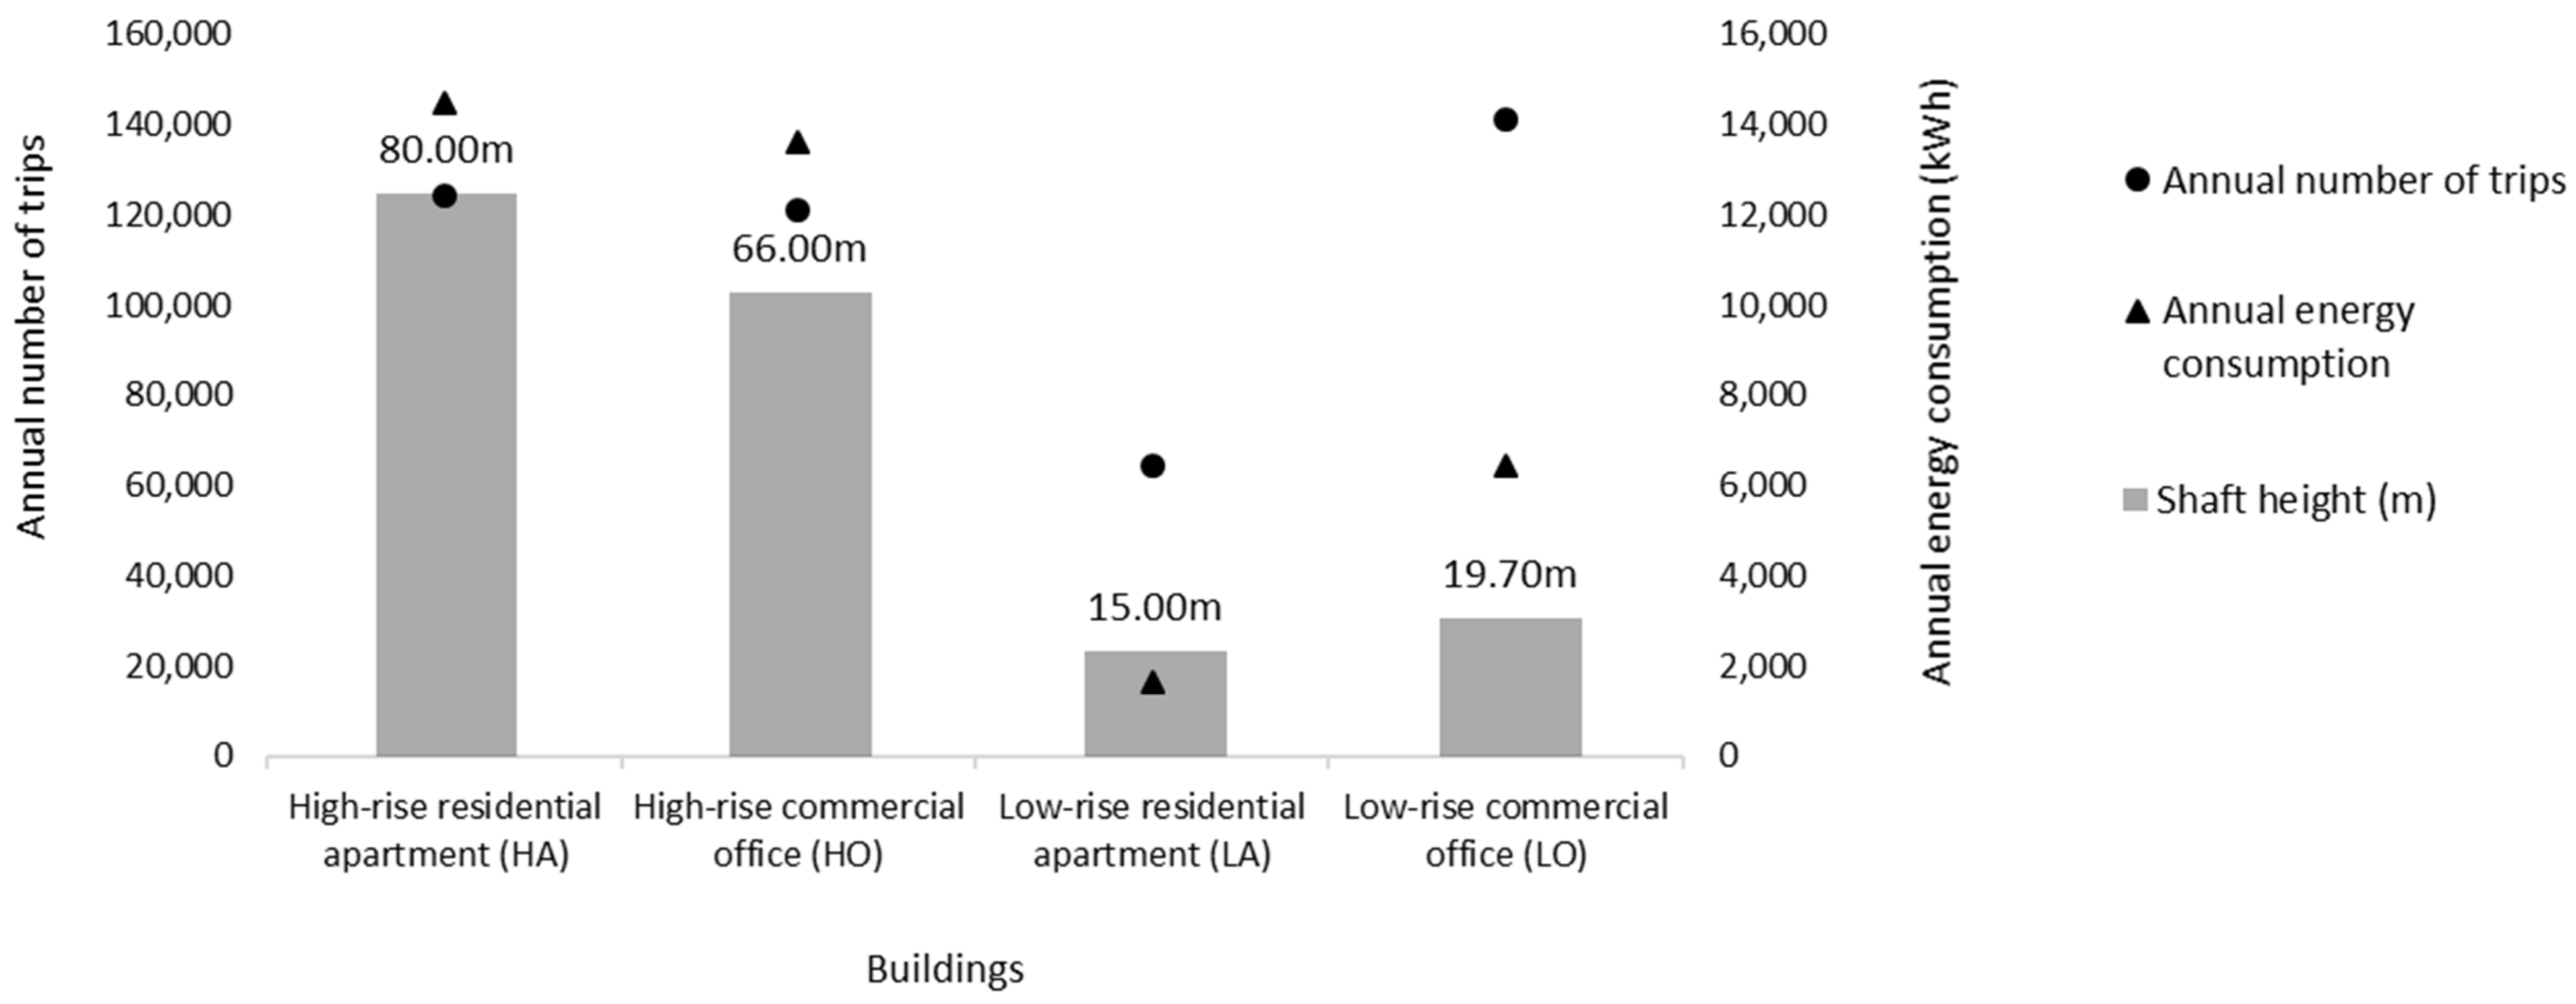
- The annual energy consumption of an elevator system had a positive correlation with the average daily energy consumption of the elevator system calculated on a weekly basis, since elevator traffic was relatively consistent weekly throughout the year. Low-rise buildings had a higher ratio of annual number of trips to annual energy consumption. The annual elevator energy consumption of the high-rise residential apartment building showed a slightly higher value than that of the high-rise commercial office buildings with an elevator zoning system;
- A higher number of cars distributing the demand for trips travelled decreased the energy consumption of each car. With the same number of cars in the elevator system, the low-rise commercial office building had a higher annual elevator energy consumption than the low-rise residential apartment building due to the higher incoming and outgoing tenants and passengers, as well as building structure limitations;
- Low-rise buildings showed relatively good energy efficiency compared to high-rise buildings;
- The usage, energy consumption, and carbon emissions had a positive correlation to each other.
Author Contributions
Funding
Institutional Review Board Statement
Informed Consent Statement
Data Availability Statement
Conflicts of Interest
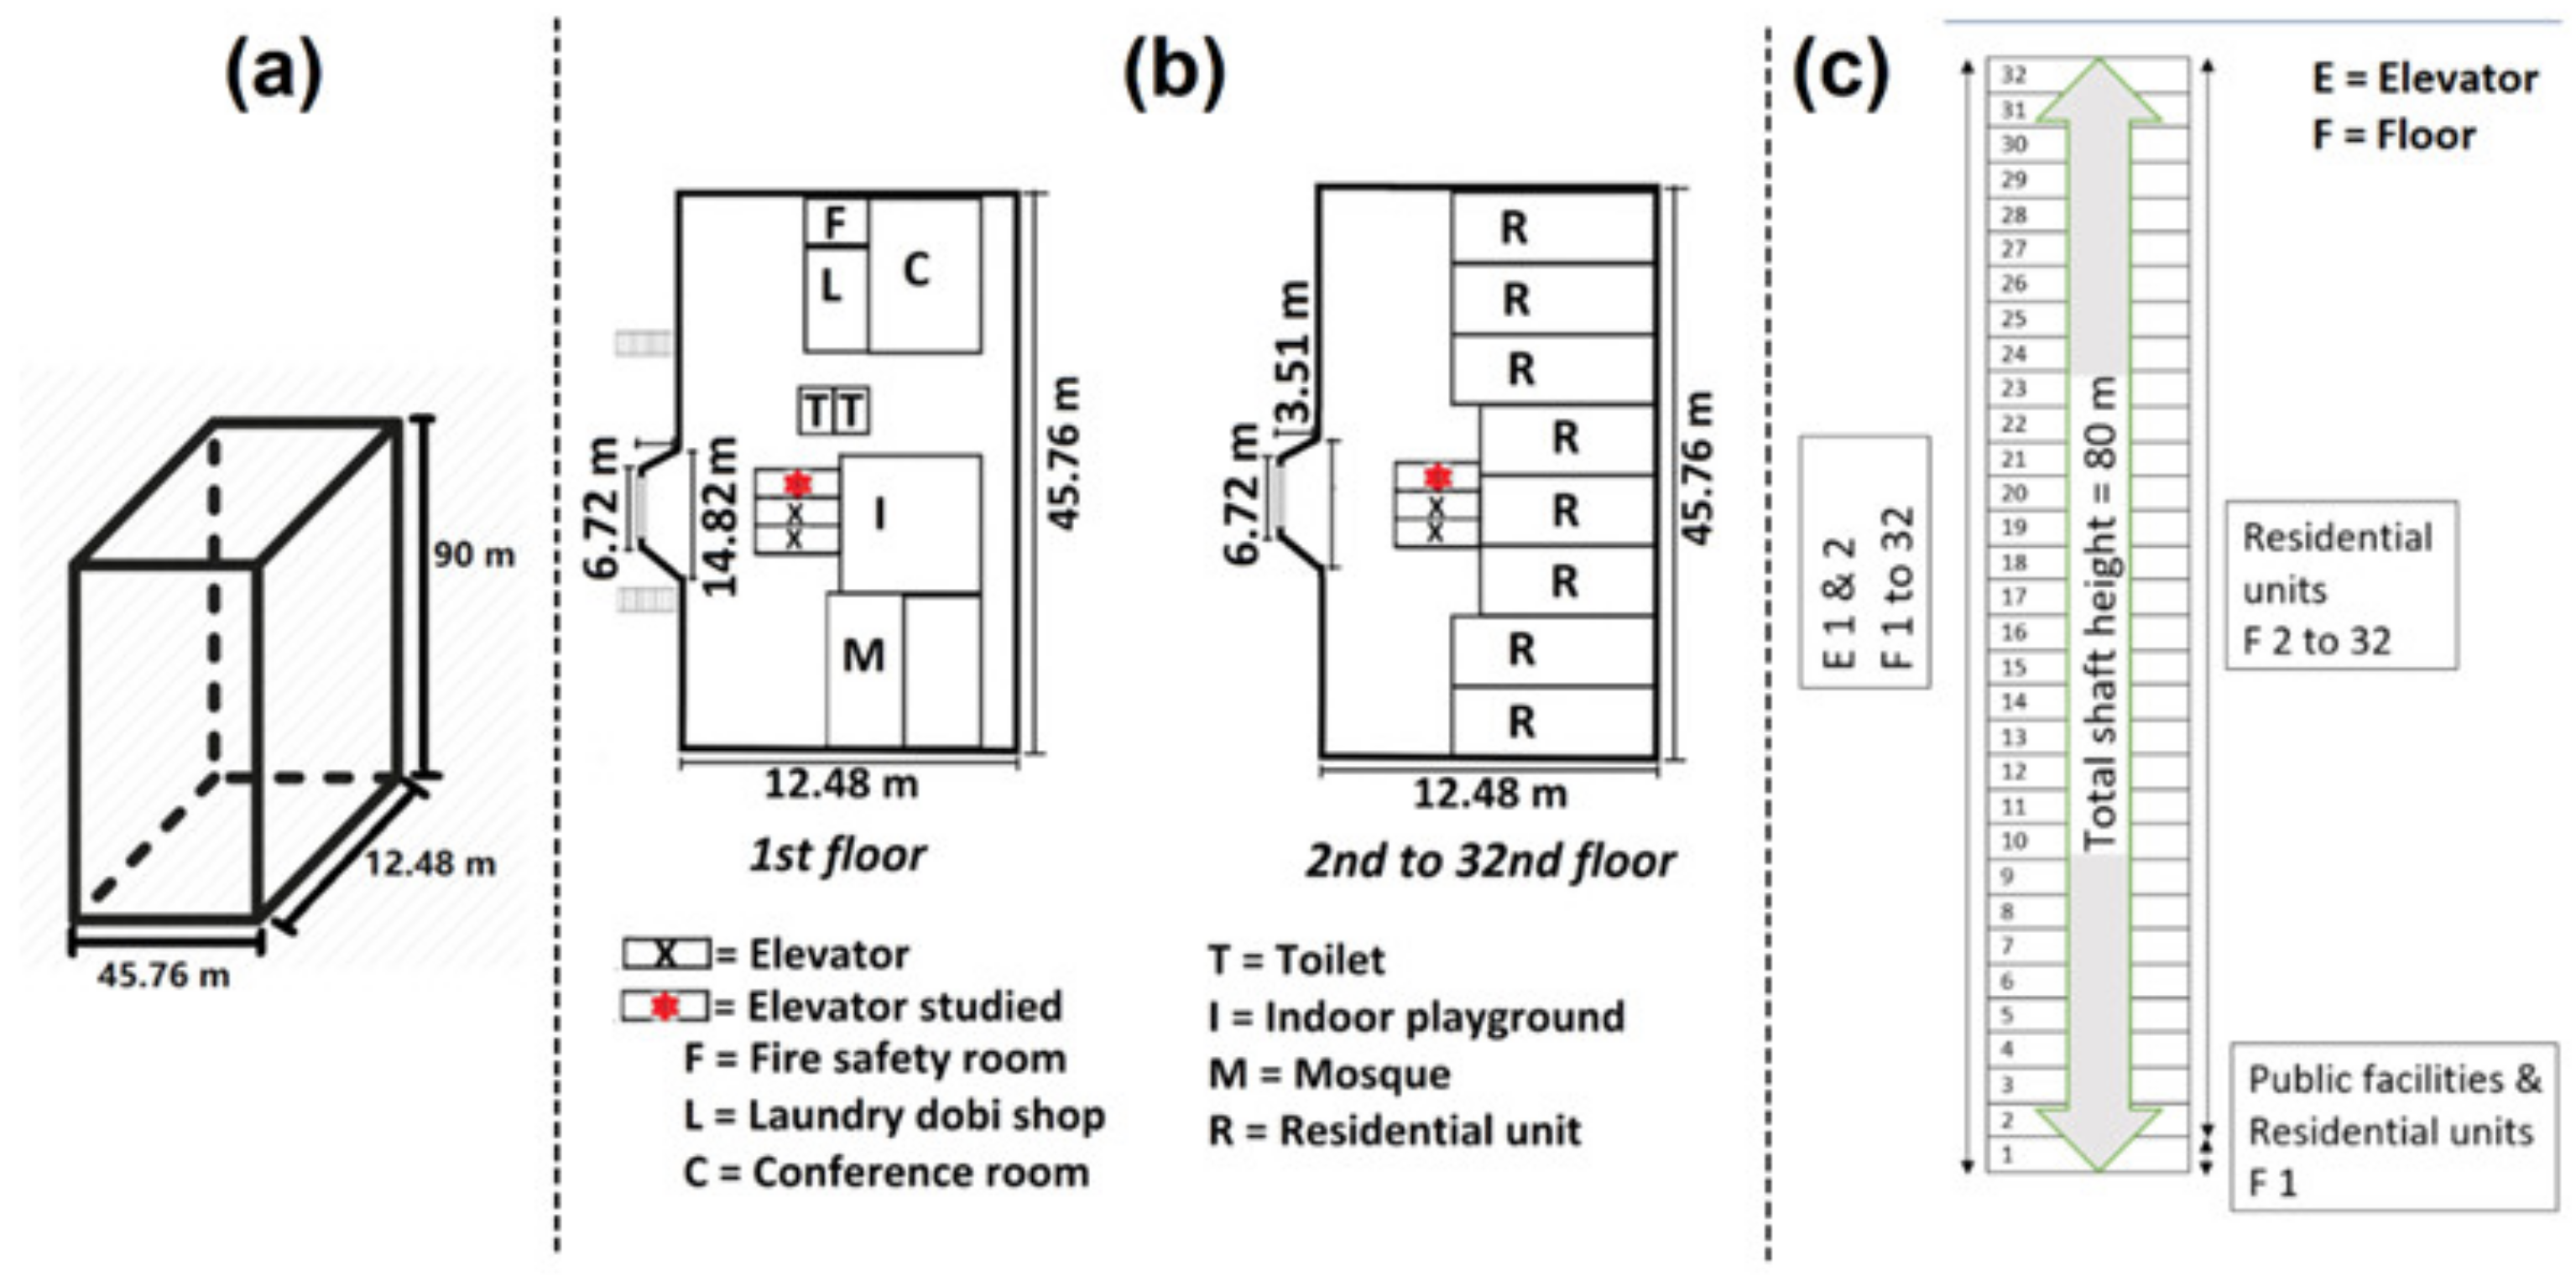
Appendix A

| Use | Residential |
| Type | High-rise |
| Height (m) | Approximately 90 |
| Shaft height (m) | 80 |
| Floor-to-floor height (m) | 2.50 |
| Number of blocks | 4 |
| Number of floors | 32 |
| Estimated number of units | 247 per block, 8 per floor |
| Estimated built-up area (m2) | Approximately 65 per unit, and 608.69 per block |
| Estimated total number of occupants (person) | 1976 |
| Number of elevator cars | 3 per block |
| Type; brand | Gearless traction; Northern |
| Car dimension (m) | 1.6 × 2.4 × 1.68 |
| Rated load (kg); capacity | 1150; 17 passengers |
| Rated speed (m/s) | 1.50 |
| Rated power (running power) * (kW) | 13 |
| Full travel distance (m) | 80 |
| Counterbalancing * (%) | 50 |
| Door operation time (open, remained open, close) (s) | 12 |
| Acceleration * (m/s2) | 1.00 (gearless traction type) |
| Jerk * (m/s3) | 1.20 |
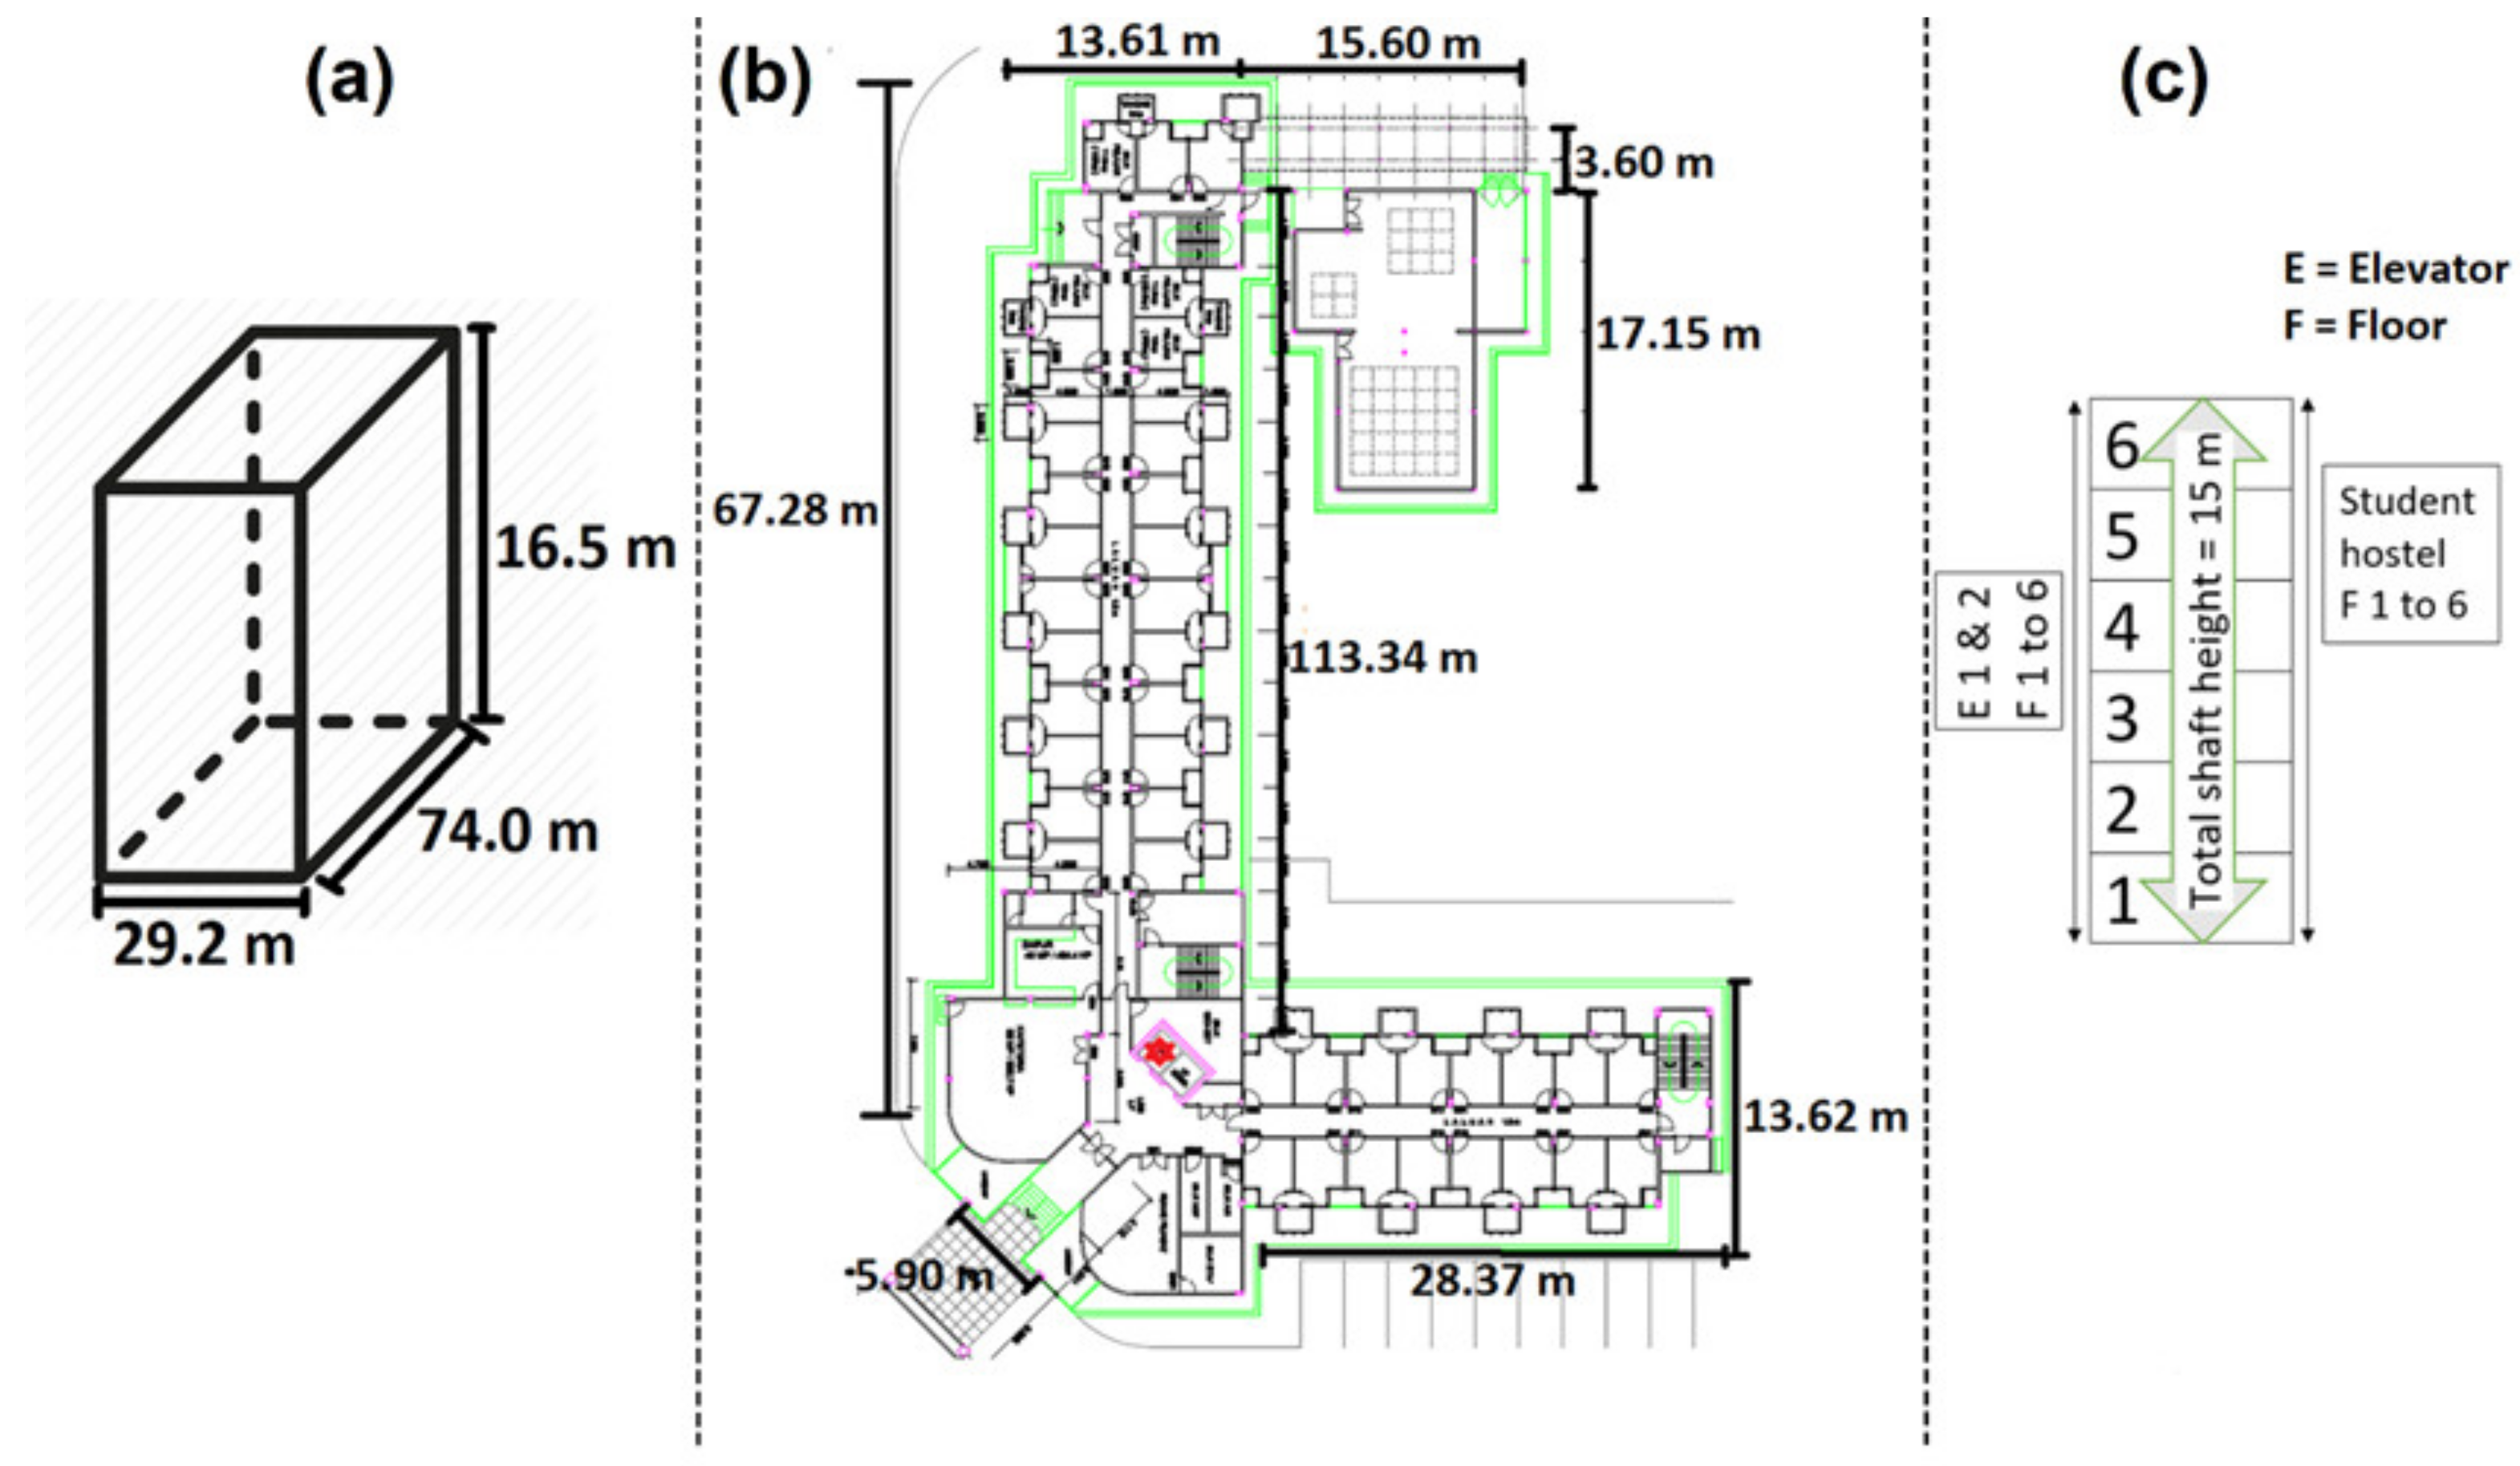
Appendix B
| Use | Residential |
| Type | Low-rise |
| Building height (m) | 16.50 |
| Shaft height (m) | 15 |
| Floor-to-floor height (m) | 2.50 |
| Number of blocks | 1 |
| Number of floors | 6 |
| Estimated number of units | 627 |
| Estimated built-up area (m2) | 1615.1 |
| Estimated total number of occupants (person) | 627 |
| Number of elevator cars | 2 |
| Type; brand | Geared traction; Otis |
| Car dimension (m) | 1.37 × 2.10 × 1.40 |
| Rated load (kg); capacity | 750; 11 |
| Rated speed (m/s) | 0.65 |
| Rated power (running power) * (kW) | 4.90 |
| Full travel distance (m) | 15 |
| Counterbalancing * (%) | 50 |
| Door operation time (open, remained open, close) (s) | 9.13 |
| Acceleration * (m/s2) | 0.80 (geared traction type) |
| Jerk * (m/s3) | 1.20 |
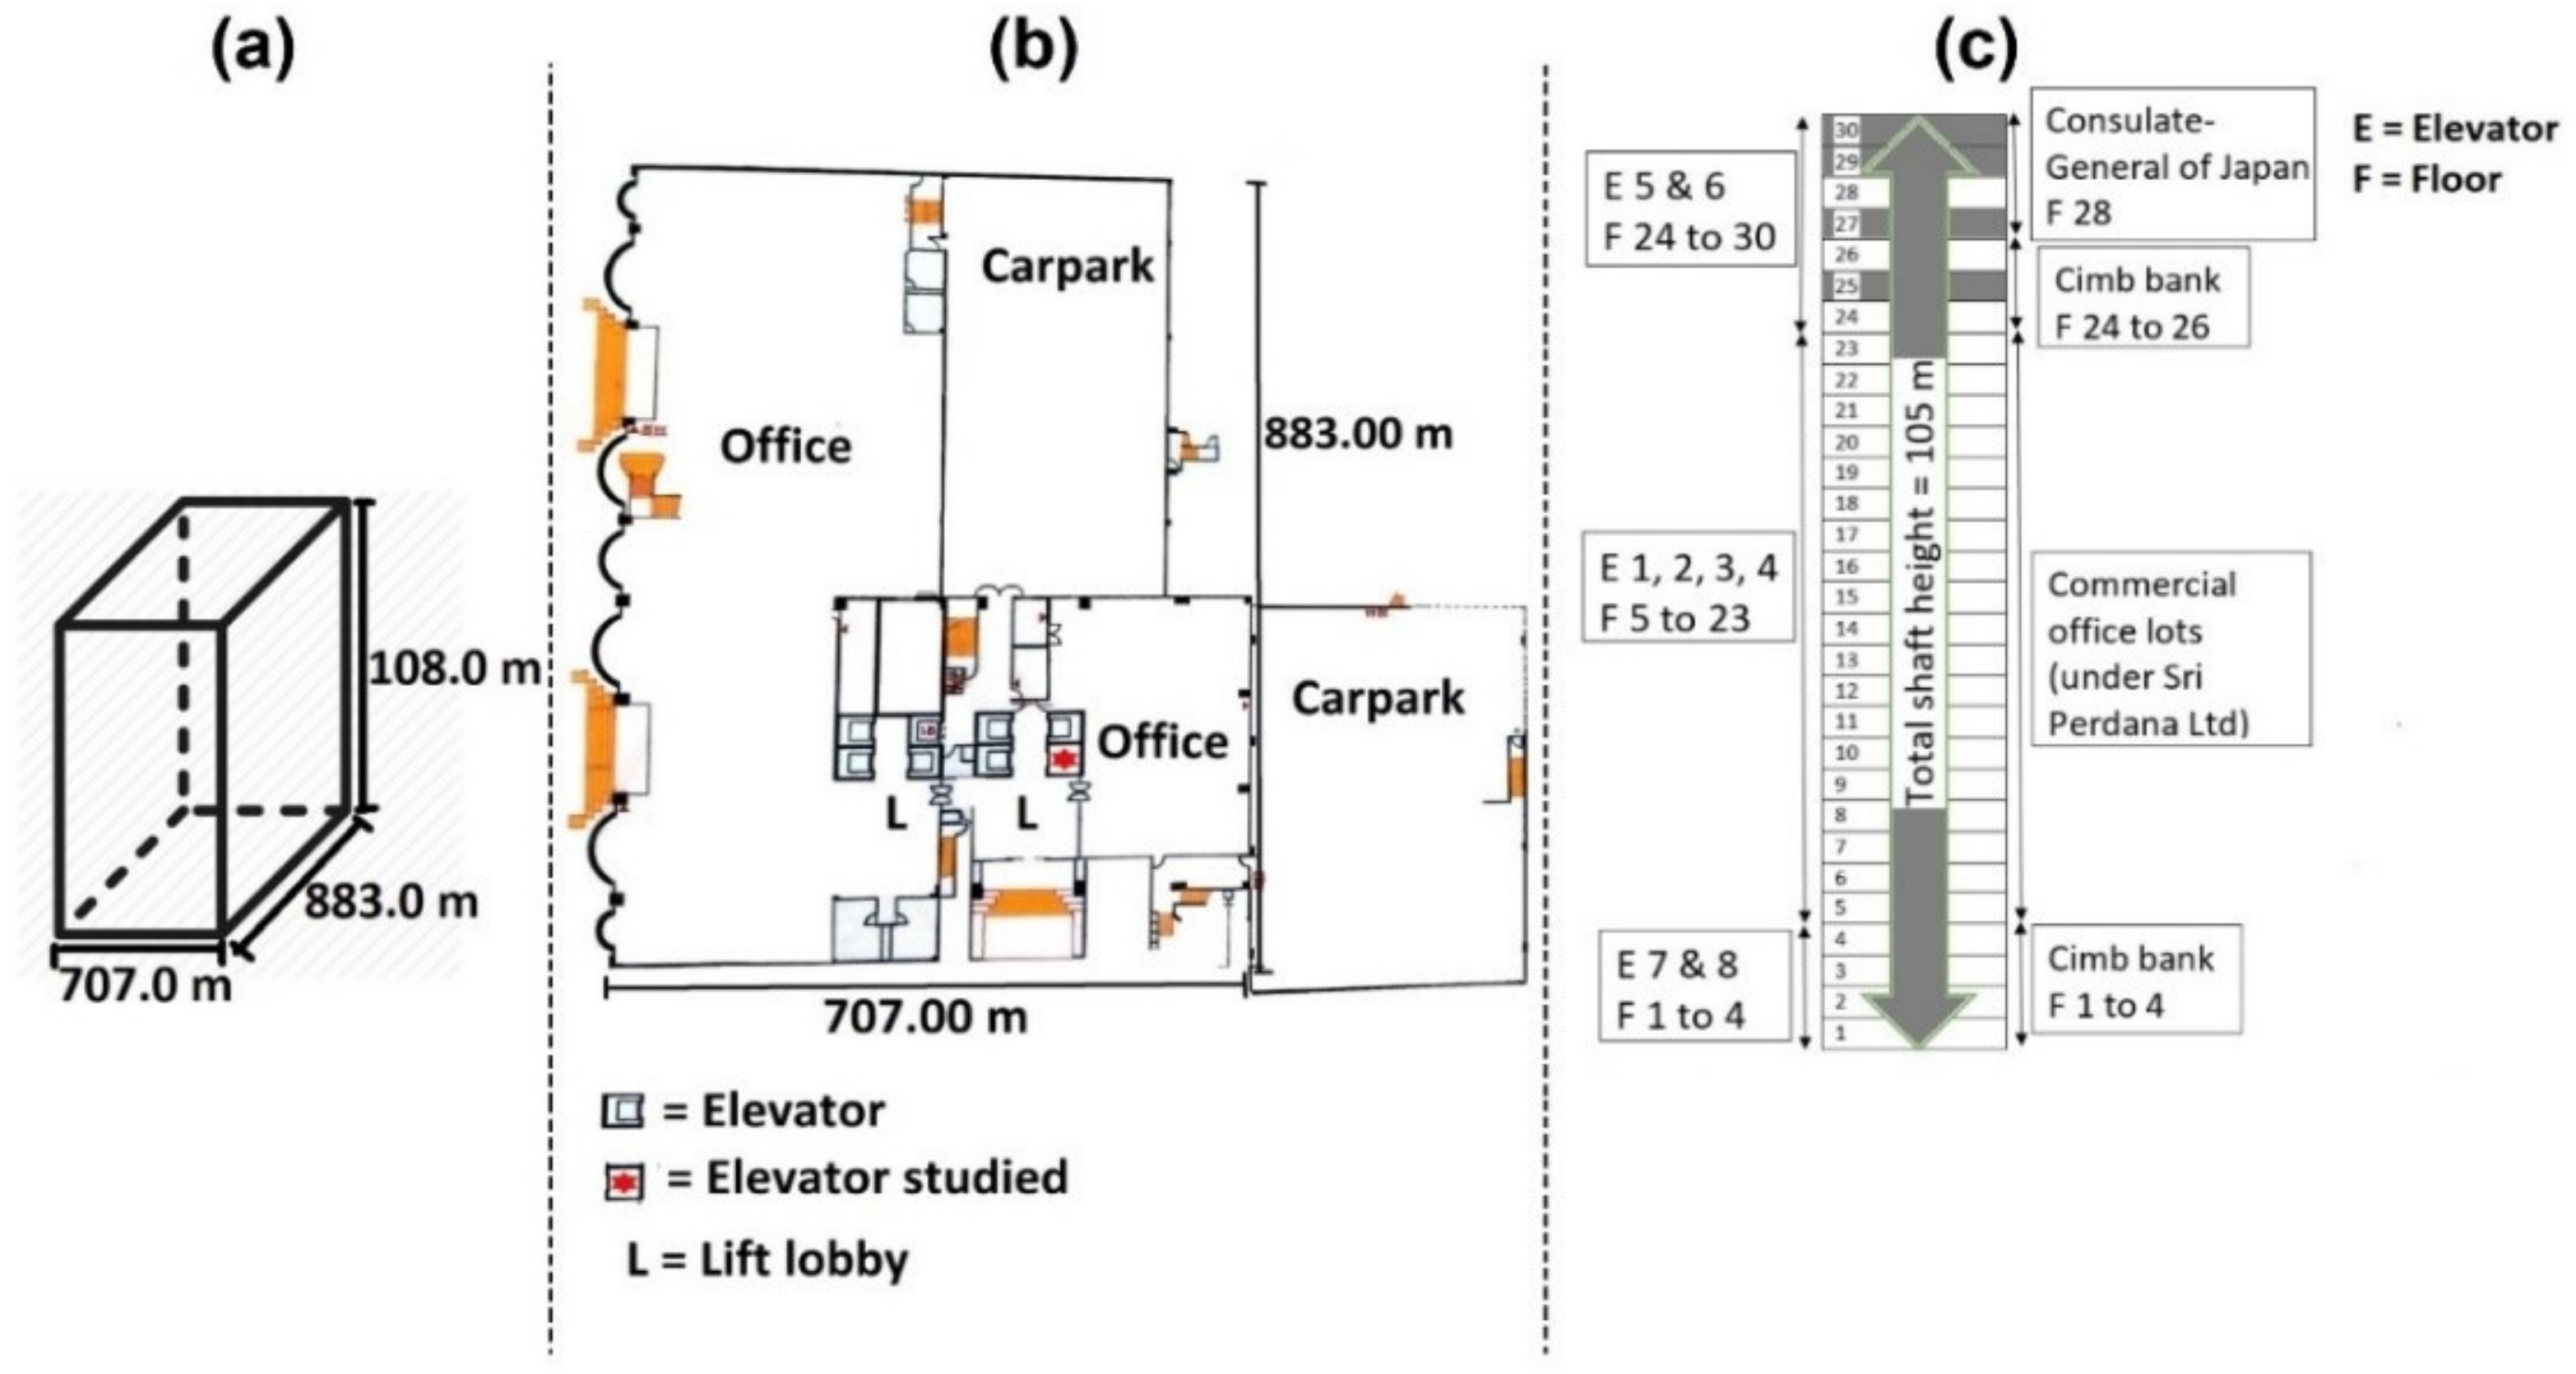
Appendix C
| Use | Commercial |
| Type | High-rise |
| Height (m) | 108 |
| Shaft height (m) | 66 out of 105 (accounting for only 19 occupied floors out of 28) |
| Floor-to-floor height (m) | 3.50 |
| Number of blocks | 1 |
| Number of floors | 19 out of 30 (accounting for only 19 occupied floors out of 28) |
| Estimated number of units | 94 out of 138 (accounting for only 19 occupied floors out of 28) |
| Estimated built-up area (m2) | Office lot: from 65 to 278.71 Total building: 624,281 |
| Estimated total number of occupants (person) | 2070 |
| Number of elevator cars | 4 (for floor 5 to 28), 2 (for floor 1 to 4), 2 (for floor 24 to 28) |
| Type; brand | Gearless traction; Northern |
| Car dimension (m) | 1.78 × 2.20 × 1.60 |
| Rated load (kg); capacity | 900; 13 passengers |
| Rated speed (m/s) | 1.60 |
| Rated power (running power) * (kW) | 13 |
| Full travel distance (m) | 66 |
| Counterbalancing * (%) | 50 |
| Door operation time (open, remained open, close) (s) | 4.17 |
| Acceleration * (m/s2) | 1.00 (gearless traction type) |
| Jerk * (m/s3) | 1.2 |
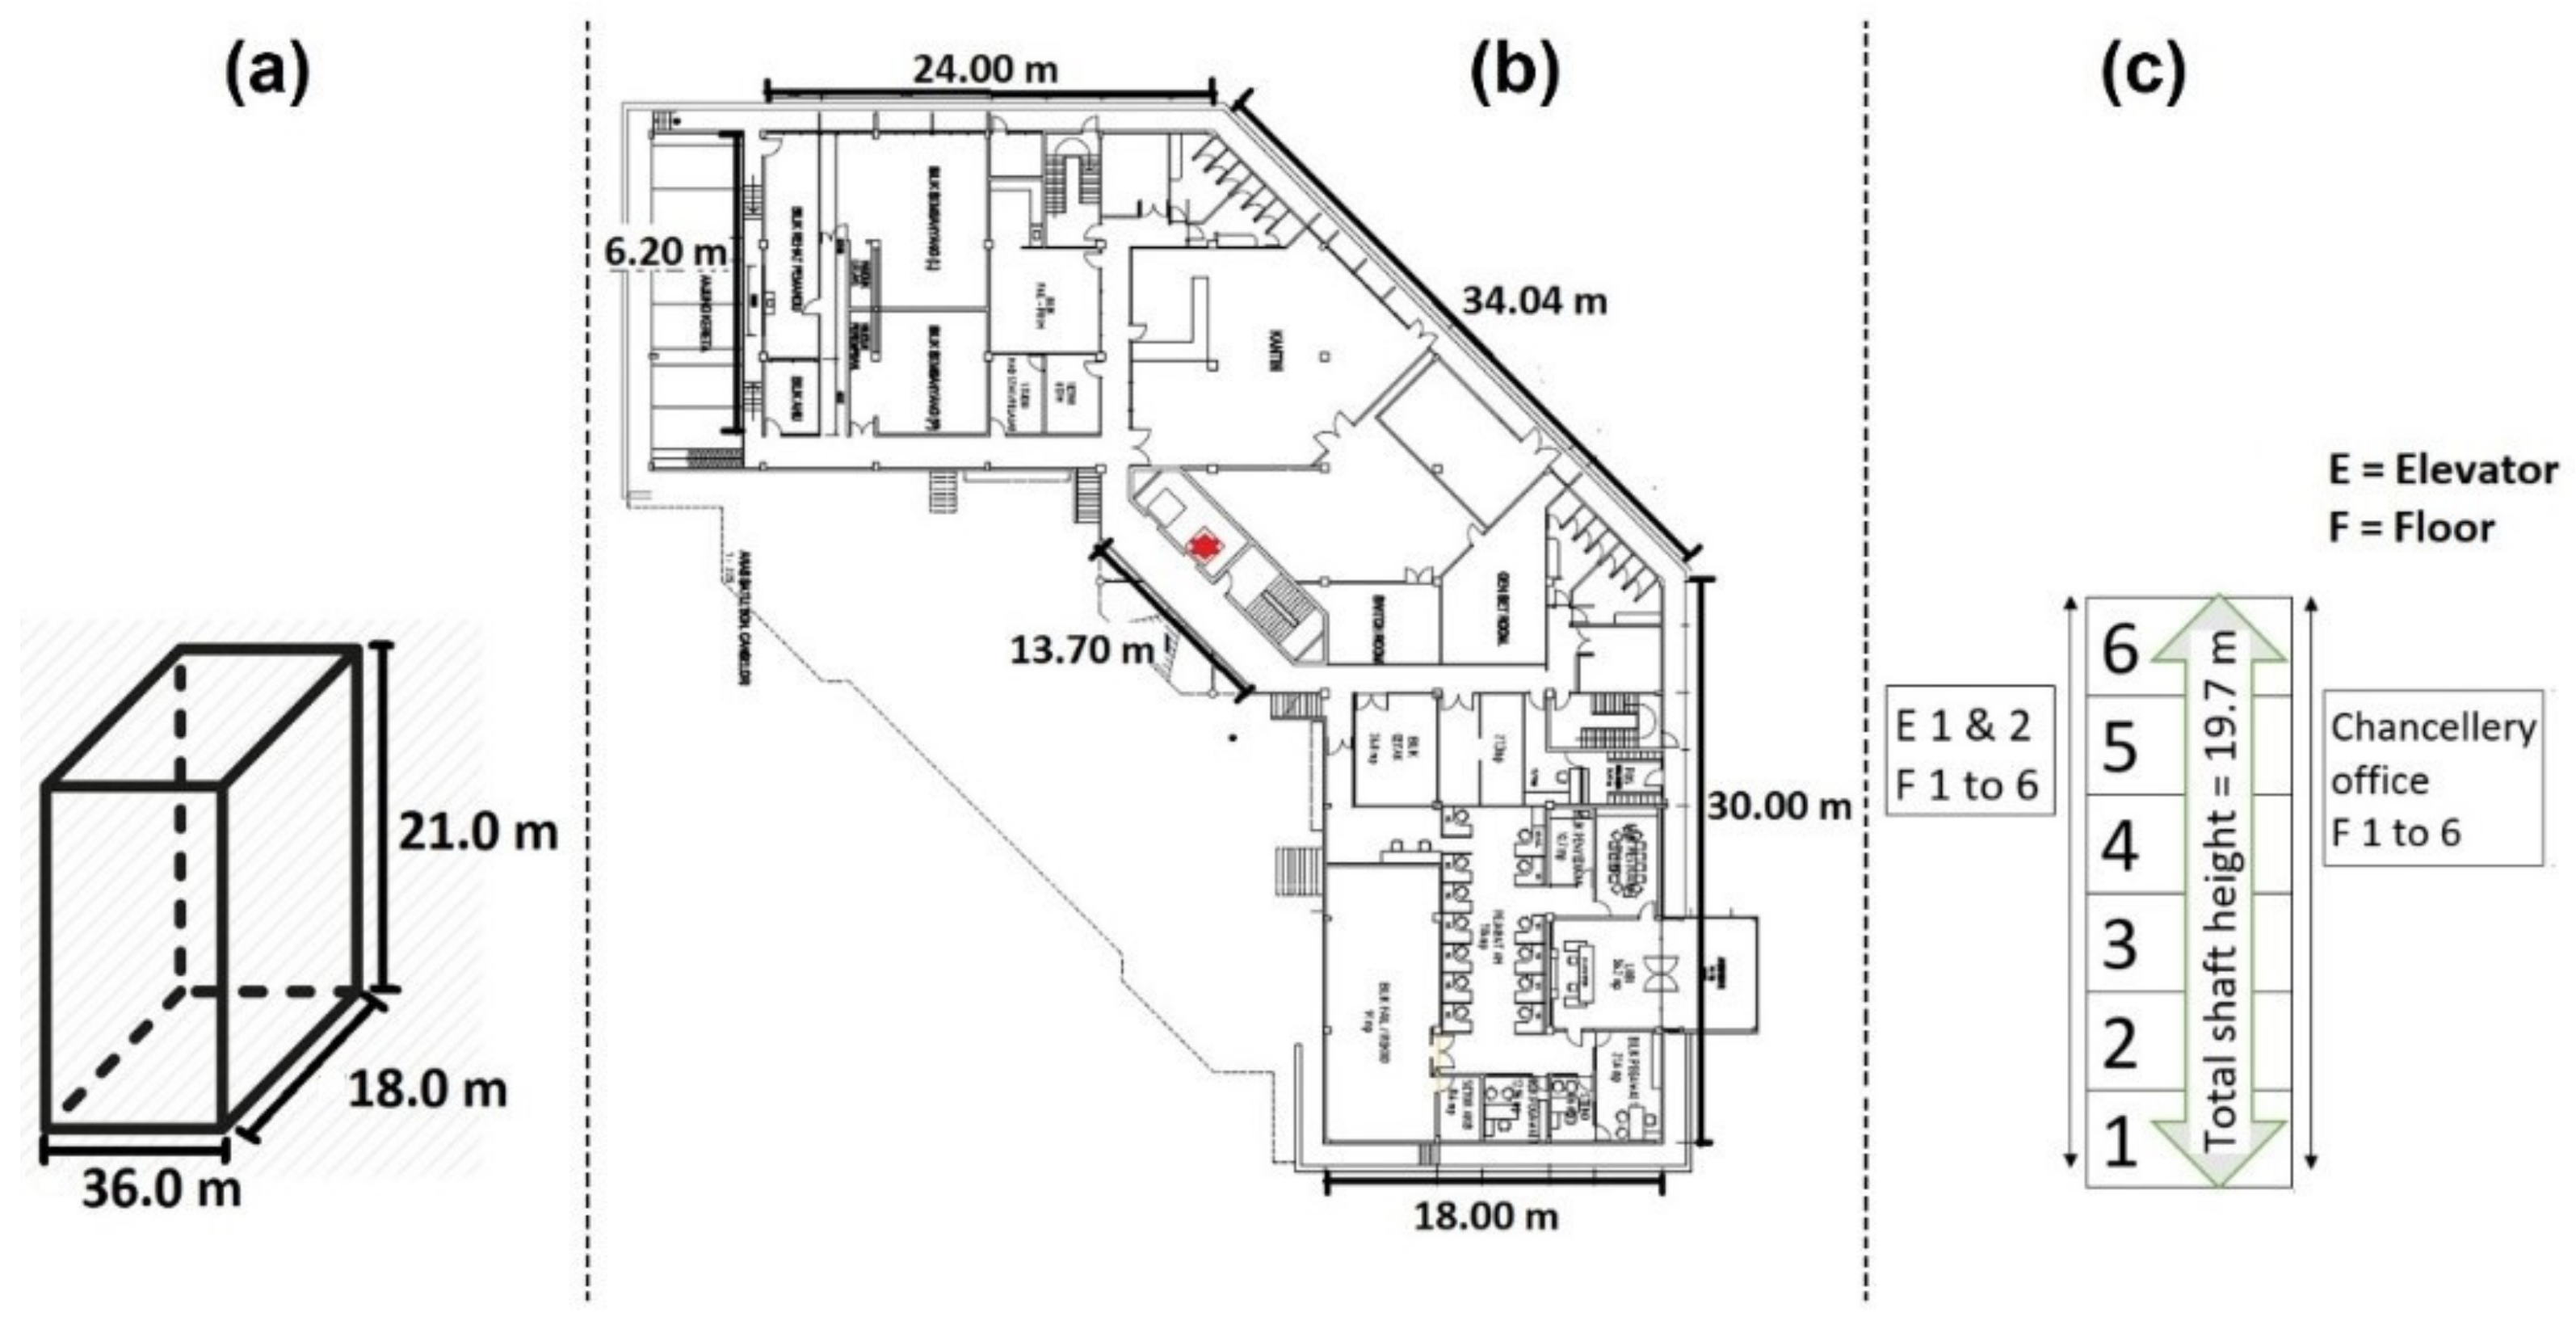
Appendix D
| Use | Office |
| Type | Low-rise |
| Building height (m) | 21 |
| Shaft height (m) | 19.70 |
| Floor-to-floor height (m) | 2.74 |
| Number of blocks | 1 |
| Number of floors | 6 |
| Estimated number of units | 229 |
| Estimated built-up area (m2) | 1148 |
| Estimated total number of occupants (person) | 458 |
| Number of elevator cars | 2 |
| Type; brand | Geared traction; Schindler |
| Car dimension (m) | 1.55 × 2.24 × 1.55 |
| Rated load (kg); capacity | 1000; 15 |
| Rated speed (m/s) | 0.70 |
| Rated power (running power) * (kW) | 8.50 |
| Full travel distance (m) | 19.70 |
| Counterbalancing * (%) | 50 |
| Door operation time (open, remained open, close) (s) | 7.39 |
| Acceleration * (m/s2) | 0.80 (geared traction type) |
| Jerk * (m/s3) | 1.20 |
References
- Enerdata. World Energy Consumption Statistics. Available online: https://yearbook.enerdata.net/total-energy/world-consumption-statistics.html (accessed on 14 January 2020).
- International Energy Agency. World Energy Outlook 2017; International Energy Agency: Paris, France, 2017; pp. 1–19. [Google Scholar]
- U.S. Energy Information Administration (EIA). Emerging Asian Economies Drive the Increase in World Energy Use from 2015 to 2040. Available online: https://www.eia.gov/pressroom/releases/press448.php (accessed on 6 February 2022).
- U.S. Energy Information Administration. Building Sector Energy Consumption. In International Energy Outlook 2016; U.S. Energy Information Administration (EIA): Washington, DC, USA, 2016; pp. 101–112. [Google Scholar]
- Hassan, J.S.; Zin, R.M.; Majid, M.Z.A.; Balubaid, S.; Hainin, M.R. Building Energy Consumption in Malaysia: An Overview. J. Teknol. 2014, 70, 33–38. [Google Scholar] [CrossRef] [Green Version]
- Ali, S.B.M.; Hasanuzzaman, M.; Rahim, N.A.; Mamun, M.A.A.; Obaidellah, U.H. Analysis of energy consumption and potential energy savings of an institutional building in Malaysia. Alexandria Eng. J. 2021, 60, 805–820. [Google Scholar] [CrossRef]
- Chel, A.; Kaushik, G. Renewable energy technologies for sustainable development of energy efficient building. Alexandria Eng. J. 2018, 57, 655–669. [Google Scholar] [CrossRef]
- Azari, R. Life Cycle Energy Consumption of Buildings; Embodied + Operational; Elsevier Inc.: Amsterdam, The Netherlands, 2019; ISBN 9780128117491. [Google Scholar]
- Pérez-Lombard, L.; Ortiz, J.; Pout, C. A review on buildings energy consumption information. Energy Build. 2008, 40, 394–398. [Google Scholar] [CrossRef]
- Department of Energy United States of America. Chapter 5—Increasing Efficiency of Building Systems and Technologies. In Quadrennial Technology Review an Assessment of Energy Technologies and Research; Department of Energy United States of America: Washington, DC, USA, 2015. [Google Scholar]
- U.S. Energy Information Administration (EIA). Monthly Energy Review January 2022; U.S. Energy Information Administration: Washington, DC, USA, 2022; Volume 0035.
- Aldhshan, S.R.S.; Abdul Maulud, K.N.; Wan Mohd Jaafar, W.S.; Karim, O.A.; Pradhan, B. Energy consumption and spatial assessment of renewable energy penetration and building energy efficiency in malaysia: A review. Sustainability 2021, 13, 9244. [Google Scholar] [CrossRef]
- European Comission. Energy Use in Buildings. Available online: https://ec.europa.eu/energy/eu-buildings-factsheets-topics-tree/energy-use-buildings_en (accessed on 6 February 2022).
- U.S. Energy Information Administration (EIA). Electricity Intensity of U.S. Homes and Commercial Buildings Decreases in Coming Decades. Available online: https://www.eia.gov/todayinenergy/detail.php?id=38332 (accessed on 17 April 2019).
- Chen, S.; Zhang, G.; Xia, X.; Chen, Y.; Setunge, S.; Shi, L. The impacts of occupant behavior on building energy consumption: A review. Sustain. Energy Technol. Assessments 2021, 45, 101212. [Google Scholar] [CrossRef]
- Godoy-Shimizu, D.; Steadman, P.; Hamilton, I.; Donn, M.; Evans, S.; Moreno, G.; Shayesteh, H. Energy use and height in office buildings. Build. Res. Inf. 2018, 46, 845–863. [Google Scholar] [CrossRef] [Green Version]
- Ang, J.H.; Yusup, Y.; Zaki, A.; Salim, S.; Ahmad, M.I. A CFD Study of Flow Around an Elevator Towards Potential Kinetic Energy Harvesting. J. Adv. Res. Fluid Mech. Therm. Sci. J. 2019, 59, 54–65. [Google Scholar]
- Al-kodmany, K. Tall Buildings and Elevators: A Review of Recent Technological Advances. Buildings 2015, 5, 1070–1104. [Google Scholar] [CrossRef] [Green Version]
- Eninter Ascensores. What Determines the Number of Lifts a Building Needs? Available online: http://www.astarlifts.com/en/blog-lifts/lifts-lifts/what-determines-the-number-of-elevators-you-need-a-building (accessed on 17 April 2019).
- Barney, G.; Al-Sharif, L. Elevator Traffic Handbook: Theory and Practice, 2nd ed.; Taylor & Francis: Abingdon-on-Thames, UK, 2016; ISBN 9781138852327. [Google Scholar]
- Al-Sharif, L.; Seeley, C. The effect of the building population and the number of floors on the vertical transportation design of low and medium rise buildings. Build. Serv. Eng. Res. Technol. 2010, 31, 207–220. [Google Scholar] [CrossRef]
- Hui, S.C.M.; Yeung, C. Analysis of standby power consumption for lifts and escalators. In Proceedings of the 7th Greater Pearl River Delta Conference on Building Operation and Maintenance—SMART Facilities Operation and Maintenance, Hong Kong, 6 December 2016; pp. 35–47. [Google Scholar]
- Zubair, M.U.; Zhang, X. Explicit data-driven prediction model of annual energy consumed by elevators in residential buildings. J. Build. Eng. 2020, 31, 101278. [Google Scholar] [CrossRef]
- Barney, G.C.; Loher, A.G. Elevator Electric Drives: Concepts and Principles, Controls and Practice; International Association of Elevator Engineers by Ellis Horwood: New York, NY, USA, 1990; ISBN 0132614626. [Google Scholar]
- Kirchenmayer, G. Energy Consumption of Elevators; Elevator World, Inc.: Mobile, AL, USA, 1981; p. 48. [Google Scholar]
- White, L.E. Energy Consumption: Hydraulic Elevators and Traction Elevators; Elevator World, Inc.: Mobile, AL, USA, 1984. [Google Scholar]
- Barney, G. Energy Models for Lifts. In Proceedings of the 1st Symposium on Lift and Escalator Technologies, Northampton, UK, 29 September 2011; Volume 1, pp. 25–34. [Google Scholar]
- Schroeder, J. Energy consumption and power requirements of elevators. In Second Century of the Skyscraper; Springer: Boston, MA, USA, 1988; Volume 34, pp. 621–627. [Google Scholar] [CrossRef]
- Daniel, C.; Forth, J.; Arthur, W.; Eric, H.; Douglas, R.; Martin, H. Methods and Apparatus for Retrieving Energy Readings from an Energy Monitoring Device. U.S. Patent 7089089B2, 8 August 2006. [Google Scholar]
- Chan, C.Y.B. Elevator Drive Systems Energy Consumption Study Report—UBC Social Ecological Economic Development Studies (SEEDS); University of British Columbia: Vancouver, BC, Canada, 2012; p. 125. [Google Scholar]
- Bannister, P.; Bloomfield, C.; Chen, H. Empirical prediction of office building lift energy consumption. In Proceedings of the Proceedings of the Building Simulation 2011, 12th Conference of International Building Performance Simulation Association, Sydney, Australia, 14–16 November 2011; pp. 2635–2642. [Google Scholar]
- Tukia, T.; Uimonen, S.; Siikonen, M.L.; Hakala, H.; Donghi, C.; Lehtonen, M. Explicit method to predict annual elevator energy consumption in recurring passenger traffic conditions. J. Build. Eng. 2016, 8, 179–188. [Google Scholar] [CrossRef] [Green Version]
- Al-Sharif, L. Lift Energy Consumption: General Overview (1974–2001). Elev. World 2004, 52, 61–67. [Google Scholar]
- Al-Sharif, L.; Peters, R.; Smith, R. Elevator Energy Simulation Model; Elevator World, Inc.: Mobile, AL, USA, 2016. [Google Scholar]
- Tukia, T.; Uimonen, S.; Siikonen, M.L.; Donghi, C.; Lehtonen, M. Modeling the aggregated power consumption of elevators—the New York city case study. Appl. Energy 2019, 251, 113356. [Google Scholar] [CrossRef]
- Barney, G.; Lorente, A. Simplified Energy Calculations for Lifts Based on ISO/DIS 25745-2. In Proceedings of the Symposium on Lift and Escalator Technologies, Northampton, UK; The CIBSE Lifts Group: London, UK, 2013; Volume 3, pp. 10–19. [Google Scholar]
- Association of German Engineers. VDI 4707 Guideline—Lifts Energy Efficiency; Association of German Engineers: Düsseldorf, Germany, 2007. [Google Scholar]
- ISO 25745-2:2015 (en); Energy Performance of Lifts, Escalators and Moving Walks—Part 2: Energy Calculation and Classification for Lifts (elevators). ISO: Geneva, Switzerland, 2015.
- Hu, D.M.; Xu, B.; Yang, H.Y. VVVF controlled closed-circuit energy-saving hydraulic lift system. J. Zhejiang Univ. Sci. 2008, 42, 209. [Google Scholar]
- Lehtonen, M.; Tukia, T. Determining and Modeling the Energy Consumption of Elevators. Master’s Thesis, Aalto University, Espoo, Finland, 2014. [Google Scholar]
- Jing, R.; Wang, M.; Zhang, R.; Li, N.; Zhao, Y. A study on energy performance of 30 commercial office buildings in Hong Kong. Energy Build. 2017, 144, 117–128. [Google Scholar] [CrossRef]
- Mardiana, A.; Riffat, S.B. Building Energy Consumption and Carbon dioxide Emissions: Threat to Climate Change. J. Earth Sci. Clim. Change 2015, S3, 1. [Google Scholar] [CrossRef] [Green Version]
- Mirrahimi, S.; Mohamed, F.M.; Haw, L.C.; Lukman, N.I.; Fatimah, W.Y.M.; Aflaki, A.; Yusoff, W.F.M.; Aflaki, A.; Mohamed, M.F.; Haw, L.C.; et al. The effect of building envelope on the thermal comfort and energy saving for high-rise buildings in hot–humid climate. Renew. Sustain. Energy Rev. 2016, 53, 1508–1519. [Google Scholar] [CrossRef]
- Tahir, M.Z.; Jamaludin, R.; Nasrun, M.; Nawi, M.; Baluch, N. Building energy index (BEI): A study of government office building in Malaysian public university. J. Eng. Sci. Technol. 2017, 12, 192–201. [Google Scholar]
- Akashah, F.W.; Ali, A.S. Analysis of Energy Trend of Office Building in Malaysia—Case Study in Universiti Pendidikan Sultan Idris (UPSI); University of Malaya: Kuala Lumpur, Malaysia, 2017. [Google Scholar]
- Sadrzadehrafiei, S.; Mat, K.S.S.; Lim, C. Energy consumption and energy saving in Malaysian office buildings. Models Methods Appl. Sci. 2009, 75, 152–156. [Google Scholar]
- Tee, B.T.; Yahaya, A.Z.; Breesam, Y.F.; Dan, R.M.; Zakaria, M.Z. Energy analysis for lighting and air-conditioning system of an academic building. J. Teknol. 2015, 76, 5536. [Google Scholar]
- Saidur, R. Energy consumption, energy savings, and emission analysis in Malaysian office buildings. Energy Policy 2009, 37, 4104–4113. [Google Scholar] [CrossRef]
- Sadrzadehrafiei, S.; Sopian, K.; Mat, S.; Lim, C.; Hashim, H.S.; Zaharim, A. Enhancing energy efficiency of office buildings in a tropical climate, Malaysia. Int. J. Energy Environ. 2012, 6, 209–310. [Google Scholar]
- Taufiq, B.N.; Masjuki, H.H.; Mahlia, T.M.I.; Amalina, M.A.; Faizul, M.S.; Saidur, R. Exergy analysis of evaporative cooling for reducing energy use in a Malaysian building. Desalination 2007, 209, 238–243. [Google Scholar] [CrossRef]
- Ossen, D.R.; Ahmad, M.H.; Madros, N.H. Impact of solar shading geometry on building energy use in hot humid climates with special reference to Malaysia. In Proceedings of the NSEB2005—SUSTAINABLE SYMBIOSIS, National Seminar on Energy in Buildings, UiTM, Subang Jaya, Malaysia, 10–11 May 2005; pp. 10–11. [Google Scholar]
- Noranai, Z.; Kammalluden, M.N.; Tun, U.; Onn, H. Study of building energy index in Universiti Tun Hussein Onn Malaysia. Acad. J. Sci. 2012, 1, 429–433. [Google Scholar]
- Saidur, R.; Hasanuzzaman, M.; Yogeswaran, S.; Mohammed, H.A.; Hossain, M.S. An end-use energy analysis in a Malaysian public hospital. Energy 2010, 35, 4780–4785. [Google Scholar] [CrossRef]
- Tang, F.E. An Energy Consumption Study for a Malaysian University. Int. J. Environ. Chem. Ecol. Geol. Geophys. Eng. 2012, 6, 99–105. [Google Scholar]
- Saidur, R.; Masjuki, H.H. Energy and associated emission analysis in office buildings. Int. J. Mech. Mater. Eng. 2008, 3, 90–96. [Google Scholar]
- Bureau of Energy Efficiency. Energy Conservation Building Code (ECBC)—Building Envelope for Hot & Dry Climate 2017; Bureau of Energy Efficiency: New Delhi, India, 2017; p. 26.
- Allied Market Research. Traction Elevator Market by Order Type (Geared Traction Elevators and Gearless Traction Elevators) and Application (Residential and Commercial): Global Opportunity Analysis and Industry Forecast 2021–2030; Allied Market Research: Portland, OR, USA, 2021. [Google Scholar]
- Elevator Wiki. Traction Elevators. Elevatorpedia 2019; pp. 1–5. Available online: https://elevation.fandom.com/wiki/Traction_elevators (accessed on 6 February 2022).
- Menezes, A.C.; Cripps, A.; Buswell, R.A.; Wright, J.; Bouchlaghem, D. Estimating the energy consumption and power demand of small power equipment in office buildings. Energy Build. 2014, 75, 199–209. [Google Scholar] [CrossRef] [Green Version]
- ISO. Energy Performance of Lifts, Escalators and Moving Walks—Part 3: Energy Calculation and Classification of Escalators and Moving Walks. Available online: https://www.iso.org/obp/ui/#iso:std:iso:25745:-3:ed-1:v1:en (accessed on 10 December 2017).
- Barney, G. Energy efficiency of lifts—Measurement, conformance, modelling, prediction and simulation. 2007. Available online: www.cibseliftsgroup.org/CIBSE/papers/Barney-on-energy%20efficiency%20of%20lifts.pdf (accessed on 6 February 2022).
- U.S. Environmental Protection Agency. Indirect Emissions from Purchased Electricity; Environmental Protection Agency: Washington, DC, USA, 2016.
- Intergovernmental Panel on Climate Change. 2006 IPCC Guidelines for National Greenhouse Gas Inventories; IPCC: Geneva, Switzerland, 2006. [Google Scholar]
- Malaysian Green Technology Corporation. 2017 Electricity Baseline for Malaysia; Malaysian Green Technology Corporation: Selangor, Malaysia, 2017. [Google Scholar]
- U.S. Environmental Protection Agency. Overview of Greenhouse Gases. Available online: https://www.epa.gov/ghgemissions/overview-greenhouse-gases (accessed on 6 January 2022).
- Intergovernmental Panel on Climate Change. Precursors and Indirect Emissions. In 2006 IPCC Guidelines for National Greenhouse Gas Inventories; IPCC: Geneva, Switzerland, 2006. [Google Scholar]
- Sustainable Energy Development Authority Malaysia (SEDA). Average Carbon Dioxide Emission Factor of Malaysia. Available online: http://www.seda.gov.my/statistics-monitoring/co2-avoidance/ (accessed on 6 January 2022).
- Intergovernmental Panel on Climate Change. 2019 Refinement to the 2006 IPCC Guidelines for National GHG Inventories; IPCC: Geneva, Switzerland, 2019. [Google Scholar]
- Intergovernmental Panel on Climate Change. Revised 1996 IPCC Guidelines for National Greenhouse Gas Inventories; IPCC: Geneva, Switzerland, 1996. [Google Scholar]
- Patrão, C.; De Almeida, A.; Fong, J.; Ferreira, F. Elevators and Escalators Energy Performance Analysis. In Proceedings of the 2010 ACEEE Summer Study on Energy Efficiency in Buildings, Pacific Grove, CA, USA, 15–20 August 2010; pp. 53–63. [Google Scholar]
- Siikonen, M.; Sorsa, J.; Hakala, H. Impact of Traffic on Annual Elevator Energy Consumption. In Proceedings of the ELEVCON 2010, Lucerne, Switzerland, 2–4 June 2010; Volume 18, pp. 344–352. [Google Scholar]
- Hakala, H.; Siikonen, M.-L.; Tyni, T.; Ylinen, J. Energy-efficient elevators for tall buildings. In Proceedings of the Council on Tall Buildings and Urban Habitat, 6th World Congress, Melbourne, Australia, 26 February–1 March 2001; pp. 1–13. [Google Scholar]
- Marsong, S. Analysis of Energy Consumption and Behavior of Elevator in a Residential Building. In Proceedings of the 5th International Electrical Engineering Congress, Pattaya, Thailand, 8–10 March 2017. [Google Scholar]
- KONE Corporation. KONE JumpLift; KONE Corporation: Espoo, Finland, 2017. [Google Scholar]
- CTBUH. The Met—The Skyscraper Center. Available online: http://skyscrapercenter.info/building/the-met/1134 (accessed on 7 February 2022).
- Elevator Wiki Fandom. Kone JumpLift. Available online: https://elevation.fandom.com/wiki/Kone_JumpLift (accessed on 7 February 2022).
- EMPORIS. Ashok Towers D, Mumbai 261721. Available online: https://www.emporis.com/buildings/261721/ashok-towers-d-mumbai-india (accessed on 19 September 2018).
- KONE. KONE MiniSpace; KONE: Chertsey, UK, 2018. [Google Scholar]
- Nipkow, J.; Schalcher, M. Energy consumption and efficiency potentials of lifts. Hospitals 2006, 2, 3. [Google Scholar]
- VDI. VDI4707 Technical Equipment for Buildings Manual; VDI: Düsseldorf, Germany, 2008; Volume 5. [Google Scholar]
- Zarikas, V.; Papanikolaou, N.; Loupis, M.; Spyropoulos, N. Intelligent Decisions Modeling for Energy Saving in Lifts: An Application for Kleemann Hellas Elevators. Energy Power Eng. 2013, 5, 31126. [Google Scholar] [CrossRef] [Green Version]
- Vollrath, D. Elevator Drives Energy Consumption & Savings; Magnetek: New York, NY, USA, 2011; p. 16. [Google Scholar]
- KONE Corporation. KONE C-Series; KONE Corporation: Espoo, Finland, 2008. [Google Scholar]
- Nguyen, H.; Gaudet, E.W. Comparative Evaluation of Line Regenerative and Non-Regenerative Vector Controlled Drives for AC Gearless Elevators. In Proceedings of the Conference Record of the 2000 IEEE Industry Applications Conference, Thirty-Fifth IAS Annual Meeting and World Conference on Industrial Applications of Electrical Energy (Cat. No. 00CH37129), Rome, Italy, 8–12 October 2000; pp. 1431–1437. [Google Scholar]
- Hackel, S.; Kramer, J.; Li, J.; Lord, M.; Marsicek, G.; Petersen, A.; Schuetter, S.; Sippel, J. Proven Energy-Saving Technologies for Commercial Properties; National Renewable Energy Laboratory: Golden, CO, USA, 2015; pp. 36–47.
- US EPA. Sources of Greenhouse Gas Emissions. Available online: https://www.epa.gov/ghgemissions/sources-greenhouse-gas-emissions (accessed on 22 April 2019).
- Herbert, R.B.; Malmström, M.; Ebenå, G.; Salmon, U.; Ferrow, E.; Fuchs, M. Quantification of abiotic reaction rates in mine tailings: Evaluation of treatment methods for eliminating iron- and sulfur-oxidizing bacteria. Environ. Sci. Technol. 2005, 39, 770–777. [Google Scholar] [CrossRef] [PubMed]


| Energy Efficiency Class | Energy Consumption Per Day (Wh) |
|---|---|
| A | 0.72 × Q × nd × Sav/1000 + (50 × tnr) |
| B | 1.08 × Q × nd × Sav/1000 + (100 × tnr) |
| C | 1.62 × Q × nd × Sav/1000 + (200 × tnr) |
| D | 2.43 × Q × nd × Sav/1000 + (400 × tnr) |
| E | 3.65 × Q × nd × Sav/1000 + (800 × tnr) |
| F | 5.47 × Q × nd × Sav/1000 + (1600 × tnr) |
| G | 5.47 × Q × nd × Sav/1000 + (1600 × tnr) |
| Elevator Energy Aspects | High-Rise Building | Low-Rise Building | ||
|---|---|---|---|---|
| Residential Apartment (HA) | Commercial Office (HO) | Residential Apartment (LA) | Commercial Office (LO) | |
| No. of trips per day (trip) | 340 | 504 | 176 | 589 |
| Usage category | 3 | 4 | 2 | 4 |
| Running power, Pr (W) | 13,000 | 13,000 | 4900 | 8500 |
| Idle power, Pid (W) | 1334.9 | 1334.9 | 1326.45 | 208 |
| Standby power 5 min, Pst5 (W) | 252.6 | 252.6 | 190.25 | 120.1 |
| Standby power 30 min, Pst30 (W) | 161.6 | 161.6 | 128.3 | 81.7 |
| Nonrunning power, Pnr (W) | 1749.1 | 1749.1 | 1645 | 409.8 |
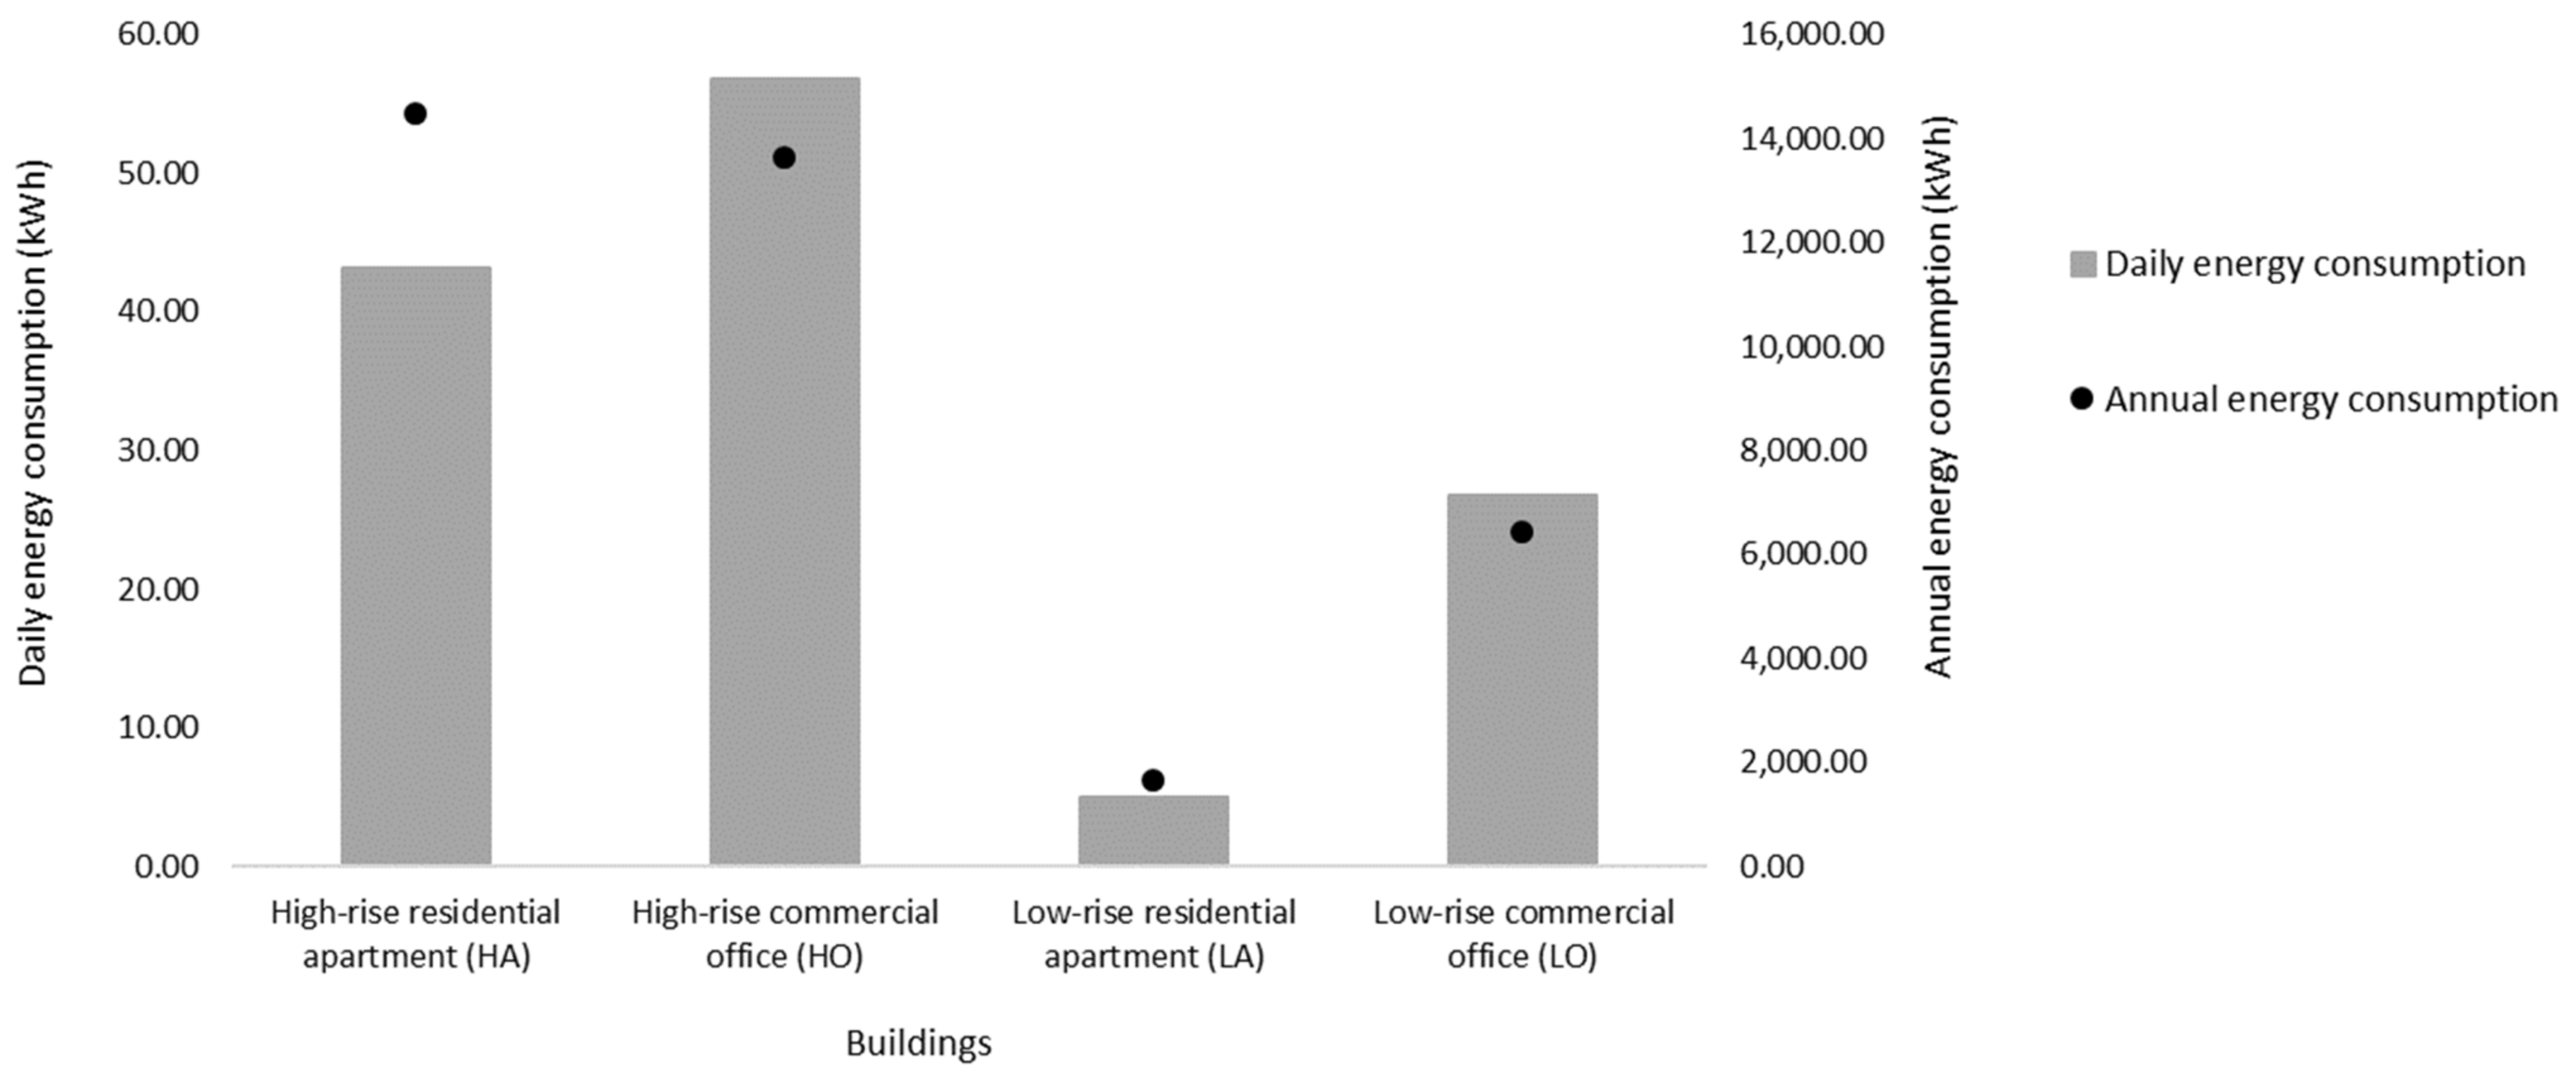
| Daily energy consumption (kWh) | 49.81 | 52.52 | 5.35 | 29.68 |
| Annual energy consumption (kWh) | 14485 | 13,617.6 | 1656.48 | 6422.88 |
| Building Height (m) and Floors | Parameters | Ref. | |||||
|---|---|---|---|---|---|---|---|
| Elevator Type | Elevator Speed (m/s) | Load (kg) | Elevator | Annual Energy Consumption (kWh) | |||
| Travel Power (kW) | |||||||
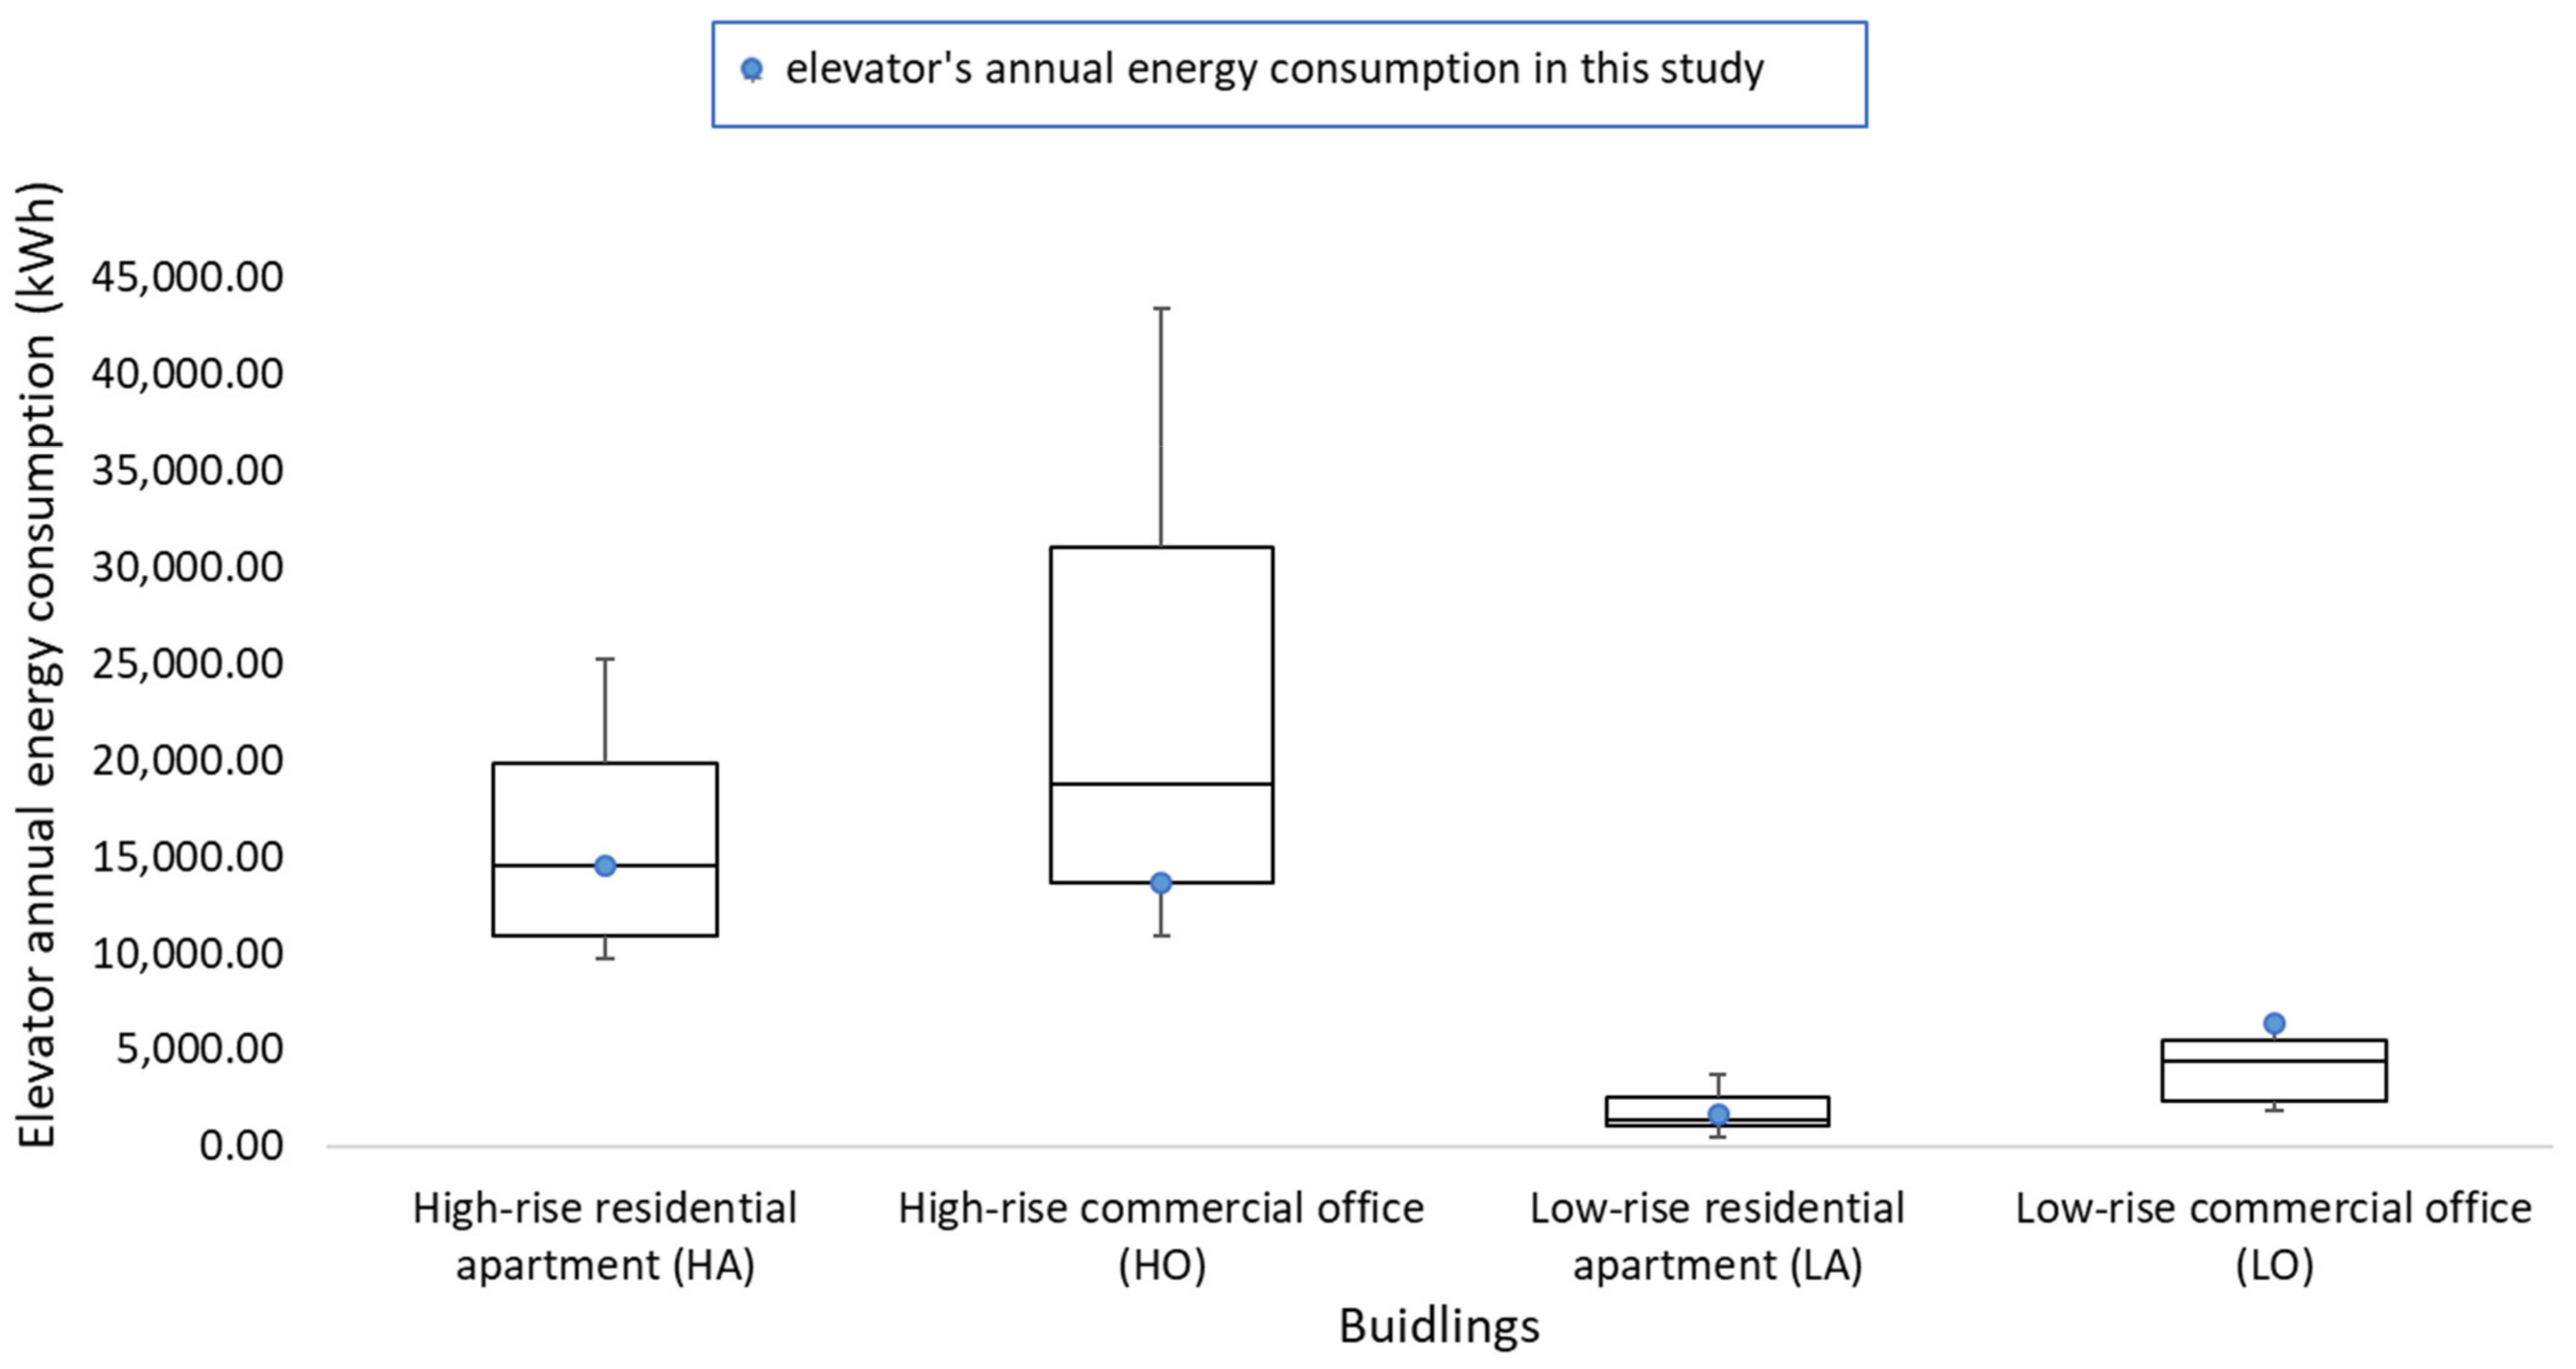
| High-rise | 136.5; 45 | Gearless traction | 3 | 1350 | 39.7 | 26,462.50 | [73] |
| 230.6; 69 | Gearless traction, regenerative, compact machine room, | 4.0–6.0 | 2000 | N/A | 19,846.50 | [74,75,76] | |
| (The Met) | KONE Jump-Lift | ||||||
| 180.0; 63 | Gearless traction, regenerative, compact machine room, | 4 | 2000 | N/A | 10,878.00 | [77,78] | |
| (Ashok tower) | KONE Mini-Space (old) | ||||||
| Mid-rise | 59.0; 16 | Traction, gearless | 2.5 | 1500 | 3.8 | 5324.00 | [32] |
| PMSM, non-regenerative | |||||||
| 50.0; 14 | Gearless traction | 1.5 | 1000 | 13 | 4350.00 | [79] | |
| Low-rise | 26.1; 7 | Geared traction | 1.6 | 750 | 7.2 | 4763.30 | [80] |
| 29.0; 7 | Gearless traction | 1 | 630 | 5.3 | 3969.40 | [80] | |
| 23.7; 6 | Geared traction | 1 | 1000 | 8.5 | 5294.30 | [80] | |
| 14.0; 4 | Geared traction | 1 | 320 | 3.9 | 711.8 | [80] | |
| 14.0; 4 | Geared traction | 1 | 630 | 3.4 | 1126.60 | [80] | |
| 14.6; 4 | Gearless traction | 1 | 630 | 4.8 | 1219.10 | [80] | |
| 17.4; 4 | Gearless traction | 1 | 630 | 5.2 | 1274.90 | [80] | |
| 16.5; 4 | Gearless traction | 1 | 800 | 4.9 | 1408.90 | [80] | |
| 11.2; 3 | Hydraulic | 0.6 | 320 | 9.5 | 2677.30 | [80] | |
| 13.4; 3 | Hydraulic | 0.6 | 500 | 12.6 | 2565.40 | [80] | |
| 12.4; 3 | Hydraulic | 1 | 500 | 4.7 | 1192.30 | [80] | |
| 11.6; 3 | Geared traction | 1 | 630 | 6 | 1481.00 | [80] | |
| 10.2; 2 | Gearless traction | 1.6 | 500 | 7.5 | 2329.40 | [80] | |
| 11.2; 5 | Gearless traction | 0.6 | 320 | travel 8.93 mWh/(m·kg), | 2124.3 | [81] | |
| standby 200W | |||||||
| 14.0; 6 | Gearless traction | 1 | 630 | 4 | 950 | [79] | |
| 14.0; 6 | Gearless traction | 1 | 1000 | 6.1 | 953.8 | [79] | |
| 13.0; 6 | Gearless traction | 0.6 | 500 | travel 91 Wh, idle 50 W, standby 31 W | 511 | [36] | |
| Building Height (m) and Floors | Parameters | Ref. | |||||
|---|---|---|---|---|---|---|---|
| Elevator Type | Elevator Speed (m/s) | Load (kg) | Elevator Travel Power (W) | Annual Energy Consumption (kWh) | |||
| High-rise | 192.0; 48 | Traction regenerative, MG-DC gearless | 6.1 | 1360.8 | N/A | 47,815.0 | [82] |
| 192.0; 48 | Traction regenerative, Quattro-DC gearless | 6.1 | 1360.8 | N/A | 23,725.0 | [82] | |
| 140.0; 35 | Traction regenerative, MG-DC gearless | 5.1 | 1360.8 | N/A | 33,507.0 | [82] | |
| 140.0; 35 | Traction regenerative, Quattro-DC gearless | 5.1 | 1360.8 | N/A | 13,833.5 | [82] | |
| Mid-rise | 81.0; 19(Moorhouse) | Gearless traction, KONE Mini-Space C7 | 4.0 | 2000.0 | N/A | 6900.0 | [83] |
| 75.0; 21 | Gearless traction | 2.5 | 1600.0 | Travel 170 Wh, idle 500 W, standby 120 W | 12,306.0 | [36] | |
| 72.0; 18 | Traction, VVVF, regenerative | 2–3.0 | 1800.0 | N/A | 20,622.5 | [84] | |
| 76.0; 19 | Traction regenerative, MG-DC gearless | 4.1 | 1360.8 | N/A | 25,367.5 | [82] | |
| 76.0; 19 | Traction regenerative, Quattro-DC gearless | 4.1 | 1360.8 | N/A | 9198.0 | [82] | |
| 73.7; 18 | Gearless traction | 2.5 | 1500.0 | 19.3 | 23,494.3 | [80] | |
| 68.1; 17 | Gearless traction | 2.5 | 1500.0 | 27.1 | 42,705.0 | [80] | |
| 60.9; 15 | Traction inductive AC non-regenerative | 3.1 | 1135.0 | N/A | 38,106.0 | [82] | |
| 60.9; 15 | Traction permanent magnet AC non-regenerative | 3.1 | 1135.0 | N/A | 28,449.0 | [82] | |
| 60.9; 15 | Traction SCR-DC regenerative | 3.1 | 1135.0 | N/A | 27,798.0 | [82] | |
| 60.9; 15 | Traction permanent magnet AC regenerative | 3.1 | 1135.0 | N/A | 14,690.0 | [82] | |
| 51.9; 13 | Gearless traction | 1.6 | 2000.0 | 18.0 | 23,925.8 | [80] | |
| 42.9; 11 | Gearless traction | 2.0 | 3000.0 | 40.0 | 50,008.7 | [80] | |
| N/A | Traction | 2.0 | 2000.0 | 19.0 | 17,700.0 | [79] | |
| N/A | Traction | 1.5 | 1000.0 | 13.0 | 4350.0 | [40] | |
| Low-rise | 27.5; 9 | Gearless traction | 1.0 | 630.0 | 4.2 | 3531.4 | [80] |
| 19.6; 8 | Gearless traction | 1.5 | 1000.0 | 21.0 | 4388.9 | [79] | |
| 26.0; 7 (Five boats, Duisburg) | Gearless traction, KONE Mono-Space C5 with energy-efficient options activated | 1.6 | 1000.0 | N/A | 5100.0 | [83] | |
| 18.0; 6 | Non-regenerative geared traction | N/A | N/A | N/A | 5800.0 | [85] | |
| 18.0; 6 | Non-regenerative geared traction | N/A | N/A | N/A | 6902.0 | [85] | |
| 18.0; 6 | Regenerative geared traction | N/A | N/A | N/A | 2441.0 | [85] | |
| 14.6; 4 | Gearless traction | 1.6 | 630.0 | 15.8 | 5010.7 | [80] | |
| 15.6; 4 | Geared traction | 1.0 | 800.0 | 6.7 | 2346.4 | [80] | |
| 11.8; 3 | Geared traction | 1.0 | 630.0 | 6.3 | 1956.0 | [80] | |
| 6.9; 2 | Gearless traction | 1.0 | 630.0 | 4.0 | 1827.9 | [80] | |
| Buildings | High-Rise Building | Low-Rise Building | ||
|---|---|---|---|---|
| Residential Apartment (HA) | Commercial Office (HO) | Residential Apartment (LA) | Commercial Office (LO) | |
| Efficiency class | D | B | A | B |
Publisher’s Note: MDPI stays neutral with regard to jurisdictional claims in published maps and institutional affiliations. |
© 2022 by the authors. Licensee MDPI, Basel, Switzerland. This article is an open access article distributed under the terms and conditions of the Creative Commons Attribution (CC BY) license (https://creativecommons.org/licenses/by/4.0/).
Share and Cite
Ang, J.H.; Yusup, Y.; Zaki, S.A.; Salehabadi, A.; Ahmad, M.I. Comprehensive Energy Consumption of Elevator Systems Based on Hybrid Approach of Measurement and Calculation in Low- and High-Rise Buildings of Tropical Climate towards Energy Efficiency. Sustainability 2022, 14, 4779. https://doi.org/10.3390/su14084779
Ang JH, Yusup Y, Zaki SA, Salehabadi A, Ahmad MI. Comprehensive Energy Consumption of Elevator Systems Based on Hybrid Approach of Measurement and Calculation in Low- and High-Rise Buildings of Tropical Climate towards Energy Efficiency. Sustainability. 2022; 14(8):4779. https://doi.org/10.3390/su14084779
Chicago/Turabian StyleAng, Jia Hui, Yusri Yusup, Sheikh Ahmad Zaki, Ali Salehabadi, and Mardiana Idayu Ahmad. 2022. "Comprehensive Energy Consumption of Elevator Systems Based on Hybrid Approach of Measurement and Calculation in Low- and High-Rise Buildings of Tropical Climate towards Energy Efficiency" Sustainability 14, no. 8: 4779. https://doi.org/10.3390/su14084779