
Urban Spatial Development Based on Multisource Data Analysis: A Case Study of Xianyang City’s Integration into Xi’an International Metropolis


1
Shaanxi Key Laboratory of Earth Surface System and Environmental Carrying Capacity, College of Urban and Environmental Sciences, Northwest University, Xi’an 710127, China
2
Institute of Qinling Mountains, Northwest University, Xi’an 710127, China
3
Yellow River Institute of Shaanxi Province, Northwest University, Xi’an 710127, China
4
The Research Center of Soil and Water Conservation and Ecological Environment, Chinese Academy of Sciences and Ministry of Education, Xianyang 712100, China
*
Authors to whom correspondence should be addressed.
Sustainability 2022, 14(7), 4090; https://doi.org/10.3390/su14074090
Submission received: 7 February 2022
/
Revised: 10 March 2022
/
Accepted: 22 March 2022
/
Published: 30 March 2022
(This article belongs to the Special Issue Urban Expansion Prediction and Land Use/Land Cover Change Modeling for Sustainable Urban Development)
Abstract
:The study of urban spatial development focuses on the process of urbanization, which involves the urban economy, population, the scale of urban construction land and the construction land’s structure. All this influences the economic structure, social structure and functional structure of the city. Taking Xianyang City, a core part of Xi’an international metropolis, as an example, this study, based on night light remote sensing data from 1992 to 2013, land use data from 1980 to 2015 (6 periods), AutoNavi Map (AMAP) Points of Interest (POI) data, and the patch-generated land use simulation model (PLUS), simulates the spatial–temporal pattern change characteristics of land use in Xianyang City from 2025 to 2035. The results show that: (1) During 1985–2015, urban land use showed a significant upward trend (p < 0.05); (2) From 1992 to 2013, the change in night light in the Xianyang City Administrative Region showed an upward trend. The gravitational center of Xianyang City’s built-up area moves southeast first and then northeast. After the beginning of 2010, the gravitational center of Xianyang City’s built-up area moved faster; (3) The distribution of different types of urban centers in Xianyang City is basically the same; (4) From 2005 to 2035, the overall land use in Xianyang City showed a trend of “multi polar explosive growth in construction land, slow growth in forest land, and first a decrease then an increase in wetland water body”. The urban spatial structure has changed from a single-center development model to a point–axis development model. The study of urban space development can provide some reference for the layout of urban construction in the future.
1. Introduction
Urban space consists of the urban material environment, functional activities and cultural values [1]. Urban spatial development is the primary form of urbanization, which is the process of the development of the urban economy and urban population, the gradual expansion of the urban construction land scale and the gradual adjustment of the land use structure, which can cause changes in the urban economic structure, social structure and functional structure [2]. Urban regionalization and urbanization show a two-way evolution trend. On the one hand, urban interior space needs to be constantly adjusted and improved to realize the optimization and coordinated development of various urban functions. On the other hand, the links between cities and the regions where they are located are strengthened, coordinated regional development is emphasized in terms of the population, function, industry, major transportation and infrastructure, and the development obstacles caused by administrative barriers and institutional constraints is eliminated. Therefore, an in-depth study of the urban spatial structure is carried out. This is of great significance to the rational layout of urban functional areas and the coordinated development between cities and regions. At present, the research on spatial development analysis mainly focuses on the optimization and adjustment of urban space, and on urban agglomerations within the region or among multiple cities with internal connections within the region [3,4]. With the development of big data technology, the research methods of urban spatial analysis mainly focus on using remote sensing data [5], thermal map data [6], Points of Interest (POI) data [7] and social media data [8]. Compared with traditional survey data, these data have a sample number, are easy to obtain, show more accurate details of the spatial location information, and meet the needs of urban studies.
Nighttime light data can reflect information closely related to the distribution of factors such as population [9] and city [10,11], and are mainly applied in the study of urban expansion and urbanization [12,13,14], the application of parameterization [15,16,17], and the spatial distribution of disasters and major events [18,19,20] in spatial planning. The dynamic development of the urban space of the data is divided into two categories. One category is traditional statistical data, but village- and town (street)-level administrative area statistics are not easy to obtain. For example, in the current public data, population data are counted in districts (counties), and there are no population data on administrative units at the street (township) level. At the same time, due to the traditional statistical methods of statistical caliber inconsistency and man-made factors, this process cannot accurately reflect the characteristics of urban space development. The other uses DMSP and VIIRS nighttime remote sensing data for analysis, which avoid the limitation of administrative boundaries. Mawenda et al. [21] integrated remotely sensed Landsat imageries from 1994, 2007 and 2018, and a geographic information system (GIS), to analyze the urban land use/land cover changes in Blantyre City, Southern Malawi.
Land use can reflect social and economic functions and activities, and reflect the development of urban space expansion. Land use data based on remote sensing interpretation can change the traditional method of land resource management, and reflect the status of land resources in a more accurate and fast way. At present, land use data are often used in the temporal analysis of urban spatial expansion [22,23]. POI usually contains information such as name, latitude and longitude, address, etc., which is easy to obtain and can be refined in large-scale units. However, as these data are mainly applied to residents’ daily lives, which thus yields a set of real-time changing data, only the data in a certain period can be obtained, and historical data are difficult to obtain. POI has been used in the study of urban structure [24,25,26] and urban boundary extraction [27,28]. Geographic cellular automata (CA) is a widely used spatiotemporal dynamic model of land use [29,30]. At present, the most commonly used simulation models for the future scenario of land use include the CA-Markov model, the CLUE-S model, the future land use simulation (FLUS) model and the patch-generated land use simulation (PLUS) model [31,32,33,34,35].
The general problems are that the simulation accuracy of small-scale modeling is high, and the simulation effect of large-scale modeling is poor. The existing CA model research focuses on improving the simulation algorithm and technology to improve the accuracy. Only a few CA studies have improved our understanding of the mechanisms of land use change through simulation. In addition, most CA models lack the ability to simulate the patch evolution of multiple land use types. For example, Simwanda et al. [36] presents a new framework to model drivers of urban LU changes in Lusaka, Zambia over the last 50 years using ground questionnaire surveys and the analytic network process (ANP). The FLUS model is improved on the basis of Cellular Automata, and adopts an artificial neural network model (ANN) to solve the complex problems of determining parameters in traditional cellular automata. Existing studies have shown that, compared with the other traditional models, such as CLUE-S, ANN-CA and Logistic-CA, the FLUS model has higher simulation accuracies [37,38]. Based on FLUS model, the PLUS model adopts a land expansion analysis strategy (LEAS) and the CA model, based on multiple types of random seeds (CARS). Compared with other models, the PLUS model can identify the drivers of land expansion and project landscape dynamics. The PLUS model is widely used in land use simulation. Liang et al. [39] combined the new land expansion analysis strategy (LEAS) with the CA model based on multiple types of random patch seeds, and proposed the PLUS model to simulate land use structure under different optimization scenarios. The results show that the simulation accuracy of the PLUS model was better than that of the FLUS model. However, the PLUS model is not able to simulate the evolution of land use components at the sub-cellular scale.
As one of the core cities of the Great Xi’an, Xianyang City faces the important task of developing the Great Xi’an, together with Xi’an City and the Xixian new area, benefiting from the driving force of Xi’an City. At the same time, due to the historical industrial similarity, administrative barriers, and other factors, its development is restrained to some extent. In this context, Xianyang City needs to make a breakthrough development with the help of Xi’an City and update its urban development model and strategy in order to affect the urban spatial development structure. Based on the land use transfer matrix, this study analyzes the changes in various land uses in the process of the urban spatial integration and development of Xianyang City from 1980 to 2015, and determines the characteristics, development focus and direction of the urbanization process of Xianyang City. On this basis, based on the land use grid data from 2005 to 2015, the PLUS model is used to simulate the land use of Xianyang City in 2025 and 2035, in order to provide suggestions for the future urban development direction.
2. Overview and Scope of the Study Area
2.1. Overview of the Study Area
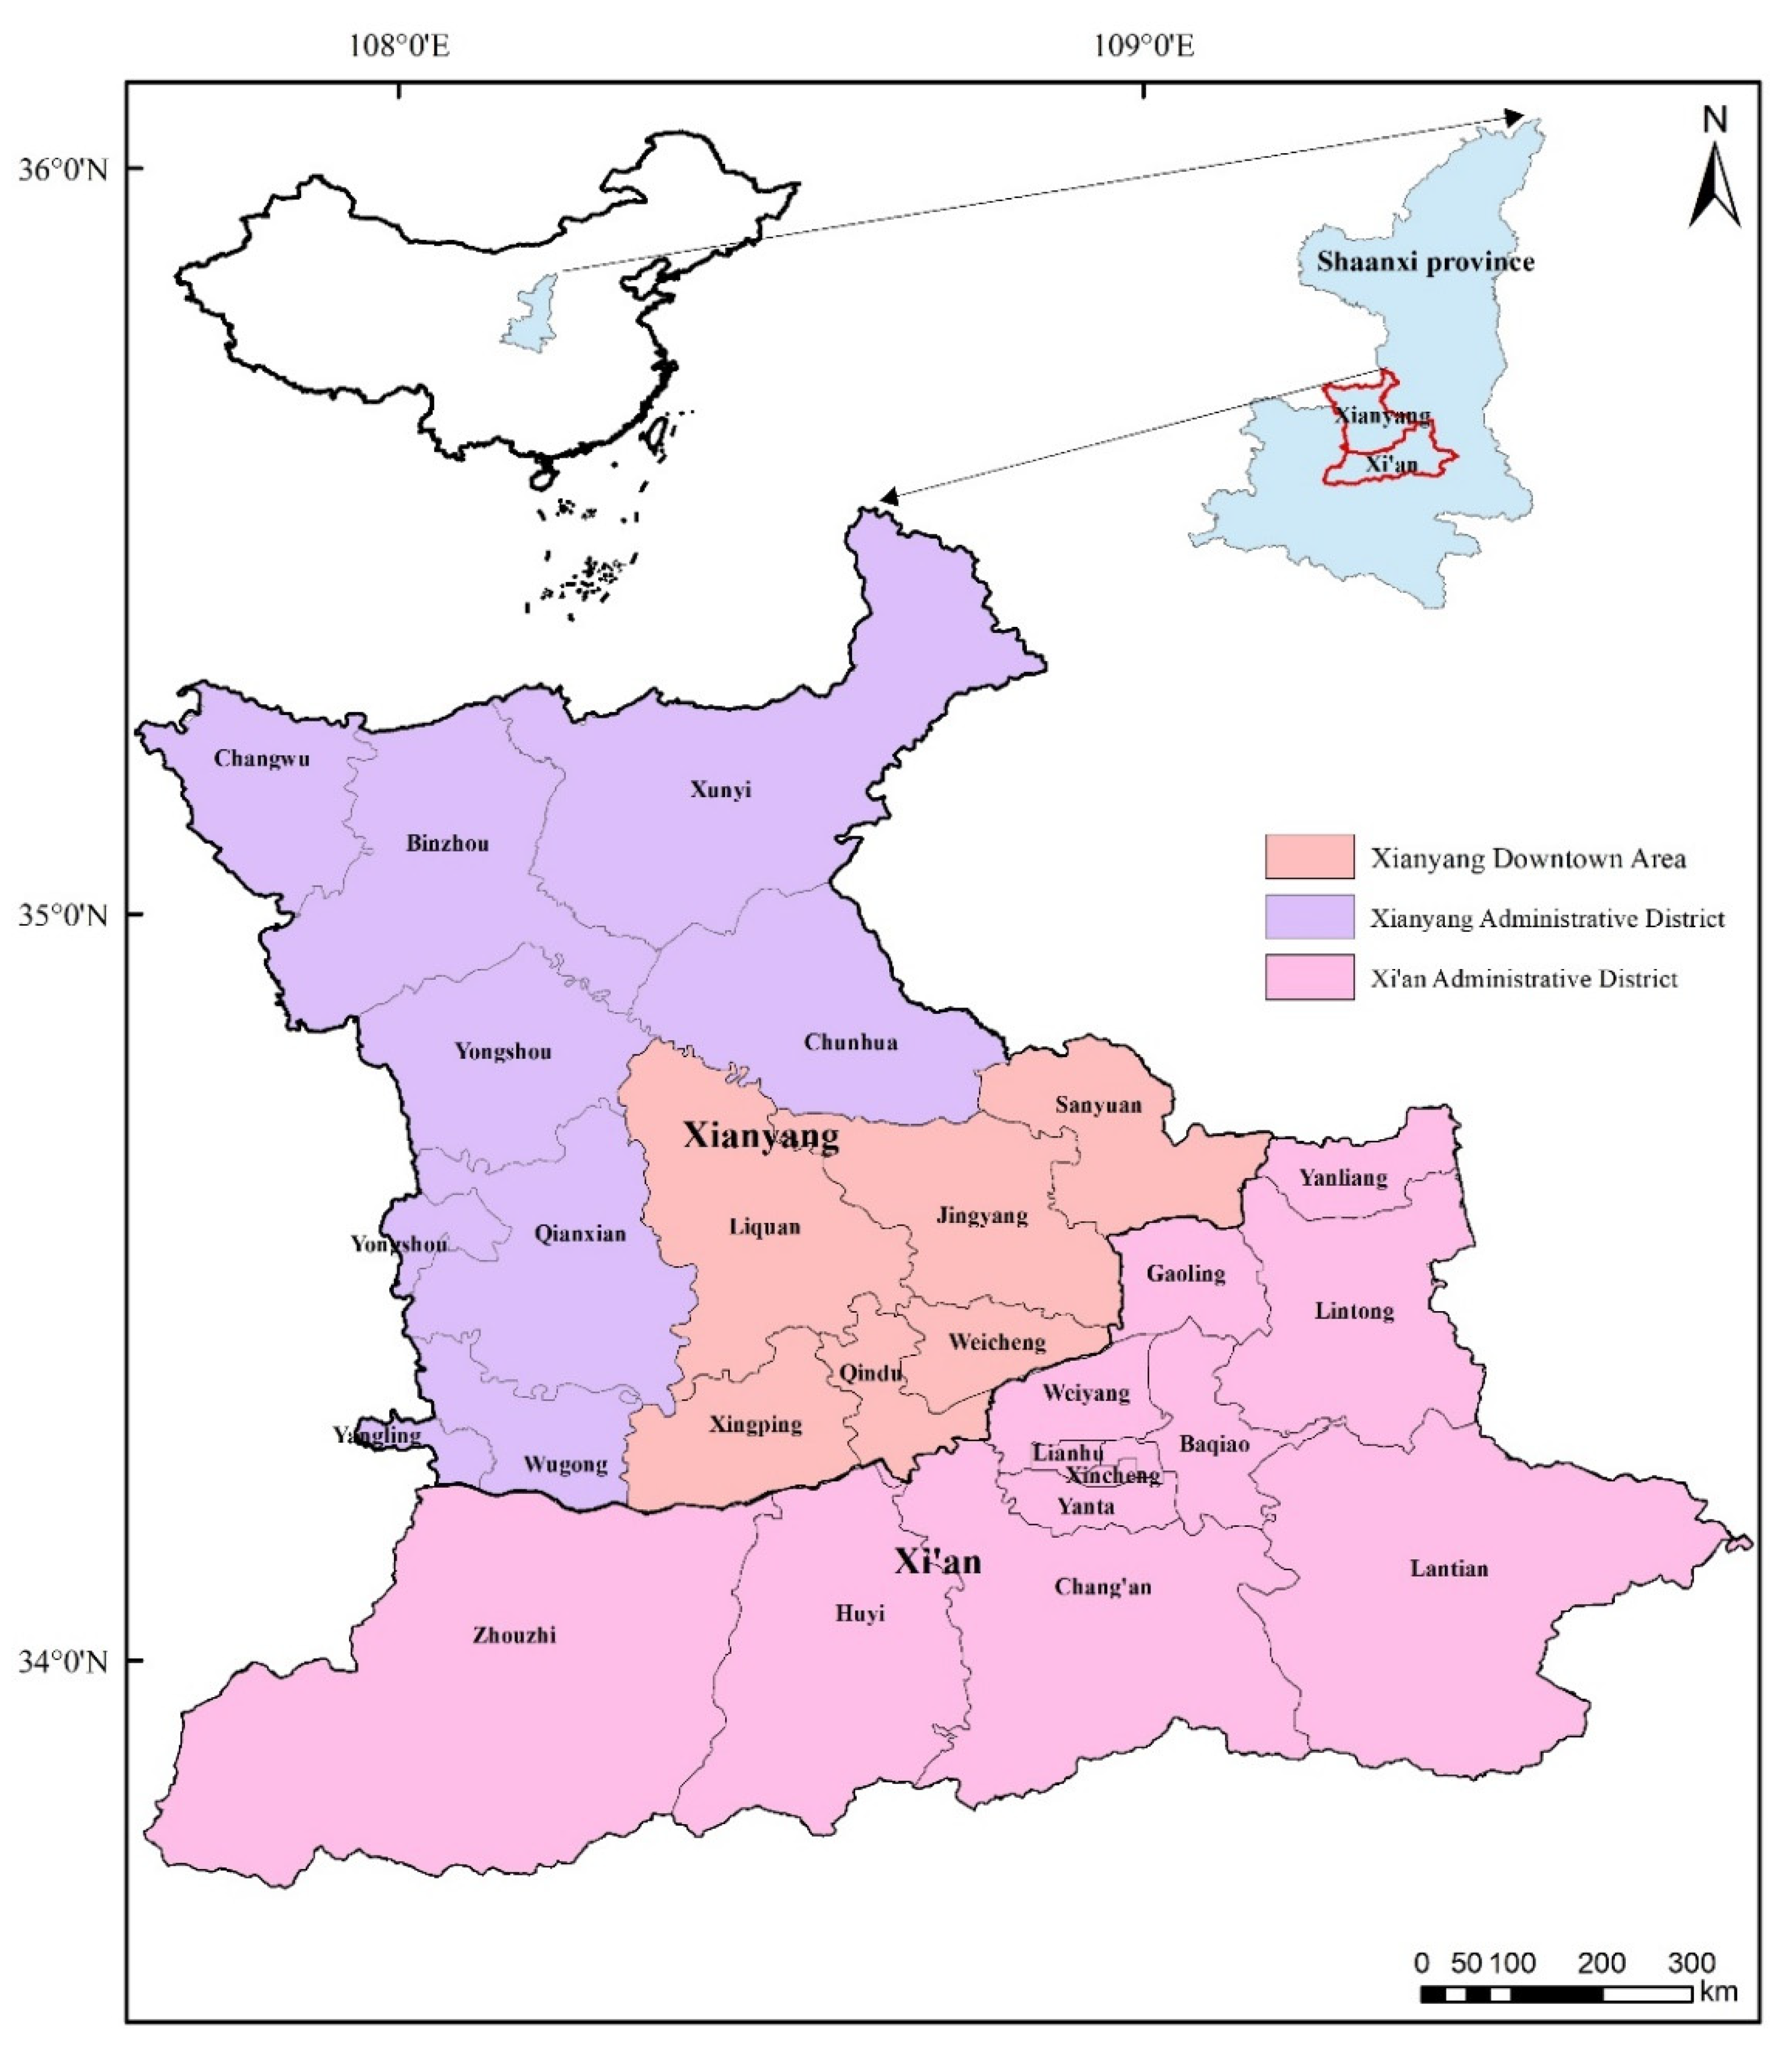
Xianyang City is located in the central Guanzhong Plain, with a total area of 10,189.4 square kilometers (among which the Xi Xian New Area is entrusted to Xi’an City, including 15 towns or streets of Xianyang City, covering an area of 644.56 square kilometers). The city has jurisdiction over two districts, two cities and nine counties, including Qindu District, Weicheng District, Xingping City, Binzhou City, Wugong County, as well as nine other counties, 126 towns, and 25 subdistrict offices.
2.2. Range of Study
This study takes Xianyang City as the research object, and the research scope is divided into three levels: (1) The first level is the administrative jurisdiction of Xianyang City and Xi’an City (including Xi Xian New Area). (2) The second level is the administrative jurisdiction of Xianyang City. Since January 2017, 15 towns and streets in Xianyang City have been taken over by the Xi Xian New Area, with a total area of 644.56 square kilometers and a population of approximately 670,000. (3) The third level is the central urban area—considering the influence of the Xianyang City Master Plan (2015–2030) and the factors of administrative integrity, the central urban area is divided into Qindu District, Weicheng District, Xingping City, Licquan County, Sanyuan County and Jingyang County (Figure 1).
3. Data Analysis and Processing
3.1. Data Sources
3.1.1. Land Use Data
In this study, six periods of land use data from 1980, 1990, 2000, 2005, 2010 and 2015 were selected as the data sources. These six periods of land use data were derived from Landsat remote sensing image interpretation results, with a spatial resolution of 30 m. Data were downloaded from the Resources and Environmental Science and Data Center (http://www.resdc.cn, 6 February 2022), Institute of Geographic Sciences and Natural Resources Research, Chinese academy of sciences.
3.1.2. Night Light Data
The DMSP/OLS data from 1992 to 2013 (22 years) were used to study the response of the city’s gravitational center to urban expansion. For 1992 to 2013, version 4 global DMSP/OLS night light data were obtained from the NOAA/NGDC website (http://www.ngdc.noaa.gov/dmsp/download.html, 6 February 2022). The spatial resolution of the data is 0.00833° (approximately 1000 m), with pixel values ranging from 0 to 63. The higher the brightness value of the light, the higher the probability that the data will contain towns and other types of stable lighting. The data are rigorously processed to eliminate the effects of fire, sunlight, moonlight, clouds and auroras. Stable lighting data include light sources from cities, towns, etc., with longer durations and removed background noise. Since the DMSP nighttime light dataset is archived by multiple DMSP satellites (F10, F12, F14, F15, F16, AND F18), data overlaps occur, and the total amount of original nighttime light from different satellites varies in the same year. Therefore, data preprocessing is required before use.
3.1.3. POI Data
The POI data differ from high-resolution images, where the light brightness, road density, and POI density can yield information about both location and economy. As they are free and developing rapidly, the open data are widely used [40]. The POI data used in this study are derived from more than 530,000 AutoNavi Map (AMAP) POI data points captured through the network from 2016 to 2019. A total of 306,533 valid data points were obtained after the weight removal, correction and screening verification of the data. POI data are mainly used for navigation, and contain the spatial locations and attribute forms of most entity objects in the city, which gives an abstract representation of entity objects on the map. POI data can be considered to contain approximately all research objects in the urban space. According to the different functions of cities and AMAP POI classification systems, POI data are divided into five categories: public service, life service, leisure and entertainment, residences and businesses (Table 1).
3.1.4. Input Data Related to Land Use Simulation
The input data used for land use simulation mainly include: ① Land use grid data (2005 and 2015), soil types, rivers, population and GDP spatial distribution data from the Resource and Environment Science and Data Center (http://www.resdc.cn, 6 February 2022). The land types of land use grid data are divided into cultivated land, grassland, forest land, water area, unused land and construction land, with a resolution of 30 m. The interpretation accuracy of the construction land and cultivated land type is above 95%, and the precision of other geotypes is above 90%. The raster data of cultivated land in the study area were obtained using the tool of attribute extraction in the ArcGIS software. ② Data on highways, railways, primary and secondary roads and locations of government buildings were obtained from BIGMAP (http://www.bigemap.com, 6 February 2022) in 2015. ③ DEM data were obtained from the geospatial data cloud platform (http://www.gscloud.cn, 6 February 2022), and slope data were extracted by ArcGIS.
3.2. Methods
3.2.1. Analysis of the City’s Gravitational Center Change
- (1)
- Pretreatment of night light data
Since the DMSP nighttime light dataset is archived by multiple DMSP satellites (F10, F12, F14, F15, F16, AND F18), data overlap exists, and the total amount of original nighttime light of different satellites varies for the same year. Therefore, it needs to be corrected before use.
Calibration between different DMSP satellites: To improve the accuracy of data, the invariant target area method was used to calibrate the nighttime light images extracted annually from Xi’an City and Xianyang City administrative regions before the extraction of urban built-up areas [41]. The invariant target region method includes mutual correction, saturation correction, and continuity correction between images. This method has been widely used [42], and is considered to have high reliability.
- (2)
- Extraction of built-up areas
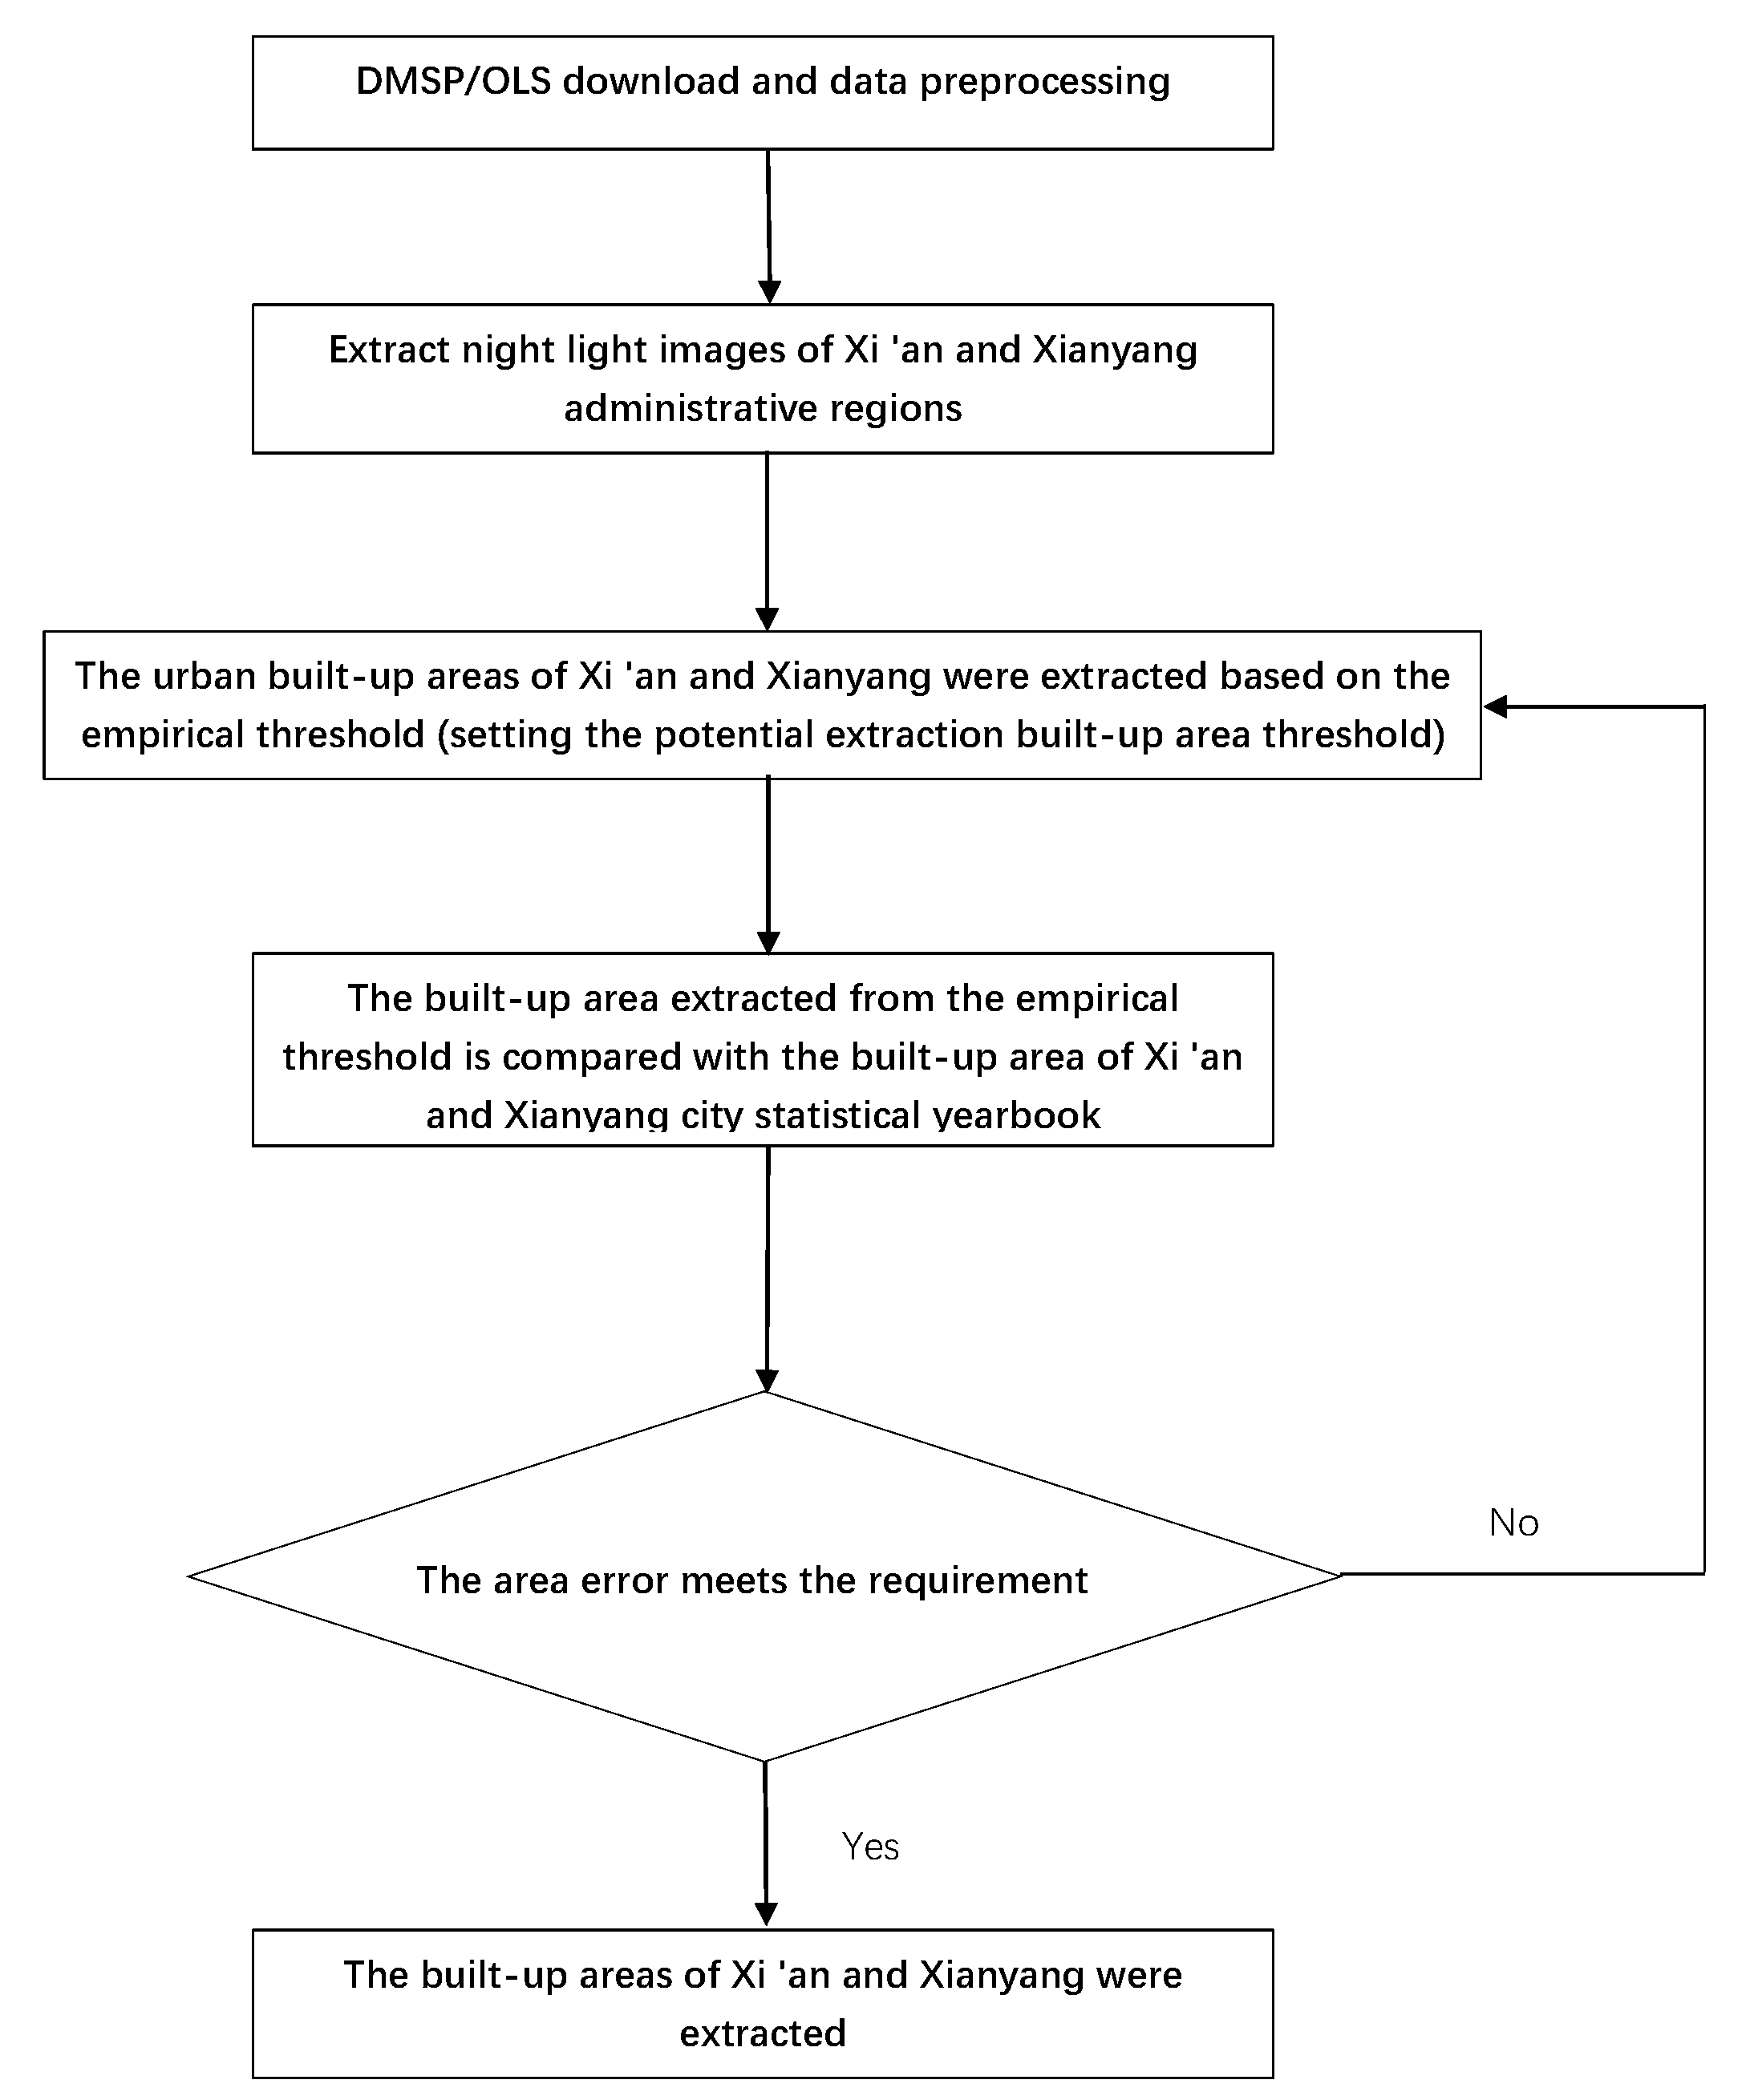
In this study, the dichotomy method was adopted to extract the urban built-up areas of Xi’an City and Xianyang City. The specific operation process is shown in the flow chart (Figure 2). First, data preprocessing of downloaded DMSP/OLS nighttime light images was carried out, including multi-sensor image DN value correction, data projection conversion, data interannual correction, etc. After that, mask extraction of DMSP/OLS was carried out on the boundaries of the Xi’an City and the Xianyang City administrative regions to obtain nighttime light data images of the study area [10,43].
For Xi’an City and Xianyang City, using dichotomy to extract the built up area, the specific approach is as follows: first, set the potential thresholds () for and , respectively, for a year of research in the area of the images in order to extract the proper maximum and minimum values, and do the same for the year of the urban statistical yearbook, , in the built up part of the study area. can be expressed as follows:
Given , the extracted area of the urban built-up area is , and is:
where represents a gray value between and in the image medium in the built-up area to be extracted, and F () is the total number of pixels in the research area when the gray value is .
The urban built-up area extracted based on the threshold value is compared with the corresponding built-up area in the urban statistical yearbook. If the area error meets the requirements, the built-up areas of Xi’an City and Xianyang City are extracted (output). Otherwise, the threshold of urban built-up area extraction will be reset to extract the urban built-up area until the area error reaches the requirement. According to this method, urban built-up areas of Xi’an City and Xianyang City were extracted year by year (Figure 2).
- (3)
- Extraction of city’s gravitational center
The gravitational centers of Xi’an City and the Xianyang City urban built-up areas are calculated using the brightness of lights at night. The calculation formula is as follows:
and in Equations (3) and (4), respectively, are the extracted coordinates of the city’s gravitational center, represents the gray value of the ith pixel, and and represent the coordinates of the ith pixel.
The change or migration of the gravitational center in Xi’an City and Xianyang City can reflect the change in urban spatial distribution. In this study, the migration distance , the average migration velocity and the migration angle of Xi’an City and Xianyang City are further calculated. The calculation formula used is as follows:
In Equations (3)–(5), , , , and represent the coordinates of the city’s gravitational center in the early and late stages, respectively, and is the time interval.
3.2.2. Land Use Transfer Matrix
The land use transfer matrix can not only reflect the structural characteristics of land use, but it also reflects the sources and compositions of various land uses during the study period. The mathematical formula of the land use transfer matrix is as follows:
where represents the area, represents the number of land use types, and and represent the land use types at the beginning and end of the study period, respectively.
3.2.3. Kernel Density Estimation
Kernel density analysis is a continuous simulation method of spatial point data distribution. At present, kernel density analysis is mainly used to calculate the urban spatial distribution of elements. In this paper, by using the kernel density function to compute the city’s hot data gathering area, according to the unit grid of POI data density values, to estimate the density of its surroundings, and by exploring Xianyang City as a whole along with the spatial distribution and accumulation characteristics of different types of POIs between different functions of the city center in terms of city space differentiation and spatial correlation characteristics, we found that it is more important to determine the distribution and change of different types of urban centers over four consecutive years.
The calculation formula of the kernel density function is as follows:
where is the estimated kernel density at ; is the search radius of the kernel density function; is the number of samples; is the distance between POI and ; and is the distance weight.
3.2.4. PLUS Model
Based on the land use data of Xianyang City in 2005 and 2015, this study takes DEM, slope, NDVI, soil type, distance from the water area, distance from the level of road, distance from the secondary road, distance from the main road, distance from the highway, distance from other road, and distance from the railway as the driving factors of land use change, and water area as a limiting factor of land use change. Firstly, the feasibility and accuracy of using the PLUS model to simulate land use data with 30 m resolution on a large scale were verified, and the land use data of Xianyang City in 2025 and 2035 were simulated with natural development scenarios.
The simulation of land use in Xianyang City is divided into two steps: (1) Based on the land use data of 2005, the data of 2015 were simulated, and the real data of 2015 were used for precision analysis. The accuracy analysis adopted the Kappa coefficient as the basis, and a Kappa coefficient higher than 0.75 is highly consistent (see reference). (2) If the simulation accuracy met the requirements, the land use data in 2025 and 2035 were simulated with the natural development scenario. The future demand of each land use type (namely, the area of each region) under the natural development scenario was predicted using the Markov chain module integrated with the PLUS model.
In this study, the land use data for 2005 were used to simulate the land use in 2015, and the actual land use in 2015 was used to verify the simulation results. The input data of the PLUS model were the land use grid data (2005 and 2015), soil types, annual mean temperature, annual precipitation, population and GDP spatial distribution data (Table 2). Except for the spatial resolution of the land use data, which was 30 m, the spatial resolution of other input data was 1000 m, and the spatial resolution was uniformly resampled to 30 m and input into the PLUS model. The Kappa coefficient of land use simulation results and actual land use in 2015 was 0.889, indicating that the PLUS model has a good effect on land use simulation in Xianyang, and can be used to simulate future land use in Xianyang.
4. Results
4.1. Gravitaitonal Center Change in Xi’an City and Xianyang City Based on Night Light Data
- (1)
- The changing trend of night light in the Xi’an and Xianyang administrative regions
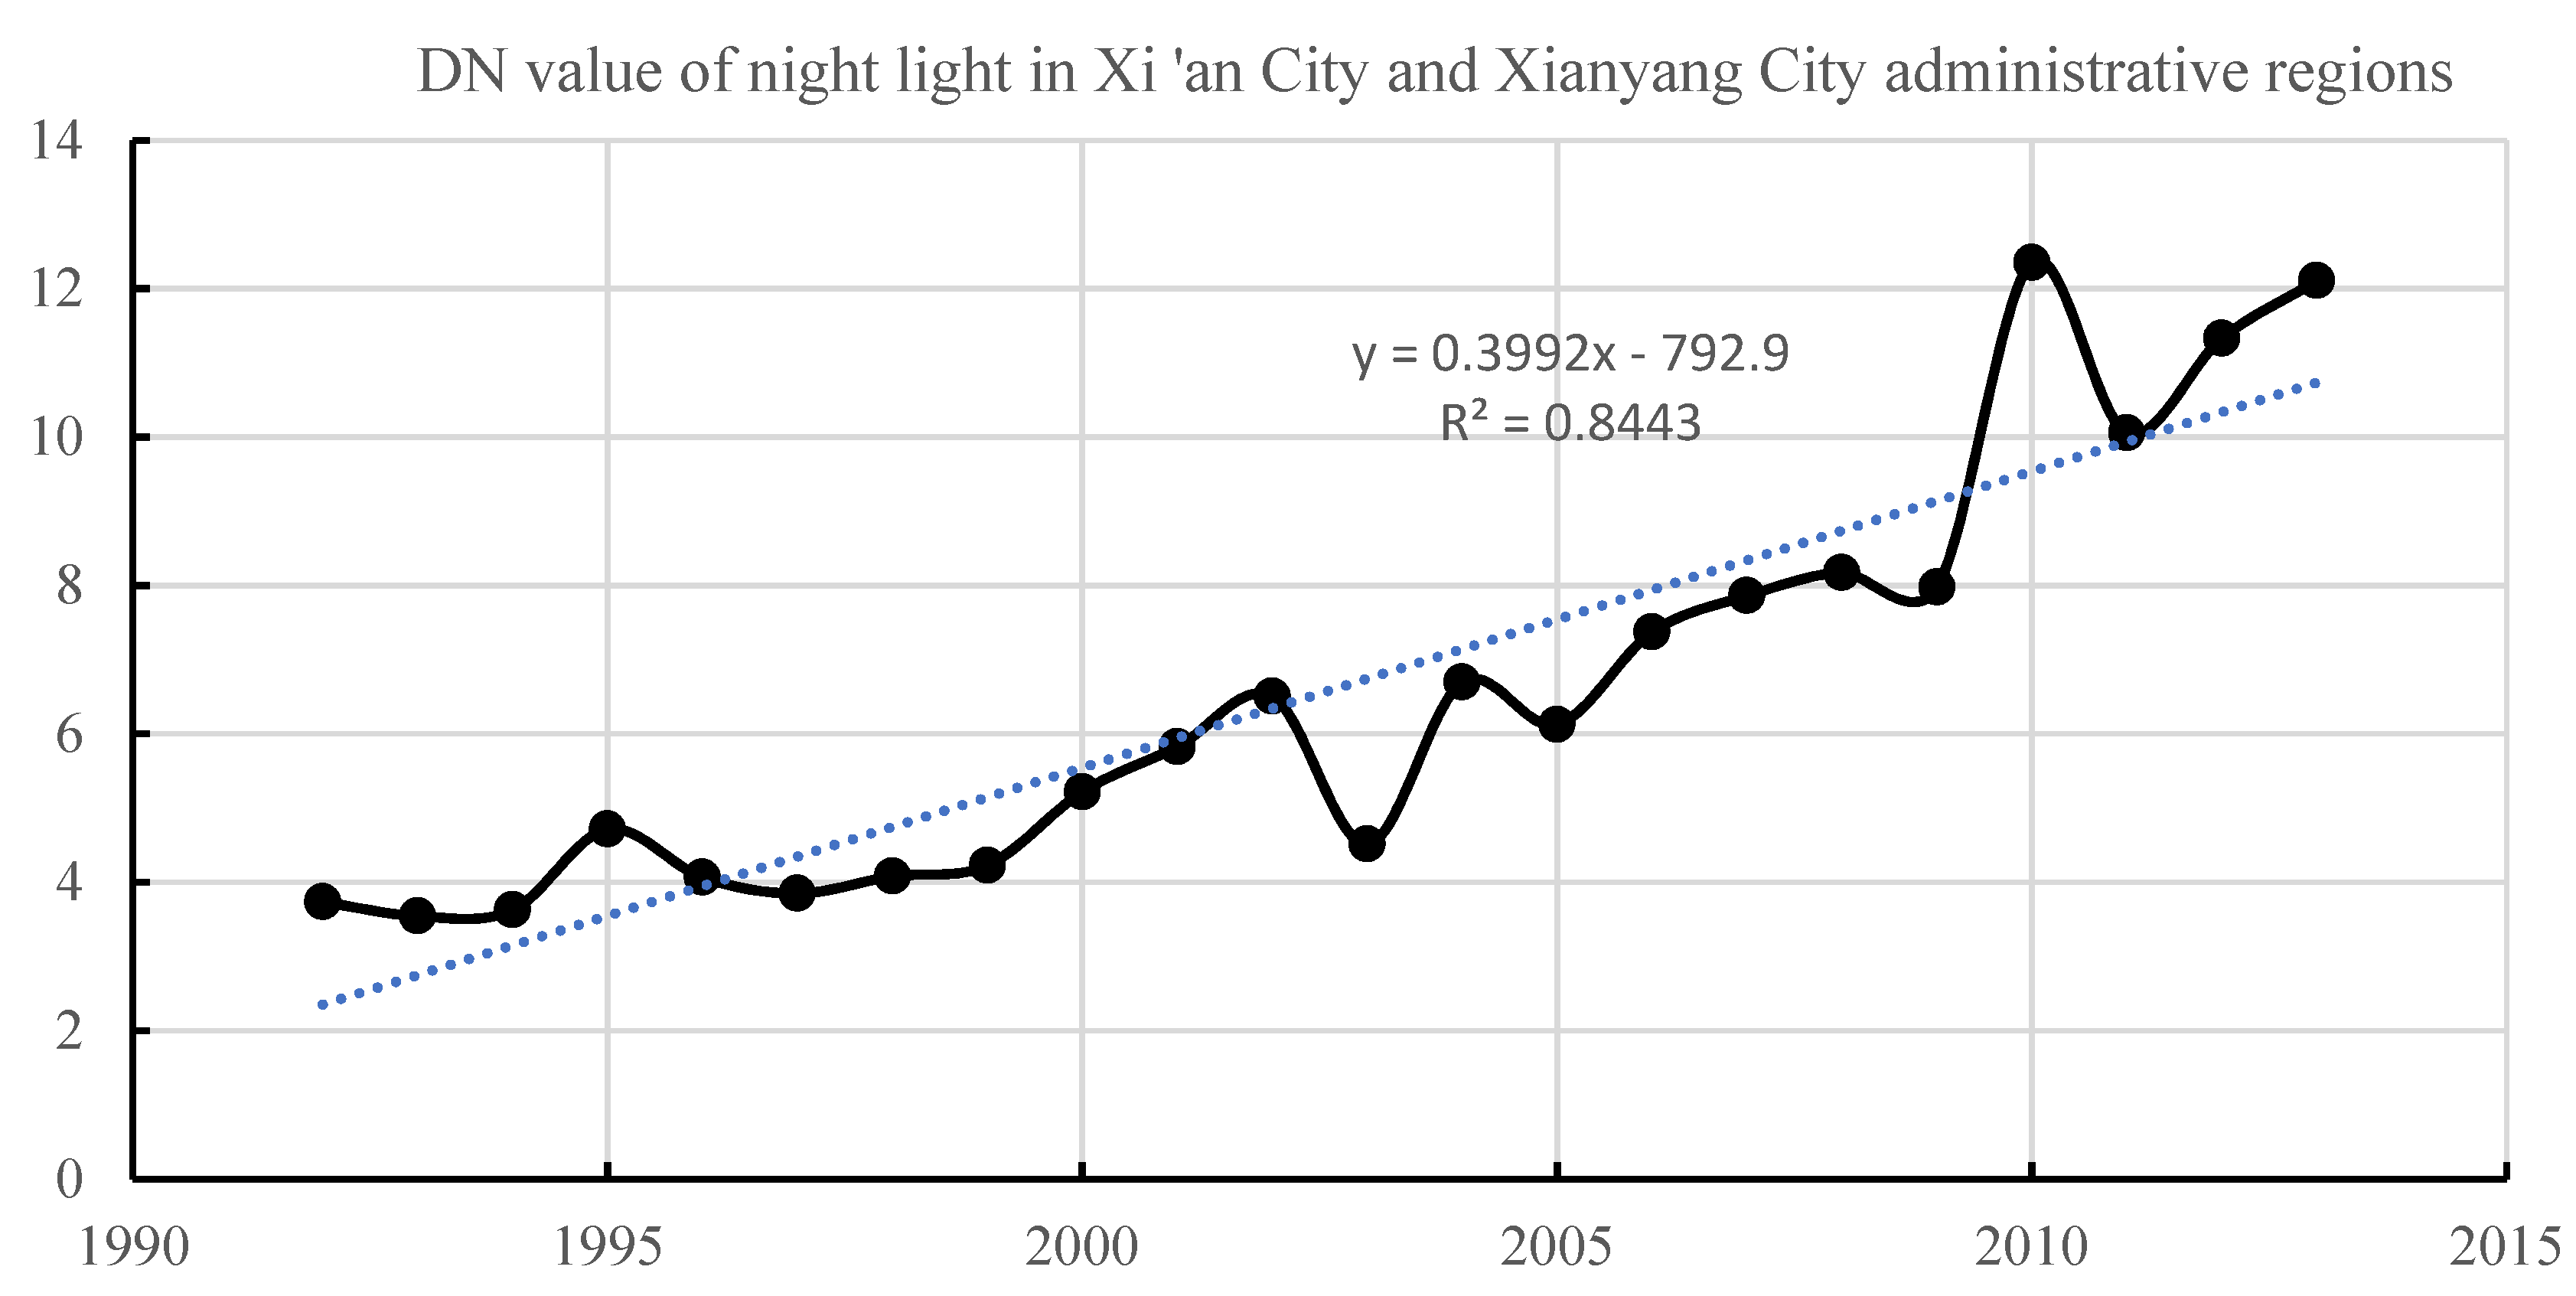
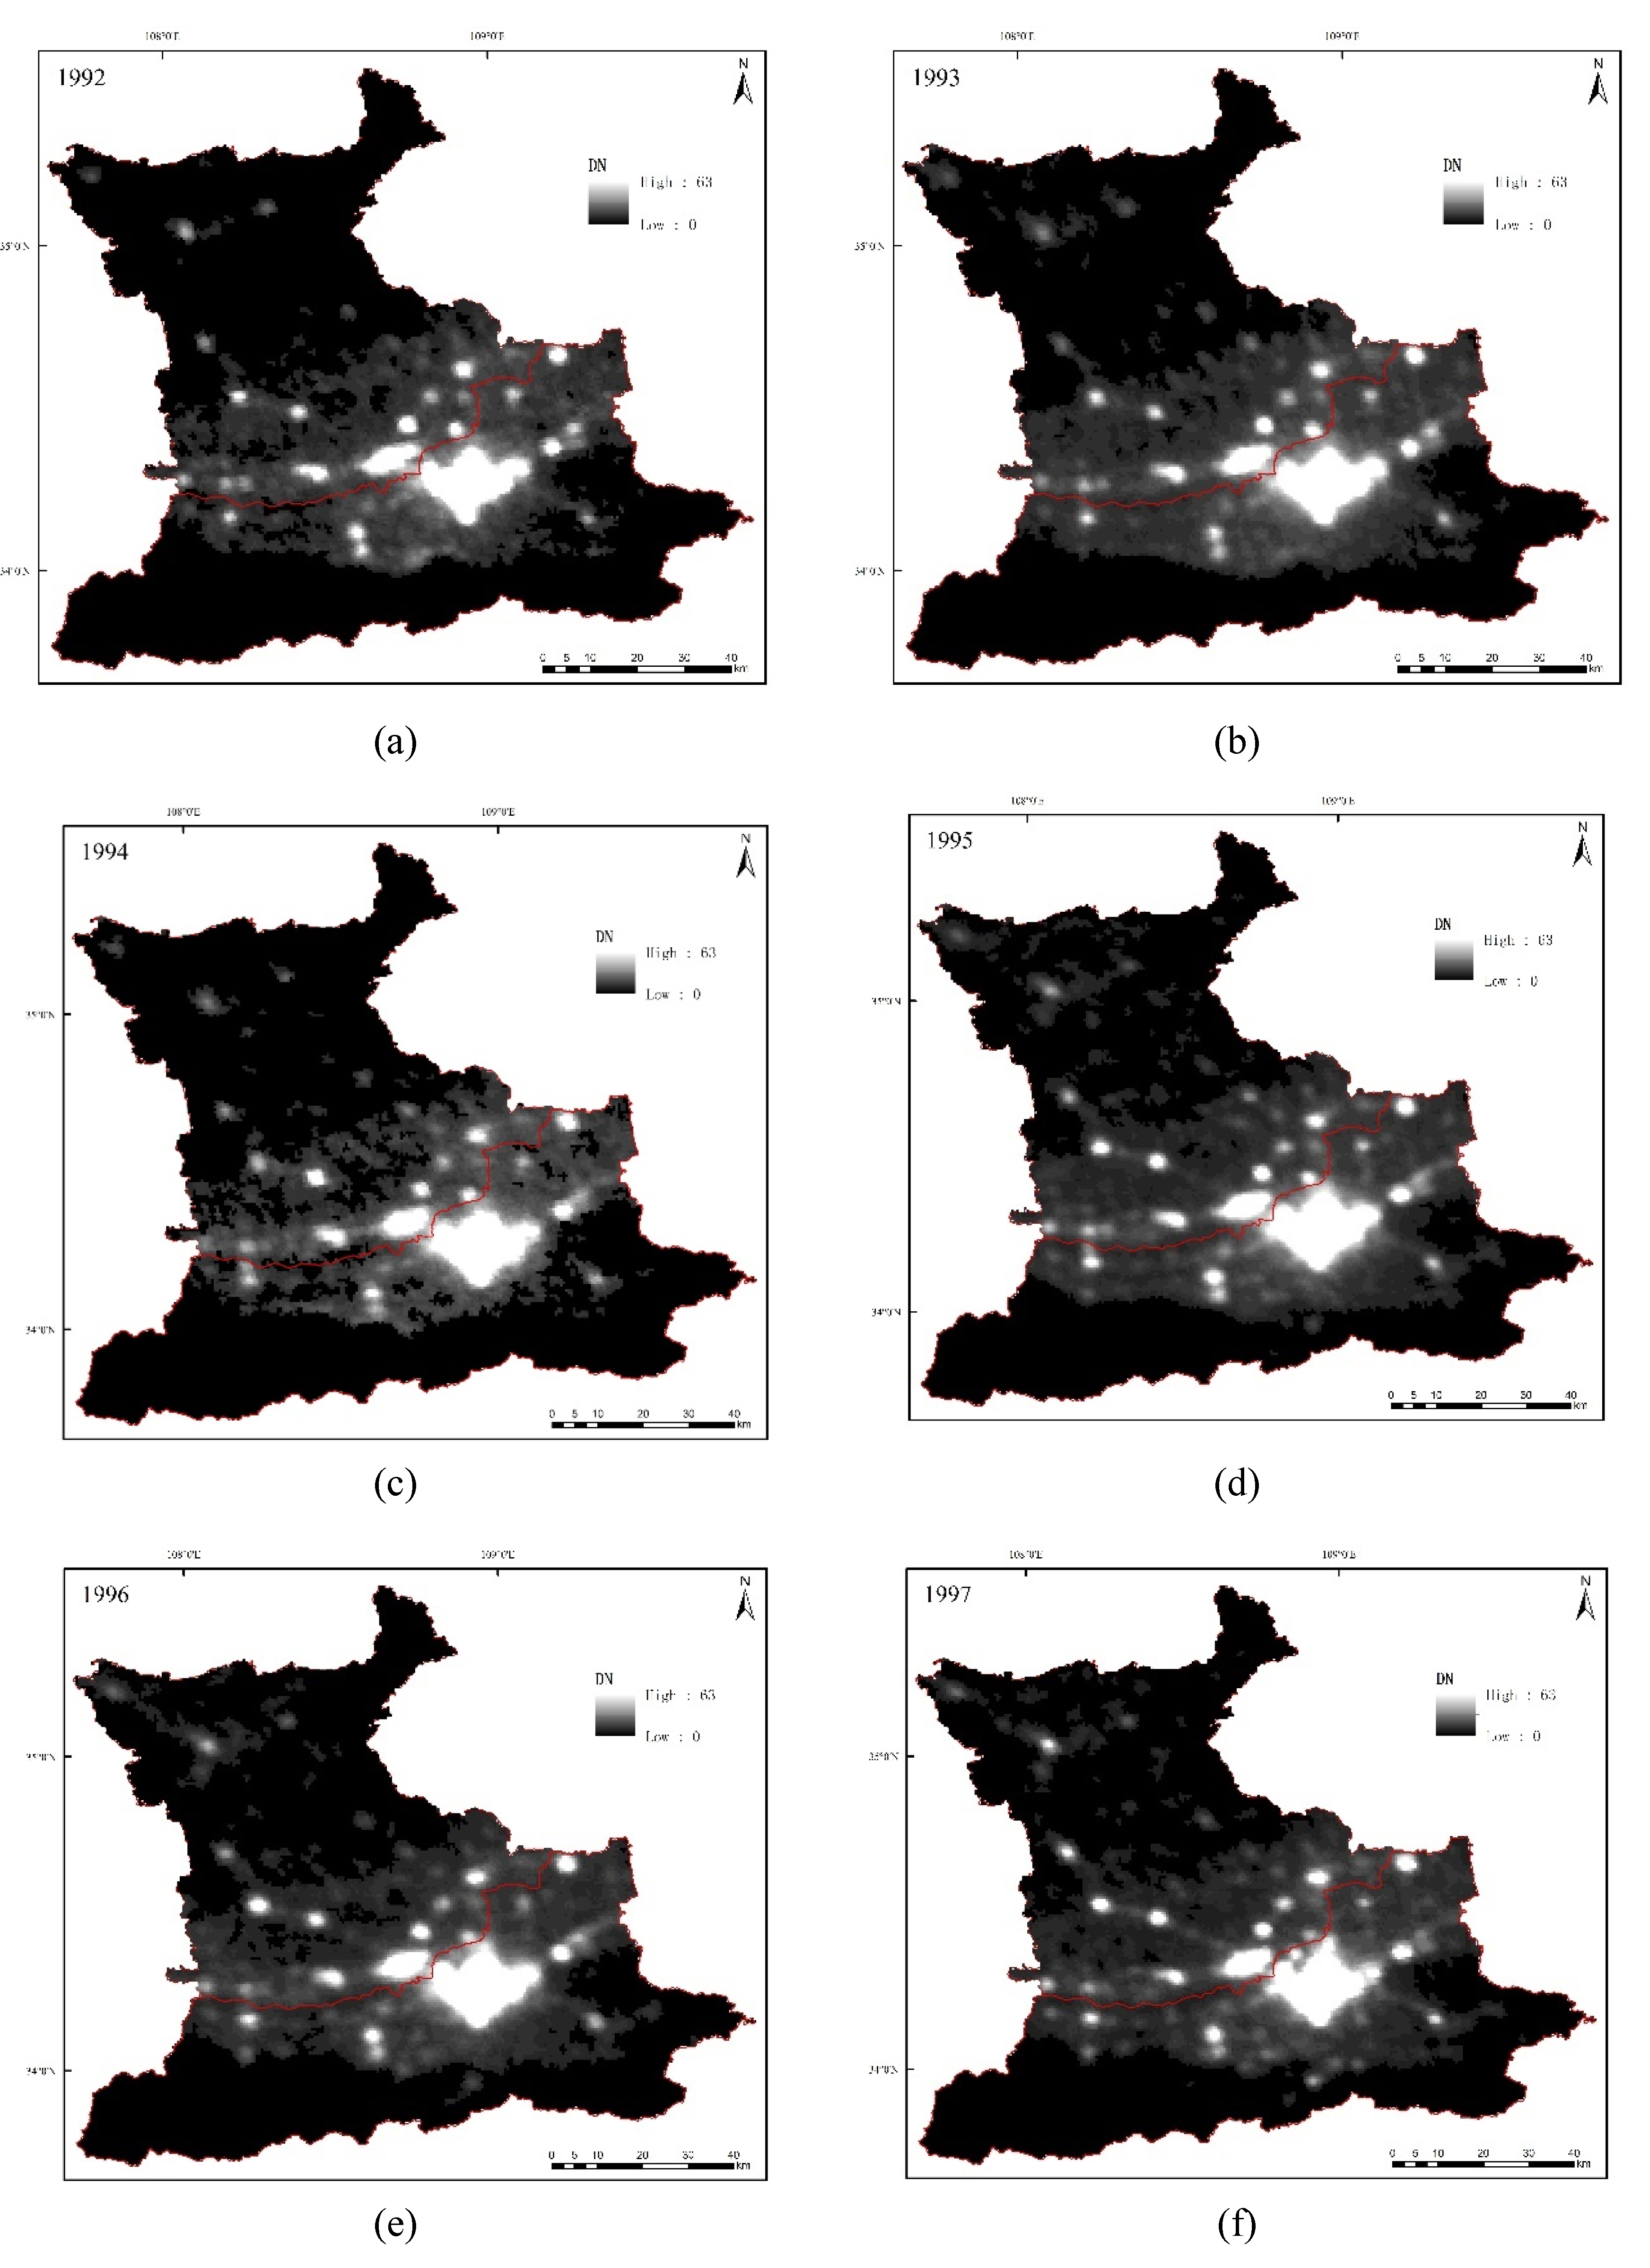
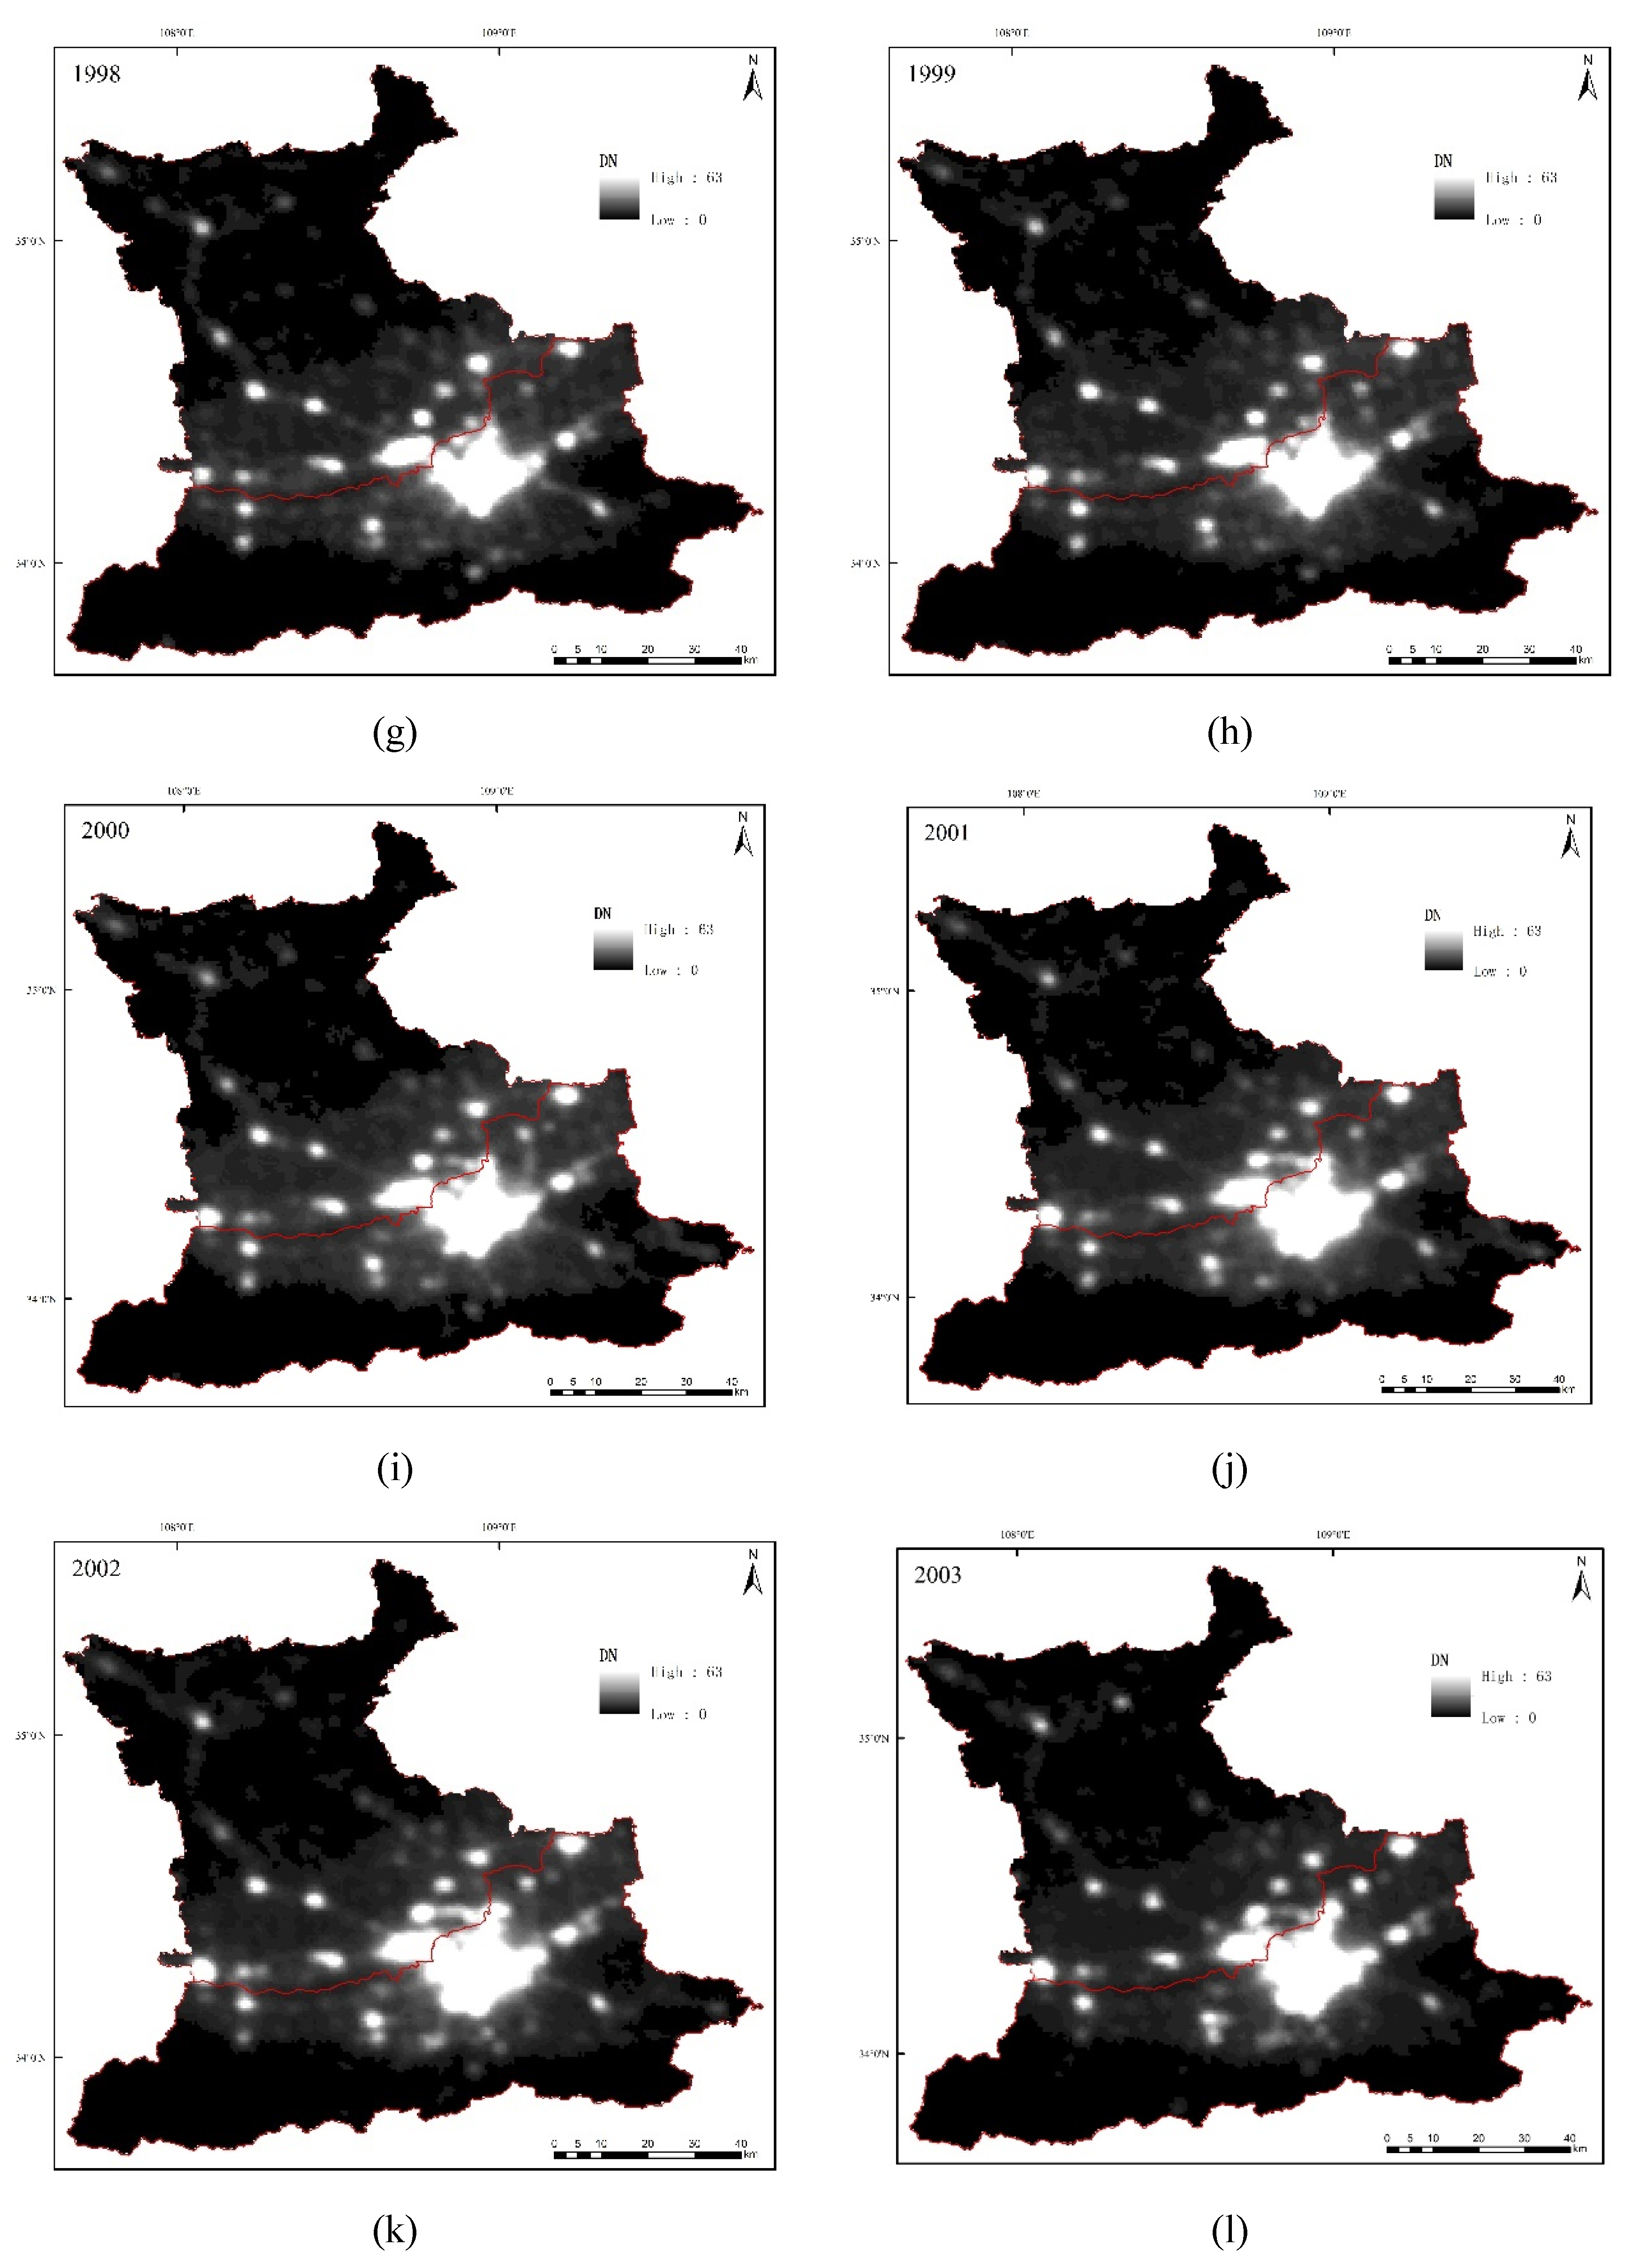
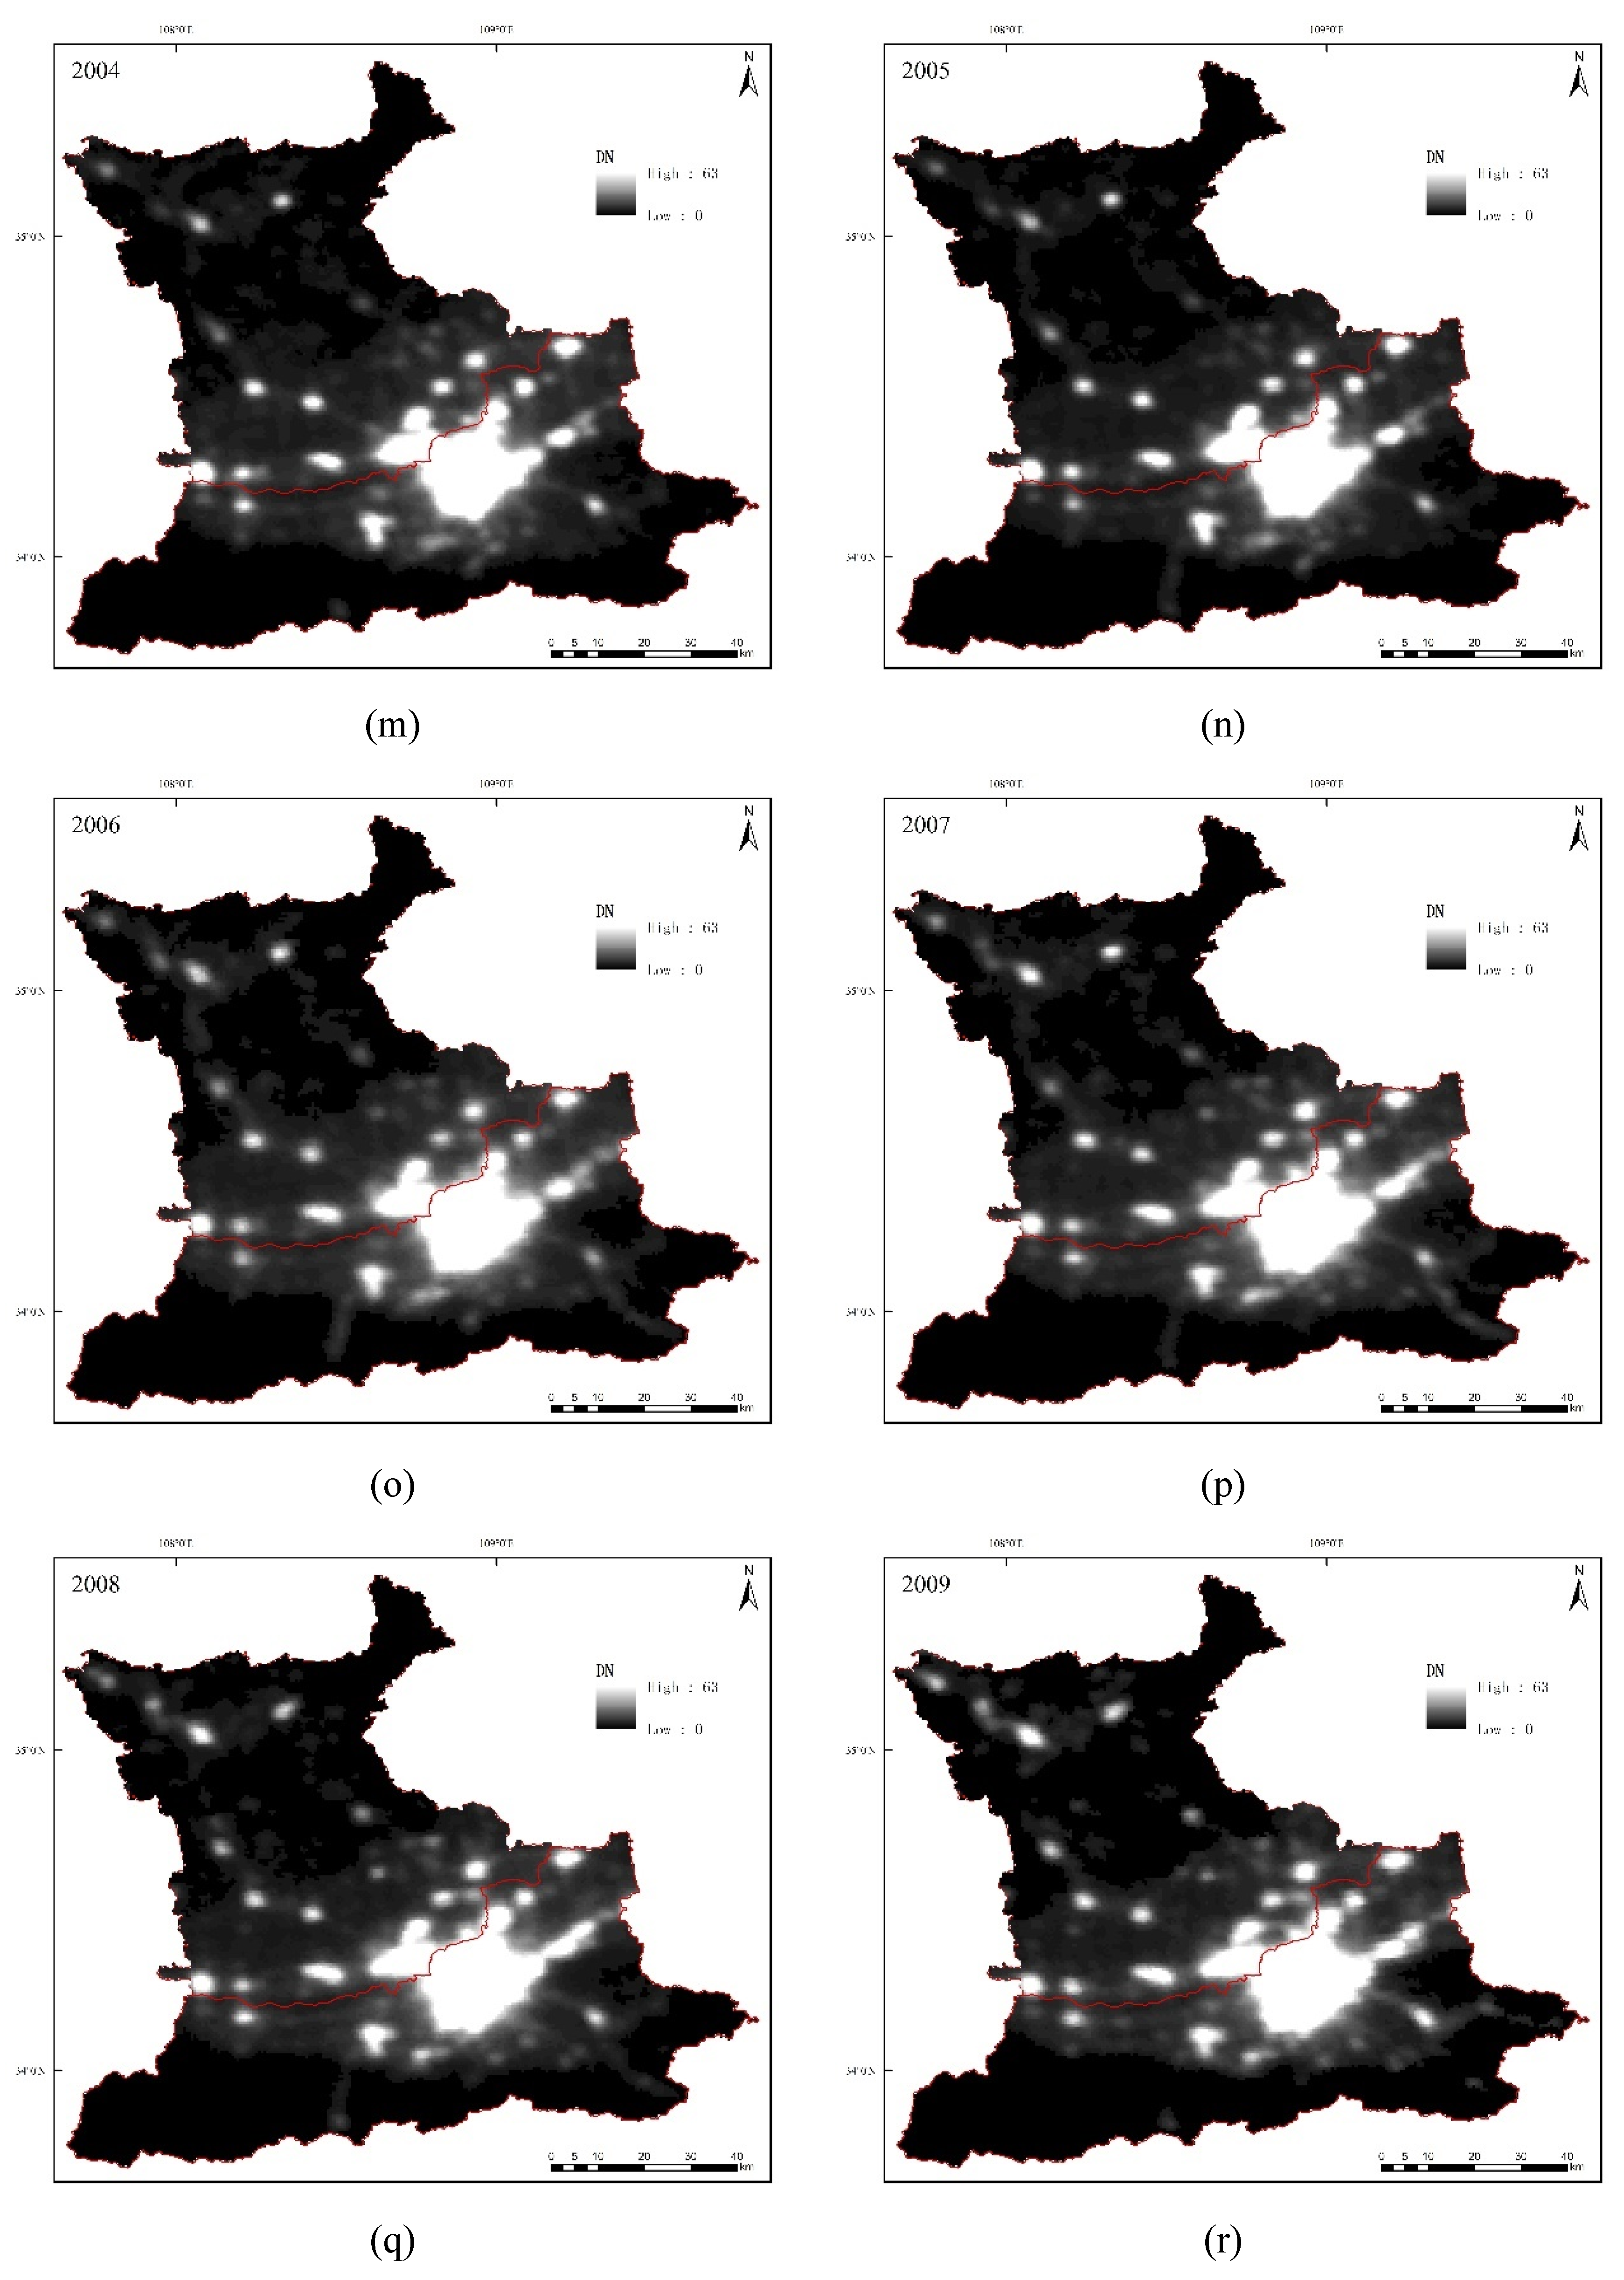
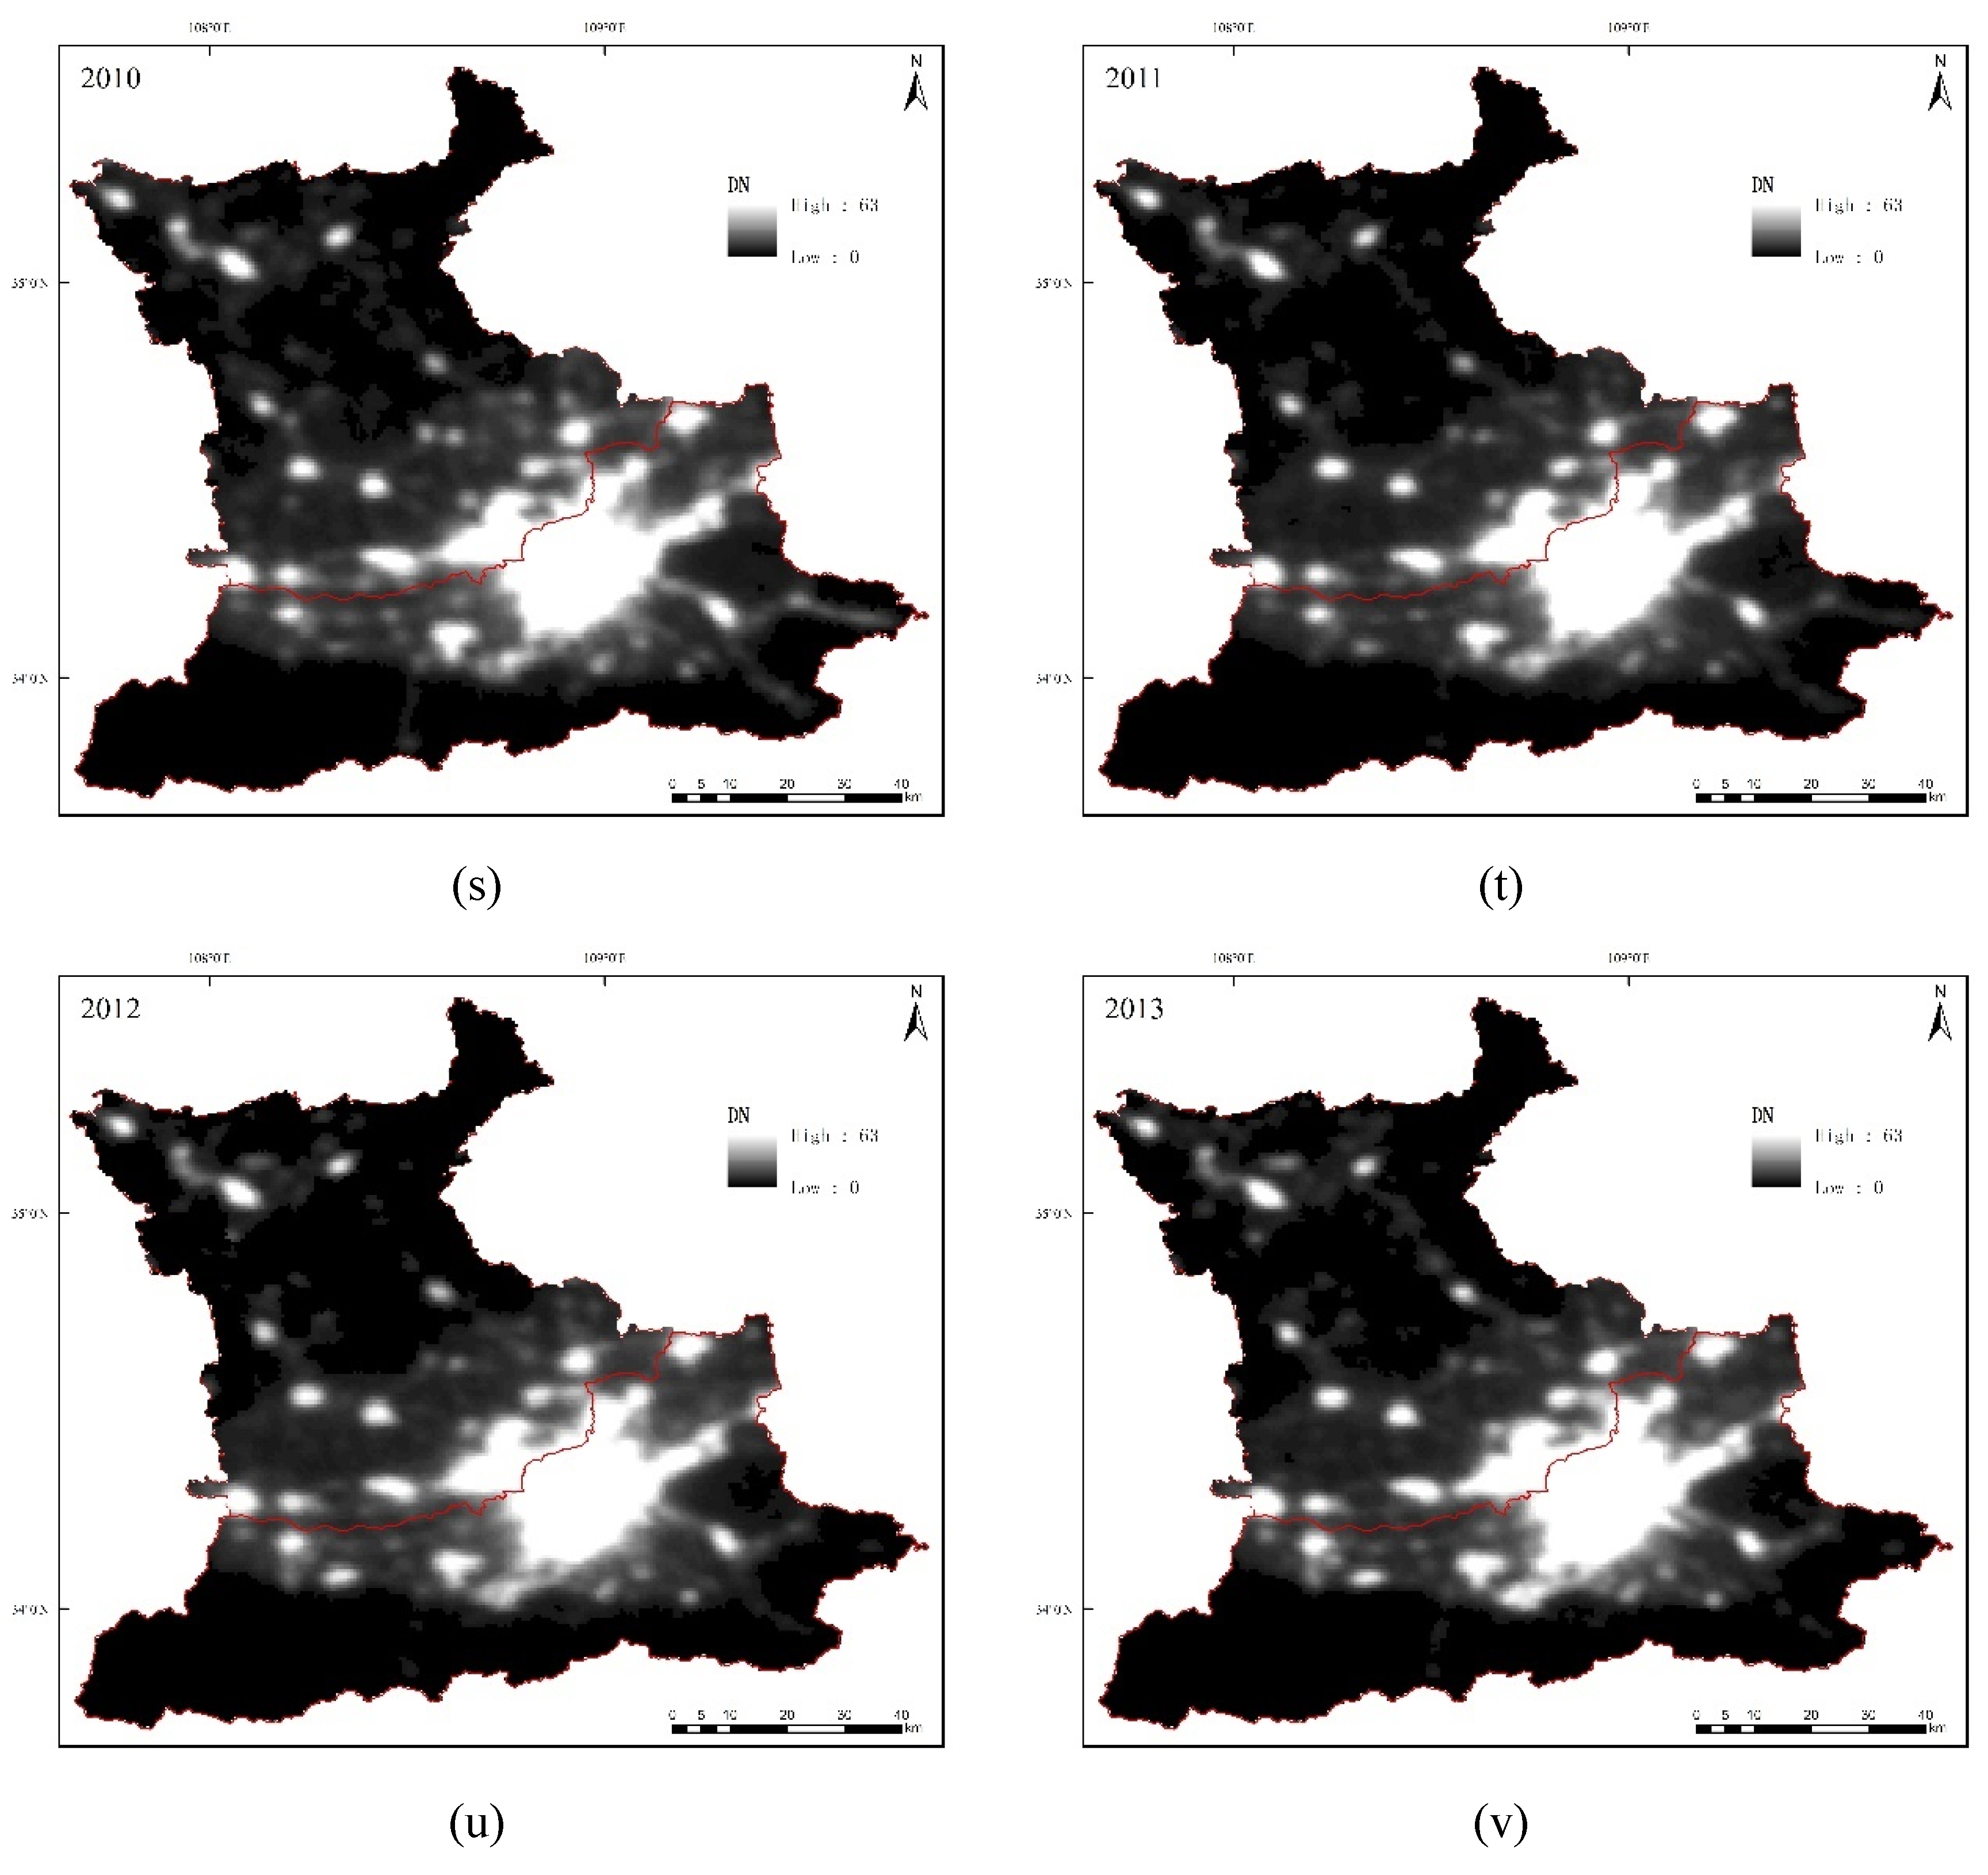
The calibration model between different DMSP satellites had a good effect, as all regression models in this study had R2 > 0.81, indicating a good correction effect (Table 3). The optimal threshold for extracting the urban built-up area is shown in Table 4. From 1992 to 2013, the change in light at night in the Xi’an City and Xianyang City administrative regions showed a significant increasing trend (Figure 3 and Figure 4a–v).
- (2)
- The change in the gravitational center in Xi’an City and Xianyang City
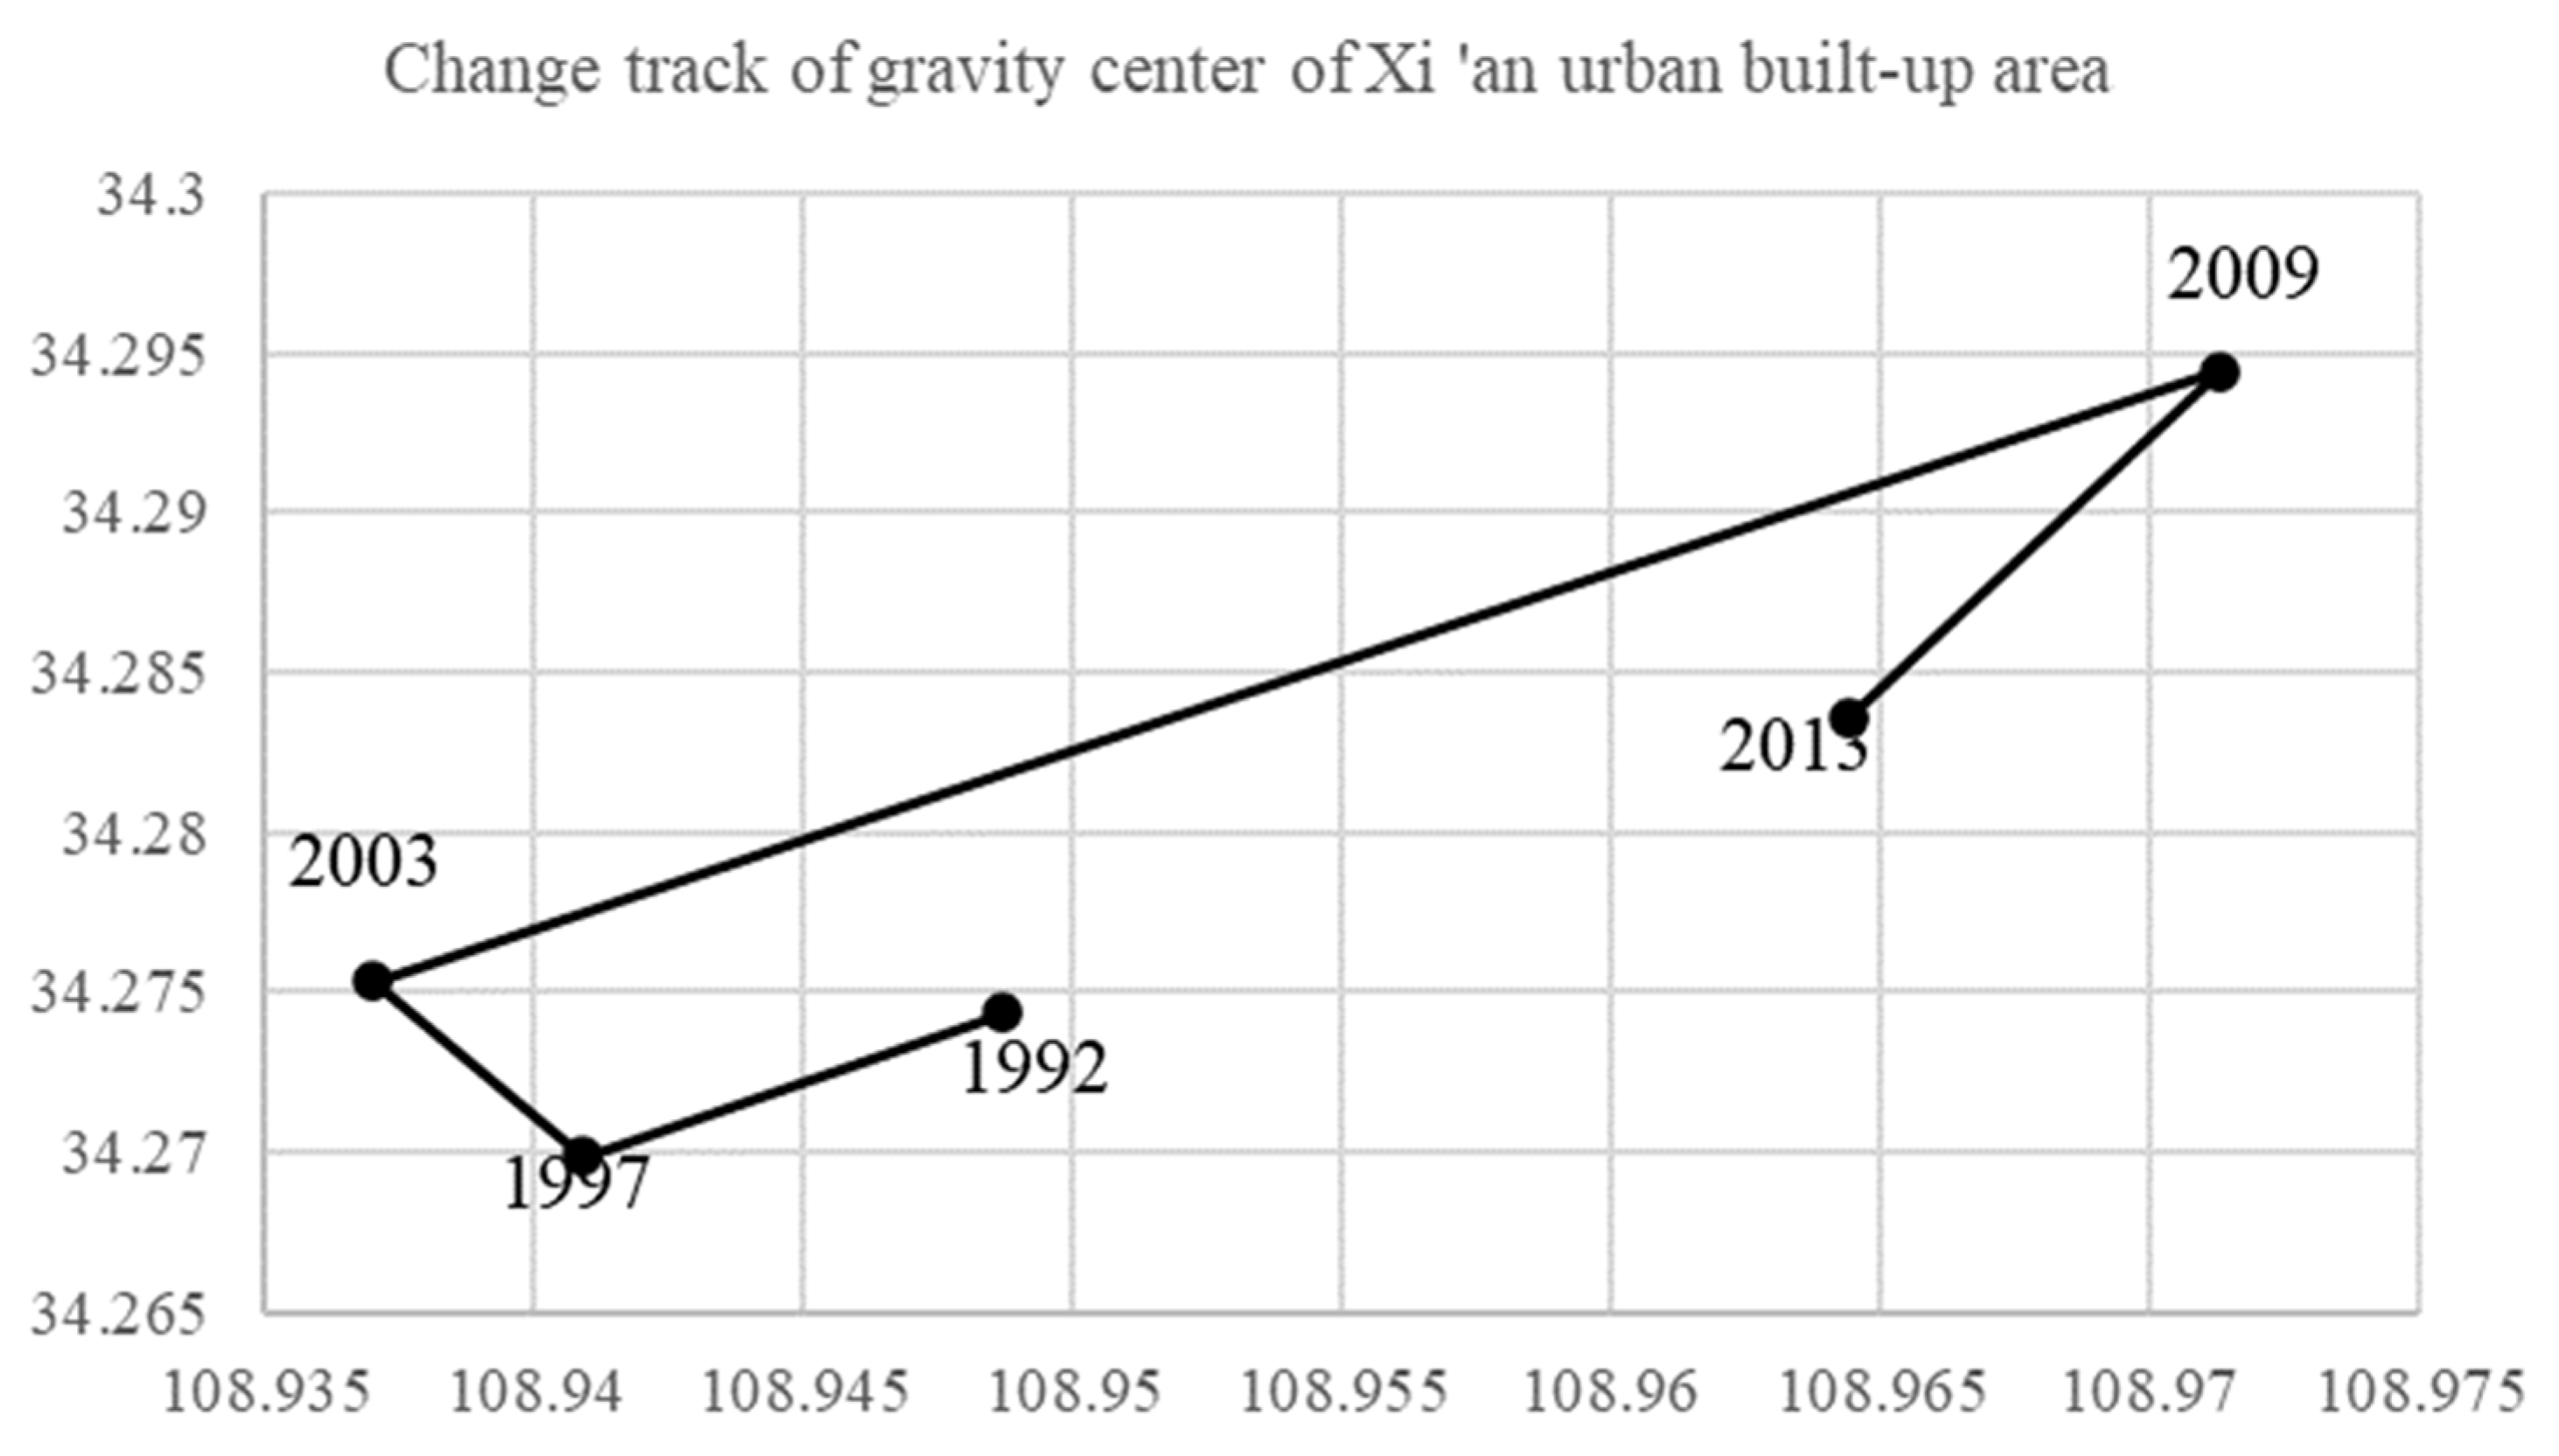
From 1992 to 2013, the gravitational center of the Xi’an City built-up area moved southwest first, and then northwest. During 1992–1997, the moving speed was 199.7 m per year, which then decreased to 117.9 m per year during 1998–2003. After the beginning of 2000, the gravitational center of Xi’an City’s built-up area moved faster. During 2010–2013, it reached 948 m per year (Table 5 and Figure 4 and Figure 5). On the whole, the gravitational center of the Xi’an City built-up area showed a trend of moving to the northeast from 1992 to 2013 (Table 5; Figure 5).
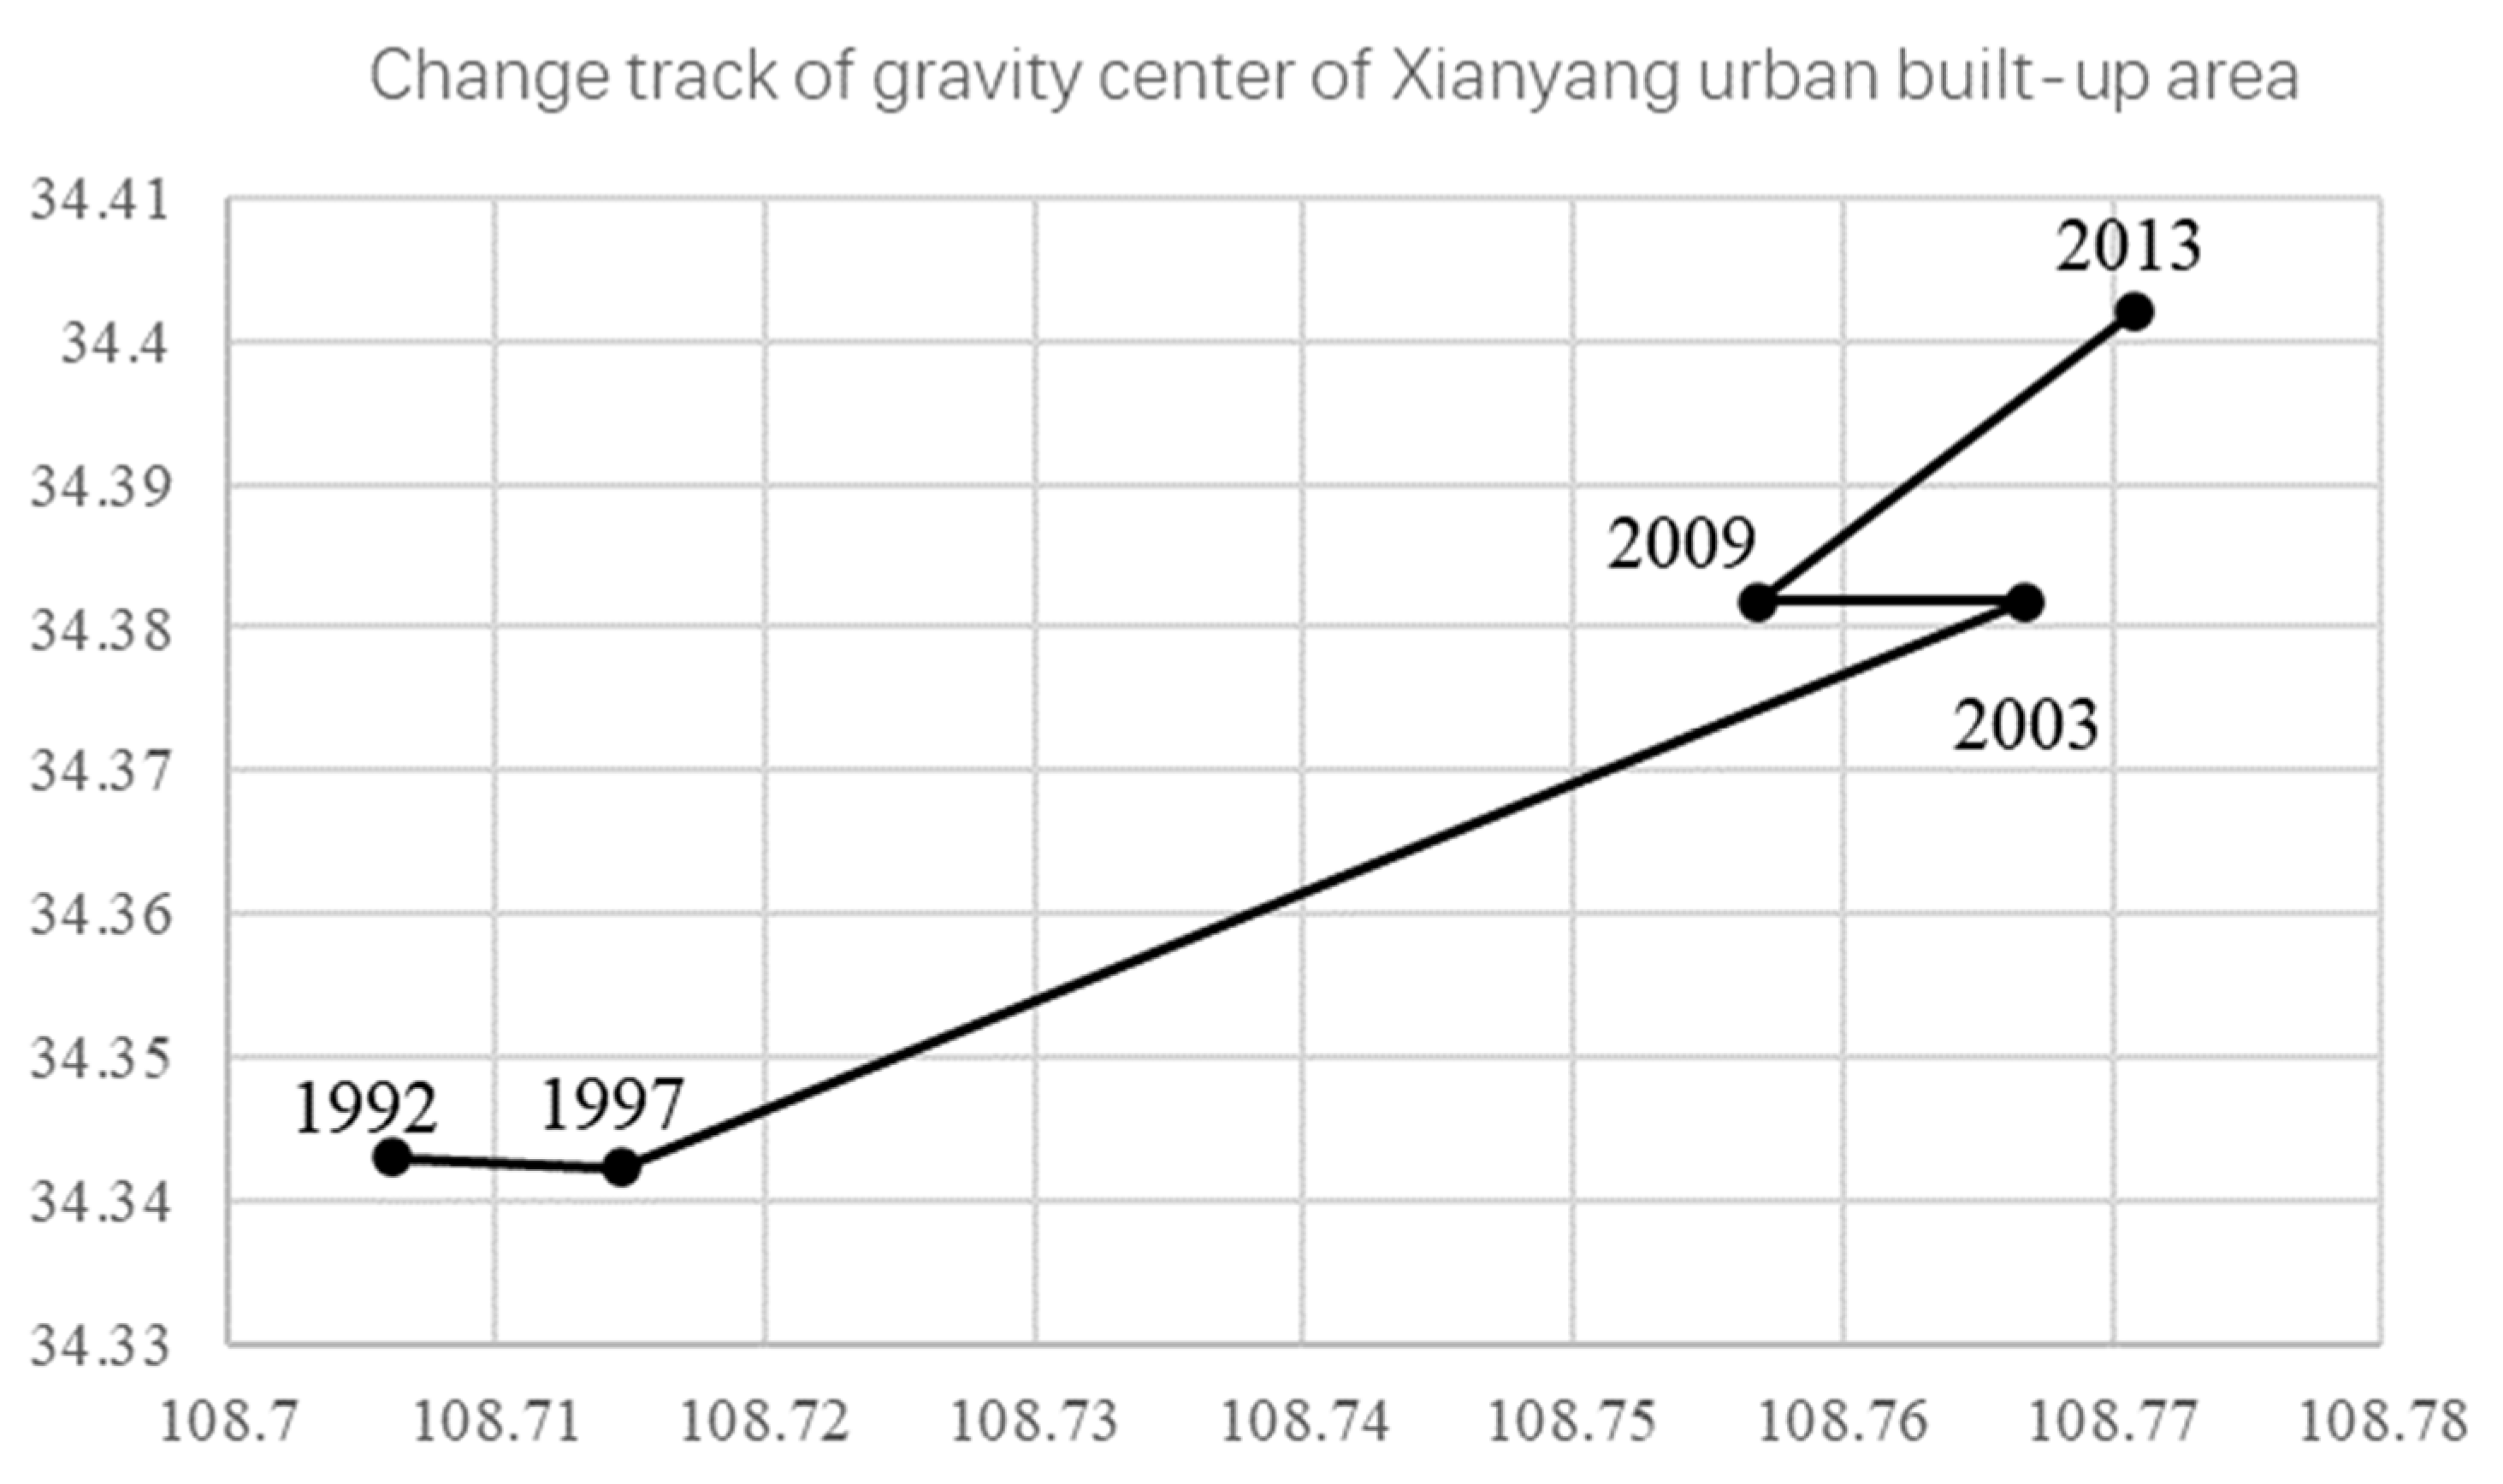
During 1992–2013, the gravitational center of Xianyang City’s built-up area moved southeast first and then northeast, and the moving speed was 187 m per year during 1992–1997, reached a maximum (1350 m per year) during 1998–2003, and then decreasing to 300.5 m per year during 2004–2009. After the beginning of 2010, the movement speed of the gravitational center in the built-up area accelerated, reaching 889 m per year from 2010 to 2013 (Table 6; Figure 6). On the whole, the gravitational center of Xianyang City’s built-up area showed a trend of moving to the northeast from 1992 to 2013.
4.2. Responses of Land Use to Urbanization in the Process of Xianyang City’s Spatial Integration
- (1)
- Land use change from 1980 to 1990
Land use in the study area changed little during 1980–1990. In 1990, compared with 1980, the forest increased by approximately 5 km2, the grassland area remained almost unchanged, the wetland and water bodies decreased by approximately 17 km2, the built-up land increased by approximately 15 km2, and the dry land decreased by approximately 4 km2 (Table 7).
- (2)
- Land use change from 1990 to 2000
From 1990 to 2000, the largest changes in land use in the Xianyang City administrative region were built-up land and dry land. Built-up land increased by approximately 112 km2 from 1990 to 2000, and dry land decreased by approximately 117 km2 from 1990 to 2000 (Table 8).
- (3)
- Land use change from 2000 to 2005
From 2000 to 2005, the largest changes in land use in the Xianyang City administrative region were still built-up land and dry land. Built-up land increased by approximately 85 km2 from 2000 to 2005, while dry land decreased by approximately 123 km2 from 2000 to 2005 (Table 9).
- (4)
- Land use change from 2005 to 2010
From 2005 to 2010, land use in the study area changed significantly. The forest area increased by approximately 18 km2, the grassland area decreased by approximately 74 km2, the wetland and water bodies decreased by approximately 10 km2, the built-up land increased by approximately 140 km2, and the dry land decreased by approximately 75 km2 (Table 10).
- (5)
- Land use change from 2010 to 2015
From 2010 to 2015, the largest changes in land use in the Xianyang City Administrative region were built-up land and dry land. Built-up land increased by approximately 120 km2 from 2010 to 2015, while dry land decreased by approximately 131 km2 from 2010 to 2015 (Table 11).
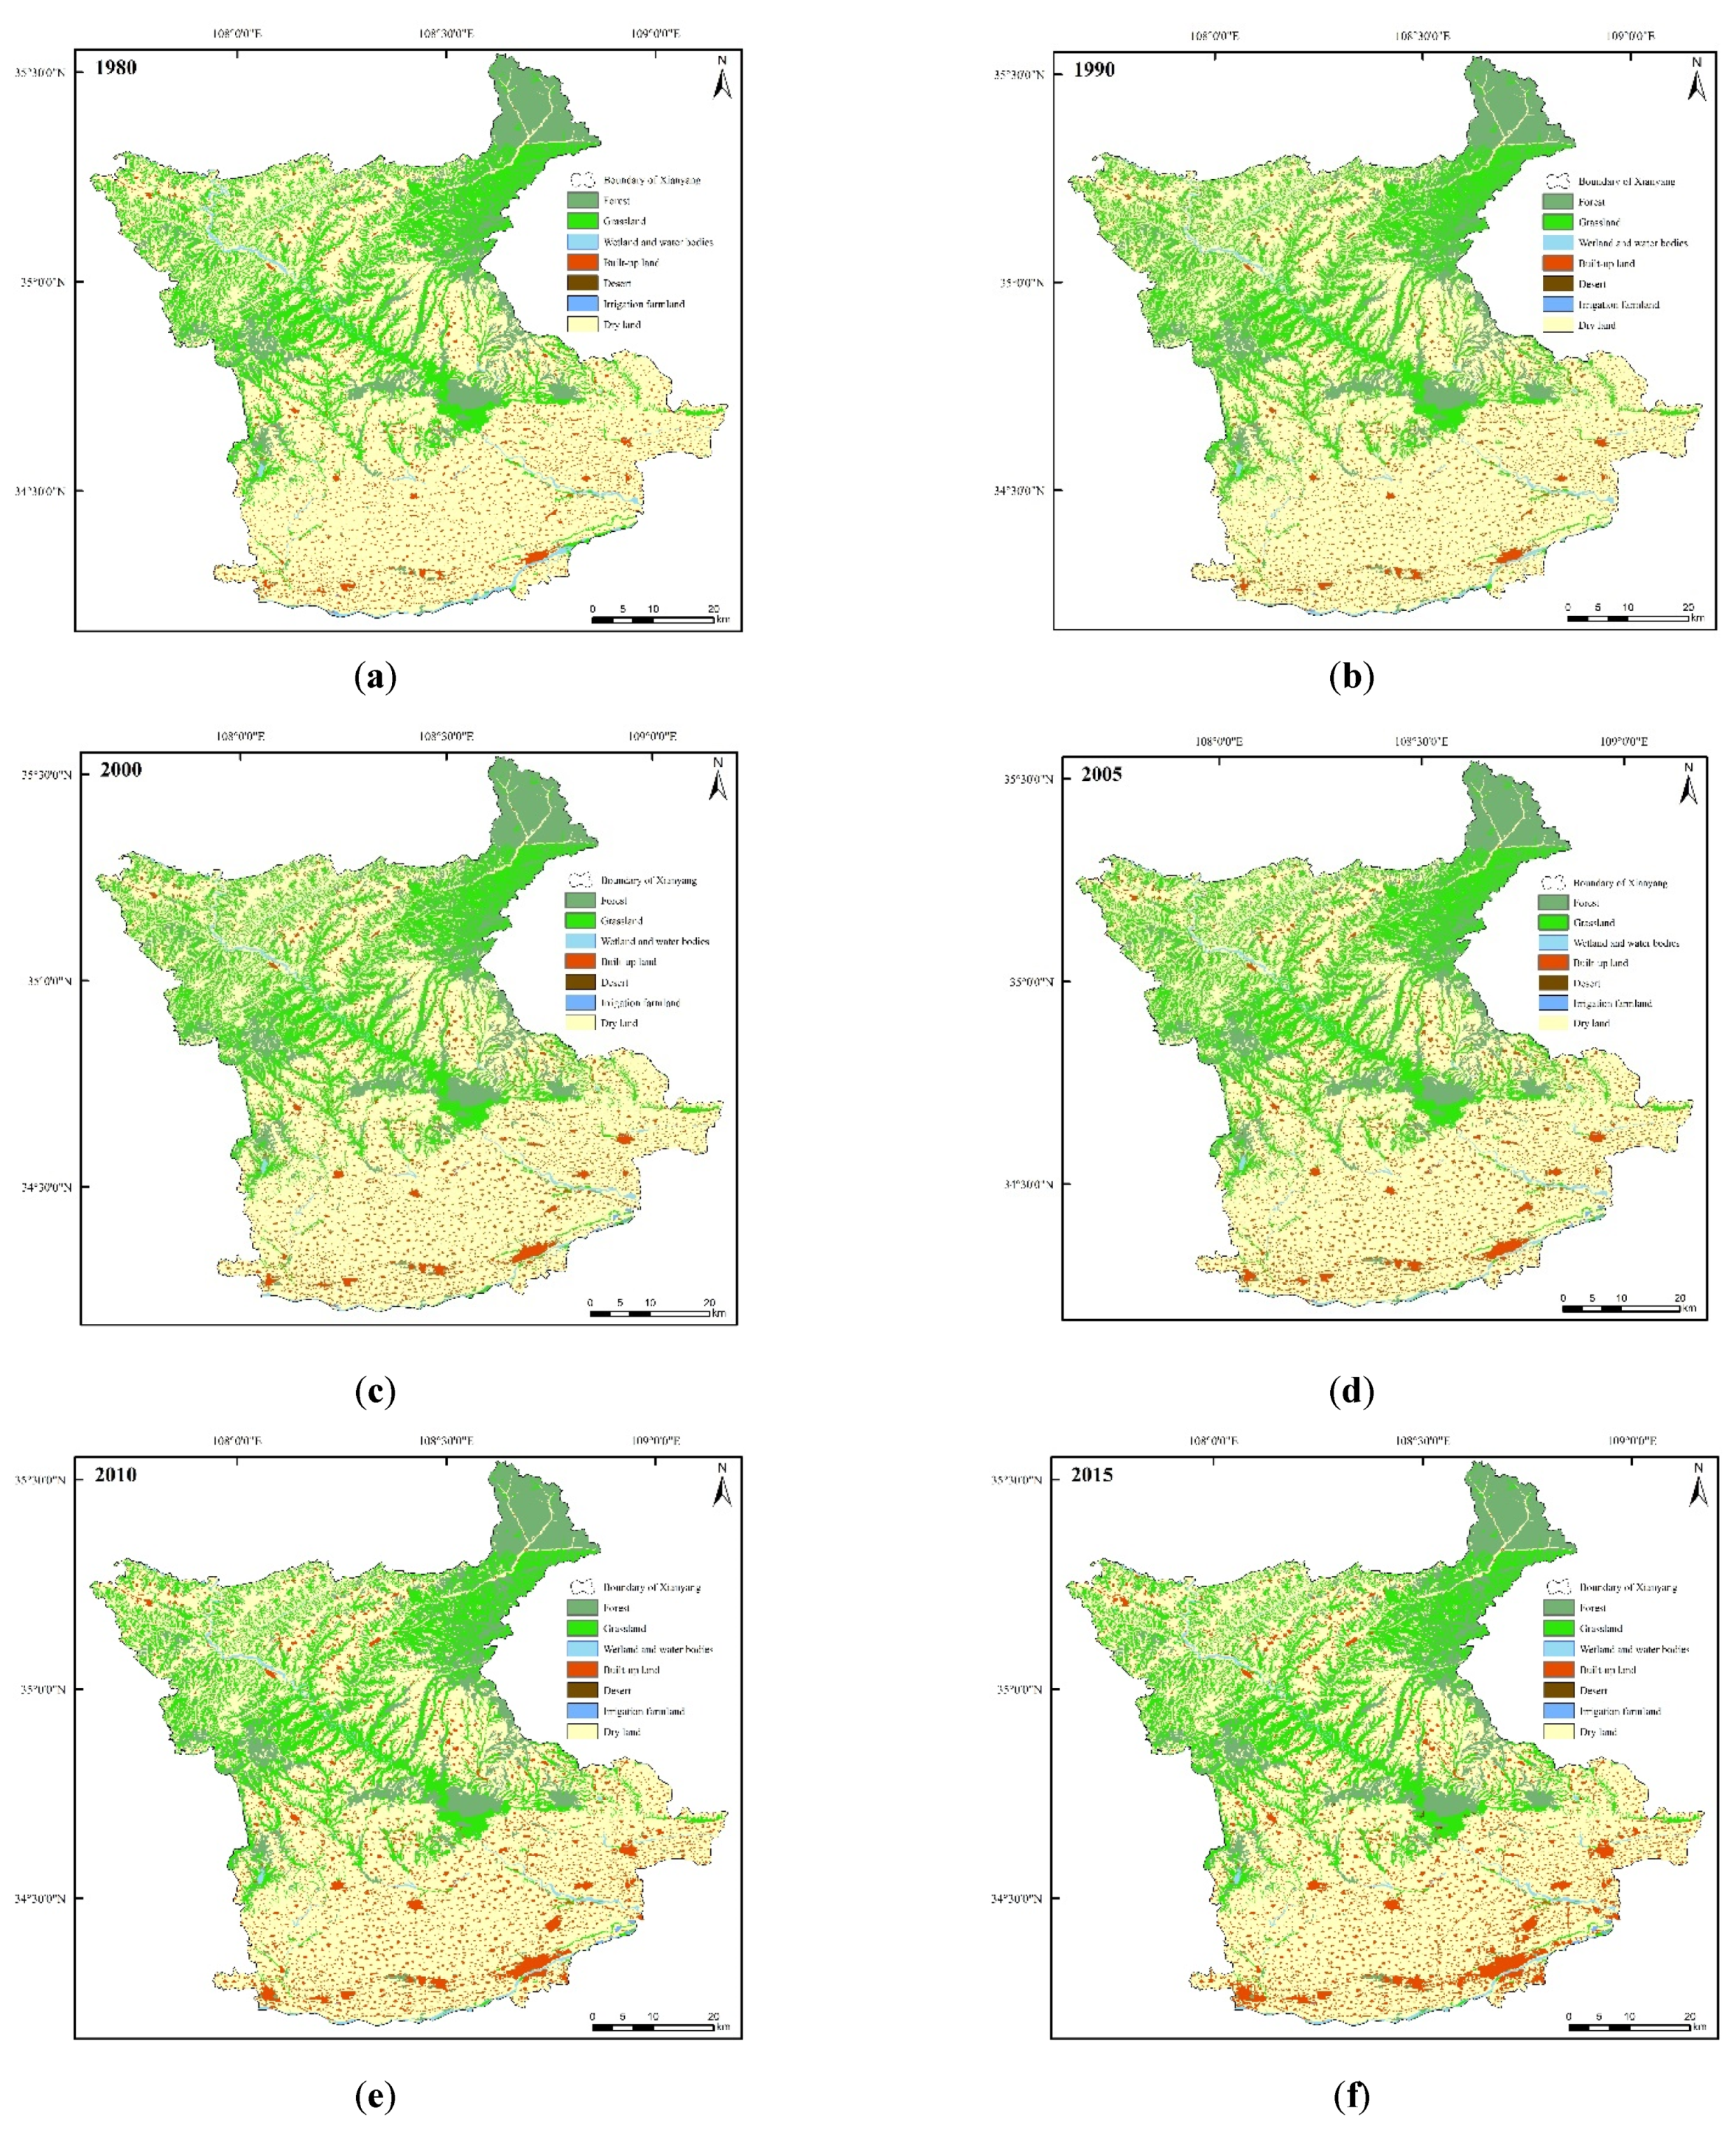
By comparing the land use data of Xianyang City during 1980–2015, it can be found that forest area and built-up land showed an increasing trend, wetland, water body and desert area remained basically unchanged, and grassland area, irrigated farmland area and dry land area all showed a decreasing trend. The urbanization process was relatively stable from 1980 to 2000, and increased faster and faster from 2000 to 2015, reaching its peak in 2010 to 2015. Figure 7 analyzes the spatial distribution of the added value of built-up land: from 1980 to 1990, built-up land remained stable; from 1990 to 2000, the added value of built-up land was mainly concentrated in the old city and Yangling district; from 2000 to 2005, the added value of built-up land was mainly concentrated in the old city; from 2005 to 2010, the added value of built-up land was concentrated on the south bank area of the Weihe River, as the construction of the Xi Xian new area sped up; from 2010 to 2015, the added value of built-up land was concentrated in the old city, the south bank area of the Weihe River, the urban area of Xingping City, Yangling District, Jinggan Street of Jingyang County, and Chengguan Town of Liquan County (Figure 7a–f).
4.3. Evolution Process of the Urban Center in the Central Urban Area Based on Kernel Density Analysis
Based on kernel density analysis, a search radius of 1000 m was adopted to analyze the POI. The spatial distributions of different types of POI are basically the same, with the old city formed by Leyu Road and Renmin Road at the junction of Qin Capital district and Weicheng District as the main center (Table 12). The southern city area across the Weihe River gradually integrated with the old city center, forming a larger urban main center. Xingping City district, Jinggan Street Jingyang County and Licquan County Chengguan Town became the subcenters of the city.
4.3.1. Evolution Process of Urban Centers Based on Overall Kernel Density Analysis
By analyzing the POI kernel density map of Xianyang City from 2016 to 2019, it can be found that Xianyang City has the characteristics of a multicenter urban spatial structure in 2016. After the developments of 2017, 2018 and 2019, the urban center obviously expanded, and the functions of the main center of the city became increasingly perfect. However, the imbalance in the development of the primary and secondary centers was prominent, and there was considerable space for the development of the secondary center.
4.3.2. Evolution of Urban Centers Based on Different Types of Kernel Density Analysis
In the process of urban development, different types of urban centers come to show different spatial distributions due to different factors, such as policy guidance, development conditions, natural factors, accessibility requirements and so on. Through the kernel density analysis of different types of POI data, the distribution and evolution characteristics of urban centers with different functions are explored.
From 2016 to 2019, the main center and the subcenter of the public service POI maintained a relatively stable state, but the old city and the south bank area of the Weihe River gradually merged into one, and formed a larger urban main center. Meanwhile, the old city showed an obvious trend of westward development. The main center and subcenter of residential POI remained relatively stable from 2016 to 2019, with almost no change, mainly concentrated in the old city, the southern bank area of Weihe River, the urban area of Xingping City, Jinggan Street of Jingyang County and Chengguan Town of Licquan County. During 2016–2019, the spatial structure of the main center and the subcenter of the business POI was stable. The business functions of the south bank area of the Weihe River and southeastern Jingyang County (divided into the Xi Xian new area) developed to a certain extent, but no new center was formed. During the study period, the spatial structure of POI did not change, but there were new gathering points and no new centers in Qindu District. The spatial structure of the leisure POI did not change. The south bank area of the Weihe River and Xingping subcenter were developed on the original basis, while the leisure functions of Weicheng District and southeast Jingyang County (divided into Xi Xian New Area) had obvious accumulation points, but no new centers were formed.
4.4. Analysis of Temporal and Spatial Evolution of Land Use in Xianyang City from 2005 to 2035
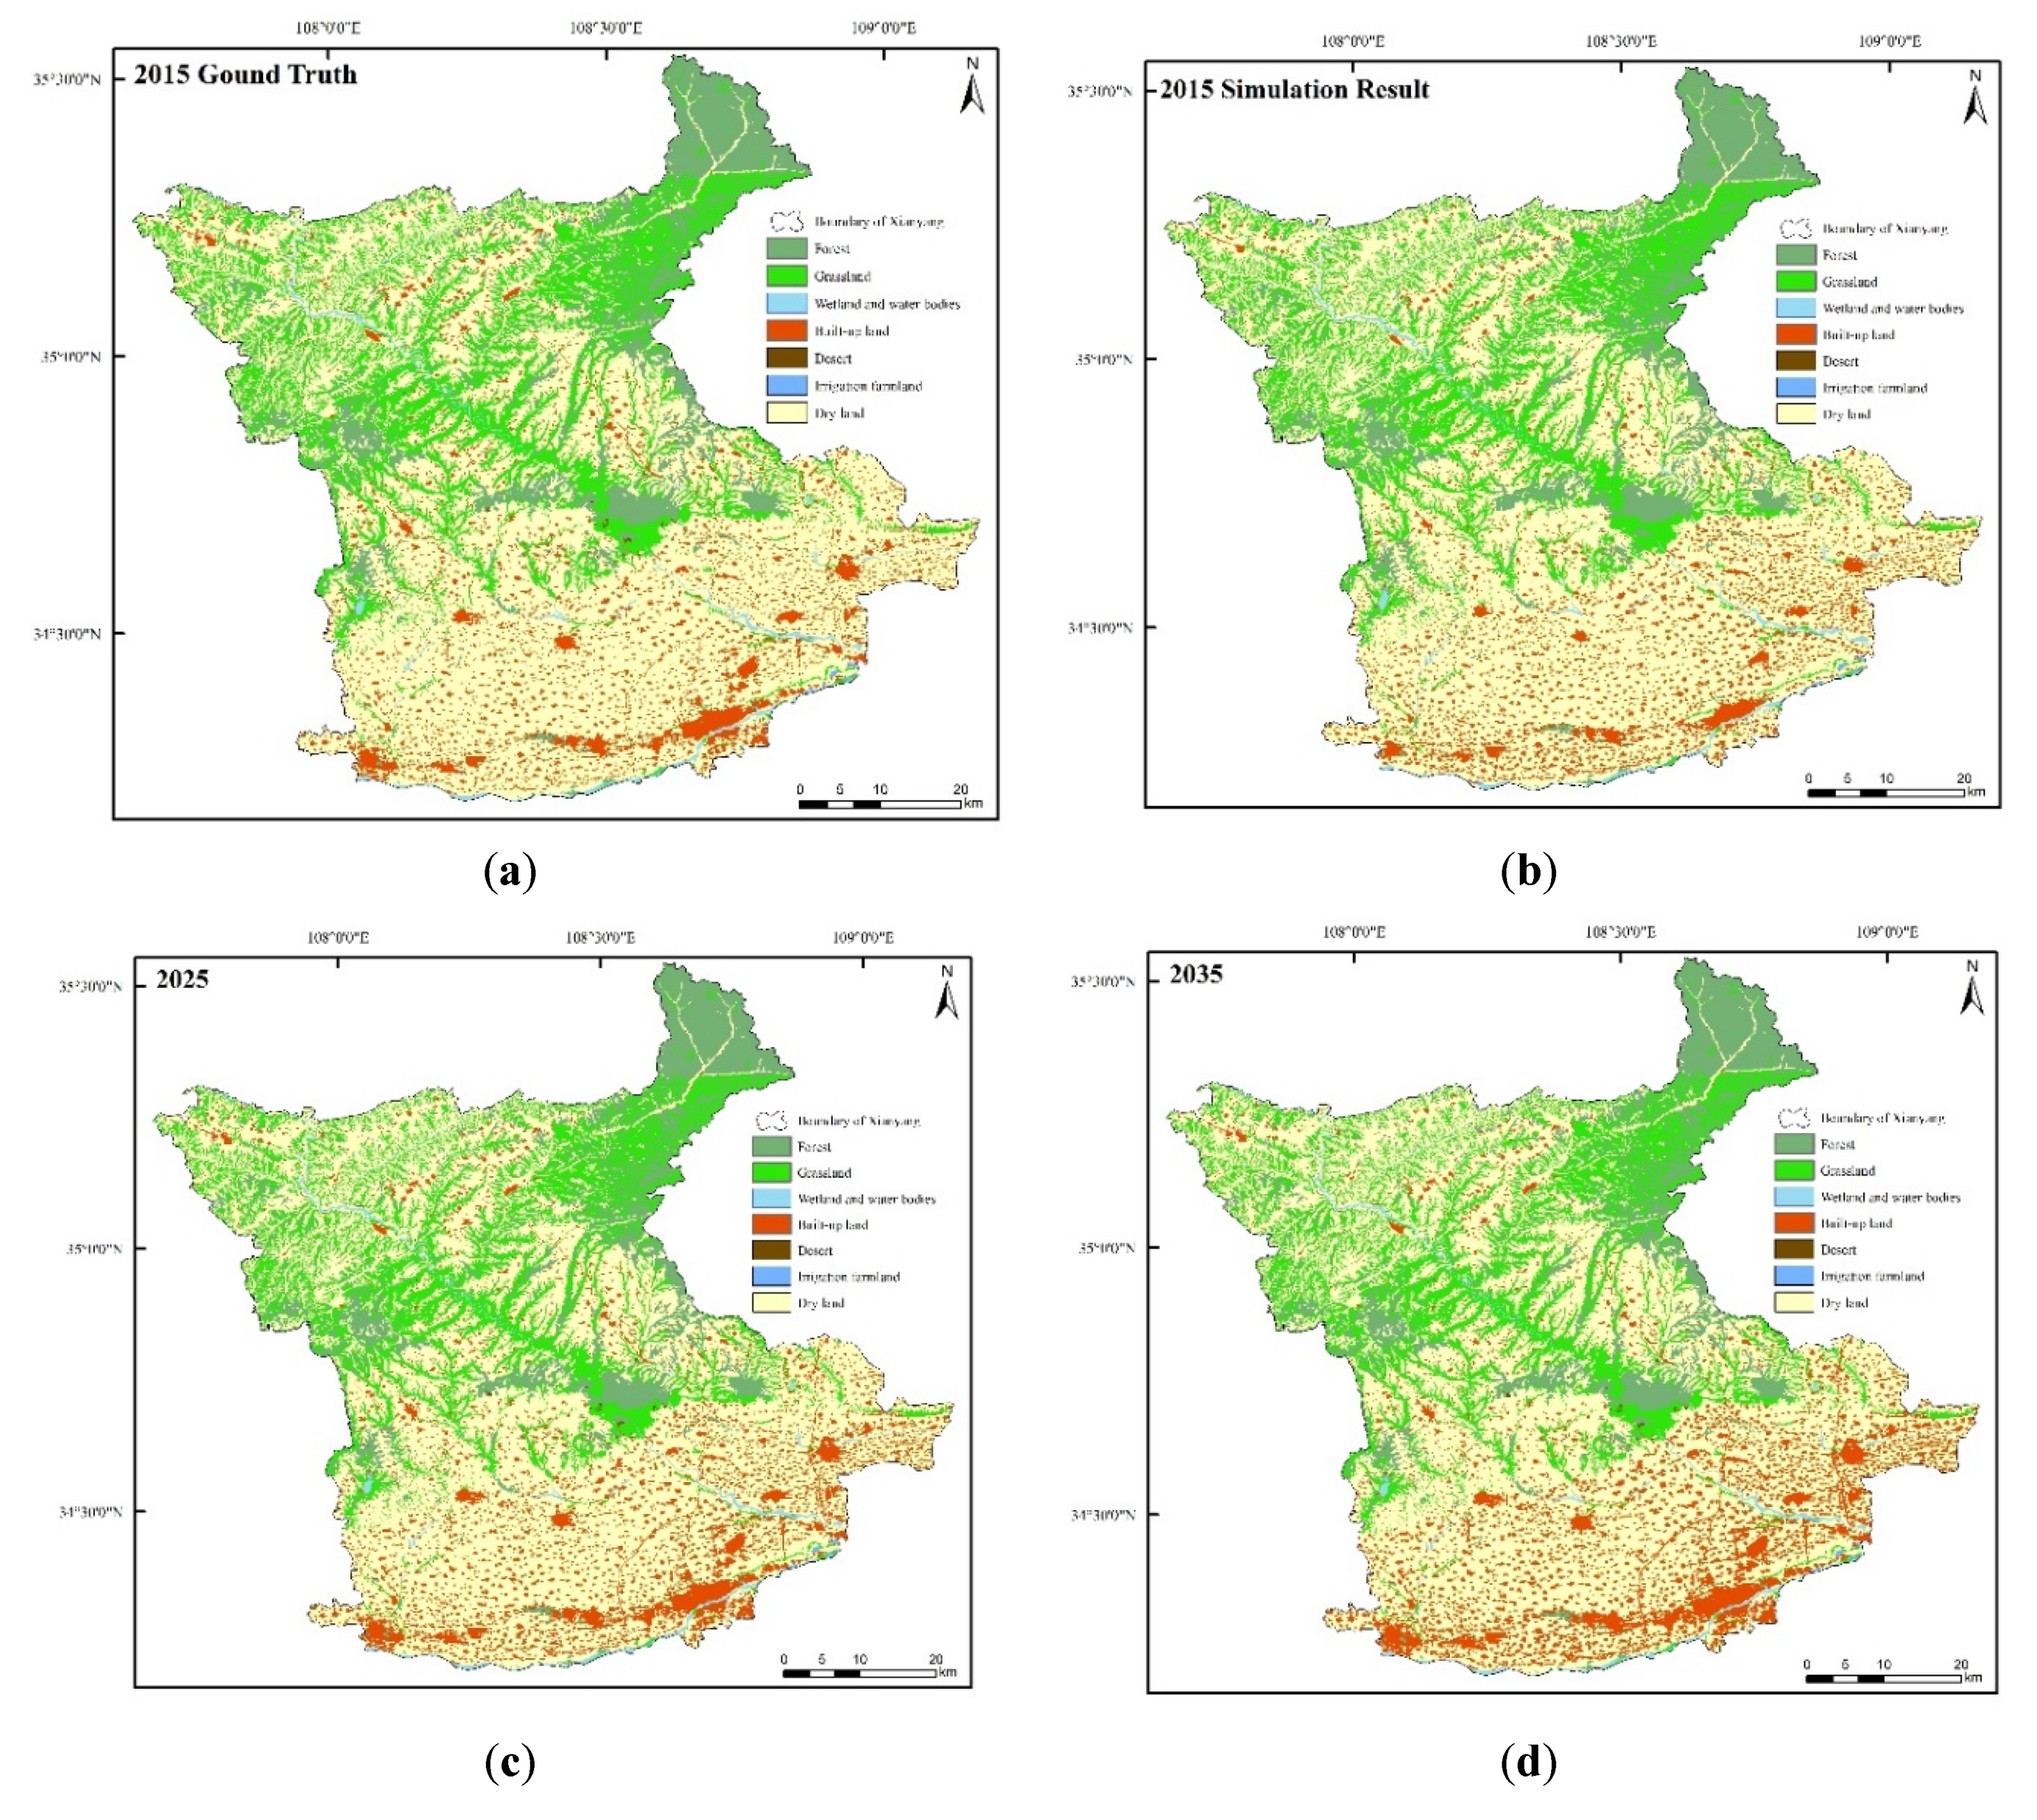
The PLUS model is used to simulate the land use of Xianyang City, with a coverage of about 10,189.4 km² and a simulation spatial resolution of 30 m. In order to better judge the land use simulation accuracy of the PLUS model in Xianyang City, based on the land use data of Xianyang City in 2005, we simulate the land use data of 2015, and verify the accuracy with the real data of 2015. The accuracy analysis results of this study show that the Kappa coefficient of the simulation in 2015 is 0.889, which is higher than 0.75, indicating that the PLUS model has a good effect in the land use simulation of Xianyang City, and the simulation accuracy is highly consistent, meaning it can be used for the scenario simulation of land use data in Xianyang City in the future (Figure 8a–d).
The evolution of land use in Xianyang City has the following obvious characteristics:
- (1)
- Construction land shows a multipolar explosive growth trend. The area increased by 234,317 km2, with growth rates of 32.76%, from 2005 to 2015; by 216,122 km2, with growth rates of 22.76%, from 2015 to 2025, and by 206,024 km2, with growth rates of 17.67%, from 2025 to 2035, under the simulation of development. The growth rate gradually decreased. In terms of spatial patterns, the central urban area of Xianyang has changed, from the development mode of taking the old urban area as the single center, to taking the main center of the old urban area and the south bank area of the Weihe River, along with Xianyang City High Tech Zone, Xingping City urban area, Chengguan Street of Sanyuan County, Chengguan Street of Liquan County, Jinggan Street of Jingyang County and Xi’an Xianyang International Airport, as the sub centers, forming an east–west development axis along Renmin–Baoquan–Xianxing Road;
- (2)
- The growth rate of forest land is slowing down. The growth rate of the forest land area is 1.62% for 2005 to 2015, 1.43% for 2015 to 2025 and 1.26% for 2025 to 2035;
- (3)
- The cultivated land area showed a continuous decreasing trend, and the change rate remained at about 12.75%, with little change;
- (4)
- The water body of wetland decreased first, and then increased. From 2005 to 2015, the wetland water body decreased by 5.56%. The growth rate in 2015–2025 was 0.43%, and in 2025–2035 it was 0.33%, while the growth range decreased;
- (5)
- The grassland area is decreasing. From 2005 to 2015, from 2015 to 2025, and from 2025 to 2035, the reduction rates are 2.83%, 2.81%, and 2.78%, respectively;
- (6)
- The area of desert first increases, then decreases. It increased by 38.6 times from 2005 to 2015, and decreases in 2015–2025 and in 2025–2035, with a reduction rate of 1.91% and 1.86%;
- (7)
- The area of arid land decreases year by year, and the rate of reduction decreases gradually. The reduction rates of 2005–2015, 2015–2025 and 2025–2035 are 2.67%, 2.51% and 2.43%.
5. Discussion
The urban expansion trend of Xi’an City obtained in this study is consistent with the research results of Gao et al. (2019) for Xi’an City, indicating the reliability of the method used in this study. The continuous migration process of the gravitational center of the urban built-up area was obtained from nighttime light, that is, the gravitational center of the built-up area of Xi’an City and Xianyang City tended to move to the northeast from 1992 to 2013, which is consistent with the conclusion drawn by Wang et al. (2015) in their study of the urban expansion characteristics of Xi’an City and Xianyang City, based on three phases of Landsat TM images.
The land use change of Xianyang City from 2000 to 2010 have been obtained from the land use transfer matrix; the change in urban residential area is obvious, and the urban residential area shows the largest increase of all kinds of land, mainly from the conversion of cultivated land around the city. This is consistent with the trend of construction land increase in the land use area in Xianyang City in 1990 and 2007, based on the remote sensing data of Meng et al. (2012) from 1990 and 2007. However, due to the different classification standards of land use, the conclusions are not consistent.
According to the land use change of Xianyang City in 2025, construction land will mainly expand around the original construction land. Here, the most obvious changes in construction land are mainly concentrated in the Qindu District and Sanyuan County of Xianyang City. This is consistent with the results of Tian et al.’s (2012) simulation of land use change in Xianyang City Tableland in 2020, based on the CLUE-S model, except for the fact that the specific changes are different in quantity. This is mainly because this study simulated the land use change in Xianyang City in 2025, which is larger than Tian et al.’s (2012) research scope, and the simulated years are also different.
In this study, the urban development characteristics of Xianyang city were analyzed using night light remote sensing, land use, and POI data, in order to predict the future spatial development strategy of Xianyang City. In future studies, mobile phone signaling, traffic tracking and social media data can be added to conduct in-depth analyses of the urban development of Xianyang.
6. Conclusions
Based on the spatial distribution, aggregation and correlation characteristics of nighttime light data, land use data and POI data, the responses of Xianyang City at different scales throughout the process of spatial integration were discussed, and the following preliminary conclusions were drawn:
- (1)
- Based on the analysis of the gravitational center of the urban built-up area via night light data, it is concluded that the gravitational center of the Xianyang City built-up area showed a trend of moving to the northeast from 1992 to 2013, which is influenced by the enhancement of the construction intensity in the Xi Xian New Area and the increase in the construction intensity of Jingyang and Liquan Counties;
- (2)
- The analysis of urban land use based on land use data showed that the urbanization process was relatively stable from 1980 to 2000, increased faster and faster from 2000 to 2015, and reached its peak from 2010 to 2015. From 1990 to 2000, the added value of built-up land was mainly concentrated in the old city and in Yangling district. From 2000 to 2005, the added value of built-up land was mainly concentrated in the old city. From 2005 to 2010, the added value of built-up land was concentrated on the south bank area of the Weihe River, as the construction of the Xi Xian new area increased. From 2010 to 2015, the added value of built-up land was concentrated in the old city, the south bank area of the Weihe River, the urban area of Xingping City, Yangling District, Jinggan Street of Jingyang County, and Chengguan Town of Liquan County;
- (3)
- According to the kernel density analysis based on POI data, the main center and subcenter of the central city as a whole are maintaining a relatively stable state, while the old city is developing a single-center system as a whole, and is gradually integrating with the south bank area of the Weihe River. The subcenter of the city is underdeveloped, and needs to be further strengthened;
- (4)
- From 2005 to 2035, the overall land use in Xianyang City showed a trend of “multi polar explosive growth of construction land, slow growth of forest land, and first a decrease and then an increase in wetland water body”. The urban spatial structure of Xianyang City has changed significantly. From the current single-center development model, it has been transformed into a point–axis development mode of “taking the old urban area and the south bank area of the Weihe River as the main center and the Xianyang High Tech Zone, urban area of Xingping, Chengguan Street of Sanyuan County, Chengguan Street of Liquan County, Jinggan street of Jingyang County and Xi’an Xianyang International Airport as the sub center, while the Renmin–Baoquan–Xianxing road forms an east–west development axis”.
Author Contributions
Conceptualization—Y.H. (Yiyi Hu) and Y.H. (Yi He); methodology—Y.H. and Y.L.; paper writing—Y.H. (Yiyi Hu); review and editing—Y.H. (Yi He). All authors have read and agreed to the published version of the manuscript.
Funding
This research was funded by the China Postdoctoral Science Foundation (Grant No. 2018M633602), Postdoctoral Research Fund of Shaanxi Province (Grant No. 2017BSHEDZZ144), and the Natural Science Basic Re-search Plan in Shaanxi Province of China (Grant No. 2021JQ-449).
Institutional Review Board Statement
Not applicable.
Informed Consent Statement
Not applicable.
Data Availability Statement
Not applicable.
Acknowledgments
We would like to thank the anonymous reviewers and editors for their valuable comments and suggestions.
Conflicts of Interest
The authors declare no conflict of interest.
References
- Zhou, C.S.; Ye, C.D. Progress on studies of urban spatial structure in China. Prog. Geogr. 2013, 32, 1030–1038. (In Chinese) [Google Scholar]
- Zhu, Y.M.; Yao, S.M.; Li, Y.J. On the Urban Spatial Evolution in the Process of Urbanization in China. Geogr. Territ. Res. 2000, 2, 12–16. (In Chinese) [Google Scholar]
- Liu, Y.J.; Li, C.G. The Formation Mechanism and Countermeasures to the Urban Spatial Structure Adjustment of Changchun. Mod. Urban Res. 2008, 6, 52–60. (In Chinese) [Google Scholar]
- Dong, R.X.; Yan, F.Y. Revealing Characteristics of the Spatial Structure of Megacities at Multiple Scales with Jobs-Housing Big Data: A Case Study of Tianjin, China. Land 2021, 10, 1144. [Google Scholar] [CrossRef]
- Franci, F.; Lambertini, A.; Bitelli, G. Integration of different geospatial data in urban areas: A case of study. Int. Conf. Remote Sens. Geoinf. Environ. 2014, 9229, 92290P. [Google Scholar]
- Yang, F.; Chen, L. Developing a thermal atlas for climate-responsive urban design based on empirical modeling and urban morphological analysis. Energy Build. 2016, 111, 120–130. [Google Scholar] [CrossRef]
- Ye, T.T.; Zhao, N.Z.; Yang, X.C.; Ouyang, Z.T.; Liu, X.P.; Chen, Q.; Hu, K.J.; Yue, W.Z.; Qi, J.G. Improved population mapping for China using remotely sensed and points-of-interest data within a random forests model. Sci. Total Environ. 2019, 658, 936–946. [Google Scholar] [CrossRef]
- Cao, G.F.; Wang, S.W.; Hwang, M.; Padmanabhan, A.; Zhang, Z.H.; Soltani, K.A. Scalable Framework for Spatiotemporal Analysis of Location-based Social Media Data. Comput. Environ. Urban Syst. 2015, 51, 70–82. [Google Scholar] [CrossRef] [Green Version]
- Wardrop, N.A.; Jochem, W.C.; Bird, T.J.; Chamberlain, H.R.; Clarke, D.; Kerr, D.; Bengtsson, L.; Juran, S.; Seaman, V.; Tatem, A.J. Spatially disaggregated population estimates in the absence of national population and housing census data. Proc. Natl. Acad. Sci. USA 2018, 115, 3529–3537. [Google Scholar] [CrossRef] [Green Version]
- Xie, Z.W.; Ye, X.Y.; Zheng, Z.H.; Li, D.; Sun, L.S.; Li, R.R.; Benya, S. Modeling polycentric urbanization using multisource big geospatial data. Remote Sens. 2019, 11, 310. [Google Scholar] [CrossRef] [Green Version]
- Tang, L.B.; Cui, H.H. Improvement of urban construction land extraction method based on NPP-VIIRS nighttime light data and landsat-8 data: A case study of Guangzhou city. Geomat. Spat. Inf. Technol. 2017, 40, 69–73. [Google Scholar]
- Xie, Y.H.; Weng, Q.H.; Fu, P. Temporal variations of artificial nighttime lights and their implications for urbanization in the conterminous United States, 2013–2017. Remote Sens. Environ. 2019, 225, 160–174. [Google Scholar] [CrossRef]
- Levin, N.; Kyba, C.C.M.; Zhang, Q.L.; de Miguel, A.S.; Roman, M.O.; Li, X.; Portnov, B.A.; Molthan, A.L.; Jechow, A.; Miller, S.D.; et al. Remote sensing of night lights: A review and an outlook for the future. Remote Sens. Environ. 2020, 237, 111443. [Google Scholar] [CrossRef]
- Wang, J.; Zhou, J.; He, H.J. Research on urban expansion characteristics of Xi’an and Xianyang based on GIS and RS. Shaanxi Meteorol. 2015, 1, 6–10. (In Chinese) [Google Scholar]
- Hao, R.F.; Yu, D.Y.; Sun, Y.; Cao, Q.; Liu, Y.; Liu, Y.P. Integrating Multiple Source Data to Enhance Variation and Weaken the Blooming Effect of DMSP-OLS Light. Remote Sens. 2015, 7, 1422–1440. [Google Scholar] [CrossRef] [Green Version]
- Huang, Y.; Chen, W.; Zheng, C. GDP of Fujian Province Grid Expression Based on the DMSP/OLS Data. J. Quanzhou Norm. Univ. 2016, 34, 78–83. (In Chinese) [Google Scholar]
- Zhao, N.; Samson, E.L.; Currit, N.A. Nighttime-Lights-Derived Fossil Fuel Carbon Dioxide Emission Maps and Their Limitations. Photogramm. Eng. Remote Sens. 2015, 81, 935–943. [Google Scholar] [CrossRef]
- Zhang, X.; Zhu, J.; Xu, J.H. Earthquake Disaster Information Extraction Based on Night-time Lighting Images. J. Seismol. Res. 2018, 41, 311–318. (In Chinese) [Google Scholar]
- Franziska, E.; Kai, J.; Christoph, R. Nighttime stomatal conductance differs with nutrient availability in two temperate floodplain tree species. Tree Physiol. 2017, 4, 428–440. [Google Scholar]
- Kurata, M.; Matsui, N.; Ikemoto, Y.; Tsuboi, H. Do Determinants of Adopting Solar Home Systems Differ between Households and Micro-Enterprises? Evidence from Rural Bangladesh. Renew. Energy 2018, 129, 309–316. [Google Scholar] [CrossRef]
- Mawenda, J.; Watanabe, T.; Avtar, R. An analysis of urban land use/land cover changes in Blantyre City, Southern Malawi (1994–2018). Sustainability 2020, 12, 2377. [Google Scholar] [CrossRef] [Green Version]
- Súl’ovský, M.; Falt’an, V.; Skokanová, H.; Havlíček, M.; Petrovič, F. Spatial analysis of long-term land-use development in regard to physiotopes: Case studies from the Carpathians. Phys. Geogr. 2017, 38, 470–488. [Google Scholar] [CrossRef]
- Meng, X.; Ren, Z.Y.; Zhang, C. Study on Land Use Change and Ecological Risk in Xianyang City. Arid. Zone Res. 2012, 29, 137–142. (In Chinese) [Google Scholar]
- Wang, Q.; Dai, Z.Y. The analysis of urban spatial structure based on POI data and principal component analysis. Territ. Nat. Resour. Study 2018, 06, 12–16. (In Chinese) [Google Scholar]
- Deng, Y.; Liu, J.P.; Liu, Y.; Luo, A. Detecting Urban Polycentric Structure from POI Data. Int. J. Geo-Inf. 2019, 8, 283. [Google Scholar] [CrossRef] [Green Version]
- Bui, T.H.; Han, Y.J.; Park, S.B.; Park, S.Y. Detection of POI boundaries through geographical topics. Int. Conf. Big Data Smart Comput. 2015, 162–169. [Google Scholar] [CrossRef]
- Zhou, L.; Zhao, Q.; Yang, F. Identification of urban agglomeration boundary based on POI and NPP/VIIRS night light data. Prog. Geogr. 2019, 6, 840–850. (In Chinese) [Google Scholar]
- Zhang, J.; Yuan, X.D.; Lin, H. The Extraction of Urban Built-up Areas by Integrating Night-time Light and POI Data—A Case Study of Kunming, China. IEEE Access 2021, 9, 22417–22429. [Google Scholar]
- Chen, G.Z.; Li, X.; Liu, X.P.; Chen, Y.M.; Liang, X.; Leng, J.Y.; Xu, X.C.; Liao, W.L.; Qiu, Y.A.; Wu, Q.L.; et al. Global projections of future urban land expansion under shared socioeconomic pathways. Nat. Commun. 2020, 11, 537. [Google Scholar] [CrossRef] [PubMed] [Green Version]
- Clarke, K.C.; Gaydos, L.J. Loose-coupling a cellular automaton model and GIS: Long-term urban growth prediction for San Francisco and Washington/Baltimore. Int. J. Geogr. Inf. Sci. 1998, 12, 699–714. [Google Scholar] [CrossRef] [Green Version]
- Liu, Y.; Zhang, J.; Zhou, D.M.; Ma, J.; Dang, R.; Ma, J.J.; Zhu, X.Y. Temporal and spatial variation of carbon storage in the Shule River Basin based on InVEST model. Acta Ecol. Sin. 2021, 41, 4052–4065. (In Chinese) [Google Scholar]
- Liang, X.; Liu, X.P.; Chen, G.L.; Leng, J.Y.; Wen, Y.Y.; Chen, G.Z. Coupling fuzzy clustering and cellular automata based on local maxima of development potential to model urban emergence and expansion in economic development zones. Int. J. Geogr. Inf. Sci. 2020, 34, 1930–1952. [Google Scholar] [CrossRef]
- Tian, Y.C.; Ren, Z.Y. Land Use Change Simulations in Loess Hilly Areas Based on CLUE-S Model: A Case Study in Xianyang Loess Tableland Areas of Shaanxi Province. Prog. Geogr. 2012, 31, 11. (In Chinese) [Google Scholar]
- Liu, X.J.; Li, X.; Liang, X.; Shi, H.; Ou, J.P. Simulating the change of terrestrial carbon storage in China based on the FLUS-InVEST model. Trop. Geogr. 2019, 39, 397–409. (In Chinese) [Google Scholar]
- Zhai, H.; Lv, C.Q.; Liu, W.Z.; Yang, C.; Fan, D.S.; Wang, Z.K.; Guan, Q.F. Understanding Spatio-Temporal Patterns of Land Use/Land Cover Change under Urbanization in Wuhan, China, 2000–2019. Remote Sens. 2021, 13, 3331. [Google Scholar] [CrossRef]
- Simwanda, M.; Murayama, Y.; Ranagalage, M. Modeling the drivers of urban land use changes in Lusaka, Zambia using multi-criteria evaluation: An analytic network process approach. Land Use Policy 2020, 92, 104441. [Google Scholar] [CrossRef]
- Liu, X.; Xun, L.; Xia, L.; Xu, X.C.; Ou, J.P.; Chen, Y.M.; Li, S.Y.; Wang, S.J.; Pei, F.S. A future land use simulation model (FLUS) for simulating multiple land use scenarios by coupling human and natural effects. Landsc. Urban Plan. 2017, 168, 94–116. [Google Scholar] [CrossRef]
- Wang, Q.Z.; Guan, Q.Y.; Lin, J.K.; Luo, H.P.; Tan, Z.; Ma, Y.R. Simulating land use/land cover change in an arid region with the coupling models. Ecol. Indic. 2021, 122, 107231. [Google Scholar] [CrossRef]
- Liang, X.; Guan, Q.; Clarke, K.C.; Liu, S.S.; Wang, B.Y.; Yao, Y. Understanding the drivers of sustainable land expansion using a patch-generating land use simulation (PLUS) model: A case study in Wuhan, China. Comput. Environ. Urban Syst. 2021, 85, 101569. [Google Scholar] [CrossRef]
- Cheng, F.Y.; Liu, S.L.; Hou, X.Y.; Zhang, Y.Q.; Dong, S.K.; Coxixo, A.; Liu, G.H. Urban Land Extraction Using DMSP/OLS Nighttime Light Data and OpenStreetMap Datasets for Cities in China at Different Development Levels. IEEE J. Sel. Top. Appl. Earth Obs. Remote Sens. 2018, 11, 2587–2599. [Google Scholar] [CrossRef]
- Akiyama, Y. Analysis of light data on the DMSP/OLS satellite image using existing spatial data for monitoring human activity in Japan. ISPRS Ann. Photogramm. Remote Sens. Spat. Inf. Sci. 2012, I2, 25–30. [Google Scholar] [CrossRef] [Green Version]
- He, C.Y.; Shi, P.J.; Li, J.G.; Chen, J.; Pan, Y.Z.; Li, J.; Zhuo, L.; Toshiaki, I. Restoring urbanization process in China in the 1990s by using non-radiance-calibrated DMSP/OLS nighttime light imagery and statistical data. Chin. Sci. Bull. 2006, 51, 1614–1620. [Google Scholar] [CrossRef]
- Gao, N.; Ge, Y.C.; Song, X.Y. Study of Urban Expansion and Driving Factors in Xi’an City based on Nighttime Light Data. Remote Sens. Technol. Appl. 2019, 34, 207–215. (In Chinese) [Google Scholar]
Figure 1.
Location of the study area.

Figure 2.
Flow chart of Xi’an City and Xianyang City built-up area extraction.

Figure 3.
DN value of night light in Xi’an City and Xianyang City administrative regions.

Figure 4.
Light intensity at night in Xi’an City and Xianyang City Administrative regions from 1992 to 2013. (a) represents nighttime light intensity in 1992, (b) represents nighttime light intensity in 1993, (c) represents nighttime light intensity in 1994, (d) represents nighttime light intensity in 1995, (e) represents nighttime light intensity in 1996, (f) represents nighttime light intensity in 1997, (g) represents nighttime light intensity in 1998, (h) represents nighttime light intensity in 1999, (i) represents nighttime light intensity in 2000, (j) represents nighttime light intensity in 2001, (k) represents nighttime light intensity in 2002, (l) represents nighttime light intensity in 2003, (m) represents nighttime light intensity in 2004, (n) represents nighttime light intensity in 2005, (o) represents nighttime light intensity in 2006, (p) represents nighttime light intensity in 2007, (q) represents nighttime light intensity in 2008, (r) represents nighttime light intensity in 2009, (s) represents nighttime light intensity in 2010, (t) represents nighttime light intensity in 2011, (u) represents nighttime light intensity in 2012, (v) represents nighttime light intensity in 2013.


Figure 5.
Change trajectory of gravitational center of Xi’an City urban built-up area from 1992 to 2013.
Figure 5.
Change trajectory of gravitational center of Xi’an City urban built-up area from 1992 to 2013.

Figure 6.
Change trajectory of the gravitational center of Xianyang City’s urban built-up area from 1992 to 2013.
Figure 6.
Change trajectory of the gravitational center of Xianyang City’s urban built-up area from 1992 to 2013.

Figure 7.
Land use map of Xi’an City and Xianyang City from 1980 to 2015. (a) represents land use in 1980, (b) represents land use in 1990, (c) represents land use in 2000, (d) represents land use in 2005, (e) represents land use in 2010, (f) represents land use in 2015.
Figure 7.
Land use map of Xi’an City and Xianyang City from 1980 to 2015. (a) represents land use in 1980, (b) represents land use in 1990, (c) represents land use in 2000, (d) represents land use in 2005, (e) represents land use in 2010, (f) represents land use in 2015.

Figure 8.
Land use evolution map of Xianyang City from 2015 to 2035. (a) represents actual land use in 2015, (b) represents simulated land use in 2015, (c) represents simulated land use in 2025, (d) represents simulated land use in 2035.
Figure 8.
Land use evolution map of Xianyang City from 2015 to 2035. (a) represents actual land use in 2015, (b) represents simulated land use in 2015, (c) represents simulated land use in 2025, (d) represents simulated land use in 2035.


Table 1.
POI data type of the main urban area of Xianyang City.
| POI Classification | Classified Content | Amount/% |
|---|---|---|
| public service | Road ancillary facilities, public facilities, transportation facilities and services, access facilities, government agencies and social organizations, science, education and cultural services | 445,098/14.7% |
| service for life | Catering services, shopping services, health care services, accommodation services, car and motorcycle services, other life services | 226,012/73.7% |
| leisure and entertainment | Resort, recreation places, sports venues, leisure places, theaters, scenic spots, park squares | 6114/2% |
| residence | Community, villa area, dormitory, other residential buildings | 7817/2.6% |
| business | Corporate enterprises, financial insurance services, car sales | 21,492/7% |
| Total | - | 306,533/100% |
Table 2.
Characteristics of all the data in this study.
| Data | Original Spatial Resolution |
|---|---|
| Landuse | 30 m |
| DEM | 30 m |
| Soil types | 1000 m |
| GDP spatial distribution | 1000 m |
| Population spatial distribution | 1000 m |
| Annual mean temperature | 1000 m |
| Annual precipitation | 1000 m |
Table 3.
Regression model parameters of multi-sensor image DN value correction.
| Sensor | Year | a | b | c | R2 |
|---|---|---|---|---|---|
| F10 | 1992 | −0.02258 | 2.367 | 1.055 | 0.8105 |
| 1993 | −0.0224 | 2.37 | 0.2988 | 0.8293 | |
| F12 | 1994 | −0.02044 | 2.275 | 0.3342 | 0.8311 |
| 1995 | −0.01638 | 2.029 | −0.07869 | 0.8439 | |
| 1996 | −0.01734 | 2.08 | −0.1832 | 0.8487 | |
| F14 | 1997 | −0.02138 | 2.305 | −0.06962 | 0.8437 |
| 1998 | −0.02161 | 2.307 | 0.04312 | 0.8605 | |
| 1999 | −0.02131 | 2.291 | −0.07784 | 0.8779 | |
| F15 | 2000 | −0.01322 | 1.854 | −0.2898 | 0.8938 |
| 2001 | −0.009224 | 1.585 | −0.03542 | 0.9093 | |
| 2002 | −0.005936 | 1.364 | 0.06226 | 0.9255 | |
| 2003 | −0.006234 | 1.383 | 0.07972 | 0.9312 | |
| F16 | 2004 | −0.006006 | 1.353 | 0.08464 | 0.936 |
| 2005 | −0.00528 | 1.299 | 0.05986 | 0.9607 | |
| 2006 | −0.002282 | 1.138 | −0.01368 | 0.987 | |
| 2007 | 0.00 | 1.00 | 0.00 | 1.00 | |
| 2008 | 0.001042 | 0.8904 | 0.2391 | 0.9889 | |
| 2009 | 0.002756 | 0.7729 | 0.6129 | 0.9773 | |
| F18 | 2010 | 0.008148 | 0.2989 | 0.8874 | 0.9359 |
| 2011 | 0.008364 | 0.2801 | 0.9166 | 0.9351 | |
| 2012 | 0.009073 | 0.2752 | 1.179 | 0.9367 | |
| 2013 | 0.008191 | 0.244 | 1.254 | 0.9059 |
Table 4.
The optimal threshold in extracting urban built-up area.
| Year | The Optimal Threshold |
|---|---|
| 1992 | 145 |
| 1993 | 147 |
| 1994 | 146 |
| 1995 | 150 |
| 1996 | 154 |
| 1997 | 152 |
| 1998 | 157 |
| 1999 | 150 |
| 2000 | 148 |
| 2001 | 152 |
| 2002 | 148 |
| 2003 | 147 |
| 2004 | 153 |
| 2005 | 150 |
| 2006 | 154 |
| 2007 | 150 |
| 2008 | 155 |
| 2009 | 155 |
| 2010 | 154 |
| 2011 | 157 |
| 2012 | 156 |
| 2013 | 157 |
Table 5.
The change trajectory of the gravitational center in Xi’an City from 1992 to 2013.
| Migration Parameters | In 1992–1997 | In 1998–2003 | In 2004–2009 | In 2010–2013 |
|---|---|---|---|---|
| Distance (m) | 998.5 | 589.5 | 4140 | 2844 |
| Speed (m/year) | 199.7 | 117.9 | 828 | 948 |
| Angle (°) | west by north 0.261 | west by north 0.345 | west by north 0.202 | east by north 0.494 |
Table 6.
Change trajectory of the gravitational center in Xianyang City from 1992 to 2013.
| Migration Parameters | In 1992–1997 | In 1998–2003 | In 2004–2009 | In 2010–2013 |
|---|---|---|---|---|
| Distance (m) | 935 | 6752 | 1502 | 2667 |
| Speed (m/year) | 187 | 1350 | 300.5 | 889 |
| Angle (°) | east by south 0.043 | east by north 0.330 | west by north 0.177 | east by north 0.432 |
Table 7.
Land use transfer matrix of Xianyang City 1980–1990 (unit: km2).
| Year | Land Use Type | 1990 | 1980 Total | ||||||
|---|---|---|---|---|---|---|---|---|---|
| 1 Forest | 2 Grassland | 3 Wetland and Water Bodies | 4 Built-Up Land | 5 Desert | 6 Irrigated Farmland | 7 Dry Land | |||
| 1980 | 1 forest | 1128.5127 | 0.2088 | 1.9062 | 0.0018 | — | — | 1.6974 | 1132.3269 |
| 2 grassland | 0.2088 | 2153.7792 | 2.9142 | 0.0144 | — | — | 8.2089 | 2165.1255 | |
| 3 wetland and water bodies | 4.4208 | 7.4862 | 127.0440 | 0.6921 | — | — | 24.0399 | 163.6830 | |
| 4 built-up land | 0.0045 | 0.0018 | 0.0000 | 585.9018 | — | — | 0.0288 | 585.9369 | |
| 5 desert | — | — | — | — | 0.1998 | — | — | 0.1998 | |
| 6 irrigated farmland | — | — | — | — | — | 1.8108 | — | 1.8108 | |
| 7 dry land | 4.6350 | 4.3767 | 14.3829 | 13.9401 | — | — | 6763.9266 | 6801.2613 | |
| 1990 | Total | 1137.7818 | 2165.8527 | 146.2473 | 600.5502 | 0.1998 | 1.8108 | 6797.9016 | 10,850.3442 |
Table 8.
Land use transfer matrix of Xianyang City 1990–2000 (unit: km2).
| Year | Land Use Type | 2000 | 1990 Total | ||||||
|---|---|---|---|---|---|---|---|---|---|
| 1 Forest | 2 Grassland | 3 Wetland and Water Bodies | 4 Built-Up Land | 5 Desert | 6 Irrigated Farmland | 7 Dry Land | |||
| 1990 | 1 forest | 1134.2970 | 0.2358 | 0.3942 | 1.5867 | — | — | 1.2681 | 1137.7818 |
| 2 grassland | 2.1339 | 2156.2425 | 0.7407 | 0.1665 | — | — | 6.5691 | 2165.8527 | |
| 3 wetland and water bodies | 0.5994 | 6.0012 | 128.3328 | 0.0009 | — | 0.0027 | 11.3103 | 146.2473 | |
| 4 built-up land | 0.0027 | 0.0072 | 0.0009 | 600.4539 | — | 0.0009 | 0.0846 | 600.5502 | |
| 5 desert | — | — | — | — | 0.1998 | — | — | 0.1998 | |
| 6 irrigated farmland | — | — | — | — | — | 1.8108 | — | 1.8108 | |
| 7 dry land | 16.4601 | 2.5038 | 3.2913 | 110.2869 | — | 4.3191 | 6661.0404 | 6797.9016 | |
| 2000 | Total | 1153.4931 | 2164.9905 | 132.7599 | 712.4949 | 0.1998 | 6.1335 | 6680.2725 | 10,850.3442 |
Table 9.
Land use transfer matrix of Xianyang City 2000–2005 (unit: km2).
| Year | Land Use Type | 2005 | 2000 Total | ||||||
|---|---|---|---|---|---|---|---|---|---|
| 1 Forest | 2 Grassland | 3 Wetland and Water Bodies | 4 Built-Up Land | 5 Desert | 6 Irrigated Farmland | 7 Dry Land | |||
| 2000 | 1 forest | 1142.2269 | 2.5227 | 1.9233 | 3.9915 | — | 0.0018 | 2.8269 | 1153.4931 |
| 2 grassland | 3.9420 | 2136.9096 | 6.7644 | 3.4461 | — | — | 13.9284 | 2164.9905 | |
| 3 wetland and water bodies | 0.0765 | 0.1584 | 131.5881 | 0.0630 | — | 0.0009 | 0.8730 | 132.7599 | |
| 4 built-up land | 0.1458 | 0.2799 | 0.0972 | 709.6509 | — | 0.0009 | 2.3202 | 712.4949 | |
| 5 desert | — | — | — | — | 0.1998 | — | — | 0.1998 | |
| 6 irrigated farmland | 0.0027 | 0.0072 | 0.2007 | 0.0801 | — | 5.8266 | 0.0162 | 6.1335 | |
| 7 dry land | 28.1889 | 26.6454 | 9.8145 | 79.3125 | — | 0.0234 | 6536.2887 | 6680.2734 | |
| 2005 | Total | 1174.5828 | 2166.5232 | 150.3882 | 796.5441 | 0.1998 | 5.8536 | 6556.2534 | 10,850.3451 |
Table 10.
Land use transfer matrix of Xianyang City 2005–2010 (unit: km2).
| Year | Land Use Land | 2010 | 2005 Total | ||||||
|---|---|---|---|---|---|---|---|---|---|
| 1 Forest | 2 Grassland | 3 Wetland and Water Bodies | 4 Built-Up Land | 5 Desert | 6 Irrigated Farmland | 7 Dry Land | |||
| 2005 | 1 forest | 1139.5494 | 6.1659 | 1.7919 | 3.0780 | 0.0540 | 0.0018 | 23.9418 | 1174.5828 |
| 2 grassland | 25.7400 | 2046.3075 | 1.8018 | 6.5169 | 0.2205 | — | 85.9428 | 2166.5295 | |
| 3 wetland and water bodies | 1.8333 | 3.8043 | 132.7698 | 1.6533 | — | 0.0027 | 10.3248 | 150.3882 | |
| 4 built-up land | 0.1809 | 2.4570 | 0.2736 | 777.3390 | — | — | 16.2954 | 796.5459 | |
| 5 desert | — | — | — | — | 0.0666 | — | 0.1332 | 0.1998 | |
| 6 irrigated farmland | — | 0.0009 | — | 0.0036 | — | 5.1507 | 0.6984 | 5.8536 | |
| 7 dry land | 25.3539 | 34.2063 | 4.3326 | 147.7071 | 0.1116 | 0.0054 | 6344.5437 | 6556.2606 | |
| 2010 | total | 1192.6575 | 2092.9419 | 140.9697 | 936.2979 | 0.4527 | 5.1606 | 6481.8801 | 10,850.3604 |
Table 11.
Land use transfer matrix of Xianyang City 2010–2015 (unit: km2).
| Year | Land Use Type | 2015 | 2010 Total | ||||||
|---|---|---|---|---|---|---|---|---|---|
| 1 Forest | 2 Grassland | 3 Wetland and Water Bodies | 4 Built-Up Land | 5 Desert | 6 Irrigated Farmland | 7 Dry Land | |||
| 2010 | 1 forest | 1189.0881 | — | 0.5346 | 2.1447 | 0.5508 | — | 0.3393 | 1192.6575 |
| 2 grassland | — | 2086.7652 | 1.0044 | 1.6650 | 2.6388 | — | 0.8685 | 2092.9419 | |
| 3 wetland and water bodies | — | 3.0933 | 137.2725 | 0.1638 | 0.0000 | — | 0.4401 | 140.9697 | |
| 4 built-up land | — | — | 0.0558 | 936.2412 | 0.0000 | — | — | 936.2970 | |
| 5 desert | — | — | — | 0.0135 | 0.4392 | — | — | 0.4527 | |
| 6 irrigated farmland | — | — | — | — | — | 5.1606 | — | 5.1606 | |
| 7 dry land | — | 0.1935 | 4.5108 | 126.4716 | 1.7118 | 0.3843 | 6348.6081 | 6481.8801 | |
| 2015 | total | 1189.0881 | 2090.0520 | 143.3781 | 1066.6998 | 5.3406 | 5.5449 | 6350.2560 | 10,850.3595 |
Table 12.
Kernel density analysis of different types of POI in Xianyang City from 2016 to 2019.
| Type | Overall Kernel Density Analysis | Public Service Kernel Density Analysis | Residential Kernel Density Analysis | Business Kernel Density Analysis | Life Service Kernel Density Analysis | Leisure Entertainment Kernel Density Analysis | |
|---|---|---|---|---|---|---|---|
| Year | |||||||
| 2016 |  |  |  |  |  |  | |
| 2017 |  |  |  |  |  |  | |
| 2018 |  |  |  |  |  |  | |
| 2019 |  |  |  |  |  |  | |
Publisher’s Note: MDPI stays neutral with regard to jurisdictional claims in published maps and institutional affiliations. |
© 2022 by the authors. Licensee MDPI, Basel, Switzerland. This article is an open access article distributed under the terms and conditions of the Creative Commons Attribution (CC BY) license (https://creativecommons.org/licenses/by/4.0/).
Share and Cite
MDPI and ACS Style
Hu, Y.; He, Y.; Li, Y. Urban Spatial Development Based on Multisource Data Analysis: A Case Study of Xianyang City’s Integration into Xi’an International Metropolis. Sustainability 2022, 14, 4090. https://doi.org/10.3390/su14074090
AMA Style
Hu Y, He Y, Li Y. Urban Spatial Development Based on Multisource Data Analysis: A Case Study of Xianyang City’s Integration into Xi’an International Metropolis. Sustainability. 2022; 14(7):4090. https://doi.org/10.3390/su14074090
Chicago/Turabian StyleHu, Yiyi, Yi He, and Yanlin Li. 2022. "Urban Spatial Development Based on Multisource Data Analysis: A Case Study of Xianyang City’s Integration into Xi’an International Metropolis" Sustainability 14, no. 7: 4090. https://doi.org/10.3390/su14074090
Note that from the first issue of 2016, this journal uses article numbers instead of page numbers. See further details here.