
CO2 Emissions Induced by Vehicles Cruising for Empty Parking Spaces in an Open Parking Lot


Department of Computer and Information Management, School of Information and Engineering, Dalarna University, 78170 Borlänge, Sweden
*
Author to whom correspondence should be addressed.
Sustainability 2022, 14(7), 3742; https://doi.org/10.3390/su14073742
Submission received: 17 February 2022
/
Revised: 15 March 2022
/
Accepted: 18 March 2022
/
Published: 22 March 2022
Abstract
:Parking lots are places of high air pollution as numerous vehicles cruise to find vacant parking places. Open parking lots receive high vehicle traffic, and when limited empty spaces are available it leads to problems, such as congestion, pollution, and driver frustration. Due to lack of return on investment, open parking lots are little studied, and there is a research gap in understanding the magnitude of CO2 emissions and cruising observed at open parking lots. Thus, this paper aims to estimate CO2 emissions and cruising distances observed at an open parking lot. A thermal camera was utilized to collect videos during peak and non-peak hours. The resulting videos were utilized to collect cruising trajectories of drivers searching for empty parking spaces. These trajectories were analyzed to identify optimal and non-optimal cruising, time to park, and walking distances of drivers. A new CO2 model was proposed to estimate emissions in smaller geographical regions, such as open parking lots. The majority of drivers tend to choose parking spaces near a shopping center, and they prefer to cruise non-optimal distances to find an empty parking space near the shopping center. The observed mean non-optimal cruising distance is 2.7 times higher than the mean optimal cruising distance. Excess CO2 emissions and non-optimal cruising were mainly observed during visitor peak hours when there were limited or no empty parking spaces. During visitor peak hours, several vehicles could not find an empty parking space in the region of interest, which also leads to excess cruising.
1. Introduction
Parking has been considered a problem for several decades due to the increasing number of vehicles and the limited number of parking spaces at locations of interest (LOI), such as city centers, shopping centers, airports, etc. Some of the common problems associated with parking are additional cruising, pollution, congestion, and driver frustration. This is a common problem across the globe, where the severity of these problems increases with higher population density. The intensity of these problems varies spatially and temporally [1,2]. Further, the problem intensifies during peak hours when traffic flow is high, which also leads to accidents [3,4,5,6]. According to a study in the central city area of Zurich, parking occupancy was around 97% on a weekend, leading to congestion and pollution [7]. Based on a group of studies mentioned in Shoup (2015) [3], the cruising time to find a vacant parking space was between 3.5 and 14 min. Cruising is defined as a slow-moving vehicle in search of a parking space, and this cruising behavior is commonly observed in parking lots. Searching for an empty parking space leads to cruising and frequent stops which increases CO2 emissions [8]. Prolonged exposure to harmful emissions, such as CO2, can lead to respiratory diseases like asthma [9]. Carbon and other emissions, such as nitrogen oxide and carbon monoxide, peak during the morning and evening times. Therefore, there is a need to understand the magnitude of these problems occurring at parking lots, where frequent pedestrian movement is observed. Passenger vehicles account for 66% of pollution emitted by road traffic [10]. Hence, it is necessary to look at the cruising behavior performed by many vehicles in search of empty parking spaces.
According to Weinberger et al., (2020) [11], cruising time and distance depend on the configuration of the city, time, and location of parking spaces. However, there are not many studies that compare optimal and non-optimal cruising behavior to find an empty parking space. Based on Weinberger et al., (2020), it is considered optimal if the driver finds an empty parking space within a threshold distance, while it is non-optimal if the driver takes more than the threshold distance to find an empty parking space. Cruising non-optimal distances also increase CO2 emissions. To the best of our knowledge, most studies on parking behavior have focused on on-street parking lots [12]. Only a fraction of the studies focused on cruising behavior in open parking lots. This is problematic since parking lots are areas of high pollution due to the large number of cruising vehicles in search of empty parking spaces, especially during peak hours and at locations of interest. Unlike CO2 emissions observed at long road segments, CO2 emissions observed in an open parking lot are concentrated in a smaller geographical area. Parking lots comprise the movement of people and vehicles, and people are directly affected by the emitted CO2 emissions. Parking lots are classified into two categories: open and closed. Closed parking lots provide parking spaces that are not free, while open parking lots provide free parking spaces for a limited duration. The demand for parking spaces is higher in open parking lots as they are free. Therefore, vehicle traffic is high in open parking lots compared to closed parking lots [13]. Parking lots occupy large geographical areas, sometimes more than needed, and it is vital to utilize these areas efficiently [14]. Understanding cruising behavior will give insight into improving the design of parking lots, which will also facilitate the reduction of non-optimal cruising. Non-optimal cruising distances may not be larger in open parking lots, compared to on-street parking lots. However, the number of vehicles searching for empty parking spaces is higher in open parking lots due to higher capacity and free parking spaces. Thus, greater demand for parking spaces leads to higher traffic, congestion, and CO2 emissions in open parking lots.
One problem observed is the methodology used to study cruising behavior in previous studies. Based on van der Waerden et al., (2015) [15], travel surveys were utilized to understand cruising behavior characteristics, such as choice and parking search time. However, it is limited to the number of respondents and recollection of the driver’s memory. Therefore, suitable sensors can be utilized to collect vehicle movement data to understand cruising behavior. Sensors, such as optical cameras, onboard sensors, and Global Positioning System (GPS), can be utilized to capture data from parking lots. However, GPS data is dependent on volunteers and accuracy. Furthermore, using underground sensors requires expensive installation on an open parking lot, and the use of optical cameras has illumination and privacy issues. Therefore, thermal cameras were utilized in this study as they overcome various illumination and privacy issues. To the best of our knowledge, this is the first time a thermal camera was used to identify cruising behavior in an open parking lot. Usage of the thermal camera also facilitates obtaining an overview of multiple moving vehicles using a single device. The CO2 emitted from an open parking lot was also not estimated in any of the previous studies. This study provides a glimpse of CO2 emissions emitted during peak and non-peak hours.
This study aims to estimate excess CO2 emissions from the observed cruising of drivers searching for empty parking spaces. To address this aim, the vehicles’ optimal and non-optimal cruising distance, CO2 emissions, time taken by drivers to reach an empty parking space, and the proximity to LOI are examined. The following research questions are established:
- What are the estimated CO2 emissions caused by optimal and non-optimal cruising in the open parking lot?
- How much optimal and non-optimal cruising time are taken to find an empty parking space?
- Does the choice of parking space impact CO2 emissions?
In this study, optimal distance refers to if the driver occupies an empty parking space in the entered parking lane. Non-optimal distance refers to if the driver misses at least one empty parking space in the entered lane and occupies an empty parking space in another lane. Cruised distance is calculated using the trajectory of each vehicle. CO2 emissions are estimated using the cruised distance and average CO2 emissions. Parking choice is based on the selection of parking space and its proximity to the entrance of the location of interest.
The following are the contributions of this study:
- The study utilizes vehicle cruising trajectories in an open parking lot to calculate cruising distance, walking distance, and time. Cruising distance of multiple drivers helps us to understand the magnitude of cruising performed in open parking lots.
- Since the area of study is a small geographical area, an open parking lot, a new CO2 emissions model is proposed that is suitable for smaller areas based on fuel consumption.
- Analysis of observed cruising behavior will also contribute to improving the design of parking lots and facilitate the reduction of CO2 emissions. For instance, based on the frequency of vehicles, the duration of parking time can be modified to accommodate more vehicles. Due to shorter parking time, there will be more available empty parking spaces, and vehicle traffic to these parking spaces can also be reduced, leading to less pollution.
The remaining sections of the study are organized in the following way: Section 2 discusses relevant literature on cruising behavior. Section 3 presents the method and discusses the process of data collection and analysis. Section 4 discusses and analyses results. Finally, Section 5 presents limitations and Section 6 presents our conclusion.
2. Related Work
Parking search behavior in previous studies is analyzed and discussed in this section. Similar studies utilized various data collection methods, such as travel diaries or surveys, onboard sensors, GPS, and stationary cameras. The suitability of data collection methods for open parking lots is also discussed. In a study by Brooke et al., (2014) [16], travel survey data was used to analyze the time taken by drivers to occupy an empty parking space. The study was conducted in the Netherlands where there were no open parking lots. Cruising times were estimated by the driver, from the vehicle entering a parking facility and occupying an empty parking space. The average time taken by drivers to occupy an empty parking space was 36 s. The average search time across multiple parking lots is low, as no open parking lots leads to higher demand and traffic. The study identified that higher search time led to higher parking duration. There was a small percentage of drivers who took more than 3 min to find a vacant parking space. Similarly, in another study, an online questionnaire was conducted which identified the influence of previous experience in the selection of parking lots [15]. The cruising time and choice of parking lot location details were dependent on the accuracy of respondents’ input. The use of surveys limits the data to a specific set of respondents, and it is not possible to obtain an overview of all the drivers who parked their vehicles in a parking lot.
In Hampshire et al., (2016) [17], parking search behavior was analyzed using an onboard camera and a GPS device in the vehicle. GPS was used to track the route and time of the search, while gestures of the driver were used to identify the start of the parking search. The study identified that the driver tended to search for a parking space for 100 m before occupying an empty parking space. An onboard camera was installed to observe the driver, and naturalistic movements of drivers were used to identify if the driver began to search for an empty parking space. Other similar studies have utilized onboard cameras and radars to analyze cruising behavior, not in parking lots but on highways, in multiple lanes, and at roundabouts [18,19]. The use of onboard sensors, radars, or GPS limits the study to specific vehicles or volunteers. An overview of multiple drivers is not possible using onboard sensors. Similarly, in Garcia et al., (2012) and Verma et al., (2018) [20,21], the fusion of camera and sensor data was performed to detect and track vehicle movement. Trajectories were generated to identify different vehicles maneuvers, such as lane changing, overtaking, and turning. Usage of cameras would enable us to get an overview of the driving behavior of multiple observed drivers. However, privacy issues may arise, as vehicles or people can be recognized using optical cameras. In addition, millimeter-wave radar has been used to alert researchers to the proximity of other vehicles on the road [22]. However, millimeter-wave radar has limited field view, making it difficult to detect vehicles in multiple lanes.
GPS data to analyze parking search behavior is objective and not based on estimation, unlike surveys, travel diaries, or visual inspection [23]. In one study, [24], parking search behavior was analyzed using GPS devices in a city in Belgium. A GPS logger with 3 s signal frequency was used to capture driving behavior. The average time to find a vacant parking space was 1.18 min. Parking search time was higher in this study as it focused on on-street parking lots in the city center, where vehicle traffic was higher than the available number of parking spaces. Similarly, another study utilized GPS data to identify and analyze the cruising of vehicles, where excess cruising was found in 6% of total vehicle trips [11]. If the cruising distance was more than 200 m, then drivers who took that route were assumed to drive an additional distance to reach their destination. The study collected data using GPS and performed map matching to measure the cruising distance of the vehicle. In addition, in this study, the driving path of the vehicles was map matched to capture traveled distance in the open parking lot. Walking distance was used to identify the choice of parking space, based on its proximity to the location of interest. The open parking lot chosen consisted of a few parking spaces closer to the LOI, while a few parking spaces were located further apart from the LOI. Walking distance to the LOI would provide the driver’s preference in the selection of empty parking spaces. Driving distance alone would not provide insight into a driver’s preference, as a driver can cruise non-optimally to occupy an empty parking space. However, this is only applicable when there are several empty parking spaces available. Similarly, in Montini et al., (2012) [23], walking distance was used to observe the distance between the parked vehicle location and the destination in a cluster of parking lots, using GPS data. The study identified that an acceptable walking distance to reach a destination was 600 m as it covered multiple parking lots. A radius of 800 m around the parking lot was a parking search starting point and based on the stop location, walking distance to the destination was measured. GPS is capable of capturing long vehicle trajectories, but the accuracy of data is dependent on several factors, such as the satellite’s position, weather conditions, and other obstructing structures [25]. A GPS device should be carried by the driver or a mobile application for GPS tracking while the driver is cruising in the parking lot should be used. The study would be limited to a few volunteers where accuracy is dependent on external conditions. The route taken by the driver might not be ascertained in an open parking lot, due to limitations in the frequency of GPS signals. Therefore, GPS is not well suited to identify cruising behavior in an open parking lot.
Detection and tracking of vehicles over continuous frames is complicated, due to occlusion and size variability, based on distance and position [22]. One study utilized a stationary camera and estimated that 15% of total traffic was cruising for parking [26]. A sample of 876 observations was made on two days in September 2017. The camera was mounted on lamps and signal poles overseeing an on-street parking lot. After a car vacates a parking space, the number of vehicles passing the vacant parking space is counted until the vacant parking space is again occupied. Using the number of traversed vehicles, the method estimates the number of vehicles cruising for parking. In another study, an optical camera was utilized to capture data, and vehicle trajectories were generated over a road segment, using the background subtraction method [27]. Speed, acceleration, and deceleration of multiple vehicles were captured, which will be useful for city planning administrators. In another study, background subtraction, corner-feature tracking, and cluster tracking were used to track and draw trajectories of pedestrians, bicycles, and vehicles [28]. Usage of videos would limit the study to a particular place or parking lot [11]. The movement of all vehicles within camera range can be captured and analyzed, which makes it a suitable approach for this paper. However, the usage of an optical camera might present problems of varying illumination conditions and privacy concerns.
Carbon and other harmful emissions were estimated for several vehicle categories, such as car, truck, and bus [29]. These pollutant emissions coefficients were utilized in Song et al., (2019) [30] to estimate emission levels at several zones, such as an expressway, a business zone, an industrial zone, and ports. Surveillance cameras were utilized to collect vehicle traffic data in those zones. Vehicles were detected using Yolo, which is a deep learning algorithm used to obtain a vehicle count. The count of vehicles was multiplied by the pollutant emissions coefficient to estimate emission levels, and it was found that pollution levels from cars were highest at business zones, such as shopping centers. This study also captures the distance of cruising vehicles in the parking lot. Therefore, the method proposed in [31] was relevant for estimating carbon emissions. The method defines pollution coefficients for cruising vehicles in urban conditions. In Jia et al., (2013) [32], GPS was utilized to calculate CO2 emissions to and from a popular shopping center. The data was collected from 151 volunteers using a portable GPS device. The average CO2 emissions amount identified for drivers traveling to the shopping center was 176 g/km. Usage of GPS provides more details, such as velocity and timestamp, compared to usage of videos. GPS is commonly utilized for a larger geographical area, where the signal frequency is between 5 and 30 s. However, in this study, cruising of drivers is observed only in the parking lot, which is a smaller geographical area. Therefore, usage of GPS is not reliable as it requires a frequency ping every 1 s. The usage of GPS limits the study to a certain number of volunteers. Therefore, a camera would give a broader overview of cruising behavior and CO2 emissions in a parking lot.
3. Materials and Methods
The present study was carried out in Sweden, a country with harsh weather conditions and limited daylight during the winter, which affect the visibility of optical cameras. Furthermore, since the usage of optical cameras is restricted, due to privacy issues, thermal cameras serve as an alternative. A thermal camera detects objects based on emitted heat, and it does not depend on illumination conditions. Thus, privacy concerns are avoided, as pedestrians or vehicles cannot be identified [33]. Hence, a thermal camera was utilized in this study to collect data from the parking lot. This section further discusses the setup of the parking lot, data collection, and identification of parking behavior.
3.1. The Setup of the Data Collection Area
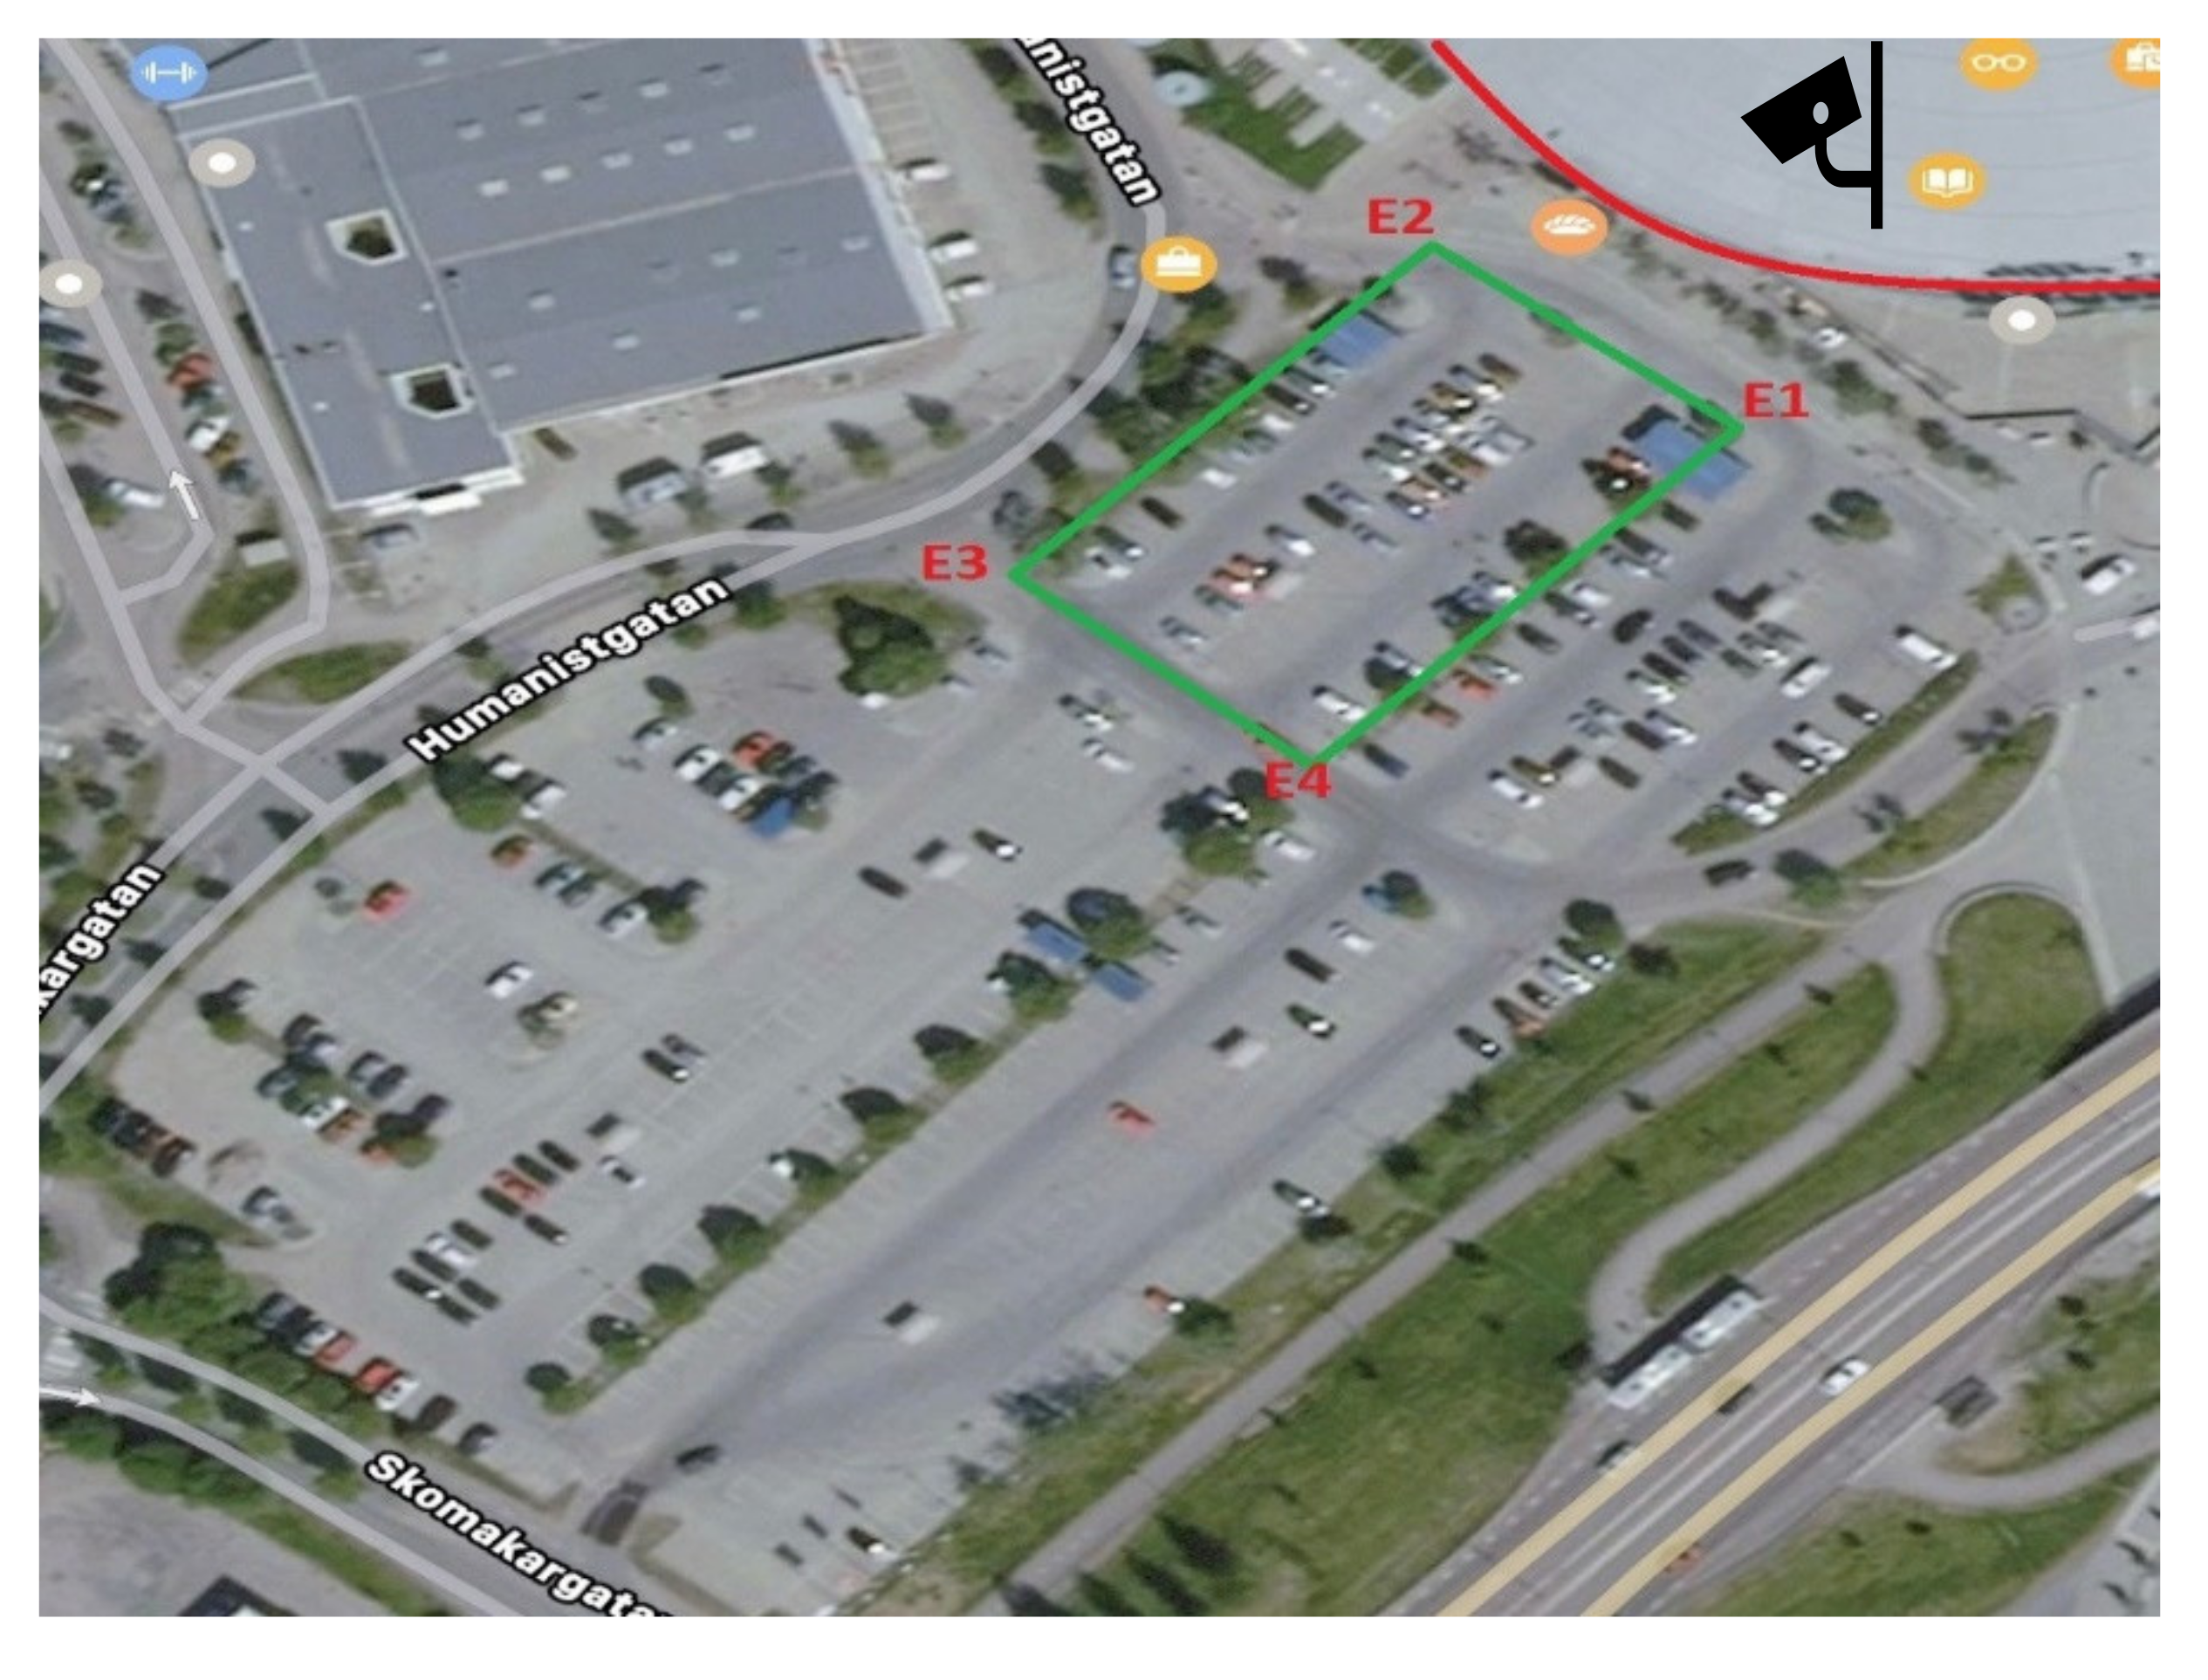
Business zones, such as shopping centers, had the highest amounts of carbon emissions [30]. Thus, an open parking lot beside a shopping center was chosen for this study. To monitor the chosen open parking lot, a thermal camera was set up at the entrance of a typical shopping center in a mid-sized city, namely Borlänge. The chosen open parking lot under surveillance is located outdoors and is one of the main parking lots of the shopping center (see Figure 1). Since the parking lot is outdoors, it is subjected to varying illumination and seasonal conditions. The entire region of the parking lot could not be covered, as the visibility of vehicles is diminished outside the proposed region of interest (ROI). Even though the sample area is simple, it is large enough for this study. The ROI covers approximately 15% of the total occupancies in the entire parking lot. However, the ROI is placed close to the LOI, which is assumed to have a higher vehicle traffic density, compared to parking spaces farther from the LOI. The location of the ROI at the parking lot is shown in Figure 1, and the movement of vehicles within this region is detected and tracked. The parking lot consists of 4 entrances, namely E1, E2, E3, and E4. The current time limit for parking vehicles is 3 h in the parking lot. Vehicles can enter the parking lot from multiple directions, which will lead to multiple orientations of the vehicle. The circular structure is the shopping center, highlighted by a red line in Figure 1, as the location of interest (LOI). An Axis Q1942-E thermal camera was positioned on top of a shopping mall to observe the cruising of vehicles (see Figure 1). The camera’s focal length is 19 mm and the viewing angle is 32 degrees.
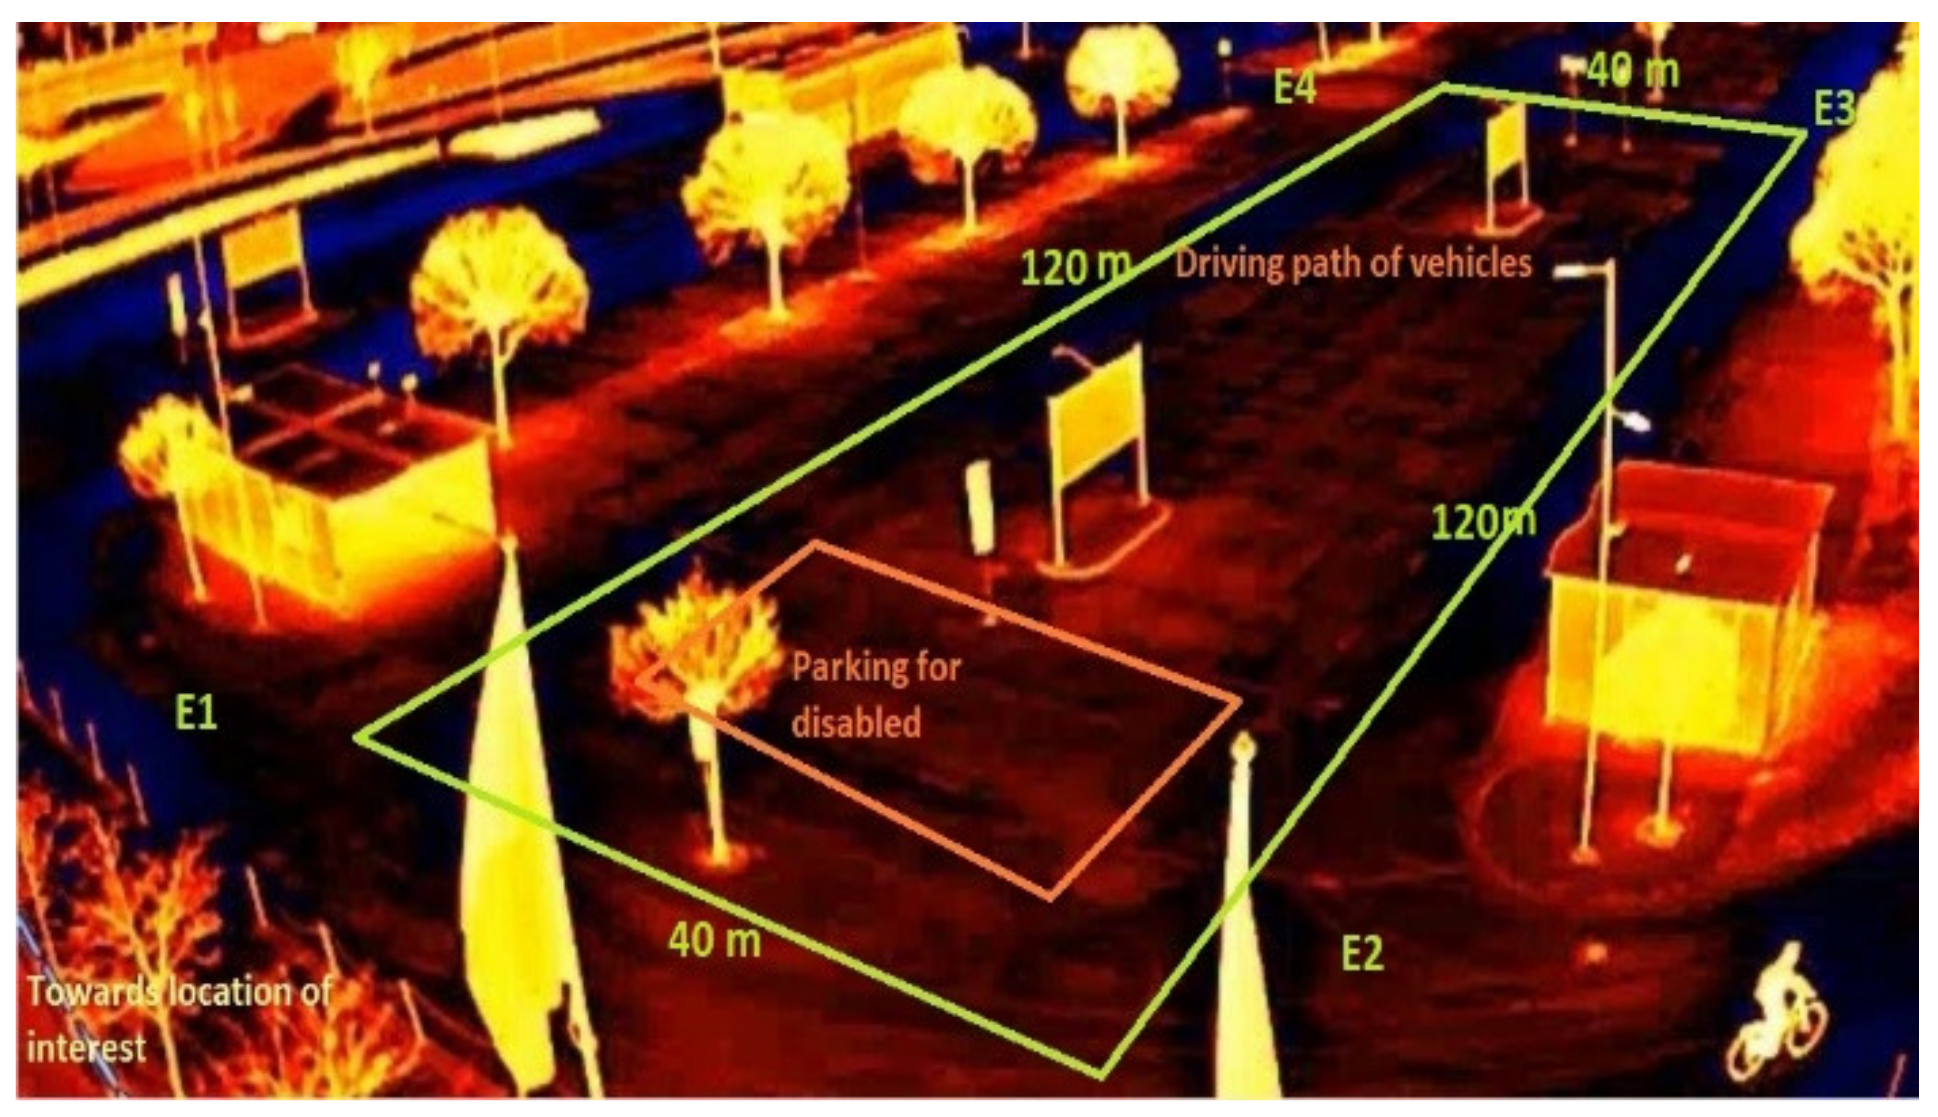
As shown in Figure 1, the vehicles parked are visible in the camera from the side view and not from the front or rear. The front or rear view of a vehicle is ideal for object detection, due to discernible features. Since the vehicles in the parking spaces are viewed from the side, they appear clustered and cannot be detected individually. Figure 2 shows the region of interest, from the viewpoint of the thermal camera. Cruising patterns to disabled parking were not analyzed in this study, and therefore the small region within the ROI is excluded, as it was allocated to the disabled. The total distance of the cruising path in ROI is 320 m, which is highlighted with a green line in Figure 2.
3.2. Data Collection and Illustration of Process
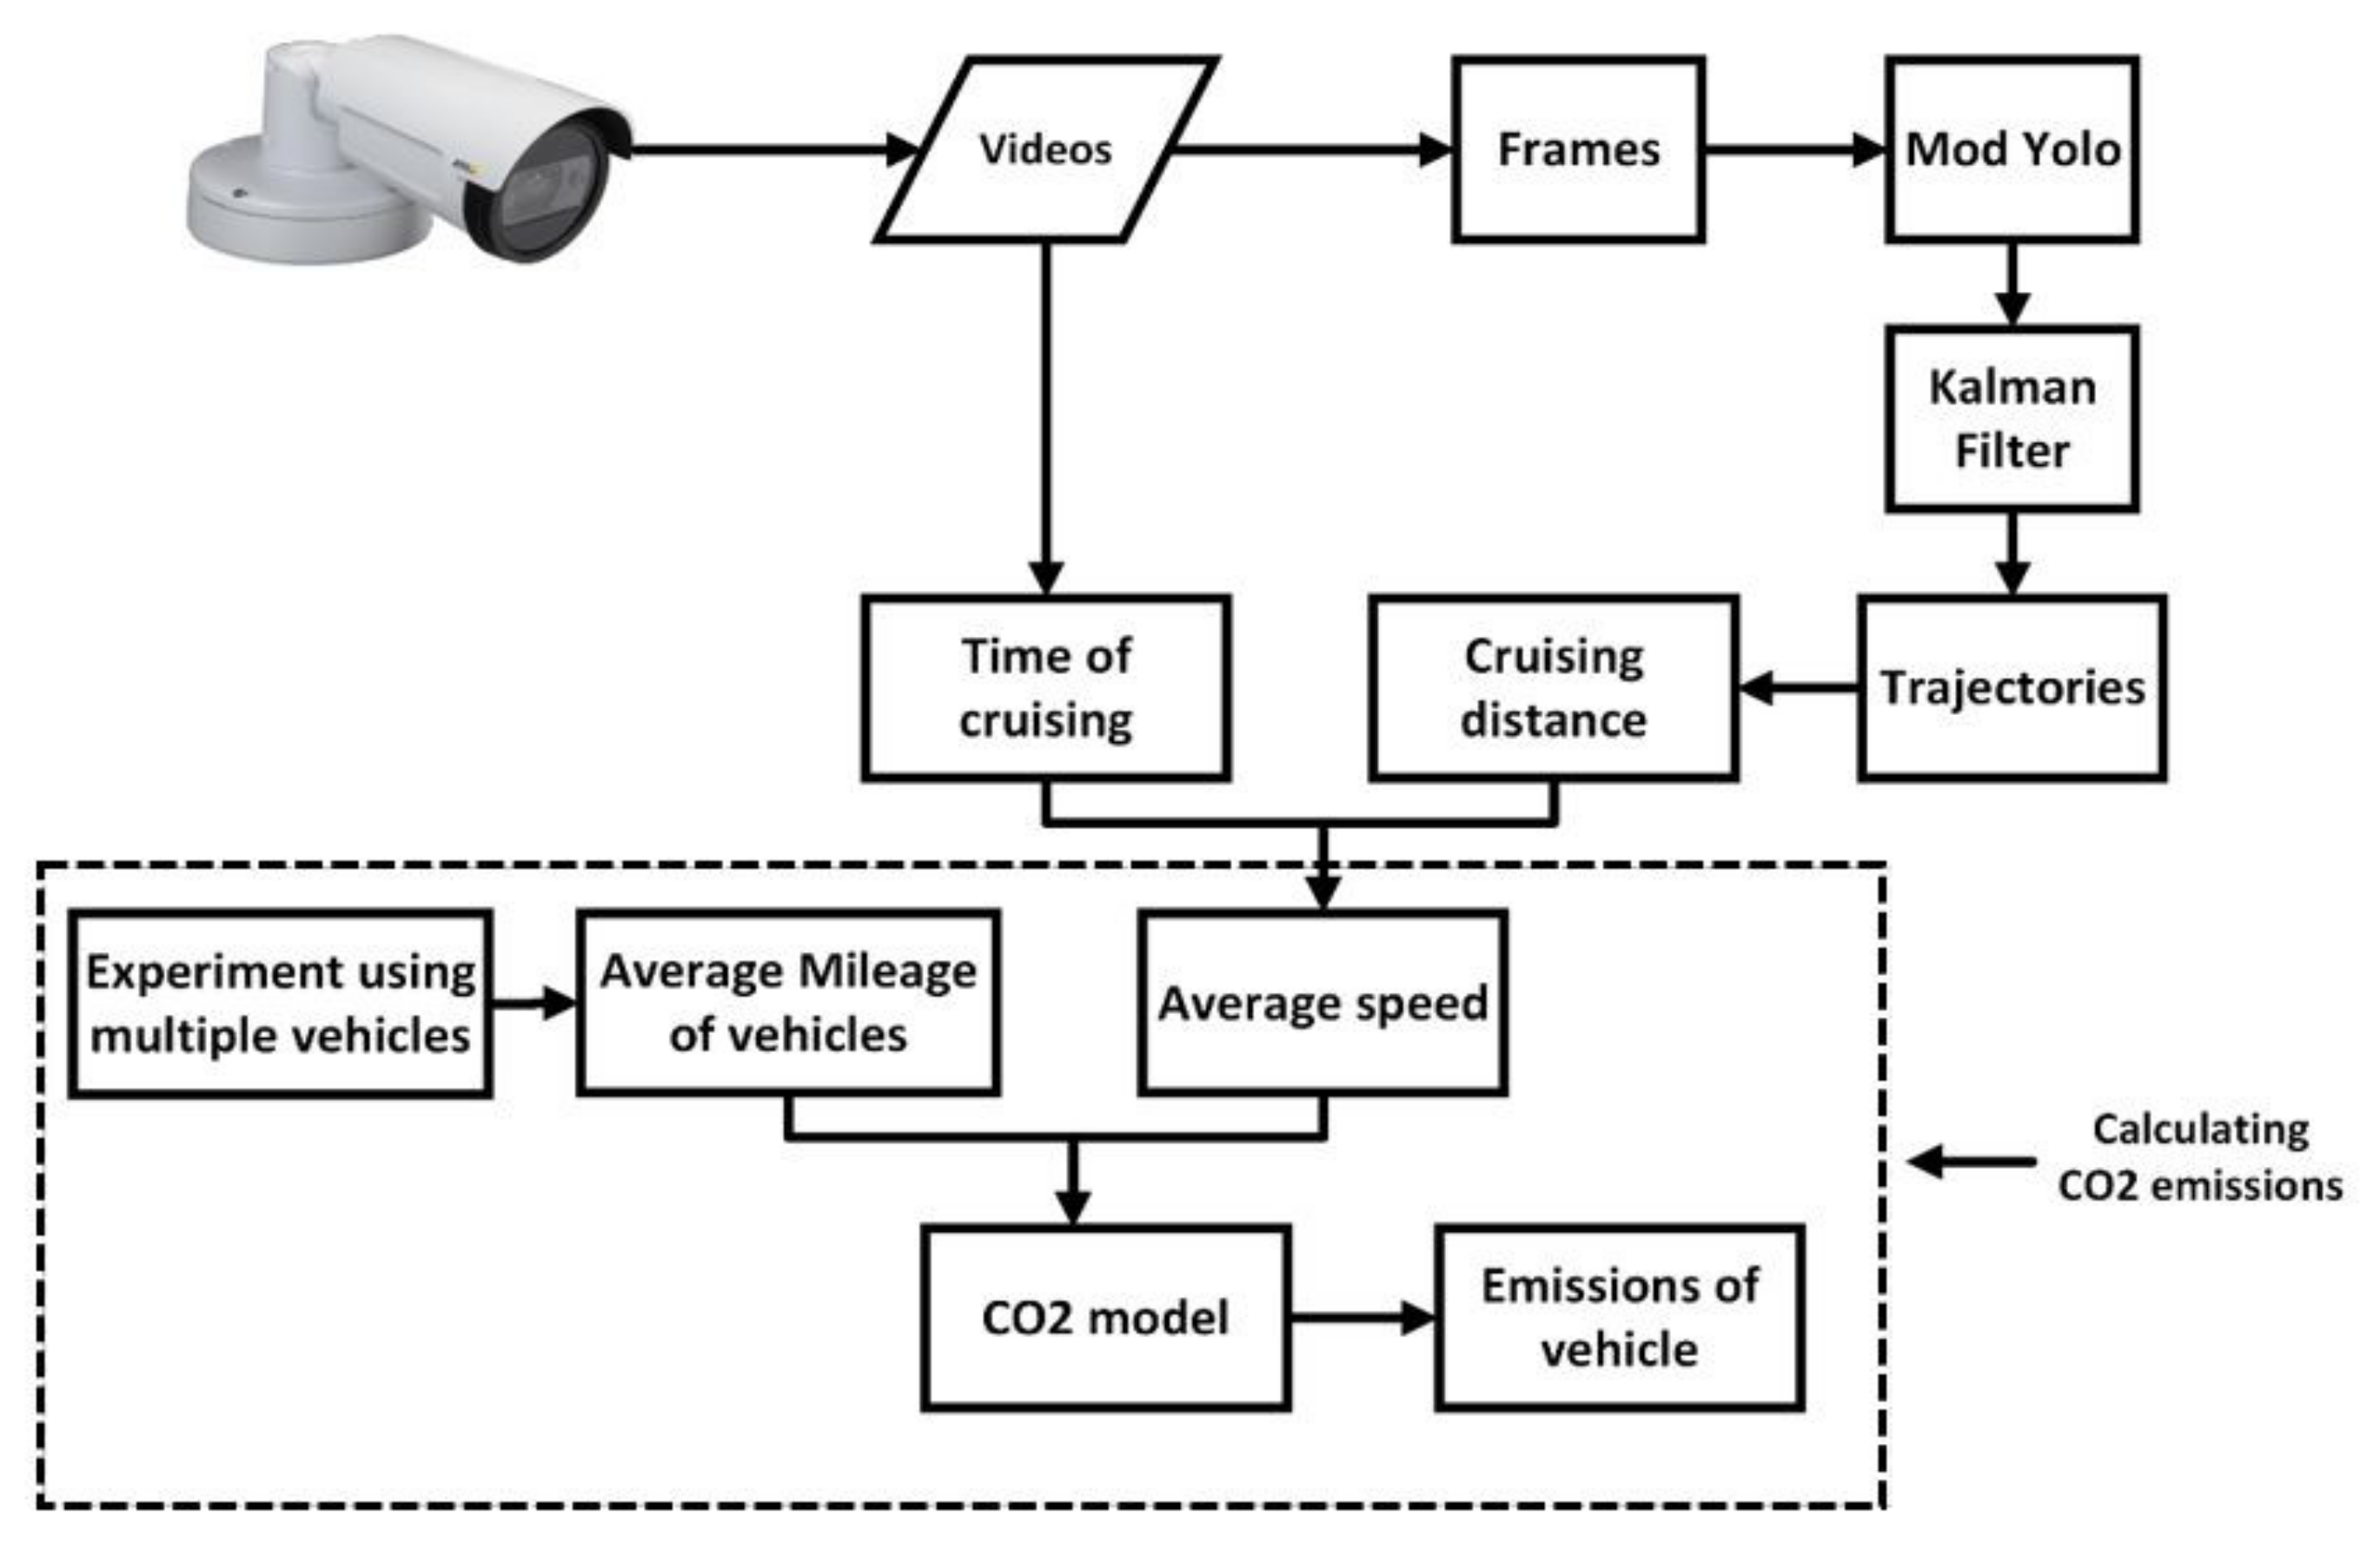
The data utilized in this paper was collected over two days in January 2020. A total of four hours of video was utilized in the study, where two hours of data were selected for each day. Even though only two hours of data are selected for each day, the selected sample represents most of the traffic movement in the parking lot. Each day consists of one video with several empty parking spaces and another video with minimal, or no, empty parking spaces. Videos with several empty parking spaces were referred to as visitor non-peak hours, and minimal or no empty parking spaces were also referred to as visitor peak hours. Visitor non-peak hours consist of empty parking spaces between 30% and 100%, while visitor peak hours consist of empty parking spaces between 0% and 30%. These two cases cover the majority of cruising situations. Therefore, videos from other high vehicle traffic durations, such as evening, were not obtained. For variability and to identify differences in cruising behavior, based on the availability of parking spaces, one set of videos was collected from Friday (i.e., weekday), and another set was collected from Saturday (i.e., weekend). Friday is chosen, as it is expected to have higher weekday vehicle traffic, while Saturday is expected to have a higher number of weekend vehicle traffic. The movement of the driver was tracked to capture the trajectory of the vehicle in the parking lot. The process of tracking is illustrated in Figure 3. The training and evaluation of Mod Yolo and Kalman filters were discussed in a previous paper [34]. Mod Yolo is a deep learning algorithm used to detect moving vehicles, while a Kalman filter is an estimator used to maintain data associations of detected vehicles. An identity (ID) is assigned to each detected vehicle, and this ID is maintained throughout the vehicle detection; this process is also referred to as data association.
The total number of observed drivers searching for empty parking spaces was 316. The two hours of video was split into multiple videos based on each driver. The framerate of the utilized videos was 8 frames per second. Drivers searching for empty parking spaces were captured, while drivers exiting the parking lot were not captured. Trajectories of these 316 drivers were calculated using Mod Yolo and Kalman filters (see Figure 4b for an example of a trajectory). Each trajectory represents the search path taken by the driver in searching for an empty parking space. The captured driver’s trajectory was map matched on a GIS application to measure cruising distance and its proximity to the LOI. The time taken by the driver to reach the empty parking space was captured using videos, as illustrated in Figure 3. Average speed of vehicles was captured using cruised time and distance. The CO2 model proposed in Section 3.5 estimates emissions based on fuel consumption and mileage information. The mileage information of vehicles observed in the open parking lot is not available. Therefore, an experiment was conducted on multiple vehicles cruising for empty parking spaces in the open parking lot to capture mileage information, as shown in Table 1. The average mileage information was utilized in the CO2 model to estimate emissions of multiple vehicles.
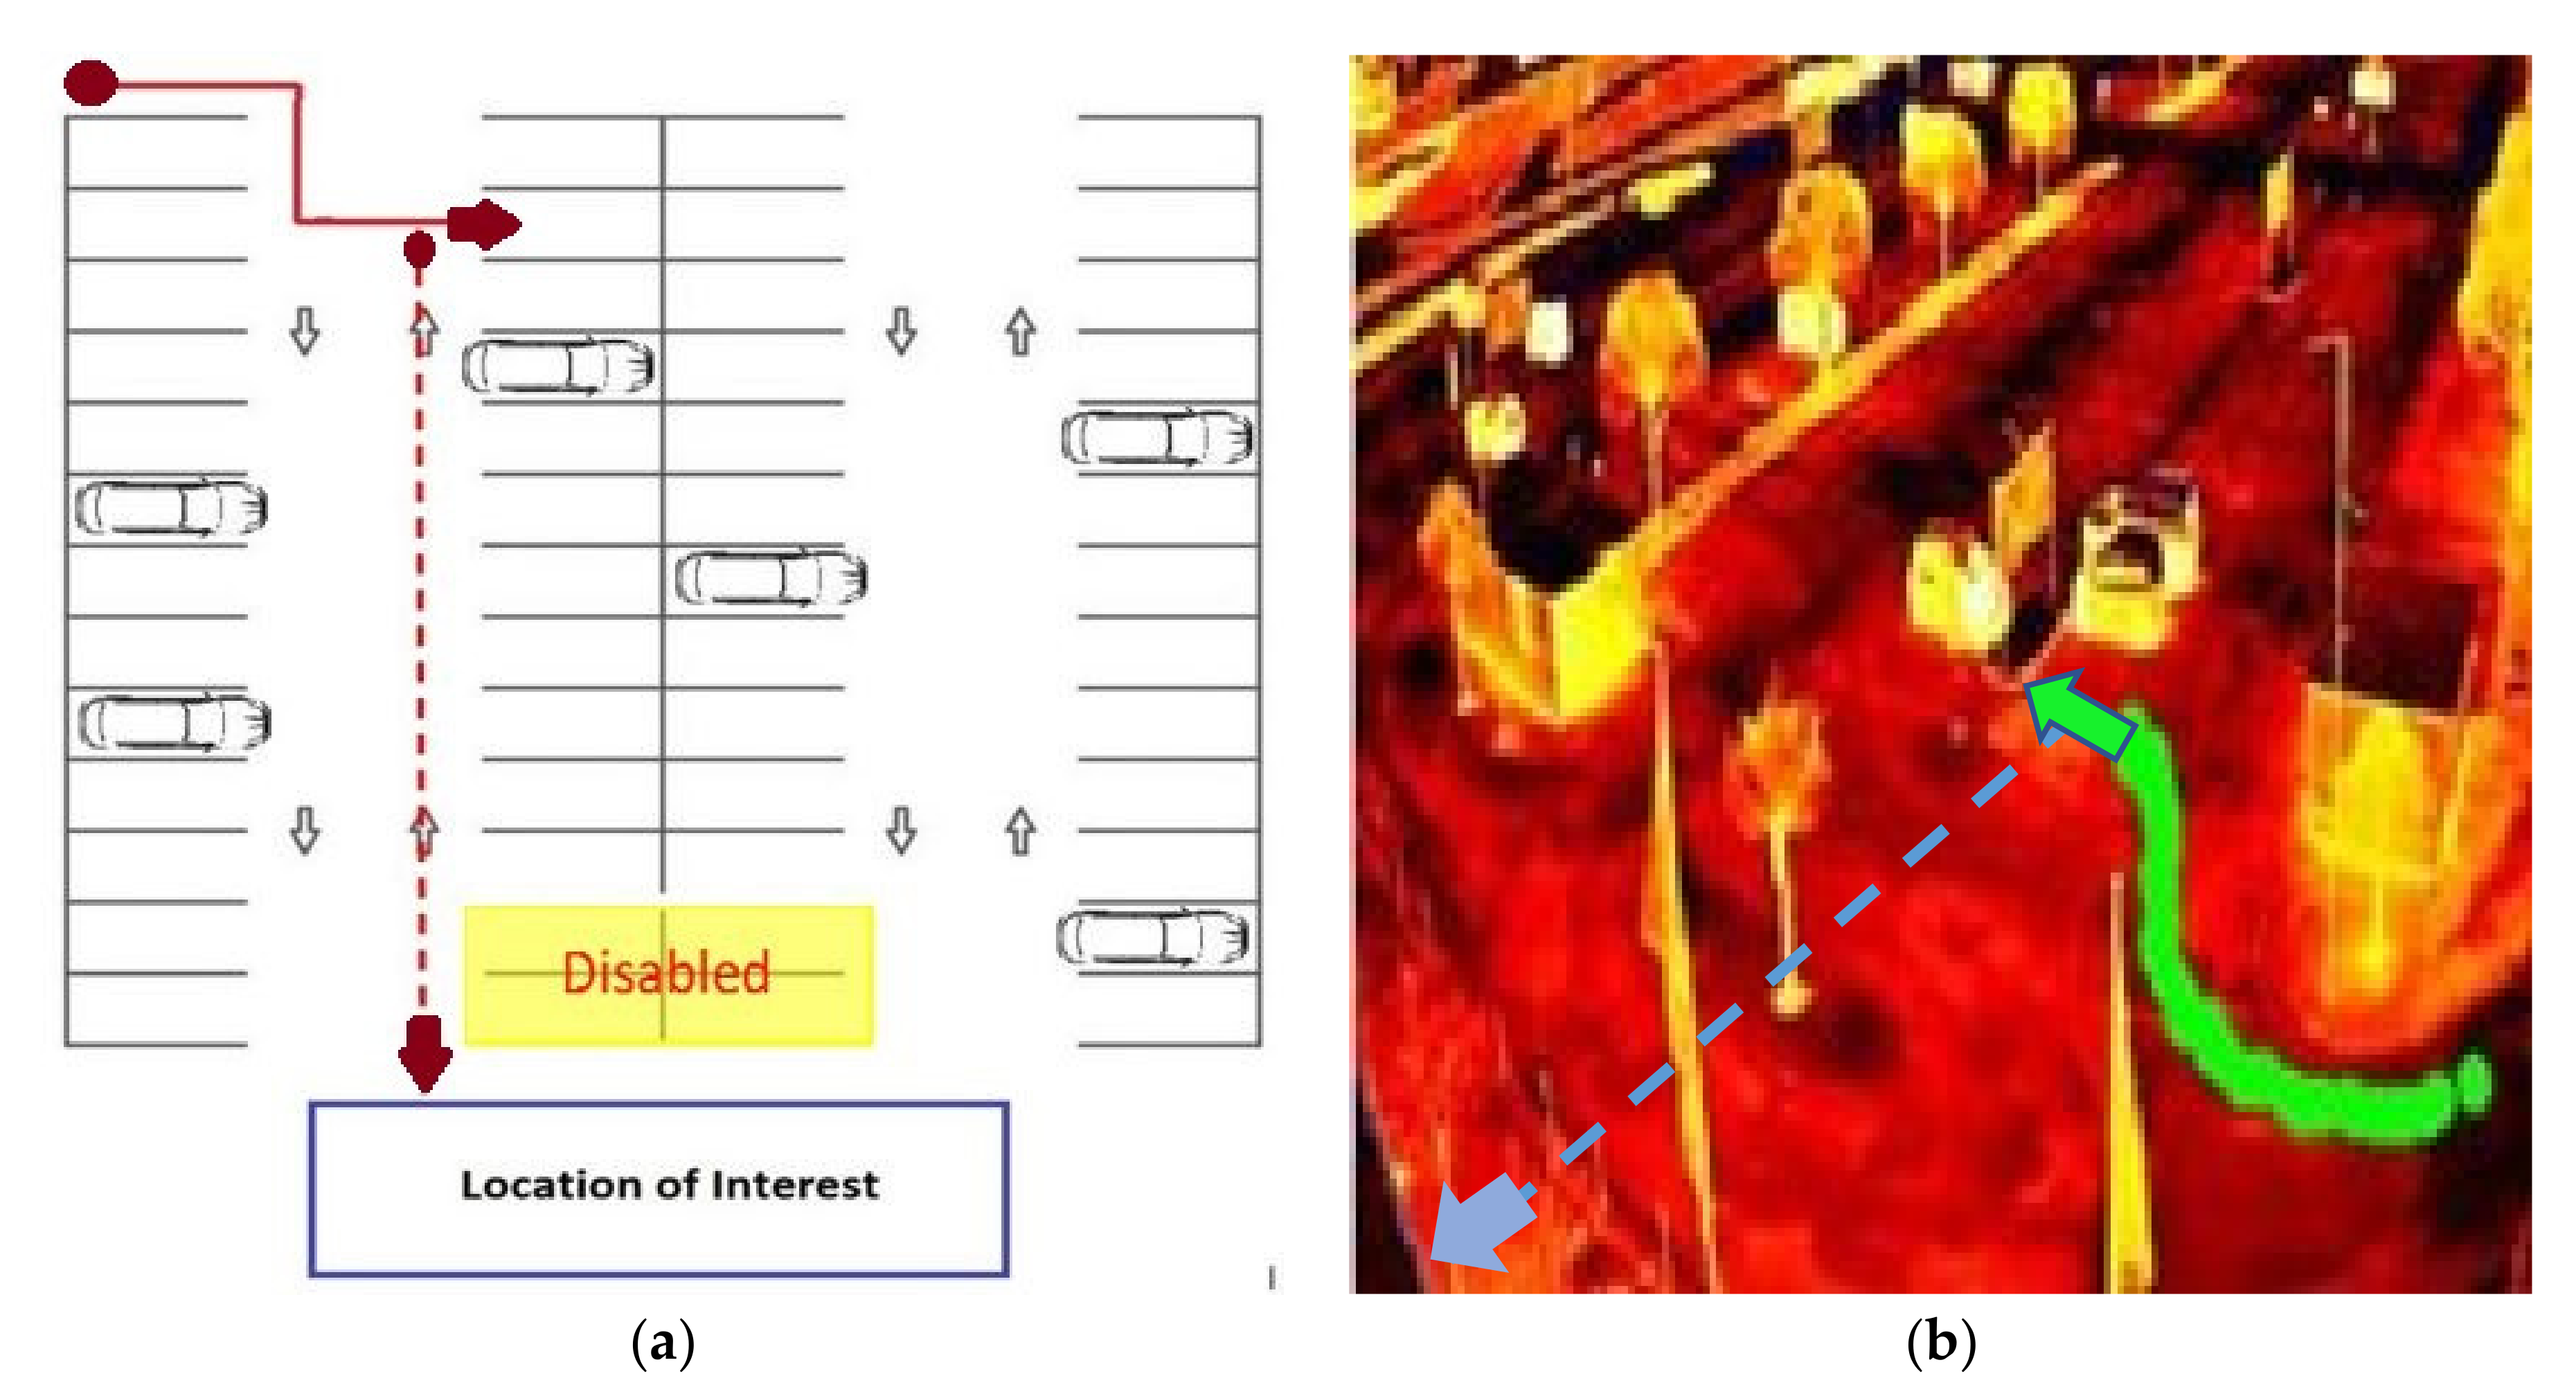
3.3. Some Illustrations of Observed Cruising Behavior and Choice of Parking
Parking choice is evaluated based on its proximity to the LOI and on the cruising and walking distance. Proximity to the LOI is measured by walking distance, while cruising distance facilitates an understanding of the importance given by the driver to LOI. In Figure 4a, walking distances are illustrated by a red dotted line, while a non-dotted red line represents the cruising path. The same can also be observed in Figure 4b. We assume that the choice of parking and cruising distance is dependent on availability of parking spaces. Therefore, choice was evaluated based on visitor non-peak and peak hours, respectively.
3.4. Classification of Optimal and Non-Optimal Cruising Behavior
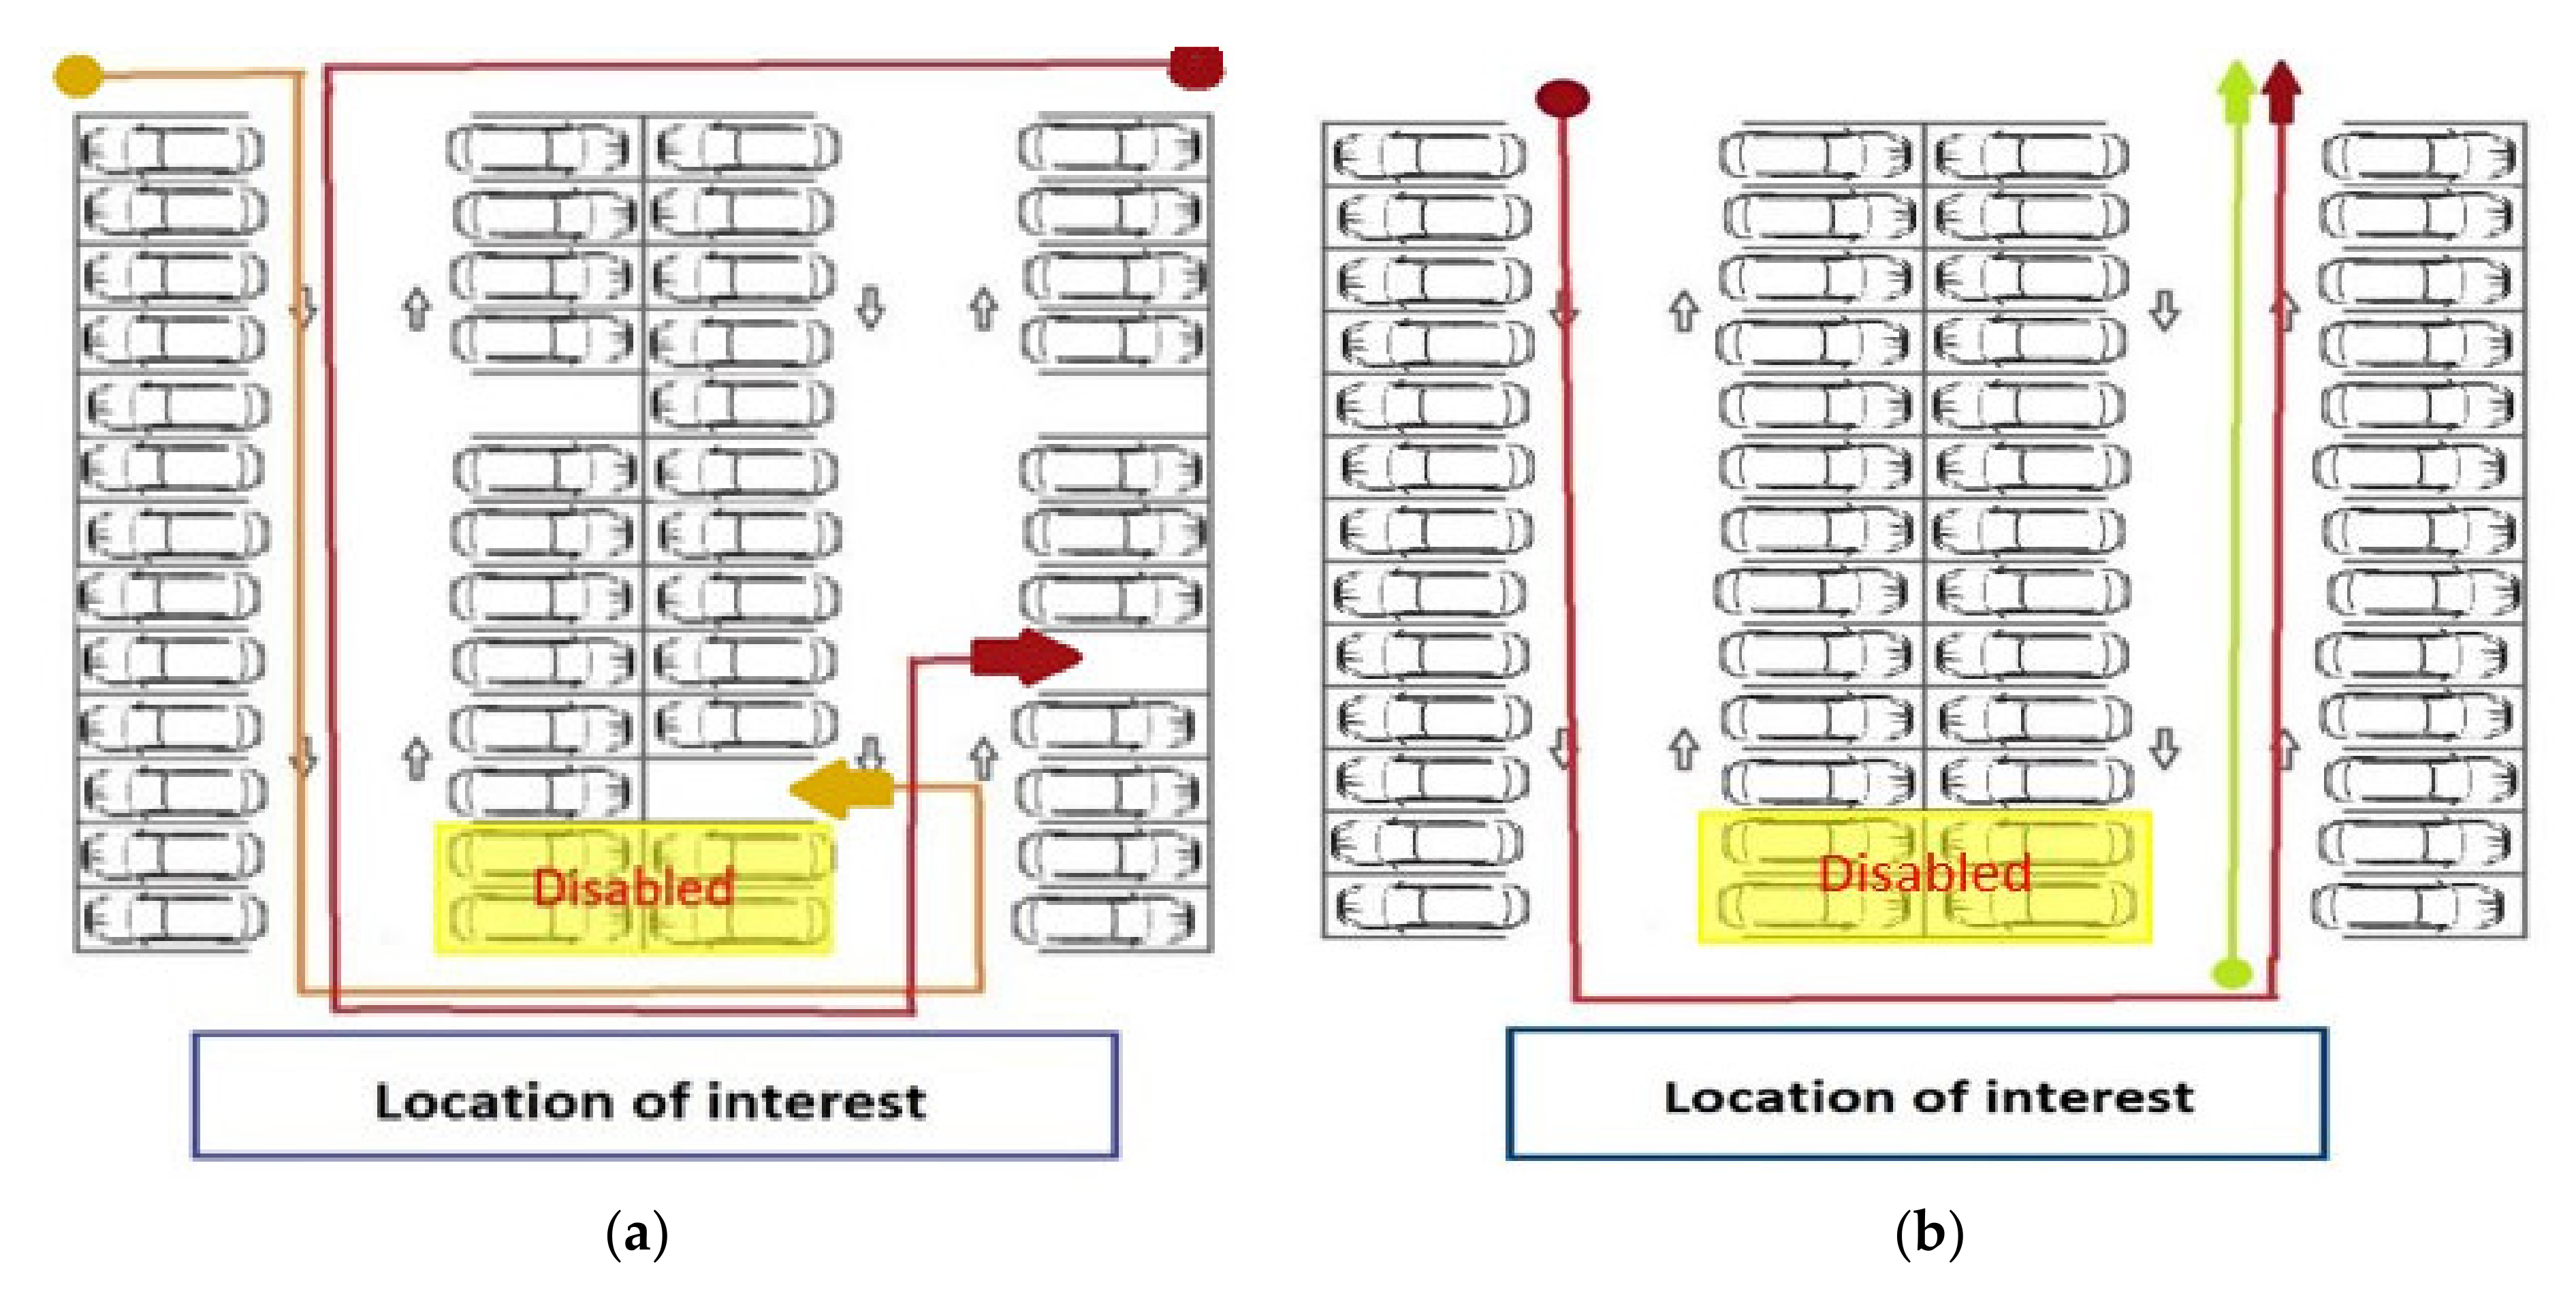
The cruising path was considered optimal if the driver parked the vehicle in the same lane, as illustrated in Figure 4. The shortest path to an empty parking space is not considered optimal, due to the short distance of each parking lane. Thus, it is not considered non-optimal even if the driver passes an empty parking space and occupies another empty parking space in the same lane. Therefore, in this study, optimal cruising does not lead to additional cruising. As illustrated in Figure 5a, non-optimal cruising refers to when the driver passes the entered lane and cruises to another lane in search of a parking space. Cruising to another lane increases the traveling distance and it can also lead to congestion during peak hours. Therefore, non-optimal cruising also refers to additional cruising observed in an open parking lot.
In Figure 5a, the red trajectory indicates the driver entering the ROI in one lane and parking in another lane. Similarly, the orange trajectory indicates the driver entering one lane and parking in another lane. Hence, this cruising trajectory is non-optimal, leading to additional cruising. In Figure 5b, the red trajectory indicates a driver entering the parking lot, having traveled in two lanes and exited the ROI. Similarly, the green trajectory indicates that the driver could not find a parking space in one lane and left the ROI. As illustrated in Figure 5b, additional cruising also occurs when the driver is unable to find an empty parking space. However, as the driver could not find an empty parking space in the ROI, these cruising trajectories were excluded from non-optimal cruising, as we are not sure if the driver parked in a farther region or left the open parking lot.
Illustrating Cruising and Walking Distances of Cruising Trajectories during Visitor Non-Peak and Peak Hours
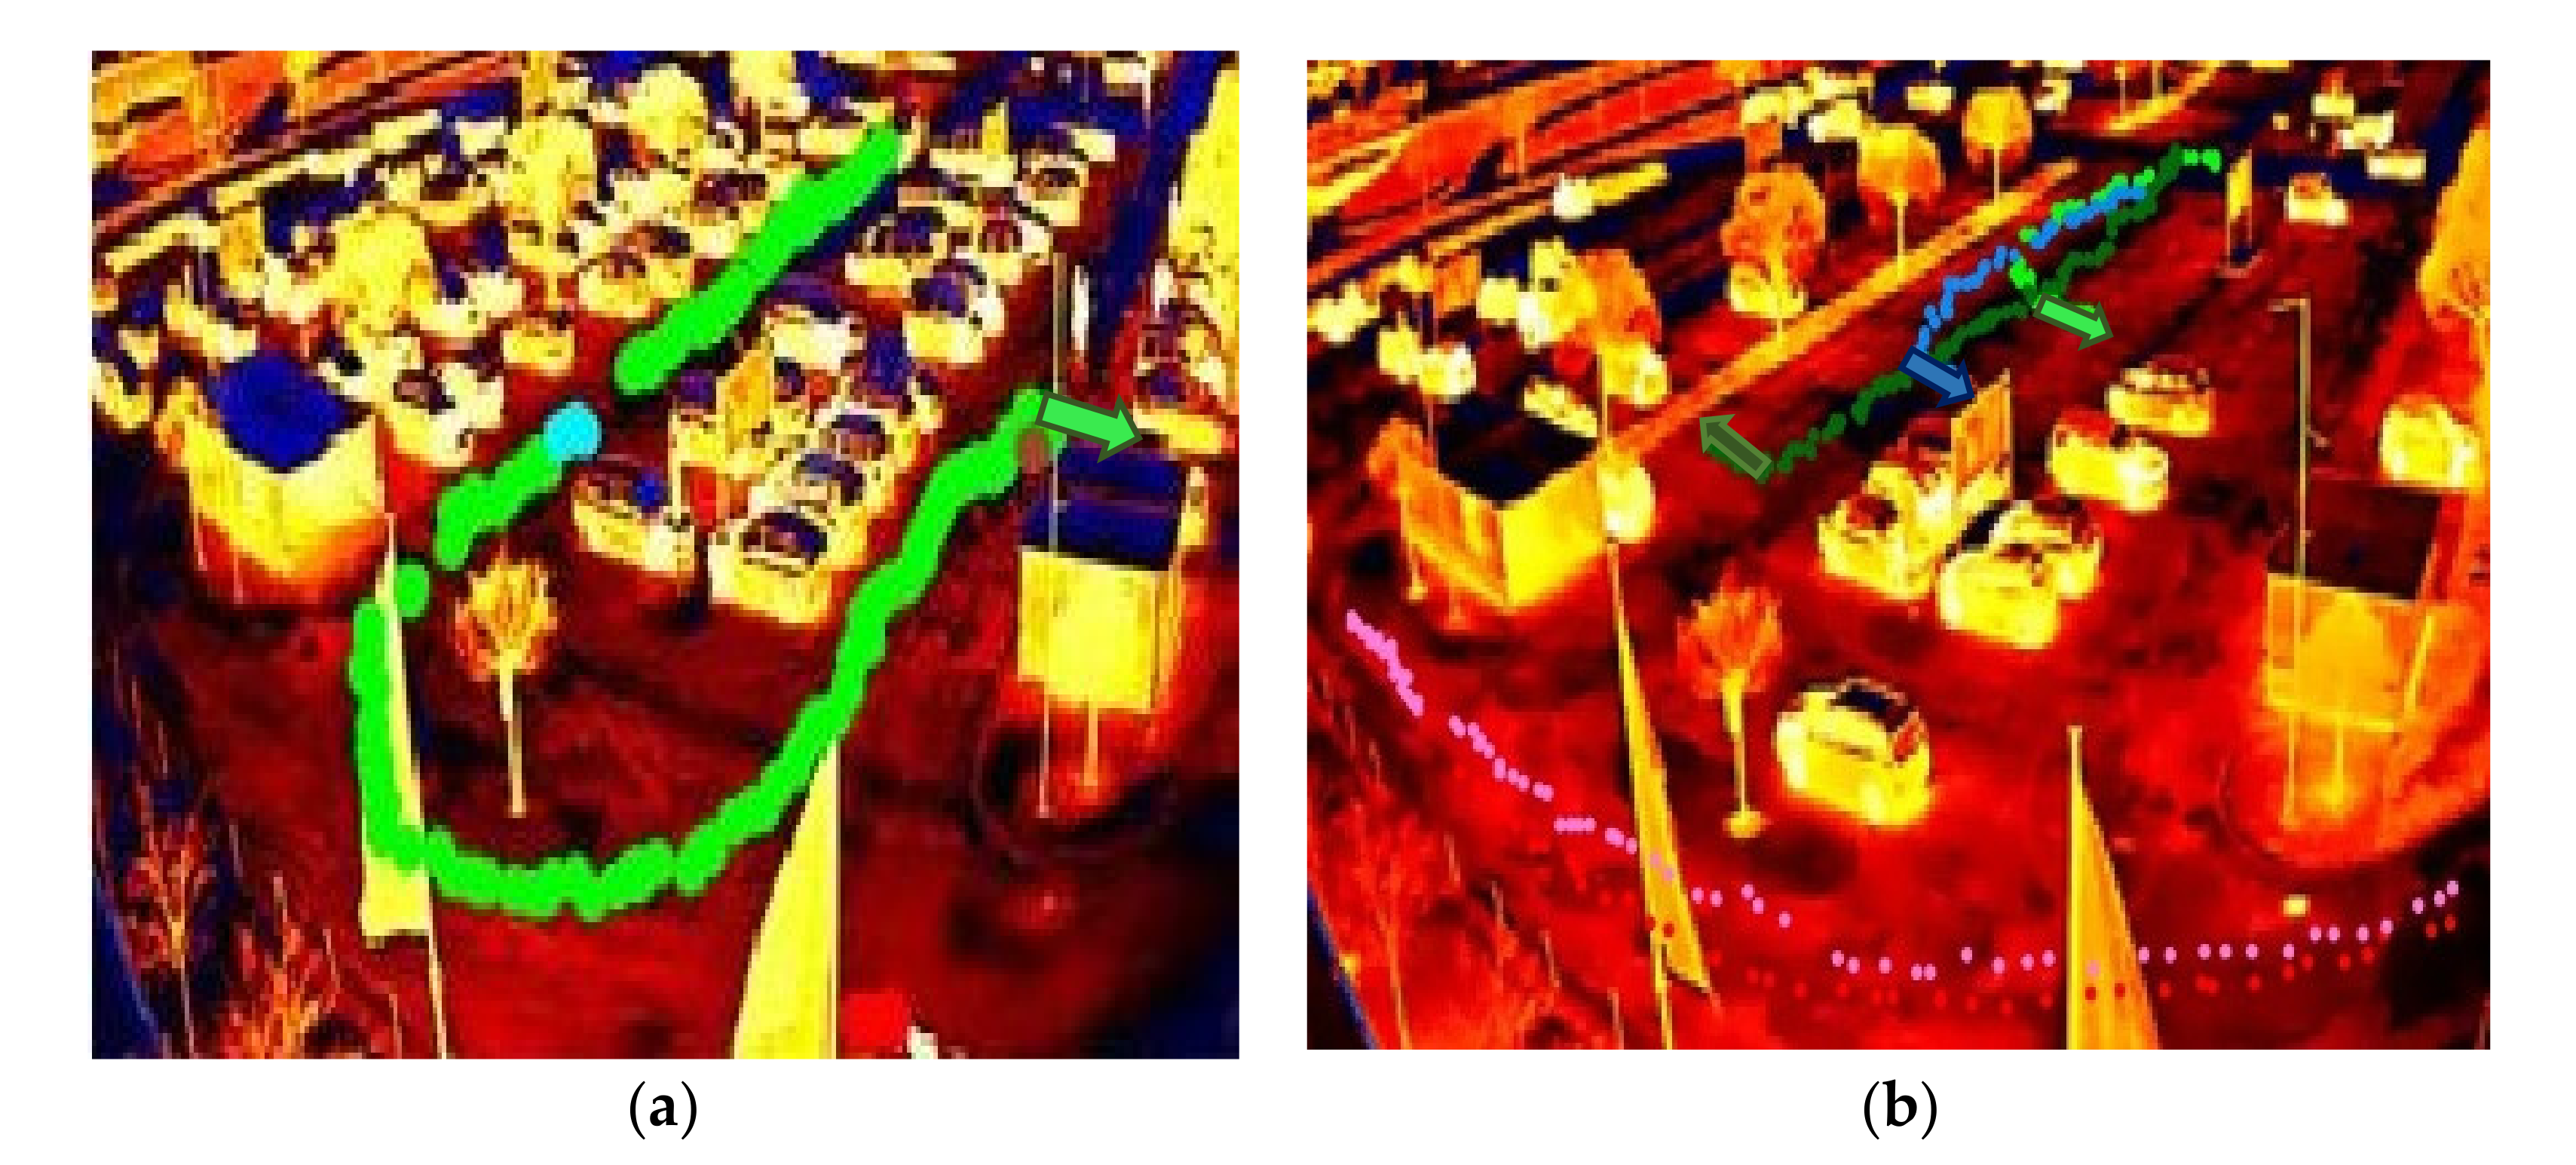
A sample of observed trajectories of cruising vehicles is illustrated and discussed in this section. Cruising distance (DD) and walking distance (WD) information were illustrated in Figure 6 with several available empty parking spaces available. This illustrates the trajectory of cruising vehicles along with cruising and walking distances. As shown in Figure 6a, one driver with a green trajectory can be seen parking near the location of interest non-optimally. The driver passed several empty parking spaces in one row and occupied a space in another row. The driver did not prefer to or missed the opportunity to park in the first row. In Figure 6b, all three drivers parked their vehicles near the location of interest without changing the lane. Exiting vehicle trajectories are ignored as they do not illustrate cruising behavior, which can be seen in Figure 6b.
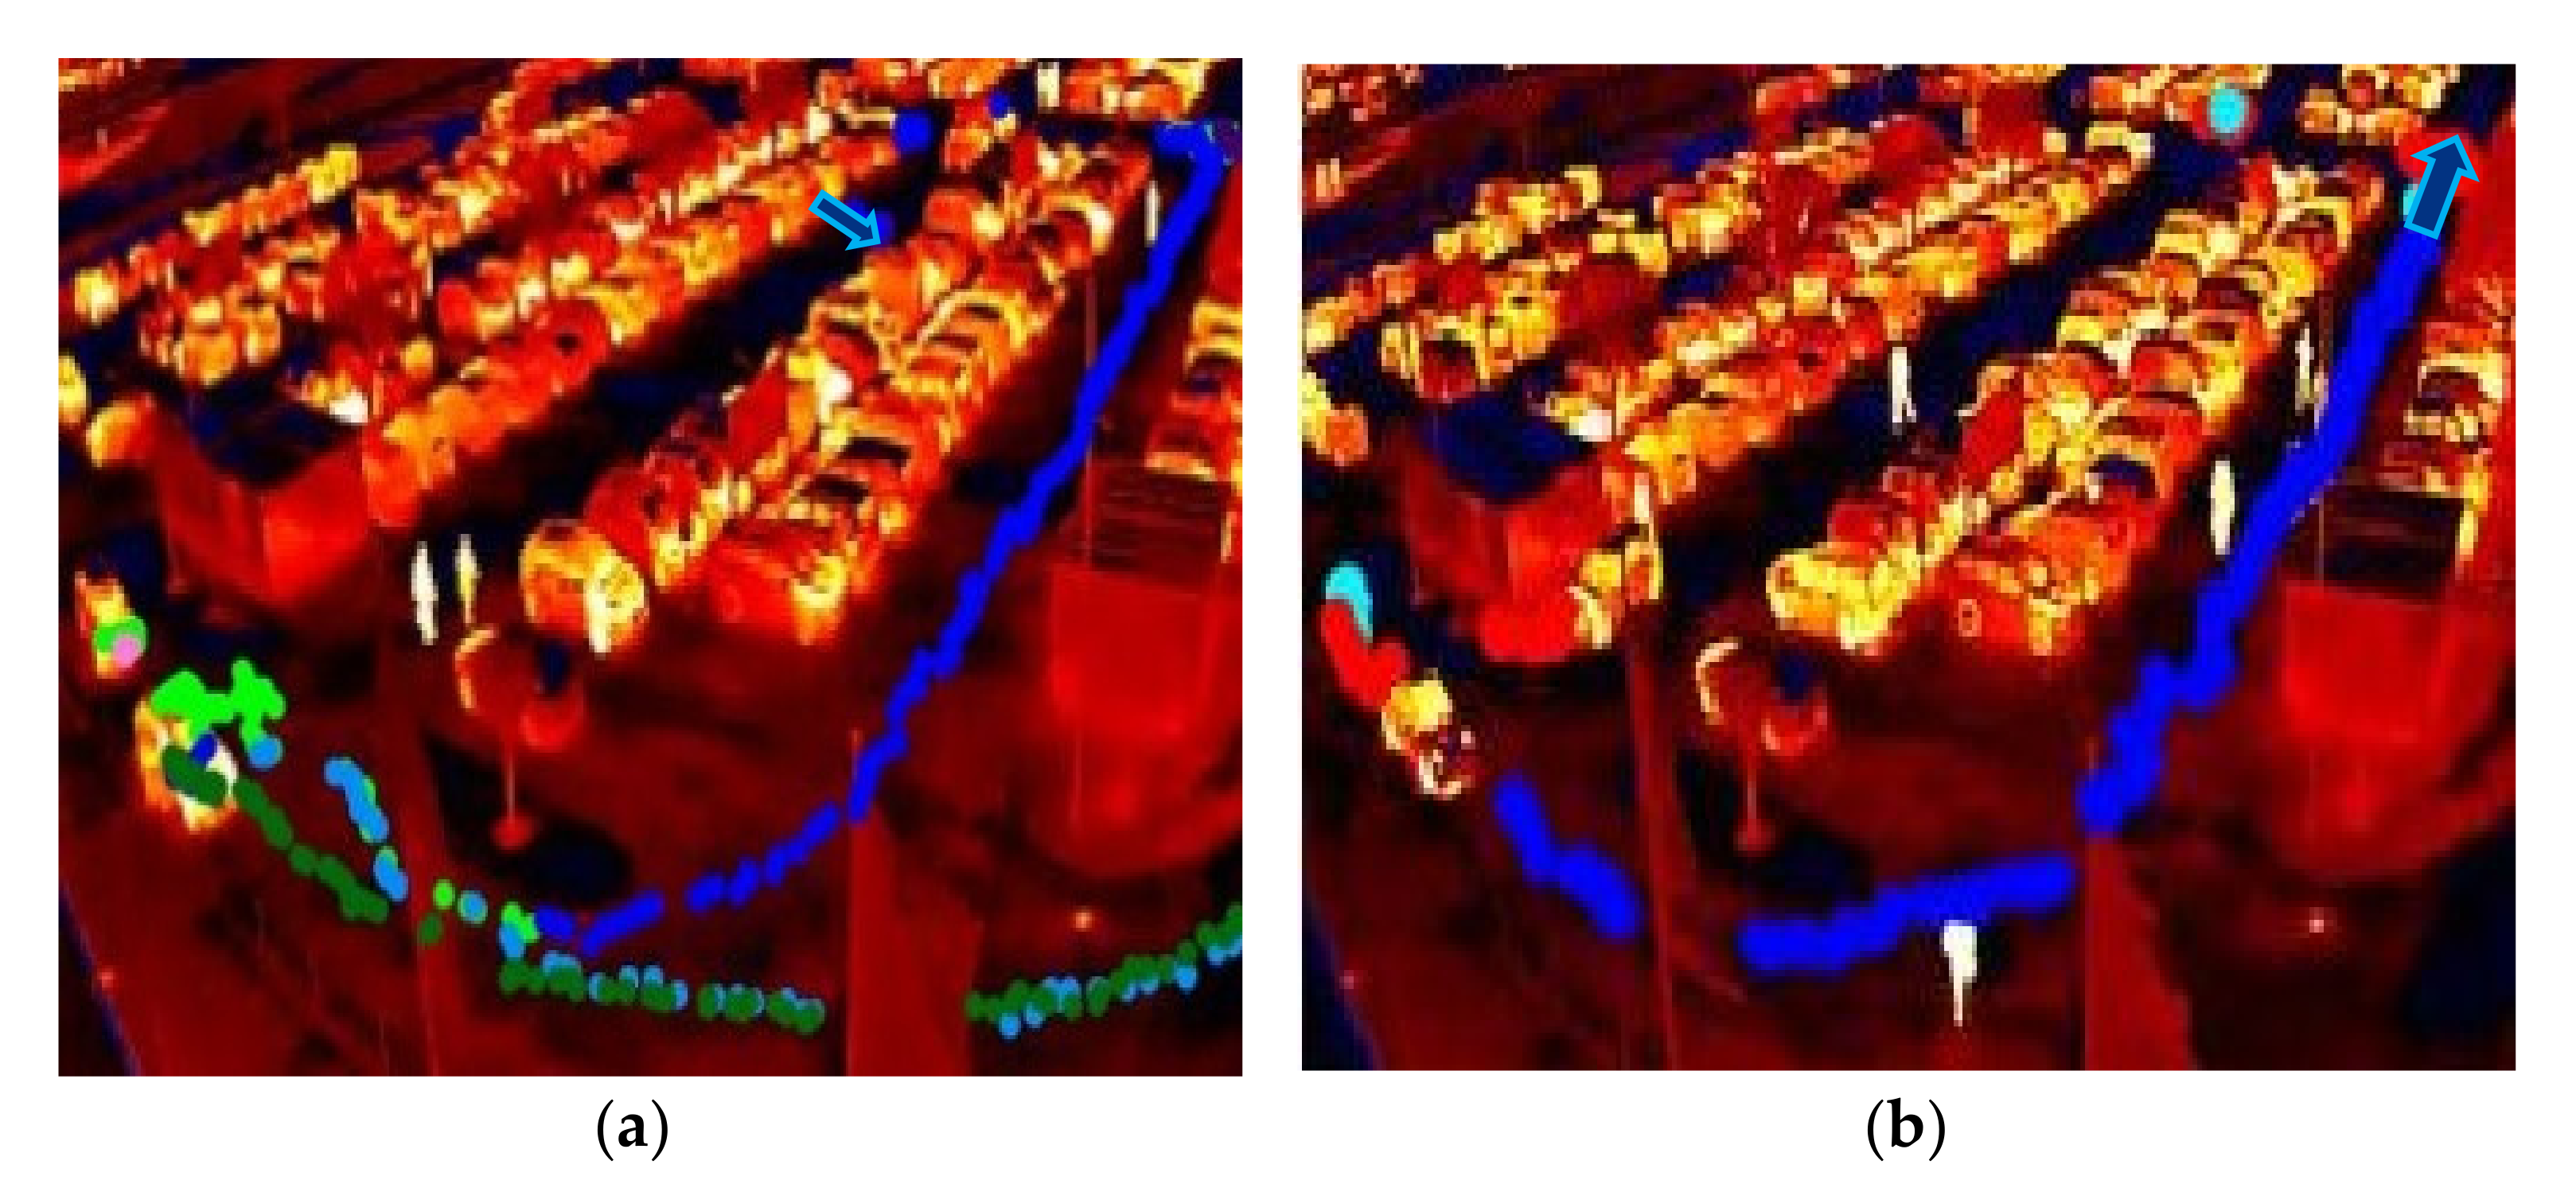
As shown in Figure 7a, one driver with a purple trajectory can be seen cruising within the ROI to occupy an empty parking space. In Figure 7b, the driver with a purple trajectory could not find an empty parking space in one row and can be seen exiting the ROI. The location of interest is still relevant when there are minimal or no empty parking spaces. Drivers in Figure 7a can be seen searching for parking spaces in the rows near the location of interest, and cruising for additional distance is not a problem. However, Figure 7b illustrates that the driver decided to search for a parking space far from the location of interest when there were no available empty parking spaces in one row.
3.5. Estimating CO2 Emissions of Vehicles Cruising in the Parking Lot
The carbon emissions are typically directly proportional to the distance cruised, although the type of engine, fuel, speed of the vehicle, and time can affect the pollution levels. The use of GPS devices can facilitate obtaining more details, such as velocity and timestamp. As mentioned in Jia et al., (2013) [32], the Oguchi model is well suited to calculating CO2 emissions based on varying time, distance, and velocity. However, in the case of an open parking lot, the cruised distance is not large and varying velocities are also minimal. The ROI in this study is 320 m, and the driver velocities vary between 5 and 15 km/h based on peak hours and traffic. The velocities of the drivers also do not vary much, leading to inaccurate estimations. Hence, the Oguchi model does not suit areas such as open parking lots. In Sing et al., (2019) [30], videos were utilized to calculate CO2 emissions using emission coefficients. The CO2 coefficients were multiplied with the count of detected vehicles to estimate emissions. The vehicle type was classified, using a deep learning algorithm, and subsequent coefficients were utilized. However, in this study, the type of vehicle cannot be determined, due to the lack of discernible features of the vehicle. Similarly, in Stead (1999) [31], cruised distance and CO2 emissions factor were utilized to calculate estimated CO2 emissions. However, in this study, distance alone cannot be considered, as a vehicle also idles for pedestrians or other vehicles. Hence, this model is also not suitable for estimating CO2 emissions in an open parking lot. Therefore, a CO2 emissions model was proposed in this paper, which is suitable for open parking lots, as shown in (1). The emissions model calculates CO2 emissions in grams (g), based on estimated fuel burnt. Since neither the vehicles nor their fuel types can be recognized, it is assumed that only petrol vehicles are observed in the open parking lot.
- AS is the average speed in kilometers per second
- ML is the mileage, i.e., kilometers per liter of fuel
- T is the time taken to reach an empty parking space
In the proposed model, time taken by the driver to reach an empty parking space, average speed, and mileage information were utilized to estimate the amount of fuel used by the vehicle. Time taken by the driver and average speed were collected using the trajectories generated from the videos. However, the mileage information could not be estimated from the videos, as they are dependent on the model, fuel, and age of the vehicle. Hence, an experiment was conducted with a group of drivers to estimate the mileage of vehicles in an open parking lot. The vehicles selected for the experiment possessed an internal computer that captured the mileage information. Once the driver was in the open parking lot, the existing measurements were reset, and the driver was instructed to cruise in the region of interest for 2 and 5 min. To simulate actual conditions, the driver cruised between 5 and 10 KMPH (kilometers per hour) while experimenting. The mileage information which was displayed by the internal computer was noted down, and the average mileage is shown in Table 1. The average mileage of all the observed vehicles in the experiment is 7.84 KM/L, which is the ML value in (1). Hence, using these values and the proposed model, CO2 emissions were estimated for the open parking lot.
4. Results and Discussion
This section discusses the results generated in this paper. The cruising distance and walking distances were compared for peak and non-peak hours to understand the correlation. Similarly, time taken to find an empty parking space was plotted to understand average parking times. The calculated cruising distances and CO2 emissions of multiple drivers searching for empty parking spaces are summarized and discussed.
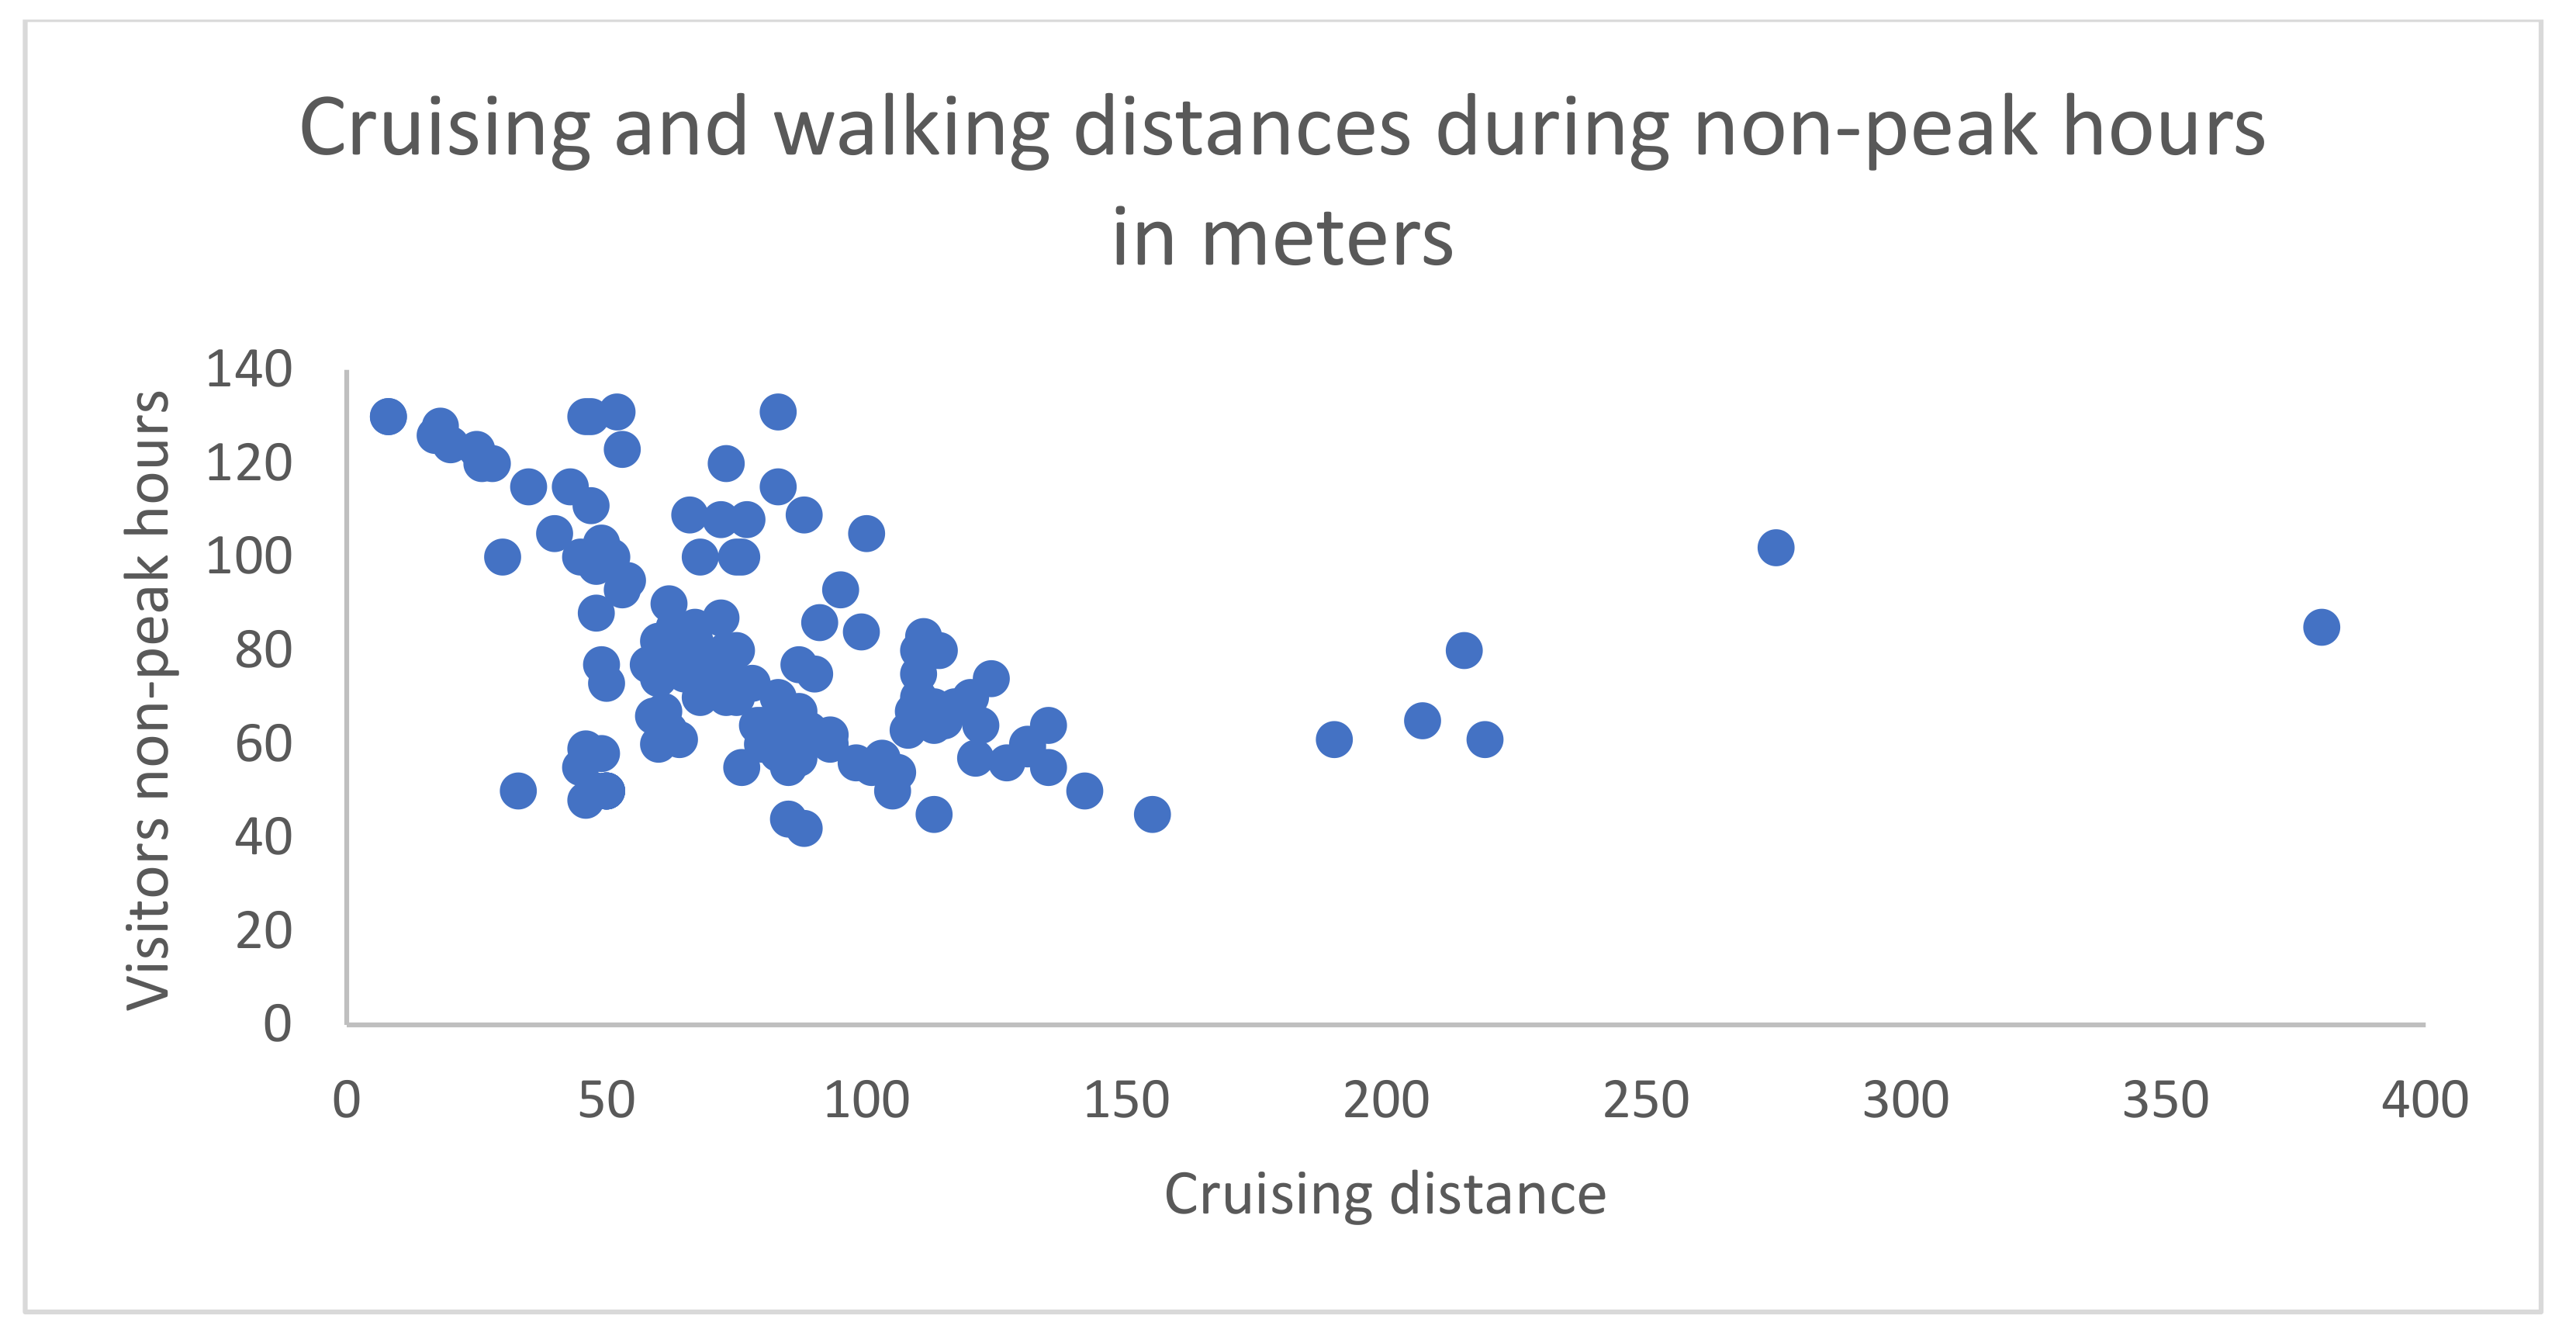
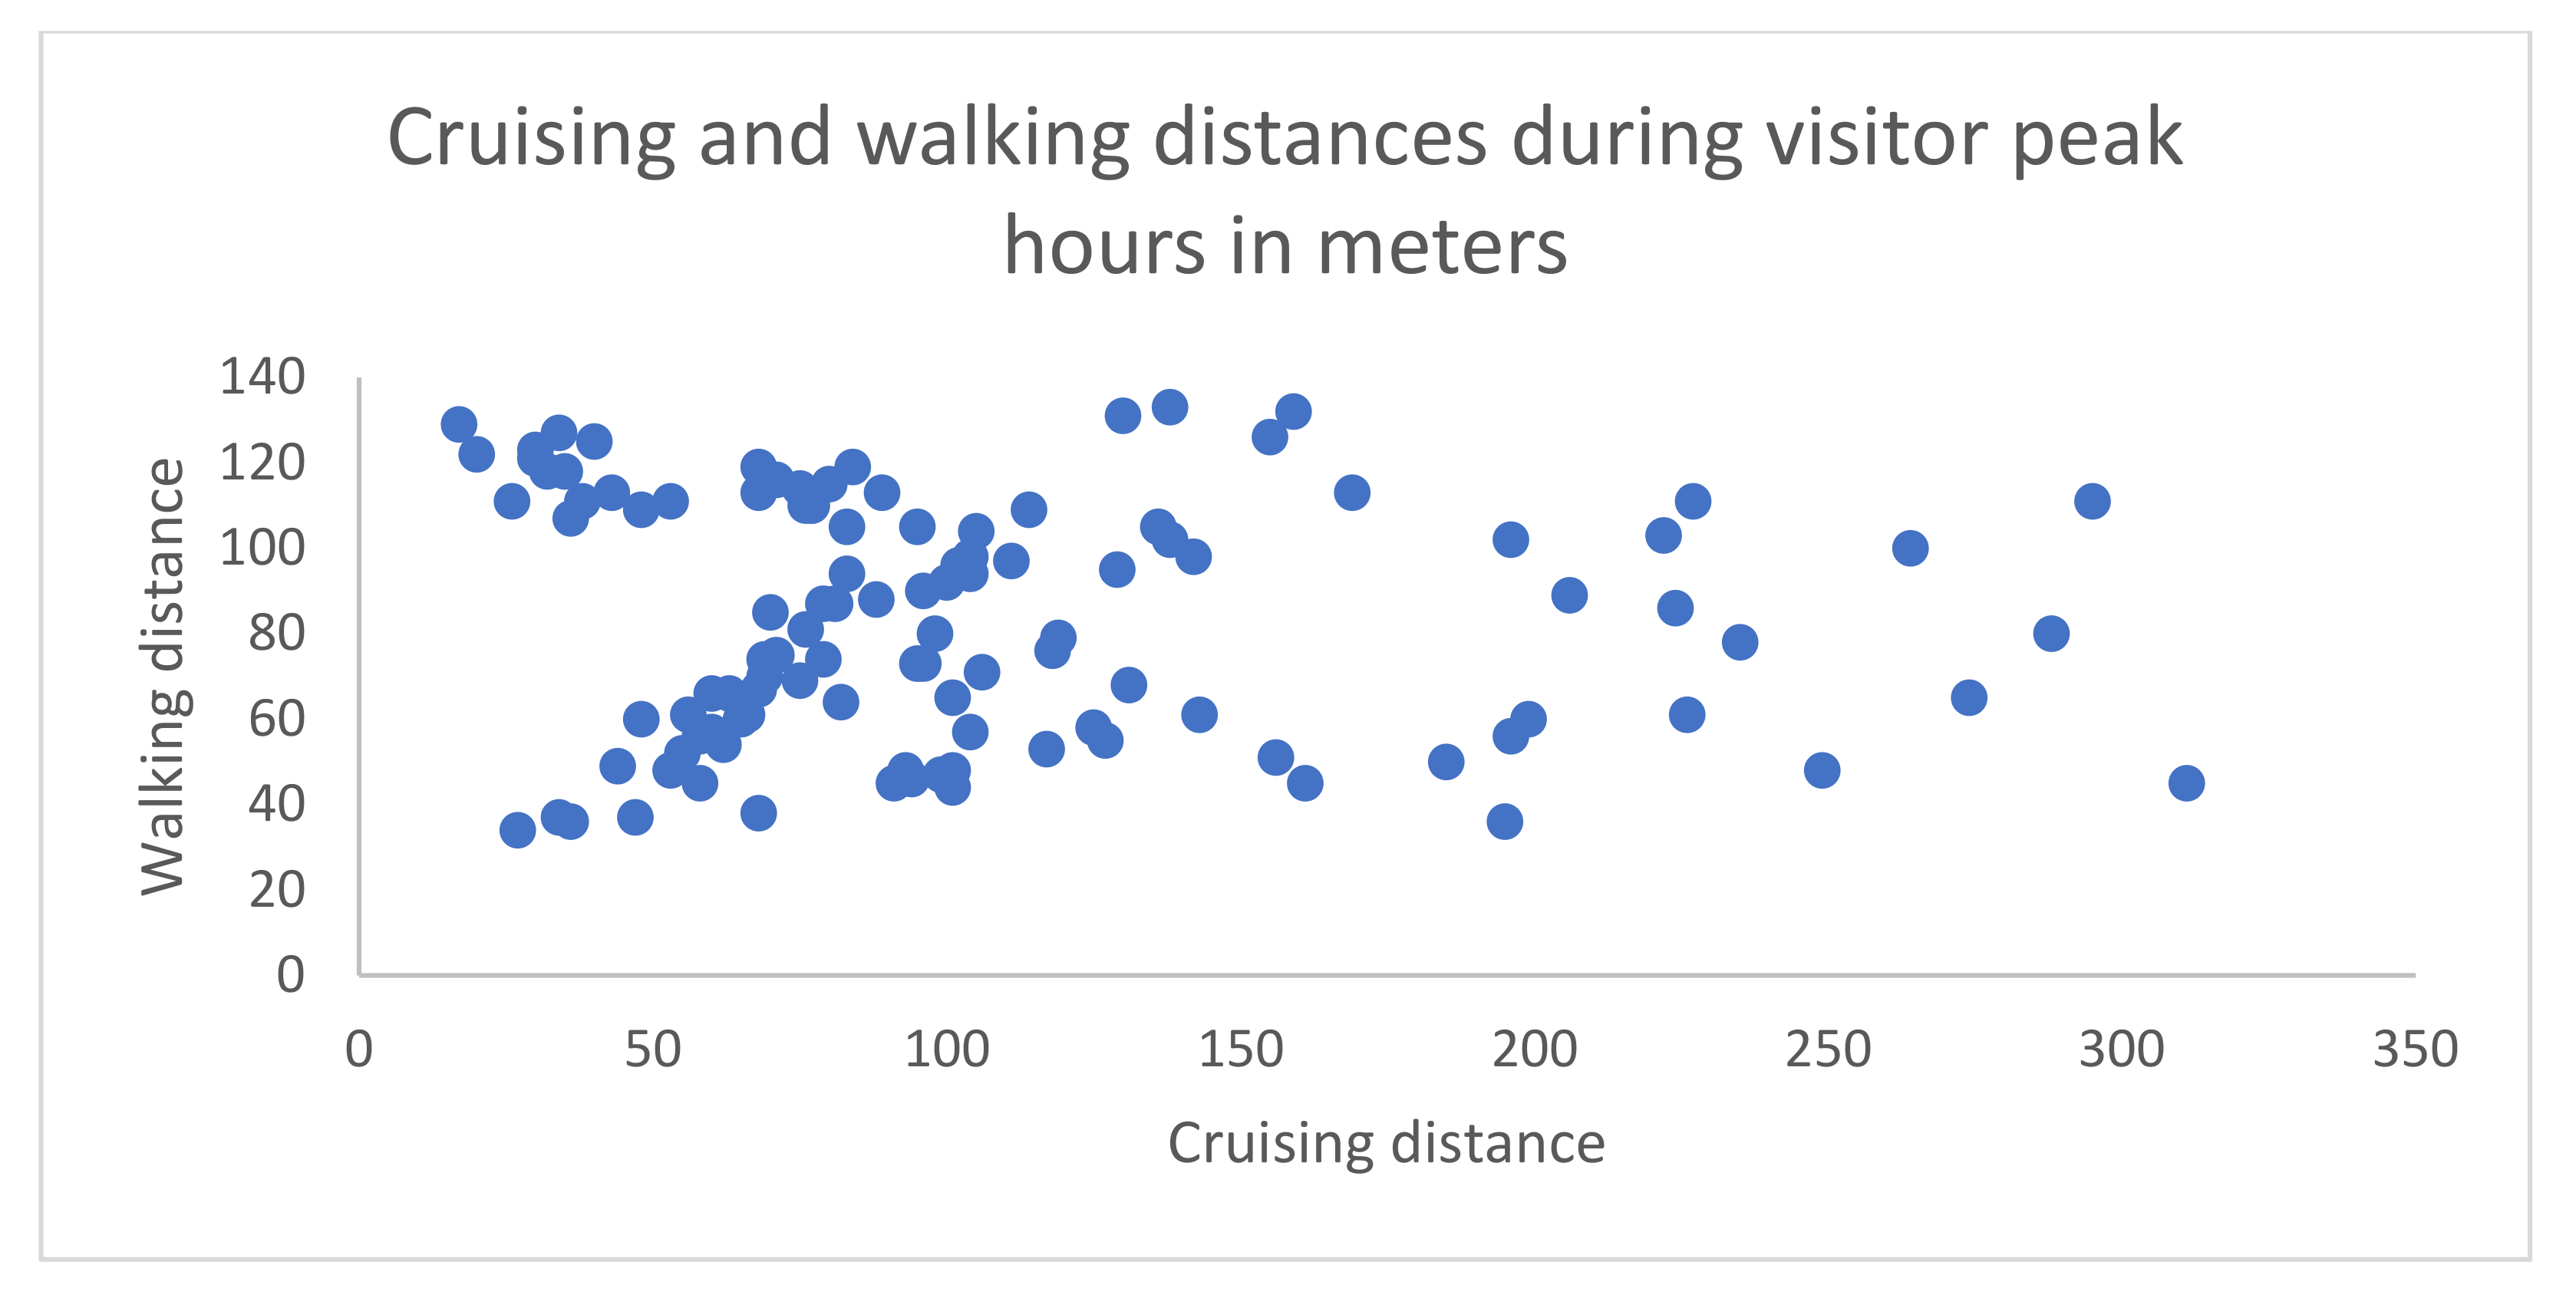
When the traffic density is low, the majority of the drivers park near the location of interest, which might be to reduce the walking distance from the parking location to the shopping center. Figure 8 illustrates the walking and cruising distances observed in visitor non-peak hours for two days. The majority of drivers traveled less than 200 m as there were several empty parking spaces. One driver cruised for nearly 400 m to find an empty parking space. However, this can be regarded as an outlier as it was unusual cruising behavior. Figure 9 illustrates the walking and cruising distances observed for two days in visitor peak hours. The number of drivers searching for a parking space during visitor peak hours was larger than visitor non-peak hours, demonstrating that peak traffic also exists within parking lots. Higher vehicle traffic leads to a greater number of cruising vehicles, which also increases CO2 emissions. Due to a smaller number of available empty parking spaces, the increased number of drivers traveling non-optimal distances can be seen in Figure 9. More drivers cruised more than 200 m during visitor peak hours, due to a lower number of available empty parking spaces. One row of the parking lane is 120 m and there were several drivers who cruised more to find an empty parking space. Figure 9 excludes the drivers who could not find an empty parking space. The drivers who were unable to park their vehicles cruised for longer, as illustrated in Figure 10.
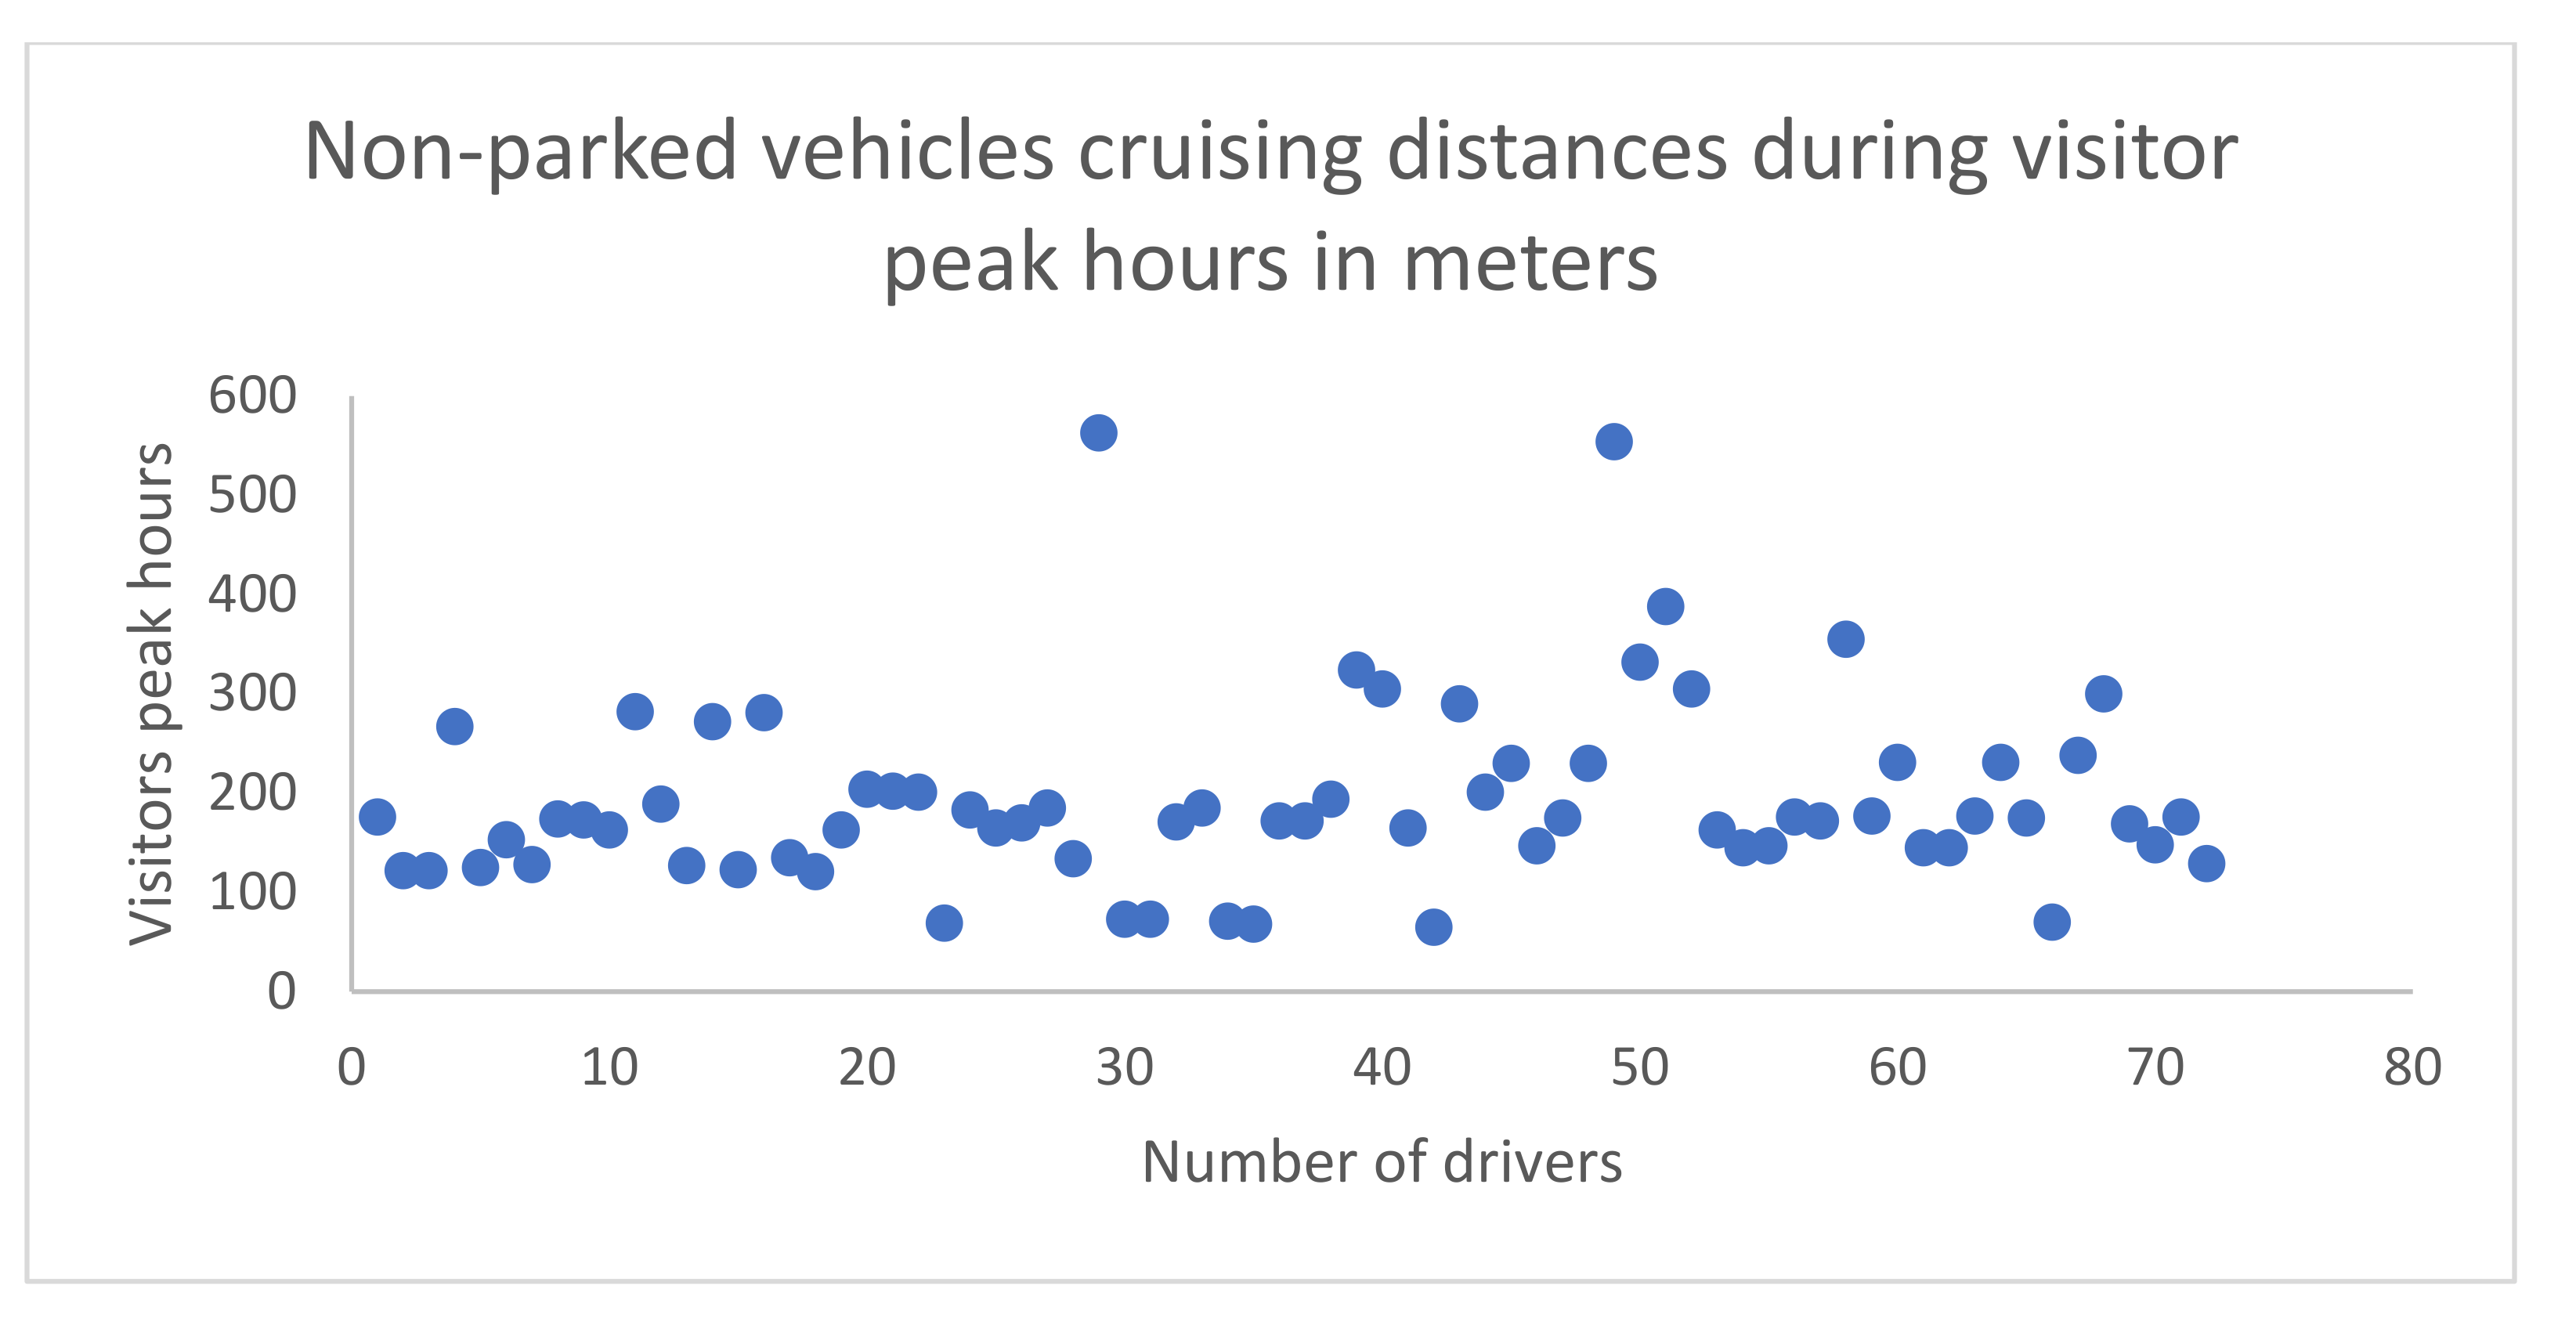
Unlike during visitor non-peak hours, not all drivers could find an empty parking space during visitor peak hours. The drivers who could not find an empty parking space are illustrated in Figure 10. As illustrated in Figure 10, two drivers cruised more than 500 m in the ROI and still could not find an empty parking space. All the drivers performed additional cruising when they could not find an empty parking space in the ROI. As observed in this study, most of the drivers were looking for empty parking spaces near the shopping center, leading to higher traffic. Even though these drivers could not find an empty parking space in the ROI, this is not assumed as non-optimal in this study. A total of 244 drivers managed to find an empty parking space out of 316 total observed drivers.
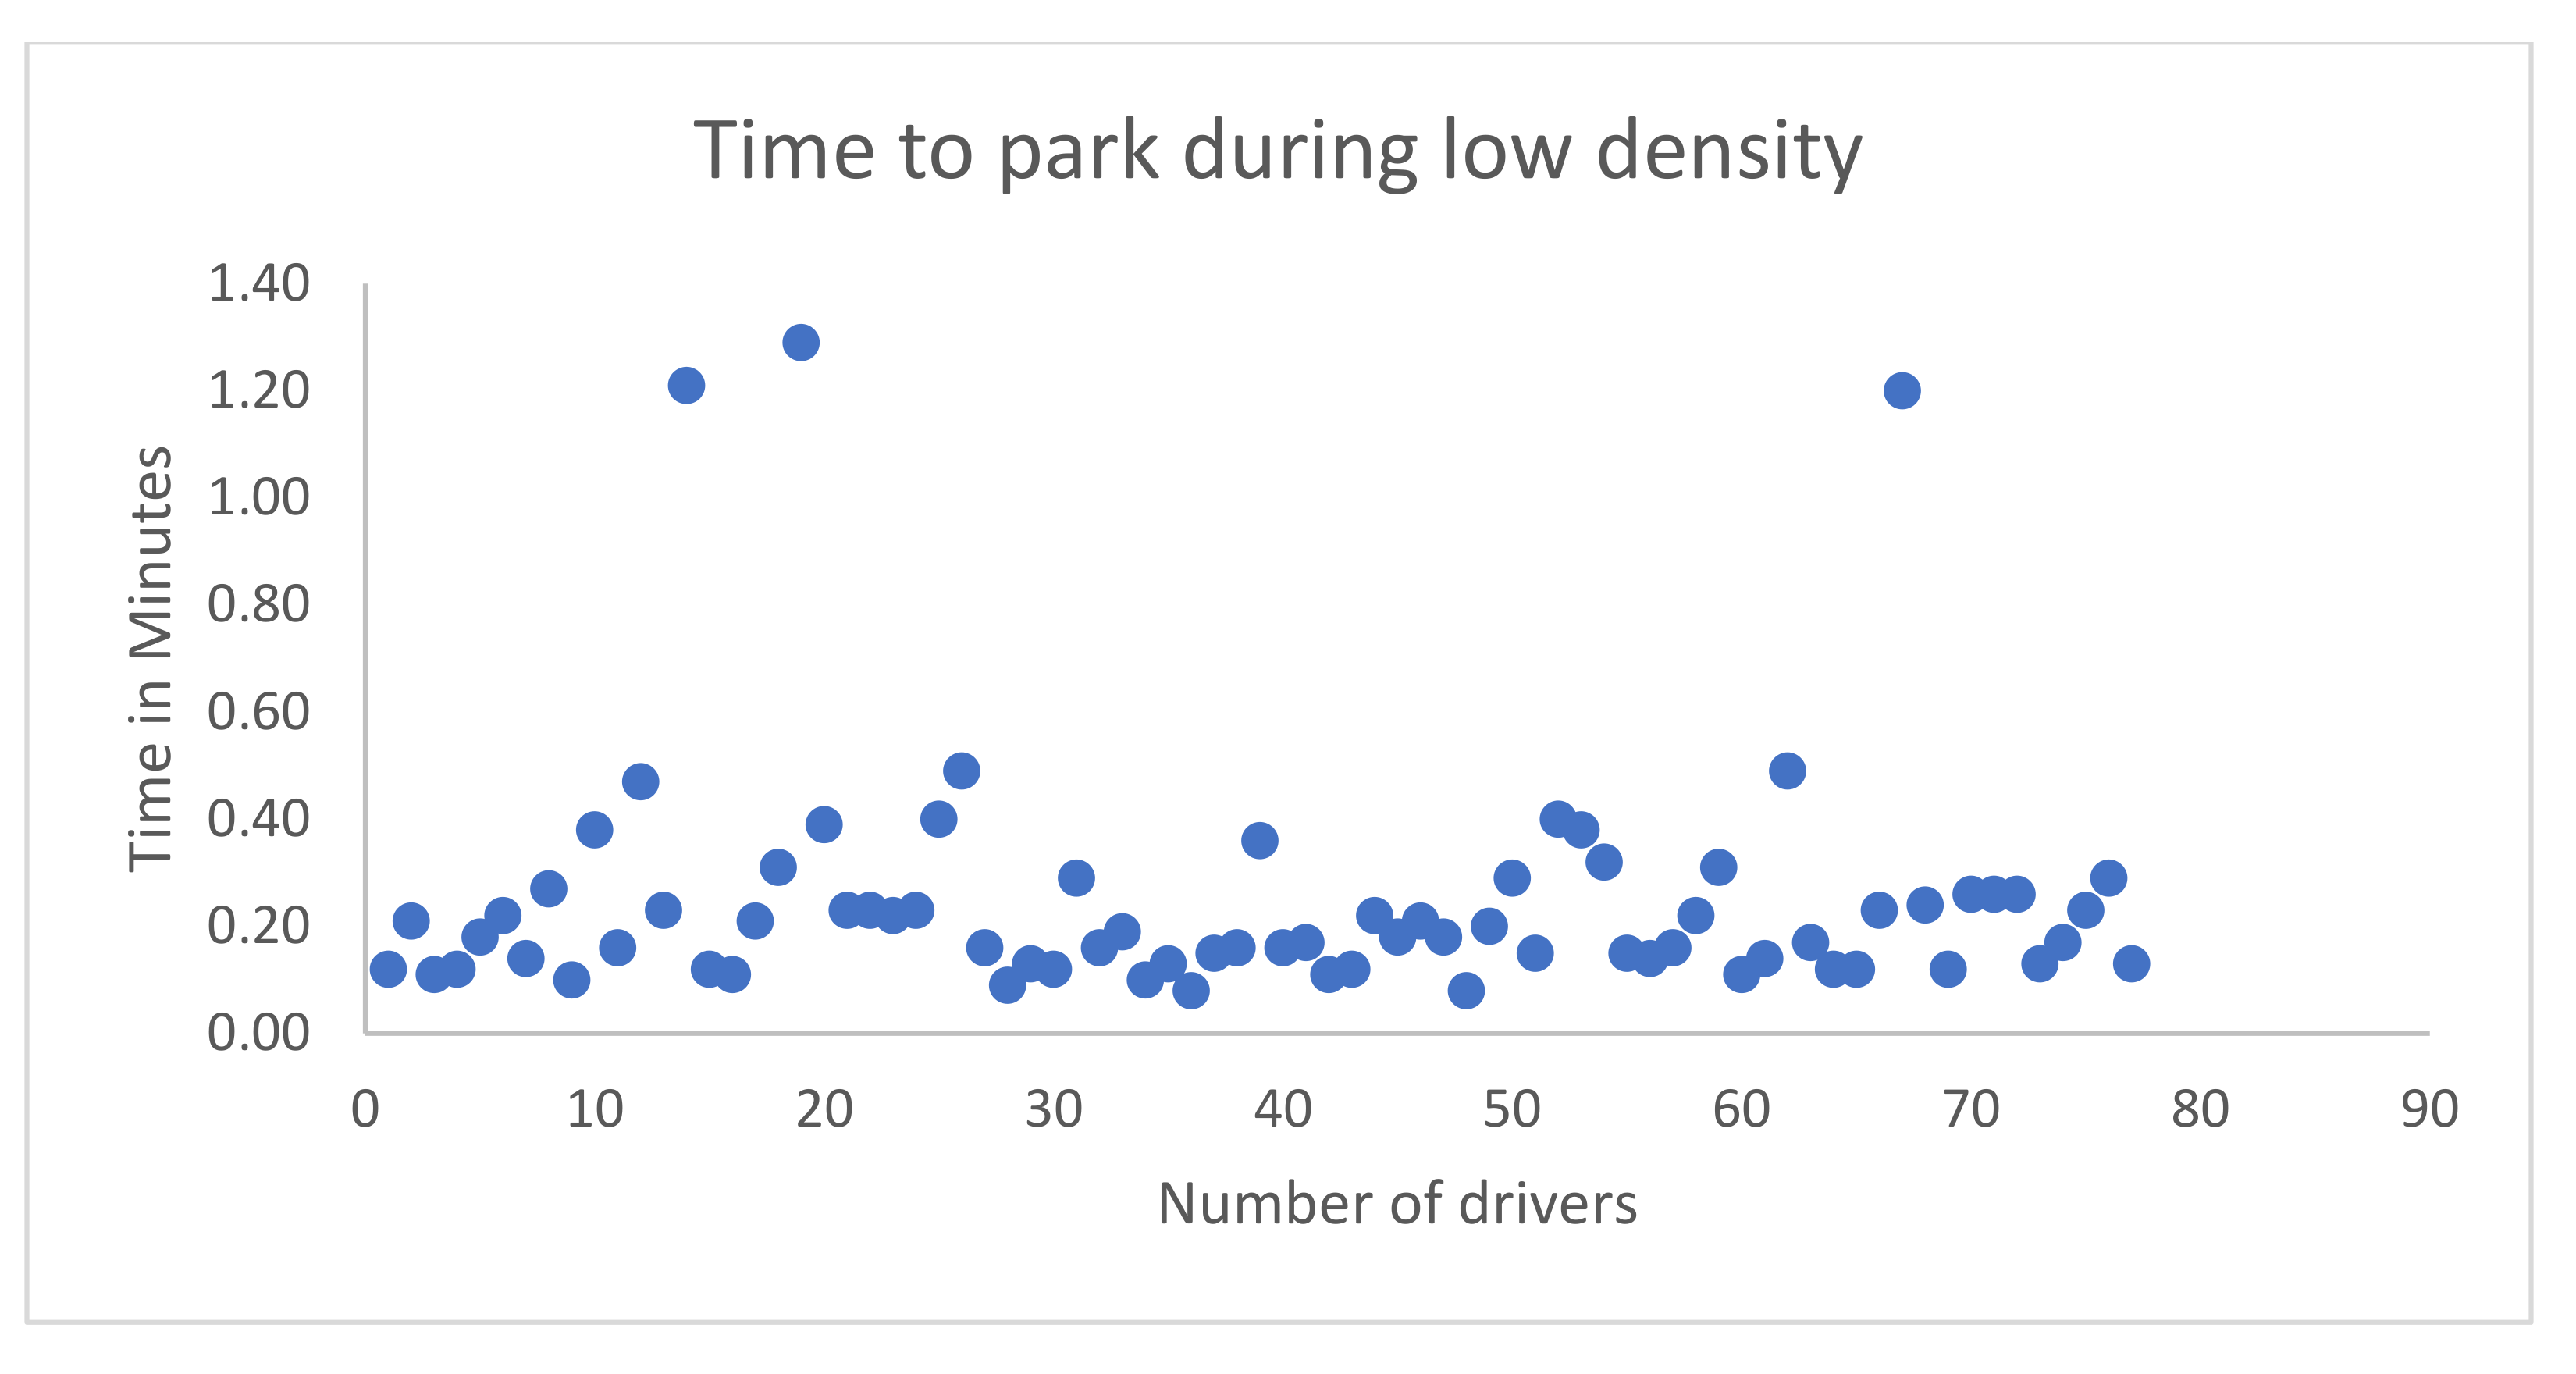
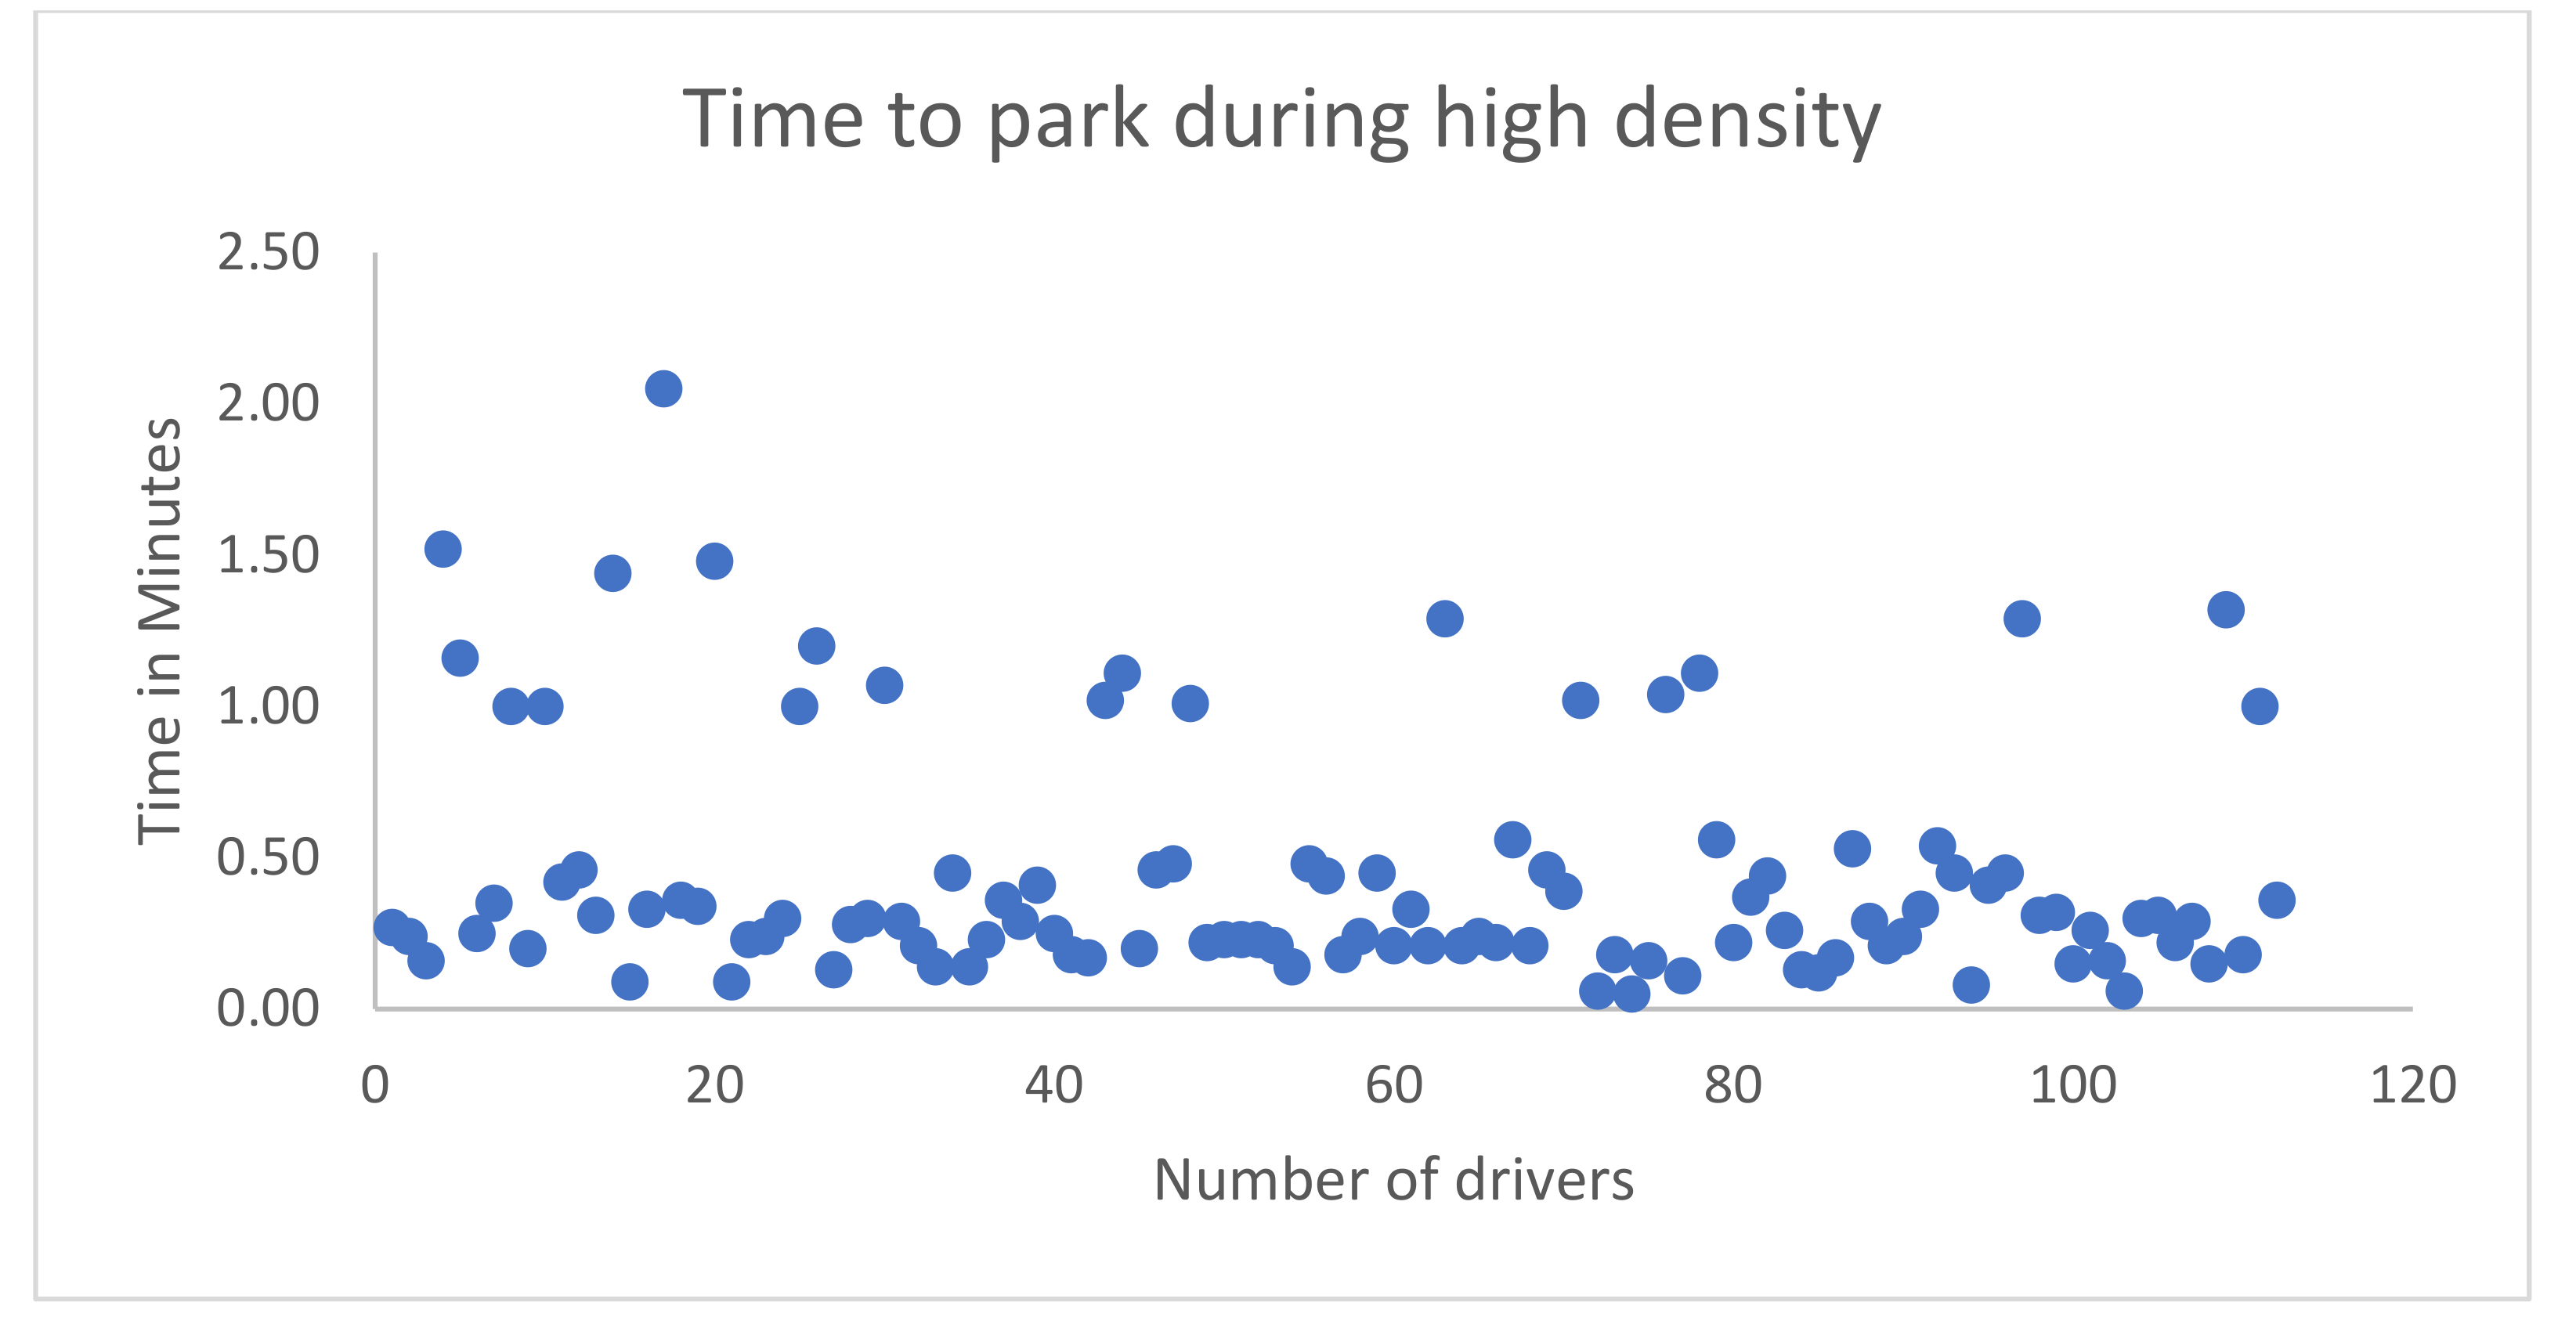
The time taken to find an empty parking space in visitor non-peak hours is shown in Figure 11, while the time taken to find an empty parking space in visitor peak hours is shown in Figure 12. Based on Figure 11 and Figure 12, it is evident that the amount of time to find an empty parking space is longer during visitor peak hours. There were only four drivers who took approximately 1 min to find an empty parking space during visitor non-peak hours. However, during visitor peak hours, 19 drivers took more than 1 min to find an empty parking space. During visitor non-peak hours, the average time taken to occupy an empty parking space was 23 s. During visitor peak hours, the average time taken to occupy an empty parking space was 43 s. During peak hours, the number of drivers looking for empty parking spaces also increases due to high traffic, and this leads to higher amounts of CO2 emissions. A few drivers also idled their vehicles when they learned a driver was about to exit a parking space. This behavior also increased the amount of time taken to park, which also increases CO2 emissions, as illustrated in Figure 12. Cruising distance and time were distributed normally during visitor non-peak hours, which had a correlation coefficient of 0.48 and a p-value of 2.518 × 10⁻⁹. Similarly, during visitor peak hours, cruising distance and time had a correlation coefficient of 0.61, with a p-value of 4.465 × 10⁻¹³. Hence, during both high and non-peak visitor hours, there is a positive correlation between cruising distance and time. Therefore, cruising distance increases with time, which subsequently also increases CO2 emissions.
Cruised Distances and CO2 Emissions Observed in an Open Parking Lot
The cruising distance of optimal driving is less than 120 m, which is the length of one parking row. However, a non-optimal cruising distance is greater than 120, as the driver leaves the first row and enters the other lane to find a vacant parking space. The mean non-optimal cruising distance is 2.7 times higher than the mean optimal cruising distance. The average non-optimal cruising distance covers 65% of the total length of the ROI, which is 320 m. Mean optimal and non-optimal cruising distances are two extremes identified in finding a vacant parking space. Cruising distance and time are majorly affected by the number of available empty parking spaces and the position of the driver in the parking lot. Hence, due to non-optimal cruising distances, higher levels of CO2 emissions were emitted. As shown in Table 2, 9% of the total drivers were cruising non-optimal distances, which amounts to 27% of the total cruising distance in the parking lot. Due to higher cruising distances of non-optimal drivers, a lower proportion of drivers cruised larger distances compared to total optimal cruising distances.
Estimated CO2 emissions of petrol are illustrated in Table 3. The CO2 emissions observed during visitor non-peak and peak hours were similar, even though a lower number of drivers was observed during non-peak hours. During visitor peak hours, due to the lack of available empty parking spaces, 23% of total drivers could not park their vehicles in the ROI. This 23% of drivers was not included in the non-optimal drivers, as they could not find an empty parking space in the ROI. Hence, higher vehicle traffic, non-optimal driving, and lack of empty parking spaces lead to higher CO2 emissions during visitor peak hours. The mean CO2 emissions of non-optimal drivers was almost triple, compared to optimal drivers during visitor peak hours. While the mean CO2 emissions appears to be small, it adds up to higher total CO2 emissions, due to a higher number of drivers. This was mainly due to a lower number of available empty parking spaces. The majority of drivers drive optimally when there are several empty parking spaces, while they drive non-optimal distances when there are limited available empty parking spaces. Since non-optimal cruising is majorly visible during visitor peak hours, the time taken to occupy an empty parking space is almost doubled.
On a Friday during visitor peak hours, a total of 114 drivers traveled more than 15 km in an area of 320 m searching for empty parking spaces. Even though individual drivers tend to cruise smaller distances, the aggregated distance observed by multiple drivers in the ROI tends to be larger. Thus, it is necessary to reduce CO2 emissions in a parking lot, even though the geographical area of the parking lot is smaller. In open parking lots, non-optimal driving can be reduced by providing real-time or forecast information on available parking spaces.
Based on the identified cruising behavior, drivers tend to choose parking spaces near the location of interest. If a parking assistance system were to provide navigational directions to empty parking spaces, then providing navigational directions to empty parking spaces near the location of interest should be prioritized. However, as the parking spaces near the location of interest are in higher demand, alternative parking spaces should also be shown for the driver when the empty parking space near the location of interest is no longer available.
Unlike CO2 emissions observed on long road segments, CO2 emissions observed in an open parking lot are concentrated in a smaller geographical area. The total CO2 emissions observed in this study were for two hours of visitor parking time. A shopping center that has opening hours between 9:00 and 20:00 each day does not have a constant influx of visitors over the whole day. Instead, visitors would be categorized as high and low traffic, based on varying times. Therefore, reducing the amount of time to park would subsequently reduce CO2 emissions. The results observed in this study represent a small proportion of CO2 emissions observed in a whole day. For instance, the shopping center is open for 11 h, where 4 h represent visitor non-peak hours and the remaining 7 h represent visitor peak hours. Therefore, estimated CO2 emissions for a whole working day would be 37 kg, which is equivalent to 122 km driven by an average passenger vehicle in an area of 320 m. Therefore, it is vital to improve the design of the parking lot and deploy feasible parking information systems to reduce CO2 emissions.
5. Limitations of the Work
This study only covers a small area of the parking lot. However, if the whole parking lot is considered, the amount of excess cruising and subsequent problems, such as pollution and congestion, would be even higher. The current region of interest is beside a shopping center and the results from this study can be relevant to other open parking lots whose regions are near the location of interest. When an entire parking lot is considered, there will be regions that are near, and a little farther from, the location of interest. Even though the distance between near and a little farther is not much, it still makes an impact on the choice of parking space. Similarly, when we consider another location of interest in a major city, the size of the parking lot will be much larger, and the regions of the parking lot, which would be of interest, will also be larger. This is mainly dependent on the location of the parking lot and the population size of the city.
6. Conclusions and Future Work
This study aims to estimate excess CO2 emissions from observed cruising of drivers searching for empty parking spaces. The use of a thermal camera helps to collect cruising data of multiple drivers based on time. Cruising trajectories are utilized to analyze the choice of parking space and excess cruising performed by drivers to reach an empty parking space. This study contributes to research by estimating the magnitude of CO2 emissions due to excess cruising in an open parking lot. Since parking lots occupy smaller geographical regions, CO2 emissions from these places are scarcely researched. However, hundreds of thousands of vehicles cruise every day in open parking lots and the accumulation of all these vehicles increases the environmental impact.
The study proposes a new CO2 estimation model which is suitable for smaller geographical regions, such as open parking lots. This CO2 model estimates emissions based on the time taken by the driver to reach an empty parking space. The proposed model can also be utilized to estimate emissions in other smaller geographical regions. Most drivers cruising for empty parking spaces near the location of interest are visible during visitor non-peak and peak hours. This preference for a parking space near the location of interest can lead to non-optimal cruising. However, to utilize the entire parking lot and reduce cruising, the time limit of the parking spaces near the location of interest can be reduced to 30 min or less. Reducing the time limit would make the parking spaces near the location of interest less attractive to at least some of the drivers. The design of the parking lot can also be modified to accommodate a greater number of parking spaces near the location of interest.
Most of the optimal cruising was found during visitor non-peak hours and the mean of optimal cruising was around 78 m. Whereas 90% of drivers who drove optimally to find an empty parking space was during visitor non-peak hours. Furthermore, 57% of drivers drove optimally during visitor peak hours. Non-optimal cruising was found to be low during visitor non-peak hours, as there were several available empty parking spaces. During visitor peak hours, non-optimal cruising and drivers who were unable to find empty parking spaces captured approximately 67% of the total cruising distance. This implies that non-optimal cruising increases with higher vehicle traffic and a limited number of available empty parking spaces. Similarly, during visitor non-peak hours, the average time taken to occupy an empty parking space was 23 s, while it took 43 s to occupy an empty parking space during visitor peak hours.
Parking spaces near the location of interest, in this case, a shopping center, were of higher demand compared to other spaces. When there were several empty parking spaces available, most drivers tended to park the vehicle near the location of interest, leading to the lower mean of WD, which is 79 m. However, the observed non-optimal driving during visitor non-peak hours might have occurred due to the choice of parking space. Similarly, drivers tend to cruise non-optimal distances while searching for empty parking spaces near the location of interest, before moving to further parking spaces during visitor peak hours. Therefore, the choice of parking space has an impact on CO2 emissions during visitor peak and non-peak hours.
Cruising behavior was analyzed based on the availability of several, minimal, or no empty parking spaces. However, in the future, cruising data from the entire parking lot can be analyzed to understand the variability of CO2 emissions and cruising behavior based on time. CO2, or other harmful emissions, can be collected using external tools at several locations to evaluate their impact on the health of individuals walking in the parking lot. The use of Mod Yolov3 and Kalman filters generated the trajectories of vehicles in the parking lot. However, errors can be identified in maintaining data association using the Kalman filters. Nonetheless, sufficient data association was maintained to identify vehicle trajectory. In the future, the performance of tracking can be improved by utilizing an extended Kalman filter or particle filter.
Author Contributions
Conceptualization, V.P.; Methodology, V.P. and J.H.; Writing—V.P., writing—review and editing, V.P., J.H., H.F. and R.G.N.; Visualization, V.P.; Supervision, J.H., H.F. and R.G.N. All authors have read and agreed to the published version of the manuscript.
Funding
This research received no external funding.
Institutional Review Board Statement
Ethical review and approval were not necessary for this study as no vehicle or pedestrian can be recognized due to the usage of thermal camera.
Informed Consent Statement
Not applicable.
Data Availability Statement
The authors collected data using a thermal camera.
Conflicts of Interest
The authors declare no conflict of interest.
References
- Kimbrough, S.; Baldauf, R.W.; Hagler, G.S.W.; Shores, R.C.; Mitchell, W.; Whitaker, D.A.; Croghan, C.W.; Vallero, D.A. Long-term continuous measurement of near-road air pollution in Las Vegas: Seasonal variability in traffic emissions impact on local air quality. Air Qual. Atmos. Health 2013, 6, 295–305. [Google Scholar] [CrossRef]
- Karner, A.A.; Eisinger, D.S.; Niemeier, D.A. Near-roadway air quality: Synthesizing the findings from real-world data. Environ. Sci. Technol. 2010, 44, 5334–5344. [Google Scholar] [CrossRef]
- Shoup, D.C. Cruising for parking. Transp. Policy 2006, 13, 479–486. [Google Scholar] [CrossRef]
- Shoup, D.C. The High Cost of Free Parking; Planners Press: Chicago, IL, USA, 2005; Volume 206. [Google Scholar]
- Polycarpou, E.; Lambrinos, L.; Protopapadakis, E. Smart parking solutions for urban areas. In Proceedings of the 2013 IEEE 14th International Symposium on “World of Wireless, Mobile and Multimedia Networks”(WoWMoM), Madrid, Spain, 4 June 2013. [Google Scholar]
- Chai, H.; Ma, R.; Zhang, H.M. Search for parking: A dynamic parking and route guidance system for efficient parking and traffic management. J. Intell. Transp. Syst. 2019, 23, 541–556. [Google Scholar] [CrossRef]
- Jud, P. Belegung und Verkehrsaufkommen von Parkfeldern in der Stadt Zurich; Bericht: Zürich, Switzerland, 2010; p. 111. [Google Scholar]
- Tsai, M.-T.; Chu, C.-P. Evaluating parking reservation policy in urban areas: An environmental perspective. In Proceedings of the Eastern Asia Society for Transportation Studies Vol. 8 (The 9th International Conference of Eastern Asia Society for Transportation Studies, 2011), Eastern Asia Society for Transportation Studies. Tokyo, Japan, 30 September 2011. [Google Scholar]
- Gordian, M.E.; Haneuse, S.; Wakefield, J. An investigation of the association between traffic exposure and the diagnosis of asthma in children. J. Expo. Sci. Environ. Epidemiol. 2006, 16, 49–55. [Google Scholar] [CrossRef] [PubMed]
- Klimatpolitiskradet. Report of the Swedish Climate Policy Council; The Swedish Climate Policy Council: Stockholm, Sweden, 2019; p. 84. [Google Scholar]
- Weinberger, R.R.; Millard-Ball, A.; Hampshire, R.C. Parking search caused congestion: Where’s all the fuss? Transp. Res. Part C: Emerg. Technol. 2020, 120, 102781. [Google Scholar] [CrossRef]
- Brooke, S.; Ison, S.; Quddus, M. On-street parking search: Review and future research direction. Transp. Res. Rec. 2014, 2469, 65–75. [Google Scholar] [CrossRef]
- Paidi, V.; Fleyeh, H.; Håkansson, J.; Nyberg, R.G. Smart parking sensors, technologies and applications for open parking lots: A review. IET Intell. Transp. Syst. 2018, 12, 735–741. [Google Scholar] [CrossRef]
- Davis, A.Y.; Pijanowski, B.C.; Robinson, K.; Engel, B. The environmental and economic costs of sprawling parking lots in the United States. Land Use Policy 2010, 27, 255–261. [Google Scholar] [CrossRef]
- Van der Waerden, P.; Timmermans, H.; da Silva, A.N.R.d. The influence of personal and trip characteristics on habitual parking behavior. Case Stud. Transp. Policy 2015, 3, 33–36. [Google Scholar] [CrossRef]
- Van Ommeren, J.N.; Wentink, D.; Rietveld, P. Empirical evidence on cruising for parking. Transp. Res. Part A Policy Pract. 2012, 46, 123–130. [Google Scholar] [CrossRef] [Green Version]
- Hampshire, R.C.; Jordon, D.; Akinbola, O.; Richardson, K.; Weinberger, R.; Millard-Ball, A.; Karlin-Resnik, J. Analysis of parking search behavior with video from naturalistic driving. Transp. Res. Rec. J. Transp. Res. Board 2016, 2543, 152–158. [Google Scholar] [CrossRef]
- Sivaraman, S.; Morris, B.; Trivedi, M. Learning multi-lane trajectories using vehicle-based vision. In Proceedings of the 2011 IEEE International Conference on Computer Vision Workshops (ICCV Workshops), Barcelona, Spain, 6–13 November 2011. [Google Scholar]
- Hermes, C.; Einhaus, J.; Hahn, M.; Wohler, C.; Kummert, F. Vehicle tracking and motion prediction in complex urban scenarios. In Proceedings of the 2010 IEEE Intelligent Vehicles Symposium, La Jolla, CA, USA, 21–24 June 2010. [Google Scholar]
- Garcia, F.; Cerri, P.; Broggi, A.; de la Escalera, A.; Armingol, J.M. Data fusion for overtaking vehicle detection based on radar and optical flow. In Proceedings of the 2012 IEEE Intelligent Vehicles Symposium, Madrid, Spain, 3–7 June 2012. [Google Scholar]
- Verma, S.; Eng, Y.H.; Kong, H.X.; Andersen, H.; Meghjani, M.; Leong, W.K.; Shen, X.; Zhang, C.; Ang, M.H.; Rus, D. Vehicle detection, tracking and behavior analysis in urban driving environments using road context. In Proceedings of the 2018 IEEE International Conference on Robotics and Automation (ICRA), Brisbane, Australia, 21–25 May 2018. [Google Scholar]
- Sivaraman, S.; Trivedi, M.M. Looking at vehicles on the road: A survey of vision-based vehicle detection, tracking, and behavior analysis. IEEE Trans. Intell. Transp. Syst. 2013, 14, 1773–1795. [Google Scholar] [CrossRef] [Green Version]
- Montini, L.; Horni, A.; Rieser-Schüssler, N.; Axhausen, K.W. Searching for parking in GPS data. In Proceedings of the 13th International Conference on Travel Behaviour Research (IATBR 2012), Toronto, Canada, 15–19 July 2012. [Google Scholar]
- Van der Waerden, P.; Timmermans, H.; Van Hove, L. GPS Data and car drivers’ parking search behavior in the city of Turnhout, Belgium. In Geoinformatics for Intelligent Transportation; Springer: Berlin/Heidelberg, Germany, 2015; pp. 247–256. [Google Scholar]
- Dogan, U.; Uludag, M.; Demir, D. Investigation of GPS positioning accuracy during the seasonal variation. Measurement 2014, 53, 91–100. [Google Scholar] [CrossRef]
- Hampshire, R.C.; Shoup, D. What share of traffic is cruising for parking? J. Transp. Econ. Policy (JTEP) 2018, 52, 184–201. [Google Scholar]
- Azevedo, C.L.; Cardoso, J.L.; Ben-Akiva, M. Vehicle tracking using the k-shortest paths algorithm and dual graphs. Transp. Res. Proced. 2014, 1, 3–11. [Google Scholar] [CrossRef] [Green Version]
- Kim, Z. Real time object tracking based on dynamic feature grouping with background subtraction. In Proceedings of the 2008 IEEE Conference on Computer Vision and Pattern Recognition, Anchorage, AK, USA, 23–28 June 2008. [Google Scholar]
- Yang, W.; Yu, C.; Yuan, W.; Wu, X.; Zhang, W.; Wang, X. High-resolution vehicle emission inventory and emission control policy scenario analysis, a case in the Beijing-Tianjin-Hebei (BTH) region, China. J. Clean. Prod. 2018, 203, 530–539. [Google Scholar] [CrossRef]
- Song, J.; Zhao, C.; Lin, T.; Li, X.; Prishchepov, A.V. Spatio-temporal patterns of traffic-related air pollutant emissions in different urban functional zones estimated by real-time video and deep learning technique. J. Clean. Prod. 2019, 238, 117881. [Google Scholar] [CrossRef]
- Stead, D. Relationships between transport emissions and travel patterns in Britain. Transp. Policy 1999, 6, 247–258. [Google Scholar] [CrossRef]
- Jia, T.; Carling, K.; Håkansson, J. Trips and their CO2 emissions to and from a shopping center. J. Transp. Geogr. 2013, 33, 135–145. [Google Scholar] [CrossRef]
- Asghar, M.N.; Kanwal, N.; Lee, B.; Fleury, M.; Herbst, M.; Qiao, Y. Visual surveillance within the EU General Data Protection Regulation: A technology perspective. IEEE Access 2019, 7, 111709–111726. [Google Scholar] [CrossRef]
- Paidi, V.; Fleyeh, H.; Håkansson, J.; Nyberg, R.G. Tracking Vehicle Cruising in an Open Parking Lot Using Deep Learning and Kalman Filter. J. Adv. Transp. 2021, 2021, 1–12. [Google Scholar] [CrossRef]
- FleetNews. Vehicle CO2 Emissions Footprint Calculator; Carbon Footprint Calculator; Bauer Consumer Media Ltd.: London, UK, 2021. [Google Scholar]
Figure 1.
The layout of the parking lot at the shopping center.

Figure 2.
ROI layout information.

Figure 3.
The process to collect trajectories of drivers and calculate CO2 emissions.

Figure 4.
Optimal driving behavior was observed in an open parking lot. Figure (a). The cruising distance of the driver is shown by the red line. The walking distance from the parked vehicle to the location of interest is illustrated by the red dotted line. (b) The green trajectory illustrates an optimal cruising path while the dotted line illustrates the walking distance to the LOI.

Figure 5.
Illustrates excess cruising. (a) Illustrates two non-optimal cruising drivers when there are limited available empty parking spaces. (b) Illustrates cruising of drivers when there are no empty parking spaces available.
Figure 5.
Illustrates excess cruising. (a) Illustrates two non-optimal cruising drivers when there are limited available empty parking spaces. (b) Illustrates cruising of drivers when there are no empty parking spaces available.

Figure 6.
Trajectories of vehicles during visitor non-peak hours. (a) Trajectories of two drivers entering the parking lot from different directions and occupying parking spaces. (b) Trajectories of multiple drivers parking.
Figure 6.
Trajectories of vehicles during visitor non-peak hours. (a) Trajectories of two drivers entering the parking lot from different directions and occupying parking spaces. (b) Trajectories of multiple drivers parking.

Figure 7.
Trajectories of vehicles during visitor peak hours: (a) The purple trajectory shows the driver searching for empty parking space in two rows; (b) Shows the vehicle searching for an empty parking space and exiting the ROI, as no space is available.
Figure 7.
Trajectories of vehicles during visitor peak hours: (a) The purple trajectory shows the driver searching for empty parking space in two rows; (b) Shows the vehicle searching for an empty parking space and exiting the ROI, as no space is available.

Figure 8.
Cruising and walking distances of drivers in visitor non-peak hours.

Figure 9.
Cruising and walking distances of drivers in visitor peak hours.

Figure 10.
Illustrates the cruising distances of drivers who could not find an empty parking space in the ROI.
Figure 10.
Illustrates the cruising distances of drivers who could not find an empty parking space in the ROI.

Figure 11.
The time that is taken by the driver to occupy an empty parking space during visitor non-peak hours.
Figure 11.
The time that is taken by the driver to occupy an empty parking space during visitor non-peak hours.

Figure 12.
The time taken by a driver to occupy an empty parking space during visitor peak hours.


Table 1.
Illustration of the mileage information captured during the experiment.
| No. | Model of Vehicle, Year | KM/L |
|---|---|---|
| 1 | Volvo v50, 2014 | 5.05 |
| 2 | Opel Astra, 2011 | 10.1 |
| 3 | Volkswagen Tiguan, 2018 | 8.19 |
| 4 | Toyota Auris, 2015 | 12.56 |
| 5 | Kia Ceed, 2012 | 7.19 |
| 6 | Kia Sorento, 2018 | 5.63 |
| 7 | Mercedes Benz, 2018 | 5.95 |
| 8 | Saab sports, 2007 | 4.29 |
| 9 | Nissan Juke, 2019 | 11.6 |
Table 2.
Summary of observed cruising distance and drivers.
| Visitor Hour Types | Number of Optimal Drivers | Number of Non-Optimal Drivers | Total Cruising Distance (Meters) | Total Number of Observed Drivers |
|---|---|---|---|---|
| Visitor non-peak hours | 119 | 13 | 11,013 | 132 |
| Visitor peak hours | 96 | 16 | 11,155 | 112 |
| Total | 215 | 29 | 22,168 | 316 |
Table 3.
Summary of CO2 emissions in (g) using proposed CO2 model and petrol as the fuel type.
| Visitor Hour Type | Optimal Cruising CO2 Emissions | Mean of Optimal CO2 Emissions | Non-Optimal CO2 Emissions | Mean of Non-Optimal CO2 Emissions | Total CO2 Emissions Based on Hour Type |
|---|---|---|---|---|---|
| Visitor non-peak hours | 2620 | 22 | 737 | 57 | 3357 |
| Visitor peak hours | 2281 | 24 | 1119 | 70 | 3400 |
| Total | 4901 | 23 | 1856 | 63 | 6757 |
Publisher’s Note: MDPI stays neutral with regard to jurisdictional claims in published maps and institutional affiliations. |
© 2022 by the authors. Licensee MDPI, Basel, Switzerland. This article is an open access article distributed under the terms and conditions of the Creative Commons Attribution (CC BY) license (https://creativecommons.org/licenses/by/4.0/).
Share and Cite
MDPI and ACS Style
Paidi, V.; Håkansson, J.; Fleyeh, H.; Nyberg, R.G. CO2 Emissions Induced by Vehicles Cruising for Empty Parking Spaces in an Open Parking Lot. Sustainability 2022, 14, 3742. https://doi.org/10.3390/su14073742
AMA Style
Paidi V, Håkansson J, Fleyeh H, Nyberg RG. CO2 Emissions Induced by Vehicles Cruising for Empty Parking Spaces in an Open Parking Lot. Sustainability. 2022; 14(7):3742. https://doi.org/10.3390/su14073742
Chicago/Turabian StylePaidi, Vijay, Johan Håkansson, Hasan Fleyeh, and Roger G. Nyberg. 2022. "CO2 Emissions Induced by Vehicles Cruising for Empty Parking Spaces in an Open Parking Lot" Sustainability 14, no. 7: 3742. https://doi.org/10.3390/su14073742
Note that from the first issue of 2016, this journal uses article numbers instead of page numbers. See further details here.