Article

Nutrient Remediation Efficiency of the Sedge Plant (Cyperus alopecuroides Rottb.) to Restore Eutrophic Freshwater Ecosystems

1
Department of Biology, College of Sciences, Taif University, Taif 21944, Saudi Arabia
2
Botany and Microbiology Department, Faculty of Science, Helwan University, Cairo 11790, Egypt
3
Biology Department, College of Science, University of Tabuk, Tabuk 47512, Saudi Arabia
4
Biology Department, College of Science, King Khalid University, Abha 61321, Saudi Arabia
5
Botany Department, Faculty of Science, Kafrelsheikh University, Kafr El-Sheikh 33516, Egypt
*
Author to whom correspondence should be addressed.
Sustainability 2022, 14(5), 2823; https://doi.org/10.3390/su14052823
Submission received: 6 February 2022 / Revised: 18 February 2022 / Accepted: 25 February 2022 / Published: 28 February 2022
(This article belongs to the Special Issue Sustainable Phytoremediation of the Polluted Soil)

Abstract

:
The current study investigated the nutrients removal efficiency of the sedge macrophyte Cyperus alopecuroides to treat water eutrophication, besides evaluating the recycling possibility of the harvested material. Samples of sediment, water, and plant tissues were taken seasonally from six polluted and three unpolluted locations for this investigation. The growth properties of C. alopecuroides showed remarkable seasonal differences in plant density and biomass, with the maximum values (7.1 individual/m2 and 889.6 g/m2, respectively) obtained during summer and the minimum (4.1 individual/m2 and 547.2 g/m2, respectively) in winter. In polluted locations, the above-ground tissues had an efficiency to remove more contents of N and P (11.9 and 3.8 g/m2, respectively) than in unpolluted ones (7.1 and 3.4 g/m2, respectively). The high-nutrient standing stock of C. alopecuroides supports its potential use for nutrient removal from eutrophic wetlands. The tissues of C. alopecuroides had the maximum nutrients removal efficiency to remediate great amounts of Na, K, and N in summer, and Ca, P, and Mg in spring. Above- and below-ground parts of C. alopecuroides from unpolluted locations can be considered as a rough forage for beef cattle, dairy cattle, goats, and sheep. The present study indicated the potential of C. alopecuroides in restoring eutrophic freshwater ecosystems, and, thus, it can be used in similar habitats worldwide.

1. Introduction

Nutrient pollution of water bodies is today among the most serious environmental issues, owing mostly to the uptake of N and P compounds because of anthropogenic and agricultural drainages, which causes eutrophication [1,2]. This sort of pollution can cause color, taste, and odor alterations, besides oxygen depletion and biodiversity loss in water resources [3]. Several nutrient sources, including agricultural drainage, sewage, and anthropogenic wastes, have been identified as increasing load of nutrients in aquatic ecosystems [4,5]. Excess nutrients in aquatic water bodies are a global challenge due to the repercussions of eutrophication [6], a widespread water pollution issue that causes excessive growth of aquatic plants [7]. Furthermore, excessive fertilizers frequently exceed crop requirements, releasing nutrients, particularly P and N, from agricultural lands into bodies of water [8,9]. Excess nutrients tend to concentrate in wetland sediments and can be returned to the above-water layer (i.e., internal nutrient loading), sustaining eutrophication hazards [10,11]. Accelerated eutrophication can reduce water quality and availability [12]. Moreover, water quality of freshwater systems is impacted by climatic variability, since low rainfall may decrease the water flow rate in water bodies and, consequently, increase eutrophication [13].
Harvesting above-ground plant biomass is a typical approach for aquatic water body restoration and management to create low-nutrient conditions [14]. Aquatic plants can help restore ecosystems by removing contaminants from sediment and water and transferring them to above-ground biomass [15]. Aquatic plants require nutrients for development and reproduction, and, because these plants grow quickly and produce a lot of food, they may store a lot of nutrients in their biomass [16]. To repair eutrophication in water bodies, biological nutrient remediation of P and N has been widely used in wastewater treatment techniques for upgrading existing or creating new wastewater treatment facilities [17]. Aquatic macrophytes, including sedges, control freshwater ecosystem functions such as water purification and nutrient remediation [18]. Harvesting plants at their peak nutrient content and biomass allows for the best nutrient remediation [19]. The harvested biomass can be recycled for a variety of purposes such as forages, fertilizers, soil additives, and biofuel production [20]. As a result, periodical harvesting of the aquatic plant biomass improves treatment efficiency and prevents nutrient re-adsorption into the water body [16].
Land desertification and population growth have recently raised demand for high-quality fodder products [21]. Whereas, the forage production system faces numerous challenges, including as a rival with the production of food crops and agricultural area reduction [22]. As a result, there is a necessity in developing nations to exploit non-traditional and fiber-rich alternative fodder, which can lower animal producers’ feed costs, while also improving digestibility and, as a result, meat quality [23]. Utilizing collected materials can aid in aquatic restoration, which provides various environmental benefits such as increased recreational opportunities [7]. Cyperus alopecuroides Rottb. (Cyperaceae) is a huge sedge plant found across the tropics, including the Egyptian Nile Delta and Valley [24]. It is a rhizomatous perennial plant that can grow up to one meter tall and has relatively large ripping leaves [25]. C. alopecuroides is a plant that tolerates salinity and waterlogging [26]. It is a promising aquatic phytoremediator for contaminated waters, which has received little attention in Egyptian wetlands [24]. Cyperus spp., according to Boulos [27], exhibit therapeutic qualities such as pectoral emollient, analgesic, and anthelmintic.
Quantifying the effects of eutrophication can also help guide recovery decision-making [28]. The overall storage of a nutrient element in a certain plant organ is known as “nutrient standing stock”, which is calculated by multiplying the nutrient concentration in plant tissue by the dry biomass of that tissue and is usually stated in grams per square meter [29]. As a result, when assessing nutrient accumulation, both nutrient concentration and dry biomass must be considered [16]. Many studies were carried out on the phytoremediation of heavy metals by C. alopecuroides [24,30], while few studies focused on its nutrients’ accumulation potential. Consequently, the present study was conducted to investigate the seasonal nutrient remediation potential of C. alopecuroides by measuring its nutrient concentration and nutrient standing stock to restore eutrophic water bodies. It also considered the possibility of reusing the harvested material as animal fodder. Our study questions were: (1) what are the nutrient stocks of C. alopecuroides? and (2) how do they differ in polluted and unpolluted areas?

2. Materials and Methods

2.1. Sampling Design and Growth Measurements

Cyperus alopecuroides is a perennial sedge, thus, fresh wild plant samples were taken seasonally for one year (winter 2016 to autumn 2017) from six polluted locations distributed evenly on Ismailia Canal (30.11210 N, 31.26922 E) and Nahia Drain (30.03213 N, 31.13757 E), which receive industrial, agricultural, and sewage wastes from neighboring areas, to assess the study plant’s capability for nutrient remediation (Figure 1). Three unpolluted locations along the Nile (29.81908 N, 31.29253 E), Egypt’s principal drinking water source, were chosen for comparison in spring and autumn (2017). During each sampling season, each site was sampled instantly across 5 quadrats (0.5 × 0.5 m) reflecting the C. alopecuroides population (n = 120 in polluted locations and n = 30 in unpolluted locations). All plant shoots were collected at the soil surface in each quadrat, and the total number of shoots was tallied to determine the shoot density (shoot/m2). The plants were then transported to the laboratory in polyethylene bags and rinsed twice with tap water to remove dirt and then rinsed once with de-ionized water. Following that, five individuals were chosen at random from each quadrat to measure stem length, diameter, and leaf area using the following equation [31]:
Leaf area (cm2/leaf) = 0.905 × length of the leaf (cm) × breadth at a midway point along the length (cm)
The above-ground components were weighed and dried in the oven at 65 °C until constant weight, yielding dry weight values per shoot. The fresh (g FW/m2) and dry (g DW/m2) biomass were then estimated by multiplying the average fresh and dry weight (g/shoot) by the shoot density (shoots/m2).

2.2. Plant Analysis

2.2.1. Inorganic Nutrients

Three composite samples of C. alopecuroides plants’ above-ground shoots (stem and leaves), as well as below-ground rhizomes and roots, were collected seasonally from each location for plant analysis. Oven-dried samples were homogenized in a metal-free plastic mill (Philips HR2221/01, Shanghai, China) and then passed through a 2 mm mesh sieve. A one-gram powdered sample was digested in a 20-mL tri-acid combination of HNO3:HClO4:HF (1:1:2, v:v:v). A microwave gadget was utilized for digesting (Perkin Elmer Titan MPS, PerkinElmer Inc., Waltham, MA, USA). Total N was calculated using the Kjeldahl method; P was calculated using a spectrophotometer (CECIL CE 1021, Cecil Instruments Limited, Milton, Cambridge, UK); Ca, Na, and K were calculated using a flame photometer (CORNING M410, Sherwood Scientific Limited, Cambridge, UK); and Mg was calculated using an atomic absorption photometer (Shimadzu AA-6300, Shimadzu Co. Ltd., Kyoto, Japan). Allen [32] discussed all these plant analysis methods. Furthermore, the nutritional contents (g DM/m2) of the above- and below-ground portions were calculated by multiplying the nutrient concentrations by the biomass of the appropriate organ.

2.2.2. Organic Nutrients

Ether was used to remove crude lipids from the plant, and the Soxhlet process was used to extract crude fibers [32]. Adesogon et al. [33] suggested a method for calculating total protein content (TP):
TP (in % dry matter) = N-concentration (%) × 6.25
Carbohydrate (NFE) was evaluated according to the equation [34]:
NFE (in % dry matter) = 100 − (TP + crude fiber + crude fat + ash)
The digestible crude protein (DCP) was calculated using the following equation [35]:
DCP (in % dry matter) = (0.929 × TP (in % dry matter)) − 3.52
Total digestible nutrients (TDN) were calculated using Naga and El-Shazly’s [36] equation:
TDN (in % dry matter) = 0.623 × (100 + (1.25 × EE)) − (CP × 0.72)
where EE and CP are the percentages of ether extract and crude protein, respectively.
The digestible energy (DE) was determined using the equation below [37]:
DE (Mcal/kg) = 0.0504 × TP (%) + 0.077 × EE (%) + 0.02 × CF (%) + 0.000377 × (NFE)2 (%) + 0.011 × (NFE) (%) − 0.152
Metabolized energy (ME) was calculated as [38]:
ME (Mcal/kg) = 0.82 × DE (Mcal/kg)
Net energy (NE) was calculated as [34]:
NE (Mcal/kg) = 0.50 × ME (Mcal/kg)
Gross energy (GE) was calculated following the equation [37]:
GE (Kcal/100 g) = 5.72 × TP (%) + 9.5 × EE (%) + 4.79 × CF (%) + 4.03 × NFE (%)

2.3. Sediments and Water Analysis

Sediment samples (three composite) were obtained from each location using a stain-less steel crab. They were dried before being sieved using a 2 mm sieve. A portable calibrated salinity multi-parameter instrument (Hanna HI 9811-5, Hanna Instruments Italia Srl, Villafranca Padovana, Italy) was used to determine sediment pH and electrical conductivity (EC) from 1:5 (w/v) sediment-water extracts [32]. The dissolved nutrients were calculated using established procedures of Allen [32]. Total N was determined using the Kjeldahl method; P was determined using the molybdenum blue method and a CECIL CE 1021, Cecil Instruments Limited, Milton, Cambridge, UK spectrophotometer; and Na and K were measured using a CORNING M410, Sherwood Scientific Limited, Cambridge, UK flame photometer. Direct titration against AgNO3 solution with 5 percent potassium chromate indicator for chlorides determination. Titration against 0.01 N HCl was used to determine carbonates and bicarbonates, and a spectrophotometer was used to estimate sulphates at 500 nm (CECIL CE 1021, Cecil Instruments Limited, Milton, Cambridge, UK) as barium sulphate. Three composite samples (1 L each) of surface water from polluted and unpolluted water bodies were obtained from each location for water analysis. The same sediment analytical procedures were used to assess water pH, EC, CO3, HCO3, SO4, Cl, N, P, K, and Na [32].

2.4. Data Analysis

A paired-sample t-test was used to compare the differences in sediment variables between contaminated and unpolluted sites. Prior to doing an analysis of variance (ANOVA), the Shapiro–Wilk and Levene tests were used to assess the presence of a normal distribution and variance homogeneity in the data set, respectively. When log transformation was required, it was utilized. One-way ANOVA was used in SPSS software to examine the significance of seasonal changes in nutrients across the several organs of C. alopecuroides plants [39]. At p < 0.05, Tukey’s HSD test revealed significant differences between means.

3. Results

3.1. Sediment and Water Properties

The descriptive statistics of the paired sample t-test indicated significant differences in all investigated sediment variables between the unpolluted and polluted locations (Table 1). It was found that the nutrient contents of the polluted locations were higher than those of the unpolluted ones. Likewise, the sediment of the polluted locations was more saline (476.4 µS/cm) than that of the unpolluted one (372.7 µS/cm) in contrast with the pH value (5.4 for polluted and 7.3 for unpolluted sediments). Moreover, the nutrient contents of the sediments fell in the order: Na > N > K > P in the unpolluted sediments, and N > K > Na > P in the polluted sediments. The water chemical study, on the other hand, revealed substantial changes in pH, EC, SO4, N, P, Na, and Cl between contaminated and unpolluted locations. Except for P, K, CO3, and HCO3, most of the variables studied were collected in the sediment more than in the water. The nutritional elements were found in the following sequence in polluted and unpolluted areas: P > K > Na > N.

3.2. Growth Properties

C. alopecuroides growth measurements revealed significant seasonal fluctuation in plant density, leaf area, and biomass (Figure 2). Summer had the highest plant density and biomass (7.1 individual/m2 and 889.6 g/m2, respectively), whereas spring had the maximum leaf area (119.1 cm2). Winter, however, had the lowest plant density, leaf area, and biomass (4.1 individual/m2, 52.1 cm2, and 547.2 g/m2, respectively). It is worth mentioning that the plant density and leaf area in the unpolluted areas (7.8 individual/m2 and 114.0 cm2, respectively) were comparable to those reported in the spring, summer, and autumn, but markedly different from those recorded in the polluted water bodies during winter. In contrast, the biomass of C. alopecuroides obtained from unpolluted regions (796.8 g/m2) differed significantly from that observed in spring, summer, and winter but was equivalent to that found in contaminated locations during autumn. The paired sample t-test revealed significant differences in plant density, leaf area, and biomass between contaminated and unpolluted areas.

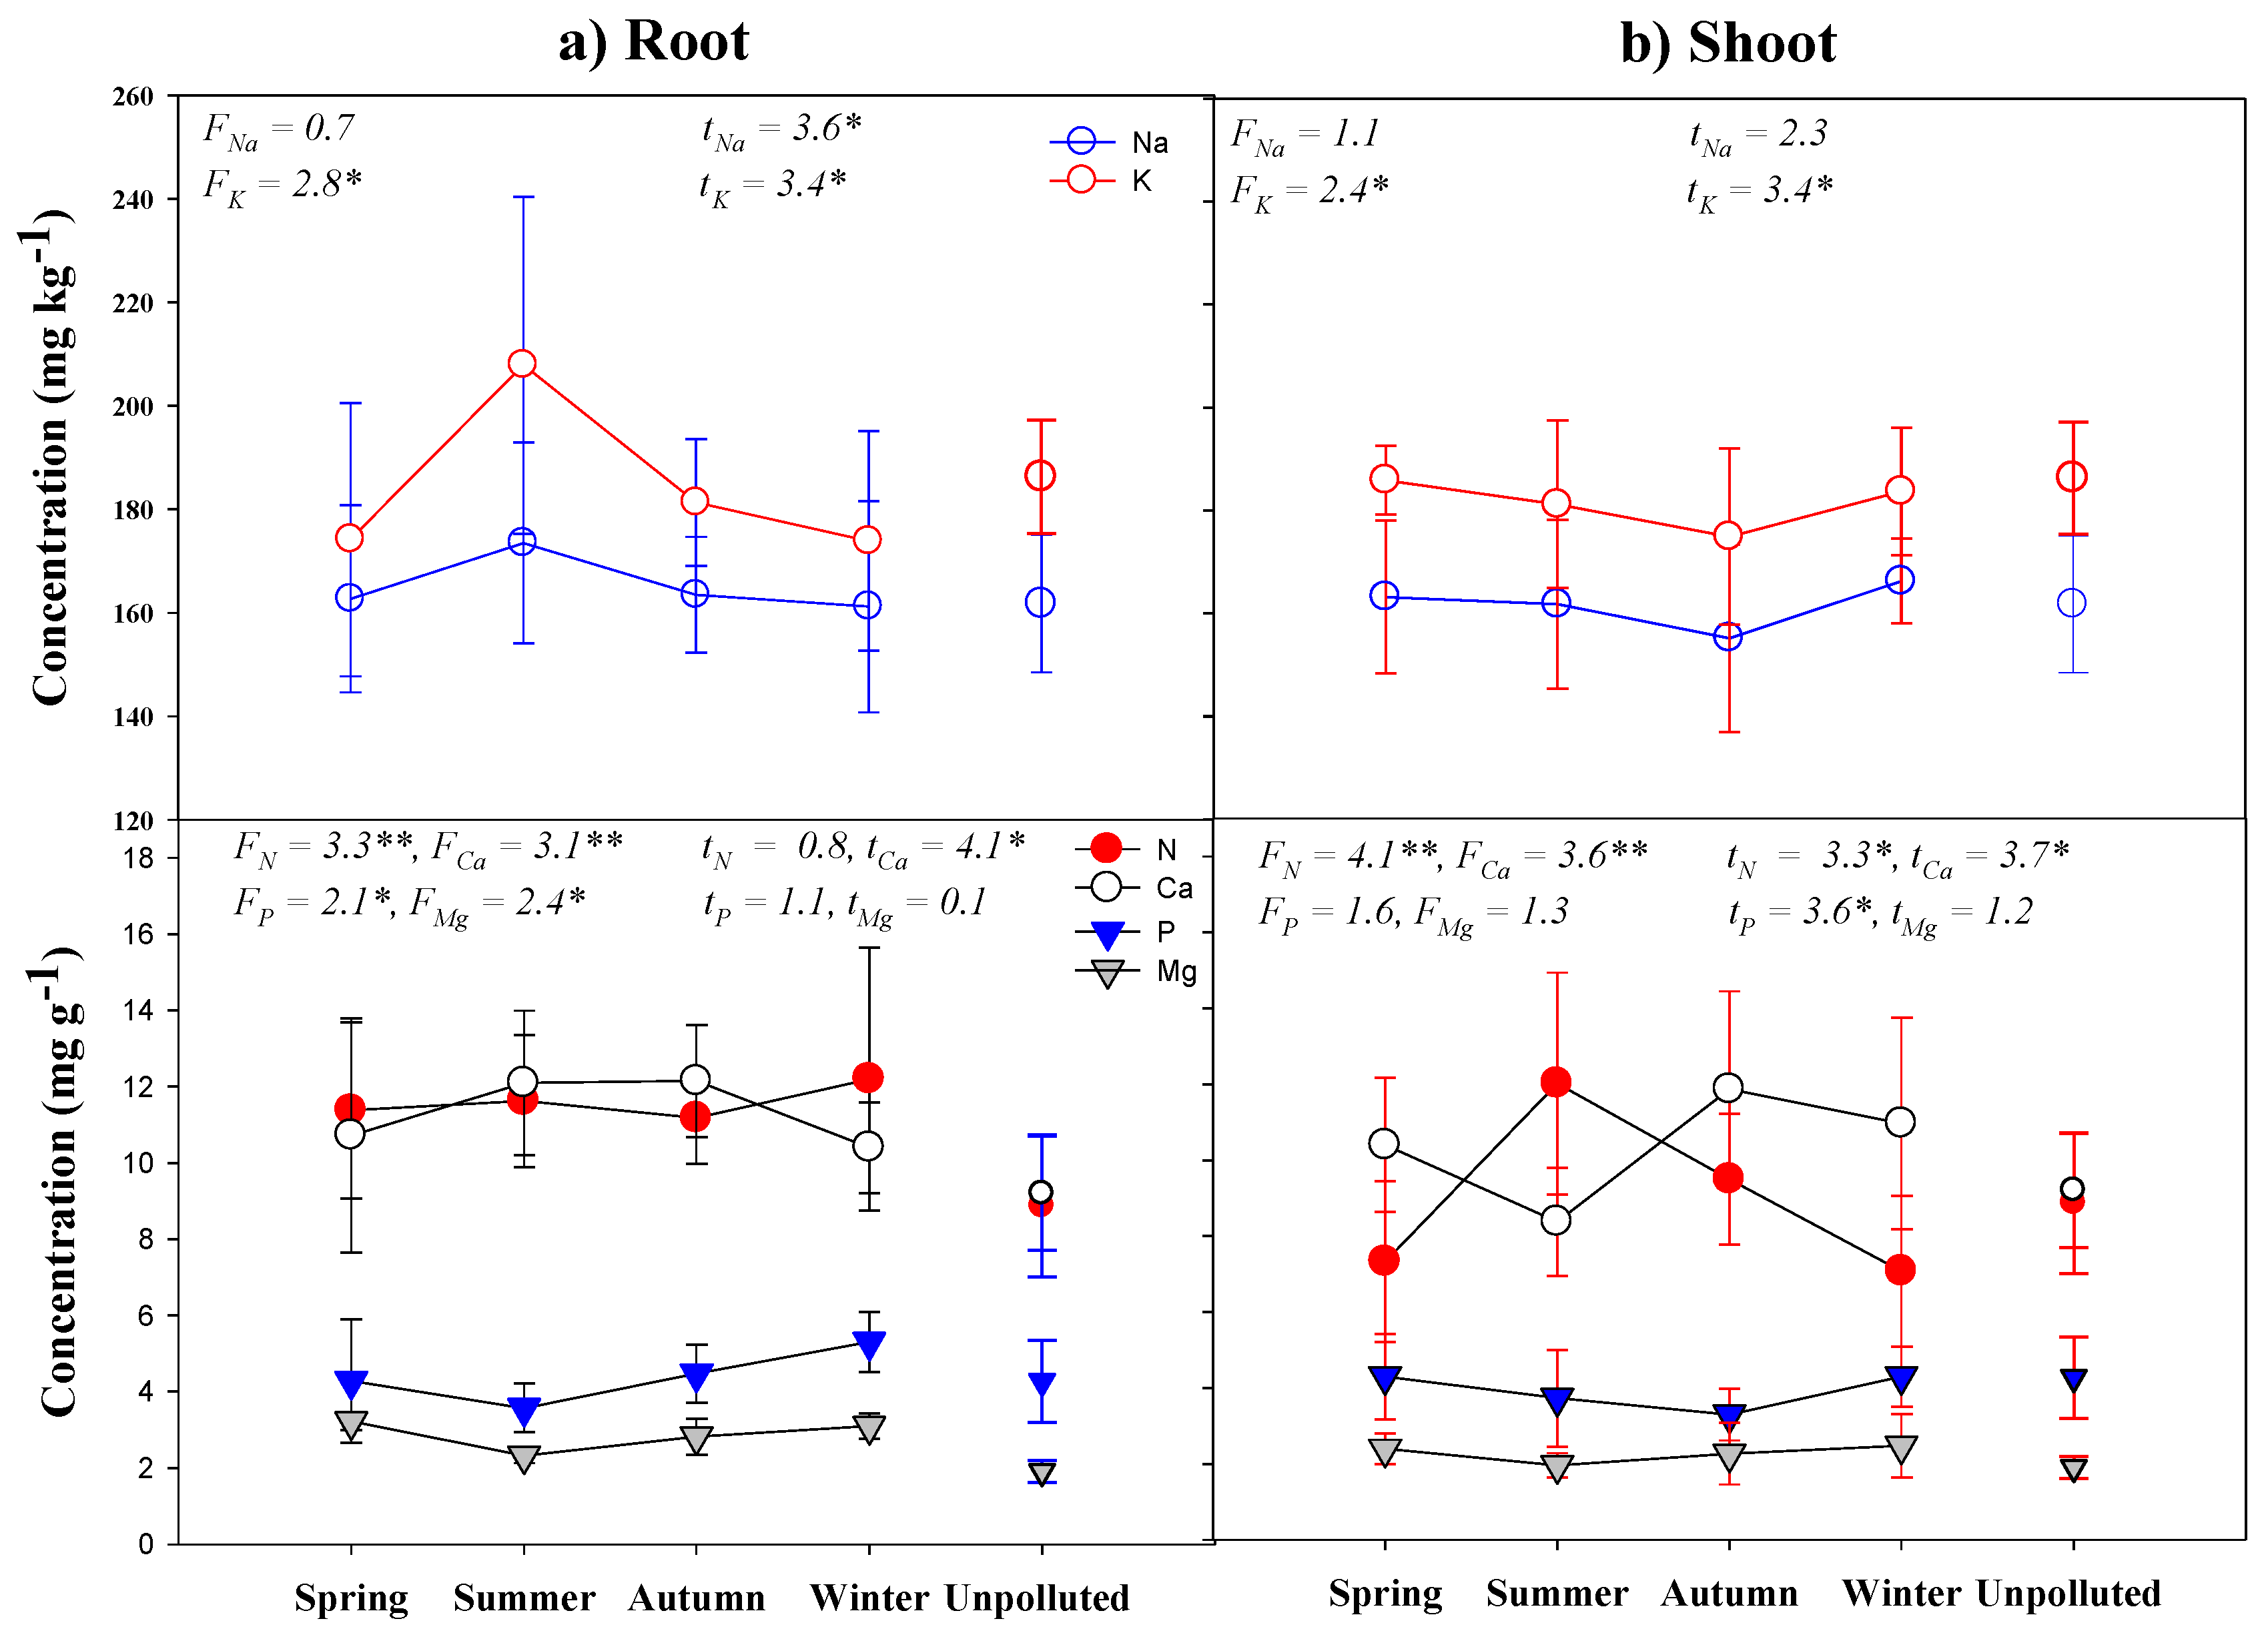
3.3. Inorganic Nutrient Concentrations

The statistical analysis (one-way ANOVA) confirmed the significant seasonal fluctuation in the investigated inorganic nutrients rather than Mg and Na in the above- and below-ground tissues of C. alopecuroides, while the paired sample t-test revealed significant differences in all nutrients (except N, P, and Mg in the below-ground parts and Na and Mg in the above-ground tissues) between polluted and unpolluted locations (Figure 3). During the summer, the below-ground components from polluted areas supplied the highest Na and K concentrations (173.5 and 207.9 mg/kg, respectively), but the lowest P and Mg concentrations (3.6 and 2.3 mg/kg, respectively). They also found the highest N and P concentrations (12.2 and 5.3 mg/kg, respectively) and the lowest Na, K, and Ca concentrations (161.2, 173.9, and 10.4 mg/kg, respectively) during the winter. It is worth mentioning that the concentrations of the examined elements (save N and Mg) in the unpolluted below-ground areas were higher than those in the polluted areas. The concentration of nutritional elements in the below-ground portions was as follows: K > Na > N > Ca > P > Mg. On the other hand, above-ground sections of C. alopecuroides gathered from contaminated areas had the highest K and P (185.9 and 4.4 mg/kg, respectively) during spring, N (12.0 mg/kg) during summer, Ca (11.9 mg/kg) during autumn, and Na and Mg (166.3 and 2.5 mg/kg, respectively) during winter (Figure 3). Furthermore, the concentrations of Na, K, and P in the unpolluted shoots were higher, while those of N, Ca, and Mg were lower than in the polluted areas. The plant branches accumulated nutrients in the following order: K > Na > Ca > N > P > Mg.

3.4. Nutrient’s Removal Efficiency

The statistical study (one-way ANOVA) indicated that the inorganic nutrient levels of K, N, and Ca in C. alopecuroides above-ground tissues differed considerably across seasons (Figure 4). The paired sample t-test also found significant differences in Ca, N, P, and K between polluted and unpolluted sites. C. alopecuroides tissues accumulated the most Na, K, and N (0.16, 0.18, and 11.9 g/m2, respectively) during summer and the least Ca, P, and Mg (9.1, 3.8, and 2.1 g/m2, respectively) during spring. Winter, on the other hand, has the lowest nutritional level of all tested seasons. It is worth noting that plant issues gathered larger Na, K, P, and Mg concentrations, but lower N and Ca contents, from unpolluted rather than polluted sites. The annual average of the nutrient contents accumulated per unit area of C. alopecuroides’ above-ground tissues was as follows: Ca > N > P > Mg > K > Na.

3.5. Organic Nutrient Content

The organic nutrient analysis of C. alopecuroides above- and below-ground tissues revealed significant seasonal fluctuation in the elements studied (Table 2). Below-ground tissues accumulated higher levels of all organic elements than above-ground tissues, contributing to the highest levels of crude fibers (CF) and carbohydrates (NFE) (7.9% and 73.1%, respectively) during summer, ether extract (EE: 1.1%) during spring, ash content (11.3%) during autumn, and total protein (TP: 8.8%) during winter. During the winter, the above-ground parts had the lowest values of CF, TP, and NFE (55.4%, 5.4%, and 28.9%, respectively). Significant differences in estimated organic nutrients were found between unpolluted and polluted water bodies, except for EE and ash content (in below-ground tissues) and EE, ash content, and TP (in above-ground tissues) (Table 3). Below-ground tissues in polluted areas showed a significant decrease from 34.3% to 20.0% for CF, but an increase from 4.2% to 7.7% for TP and from 50.2% to 61.6% for NFE. However, the above-ground tissues showed a significant decrease in NFE from 42.1% to 37.6%, but a remarkable increase in CF from 40.5% to 46.9%.

3.6. Forage Quality

The forage quality of C. alopecuroides plants was evaluated, and all the analyzed nutritional characteristics showed considerable seasonal change (Table 4). During the summer, below-ground tissues had its maximum DE, ME, and NE (3.3, 2.7, and 1.3 Mcal/kg, respectively), but the lowest GE (379.1 Mcal/kg). Furthermore, they had the most DCP (4.7%) but the lowest TDN (56.3%) throughout the winter. During winter, above-ground tissues showed the lowest levels of DCP (1.5%), DE, ME, and NE (1.9, 1.6, and 0.8 Mcal/kg, respectively), and the greatest levels of TDN (59.2%) and GE (420.0 Mcal/kg). There were no significant variations in plant forage quality characteristics (save DCP, ME, and NE in below-ground tissues and DCP in above-ground tissues) between polluted and unpolluted areas on an annual basis (Table 5). Under pollution conditions, DCP, ME, and NE levels in C. alopecuroides below-ground tissues increased significantly (0.4–3.7%, 1.9–2.3 Mcal/kg, and 0.9–1.2 Mcal/kg, respectively). In polluted areas, however, the DCP decreased significantly from 2.6 to 1.9% in above-ground tissues.

4. Discussion

The water body’s sediment and water chemistry indicate the type and intensity of point-source contamination [29]. It was discovered that nutrient concentrations were higher in polluted areas than in unpolluted areas, and higher in sediments than in water. These findings are consistent with those of Ghazi et al. [31] and Galal et al. [40], who found that sediment from polluted water bodies contained more nutrients and heavy metals than sediment from the unpolluted River Nile. Agricultural drainage, as well as home and industrial effluents from anthropogenic activities, are the primary causes of pollution in eutrophic water bodies, according to Galal et al. [41]. In the same vein, polluted areas in the current study are surrounded by huge amounts of agricultural fields, which could dramatically raise the levels of water nutrients, particularly N and P, and, hence, enhance eutrophication [42,43].
C. alopecuroides plant density and biomass showed substantial seasonal variation, with the highest values recorded during the summer and the lowest values acquired during the winter. Many water macrophytes, such as Phragmites australis [29], Cyperus articulatus [40], Vossia cuspidata [41], Ludwigia stolonifera [43,44], Arundo donax [45], and Typha domingensis [46] have shown similar results. C. alopecuroides had the highest biomass of 0.9 kg/m2, which is higher than the same species’ 0.1 kg/m2 [24] and 0.6 kg/m2 [47], but lower than the 1.7 kg/m2 [40] and 5.0 kg/m2 [48] for C. articulatus. Low biomass through winter may be due to low temperature, eco-physiological behavior, and water body monitoring systems [24], in addition to the short growing season, water eutrophication intensity, and severe conditions such as competition [43]. Furthermore, Eid et al. [29] linked this decline to the winter season’s glucose transfer from below-ground to above-ground tissues. Furthermore, the average biomass in polluted areas was much lower than in unpolluted areas, which could be related to high heavy metal content, which inhibit plant development [31].
According to Manolaki et al. [18], there is a significant fluctuation in the absorption potential of aquatic macrophytes dependent on sediment and water chemistry, where these plants demonstrate seasonal development fluctuates depending on their nutrient requirements. There is a large seasonal fluctuation in the inorganic nutrients among C. alopecuroides tissues and between unpolluted and polluted regions. This finding is consistent with Klaus et al. [49] and Galal et al. [41], who determined that plant size and growing season are the primary causes of nutritional variance. The below-ground regions of polluted water bodies contributed the most Na and K concentrations during the summer, and the least N and P concentrations during the winter. However, the above-ground shoot had the greatest K and P levels in the spring, the highest N levels in the summer, the highest Ca levels in the autumn, and the highest Na and Mg levels in the winter. According to Vymazal [16], plant tissues gathered most nutrients at the start of the growth season, and the least at maturity and senescence. Furthermore, according to Vymazal and Richardson [50], increased sediment or water nutrient contents may not enhance nutrient concentrations in plant tissues but may increase above-ground biomass.
The plant nutrient content (storage capacity or nutrient standing stock) is calculated by multiplying an organ’s biomass by its element concentration. The aquatic plant biomass is regarded as the most important component in determining the nutrient standing stock [16]. The tissues of C. alopecuroides exhibited the maximum nutrient standing stock (g/m2) of Na, K, and N throughout the summer, while the highest Ca, P, and Mg were obtained during the spring. Above-ground tissues in polluted areas acquired higher levels of N and P (11.9 and 3.8 g/m2, respectively) than in unpolluted areas (7.1 and 3.4 g/m2, respectively). These values are lower than those reported by Zhao et al. [51] on P. australis throughout the summer (74.5 and 7.3 g/m2, respectively). Furthermore, Vymazal et al. [52] showed that tall macrophytes such as P. australis and Phalaris arundinacea can remove 30.0 and 80.0 g N/m2, respectively, as well as 2.0 and 6.0 g P/m2, and that these values can surpass 150.0 g N/m2 and 15.0 g P/m2 in high biomass stands. Furthermore, C. alopecuroides’ nutritional content supports its possible use for nutrient remediation from eutrophic water bodies by above-ground biomass harvesting.
Increased nutrient content in aquatic habitats because of industrialization, urbanization, and enhanced anthropogenic activities could lead to eutrophication and degradation of these ecosystems [42]. To help restore these ecosystems, aquatic plants should be harvested during the growing season, when the biomass and nutritional contents of the plant tissues are at their peak [14,29]. Our research found that summer is the best time to harvest C. alopecuroides for greatest removal of Na, K, and N, while spring is best for removal of Ca, P, and Mg from eutrophic water bodies. This conclusion is consistent with the findings of Galal et al. [41,43], who attributed it to the greatest nutrient accumulation (particularly N and P) linked with maximal plant biomass throughout the summer. Furthermore, Eid et al. [29] identified spring as the best period to harvest P. australis with the maximum nutrient content and biomass to address Lake Burullus eutrophication in Egypt. According to Kasak et al. [53], removing nutrients through biomass collection is effective for rebuilding nutrient-depleted aquatic habitats. The biggest issue in eutrophic water bodies about leaving aquatic biomass unharvested throughout the growing season is the excessive nutrient re-adsorption from aquatic plants to the environment rather than absorbing them during senescence [14]. Furthermore, harvesting aquatic plants must consider that these plants inhibit the formation of algal blooms in eutrophic water bodies by mitigating light and nutrients [54], and, thus, harvesting large stands of aquatic biomass will accelerate algal growth, leading to phytoplankton dominance [7].
According to Geurts et al. [14], plants should be collected at the highest protein content for high forage quality, and C. alopecuroides should be harvested during winter to be used as fodder, where its below-ground parts have the highest protein content (8.8%), and the above-ground shoots can produce fiber-rich fodder (CF = 55.4%). The crude fiber value of Egyptian clover (Trifolium alexandrinum), a typical grazing herb, exceeded 21.5% [55]. According to El-Kady [56], the lowest protein content needed for animal feed was 6–12%. The above- and below-ground sections of C. alopecuroides meet the criterion for animal maintenance based on the values observed in the current study (5.5–8.8%). Furthermore, the measured values are consistent with the protein level (2.7–13.4%) of some tough feed [57]. The great protein content of C. alopecuroides tissues may boost bovine meat and milk supply, which can be limited by low protein forages. The ether extract (crude fats) concentration is comparable to that of some tough fodder (0.5–3.1% [57]). Furthermore, the various tissues of C. alopecuroides were fiber-rich fodder, outperforming the Egyptian clover (21.5% [55]).
TDN is an adequate measure for the animals’ feed energy, according to El-Beheiry [58]. The TDN of the above- and below-ground sections of C. alopecuroides in the current study exceeded 57.0%, which meets the diet requirements (50.0%) of breeding cattle [37]. Furthermore, the mean DE (up to 2.9 Mcal/kg) saved the amount (2.7 Mcal/kg) required by sheep [59], and the ME (1.7–2.3 Mcal/kg) approximated the breeding cattle and sheep requirements [37,59]. It is worth mentioning that the forage value of C. alopecuroides above- and below-ground portions from contaminated or unpolluted areas meets the forage scales of beef cattle [37], dairy cattle [60], goat [61], and sheep [62]. It is also vital to examine this species’ ability to accumulate heavy metal contaminants in its tissues [24]. As a result, while harvesting C. alopecuroides plants from polluted water bodies for use as animal fodder, caution should be exercised [63,64].

5. Conclusions

The above-ground biomass and plant density of C. alopecuroides were at their highest during the summer and at their lowest during the winter. The below-ground parts from polluted areas accumulated the highest Na and K concentrations during summer, and N and P concentrations during winter, whereas the above-ground shoot accumulated the highest K and P concentrations during spring, N during summer, Ca during autumn, and Na and Mg concentrations during winter. The plant gathered most of the nutrients studied in the below-ground rather than the above-ground sections. C. alopecuroides’ high nutrient standing stock (g/m2) supports its potential use for nutrient removal from eutrophic wetlands by biomass harvesting. C. alopecuroides tissues had the maximum nutrient removal efficiency, remediating considerable amounts of Na, K, and N in the summer and Ca, P, and Mg in the spring. Harvested plants from contaminated water bodies could be converted to ash and packed in a safe place to recover the accumulated heavy metals for economic purposes. Furthermore, the above- and below-ground sections of C. alopecuroides from unpolluted areas can be harvested to be used as rough feed for beef cattle, dairy cattle, goats, and sheep to recycle the collected materials. The present study indicated the potential of C. alopecuroides in restoring eutrophic freshwater ecosystems, and, thus, it can be used in similar habitats worldwide.

Author Contributions

Conceptualization, T.M.G.; methodology, T.M.G., F.A.G. and K.H.M.; software, T.M.G., F.A.G. and K.H.M.; formal analysis, T.M.G., F.A.G., K.A.A.-M. and K.H.M.; investigation, E.M.E.; resources, H.M.A.-Y.; data curation, T.M.G., F.A.G., K.H.M. and E.M.E.; writing–original draft preparation, T.M.G.; writing–review and editing, F.A.G., H.M.A.-Y., K.A.A.-M., K.H.M. and E.M.E.; visualization, T.M.G.; supervision, T.M.G.; funding acquisition, H.M.A.-Y. All authors have read and agreed to the published version of the manuscript.

Funding

This research was funded by the Scientific Research Deanship at Taif University through the project number TURSP-2020/199.

Institutional Review Board Statement

Not applicable.

Informed Consent Statement

Not applicable.

Data Availability Statement

The data are contained within the article.

Conflicts of Interest

The authors declare no conflict of interest.

References

  1. Yaqub, M.; Asif, H.; Kim, S.; Lee, W. Modeling of a full-scale sewage treatment plant to predict the nutrient removal efficiency using a long short-term memory (LSTM) neural n. J. Water Process Eng. 2020, 37, 101388. [Google Scholar] [CrossRef]
  2. Krimsky, L.S.; Lusk, M.G.; Abeels, H.; Seals, L. Sources and concentrations of nutrients in surface runoff from waterfront homes with different landscape practices. Sci. Total Environ. 2021, 750, 142320. [Google Scholar] [CrossRef] [PubMed]
  3. Zainol, Z.; Fadzil, M.; Abdullah, S. Hydrodynamics, nutrient concentrations, and phytoplankton biomass in a shallow and restricted coastal lagoon under different tidal and monsoonal environmental drivers. Reg. Stud. Mar. Sci. 2020, 38, 101376. [Google Scholar] [CrossRef]
  4. Jani, J.; Yang, Y.Y.; Lusk, M.G.; Toor, G.S. Composition of nitrogen in urban residential stormwater runoff: Concentrations, loads, and source characterization of nitrate and organic nitrogen. PLoS ONE 2020, 15, e0229715. [Google Scholar] [CrossRef] [PubMed] [Green Version]
  5. Castillo, P.; Serra, I.; Townley, B.; Aburto, F.; López, S.; Tapia, J. Biogeochemistry of plant essential mineral nutrients across rock, soil, water and fruits in Vineyards of Central Chile. Catena 2021, 196, 104905. [Google Scholar] [CrossRef]
  6. Huang, J.; Chen, Q.; Peng, J.; Gao, J. Quantifying the cost-effectiveness of nutrient-removal strategies for a lowland rural watershed: Insights from process-based modeling. Ecol. Model. 2020, 431, 109123. [Google Scholar] [CrossRef]
  7. Quilliam, R.S.; van Niekerk, M.A.; Chadwick, D.R.; Cross, P.; Hanley, N.; Jones, D.L.; Vinten, A.J.A.; Willby, N.; Oliver, D.M. Can macrophyte harvesting from eutrophic water close the loop on nutrient loss from agricultural land? J. Environ. Manag. 2015, 152, 210–217. [Google Scholar] [CrossRef] [Green Version]
  8. Li, Y.; Peter, T.; Guo, H.; Huang, Z.; Steven, K.; Wang, H.; Gu, M.; Wei, L. Variation of dissolved nutrient exports by surface runoff from sugarcane watershed is controlled by fertilizer application and ground cover. Agric. Ecosyst. Environ. 2020, 303, 107121. [Google Scholar] [CrossRef]
  9. van der Wiel, B.Z.; Weijma, J.; Van Middelaar, C.E.; Kleinke, M.; Jan, C.; Buisman, N.; Wichern, F. Restoring nutrient circularity: A review of nutrient stock and flow analyses of local agro-food-waste systems. Resour. Conserv. Recycl. X 2020, 160, 104901. [Google Scholar] [CrossRef]
  10. Fan, H.; Wang, K.; Wang, C.; Yu, F.; He, X. A comparative study on growth characters and nutrients removal from wastewater by two microalgae under optimized light regimes. Environ. Technol. Innov. 2020, 19, 100849. [Google Scholar] [CrossRef]
  11. Kiani, M.; Tammeorg, P.; Niemistö, J.; Simojoki, A.; Tammeorg, O. Internal phosphorus loading in a small shallow lake: Response after sediment removal. Sci. Total Environ. 2020, 725, 138279. [Google Scholar] [CrossRef] [PubMed]
  12. Taillardat, P.; Marchand, C.; Friess, D.A.; Widory, D.; David, F.; Ohte, N.; Nakamura, T.; Van Vinh, T.; Thanh-Nho, N.; Ziegler, A.D. Respective contribution of urban wastewater and mangroves on nutrient dynamics in a tropical estuary during the monsoon season. Mar. Pollut. Bull. 2020, 160, 111652. [Google Scholar] [CrossRef] [PubMed]
  13. Mosley, L.M. Drought impacts on the water quality of freshwater systems; review and integration. Earth Sci. Rev. 2015, 140, 203–214. [Google Scholar] [CrossRef]
  14. Geurts, J.J.; Oehmke, C.; Lambertini, C.; Eller, F.; Sorrell, B.K.; Mandiola, S.R.; Grootjans, A.P.; Brix, H.; Wichtmann, W.; Lamers, L.P.; et al. Nutrient removal potential and biomass production by Phragmites australis and Typha latifolia on European rewetted peat and mineral soils. Sci. Total Environ. 2020, 747, 141102. [Google Scholar] [CrossRef]
  15. Kumwimba, M.N.; Zhud, B.; Wang, T.; Dzakpasu, M.; Li, X. Nutrient dynamics and retention in a vegetated drainage ditch receiving nutrient-rich sewage at low temperatures. Sci. Total Environ. 2020, 741, 140268. [Google Scholar] [CrossRef]
  16. Vymazal, J. Removal of nutrients in constructed wetlands for wastewater treatment through plant harvesting—Biomass and load matter the most. Ecol. Eng. 2020, 155, 105962. [Google Scholar] [CrossRef]
  17. Sutherland, D.L.; Burke, J.; Ralph, P.J. Increased harvest frequency improves biomass yields and nutrient removal on a filamentous algae nutrient scrubber. Algal Res. 2020, 51, 102073. [Google Scholar] [CrossRef]
  18. Manolaki, P.; Mouridsen, M.B.; Nielsen, E.; Olesen, A.; Jensen, S.M.; Lauridsen, T.L.; Baattrup-Pedersen, A.; Sorrell, B.K.; Riis, T. A comparison of nutrient uptake efficiency and growth rate between different macrophyte growth forms. J. Environ. Manag. 2020, 274, 111181. [Google Scholar] [CrossRef]
  19. Meuleman, A.F.M.; Beekman, P.; Verhoeven, J.T.A. Nutrient retention and nutrient-use efficiency in Phragmites australis stands after wastewater application. Wetlands 2002, 22, 712–721. [Google Scholar] [CrossRef]
  20. Plaimart, J.; Acharya, K.; Mrozik, W.; Davenport, R.J.; Vinitnantharat, S.; Werner, D. Coconut husk biochar amendment enhances nutrient retention by suppressing nitrification in agricultural soil following anaerobic digestate application. Environ. Pollut. 2021, 268, 115684. [Google Scholar] [CrossRef]
  21. Tanaka, T.S.; Irbis, C.; Kumagai, H.; Wang, P.; Li, K.; Inamura, T. Effect of Phragmites japonicus harvest frequency and timing on dry matter yield and nutritive value. J. Environ. Manag. 2017, 187, 436–443. [Google Scholar] [CrossRef] [PubMed] [Green Version]
  22. Bruinsma, J. World Agriculture: Towards 2015/2030, an FAO Perspective; Earthscan, FAO: Rome, Italy, 2003. [Google Scholar]
  23. Rattanasomboon, T.; Wester, T.G.; Smith, S.L.; Morel, P.C. Nutritive value of plantain and chicory for pigs. Livest. Sci. 2019, 223, 8–15. [Google Scholar] [CrossRef]
  24. Galal, T.M.; Shedeed, Z.A.; Gharib, F.A.; Al-Yasi, H.M.; Mansour, K.H. The role of Cyperus alopecuroides Rottb. sedge in monitoring water pollution in contaminated wetlands in Egypt: A phytoremediation approach. Environ. Sci. Pollut. Res. 2021, 28, 23005–23016. [Google Scholar] [CrossRef]
  25. Kantor, H.J. Chapter V: Cyperus alopecuroides Rottb. and the Egyptian volute. In Plant Ornament in the Ancient Near East; Oriental Institute, University of Chicago: Chicago, IL, USA, 1999; pp. 169–198. [Google Scholar]
  26. Nawaz, T.; Hameed, M.; Ashraf, M.; Sajid, M.; Ahmad, A.; Batool, R.; Fatima, S. Anatomical and physiological adaptations in aquatic ecotypes of Cyperus alopecuroides Rottb. under saline and waterlogged conditions. Aquat. Bot. 2014, 116, 60–68. [Google Scholar] [CrossRef]
  27. Boulos, L. Medicinal Plants of North Africa; Reference Publications: Algonac, MI, USA, 1983. [Google Scholar]
  28. Sampat, A.M.; Hicks, A.; Ruiz-mercado, G.J.; Zavala, V.M. Valuing economic impact reductions of nutrient pollution from livestock waste. Resour. Conserv. Recycl. 2021, 164, 105199. [Google Scholar] [CrossRef]
  29. Eid, E.M.; Shaltout, K.H.; Al-Sodany, Y.M.; Haroun, S.A.; Galal, T.M.; Ayed, H.; Khedher, K.M.; Jensen, K. Seasonal potential of Phragmites australis in nutrient removal to eliminate the eutrophication in Lake Burullus, Egypt. J. Freshw. Ecol. 2020, 35, 135–155. [Google Scholar] [CrossRef] [Green Version]
  30. Batool, R.; Hameed, M.; Ashraf, M.; Fatima, S.; Nawaz, T.; Ahmad, M.S.A. Structural and functional response to metal toxicity in aquatic Cyperus alopecuroides Rottb. Limnologica 2014, 48, 46–56. [Google Scholar] [CrossRef]
  31. Ghazi, S.M.; Galal, T.M.; Hussein, K.H. Monitoring Water Pollution in the Egyptian Watercourses: A Phytoremediation Approach; Lap Lambert Academic Publishing: Saarbrucken, Germany, 2019; p. 153. [Google Scholar]
  32. Allen, S.E. Chemical Analysis of Ecological Materials; Blackwell Scientific Publications: London, UK, 1989. [Google Scholar]
  33. Adesogon, A.T.; Givens, D.I.; Owen, E. Measuring chemical composition and nutritive value in forages. In Field and Laboratory Methods for Grassland and Animal Production Research; t’Mannetje, L., Jones, R.M., Eds.; CABI Publishing: Wallingford, UK, 2000. [Google Scholar]
  34. Le Houérou, H.N. Chemical composition and nutritive value of browse in Tropical West Africa. In Browse in Africa: The Current State of Knowledge; Le Houérou, H.N., Ed.; ILCA: Addis Ababa, Ethiopia, 1980; pp. 261–289. [Google Scholar]
  35. Demarquilly, C.; Weiss, P. Tableau de la Valeur Alimentaire des Fourrages. Et. 42: Versailles INRA-SEI; INRA: Paris, France, 1970. [Google Scholar]
  36. Naga, M.A.; El-Shazly, K. The prediction of the nutritive value of animal feeds from chemical analysis. J. Agric. Sci. 1971, 77, 25–31. [Google Scholar] [CrossRef]
  37. NRC. Nutrient Requirements of Domestic Animals: Nutrient Requirement of Beef Cattle, 6th ed.; National Research Council No. 5; National Academic Sciences: Washington, DC, USA, 1984. [Google Scholar]
  38. Garrett, W.N. Energy utilization of growing cattle as determined in seventy-two comparative laughter experiments. In Energy Metabolism; No. 26; Mount, L.E., Ed.; EAAP Publication: London, UK, 1980. [Google Scholar]
  39. SPSS. IBM SPSS Statistics Version 21.0. Copyright of IBM and Other(s) 1989–2012; SPSS: Chicago, IL, USA, 2012. [Google Scholar]
  40. Galal, T.M.; Gharib, F.A.; Ghazi, S.M.; Mansour, K.H. Metal uptake capability of Cyperus articulatus L. and its role in mitigating heavy metals from contaminated wetlands. Environ. Sci. Pollut. Res. 2017, 24, 21636–21648. [Google Scholar] [CrossRef]
  41. Galal, T.M.; Gharib, F.A.; Al-Yasi, H.M.; Mansour, K.H.; Hassan, M.M. Evaluation of the nutrient status and forage quality of the hippo grass (Vossia cuspidata (Roxb.) Griff.) along Ismailia canal, Egypt. J. Freshw. Ecol. 2021, 36, 63–76. [Google Scholar] [CrossRef]
  42. Wu, N.; Liu, S.; Zhang, G.; Zhang, H. Anthropogenic impacts on nutrient variability in the lower Yellow River. Sci. Total Environ. 2021, 755, 142488. [Google Scholar] [CrossRef] [PubMed]
  43. Galal, T.M.; Abu Alhmad, M.F.; Al-Yasi, H.M. Nutrient sequestration potential of water primrose Ludwigia stolinefera (Guill. & Perr.) PH Raven: A strategy for restoring wetland eutrophication. Saudi J. Biol. Sci. 2021, 28, 2438–2446. [Google Scholar] [PubMed]
  44. Saleh, H.M.; Aglan, R.F.; Mahmoud, H.H. Ludwigia stolonifera for remediation of toxic metals from simulated wastewater. Chem. Ecol. 2019, 35, 164–178. [Google Scholar] [CrossRef]
  45. Galal, T.M.; Shehata, H.S. Growth and nutrients accumulation potentials of giant reed (Arundo donax L.) in different habitats in Egypt. Int. J. Phytoremediation 2016, 18, 1221–1230. [Google Scholar] [CrossRef] [PubMed]
  46. Eid, E.M.; Shaltout, K.H.; El-Sheikh, M.A.; Asaeda, T. Seasonal courses of nutrients and heavy metals in water, sediment and above- and below-ground Typha domingensis biomass in Lake Burullus (Egypt): Perspective for phytoremediation. Flora 2012, 207, 783–794. [Google Scholar] [CrossRef]
  47. Soda, S.; Hamada, T.; Yamaoka, Y.; Ike, M.; Nakazato, H.; Saeki, Y.; Kasamatsu, T.; Sakurai, Y. Constructed wetlands for advanced treatment of wastewater with a complex matrix from a metal-processing plant: Bioconcentration and translocation factors of various metals in Acorus gramineus and Cyperus alternifolius. Ecol. Eng. 2012, 39, 63–70. [Google Scholar] [CrossRef]
  48. Caselles-osorio, A.; Vega, H.; Camilo, J.; Casierra-martínez, H.A.; Euliser, J. Horizontal subsurface-flow constructed wetland removal efficiency using Cyperus articulatus L. Ecol. Eng. 2017, 99, 479–485. [Google Scholar] [CrossRef]
  49. Klaus, V.H.; Kleinebecker, T.; Hölzel, N.; Blüthgen, N.; Boch, S.; Müller, J.; Socherc, S.A.; Prati, D.; Fischer, M. Nutrient concentrations and fiber contents of plant community biomass reflect species richness patterns along a broad range of land-use intensities among agricultural grasslands. Perspect. Plant Ecol. Evol. Syst. 2011, 13, 287–295. [Google Scholar] [CrossRef]
  50. Vymazal, J.; Richardson, C.J. The relationship between soil, water nutrients and biomass of Cladium jamaicense and Typha domingensis in the northern Everglades. In Wetlands—Nutrients, Metals and Mass Cycling; Vymazal, J., Ed.; Backhuys Publishers: Leiden, The Netherlands, 2003; pp. 107–127. [Google Scholar]
  51. Zhao, Y.; Xia, X.; Yang, Z. Growth and nutrient accumulation of Phragmites australis in relation to water level variation and nutrient loadings in a shallow lake. J. Environ. Sci. 2013, 25, 16–25. [Google Scholar] [CrossRef]
  52. Vymazal, J. Nitrogen removal in constructed wetlands with horizontal sub-surface flow—Can we determine the key process? In Nutrient Cycling and Retention in Natural and Constructed Wetlands; Vymazal, J., Ed.; Backhuys Publishers: Leiden, The Netherlands, 1999; pp. 1–17. [Google Scholar]
  53. Kasak, K.; Valach, A.C.; Rey-Sanchez, C.; Kill, K.; Shortt, R.; Liu, J.; Dronova, I.; Mander, Ü.; Szutu, D.; Verfaillie, J.; et al. Experimental harvesting of wetland plants to evaluate trade-offs between reducing methane emissions and removing nutrients accumulated to the biomass in constructed wetlands. Sci. Total Environ. 2020, 715, 136960. [Google Scholar] [CrossRef]
  54. Mulderij, G.; Mau, B.; Domis, L.N.; Smolders, A.J.P.; Van Donk, E. Interaction between the macrophyte Stratiotes aloides and filamentous algae: Does it indicate allelopathy? Aquat. Ecol. 2009, 43, 305–312. [Google Scholar] [CrossRef] [Green Version]
  55. Chauhan, T.R.; Gill, R.S.; Ichhponani, J.S. Nutritive value of berseem and cluster bean forages. Indian J. Anim. Sci. 1980, 50, 1052–1055. [Google Scholar]
  56. El-Kady, H. Seasonal variation in phytomass and nutrient status of Phragmites australis along the water courses in the Middle Delta region. Taeckholmia 2002, 20, 123–138. [Google Scholar] [CrossRef]
  57. Shoukry, M.M. An actual vision about the availability of the utilization of water hyacinth in feeding ruminants. In Proceedings of the National Symposium on Water Hyacinth, Assiut University, Assiut, Egypt, 25–26 February 1992; pp. 75–92. [Google Scholar]
  58. El-Beheiry, M.A. Nutritive evaluation of two Acacia populations in Southwestern Saudi Arabia. J. Appl. Sci. Res. 2009, 5, 1030–1039. [Google Scholar]
  59. NRC. Nutrient Requirements of Domestic Animals: Nutrient Requirement of Sheep, 6th ed.; National Research Council Pamphelets No. 5; National Academic Sciences: Washington, DC, USA, 1985. [Google Scholar]
  60. NRC. Nutrient Requirements of Domestic Animals: Nutrient Requirement of Dairy Cattle, 5th ed.; National Research Council: Washington, DC, USA, 1978. [Google Scholar]
  61. NRC. Nutrient Requirements of Domestic Animals: Nutrient Requirement of Goats; National Research Council No. 15; National Academy of Science: Washington, DC, USA, 1981. [Google Scholar]
  62. NRC. Nutrient Requirements of Domestic Animals: Nutrient Requirement of Sheep, 5th ed.; Natlional Research Council: Washington, DC, USA, 1975. [Google Scholar]
  63. Ray, P.; Chattaraj, S.; Bandyopadhyay, S.; Jena, R.K.; Singh, S.K.; Ray, S.K. Shifting cultivation, soil degradation and agricultural land use planning in the Northeastern hill region of India using geo-spatial techniques. Land Degrad. Dev. 2021, 32, 3856–3869. [Google Scholar] [CrossRef]
  64. Kumar, A.; Jigyasu, D.K.; Kumar, A.; Subrahmanyam, G.; Mondal, R.; Shabnam, A.A.; Cabral-Pinto, M.M.S.; Malyan, S.K.; Chaturvedi, A.K.; Gupta, D.K.; et al. Nickel in terrestrial biota: Comprehensive review on contamination, toxicity, tolerance and its remediation approaches. Chemosphere 2021, 275, 129996. [Google Scholar] [CrossRef]
Figure 1. Satellite images of the study area indicating the sampling locations (red star).
Sustainability 14 02823 g001
Figure 2. Seasonal fluctuation (mean ± standard deviation) in some Cyperus alopecuroides growth metrics in polluted versus unpolluted sites. Means with different letters are significantly different at p < 0.05 according to Tukey’s HSD test. *: p < 0.05; ***: p < 0.001.
Sustainability 14 02823 g002
Figure 3. Seasonal fluctuation in the nutrient contents of Cyperus alopecuroides roots (a) and shoots (b) obtained from polluted and unpolluted sites. Vertical bars represent the standard deviation. *: p < 0.05, **: p < 0.01.
Sustainability 14 02823 g003
Figure 4. Seasonal fluctuation in the nutrient content (g/m2) of the above-ground shoots of Cyperus alopecuroides collected from polluted and unpolluted locations. Vertical bars represent standard deviation. tNa = 2.1, tK = 3.8 *, tN = 3.6 *, tCa = 4.2 *, tP = 3.2 *, tMg = 1.3, *: p < 0.05, **: p < 0.01.
Sustainability 14 02823 g004
Table 1. Chemical properties (mean ± standard deviation) of sediment from investigated polluted and unpolluted sites.
VariableWater (mg/L)t-ValueSediment (mg/kg)t-Value
UnpollutedPollutedUnpollutedPolluted
pH6.1 ± 0.87.4 ± 0.82.7 *7.3 ± 0.45.4 ± 0.82.6 *
EC (µS/cm)242.3 ± 10.2456.6 ± 9.65.8 **372.7 ± 32.7476.4 ± 24.62.8 *
CO3364.3 ± 63.6401.1 ± 54.61.1254.2 ± 2.2392.0 ± 5.83.1 *
HCO3396.2 ± 18.4408.1 ± 21.41.2241.9 ± 21.7396.5 ± 13.13.4 *
SO478.1 ± 9.9106.1 ± 15.62.5 *251.3 ± 9.8350.0 ± 8.13.6 *
N31.2 ± 6.452.2 ± 6.72.6 *132.4 ± 12.3221.3 ± 12.84.7 **
P183.4 ± 32.1424.1 ± 31.56.2 **81.8 ± 2.192.9 ± 6.12.6 *
Na48.6 ± 7.394.2 ± 11.23.4 *142.7 ± 6.2213.5 ± 6.72.8 *
K211.7 ± 21.4221.3 ± 43.61.1124.6 ± 6.9143.8 ± 10.84.2 **
Cl14.2 ± 2.420.2 ± 3.62.6 *156.2 ± 11.2221.3 ± 12.24.6 **
t-values represent Paired-sample t-test; *: p < 0.05, **: p < 0.01.
Table 2. Seasonal fluctuation in the organic nutrient concentrations (mean ± standard deviation) of the different organs of Cyperus alopecuroides collected from polluted locations. EE stands for ether extract, CF stands for crude fiber, TP is for total protein, and NFE stands for nitrogen free extract (soluble carbohydrate).
SeasonOrganic Nutrient (%)
EECFAshTPNFE
Polluted locationsSpringR1.1 ± 0.3a34.9 ± 5.5bc7.7 ± 0.6b8.4 ± 0.5a48.0 ± 5.4bc
S0.8 ± 0.1ab42.9 ± 8.2b7.8 ± 1.2b5.7 ± 0.4b42.8 ± 7.2bc
SummerR0.4 ± 0.1d7.9 ± 2.8e11.2 ± 1.3a7.3 ± 1.6ab73.1 ± 14.4a
S0.7 ± 0.1b50.7 ± 2.2ab8.7 ± 0.8ab5.5 ± 0.3b34.4 ± 2.7bc
AutumnR0.7 ± 0.1b16.8 ± 4.5de11.3 ± 1.2a6.4 ± 0.7ab64.8 ± 15.1ab
S0.6 ± 0.2bc38.6 ± 13.3bc9.8 ± 1.1ab6.7 ± 0.5ab44.3 ± 2.0bc
WinterR0.5 ± 0.1c20.3 ± 7.2d9.7 ± 0.6ab8.8 ± 2.4a60.7 ± 11.3b
S0.8 ± 0.3ab55.4 ± 7.8a9.5 ± 0.8ab5.4 ± 0.3b28.9 ± 7.8c
F-value3.2 **2.6 *2.7 *3.3 **2.6 *
F-values represent one-way ANOVA; means in the same column followed by different letters are significantly different at p < 0.05 according to Tukey’s HSD test; *: p < 0.05; **: p < 0.01; R: root system; S: shoot system.
Table 3. Average inorganic nutrients concentration (mean ± standard deviation) of the different organs of Cyperus alopecuroides collected from polluted (P) and unpolluted (U) locations. EE stands for ether extract, CF stands for crude fiber, TP is for total protein, and NFE stands for nitrogen free extract (soluble carbohydrate).
Organic NutrientRoot Systemt-ValueShoot Systemt-Value
PUPU
EE0.7 ± 0.30.5 ± 0.11.20.7 ± 0.10.7 ± 0.10.1
CF20.0 ± 11.234.3 ± 9.94.1 *46.9 ± 7.540.5 ± 7.12.4 *
Ash10.1 ± 1.710.9 ± 1.61.19.2 ± 0.910.1 ± 1.80.8
TP7.7 ± 1.14.2 ± 1.12.6 *5.8 ± 0.66.6 ± 0.81.4
NFE61.6 ± 10.550.2 ± 11.22.7 *37.6 ± 7.342.1 ± 2.63.1 *
t-values represent Paired-sample t-test; *: p < 0.05.
Table 4. Seasonal variation in the nutritive value (mean ± standard deviation) of Cyperus alopecuroides grown in polluted and unpolluted locations. DCP: digestible crude protein, TDN: total digestible nutrients, DE: digestible energy, ME: metabolized energy, NE: net energy and GE: gross energy.
SeasonNutritive Value
DCPTDNDEMENEGE
%Mcal/kg
Polluted canalsSpringR4.3 ± 0.5a57.1 ± 11.3c2.5 ± 0.1b2.1 ± 0.1bc1.0 ± 0.1bc418.7 ± 36.2ab
S1.8 ± 0.4b58.8 ± 13.6ab2.2 ± 0.2bc1.8 ± 0.2bc0.9 ± 0.1bc418.1 ± 29.9ab
SummerR3.3 ± 1.3a57.5 ± 11.1c3.3 ± 0.9a2.7 ± 0.5a1.3 ± 0.2a379.1 ± 13.7c
S1.6 ± 0.3b58.8 ± 12.2ab2.0 ± 0.c1.7 ± 1.1bc0.8 ± 0.1bc419.5 ± 12.8ab
AutumnR2.4 ± 0.6ab58.3 ± 13.4ab2.9 ± 0.6ab2.4 ± 0.9ab1.2 ± 0.3ab384.8 ± 13.8abc
S2.7 ± 0.4ab58.0 ± 4.7ab2.2 ± 0.4bc1.8 ± 0.6bc0.9 ± 0.1bc407.4 ± 17.2ab
WinterR4.7 ± 2.2a56.3 ± 11.8c2.8 ± 0.9ab2.3 ± 0.4b1.1 ± 0.3b396.7 ± 15.3ab
S1.5 ± 0.2b59.2 ± 12.5a1.9 ± 0.4cbc1.6 ± 0.7c0.8 ± 0.1c420.0 ± 27.6a
F-value3.3 **3.4 **2.8 **2.8 **2.7 *3.1 **
F-values represent one-way ANOVA; means in the same column followed by different letters are significantly different at p < 0.05 according to Tukey’s HSD test; *: p < 0.05; **: p < 0.01; R: root system; S: shoot system.
Table 5. Average nutritional value (mean ± standard deviation) of Cyperus alopecuroides organs cultivated in polluted (P) and unpolluted (U) environments. DCP stands for digestible crude protein, TDN stands for total digestible nutrients, DE stands for digestible energy, ME stands for metabolized energy, NE stands for net energy, and GE stands for gross energy.
Nutritive ValueRoot Systemt-ValueShoot Systemt-Value
PUPU
DCP (%)3.7 ± 1.10.4 ± 0.13.4 *1.9 ± 0.52.6 ± 0.82.6 *
TDN (%)57.3 ± 8.259.7 ± 6.31.458.6 ± 5.658.1 ± 5.60.2
DE (Mcal/kg)2.9 ± 0.32.3 ± 0.31.82.1 ± 0.72.2 ± 0.10.5
ME (Mcal/kg)2.3 ± 0.31.9 ± 0.32.5 *1.7 ± 0.11.8 ± 0.10.3
NE (Mcal/kg)1.2 ± 0.30.9 ± 0.13.1 *0.9 ± 0.20.9 ± 0.10.1
GE (Mcal/kg)394.8 ± 17.5395.3 ± 99.21.3416.3 ± 25.9407.8 ± 20.91.1
t-values represent Paired-sample t-test; *: p < 0.05.
Publisher’s Note: MDPI stays neutral with regard to jurisdictional claims in published maps and institutional affiliations.

