Article

The Relationship between Circular Economy, Industry 4.0 and Supply Chain Performance: A Combined ISM/Fuzzy MICMAC Approach

by
Moacir Godinho Filho
1,2,*,
Luiza Monteiro
2,
Renata de Oliveira Mota
2,
Jessica dos Santos Leite Gonella
2 and
Lucila Maria de Souza Campos
3
1
Department of Supply Chain Management and Decision Sciences, EM Normandie Business School, 76600 Le Havre, France
2
Department of Production Engineering, Federal University of São Carlos, São Carlos 13565-905, Brazil
3
Department of Production Engineering, Federal University of Santa Catarina, Florianópolis 88040-900, Brazil
*
Author to whom correspondence should be addressed.
Sustainability 2022, 14(5), 2772; https://doi.org/10.3390/su14052772
Submission received: 29 December 2021 / Revised: 22 February 2022 / Accepted: 22 February 2022 / Published: 26 February 2022
(This article belongs to the Special Issue Cleaner Production Practices and Sustainable Development)

Abstract

:
This paper aims to assess the relationship between Industry 4.0 (I4.0) and the circular economy that could contribute to supply chain management performance. To achieve this, a combination of the interpretative structural modelling (ISM) and (cross-impact matrix multiplication applied to classification) MICMAC approach was used to establish the interrelationships between these topics. The developed analysis reveals that there are 19 constructs capable of elucidating this relationship and that there is a hierarchy between these constructs, which are presented in a structural model. Further, the different levels of dependency and driving power are compared in a cluster diagram. As the main result, it was found that there is a strong mutual relationship between the basic technologies. The use of Internet of Things and cloud computing technologies influences the collection of large amounts of data, leading to big data, which in turn influence the use of data analytics tools to obtain competitive advantages. These outcomes may contribute to managers’ more assertive decision-making regarding the selection, implementation, and evaluation of projects adopting Industry 4.0 technologies and circular economy approaches in supply chains. Moreover, our study could be the basis for future empirical research to investigate how companies incorporate Industry 4.0 technologies into their processes and how this influences the quest for sustainable supply chains.

1. Introduction

The vertical disintegration of companies has increased the complexity of management in terms of time and quality and increased uncertainty in the markets, making it impossible today for companies to compete effectively if they are isolated from their suppliers and other stakeholders [1,2]. In this context, adopting the concept of supply chains (SCs) is increasingly essential for a company’s performance. Moreover, two themes are being increasingly discussed in the context of SCs, the circular economy (CE) and Industry 4.0 (I4.0) [3]. The CE paradigm consists of a possible way to achieve environmental objectives and economic sustainability by developing systemic changes that go beyond the individual company and involve the other actors in the SC, contributing to adding value to a product and/or service [4,5]. On the other hand, I4.0 refers to an industrial revolution based on the deployment of automation technologies and information and communication technologies, which can be helpful to meet current SC needs, such as flexibility, increased productivity, reducing waste, resource optimisation, and more sustainable production processes [2]. Consequently, the CE can be used to minimise resource usage and decrease waste generation in a high-tech manufacturing environment, integrating sustainable resource management and transforming SCs in the I4.0 [6,7].
Previous research has assessed the relationship between these themes. For example, some researchers have linked the CE to I4.0 [7,8], while others have linked, separately, the implementation of I4.0 or the CE to SC performance [1,2,9,10,11]. However, a systematic analysis from the perspective of experts concerning the relationship between these three topics is still missing. Many articles do not provide insight into the realization of initiatives to introduce Sustainable Industry 4.0 in the supply chain context. Our paper uses combined Interpretive structural modelling (ISM) and the MICMAC approach was used as a systematic methodology to establish the interrelationships between these topics. However, there is still a lack of studies that analyse this relationship more deeply, to create a consensus between the relationships between the different strategies of I4.0 and CE in the supply chain [12,13]. To clarify our research gap, Table 1 was developed to contrast the research gap with the studies already published.
This study aims to identify the relationship between I4.0 technologies and the CE and present the effect of adopting both approaches concerning SC performance. Then, this research is an attempt to fill this gap and aims to answer the two research questions: (1) what are the relationships between I4.0 technologies and the CE? (2) What is the potential effect of these constructs on SC performance? As a starting point, a systematic literature review (SLR) was developed, resulting in 19 constructs. Subsequently, the interactions between these constructs and the strength of the driving and dependence power of this relationship were proposed using a combined interpretive structural modelling (ISM) and fuzzy MICMAC (Matrice d’Impacts Croisés Multiplication Appliqués à un Classement (cross-impact matrix multiplication applied to classification) analysis.
The discussion on sustainable development and the CE has been highlighted worldwide since the 1980s, recognising that natural resources are limited and are suffering significant and irreversible damage from human activity [4]. This new perspective has created pressure from several stakeholders (consumers, investors, governments, etc.) for companies to reduce their negative impact on the environment [4]. Therefore, organisations have been working on improving their environmental performance to obtain competitive advantages (such as increased market share and product differentiation) capable of improving financial performance without significantly increasing (or even reducing) costs [13]. At the same time, I4.0 has been impacting the development of the global industry as it has been providing solutions for computerisation and digitalisation. In other words, the CE and I4.0 are seen as having the potential to increase the efficiency and competitiveness of organisations and, consequently, to offer performance improvements for SCs. Sustainable development depends on its relationship with technological development [15]. The I4.0, through technological pillars, has the potential for transition to CE, by maximizing the use of available resources and minimizing waste and emission [2,16].
The present study with the multi-method approach enables relevant propositions to be made regarding the intersection between these three themes and also provides researchers, managers, and policymakers with a much more efficient roadmap for technological and environmental actions capable of improving the performance of organisations and SCs. The structure of this paper is as follows. Section 2 presents the conceptual background that supports this research. Section 3 details the research method. Section 4 presents the results. Section 5 discusses the results and Section 6 presents the conclusions and implications of the study.

2. Theoretical Background

Although much work has been done on sustainable SCs, the relationship between the CE and SCs still needs to be explored, especially to identify the methods and tools that need to be adopted across the SC to support efficient CE adoption, enabling a “complete” transition from a linear to a circular SC due to its increased complexity [5]. In this context, I4.0 technologies can be of great value [2,7]. Some proposals for relationships between these two approaches can be found in the literature, with ReSOLVE [16] being one of the most cited methods. However, empirical studies are scarce, resulting in the effect of this relationship on companies’ performance, especially in the SC, is poorly studied. It is this gap that the present study aims to address. The intersection literature between these areas is presented below.

2.1. The Importance of the CE and I4.0 for SC Performance

Population growth linked to economic and technological development has led to changes in the types of production and consumption, making SCs increasingly dependent and unsustainable [4]. Growing market competitiveness, environmental changes, public pressure, and environmental legislation have generated the need for organizations to change their production systems’ operations to ensure the coexistence of industrial development and environmental protection [17]. For these changes to occur, it is necessary to redefine the basic structure of SCs to include environmental issues [18]. As recommended by the CE literature [5], the first step of this change is to migrate from a linear SC to a closed-loop one. When SCs extend environmental concerns to their operations, they are characterized as a circular supply chain (CSC) [6]. According to Srivastava [19] (p. 54), circular supply chain management (CSCM) can be defined as “the integration of environmental thinking with supply chain management, including product design, material selection and supply, manufacturing processes, delivery of the final product to consumers and the management of the entire product life cycle, even after the end of its useful life”.
The adoption of the CSCM requires a paradigm shift [13,19]. Specifically, organisations need to stop seeing environmental issues as external restrictions that impose limits, increase the costs of their operation, and reduce their competitiveness [20] and start instead to see them as an opportunity to generate economic and financial gains [19], thus improving their performance [13]. To achieve this, several practices need to be adopted, including: circular projects; designing products and operations in the SC taking into account environmental protection and health throughout the product’s life cycle; reverse logistics (planning and controlling the flow of raw materials, inventories, and products from the point of consumption to the point of origin to recapture value or ensure proper disposal); recycling and remanufacturing operations; the recovery, reuse, and reforming of products and packaging; waste management and minimisation; and the substitution of hazardous materials or processes with less problematic ones [21].
The SC involves coordinating, planning, and controlling products and services through integrated activities between suppliers and customers. However, despite being connected, many of these activities are carried out independently by each member organisation of the chain [22]. Thus, the results obtained in the traditional SC structure are no longer sufficient and do not match current technological developments [22]. In this context, the concept of the integration and digitisation of the SC emerges to add value, strengthen the competitive potential of organisations, and improve the corporate performance of intra-organisational and inter-organisational processes [23].
A digitised SC is an intelligent system of networks, hardware, and software that requires a massive amount of data, as well as cooperation and communication, to support and synchronise interaction between organisations to provide higher value and more accessible services based on agility, consistency, and effectiveness [3]. Several technologies and innovative solutions are used for digitising and integrating of SCs, including I4.0 technologies [22,24], such as: flexible and digitally integrated production systems; inter-organisational information integration, synchronisation and communication systems; worker support technologies; the Internet of Things (IoT); cloud computing; big data; and data analytics. Further, as Vacchi et al. [7] (p. 1) stated, “Industry 4.0 pushes manufacturing industries to make their processes minimise waste: this transition to efficiency links Industry 4.0 with the goals of the circular economy”. Therefore, there is an opportunity to investigate the relationship between these three themes.

2.2. The Literature Regarding the Relationship between the CE and I4.0 and Its Effect on SC Performance
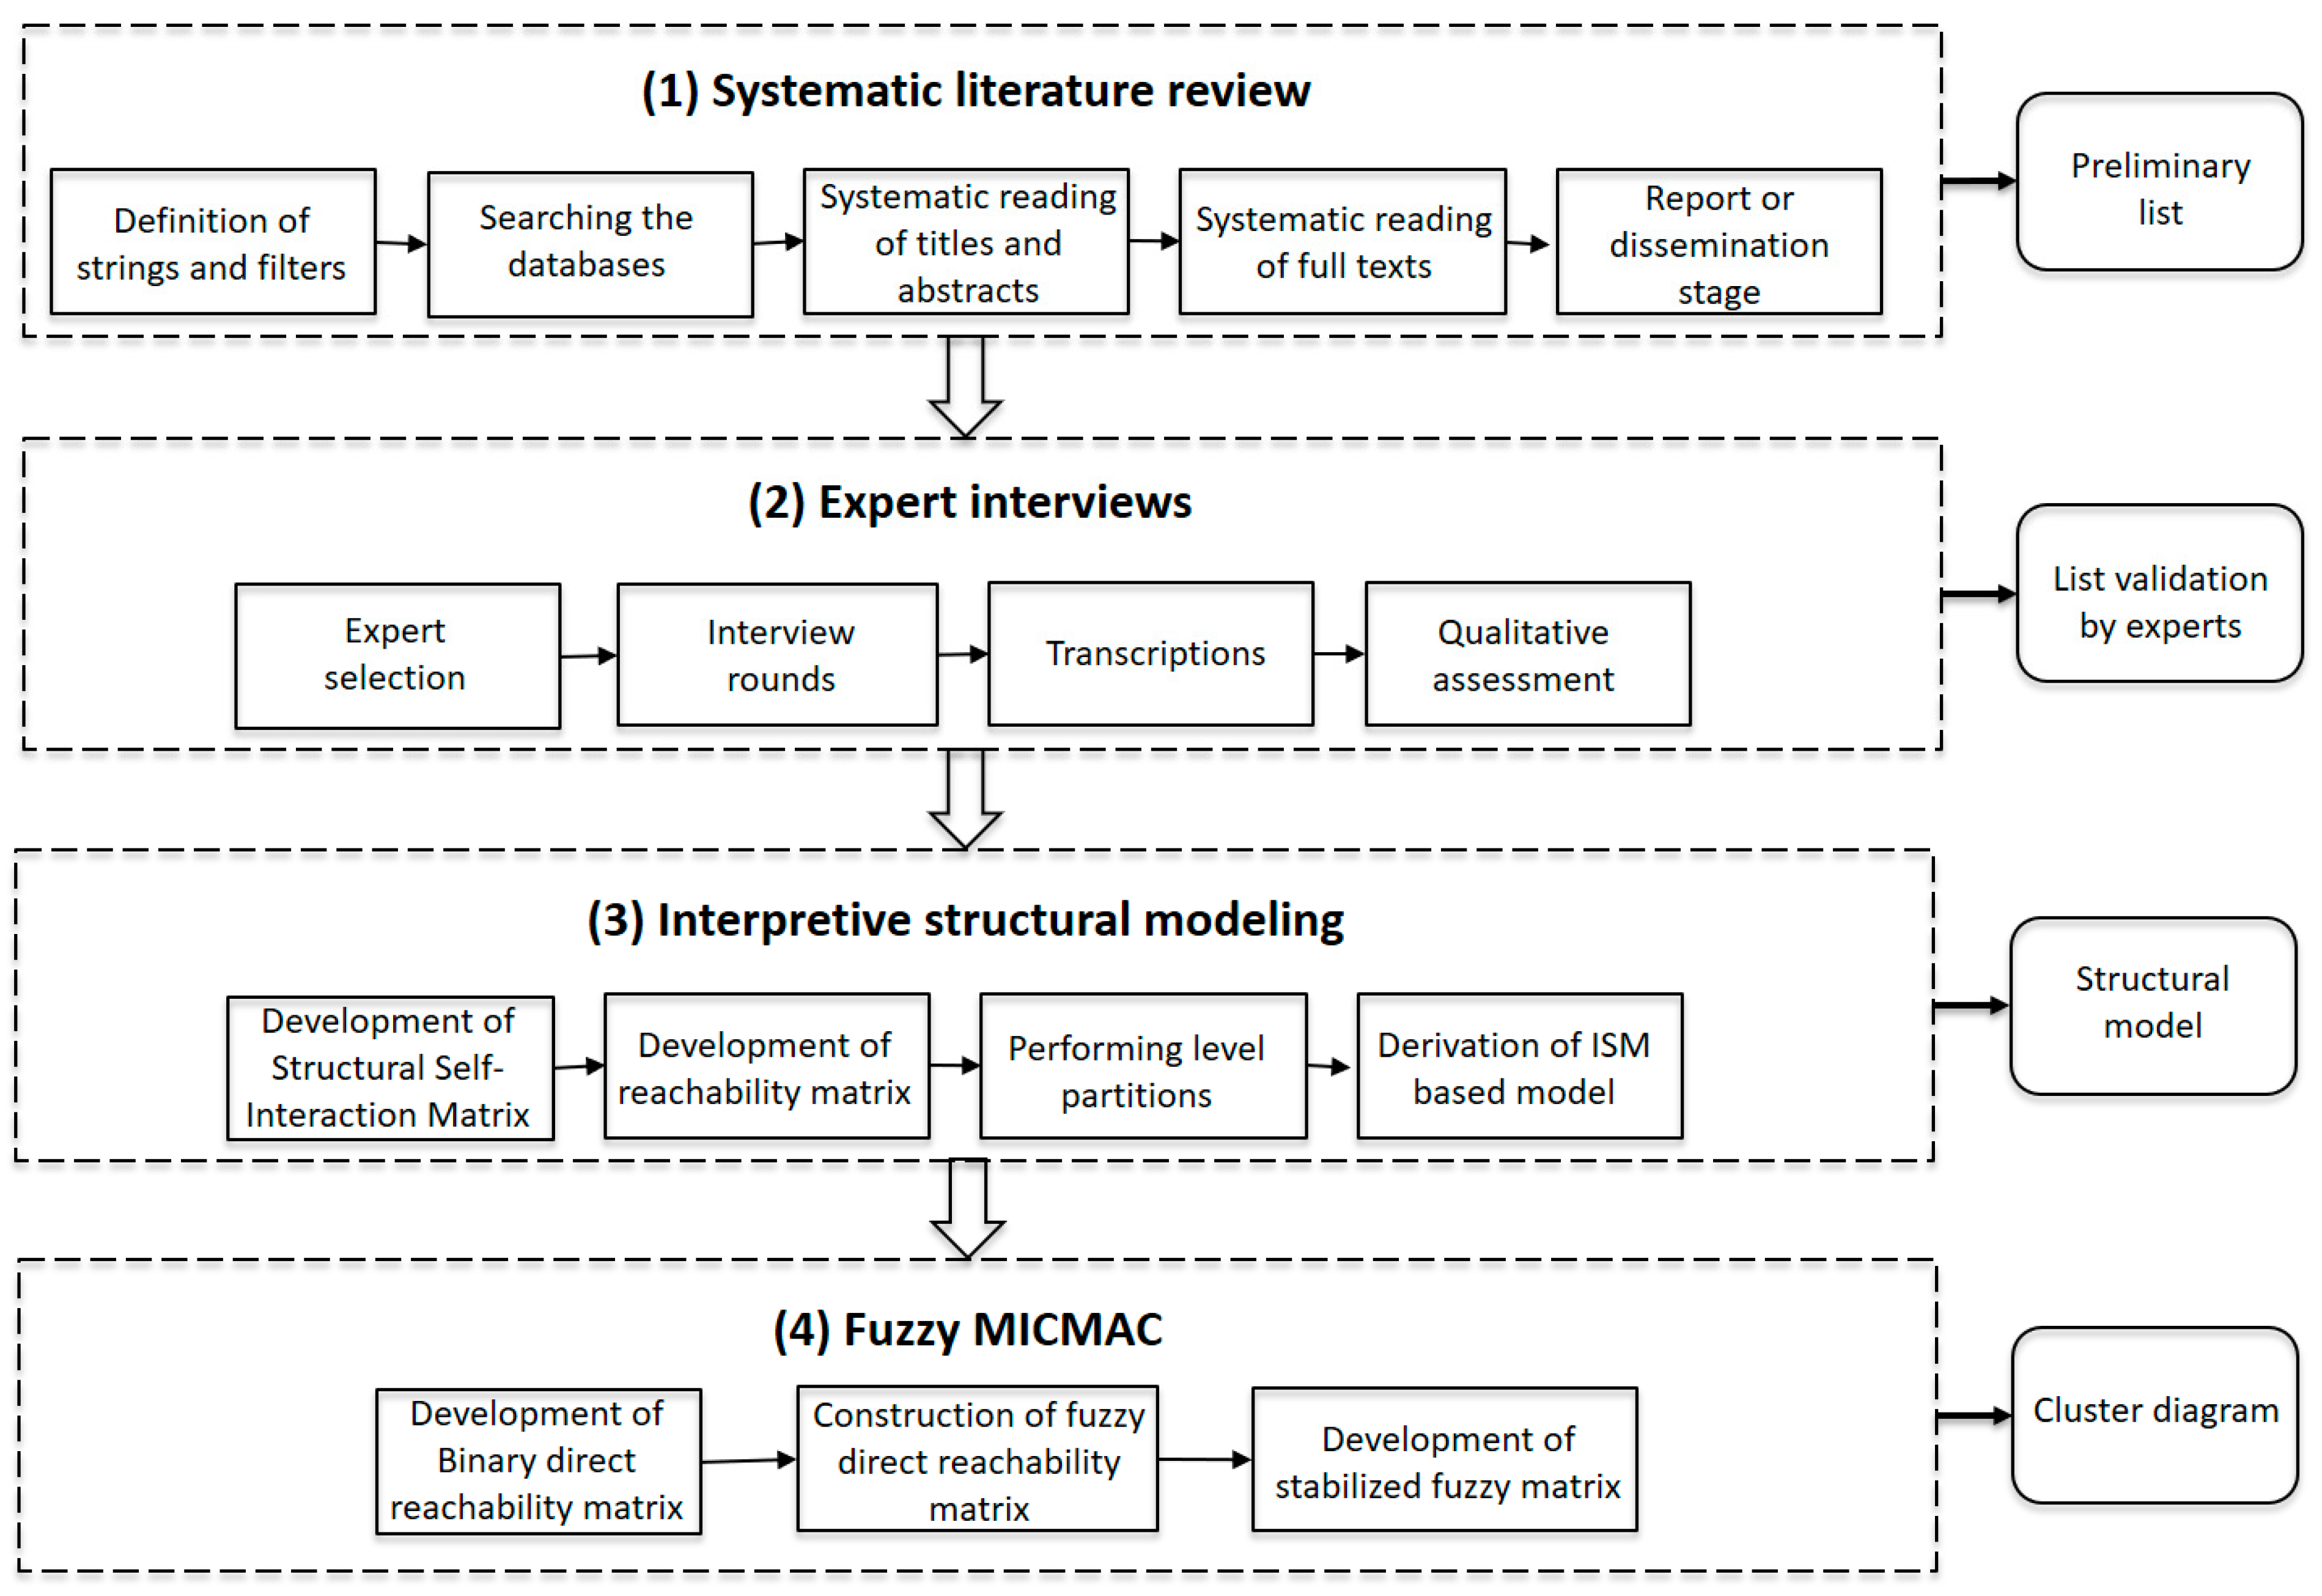
The need to optimise SCs due to the competitive pressures of the market promotes and encourages the adoption of I4.0 technologies in parallel with CE approaches [16]. According to Rajput [25], the CE integration with I4.0 is a way to achieve sustainability, as it reduces barriers such as lack of information regarding the life cycle of products and uncertainty about the return on investments [26]. For example, as Tiwari [8] (p. 2) stated, “the advent and adoption of digital technologies based on the principles of Industry 4.0 may help to overcome the barriers to the adoption of CE”. In other words, if organisations want to maintain and strengthen their competitive potential, they need to embrace technological and environmental changes together [12]. In this context, Jabbour et al. [16] proposed the relationship between the CE business actions and I4.0 technologies (Table 2).
More recently, some studies have simultaneously addressed all these three themes Laskurain-Iturbe et al. [12] showed evidence of the potential impacts of additive manufacturing and robotics by integrating industry 4.0 and the CE. Rajput and Singh [25] used DEMATEL to identify enablers and barriers to the relationship between these topics. Dev et al. [27] simulated a reverse logistics model to propose a roadmap for the joint implementation of I4.0 principles using the ReSOLVE model. Further, Yadav et al. [28] developed a framework to overcome challenges in SCs through solutions based on I4.0 and the CE, subsequently validating it through a case study in the automotive industry. Various researchers have used other perspectives to examine this relationship [29,30]. Although the theme’s relevance in the literature has been highlighted, no research was identified in the SLR assessing the relationship between the themes systematically from the perspective of experts, which is the primary goal of the present study.

3. Research Method

This research aims to identify the relationships between I4.0 technologies, CE approaches, and SC performance. For this, the ISM approach was chosen to identify and classify relationships between variables [10]. This methodology involves four steps [10,31,32]: (1) identification of elements that relate the three research topics through a systematic literature review (SLR), and this generated a preliminary list; (2) data collection through expert interviews to validate this list from an empirical perspective; (3) elaboration of the structural model; and (4) fuzzy MICMAC development with a cluster diagram showed the elements driver and dependence power. The following subsections describe these steps, as summarised in Figure 1.

3.1. Systematic Literature Review

An SLR was developed to understand the main definitions and constructs of the themes under analysis. For this, the filtering procedure proposed by Denyer and Transfield [33] and content analysis technique was used. This method consists of three main steps: planning, conducting and reporting. In the planning, the frameworks described in the literature that characterise elements regarding the CE, I4.0, and SC management (SCM) were selected. To select the most relevant journals in each area studied, the Scimago Journal & Country Rank (SJCR) was used. Those journals containing the terms: “economic”; “circular”; “ecological”; “environmental”; “sustainable”; and “cleaner”, which were considered suitable for the study of CE, while the terms “technology”, “industrial”, “production”, “operation(s)”, and “manufacturing” were considered suitable for the study of I4.0; finally, those with the terms “management”, production”, “operation(s)”, “supply chain”, “manufacturing”, “industrial”, and “organisation” were considered appropriate for the study of SCM. Only those in quartile 1 (Q1) or quartile (Q2) were selected, resulting in a universe of 42 journals. Of these, 24% belong to Elsevier BV, 14% to Taylor & Francis, 14% to John Wiley & Sons Inc., 6% to the Institute for Operations Research and the Management, 7% to Springer and 5% to Emerald Group Publishing Ltd. The remaining 29% belong to other publishers as shown in Table 3.
The following keyword phrases were used to search for papers: “Circular economy literature review”, “Industry 4.0 review” and “supply chain management systematic review”. In the conducting step, the papers found were evaluated and selected according to their adherence to the objectives of this study. Thus, papers focused on a specific study area (circular economy development, for example) or a specific geographic region were discarded, along with those dealing with the themes more broadly. Therefore, the screening process was developed, which consisted of a systematic reading of titles and abstracts using the inclusion and exclusion criteria and a sample of 42 documents was included in the revision and reported.

3.2. Expert Interviews

Refinements with experts were performed to validate the list of elements identified in the SLR from a perspective of integration between research topics. Rounds of semi-structured interviews were conducted, and this data collection was discontinued after theoretical saturation appeared to have been reached; that is, new insights into the phenomena being examined were no longer obtained. However, the greater the group’s heterogeneity (the difference in the social and professional background of the specialists), the smaller the number of participants recommended [32]. One way to increase the group’s heterogeneity is to select experts from academia (represented by the letter A) and practice (represented by the letter P) [31,34]. Therefore, the authors of the present paper ensured a 50/50 distribution among academic experts and practitioners to increase the heterogeneity of the group of specialists. The experts contacted in this research were selected based on their knowledge, skills, and experience in the CE, I4.0, and SCs. The choice of practitioners was due to their occupying top management positions, and their being involved in different areas related to the research topics, which would provide a broad view and knowledge of sustainable supply chains. As for academic specialists, the basic requirements were to present academic projects and publications related to the themes in recent years. This knowledge was necessary for this study to eliminate those whose history was not relevant from a sustainable perspective.
There is no consensus in the literature regarding the number of experts to be consulted for satisfactory execution of the method [35]; it was decided to select at least eight experts, as this is the average used in recent SC papers as shown in Table 4.
In this study, 36 experts were initially contacted via e-mail or telephone and are part of important networks of projects on these themes in the country of analysis. Of these, 14 experts completed the questionnaire, including filling in structural self-interaction matrix (SSIM) matrices. Once the questionnaires had been collected, data analysis was initiated using the ISM methodology. The profile of the 14 experts is shown in Table 5.
The interview procedure was developed in three stages: contextualization, individual analysis, and relationship analysis. In this context, the objective of the interview was highlighted, highlighting the specific application integrating the three research topics. The preliminary list was presented, and the interviewee was asked about their experiences with the themes and their general perceptions about the elements presented. In the individual analysis, the interviewee answered whether they agreed with the influence of each of the elements. The answer to that question would launch a discussion that would or would not lead to a change in the preliminary list. Therefore, the expert was also asked about the need to add another element to the list. Finally, in the relationship analysis, each interviewee was asked about possible interactions between elements. In this step, a structural self-interaction matrix (SSIM) was completed. All interviews were audio-recorded and transcribed, and these matrices were filled in for further analysis.

3.3. Interpretative Structural Modelling Methodology

The methodological steps followed in this stage were proposed by Muruganantham et al. (2016). From the data collected in the expert interviews, the direct relationship between the variables can be analysed by constructing an SSIM. This matrix uses four symbols to identify the direction of the relationship between the variables:
  • V: element i leads to/facilitates element j.
  • A: element j leads to/facilitates element i.
  • X: elements i and j are mutually interdependent.
  • O: no relationship exists between elements i and j.
The multiple SSIMs (one for each specialist) were collected and combined (on average, for example) to generate the final adjacency matrix. From the adjacency matrix, a reachability matrix was built, which is the basis for building the structural model. This binary matrix translates the adjacency matrix and its symbology (V, A, X, O) into 0 or 1. Thus, the reachability matrix was built in two stages:
  • Converting the adjacent matrix into a binary matrix following these rules:
    • If (i, j) entry in SSIM is V, then (i, j) entry in the reachability matrix becomes 1 and (j, i) entry becomes 0.
    • If (i, j) entry in SSIM is A, then (i, j) entry in the matrix becomes 0 and (j, i) entry becomes 1.
    • If (i, j) entry in SSIM is X, then (i, j) entry in the matrix becomes 1 and (j, i) entry also becomes 1.
    • If (i, j) entry in SSIM is O, then (i, j) entry in the matrix becomes 0 and (j, i) entry also becomes 0.
    • Diagonal elements are assigned 1 if both i and j are the same.
  • Transitivity check: the transitivity in the ISM approach is assessed according to the contextual relationship between the variables based on the following assumption: if variable A is related to variable B and B is related to C, then variable A is necessarily related to C. Thus, the transitivity indicates the indirect relationship between the variables, indicated by 1 in the matrix.
After these two steps, the final reachability matrix can be produced, in which dependence and driving power can be calculated. The dependency power is given by the total of variables that influence a certain variable, indicated in the last line, summing the matrix column. The driving power is given by the total number of variables that a certain variable influences, which is indicated in the last column and the matrix line. The final reachability matrix obtained is then decomposed into different levels, providing the reachable set and the antecedent set for each variable in the matrix. The reachable set of a given variable is composed of the variable itself and the other variables it influences. This set can be written as shown in Equation (1). The antecedent set for a given variable is composed of the variable itself and the other variables that influence it. This set can be written as shown in Equation (2). Finally, the intersection set is constructed using Equation (3):
R(i) = {jS/eij = 1} ∪ {iS}
A(i) = {jS/eji = 1} ∪ {iS}
I(i) = R(i) ∩ A(i)
The variable for which the accessibility and intersection sets are the same becomes the maximum level variable in the ISM hierarchy. After identifying the Level I variable, it is discarded from the set of other variables and the interaction continues until the level of all variables is found. Finally, the model is constructed. An initial diagram is obtained by representing each variable at its respective level, as described in the final reachability matrix. The connections between variables are also shown in the diagram. If there is a relationship between variables i and j, an arrow pointing from i to j is drawn, the transitivity connections are removed, and the diagram is checked to avoid inconsistencies.

3.4. Cross-Impact Matrix Multiplication Applied to Classification Fuzzy

To assess the power of driving and dependence between one variable and another in the ISM model, fuzzy MICMAC analysis was used. This analysis allows the fuzzification of the intensity of the relationship through the frequency of the experts’ responses. For this, the initial reachability matrix is the starting point for identifying and disseminating the direct relationships between variables. To obtain the binary direct reachability matrix, the interactions are referenced in the initial reachability matrix, and all diagonal entries are replaced by zero. The strength of the impacts between elements was described as a qualitative consideration on a scale of 0–1, shown in Table 6, together with the attribution rule used to establish the relationship on a diffuse basis.
In this study, the max–min composition was used to determine the strength of the diffuse indirect relation from element I to j. The matrix multiplication was calculated using the rule described below (to assist this calculation, the MATLAB program was used):
T = U · V = max n   [ min ( x i n ,   y n j ) ]
where U = x i n and V = y n j .
To determine the driving force, all line entries of the possibility of interaction were added, while the addition of column entries provided the dependency power. Subsequently, a cluster diagram was developed with quadrants showing autonomy, dependence, connection, and drive power.

4. Results

A multi-method approach was adopted in this research. Therefore, the application of each method presented a specific result but was complementary to each other. The following will be discussed in this section: (1) preliminary list of constructs; (2) validation by experts; (3) ISM results; and (4) Fuzzy MICMAC results.

4.1. Preliminary and Final List of Constructs

From the SLR, 23 papers were selected to compose the final sample. Subsequently, a content analysis [33] was performed to identify the constructs and their definitions. In this step, excerpts were identified throughout the texts that indicated the main constructs related to SCs, the CE, and I4.0. A preliminary list of 18 constructs was identified. For item validation, the definition of each of the 19 constructs selected in the SLR was submitted for analysis by the 14 experts selected in the present study. Initially, the experts evaluated the definitions of the constructs and proposed the modifications they deemed necessary for the coherence of the research. The final list of 17 constructs is shown in Table 7. After this step, the experts were invited to analyse the relationship between the variables, for which a questionnaire with the SSIM matrix was filled out by each of them (details are provided in Section 4.2).

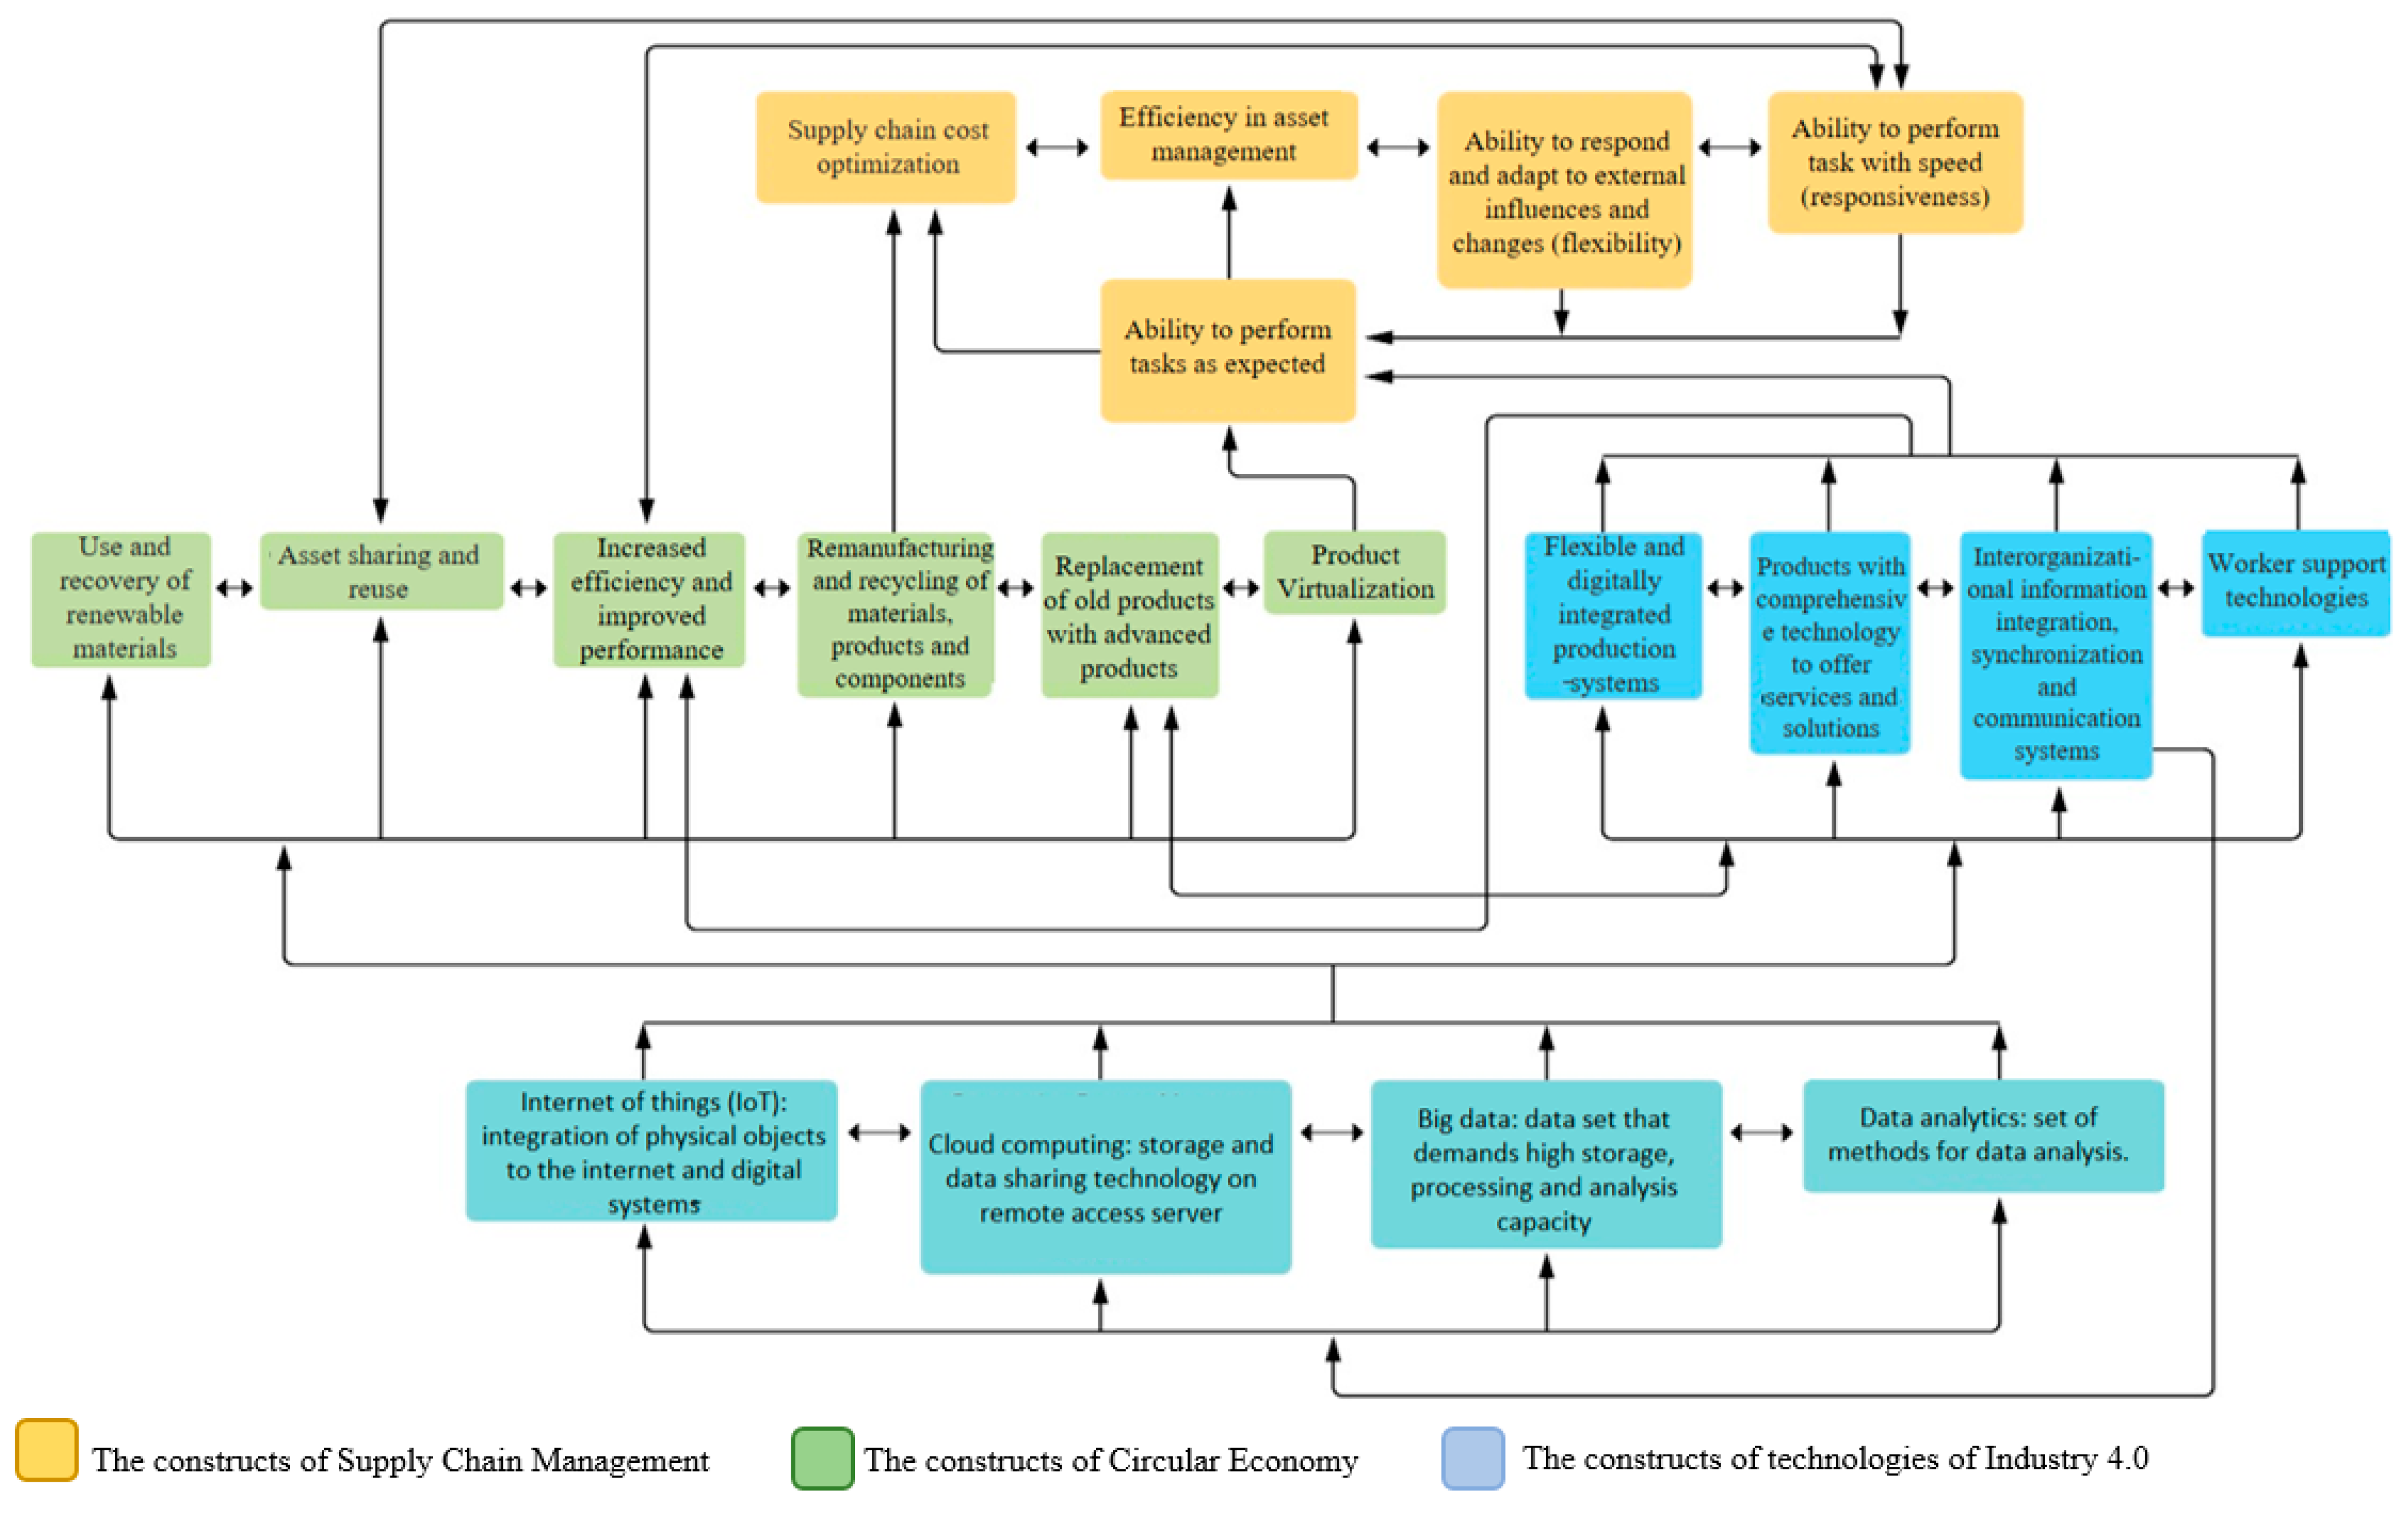
4.2. Interpretative Structural Modelling Results

Fourteen SSIMs were developed, and the unified SSIM is shown in Table 8. The initial reachability matrix developed is shown in Table 9, and the final reachability matrix is shown in Table 10, while the level partition is shown in Table 11. Finally, the conical reachability matrix was constructed based on the rearrangement of the final reachability matrix according to the level of each variable, ordering it from the highest level to the lowest level (Table 12). Responses were assigned different weights according to the number of experts who agreed with that relationship, i.e., a relationship agreement matrix was developed (Table 13). Thus, it was possible to build the structural model from the strongest relationships between directly linked levels (Figure 2).

4.3. MICMAC Results

As the main product of applying the MICMAC approach, Figure 3 shows the cluster diagram that elucidates the driving and dependence powers between the drivers and capabilities studied.

5. Discussion

The ISM model (Figure 2) describes the relationship between the constructs, and it is possible to observe that there is a clear separation of groups: at the top, the constructs of SCM; at the intermediate level, the constructs of the CE and the front-end technologies of I4.0; and, finally, at the base, the basic technologies of I4.0.
Analysing together the ISM model and the cluster diagram (Figure 3) from the MICMAC approach, it is possible to observe that basic I4.0 technologies (I5, I6, I7, I8) appear at the base of the structural model and are also classified as “independent factors” by the MICMAC approach. Therefore, it is possible to discern that these constructs influence all other constructs in the model. In particular, there is a strong mutual relationship between the basic technologies, which is in line with what Frank et al. [37] found. These authors pointed out relationships between basic technologies: the use of IoT and cloud computing technologies influence the collection of large amounts of data, leading to big data, which in turn influences the use of data analytics tools to obtain competitive advantages [37]. Furthermore, I4.0 creates a cyber-physical system that creates flexible production models, with continuous interaction between people, products, and devices during the production process [12]. In this sense, the study of Nascimento et al. [30] showed that I4.0 technologies facilitate the optimization for the implementation of circular strategies such as the use and recovery of renewable material and recycling. The IoT, for example, has allowed companies to be more efficient in the consumption of materials, allowing greater control in production and maintenance processes [30].
In contrast, however, an “inverse” relationship (data analytics for big data in the context of IoT and cloud computing) was found in the model. This result may be due to the experts’ view that it is necessary to have IoT and cloud technologies to use data analytics and big data, thus creating their dependence on them. The base technologies also influence the front-end technologies of I4.0 and the CE approaches, positioned at Level III of the model. The relationship between basic and front-end technologies is in line with that advocated by Frank et al. [37]. According to these authors, the basic technologies provide connectivity, intelligence, and integration with the front-end technologies, thus supporting them [37]. Similarly, Dantas et al. [38] showed the connectivity between the CE and I4.0, which helps them connect with new production models and circular businesses. In the study developed by [30], IoT technology called movement control of workers by sensors to optimize routes and movements was used to optimize the consumption of fossil fuels in the industry I4.0 and the CE are at an early stage, leading to challenges in realising the benefits of this relationship in the future [39]. The mutual influence relationship of basic technologies to CE approaches was also expected. There are many examples of IoT, cloud, big data, and data analytics technologies that influence CE approaches. This relationship between I4.0 and CE technologies facilitates the development of more circular business models [40]. Driving the transition to a more circular economy maximises the use of available resources and minimises waste. Therefore, I4.0 technologies help steer economies towards sustainability [12]. These results come to confirm findings from previous studies such as [41,42]. The high strength of the relationship between base technologies and the ReSOLVE framework is particularly noteworthy. This framework, developed by the Ellen MacArthur Foundation in 2015, proposes the basic principles of circularity and applies them in six actions: regenerate; share; optimise; loop; virtualise; and exchange [43].
According to the Ellen MacArthur Foundation’s definition, big data technologies, remote sensing (linked to cloud technologies), and IoT enable the optimisation of the CE. The strong influence of the basic I4.0 technologies on the key attributes of SCM has received much attention. In this context, Khan and Rundle-Thiele [44] showed that IoT contributes to achieving economic and circular objectives and Modgil et al. [45] showed the relationship between big data and circularity-oriented decision-making. The study of Laskurain-Iturbe [12] identified an influence of Additive Manufacturing, Artificial Intelligence, Artificial Vision, Big Data and Advanced Analytics, Cybersecurity, the IoT Robotics, and Virtual and Augmented Reality technologies on the main action areas covered by the CE. Thus, the results indicate the adoption of the CE through emerging technologies, such as big data. Laskurain-Iturbe [12] showed in their study that big data technology reduced paper consumption by 80% and achieved improvements in energy consumption by increasing the use rate of machines at certain times, avoiding unnecessary use, and reducing consumption caused by switching on and off. Furthermore, operating the lighting through algorithms to convert it into an intelligent system resulted in a 30% energy saving. Although not directly revealed in the model, the relationships between these constructs happen through different transitivity paths.
CE approaches have, to a large extent, a relationship of mutual influence. In particular, the solid mutual relationship between the virtualisation of products and the substitution of old goods by advanced products (with strength 10) stands out. Exceptions to mutual influencing, however, also stand out. Although the virtualisation of products influences the increase in efficiency and the improvement of performance, this does not influence either directly (it does so through transitivity). The same is also true for another pair. The use and recovery of renewable materials favours the increase in efficiency and the improvement of performance (CE3), but the opposite does not happen. Another exception is the absence of a relationship between product virtualisation and remanufacturing and the recycling of materials, products, and components. The absence of a relationship between these constructs thus poses the question of whether, through product virtualisation, it is not possible (or not) to recycle or remanufacture previously used products that have been discarded.
Although CE approaches have little relation to the attribute of reliability (the ability to perform tasks as expected), only product virtualisation and increased efficiency and improved performance lead to reliability. This last link is revealed in the model by transitivity since the strength of the relationship between virtualisation and reliability is stronger. As shown by the key attributes of SCM highlighted at the top of the model, CE approaches have a more significant relationship. In particular, all CE approaches influence SC cost optimisation and efficiency in asset management. Based on the literature, this influence is expected, as pointed out in the study of Diaz-Chao et al. [14], which revealed that CE approaches generate effects on profitability when combined with I4.0 technologies and investment in research and development. Moreover, product virtualisation and replacing old goods with advanced products influence both flexibility and SC responsiveness. These relationships are even more evident in the cluster diagram.
Sharing and reusing assets (CE2) and increasing efficiency and improving performance (CE3) have a relationship of mutual influence with flexibility and responsiveness. The influence of CE2 and CE3 on the key attributes of SCM is established in alignment with the literature. However, the relationship of key attributes influencing CE approaches differs from the view established in the literature. The SC key attributes are seen as performance objectives and, therefore, “ends” of an action and not “means” to achieve other factors. This discrepancy in results may be due to the poor definition of constructs in the questionnaire presented to the experts, thus confusing their apprehension. Product virtualisation (CE5) has a mutually beneficial relationship with cloud computing, big data, and data analytics technologies, as evidenced by Bag et al. [46], who showed that artificial intelligence powered by big data analytics can improve SC performance. The influence of CE5 on basic technologies had not been previously highlighted in the literature; therefore, this is a novel finding of the present work. Combining these technologies allows connections to be made between various production systems and equipment, thus improving manufacturing flexibility, product quality, energy efficiency, and equipment servicing [12].
The front-end technologies revealed at Level III have mutually beneficial relationships, in line with those presented by Frank et al. [36]. According to these authors, the central dimension of I4.0 is that of flexible and digitally integrated production systems (smart manufacturing), and all other dimensions are linked to it. Further, I4.0 front-end technologies meet operational and market needs and are directly associated with the companies’ value chains. Thus, the strong relationship of these technologies with the key attributes of the SC is in line with the framework created by Frank et al. [37].
The I4.0 dimensions are also associated with CE approaches, located on the same level as the ISM model and classified as “linkage factors” in the cluster diagram. Sharing and reusing assets (CE2) and increasing efficiency and improving performance (CE3) are influenced by I4.0 front-end technologies. In particular, the high strength of this last relationship is noteworthy because a positive relationship has been highlighted in the literature. Note that all eight I4.0 elements strongly influence the CE3 construct.
Product virtualisation (CE5) and the replacement of old goods with advanced products (CE6) established a relationship of mutual influence with all dimensions of I4.0 in the model. Moreover, the model indicates that flexible and digitally integrated production systems (I1) and inter-organisational information integration, synchronisation, and communication systems (I3) influence the remanufacturing and recycling of materials, products, and components (CE4) and the use and recovery of renewable materials (CE1), which is also influenced by products with technology aimed at offering services and solutions (I2). The model highlights that I4.0 front-end technologies influence their base technologies, establishing relationships of mutual influencing (linkage factors). This influence of the I4.0 dimensions on base technologies was not expected and had not been pointed out by Frank et al. [36], who argued that base technologies support front-end technologies. Therefore, this connection indicated in the model should be a focal point for the frameworks of authors pointing out a unidirectional relationship between the base and front-end technologies.
The SCM key attributes are positioned at the top of the ISM model and are also classified as “dependent factors” in the cluster diagram, demonstrating that I4.0 and the CE constructs influence them. First, it is notable that the reliability (the ability to perform tasks as expected) is positioned below the other SCM constructs, indicating its influencing role on them. Reliability mainly influences efficiency in asset management (SC5) and cost optimisation in the supply chain (SC4), and it is influenced by two other two constructs: flexibility (SC3); and responsiveness (SC2). Further, almost all key attributes have connections of mutual influence. For example, efficiency in asset management and cost optimisation influence each other, as do responsiveness and flexibility. The same occurs between responsiveness and chain cost optimisation (SC5) and between the SC5 construct and flexibility. This structure of the relationships between SC performance attributes reveals a certain cyclical behaviour between these constructs, resulting in increasing the ability to perform tasks as expected, optimising costs, and improving asset management, which increases flexibility and responsiveness, thus further increasing the ability to perform tasks as expected.

6. Conclusions

From the second half of the 20th century onwards, society has begun to worry about the impacts of linear production and consumption models. As a result, environmental and economic crises have surfaced, entailing devastating consequences for the planet. Given this scenario, it becomes increasingly important to accelerate transformation of a linear economy into a CE. Technological development can assist in this crucial transition. Against this backdrop, this study sought to identify the relationship between I4.0 technologies and the CE and the potential effect of these constructs on SC performance.
The adoption of I4.0 technologies and the search to make products, processes, and organisations more sustainable are strong trends in current times. Despite their importance, however, these trends still pose challenges for managers. The relative immaturity and scarcity of practical examples of the implementation of technologies using I4.0 technologies and CE approaches generate distrust and apprehension about the potential impacts of these new actions on the performance of organisations and SCs. The ISM approach was used in the present study to understand how I4.0 technologies and the CE approach impact SC performance. With this method, it was possible to analyse the interaction between these two trends and how they, together and separately, can be used to improve the performance of organisations. Notably, CE approaches and I4.0 dimensions have a strong potential to influence SCs’ key performance attributes, especially if supported by base I4.0 technologies, which were identified as the basis for all constructs of the model. Further, the horizontal relationship between the constructs of each theme stands out: there is a strong interdependence relationship between CE approaches, between I4.0 technologies, as well as between their dimensions and between SC performance attributes, which demonstrates the potential ability to achieve several benefits with the commitment of less effort and fewer actions.
The main contribution of this research is to present the relationships between the different constructs of the studied themes. The ISM model, the reachability matrix, and the strength matrix of relationships are, together, valuable tools for understanding the direction, order, and power of the complex relationships between I4.0, the CE, and SC performance. Using these tools, managers can make more proactive and consistent decisions regarding implementing I4.0 technologies and CE approaches. They can also select the main performance measures associated with this implementation, allowing the evaluation of the performance of projects with greater accuracy.
Industry managers can benefit from this study since it was possible to understand the interaction between I4.0 strategies, CE and SC performance. Thus, the worship of certain smart technologies can bring more efficiency, positively influencing profit, as discussed in the study of [42]. The study developed by [46] shows the sustainable development goals to be achieved by the year 2030. In this sense, the applicability of this research serves as a guideline for achieving the substantive development goals. In practical terms, there are positive effects with aspects such as energy efficiency and electricity consumption and Greenhouse gas emissions, for example. From a sustainability perspective, I4.0 strategies such as IoT and Cloud Computing facilitate the development of circular strategies such as product virtualization. The strategy Managers can use the strategies Use and recovery of renewable materials and Replacement of old products to create efficiencies and increase responsiveness in the supply chain.
The results of this study may serve as a roadmap for managers and policymakers. An example of this is that, if a manager wants to increase the responsiveness of his/her SC (SC2) without dramatically increasing costs and also wants to optimise the SC costs (SC4), by consulting the strength of relationships in Figure 2 and Figure 3, it is possible to note that the adoption of the IoT (I5) is the approach that most strongly influences the desired performance attributes. Another manager may realise that her/his operation has an opportunity for projects for remanufacturing or recycling materials (CE4) and wants to measure the impact of these projects on company performance. This manager realises that this type of project can strongly impact cost optimisation and asset management efficiency. Thus, this manager will be able to choose the correct performance metrics to measure the impact of this project, such as, for example, measuring the reduction in the consumption costs of virgin materials in the production of products and the reduction in the value of the stock of raw materials for its operation. Thus, the combined approach used in this study can encourage and assist in implementing I4.0 technologies and CE approaches that influence SC performance. Future research should adopt more practical approaches investigating how companies incorporate I4.0 technologies into their processes and how this influences the quest for more sustainable SCs.
This research has covered three very broad themes, which brings some limitations to the research. First, it is not possible to cover all aspects of the themes, leading to some important constructs being left out, such as blockchain in I4.0, Company B certifications in the CE, and the reduction in inventories as an SC performance objective. The impossibility of dealing with all aspects of the themes is related to restrictions on the length (and breadth) of the research questionnaire, i.e., ensuring that the questionnaire was not too exhausting for experts. It was, therefore, necessary to focus on the main constructs of the themes, using frameworks already established in the literature. Second, it is almost impossible to find specialist professionals who have mastery of the three topics covered in the research. The ISM approach treats responses from all experts as having the same relevance. Thus, the failure to consider different weights for each specialist when responding in their area of expertise may generate misunderstandings in the model’s results. Third, to work with the three research themes, 19 constructs were used, resulting in 230 relationships. This high number of connections makes it impossible to expose all of them in the ISM model, resulting in many relationships being presented through transitivity. However, this weakness of the model can be overcome by analysing the final reachability matrix and the relationship strength matrix.
Given these limitations, it would be interesting to study the relationships between I4.0 and the CE considering specific market sectors. It has already been demonstrated [10,32] that the use of ISM using experts from specific market niches can provide different results due to the particularities of each sector. Thus, studying the topic using experts in the same sector can reduce the likelihood of discrepancies in the responses, ensuring greater accuracy for the final model.

Author Contributions

M.G.F.: conceptualization, supervision, methodology and validation. L.M.: conceptualization, collected the data, methodology, formal analysis, validation and writing—original draft preparation. R.d.O.M.: methodology, formal analysis and writing—original draft preparation. J.d.S.L.G.: conceptualization and writing—review and editing. L.M.d.S.C.: conceptualization, validation and writing—review and editing. All authors have read and agreed to the published version of the manuscript.

Funding

This study was funded in part by the Coordination for the Improvement of Higher Education Personnel—Brazil (CAPES) and National Council for Scientific and Technological Development—Brazil (CNPq).

Institutional Review Board Statement

Not applicable.

Informed Consent Statement

Not applicable.

Data Availability Statement

Not applicable.

Acknowledgments

Sincere thanks to the research funding institutions and the anonymous interviewees.

Conflicts of Interest

The authors declare no conflict of interest.

References

  1. Kaur, H.; Prakash Singh, S. Multi-stage hybrid model for supplier selection and order allocation considering disruption risks and disruptive technologies. Int. J. Prod. Econ. 2021, 231, 107830. [Google Scholar] [CrossRef]
  2. Mastos, T.D.; Nizamis, A.; Vafeiadis, T.; Alexopoulos, N.; Ntinas, C.; Gkortzis, D.; Papadopoulos, A.; Ioannidis, D.; Tzovaras, D. Industry 4.0 sustainable supply chains: An application of an IoT enabled scrap metal management solution. J. Clean. Prod. 2020, 269, 122377. [Google Scholar] [CrossRef]
  3. Abdul-Hamid, A.-Q.; Ali, M.H.; Osman, L.H.; Tseng, M.-L. The drivers of industry 4.0 in a circular economy: The palm oil industry in Malaysia. J. Clean. Prod. 2021, 324, 129216. [Google Scholar] [CrossRef]
  4. Kakadellis, S.; Woods, J.; Harris, Z.M. Friend or foe: Stakeholder attitudes towards biodegradable plastic packaging in food waste anaerobic digestion. Resour. Conserv. Recycl. 2021, 169, 105529. [Google Scholar] [CrossRef]
  5. Elia, V.; Gnoni, M.G.; Tornese, F. Evaluating the adoption of circular economy practices in industrial supply chains: An empirical analysis. J. Clean. Prod. 2020, 273, 122966. [Google Scholar] [CrossRef]
  6. Ozkan-Ozen, Y.D.; Kazancoglu, Y.; Kumar Mangla, S. Synchronized Barriers for Circular Supply Chains in Industry 3.5/Industry 4.0 Transition for Sustainable Resource Management. Resour. Conserv. Recycl. 2020, 161, 104986. [Google Scholar] [CrossRef]
  7. Vacchi, M.; Siligardi, C.; Cedillo-González, E.I.; Ferrari, A.M.; Settembre-Blundo, D. Industry 4.0 and smart data as enablers of the circular economy in manufacturing: Product re-engineering with circular eco-design. Sustainability 2021, 13, 10366. [Google Scholar] [CrossRef]
  8. Tiwari, D.; Miscandlon, J.; Tiwari, A.; Jewell, G.W. A review of circular economy research for electric motors and the role of industry 4.0 technologies. Sustainability 2021, 13, 9668. [Google Scholar] [CrossRef]
  9. Geissdoerfer, M.; Morioka, S.N.; de Carvalho, M.M.; Evans, S. Business models and supply chains for the circular economy. J. Clean. Prod. 2018, 190, 712–721. [Google Scholar] [CrossRef]
  10. Govindan, K.; Azevedo, S.G.; Carvalho, H.; Cruz-Machado, V. Lean, green and resilient practices influence on supply chain performance: Interpretive structural modeling approach. Int. J. Environ. Sci. Technol. 2015, 12, 15–34. [Google Scholar] [CrossRef] [Green Version]
  11. Rosa, P.; Sassanelli, C.; Urbinati, A.; Chiaroni, D.; Terzi, S. Assessing relations between Circular Economy and Industry 4.0: A systematic literature review. Int. J. Prod. Res. 2020, 58, 1662–1687. [Google Scholar] [CrossRef] [Green Version]
  12. Laskurain-Iturbe, I.; Arana-Landín, G.; Landeta-Manzano, B.; Uriarte-Gallastegi, N. Exploring the influence of industry 4.0 technologies on the circular economy. J. Clean. Prod. 2021, 321, 128944. [Google Scholar] [CrossRef]
  13. Ambec, S.; Lanoie, P. Negotiating Identities: Proceedings of the 13th Annual Conference of the South African Association of Art Historians. Acad. Manag. Rev. 2008, 45–63. [Google Scholar]
  14. Ejsmont, K.; Gladysz, B.; Kluczek, A. Impact of industry 4.0 on sustainability—Bibliometric literature review. Sustainability 2020, 12, 5650. [Google Scholar] [CrossRef]
  15. Bashtannyk, V.; Buryk, Z.; Kokhan, M.; Vlasenko, T.; Skryl, V. Financial, economic and sustainable development of states within the conditions of industry 4.0. Int. J. Manag. 2020, 11, 406–413. [Google Scholar] [CrossRef]
  16. Lopes de Sousa Jabbour, A.B.; Jabbour, C.J.C.; Godinho Filho, M.; Roubaud, D. Industry 4.0 and the circular economy: A proposed research agenda and original roadmap for sustainable operations. Ann. Oper. Res. 2018, 270, 273–286. [Google Scholar] [CrossRef]
  17. Díaz-Chao, Á.; Ficapal-Cusí, P.; Torrent-Sellens, J. Environmental assets, industry 4.0 technologies and firm performance in Spain: A dynamic capabilities path to reward sustainability. J. Clean. Prod. 2021, 281, 125264. [Google Scholar] [CrossRef]
  18. Hummels, H.; Argyrou, A. Planetary demands: Redefining sustainable development and sustainable entrepreneurship. J. Clean. Prod. 2021, 278, 123804. [Google Scholar] [CrossRef]
  19. Srivastava, S.K. Green supply-chain management: A state-of-the-art literature review. Int. J. Manag. Rev. 2007, 9, 53–80. [Google Scholar] [CrossRef]
  20. Díaz-Ramírez, M.C.; Ferreira, V.J.; García-Armingol, T.; López-Sabirón, A.M.; Ferreira, G. Environmental assessment of electrochemical energy storage device manufacturing to identify drivers for attaining goals of sustainable materials 4.0. Sustainability 2020, 12, 342. [Google Scholar] [CrossRef] [Green Version]
  21. Isernia, R.; Passaro, R.; Quinto, I.; Thomas, A. The reverse supply chain of the e-waste management processes in a circular economy framework: Evidence from Italy. Sustainability 2019, 11, 2430. [Google Scholar] [CrossRef] [Green Version]
  22. Büyüközkan, G.; Göçer, F. Digital Supply Chain: Literature review and a proposed framework for future research. Comput. Ind. 2018, 97, 157–177. [Google Scholar] [CrossRef]
  23. Flynn, B.B.; Huo, B.; Zhao, X. The impact of supply chain integration on performance: A contingency and configuration approach. J. Oper. Manag. 2010, 28, 58–71. [Google Scholar] [CrossRef]
  24. Bhargava, B.; Ranchal, R.; Ben Othmane, L. Secure information sharing in digital supply chains. Proceedinigs of the 2013 3rd IEEE International Advance Computing Conference (IACC), Ghaziabad, India, 22–23 February 2013; 2013; pp. 1636–1640. [Google Scholar] [CrossRef] [Green Version]
  25. Rajput, S.; Singh, S.P. Connecting circular economy and industry 4.0. Int. J. Inf. Manag. 2019, 49, 98–113. [Google Scholar] [CrossRef]
  26. Jabbour, C.J.C.; de Sousa Jabbour, A.B.L.; Sarkis, J.; Filho, M.G. Unlocking the circular economy through new business models based on large-scale data: An integrative framework and research agenda. Technol. Forecast. Soc. Chang. 2019, 144, 546–552. [Google Scholar] [CrossRef]
  27. Dev, N.K.; Shankar, R.; Qaiser, F.H. Industry 4.0 and circular economy: Operational excellence for sustainable reverse supply chain performance. Resour. Conserv. Recycl. 2020, 153, 104583. [Google Scholar] [CrossRef]
  28. Yadav, G.; Kumar, A.; Luthra, S.; Garza-Reyes, J.A.; Kumar, V.; Batista, L. A framework to achieve sustainability in manufacturing organisations of developing economies using industry 4.0 technologies’ enablers. Comput. Ind. 2020, 122, 103280. [Google Scholar] [CrossRef]
  29. Manavalan, E.; Jayakrishna, K. An analysis on sustainable supply chain for circular economy. Procedia Manuf. 2019, 33, 477–484. [Google Scholar] [CrossRef]
  30. Nascimento, D.L.M.; Alencastro, V.; Quelhas, O.L.G.; Caiado, R.G.G.; Garza-Reyes, J.A.; Lona, L.R.; Tortorella, G. Exploring Industry 4.0 technologies to enable circular economy practices in a manufacturing context: A business model proposal. J. Manuf. Technol. Manag. 2019, 30, 607–627. [Google Scholar] [CrossRef]
  31. Charan, P.; Shankar, R.; Baisya, R.K. Analysis of interactions among the variables of supply chain performance measurement system implementation. Bus. Process Manag. J. 2008, 14, 512–529. [Google Scholar] [CrossRef]
  32. Ruiz-Benitez, R.; López, C.; Real, J.C. Environmental benefits of lean, green and resilient supply chain management: The case of the aerospace sector. J. Clean. Prod. 2017, 167, 850–862. [Google Scholar] [CrossRef]
  33. Denyer, D.; Tranfield, D. Producing a systematic review. In The Sage Handbook of Organizational Research Methods; Buchanan, D., Bryman, A., Eds.; Sage Publications: London, UK, 2009; pp. 671–689. [Google Scholar]
  34. Attri, R.; Dev, N.; Sharma, V. Interpretive structural modelling (ISM) approach: An overview. Res. J. Manag. Sci. 2013, 2319, 1171. [Google Scholar]
  35. Iyer, K.C.; Sagheer, M. Hierarchical Structuring of PPP Risks Using Interpretative Structural Modeling. J. Constr. Eng. Manag. 2010, 136, 151–159. [Google Scholar] [CrossRef] [Green Version]
  36. Beamon, B. Measuring supply chain performance in SMES. Int. J. Oper. Prod. Manag. 1999, 19, 275–292. [Google Scholar] [CrossRef]
  37. Frank, A.G.; Dalenogare, L.S.; Ayala, N.F. Industry 4.0 technologies: Implementation patterns in manufacturing companies. Int. J. Prod. Econ. 2019, 210, 15–26. [Google Scholar] [CrossRef]
  38. Dantas, T.E.T.; de-Souza, E.D.; Destro, I.R.; Hammes, G.; Rodriguez, C.M.T.; Soares, S.R. How the combination of Circular Economy and Industry 4.0 can contribute towards achieving the Sustainable Development Goals. Sustain. Prod. Consum. 2021, 26, 213–227. [Google Scholar] [CrossRef]
  39. Bigerna, S.; Micheli, S.; Polinori, P. New generation acceptability towards durability and repairability of products: Circular economy in the era of the 4th industrial revolution. Technol. Forecast. Soc. Chang. 2021, 165, 120558. [Google Scholar] [CrossRef]
  40. Brown, P.; Bocken, N.; Balkenende, R. How do companies collaborate for circular oriented innovation? Sustainability 2020, 12, 1648. [Google Scholar] [CrossRef] [Green Version]
  41. Lim, X.J.; Cheah, J.H.; Ng, S.I.; Basha, N.K.; Soutar, G. Will you stay or will you go? The effects anthropomorphism presence and the marketing mix have on retail app continuance use intention. Technol. Forecast. Soc. Chang. 2021, 168, 120763. [Google Scholar] [CrossRef]
  42. Sardar, S.K.; Sarkar, B.; Kim, B. Integrating machine learning, radio frequency identification, and consignment policy for reducing unreliability in smart supply chain management. Processes 2021, 9, 247. [Google Scholar] [CrossRef]
  43. Jaria, G.; Silva, C.P.; Oliveira, J.A.B.P.; Santos, S.M.; Gil, M.V.; Otero, M.; Calisto, V.; Esteves, V.I. Production of highly efficient activated carbons from industrial wastes for the removal of pharmaceuticals from water—A full factorial design. J. Hazard. Mater. 2019, 370, 212–218. [Google Scholar] [CrossRef] [PubMed] [Green Version]
  44. Khan, J.; Rundle-Thiele, S. Factors explaining shared clothes consumption in China: Individual benefit or planet concern? Int. J. Nonprofit Volunt. Sect. Mark. 2019, 24, e1652. [Google Scholar] [CrossRef]
  45. Modgil, S.; Gupta, S.; Sivarajah, U.; Bhushan, B. Big data-enabled large-scale group decision making for circular economy: An emerging market context. Technol. Forecast. Soc. Chang. 2021, 166, 120607. [Google Scholar] [CrossRef]
  46. AlArjani, A.; Modibbo, U.M.; Ali, I.; Sarkar, B. A new framework for the sustainable development goals of Saudi Arabia. J. King Saud Univ.-Sci. 2021, 33, 101477. [Google Scholar] [CrossRef]
Figure 1. Research method.
Sustainability 14 02772 g001
Figure 2. ISM model.
Sustainability 14 02772 g002
Figure 3. Cluster diagram from the MICMAC analysis.
Sustainability 14 02772 g003
Table 1. Gaps in the extant literature.
Prior Research
PurposeReferenceResearch Gap
Evaluate the state of the art of relations between sustainability and I4.0.[14]There was lack of research approaching issues of sustainability and Industry 4.0 in a comprehensive way.
Integrates Industry 4.0 technologies, smart data, Life Cycle Assessment methodology, and material microstructural analysis techniques to develop and apply a circular eco-design model that has been implemented in the Italian ceramic tile manufacturing industry.[7]This study considered only the environmental dimension of sustainability without including the economic and social dimensions.
To provide evidence of the impact of an IoT solution on the sustainable supply chain management (SSCM) performance[2]Investigate IoT/industry 4.0 applications in supply chain management.
Present Research
A systematic analysis from the perspective of experts concerning the relationship between CE, I4.0 and SC performance.
Table 2. Relationship between the ReSOLVE framework and I4.0 technologies.
ReSOLVE StrategiesI4.0 Technologies
RegenerateInternet of Things (IoT)
ShareCloud computing and IoT
OptimiseCyber–Physical Systems (CPS) and IoT
LoopCPS, IoT and Cloud computing
VirtualiseCloud computing, IoT and Additive Manufacturing
ExchangeAdditive Manufacturing
Source: [15].
Table 3. Distribution of quartile 1 and 2 journals suitable for each theme by publisher.
PublishersNumber of JournalsCEI4.0SC Management
Elsevier BV1024%935%519%930%
John Wiley & Sons, Inc.614%415%312%413%
Taylor & Francis Group614%28%415%517%
INFORMS37%00%14%310%
Springer Nature37%14%312%310%
Emerald Group25%00%14%27%
Others1229%1038%312%413%
Total42100%26100%20100%30100%
Table 4. Comparison of the number of respondents in previous studies.
AuthorsAcademicsPractitionersTotal
Charan, Shankar e Baisya (2008)347
Luthra et al. (2011)246
Mathiyazhagan et al. (2013)112
Govindan, Azevedo e Carvalho (2015)235
Ruiz-Benitez, López e Real (2017)01515
Average268
Table 5. Detail of expert interviews.
ExpertPADescriptionExperience inYears of Experience
#e1 XAssistant professor with a master’s degree in Industrial Engineering, member of the GEI/NUMA and Schmidt MacArthur FellowshipCE.5
#e2 XPh.D., professor and member of SC4.0.SC, I4.0 and CE.16
#e3 XPh.D., professor and member of SC4.0 and IntelliLab.org.I4.024
#e4 XPh.D., professor, visiting researcher,
SCM Consultant and member of SC4.0.
SC and I4.0.10
#e5 XPh.D., professor coordinator of SC4.0 and co-director of IntelliLab.org.SC, I4.0 and CE.20
#e6 XPh.D., professor and member of SC4.0.SC and I4.0.17
#e7 XPh.D., professor and member of SC4.0.SC and I4.0.18
#e8 XAssistant professor with master’s degree in Industrial Engineering.SC and CE.8
#e9X Co-founder of a company in the reverse logistics of the electronic waste sector.CE.10
#e10X Partner of an I4.0 consultancy.SC and I4.0.20
#e11X PCP supervisor of a writing material and school products industry.SC7
#e12X Partner of the sustainable food industry.CE.18
#e13X Planning coordinator of cosmetic industry.SC9
#e14X Manager of a Supply chain and operations consultancy.SC and CE.7
Table 6. Fuzzy scale and assignment rule for defining the strength of antecedents.
StrengthValue AssignedNumber of Experts Who Agreed That the Factor i Drive Factor j
No0None
Weak0.251–5
Medium0.55–9
Strong0.759–13
Very strong113 and above
Table 7. Final list of constructs and definitions.
CodeConstructDefinitionsMain References
SC1ReliabilityThe capacity of performing tasks as expected[13,19,36]
SC2ResponsivenessAbility to perform tasks with speed
SC3AgilityAbility to respond and adapt to external influences and changes (Flexibility)
SC4CostsCost optimisation Supply Chain
SC5Active management efficiencyEfficiency in the management of active
CE1RegenerateUse and recovery of renewable materials[22,23,24]
CE2ShareSharing and reuse of goods
CE3OptimiseIncreased efficiency and performance improvement
CE4LoopRemanufacturing and recycling of materials, products and components
CE5VirtualiseVirtualisation of products
CE6ExchangeSubstitution of goods advanced products
I1Smart ManufacturingProduction systems are flexible and digitally integrated[16,19,25,27]
I2Smart ProductsProducts with technology encompassed to offer services and solutions
I3Smart Supply ChainIntegration systems, synchronisation and communication of inter-organisational information
I4Smart WorkingSupport technologies to the worker
I5Internet of Things (IoT)Integration of physical objects to the Internet and digital systems
I6Cloud computingStorage and data sharing technology on the remote access server
I7Big DataSet of data that require high storage capacity, processing and analysis
I8Data AnalyticsSet of methods for data analysis
Table 8. Structural self-interaction matrix.
I8I7I6I5I4I3I2I1CE6CE5CE4CE3CE2CE1SC5SC4SC3SC2SC1
SC1AAAAAAAAOAOAOOVVAA
SC2AAAAAAAAAAOXXOXVX
SC3AAAAAAAAAAOAXOXO
SC4AAAAAAAAAAAAAAX
SC5AAAAAAAAAAAAAA
CE1AAAAOAAAXXXVX
CE2AAAAAAAAXXXX
CE3AAAAAAAAXAX
CE4AAAAOAOAXO
CE5XXXAXXXXX
CE6AAAAXXXX
I1XXAXXXX
I2XXAXXX
I3XXXXX
I4AXAA
I5XXX
I6XX
I7X
I8
Table 9. Initial Reachability Matrix.
I8I7I6I5I4I3I2I1CE6CE5CE4CE3CE2CE1SC5SC4SC3SC2SC1
SC10000000000000011001
SC20000000000011011111
SC30000000000001010111
SC40000000000000011000
SC50000000000000011110
CE10000000011111111000
CE20000000011111111110
CE30000000010111011111
CE40000000010111111000
CE51110111111011111111
CE60000111111111111110
I11101111111111111111
I21101111111011111111
I31111111111111111111
I40100111111011011111
I51111111111111111111
I61111111111111111111
I71111111111111111111
I81111111111111111111
Table 10. Final Reachability Matrix.
I8I7I6I5I4I3I2I1CE6CE5CE4CE3CE2CE1SC5SC4SC3SC2SC1Driving Power
SC100000000000000111 *1 *15
SC2000000001 *1 *1 *111 *1111111
SC3000000001 *1 *1 *1 *11 *11 *11111
SC400000000000000111 *1 *04
SC5000000000001 *1 *011111 *7
CE11 *1 *1 *01 *1 *1 *1 *111111111 *1 *1 *18
CE21 *1 *1 *01 *1 *1 *1 *11111111111 *18
CE300001 *1 *1 *1 *11 *1111 *1111115
CE400001 *1 *1 *1 *11 *1111111 *1 *1 *15
CE51111 *1111111 *1111111119
CE61 *1 *1 *1 *111111111111111 *19
I1111 *111111111111111119
I2111 *11111111 *1111111119
I3111111111111111111119
I41 *11 *1 *1111111 *111 *1111119
I5111111111111111111119
I6111111111111111111119
I7111111111111111111119
I8111111111111111111119
Dependence Power12121210141414141616161717161919191918-
* The transitivity identified in the relationship between the variables.
Table 11. Level partitions.
VariableAccessible SetBackground SetIntersection SetLevel
SC1SC1, SC2, SC3, SC4, SC5SC1, SC2, SC3, SC5, CE1, CE2, CE3, CE4, CE5, CE6, I1, I2, I3, I4, I5, I6, I7, I8SC1, SC2, SC3, SC5II
SC2SC1, SC2, SC3, SC4, SC5, CE1, CE2, CE3, CE4, CE5, CE6SC1, SC2, SC3, SC4, SC5, CE1, CE2, CE3, CE4, CE5, CE6, I1, I2, I3, I4, I5, I6, I7, I8SC1, SC2, SC3, SC4, SC5, CE1, CE2, CE3, CE4, CE5, CE6I
SC3SC1, SC2, SC3, SC4, SC5, CE1, CE2, CE3, CE4, CE5, CE6SC1, SC2, SC3, SC4, SC5, CE1, CE2, CE3, CE4, CE5, CE6, I1, I2, I3, I4, I5, I6, I7, I8SC1, SC2, SC3, SC4, SC5, CE1, CE2, CE3, CE4, CE5, CE6I
SC4SC2, SC3, SC4, SC5SC1, SC2, SC3, SC4, SC5, CE1, CE2, CE3, CE4, CE5, CE6, I1, I2, I3, I4, I5, I6, I7, I8SC2, SC3, SC4, SC5I
SC5SC1, SC2, SC3, SC4, SC5, CE2, CE3SC1, SC2, SC3, SC4, SC5, CE1, CE2, CE3, CE4, CE5, CE6, I1, I2, I3, I4, I5, I6, I7, I8SC1, SC2, SC3, SC4, SC5, CE2, CE3I
CE1SC1, SC2, SC3, SC4, SC5, CE1, CE2, CE3, CE4, CE5, CE6, I1, I2, I3, I4, I6, I7, I8SC2, SC3, CE1, CE2, CE3, CE4, CE5, CE6, I1, I2, I3, I4, I5, I6, I7, I8SC2, SC3, CE1, CE2, CE3, CE4, CE5, CE6, I1, I2, I3, I4, I6, I7, I8III
CE2SC1, SC2, SC3, SC4, SC5, CE1, CE2, CE3, CE4, CE5, CE6, I1, I2, I3, I4, I6, I7, I8SC2, SC3, SC5, CE1, CE2, CE3, CE4, CE5, CE6, I1, I2, I3, I4, I5, I6, I7, I8SC2, SC3, SC5, CE1, CE2, CE3, CE4, CE5, CE6, I1, I2, I3, I4, I6, I7, I8III
CE3SC1, SC2, SC3, SC4, SC5, CE1, CE2, CE3, CE4, CE5, CE6, I1, I2, I3, I4SC2, SC3, SC5, CE1, CE2, CE3, CE4, CE5, CE6, I1, I2, I3, I4, I5, I6, I7, I8SC2, SC3, SC5, CE1, CE2, CE3, CE4, CE5, CE6, I1, I2, I3, I4III
CE4SC1, SC2, SC3, SC4, SC5, CE1, CE2, CE3, CE4, CE5, CE6, I1, I2, I3, I4SC2, SC3, CE1, CE2, CE3, CE4, CE5, CE6, I1, I2, I3, I4, I5, I6, I7, I8SC2, SC3, CE1, CE2, CE3, CE4, CE5, CE6, I1, I2, I3, I4III
CE5SC1, SC2, SC3, SC4, SC5, CE1, CE2, CE3, CE4, CE5, CE6, I1, I2, I3, I4, I5, I6, I7, I8SC2, SC3, CE1, CE2, CE3, CE4, CE5, CE6, I1, I2, I3, I4, I5, I6, I7, I8SC2, SC3, CE1, CE2, CE3, CE4, CE5, CE6, I1, I2, I3, I4, I5, I6, I7, I8III
CE6SC1, SC2, SC3, SC4, SC5, CE1, CE2, CE3, CE4, CE5, CE6, I1, I2, I3, I4, I5, I6, I7, I8SC2, SC3, CE1, CE2, CE3, CE4, CE5, CE6, I1, I2, I3, I4, I5, I6, I7, I8SC2, SC3, CE1, CE2, CE3, CE4, CE5, CE6, I1, I2, I3, I4, I5, I6, I7, I8III
I1SC1, SC2, SC3, SC4, SC5, CE1, CE2, CE3, CE4, CE5, CE6, I1, I2, I3, I4, I5, I6, I7, I8CE1, CE2, CE3, CE4, CE5, CE6, I1, I2, I3, I4, I5, I6, I7, I8CE1, CE2, CE3, CE4, CE5, CE6, I1, I2, I3, I4, I5, I6, I7, I8III
I2SC1, SC2, SC3, SC4, SC5, CE1, CE2, CE3, CE4, CE5, CE6, I1, I2, I3, I4, I5, I6, I7, I8CE1, CE2, CE3, CE4, CE5, CE6, I1, I2, I3, I4, I5, I6, I7, I8CE1, CE2, CE3, CE4, CE5, CE6, I1, I2, I3, I4, I5, I6, I7, I8III
I3SC1, SC2, SC3, SC4, SC5, CE1, CE2, CE3, CE4, CE5, CE6, I1, I2, I3, I4, I5, I6, I7, I8CE1, CE2, CE3, CE4, CE5, CE6, I1, I2, I3, I4, I5, I6, I7, I8CE1, CE2, CE3, CE4, CE5, CE6, I1, I2, I3, I4, I5, I6, I7, I8III
I4SC1, SC2, SC3, SC4, SC5, CE1, CE2, CE3, CE4, CE5, CE6, I1, I2, I3, I4, I5, I6, I7, I8CE1, CE2, CE3, CE4, CE5, CE6, I1, I2, I3, I4, I5, I6, I7, I8CE1, CE2, CE3, CE4, CE5, CE6, I1, I2, I3, I4, I5, I6, I7, I8III
I5SC1, SC2, SC3, SC4, SC5, CE1, CE2, CE3, CE4, CE5, CE6, I1, I2, I3, I4, I5, I6, I7, I8CE5, CE6, I1, I2, I3, I4, I5, I6, I7, I8CE5, CE6, I1, I2, I3, I4, I5, I6, I7, I8IV
I6SC1, SC2, SC3, SC4, SC5, CE1, CE2, CE3, CE4, CE5, CE6, I1, I2, I3, I4, I5, I6, I7, I8CE1, CE2, CE5, CE6, I1, I2, I3, I4, I5, I6, I7, I8CE1, CE2, CE5, CE6, I1, I2, I3, I4, I5, I6, I7, I8IV
I7SC1, SC2, SC3, SC4, SC5, CE1, CE2, CE3, CE4, CE5, CE6, I1, I2, I3, I4, I5, I6, I7, I8CE1, CE2, CE5, CE6, I1, I2, I3, I4, I5, I6, I7, I8CE1, CE2, CE5, CE6, I1, I2, I3, I4, I5, I6, I7, I8IV
I8SC1, SC2, SC3, SC4, SC5, CE1, CE2, CE3, CE4, CE5, CE6, I1, I2, I3, I4, I5, I6, I7, I8CE1, CE2, CE5, CE6, I1, I2, I3, I4, I5, I6, I7, I8CE1, CE2, CE5, CE6, I1, I2, I3, I4, I5, I6, I7, I8IV
Table 12. Conical final accessibility matrix.
I8I7I6I5I4I3I2I1CE6CE5CE4CE3CE2CE1SC5SC4SC3SC2SC1Level
I51111111111111111111IV
I61111111111111111111IV
I71111111111111111111IV
I81111111111111111111IV
CE11 *1 *1 *01 *1 *1 *1 *111111111 *1 *1 *III
CE21 *1 *1 *01 *1 *1 *1 *11111111111 *III
CE300001 *1 *1 *1 *11 *1111 *11111III
CE400001 *1 *1 *1 *11 *1111111 *1 *1 *III
CE51111 *1111111 *11111111III
CE61 *1 *1 *1 *111111111111111 *III
I1111 *1111111111111111III
I2111 *11111111 *11111111III
I31111111111111111111III
I41 *11 *1 *1111111 *111 *11111III
SC100000000000000111 *1 *1II
SC2000000001 *1 *1 *111 *11111I
SC3000000001 *1 *1 *1 *11 *11 *111I
SC400000000000000111 *1 *0I
SC5000000000001 *1 *011111 *I
* The transitivity identified in the relationship between the variables.
Table 13. Relationship agreement matrix.
I8I7I6I5I4I3I2I1CE6CE5CE4CE3CE2CE1SC5SC4SC3SC2SC1Level
I511129 79898871297121191210IV
I61011 9887867712771110101111IV
I710 1112686776710781211111112IV
I8 101011786676710781211121012IV
CE1 85877 68 III
CE2 8587 781066 III
CE3 6 6 7 77656III
CE4 8 688910 III
CE5667 676710 85591010118III
CE6 5888 1086885766 III
I167 9766 877127681010811III
I266 857 686 127611101079III
I388899 7687812879891110III
I4 6 95756 127 1111111011III
SC1 65 II
SC2 56 568 6I
SC3 6 6 89I
SC4 7 I
SC5 765 I
Publisher’s Note: MDPI stays neutral with regard to jurisdictional claims in published maps and institutional affiliations.

