
Differentiation Rule and Driving Mechanisms of Collapse Disasters in Changbai County

1
Heilongjiang Province Key Laboratory of Geographical Environment Monitoring and Spatial Information Service in Cold Regions, Harbin Normal University, Harbin 150025, China
2
China Construction Materials and Geological Prospecting Central Jilin General Team, Changchun 130033, China
*
Author to whom correspondence should be addressed.
Sustainability 2022, 14(4), 2074; https://doi.org/10.3390/su14042074
Submission received: 20 December 2021
/
Revised: 21 January 2022
/
Accepted: 25 January 2022
/
Published: 11 February 2022
(This article belongs to the Special Issue Applied Modeling for Energy and Environmental Risks)
Abstract
:The differentiation rule and driving mechanisms of collapse disasters in various regions are unclear, and the results from existing methods of research are not sufficiently scientific. To reveal the nature of collapse disasters, this study utilized data from the 1:50,000 geological disaster investigation results database, 1:50,000 topographic data, and TM images. Topography, human activity intensity, rock mass structure, hydrological conditions, vegetation status, and meteorological conditions were used as indicators in the DEA model to analyze their validity and to explore the differentiation law and driving mechanisms of the highway slope along the YaLu river, a location of frequent geological disasters in Changbai County. In the analysis process, each index was quantitatively graded, i.e., the number of disaster points corresponding to each index was used as an input index, and the number of disaster points and the scale and stability of disaster points corresponding to the graded quantitative index were used as the output indexes. The results of the analysis of the study area indicate that there are significant differences in geological disasters due to different regional characteristics. We carried out three evaluations and performed spatial superposition analysis of the indicators corresponding to the effective values and the regional collapse points. The driving factors of collapse disasters can be divided into three categories, namely the impact of human activities, rainfall, and gravity stress. The GIS analysis and mapping found that the collapse points located to the south of the Grand Canyon of Changbai County were primarily affected by rainfall. Additionally, the areas affected by activity intensity are mostly concentrated in county towns with concentrated populations and road slopes.
1. Introduction
Geological hazards refer to the catastrophic geological events resulting from various natural geological processes and human activities during the development and evolution of the Earth. Collapse disasters refer to events in which the rock mass on a steep slope suddenly breaks away from the parent body due to gravity, rolls and accumulates at the foot of the slope (or valley) and causes damage to human life and property.
Because human understanding of geological disasters is still in its infancy, many of these issues require further study. Most studies focus on geological hazard risk assessment, vulnerability assessment, susceptibility, geo-hazard monitoring, early warning, and disaster prevention control (e.g., [1,2,3,4,5,6,7,8,9,10]).
Studies on the differentiation rule and driving mechanisms of critical factors of geo-hazards are relatively rare. However, there are some related studies. For example, Zhang et al. [11] found that geological disasters are closely related to topography and vegetation coverage, among other factors. Dexin et al. [12] established a simple dynamic study and found that slope stability is closely related to rainfall, slope, and the friction angle of the slope. Chunfeng et al. [13] found that the topography and stratum lithology are characterized by a large height difference, and the high, steep slope played a controlling role in the stability of the rock collapse; additionally, the stability of the dangerous rock mass is reduced under the influence of heavy rain and earthquakes. Jia et al. [14] used the limit analysis upper bound method to study 35 dangerous rock masses on the bank slope of a hydropower station in the Dadu River and found that collapsed dangerous rock masses are more likely to be affected by earthquakes and that dumping and falling dangerous rock masses are possible. Genis et al. [15] clarified that rock properties, geometry, environmental factors, and human activities are the factors that contribute to slope instability, and RockFall V4.0 was used to simulate the rockfall conditions of the Gökgöl tunnel in Zonguldak, Turkey. Verma et al. [16] utilized 3DEC software to analyze the stability of the slope body and found that the size and volume of the rock block, the height of the dangerous rock mass, and the shape of the rock block as well as other factors caused instability.
Most studies (e.g., [17,18,19]) of geological disasters are based on the traditional understanding of the impact of disaster indicators as an empirical value and implement related evaluation analysis, which creates many limitations to the characterization of geological disasters; for example, the disaster warning is not accurate, or the risk assessment is not realistic. Therefore, a core understanding of geological disasters cannot be completely revealed in this way. The geological disaster itself is a very complicated systematic problem. The control of its index factors may also exhibit different contributions for different regions. Therefore, the study of differentiation law and the driving mechanisms of geo-hazards is helpful for developing a reliable theoretical basis for analysis or evaluation as well as for disaster warning. It also allows for a more comprehensive understanding of geological disasters and provides a reliable reference for further study from the perspective of collapse disaster research. Based on this notion, related research work was carried out in this study.
Changbai Korean Autonomous County (Changbai County) is located at the border between China and North Korea and therefore is located in an important strategic position that has a profound impact on the country’s geopolitical security [20]. In addition, according to the latest survey data, it contains 219 collapse disaster points, and collapse disaster is one of the most common types of geological disaster in this region. Therefore, it is of great significance to examine the collapse disasters in this area.
In order to eliminate subjectivity, the DEA model was used in this study because it does not require any weighting assumptions and because it has an absolute advantage in evaluating the effectiveness of multi-input and multi-output conditions [21]. It has therefore been widely used in practical applications. Based on the systematic mechanism, the indicators selected to analyze and explore the differentiation rules and driving mechanisms of geological disasters in Changbai County are: disaster environment and the actual field survey data of the geological collapse disasters, topography, human activity intensity, rock and soil structure, geological structure, hydrological conditions, and vegetation conditions. The results can provide a necessary reference for further in-depth research and have practical guiding significance for local government disaster prevention and mitigation work.
2. Regional Location and Profile
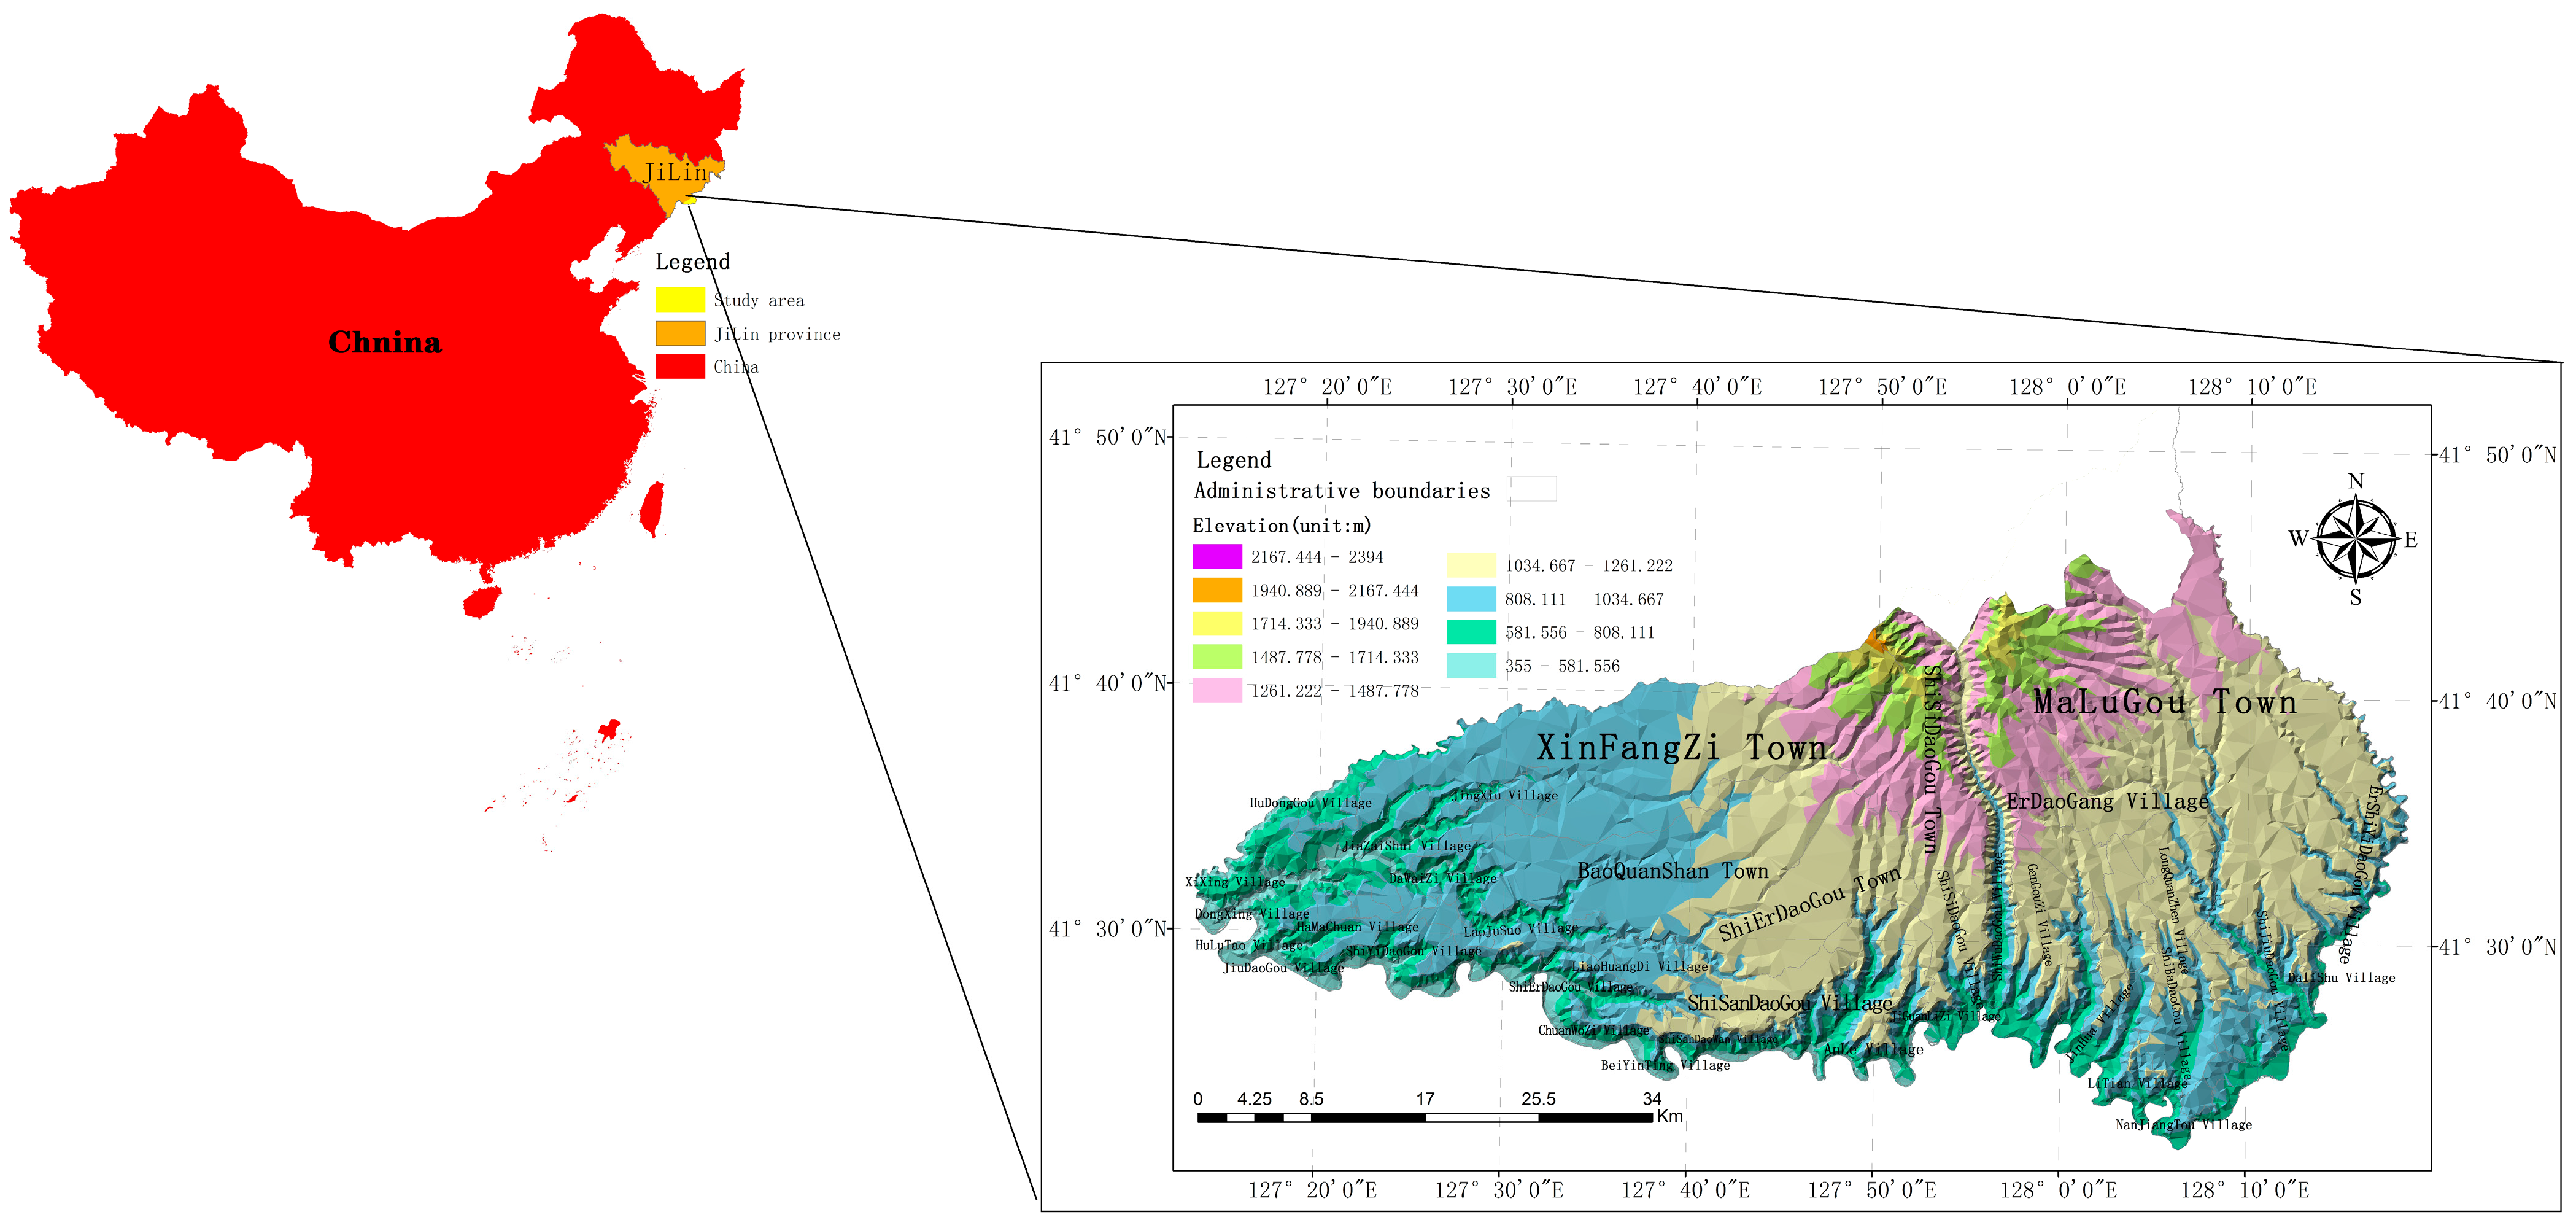
Changbai County is located at the southern slope of Changbai Mountain and is situated on the right bank of the upper Yalu River. It is in the southeast part of Jilin Province, China (127°12′20″∼128°18′10″ E, 41°21′41″∼41°58′02″ N). The total population is 86,340 (as of 2011), and the total area is 2497.6 km2. The mountains are densely forested, and the topography is characterized by large peaks and valleys (Figure 1).
This area is the largest Quaternary volcanic rock distribution area in China. Under the influence of the Himalayan orogeny, the volcano erupted intermittently, causing the crust to experience some columns of fracture and uplift, and the underground basaltic rock slurry was ejected from the ground to form a basalt platform. However, the new crustal movements began to break out before the Quaternary and the volcanic activity changed from the original fissure eruption to central eruption. A huge volcanic heap with Tianchi as the main channel was gradually formed. The crust in Changbai Mountain area was uplifted, and magmatic rocks with basalt and trachyte appeared [22].
The study area belongs to the northern temperate continental humid monsoon climate, which is characterized by distinctive seasonal features; the winter is long and cold, and the summer is short and rainy. The average annual temperature is 2.1 °C, and the extreme maximum and minimum temperatures are 34.8 and −36.4 °C, respectively. The extreme maximum and minimum precipitation are 110.0 (2010) and 93.5 mm (1965), respectively. Precipitation during June through August accounts for 60% of the yearly rainfall and is unevenly geographically distributed. The precipitation in the northern and southwestern parts of the zone is relatively large, and the annual precipitation is greater than 700 mm. The average annual precipitation of the middle and northeastern areas of Changbai Tianchi is greater than 1000 mm, and the precipitation in the central and eastern parts of the region is relatively small; the annual precipitation is less than 700 mm, and that in the Yalu River is about 600 mm.
The rivers in this area belong to the Yalu River, which originates from the southern slope of the Changbai Mountain. It flows from the northeast to the southwest along the border between China and North Korea and then flows westward along the boundary. The river width is between 50 and 100 m, the water depth is about 2 m, the maximum flow velocity is 1.36 m/s, and the maximum flow rate is 109.1 m3/s.
Topographically, the study area has a high elevation in the northeast and a low elevation in the southwest. The highest elevation is 2457.4 m, the lowest elevation is 450 m, and the average elevation is about 1570 m. The entire area can be divided into four landform types: volcanic landform, erosion landform, erosion accumulation landform, and accumulation landform. The main stratum is the Upper Neogene–Pleistocene basalt, which accounts for more than 80% of the total area. The groundwater in the area is divided into four types: loose rock pore water, basalt fissure water, carbonate fissure cave water, and bedrock fissure water.
According to the 1:50,000 geological disaster survey data, there are 219 collapse points in the entire area, and they appear in groups along the highway, such as those along the Yalu River. Most of the geo-hazards exist in unstable conditions and are small-scale, unevenly distributed, and occur repeatedly. As can be discerned from the spatial distribution of this area, the collapse points are mostly concentrated in Malutgou Town and account for 59% of the total collapse points. Badaogou Town, Shisidaogou Town, and Shierdaogou Town account for 13.7% of the total number of collapse points. The list of environmental and typical disaster points in the main areas are provided in Table 1.
3. Methods
3.1. DEA Model
Data envelopment analysis (DEA) is a method based on the concept of “relative efficiency” to evaluate the relative effectiveness and benefit according to multi-index input and multi-index output. It involves selecting a set of input and output evaluation indicators for a given group of units to obtain the effectiveness of specific decision-making units (DMUs) [21]. This effectiveness is also called the “contribution rate” in this paper. The advantage of the DEA model is that it eliminates the interference of human subjective factors and has strong objectivity. It is especially suitable for the analysis and research of complex multi-input and multi-output systems.
In this study, we regarded the collapse disaster as a system firstly. We then regarded this system as a unit within a certain range and selected a set of input indicators to produce a set of output indicators to obtain the validity factor of this unit. The result was used to evaluate whether the unit is valid. Assuming this system unit can be defined as a DMU, each unit has a set of input and output statistical indicator data, and the obtained validity coefficient is used as a quantitative indicator of the overall efficiency of each DMU. This is described in mathematical terms as follows:
There are n decision-making units in the collapse disaster system in this area, DMUj (j = 1, 2, 3, …, n) (indicator evaluation units), and each DMUj has m inputs and s outputs. The input vector can be written as X = (x1j, x2j, ..., xmj)T, and the output vector is Y = (y1j, y2j, ..., ysj)T. The model is therefore as follows:
where θ is the evaluation value, Xj is the input index of the geological collapse disaster, Yj is the output index, λj is the variable coefficient, and S− and S+ are the slack variables of input and output, respectively. In the evaluation, when θ = 1, it indicates that the indicator corresponding to the DMU achieves the best efficiency, i.e., the indicator is considered effective. See Reference [22] for details.
3.2. Data Source
Refer to relevant literature [23] for DEM(Digital Elevation Model) and remote sensing image data. The 1:50,000 DEM data are from the Jilin Surveying and Mapping Geographic Information Bureau. The meteorological data are from the Meteorological Bureau of Jilin Province and Baishan City. The data of rock and soil structure are from the Department of Natural Resources of Jilin Province. The survey data of geological collapse hazards were field measured. The land use database comes from the Bureau of Land and Resources of Changbai Korean Autonomous County.
3.3. Selection of Indicators
The selection of geological disaster indicators is the premise by which to study the differentiation law and driving mechanisms, but the collapse disaster itself is a complex system. Many studies show that understanding of collapse disasters is still in a primary stage. It was therefore difficult to establish and select a comprehensive set of indexes that both fit our study and accurately reflected the index system of collapse disasters. For the convenience of exploration and research, we selected the evaluation index from the natural and social attributes of hazard factors based on actual situations and working degrees of the geological disasters in this region.
Topographical and geomorphic factors are particularly important in terms of natural attributes, as they provide energy conversion conditions for collapse disasters and determine the stress and stability of slopes. Rock and soil, and their weathering products, are the material sources. Vegetation conditions affect the degree of soil exposure, and vegetation roots play a role in resisting the weathering of the rock, which is conducive to maintaining the soil and preventing the occurrence of collapse. Many studies indicate that rainfall is the chief trigger factor for sudden geological disasters (e.g., [24,25]). During rainfall infiltration, the water content of the soil and the bulk density increases, and the matric suction decreases gradually; therefore, a reduction in shear strength results in both a decrease in the safety of the slope and further slope failure [26]. The difference in the structure of the rock mass is another major factor that affects the stability of the slope. In terms of the social attributes of hazard factors, collapse is affected by human activities. For example, unscientific human engineering activities and excavating have changed the natural state and environment of the rock and soil. These changes have not been properly rectified and can result in the deformation or destruction of the slope.
Due to the collapse disasters being a type of landslide [27], geological hazard assessment norms [28], other references (e.g., [2,29,30,31,32,33,34,35]), geological hazard data for this region, and geological hazard investigation, we selected topography, human activity intensity, rock and soil structure, hydrological conditions, vegetation conditions, and meteorological conditions as the key factors that contribute to geological disasters and used these factors as input indicators for the DEA model.
The scale of a disaster is an important indicator that reflects the extent of disaster development and damage [36]. Generally, a larger scale of collapse is associated with higher danger, and the stability of the slope is the direct impetus for collapse. Danger refers to the threat to the lives and property of people and must be controlled, prevented, and eliminated. It is the result of the joint actions of regional natural disaster system elements [37]. Therefore, the size, danger, and slope stability of the collapse disaster were selected as the model output indexes.
3.4. Indicator Grading and Quantified Values
The 1:50,000 geological disaster investigation and the 1:10,000 key area investigation were carried out in the study area by JiLin Province, China. It was found that there were 219 collapse disaster sites in Changbai County that were mostly distributed along the Changbai County to Qidaogou section of the Yalu River Highway, S302 Songjiang River to Changbai County. According to existing statistics and classifications, there are 215 small-scale dangerous level collapse points, 199 small-scale collapse points, 73 unstable collapse points, and 145 stable collapse points. Most of the collapse disasters in the region are distributed along the highway and are caused by excavation and mining.
The indicator grading is based on actual situations of the regional collapse disaster environment. Other references (e.g., [38,39,40]) and the 1:50,000 geological disaster database of Changbai County were used to select the slope and terrain relief as the secondary indicators of the topography and division.
The human activity intensity index was calculated using the artificial transformation activity index method proposed by Zeng Hui [41] and was classified into the following three categories: greater than 2.5, 1~2.5, and less than 1. The rock and soil structure at the collapse point was categorized into 4 grades according to the integrity of the rock and soil: bulk, fragmentation, block, and overall block [42]. The density of the gully was divided into three levels: greater than 3, 1~2, and less than 1 km/km2. The vegetation status was based on TM(Thematic Mapper) data, and the vegetation index is divided into three levels. The rainfall was interpolated by the average rainfall of seven rainfall stations in the study region and then categorized into 4 levels. Finally, according to the dangers, scales, and slope stability of the collapse points corresponding to the above indicators, which are exhibited in Table 2, statistical analysis of collapse disaster points was carried out.
3.5. Data Processing and Information Collection
First, the slope and terrain relief in Table 1 was graded by ArcGIS10.2(Environmental Systems Research Institute, Inc. Referred to as ESRI) software based on the 1:50,000 DEM data. Then, the land use database in the area was selected to extract 12 indicators: bare land, forest land, grassland, garden, river, reservoir, dry land, irrigated land, village, town, mining land, and facility agricultural land. The amount of calculation for the human activity intensity index is very large. In order to avoid artificial inefficiency, the land use database was loaded into the SQLSERVER2008 (Microsoft, China) software platform. The calculation formula in Reference [41] was used, and SQL statements were written to extract various indicators.
where DT is the artificial transformation activity index, N is the number of landscape component types, is the total area of the i landscape component, is the i landscape which is the parameter of worker influence intensity reflected by the component, and TA is the total area of landscape. Third, using the Jilin Province Regional Geological Environment Survey Report (1:50,000), the 1:500,000 Jilin Province Geological Map and Structural System Map, and the actual regional environment, the rock mass structure and geological structure data were optimized and divided into three levels using ArcGIS10.2 software according to the classification criteria listed in Table 1. Some of the technical methods in the process refer to Reference [24].
Fourth, using the DEM data, the Hydrology tool of ArcGIS10.2 software was selected to perform the calculation steps, such as squat filling, innocent water flow direction, and cumulant accumulation. The grid river network data were then obtained, and raster river network vectorization was performed with the Stream to Feature tool. Based on the 1000 × 1000 m grid, the gully density data of each grid were calculated using the formula for gully density.
Fifth, nearly 20 years of rainfall data for each rainfall station in the study area were collected to calculate the annual average rainfall of each station, which were then analyzed by the inverse distance weight interpolation method in ArcGIS10.2 software to obtain the average rainfall for this district.
Finally, because traditional NDVI(Normalized Difference Vegetation Index) is sensitive to changes in soil background [43], this study utilized IMSAVI [44] to eliminate the interference of soil background values. Based on TM images, the Band Math tool in ENVI (Exelis Visual Information Solutions, USA)software was used. The vegetation index was extracted and graded according to Table 1.
4. Evaluation and Analysis
4.1. Evaluation Process
Establishing the input/output indexes of the DEA model is a basic premise for this evaluation. Most of the input indicators are expressed in the form of numerical intervals, as exhibited in Table 2. The method of determining the reasonable and effective input values of the index is especially important, and the analysis process requires repeated data experiments. Determining the number of disaster points that correspond to each indicator interval as the input value is the most reasonable and scientific method of analysis.
In this study, due to the different indexes and roles between the input and output of various indicators (see Table 2), to evaluate DMUs is to regard them as a process of overall input and overall output. First, let be a measure input for i indexes and a measure of the output of r indexes, so each has a corresponding efficiency contribution value; this process can be expressed as follows:
According to the above formula, V and U can always be found in mathematics so that ≤ 1. In the evaluation process, if the evaluation value is 1, the corresponding indicator is valid; otherwise, it is invalid. However, the inferiority of the invalid DMUs cannot be easily compared and analyzed from the size of the evaluation value. To overcome this defect, the first evaluation of all DMUs was carried out, and the DMU evaluated as 1 was removed. The remaining DMUs are then evaluated until the remaining DMUs are invalid. The first evaluation of the effective indicators is the most important and is followed in importance by the second result. The index evaluation calculation and classification were then carried out in turn. When hydrological conditions are not intensive, the corresponding indicators are invalid in the model. The evaluation results are provided in Table 3.
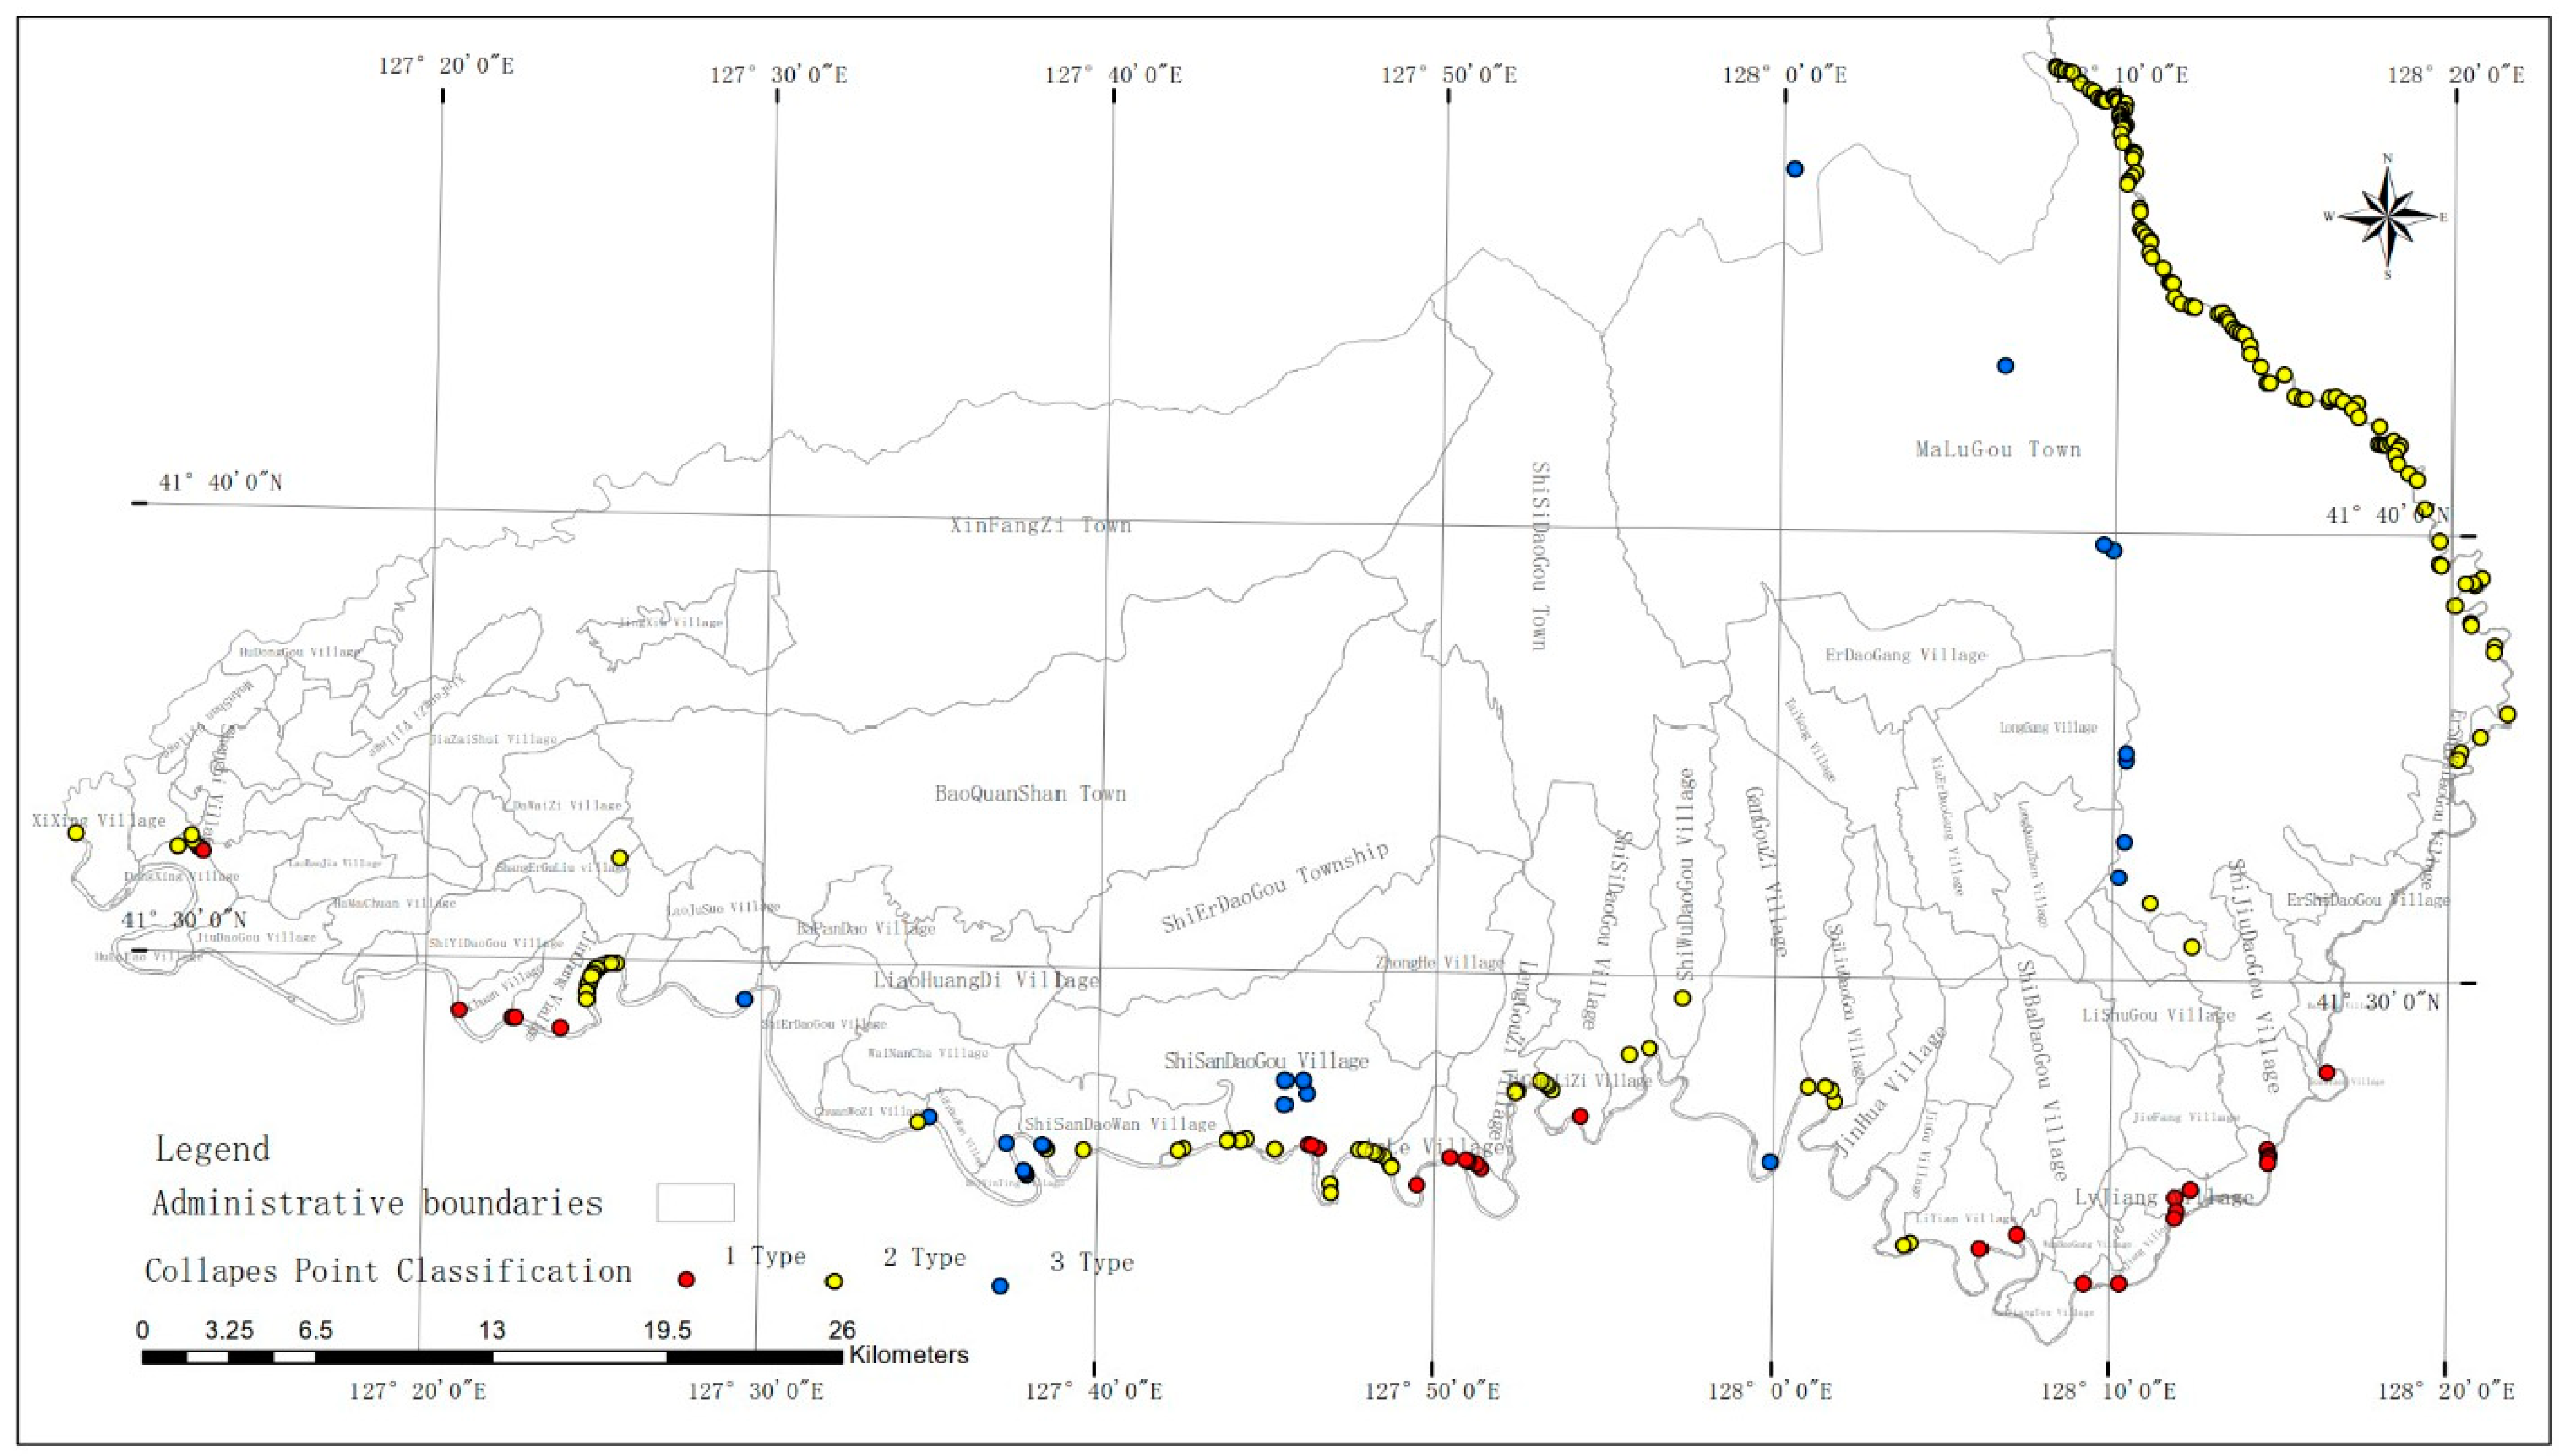
The results of the three evaluations were spatially superimposed and analyzed according to the range of indicators that correspond to the effective value, and the spatial distribution map was generated and is provided in Figure 2. The 219 collapse points in the entire area are divided into three categories, namely those affected by rainfall, human activities, and gravity.
4.2. Discussion
(1) Judging from the overall distribution of the evaluation results, the differential characteristics of geological hazards in the study region are obvious, and the driving mechanisms can be divided into three categories. The first category (Type 1 in Figure 2) is that which is controlled by the intensity of human activities and is mainly distributed in Lujiang Village, Yanjiang Village, Jiguan Particle Village, and Anle Village. The second category of collapse points (Type 2 in Figure 2) is that which is affected by rainfall. The regional location is concentrated west of Malugou Town, particularly the road slope located to the north of the 21st ditch and to the south of the Yalu River Grand Canyon scenic spot. The third category of collapse points, which is characterized by ragged topography (Type 3 in Figure 2), is easily affected by slope gravity stress, and is characterized by slope deformation.
(2) According to the evaluation results, the effective value of the first type of collapse point is less than 50°, the terrain relief is between 51 and 80 meters, the human activity is very strong, the gully is moderately dense, and the regional vegetation conditions are good. There are 31 collapse disaster points affected by this combination of indicators, and they are indicated by the red points in Figure 2. These collapse disaster points are mainly concentrated along the highways of the Democratic Village, Lujiang Village, Jiguanzizi Village, Anle Village, and Dongxing Village. High-resolution remote sensing images and related data of these areas were collected, and it was found that the administrative populations in these disaster areas were the most concentrated. Public disaster prevention work should therefore be conducted in these areas to enhance disaster prevention awareness. In addition, economic investment to remedy the unstable slopes should be strengthened, and engineering treatments should be carried out to prevent the loss of life and property.
(3) The second type of collapse point is characterized by a terrain relief of less than 50 meters and a general vegetation index. As can be determined from the actual surveyed microtopography, the slopes of the collapse points in this category are steep, and the rock mass is broken. In terms of the effective value of the second evaluation in Table 2, rainfall is particularly prominent, and ranges from 700 to more than 850 mm per year. Rainfall is considered to be the main cause of collapse in this study region; Malugou Town exhibits the most concentrated rainfall from the 21st Ditch to the Changbai Mountain Grand Canyon. According to a 1:250,000 geological map and actual investigation, the area was formed by the accumulation of volcanic ash and volcanic debris that belong to the horizontal stratum, and the spalled geotechnical body is easily affected by rainfall. The collapse points in 13 Daowan Village, 13 Dadaogou Village, Jinchang Village, and 16 Daogou Village are particularly important, as there are many medium-sized and relatively densely populated areas in these regions, and disaster points in these villages should be avoided during rainfall.
(4) The third type of collapse point is that which is primarily affected by gravity stress. These areas are characterized by poorly developed vegetation and weak human activities and are mostly in densely populated areas. Providing warning signs and taking slight precautions are recommended for these areas.
(5) According to the analysis results, the impact factors of collapse disasters are different due to varying regional environments. Whether for risk assessment or vulnerability assessment, it is necessary to analyze the indicators of the region as a whole. Above all, special regional conditions should be considered to appropriately set the index weights, otherwise the analysis results may deviate and the study may be invalid.
5. Conclusions
Starting from the essence of geological collapse disaster, taking Changbai Korean Autonomous County as an example, the purpose of this study was to explore the differentiation characteristics and driving mechanism of the main controlling factors of collapse disaster in the regional environment. The indicators such as landform, human activity intensity, rock and soil structure, hydrological conditions, vegetation status and meteorological conditions were selected, and the scale of collapse disaster was included in the evaluation process. The DEA model was used for analysis. It was found that collapse disaster has obvious differentiation characteristics and different disaster driving mechanisms. The research results not only provide a reference basis for the accurate monitoring, early warning, risk assessment, disaster prevention, and reduction in geological collapse disasters in the study area but also, due to the complexity of geological collapse disasters, a reminder for relevant researchers that they should not unify the indicators when studying the target area but should fully understand the study area. This method is a recommended scheme when analyzing the contribution rate of indicators affecting disaster points and then carrying out further research. This study represents not only a case but also an idea, which provides a reference for researchers in the field.
Author Contributions
Methodology, funding acquisition, supervision, project administration, S.Z.; Formal analysis, investigation, data curation, writing original draft preparation, L.Q. All authors have read and agreed to the published version of the manuscript.
Funding
This research was funded by the Natural Science Foundation of Heilongjiang Province of China (No. TD2019D002), Key Joint Program of National Natural Science Foundation of China (NSFC) and Heilongjiang Province for Regional Development (No. U20A2082), National Natural Science Foundation of China (NSFC) (No. 41971151).
Acknowledgments
I would like to show my deepest gratitude to my supervisor, ShuYing Zang, a respectable, responsible tutor, who has provided me with valuable guidance in every stage of the writing of this thesis. Without her enlightening instruction, impressive kindness and patience, I could not have completed my paper.
Conflicts of Interest
We declare that we have no conflict of interest.
References
- Li, S.C.; Wu, J. A multi-factor comprehensive risk assessment method of karst tunnelsand its engineering application. Bull. Eng. Geol. Environ. 2019, 78, 1761–1776. [Google Scholar] [CrossRef]
- Zhao, H.; Tian, W.-P.; Li, J.-C.; Ma, B.-C. Hazard zoning of trunk highway slope disasters: A case study in northern Shaanxi, China. Bull. Eng. Geol. Environ. 2018, 77, 1355–1364. [Google Scholar] [CrossRef]
- Pappalardo, G.; Mineo, S. Rockfall hazard and risk assessment: The promontory of the pre-hellenic village Castelmola case, North-Eastern Sicily (Italy). In Engineering Geology for Society and Territory; Lollino, G., Manconi, A., Clague, J., Shan, W., Chiarle, M., Eds.; Springer International Publishing: Cham, Switzerland, 2015; Volume 2, pp. 1989–1993. [Google Scholar]
- Tang, C.; Ma, G.C. Small regional geohazards susceptibility mapping based on geomorphic unit. Sci. Geogr. Sin. 2015, 35, 91–98. [Google Scholar]
- Hu, S.; Wang, J.; Zhou, C.; Zhang, J. Research on the risk assessment and prevent to collapse disaster in Huangshan scenic area. Geogr. Res. 2013, 32, 1814–1823. [Google Scholar]
- Giordan, D.; Cignetti, M.; Godone, D.; Bertolo, D.; Paganone, M. Definition of an operative methodology for the management of rockfalls along with the road network. Sustainability 2021, 13, 7669. [Google Scholar] [CrossRef]
- Yin, K.; Chen, L.; Zhang, G. Regional landslide hazard warning and risk assessment. Earth Sci. Front. 2007, 14, 85–97. [Google Scholar] [CrossRef]
- Huang, J.; Liu, Y.; Ma, L. Assessment of regional vulnerability to natural hazards in China using a DEA model. Int. J. Disaster Risk Sci. 2011, 2, 41–48. [Google Scholar] [CrossRef] [Green Version]
- Guzzetti, F.; Reichenbach, P.; Wieczorek, G.F. Rockfall hazard and risk assessment in the Yosemite Valley, California, USA. Nat. Hazards Earth Syst. Sci. 2003, 3, 491–503. [Google Scholar] [CrossRef] [Green Version]
- Bozzano, F.; Esposito, C.; Fantini, A.; Fiorucci, M.; Martino, S.; Mazzanti, P.; Prestininzi, A.; Rivellino, S.; Rocca, A.; Mugnozza, G.S. Multisensor landslide monitoring as a challenge for early warning: From process based to statistic based approaches. In Advancing Culture of Living with Landslides; Springer: Berlin/Heidelberg, Germany, 2017; Volume 3, pp. 33–39. [Google Scholar]
- Zhang, G.P.; Xu, J.; Bi, B.G. Relations of landslide and debris flow hazards to environmental factors. Chin. J. Appl. Ecol. 2009, 20, 653–658. [Google Scholar]
- Li, D.-X.; He, S.-M.; Li, J.-G. Effect of rainfall on slope stability in mountainous area. Chin. J. Geol. Hazard Control. 2011, 22, 7–10. [Google Scholar]
- Yang, C.F.; Wang, H.; Yang, M. stability of hawk rock collapsed dangerous rock. J. Shenyang Univ. 2018, 30, 390–394. [Google Scholar]
- Chen, J.; Peng, S.-Q.; Liu, G.L. Stability analysis of unstable rock collapsing based on limit analysis upper bound method. J. Henan Polytech. Univ. 2009, 28, 180–184. [Google Scholar]
- Geniş, M.; Sakız, U.; Çolak Aydıner, B. A stability assessment of the rockfall problem around the Gökgöl Tunnel (Zonguldak, Turkey). Bull. Eng. Geol. Environ. 2017, 76, 1237–1248. [Google Scholar] [CrossRef]
- Verma, A.K.; Sardana, S.; Sharma, P.; Dinpuia, L.; Singh, T.N. Investigation of rockfall-prone road cut slope near Lengpui Airport. J. Rock Mech. Geotech. Eng. 2019, 11, 146–158. [Google Scholar] [CrossRef]
- Song, Y.; Cheng, W.-M.; Bo, Y.-C. Occurrence probability estimination of landslides and debris flows in mountainous areas surrongding the Miyun Reservoir. Prog. Geogr. 2011, 30, 343–350. [Google Scholar]
- Ferrari, F.; Giacomini, A.; Thoeni, K. Qualitative rockfall hazard assessment: A comprehensive review of current practices. Rock Mech. Rock Eng. 2016, 49, 2865–2922. [Google Scholar] [CrossRef]
- Champati Ray, P.K.; Suvarna, D.; Lakhera, R.C.; Sati, S. Fuzzy-based method for landslide hazard assessment in active seismic zone of Himalaya. Landslides 2007, 4, 101–111. [Google Scholar] [CrossRef]
- Ni, X.J.; Nan, Y.; Cui, X.Y.; Liu, G.M.; Liu, C.; Yao, K. Study on comprehensive assessment of ecological security in Changbai Mountain Region based on multi-hazard natural disaster risk. Geogr. Res. 2014, 32, 1348. [Google Scholar]
- Du, D.; Pang, Q.; Wu, Y. Mordern Comprehensive Evaluation Method and Case Selection; Tsinghua University Press: Beijing, China, 2008; pp. 62–63. [Google Scholar]
- Qiao, Z.-K.; Huang, D.-N.; Zhou, W.-Y.; Gao, X.-H. Research of geological structure of Changbai mountain basalt cover. Prog. Geophys. 2016, 31, 1991–1997. [Google Scholar]
- Wei, L.-W.; Chen, H.; Lee, C.-F.; Huang, W.-K.; Lin, M.-L.; Chi, C.-C.; Lin, H.H. The mechanism of rockfall disaster: A case study from Badouzih, Keelung, in northern Taiwan. Eng. Geol. 2014, 183, 116–126. [Google Scholar] [CrossRef]
- Valjarević, A.; Djekić, T.; Stevanović, V.; Ivanović, R.; Jandziković, B. GIS numerical and remote sensing analyses of forest changes in the Toplica region for the period of 1953–2013. Appl. Geogr. 2018, 92, 131–139. [Google Scholar] [CrossRef]
- Bell, D.H. High intensity rainstorms and geological hazaeds: Cyclone Alison, March 1975, Kaikoura, New Zealand. Bull. Int. Assoc. Eng. Geol. 1976, 13, 189–200. [Google Scholar] [CrossRef]
- Chen, T.C.; Jhang, P.Y.; Ciou, H.J. Topographic characteristic of the rainfall-inducing landslide in slate stratum—Case of ai-liao catchment, South Taiwan. In Geotechnical Hazards from Large Earthquakes and Heavy Rainfalls; Springer: Berlin/Heidelberg, Germany, 2017; pp. 249–258. Available online: https://link.springer.com/chapter/10.1007/978-4-431-56205-4_23 (accessed on 19 December 2021).
- Zhang, G. Principle and Method of Natural Disaster Risk Assessment and Zoning; Meteorological Press: Beijing, China, 2014; pp. 56–59. [Google Scholar]
- Ansari, M.K.; Ahmed, M.; Rajesh Singh, T.N.; Ghalayani, I. Rainfall, a major cause for rockfall hazard along the roadways, highways and railways on hilly terrains in India. In Engineering Geology for Society and Territory; Lollino, G., Manconi, A., Clague, J., Shan, W., Chiarle, M., Eds.; Springer: Cham, Switzerland, 2015; Volume 1, pp. 457–460. [Google Scholar]
- DZ/T0261-2014; Specification of Comprehensive Survey for Landslide, Collapse and Debris Flow (1:50,000). Geological and Mineral Industry Standards of the People’s Republic of China. Beijing, China. 2014. Available online: https://max.book118.com/html/2019/0809/8002001061002041.shtm (accessed on 19 December 2021).
- Chunyu, W. On the artificial geological disaster and geoenvironment. J. Eng. Geol. 1997, 5, 362–367. [Google Scholar]
- Guo, F.-F.; Yang, N.; Meng, H.; Zhang, Y.-Q.; Ye, B.-Y. Application of the relief amplititude and slope analysis to regional landslide hazard assessments. Geol. China 2008, 35, 131–143. [Google Scholar]
- Fanos, A.; Pradhan, B.; Mansor, S.; Yusoff, Z.M.; bin Abdullah, A.F. A hybrid model using machine learning methods and GIS for potential rockfall source identification from airborne laser scanning data. Landslides. 2018, 15, 1833–1850. [Google Scholar] [CrossRef]
- Zhu, L.; Yin, K.; Zhang, L.; Li, M. Risk ayalysis system of geo-hazards by using GIS technique. J. Eng. Geol. 2002, 10, 431–432. [Google Scholar]
- Fu, W.J.; Wang, G.J. Assessment of regional geological disaster on grey clustering methed in Shulan. Appl. Mech. Mater. 2013, 295–298, 673. Available online: https://www.scientific.net/AMM.295-298.673 (accessed on 19 December 2021). [CrossRef]
- Chau, K.T.; Wong, R.H.C.; Liu, J.; Lee, C.F. Rockfall hazard analysis for Hong Kong based on rockfall inventory. Rock Mech. Rock Eng. 2003, 36, 383–408. [Google Scholar] [CrossRef]
- Liu, Y.; Sun, H.; Gong, J. Geologic hazard susceptibility and disaster risk mapping based on information value model for the MianChi county, China. IOP Conf. Ser. Earth Environ. Sci. 2018, 199, 022039. [Google Scholar]
- Hai, X. A Study on Risk Assessment About Geological Disasters and Hazard Prevention and Mitigation Measures of Fengjie in Chongqing. 2008. Available online: http://cdmd.cnki.com.cn/article/cdmd-10635-2008093047.htm (accessed on 19 December 2021).
- Liu, Y.; HuanG, J.-Y.; Ma, L. The assessment of regional vulnerability to natural disasters in China based on DEA model. Geogr. Res. 2010, 29, 1153–1162. [Google Scholar]
- Saro, L.; Biswajeet, P. Probabilistic landslide hazards and risk mapping on Penang Island, Malaysia. J. Earth Syst. Sci. 2006, 115, 661–672. [Google Scholar]
- Gariano, S.; Rianna, G.; Petrucci, O.; Guzzetti, F. Assessing future changes in the occurrence of rainfall-induced landslides at a regional scale. Sci. Total Environ. 2017, 596–597, 417–426. [Google Scholar] [CrossRef] [PubMed]
- Zeng, H.; Guo, Q.-H.; Yu, H. Spatial analysis of artificial landscape transform in FengGang town, DongGuan city. Acta Ecol. Sin. 1999, 19, 298–303. [Google Scholar]
- GB50021-2001. General Administration of Quality Supervision, Inspection and Quarantine of the People’s Republic of China. Code for Investigation of Geotechnical Engineering; Architecture & Building Press: Beijing, China, 2009. [Google Scholar]
- Chen, S.; Zhao, Y. Geo-Analysis of Remote Sensing; The Mapping Publishing Company: Beijing, China, 1990; pp. 211–212. [Google Scholar]
- Qi, J.; Chehbouni, A.; Huete, A.R.; Kerr, Y.H.; Sorooshian, S. A modified soil ad-justed vegetation index. Remote Sens. Environ. 1994, 48, 119–126. [Google Scholar] [CrossRef]
Figure 1.
Location of the Changebai within JiLin province with elevation data.

Figure 2.
Differentiation characteristics, driving classification, and distribution map of collapse disasters.
Figure 2.
Differentiation characteristics, driving classification, and distribution map of collapse disasters.


Table 1.
Environmental characteristics in major areas and typical collapse disaster points.
| Spatial Location Description | Environmental Characteristics | Typical Disaster Point Picture |
|---|---|---|
| Badaogou to Changbai County section of the Yalu River Highway | The topography is an erosion terrace and a low-lying structure. The slope of the natural terrain is 0–45°. The lithology of the formation is dominated by the Nanfen Formation and the Wanlong Formation limestone, and some areas are Quaternary gravel soil and Wanlong Formation shale. There are 85 collapse points in the whole area. |  |
| Ershierdaogou to the south door of the Changbai Mountain Scenic Area section of the Yalu River Highway | The topography and landforms are erosion accumulation terraces and tectonic low mountains. The natural terrain slope is 0–45°. The lithology of the formation is dominated by basalt and is strongly weathered. A total of 65 geological disasters were found. |  |
| Located in the west of Changbai County, centered on Badaogou Town and New House Town | The topography is mainly composed of low mountains. The slope of the natural terrain is 5–45°. The lithology of the strata is mainly Ordovician and Cambrian limestone, some of which is basalt. The diatomite is mainly distributed in this area. There are many villages and strong human activities. A total of eight geological disasters have been discovered. |  |
| Changbai County to Ershiyidaogou section | The topography is mainly composed of low mountains, the slope of natural terrain is 10– 45°, and the lithology of the strata is dominated by Jurassic neutral lava. The human activities are medium, and a total of seven collapses were found. |  |
| From the south gate of Changbai Mountain to the Tianchi section of Changbai Mountain, on both sides of the road | The topography is mainly composed of low mountains, the slope of natural terrain is 5–45°, and the lithology of the strata is mainly Quaternary Pleistocene basalt; some areas are Quaternary Pleistocene rough lava and tuff, and a total of 30 collapses were found. |  |
| Changbai County to the Songjianghe section of highway | The topography is mainly characterized by low mountains, partially erosional terraces, with natural slopes of 5–45°, and the lithology of the strata is dominated by Quaternary Pleistocene basalts. A total of 21 collapses were found. |  |
Table notes: ① The number in the picture is the number of field measured points; ② Due to the space limitation of the table, only the typical pictures of each region can be quoted.
Table 2.
Input and output indicator values of decision units.
| Input Index | Collapse Attribute (DEA Output) | ||||||||||
|---|---|---|---|---|---|---|---|---|---|---|---|
| Danger Level | Scale of Collapse | Slope Stability | |||||||||
| Small | Medium | Large | Small | Medium | Large | Stable | Less Stable | Unstable | |||
| Topography | slope (°) | <50 | 105 | 0 | 0 | 101 | 10 | 0 | 1 | 101 | 9 |
| 51~60 | 26 | 0 | 0 | 21 | 1 | 0 | 0 | 11 | 11 | ||
| 61~70 | 32 | 1 | 0 | 31 | 3 | 0 | 0 | 18 | 16 | ||
| >71 | 52 | 0 | 0 | 46 | 6 | 0 | 0 | 15 | 37 | ||
| relief (m) | <50 | 212 | 1 | 0 | 179 | 14 | 0 | 1 | 136 | 54 | |
| 51~80 | 3 | 0 | 0 | 20 | 6 | 0 | 0 | 9 | 18 | ||
| >81 | 0 | 0 | 0 | 0 | 0 | 0 | 0 | 0 | 1 | ||
| Human activity intensity | human activity intensity index (HAI) | ≥2.5 | 38 | 1 | 0 | 25 | 6 | 0 | 0 | 18 | 19 |
| 1~2.5 | 58 | 0 | 0 | 50 | 7 | 0 | 0 | 22 | 28 | ||
| <1 | 119 | 0 | 0 | 124 | 7 | 0 | 1 | 105 | 26 | ||
| Structure of rock and soil | structural types of rock mass | bulk | 37 | 0 | 0 | 37 | 3 | 0 | 0 | 35 | 3 |
| fragment | 62 | 0 | 0 | 58 | 4 | 0 | 1 | 54 | 8 | ||
| block | 72 | 1 | 0 | 66 | 9 | 0 | 0 | 38 | 36 | ||
| overall block | 44 | 0 | 0 | 38 | 4 | 0 | 0 | 18 | 26 | ||
| Hydrology | density of the gully | dense | 200 | 1 | 0 | 185 | 20 | 0 | 0 | 137 | 68 |
| medium dense | 15 | 0 | 0 | 14 | 0 | 0 | 1 | 8 | 5 | ||
| non-dense | 0 | 0 | 0 | 0 | 0 | 0 | 0 | 0 | 0 | ||
| Vegetation | vegetation coverage index (MSAVI) | ≤0.3 | 153 | 1 | 0 | 129 | 15 | 0 | 1 | 106 | 39 |
| 0.3~0.5 | 38 | 0 | 0 | 34 | 3 | 0 | 0 | 18 | 13 | ||
| >0.5 | 24 | 0 | 0 | 36 | 2 | 0 | 0 | 21 | 21 | ||
| Meteorological | average rainfall (mm) | >850 | 30 | 0 | 0 | 25 | 3 | 0 | 0 | 22 | 6 |
| 800~850 | 18 | 0 | 0 | 11 | 0 | 0 | 0 | 16 | 2 | ||
| 700~800 | 121 | 0 | 0 | 113 | 11 | 0 | 1 | 83 | 33 | ||
| <700 | 46 | 1 | 0 | 50 | 6 | 0 | 0 | 24 | 32 | ||
Table 3.
Evaluation index and effectiveness evaluation results of the DEA model.
| DMU | Primary Indicators | Secondary Indicators | Indicator Attribute Value | Evaluation Optimization Value | Evaluation Process | ||
|---|---|---|---|---|---|---|---|
| First Evaluation Value | Second Evaluation Value | Third Evaluation Value | |||||
| 1 | Topography | slope (°) | <50 | 111 | 1 | -- | -- |
| 2 | 51~60 | 22 | 0.950994 | 1 | -- | ||
| 3 | 61~70 | 34 | 0.985294 | 1 | -- | ||
| 4 | >71 | 52 | 0.8125 | 1 | -- | ||
| 5 | relief (m) | <50 | 188 | 0.946373 | 1 | -- | |
| 6 | 51~80 | 29 | 1 | -- | -- | ||
| 7 | >81 | 2 | 0 | 0.702703 | 1 | ||
| 8 | Human activity intensity | human activity intensity index (HAI) | ≥2.5 | 30 | 1 | -- | -- |
| 9 | 1~2.5 | 57 | 0.824424 | 1 | -- | ||
| 10 | <1 | 132 | 0.848485 | 0.987436 | 1 | ||
| 11 | Structure of rock and soil | structure types of rock mass | granular | 38 | 0.921053 | 1 | -- |
| 12 | fragmentation | 62 | 0.983871 | 1 | -- | ||
| 13 | block crack | 75 | 0.783125 | 1 | -- | ||
| 14 | bulk block | 44 | 0.810369 | 0.997029 | 1 | ||
| 15 | Hydrology | density of the gully | concentration | 204 | 0.818145 | 1 | -- |
| 16 | mid-concentration | 15 | 1 | -- | -- | ||
| 17 | non-concentration | 0 | −1 × 1030 | −1 × 1030 | -- | ||
| 18 | Vegetation | vegetation coverage index | ≤0.3 | 164 | 0.798181 | 0.947306 | 1 |
| 19 | 0.3~0.5 | 34 | 0.909237 | 1 | -- | ||
| 20 | >0.5 | 21 | 1 | -- | -- | ||
| 21 | Meteorological | average rainfall (mm) | >850 | 28 | 0.905152 | 1 | -- |
| 22 | 800~850 | 18 | 0.888889 | 1 | -- | ||
| 23 | 700~800 | 117 | 0.888609 | 1 | -- | ||
| 24 | <700 | 56 | 0.796131 | 1 | -- | ||
Publisher’s Note: MDPI stays neutral with regard to jurisdictional claims in published maps and institutional affiliations. |
© 2022 by the authors. Licensee MDPI, Basel, Switzerland. This article is an open access article distributed under the terms and conditions of the Creative Commons Attribution (CC BY) license (https://creativecommons.org/licenses/by/4.0/).
Share and Cite
MDPI and ACS Style
Qian, L.; Zang, S. Differentiation Rule and Driving Mechanisms of Collapse Disasters in Changbai County. Sustainability 2022, 14, 2074. https://doi.org/10.3390/su14042074
AMA Style
Qian L, Zang S. Differentiation Rule and Driving Mechanisms of Collapse Disasters in Changbai County. Sustainability. 2022; 14(4):2074. https://doi.org/10.3390/su14042074
Chicago/Turabian StyleQian, Lihui, and Shuying Zang. 2022. "Differentiation Rule and Driving Mechanisms of Collapse Disasters in Changbai County" Sustainability 14, no. 4: 2074. https://doi.org/10.3390/su14042074
Note that from the first issue of 2016, this journal uses article numbers instead of page numbers. See further details here.