
Application of the Perceived Popularity of Sports to Support the Sustainable Management of Sports Organizations


Department of Management Theories, Faculty of Management Science and Informatics, University of Žilina, 010 26 Žilina, Slovakia
*
Author to whom correspondence should be addressed.
Sustainability 2022, 14(3), 1927; https://doi.org/10.3390/su14031927
Submission received: 15 November 2021
/
Revised: 25 January 2022
/
Accepted: 1 February 2022
/
Published: 8 February 2022
(This article belongs to the Section Sustainable Management)
Abstract
:The operations of sports organizations must be managed to create value in the long run. This explicit management will support their efficiency, competitiveness, and sustainability. The key concept measured in this study was the popularity of sports. This concept is a pivotal element in influencing the acquisition of financial contributions for sports organizations (from the state and sponsors) as well as in attracting new members. We conducted an online questionnaire in 2021 focusing on the concept of the perceived popularity of sports in Slovakia. The number of observations was 338, out of the total population of Slovak citizens over the age of 15. We also applied other methods, including content analysis, induction, deduction, comparison, and synthesis analyses. The analysis of the data led to the following findings: in this context, the two most popular sports were hockey and European football; the greatest propensity for fan self-identification was observed for European football, hockey, and basketball; men who indicated a preference for cycling were significantly larger fans of the sport than women; European football and motorsports were almost exclusively preferred by men; skiing, volleyball, and tennis were preferred by women; and basketball was preferred by the youngest respondents. This study aimed to propose recommendations for approaching sustainability, assuming that increasing popularity represents an opportunity to increase a sport organizations’ membership base.
1. Introduction
While studying the subjective popularity of sports in different countries, selected characteristics need to be deliberately included so that new, applicable findings and conclusions can be drawn to direct the decision-making of policy makers and the managers of sports organizations. This area is not clearly defined in Slovakia. Therefore, we decided to focus on the subjective popularity of sports and its connection to the sustainable operation and development of sports organizations. To better describe the topic studied, the ideas in this article are introduced following a deductive flow from the more general concepts to individual, differentiated elements. Further in the text, these elements and specific points are directly accompanied by supporting or opposing opinions and the findings of other authors from around the world. This proves the importance and topicality of the research presented in this article.
In a comprehensive manner, sports represent a pervasive social institution that has grown into a multi-billion-dollar industry [1]. It is necessary to understand how changes in culture (as a fundamental component of society) are reflected in the perception of sports. An example of the impact of such changes on sports is skateboarding [2]. This sport was considered informal; however, it has become more and more accepted over time, which is reflected in the increased effort to create space for its practice. This means the use of buildings or unused swimming pools in cities that were adapted to the needs of skateboarding.
In the past, the traditional values of teamwork and collective interest were primarily recognized in sports [3,4]. Even though cooperation remains a much needed and important factor [5], sports are currently used as a tool to escape everyday life, as many people lead a stressful lifestyle in large cities [6,7,8,9]. One way to understand the motivation to practice sports is as a kind of rebellion, as it feeds individualism. These statements also relate to the use of sports as a liberating mechanism. An increased interest in a healthy lifestyle has led to the popularization of various sports, such as yoga [10,11]. Sports are increasingly perceived as an inseparable part of modern lifestyle [2].
In Slovakia, public funds are redistributed in the field of sports using a formula called the “Contribution to Recognized Sports” (the Ministry of Education, Science, Research, and Sports of the Slovak Republic). This formula includes the domestic or foreign popularity of a particular sport as a power factor of the impact of sports on society. On the other hand, the success of the national team at important international events affects (mostly positively) the economy, tourism, or the brand of individual destinations. These events include the World Cup or the Olympic Games, which raise awareness of the region as a tourist destination, helping stabilize and improve its long-term future prosperity by increasing economic activity and creating new jobs [12].
The popularity of sports has been studied, for example, among pupils of primary schools in Serbia. The authors of this study identified not only the favorite sports among the children, but they also proved that there were statistically significant differences in preferences in relation to genders. As they studied a different population, the question is whether a similar statistical difference would appear in the Slovak Republic [13].
In another study, the popularity of three selected sports (European football, basketball, and volleyball) in Estonia was analyzed. However, the methodology was different to that used in this article. The authors assumed the selected sports were the most popular sports in Estonia, and then analyzed historical data (1920–1940) from individual sports associations [14]. No such assumption was applied in this study. Our intention was to analyze what the population subjectively prefers.
Other authors have analyzed the reasons why alternative sports (those that cross the boundaries of traditional rules and celebrate the artistic quality) have become popular in the UK. They used qualitative methods in an effort to answer this research question [15].
Another study focused on national cricket teams. The authors analyzed Twitter data, a popular source for text analysis [16]. Twitter data was also used in [17] to analyze sports fans’ behavior. However, this approach could not be used in this study, since Twitter is not a popular social media platform in Slovakia. Only three percent of the Slovak population use it daily [18]. Hence, the data would not yield representative conclusions.
To explain the focus of this article, the following points are highlighted, representing the gap that we identified. Firstly, there is no defined notion of a sport’s popularity. Secondly, there is no methodology by which popularity can be approached and measured objectively. We primarily followed the analysis of the Slovak sports market’s specifics. The previously mentioned formula was applied here in the financing of sports, including a parameter of the popularity of the sport. In working with the popularity factor, the key issues that arise are the objective measurability and measurement frequency. The cause of these issues is often the organization of various events, even the events connected to the Olympic cycle.
For example, the success of baseball teams in Taiwan has made baseball a national sport [15]. Winning the Little League World Series has led to an increase in baseball’s popularity in Taiwan, while helping improve the performance of baseball teams within all age groups [19]. Thus, a multiplicative relationship between success in sports and their popularity is assumed.
The very notion of “sports’ popularity” is essentially abstract because there is no uniform definition for it [14,15,20,21,22,23,24]. This concept can be approached from different perspectives and can be divided into objective and subjective components. Objectively, the popularity of sports can be expressed by numerical indicators, such as the total number of spectators at sports events, the viewership of sports on TV, the number of sports clubs and athletes, etc. The subjective component represents the perception of a sport’s popularity among the entire country’s population. The research and questionnaire survey presented in this article focused specifically on this component. Subsequently, the popularity can be examined in relation to the active practice (physical activity) or passive consumption of sports (watching sports events in the media). These aspects of popularity should be differentiated.
Based on the position of a sport in the state’s budget allocation [25,26,27,28,29,30,31], it can be assumed that if the most popular sports receive the largest share of the budget, they will have better conditions for international success (assuming an efficient utilization of the funds). Thus, the state government would achieve the highest return on investment and the retroactive effect would be maximized in this way. The international success of less popular sports would not yield such a retroactive effect as that of the most popular sports on the domestic and foreign sports market. Therefore, it is necessary to examine the topic of the recognized sport’s popularity so that this abstract concept can be objectively quantified, at least to some extent. This will result in the efficient allocation of public funds. The sustainable operation of sports organizations (regarding the dimensions addressed in this article) will also be supported.
However, finding an objective approach to measure the popularity of sports is challenging. Capturing this concept in values that credibly indicate the population’s sports preferences is difficult. Measuring an individual sport’s popularity, thus making it objective, is a complex issue. Another aspect is the application of the knowledge gained this way to improve the formula for calculating the contribution to recognized sports (under the conditions of the Slovak legislation). The popularity of a sport can be assessed in a variety of ways and is affected by numerous factors [32,33,34]. However, it should be quantifiable to such an extent that it can be meaningfully applied in the formula. Its current form has hardly changed in Slovakia for several years, which may indicate its quality, or rather the lack of viable alternatives [35].
This article responds to the current absence of a uniform definition of a sport’s popularity, or a uniform approach to its evaluation. Therefore, we narrowed our attention to the “perceived popularity” of individual sports among the overall country’s population.
The value of this article stems from focusing on the topical issue of the sustainable operation of sports organizations. Its main contribution is the proposed methodology for analyzing a sport’s popularity, and its consideration within the policy makers’ and sports managers’ decision-making processes. The innovativeness of this study is found in its definition of specific terms, such as sports’ popularity and sustainable development of sports organizations.
The logical structure (underlying the purpose) of this research includes the sports organizations, sports management, the aspect of sustainability, and the inter-relationships between these elements. These relationships are described in more detail via the establishment of the research hypotheses in the literature review section. Specifically, the following direction is examined: the impact of sports financing from the state budget and the popularity of individual sports among the country’s population on the development and sustainability of sports organizations.
2. Literature Review
The analysis and summarization of the theoretical background available within the area of sports management in connection with the concept of sustainability formed the fundamental basis for conducting this research. This article presents the results of these activities. Its topic is set into a broader context of sustainable sports management and the management of the key sports organizations’ stakeholders. The literature review follows a logical sequence; beginning with an initial definition of sports spectators and sports fans, it continues with the effects of sports’ popularity on this specific market. Finally, the relevant aspects of the sustainable operation of modern sports organizations are linked to the perceived popularity of various sports from the perspective of the country’s population.
2.1. Sports Spectator, Sports Fan
Once the overall research area was set, specific sports management-related issues were selected for the study. This was performed by approaching sports’ popularity from the perspective of the public, then specifically focusing on people identifying themselves as true fans of individual sports. In this context, it was necessary to deal with the identification, definition, and mutual distinction of several terms, described below.
The first term is a sports spectator, who is not necessarily a sports fan [36]. The characteristics of a sports fan are the devotion and emotional involvement a person feels in relation to a particular sports organization [37]. It is in the sports organizations’ interest to attract as many genuine fans as possible, as fans who strongly identify with a particular team are willing to spend more on purchasing the team’s promotional items, and they are more likely to watch a match in person or via the media, pay more for tickets to an event, and remain loyal, even if the team’s athletic performance is poor [38,39].
This finding was also confirmed by Da Silva et al. [40], who claimed that such fan behavior grows into a long-term relationship with the club or the team. This is characterized by a considerable willingness to invest time and money, regardless of the quantifiable results. Additionally, the phenomenon of fans’ belief that their attendance at an event as well as their overall involvement influence their favorite teams’ final performance has been studied in the past as well [41].
2.2. Linking Popularity with Sustainability
Within the wide topic of sports management leading to the sustainable operation and development of sports organizations, the core concept studied and presented here is the subjective aspect of sports’ popularity. Following this premise, this article’s focus specifically reflects on the formula for calculating the value of the contribution for recognized sports, defined in the Slovak legislation as [35]:
where A is the percentage of the weight of a sporting achievement; B is the percentage of the weight of domestic interest in sports; C is the percentage of the weight of foreign interest in sports; (1 − 2 * A) is the percentage of the weight of the number of young people under 23 years of age; KVVD is the coefficient of the significance of the result in the category of adults as of September 30 of the year preceding the year for which the contribution to the recognized sport was provided; KVVM is the coefficient of significance of the result in the youth category as of September 30 of the year preceding the year for which the contribution to the recognized sport was provided; ZD is the domestic interest in the relevant recognized sport, calculated based on public opinion polls in the territory of the Slovak Republic, the conduction of which is ensured by the Ministry of Education every two years within one month after the end of the Olympic Games (the Ministry of Education publishes the results of these polls on its website within one month); ZZ is the foreign interest in the relevant recognized sport, calculated based on audience surveys abroad, the conduction of which is ensured by the Ministry of Education every two years, always by September 30 (the Ministry of Education publishes the results of these surveys on its website within one month); M23 is the average of the number of active athletes in a recognized sport under the age of 23 as of September 30 from two years preceding the year for which the contribution was provided to the recognized sport, as well as of September 30 of the year preceding the year for which the contribution was provided to the recognized sport—the number of active athletes includes all the athletes who have reached the age of 23 during the period being considered.
P = (A ∗ KVVD + A ∗ KVVM) ∗ (B ∗ ZD + C ∗ ZZ) + (1 − 2 ∗ A) ∗ M23,
More details on the components of the formula can be found in the corresponding act and other relevant regulations. The formula includes sports’ popularity from the perspective of the country’s population. We focused on this aspect directly related to the sustainability of sports and the sustainable development of sports organizations. Therefore, this article aims to propose recommendations for approaching the popularity of sports as one of the key elements for influencing the acquisition of monetary donations, which have other significant impacts on the sports industry as a whole and sports organizations as well.
An increase in popularity leads to an increase in a sports club’s membership base. On the other hand, it also increases the number of fans, achieving greater viewership of matches and other events. Higher viewership attracts more sponsors because more popular sports are more “visible”. Therefore, the impact of sports’ popularity goes beyond the contributions for the recognized sports as part of the state’s budget allocation.
All these aspects follow the support of sports’ sustainability and their sustainable development. If building popularity is considered a long-term process that supports the efficiency and competitiveness of a sports organization, the sustainability of this organization will also be continuously supported.
Building on the findings mentioned above and the results of previous research [42,43,44,45] associated with sports fans, two hypotheses were defined for this study. The hypotheses include the variables of gender and the self-identification of sports fans in the country’s population on which the concept of the popularity of sports was studied. Their validity will advance knowledge in relation to the aspect of the perceived popularity of sports, belonging within the broader field of sports management. In this field, the sports fans, and thus the fans of sports organizations, represent an important stakeholder group. Therefore, these findings will have an application in the management of sports organizations, leading to their sustainable operation and further development.
Studying such differences is important in relation to the sustainable operation of sports organizations, because the popularity of a sport is one of the parameters included in the formula for the allocation of public funds among the individual sports. In addition, the popularity of a sport also affects the opportunities for sports organizations to gain funds from private sponsors, as well as from their own business activity. Hypothesis H1 was defined as follows:
Hypothesis 1 (H1).
The distribution of a country’s population in terms of their identification as fans of particular sports, which is one of the elements of the subjectivity of a sport’s popularity, is statistically different among the sports people consider as their favorite.
In this context, the preference of a particular sport by the people within the population studied still describes the subjectivity of the sport’s popularity. The detection of differences based on gender then poses important issues to be solved by the policy makers as well as sports managers themselves, with the aim of the sustainable operation of sports organizations, the equality of opportunities, and the preservation of particular sports. Hypothesis H2 was defined as follows:
Hypothesis 2 (H2).
The distribution of the country’s population in terms of gender is statistically different among the individual sports people consider as their favorite.
2.3. The Sustainability of Sports Organizations and Their Sustainable Development
The need to address the sustainability of the operation and management of sports organizations is now strongly supported by the need to respond to the COVID-19 crisis. This is still relevant in the world and in Slovakia, and it has had a very serious impact on the operation of sports organizations at all levels (from national associations to small, local sports clubs).
The crisis caused by the pandemic has also dramatically highlighted the need for sports organizations to behave in accordance with business principles. This need existed even before, because the operation of various sports organizations is supported by the state budget; however, this support often does not cover the full costs of these organizations. Thus, from the perspective of their sustainability, it is critically important to seek new applications of business concepts and become economically sustainable [46,47,48,49].
Among the business aspects that need to be properly set and continuously managed in relation to sustainability itself, the marketing aspect stands out. This can be perceived in two directions. The first direction represents the marketing of an organization’s sports product [50,51,52], represented by a match or another sports event, where customers are the spectators (either on-site or via broadcasting on television). This aspect is still connected to the first strong stakeholder group, represented by the genuine fans and other customers buying the sports product. However, the appropriate setting of the sports organization’s marketing strategies also affects another stakeholder group—the sports organization’s members.
Achieving sustainability in the long run via building a membership base is only possible when organizations have well-functioning marketing aimed at gaining attention and reaching and recruiting new athletes from an early age [13,53]. It is an emphasis on this dimension of sustainability that makes it crucial to study the perceived popularity of different sports among the population depending on their age. The differences in the popularity of individual sports in different age groups [54,55,56] may be an indicator of a change in preferences in the younger generation. Therefore, another variable, age, and the differences in the popularity of sports connected to it were specifically analyzed.
Once again, the preference of a particular sport represents the subjective element of sports’ popularity. In connection to the points stated above, the age differences in sports’ popularity need to be monitored since they are linked to the ability of sports organizations to sustainably build and develop their membership bases. Thus, this is not only linked to the opportunities for sports organizations to gain funds from the state’s budget allocation, but it is closely linked to their very existence since no sport club can operate without a sufficient number of athletes. In this context, the third research hypothesis was defined as follows:
Hypothesis 3 (H3).
The distribution of the country’s population in terms of age categories is statistically different among the individual sports that people consider as their favorite.
The last hypothesis examines the influence of socio-economic factors on sports’ popularity. Thus far, demographic factors, such as gender and age, accompanied by respondents’ self-identification as sports fans were examined. The precondition for the definition of H4 was the difference in the subjective popularity of sports in relation to employment status and education.
Hypothesis 4 (H4).
Socio-economic factors and the particular types of sports themselves positively or negatively affect the subjective popularity of different sports.
Resulting from the interconnection of the specific aspects described above, a sports organization’s sustainable development can be defined as its long-term intention to be economically prosperous as well as to continuously build its membership base. This can be viewed as one dimension of the sustainable development of sports organizations—the economic dimension—followed by their sustainable operation in terms of human potential (represented by the athletes themselves). Another dimension of the sustainability of sports consists of the environmental issues and consequences of sports for the planet. However, this other dimension is not addressed in the study and should be approached in future research.
3. Materials and Methods
The different aspects and perspectives were explored using several methods, based on our deliberate decisions. To obtain a theoretical background review, a content analysis of professional literature, scientific publications, and research studies conducted thus far was applied. The thought processes of induction and deduction were applied, e.g., when working with the various factors (fan behavior, sports’ popularity, etc.) extracted from the scientific publications. While analyzing foreign surveys of sports popularity and the results of the questionnaire survey, comparison and synthesis was applied to examine the validity of the hypotheses using the appropriate statistical tests. The synthesis of the results is comprehensively presented in the conclusion section.
The literature review and the analysis of similar foreign surveys was followed by the planning and preparation of the original questionnaire survey, where the questions were established utilizing the knowledge base obtained. The data collection via the questionnaire was conducted in April and May 2021, with data collection being performed entirely online using Google Forms. It was disseminated via social networks (e.g., Facebook, Reddit, etc.) and email contacts. This is a common scientific procedure, used for example in [57].
The resulting data were exported to a .csv file. The R programming language (RStudio programming environment) and Python (Jupyter programming environment) were used for data processing, evaluation, hypothesis testing, and visualization. In addition to the integrated libraries, the dplyr and ggplot2 libraries were also used in R. For the Python libraries, pandas (handling data frames), matplotlib.pyplot (data visualization), and seaborn (as a ‘skin’ for pyplot visuals) were used.
The choice to combine the programming tools was a deliberate decision due to the need to address a diverse range of related issues. Each of the tools proved to be a more appropriate option for solving a different issue. For example, Python was selected to iterate over the sheets, and the ggplot2 package was used for data visualization due to its flexibility.
The statistical population of the questionnaire survey was characterized as 4,594,153 Slovak citizens over 15 years of age [58]. The number of observations included in the sample was 338, which shifted the margin of error to 5.33% (while applying the standard confidence level of 95%, calculated by the Raosoft sample size calculator). Therefore, the sample was considered as representative. The Cronbach alpha value calculated using the sample data was 0.759. This result was achieved by including questions with Likert scale variables (where points from 1 to 6 could be assigned to the statements) on all the observations. This was performed using the ‘ltm’ R package. A similar method was used in [59]. Thus, the reliability of the applied research tool was confirmed as well.
The purpose of the questionnaire was not only to identify the popularity ranking of sports, but also to test the significance of the association between this popularity, demographic variables, and fandom. This survey focused on mapping the subjective perception of sports’ popularity from the perspective of the whole population. The results of the quantitative analysis can therefore be described as a reflection of the population’s general opinion.
4. Results
This section, which presents the results of the research, first describes the detailed characteristics of the collected sample. Then it proceeds to the testing of the scientific hypotheses defined in the previous sections.
4.1. The Distribution of the Questionnaire Survey Sample by Gender and Age
The gender distribution of the data sample is represented by the following values: 60.9% men and 39.1% women. The gender distribution of the population of Slovakia over 15 years of age (4,591,487 citizens) is approximately 48.38% men (2,221,558 men) to 51.62% women (2,369,929 women) [58]. The difference in the gender distribution of the sample compared to the distribution of the overall population was not statistically different, based on the chi-squared test (chi-squared = 3.16; df = 1; p-value = 0.075).
However, the distribution of the sample by age was no longer consistent with the population-wide distribution (chi-squared = 68.68; df = 6; p-value < 0.001). Table 1 below shows a comparison of the population distribution and the sample distribution in relation to age groups.
Three age categories were selected for comparison purposes. The greatest portion of the sample consisted of respondents aged between 15 and 30 (259 responses; 76.63% of all responses received). This means that the online survey was mostly responded to by young people, which is not the same distribution as that of the whole population. The relevant results respect this specific sample’s attribute. However, the interests of the various age groups in the survey could also be interpreted as their different interests in the sports themselves.
4.2. Aggregated Results of the Questionnaire Survey on the Perceived Popularity of Sports
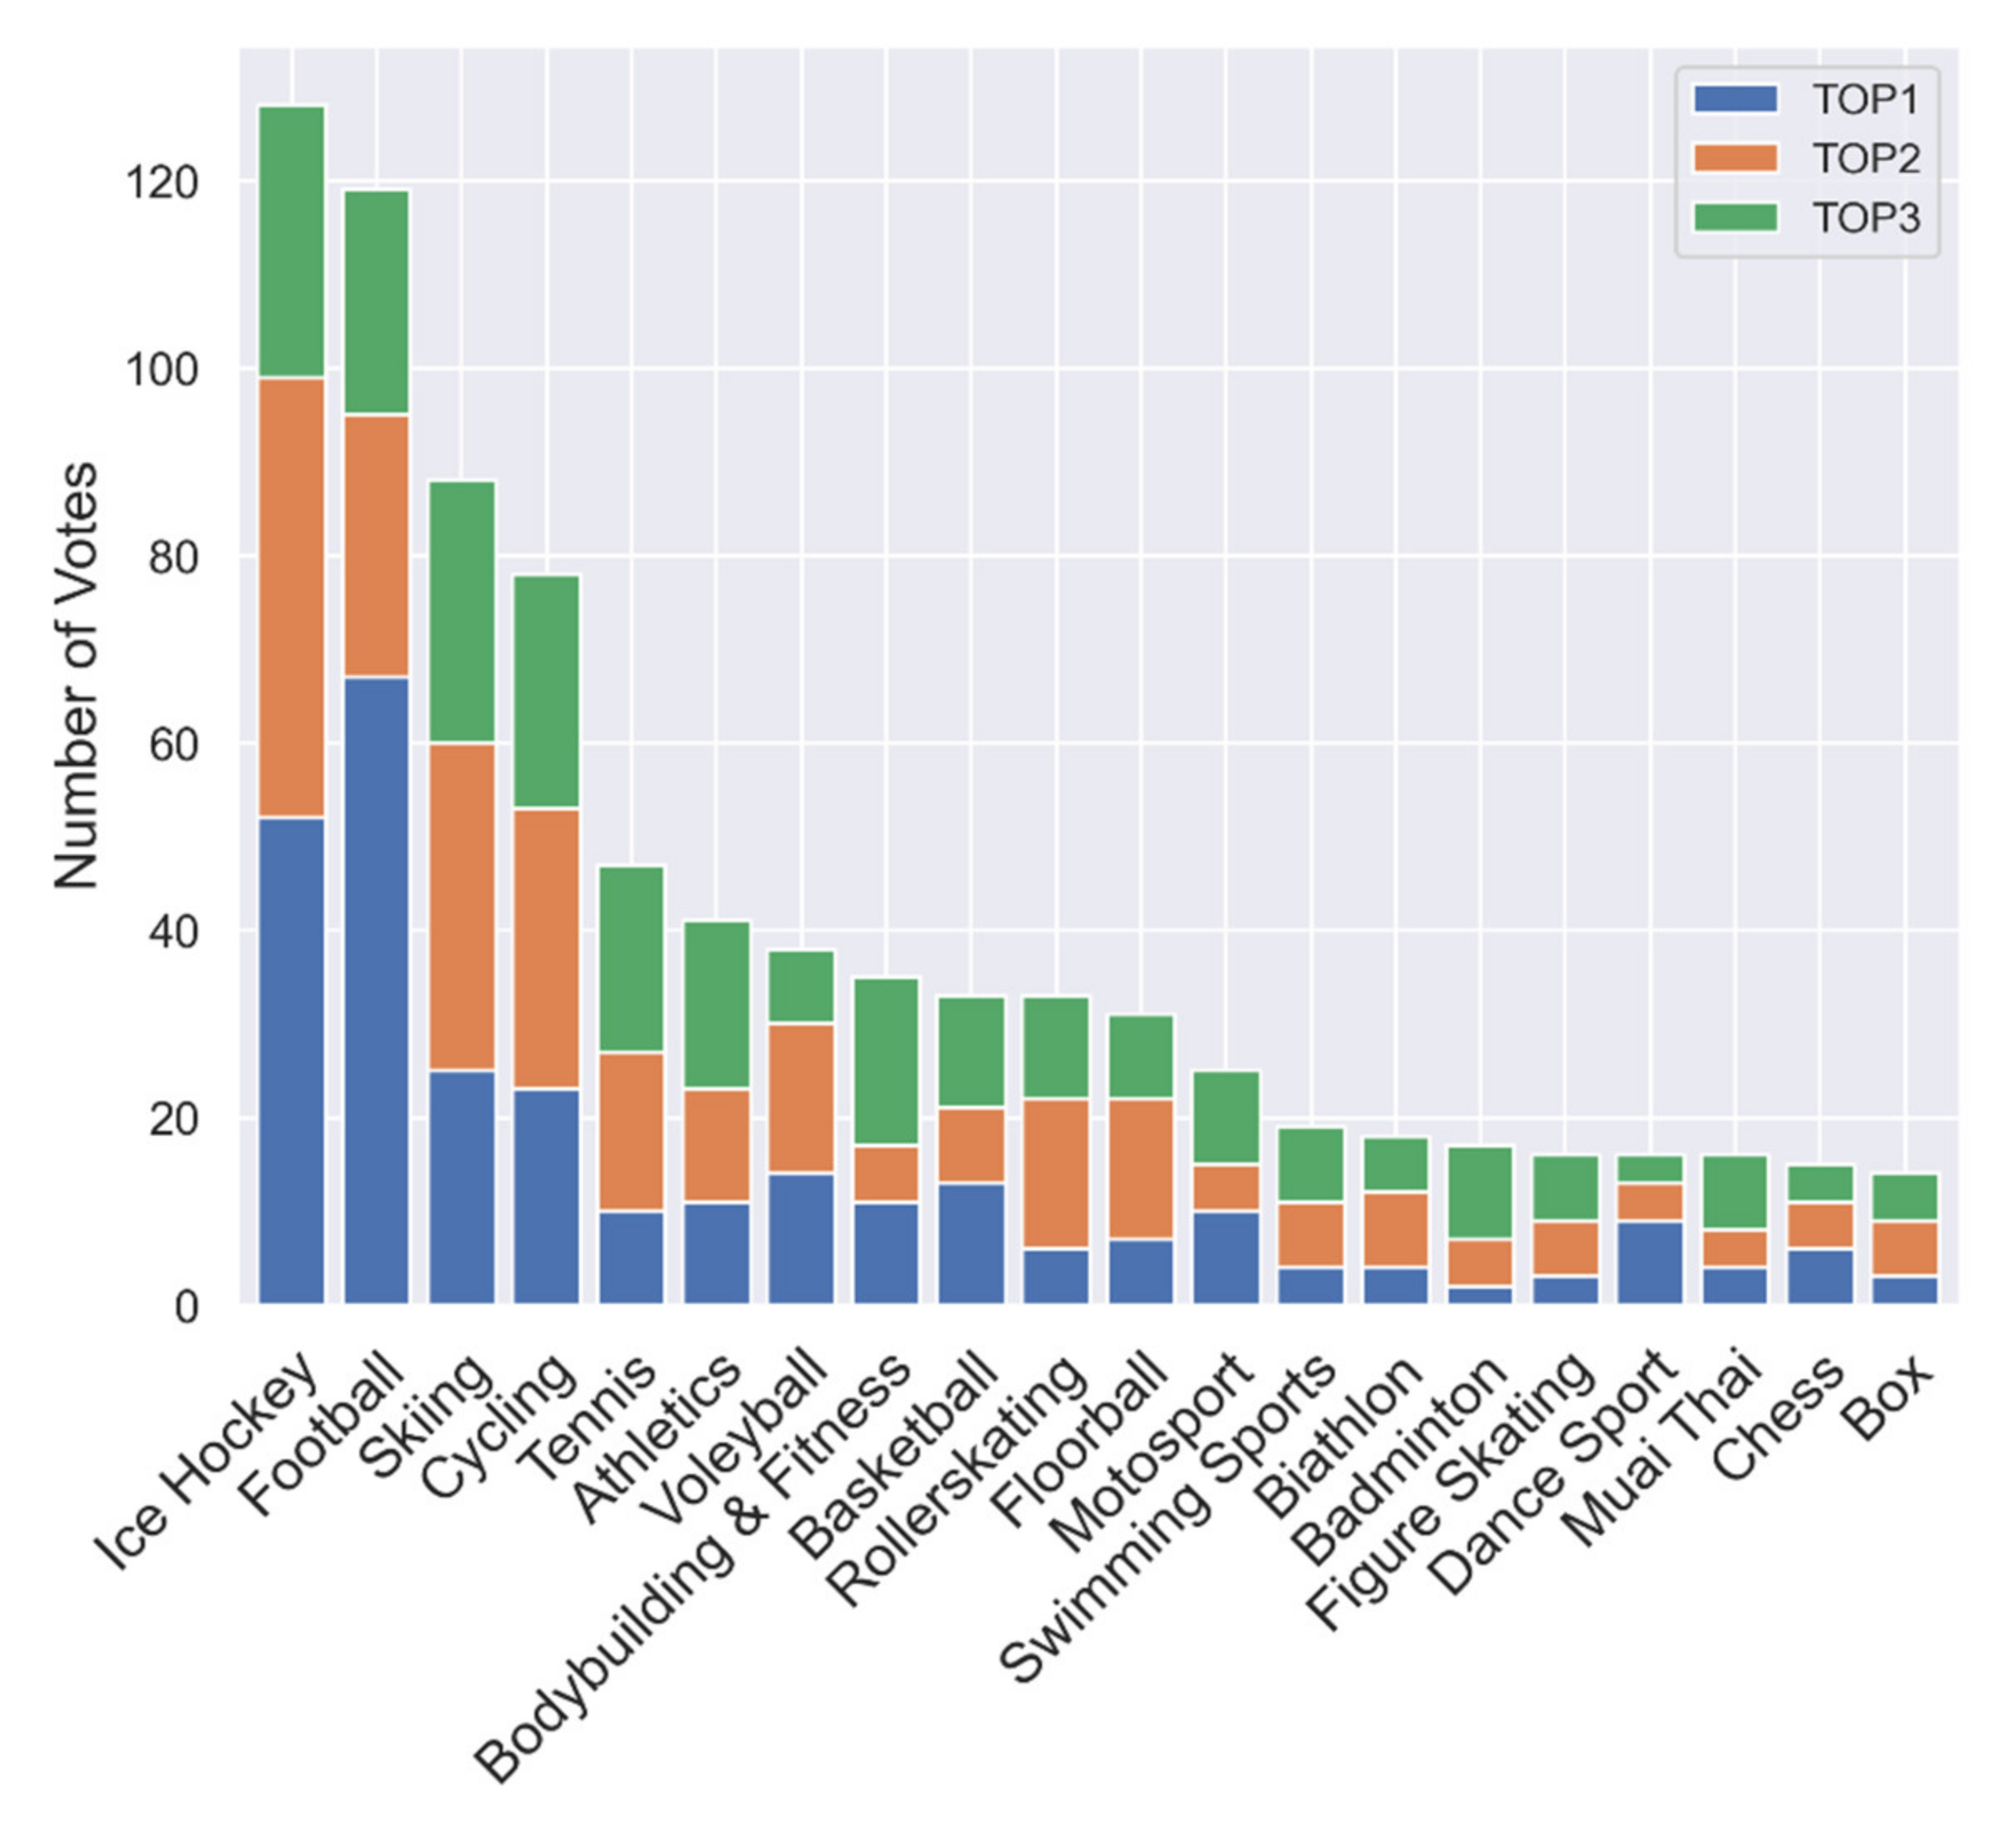
To evaluate the popularity of individual sports, a table was constructed with the number of responses for each of the three selected categories (TOP 1: the most favorite sport; TOP 2: the second most favorite sport; and TOP 3: the third most favorite sport). These were then summarized (the SUM variable in the summary table) and the sports were sorted in a descending order. The table was constructed using a for loop in Python, which sequentially traversed a sheet of the full statutory list of recognized sports and compared the results with the sheet of relevant variables from the pandas DataFrame dataset that was created. A graphical representation of the results is shown below (Figure 1).
Within the aggregated responses, ice hockey was the most popular sport type. However, European football (in Figure 1 and further in the text referred to as football) reached more responses in the TOP 1 category (67) compared to ice hockey (52). On the other hand, this phenomenon is aligned with the theoretical premises arguing that significant international success increases the sport’s popularity. Petra Vlhová won the downhill skiing World Cup in the month when the survey was conducted, which could have influenced the survey’s results. The fourth most popular sport type was cycling. In this case, the relatively high popularity may be explained by the long-term success of Peter Sagan, who popularized the sport of cycling in Slovakia with his achievements. The fifth place in overall popularity was taken by tennis (with the majority of TOP 2 and TOP 3 occurrences), followed by athletics, volleyball, bodybuilding and fitness, and basketball. The top ten sports were completed by roller skating, which had the largest representation in the TOP 2 category. Roller skating appeared in the top ten in connection to the instructions given to respondents to express their subjective feelings. Specifically, the dimensions of practicing and watching the sports may have been intertwined in their minds. The results could also have been affected by the fact that, at the time of the survey, a lockdown was in force and many sports facilities in the country were closed for this reason.
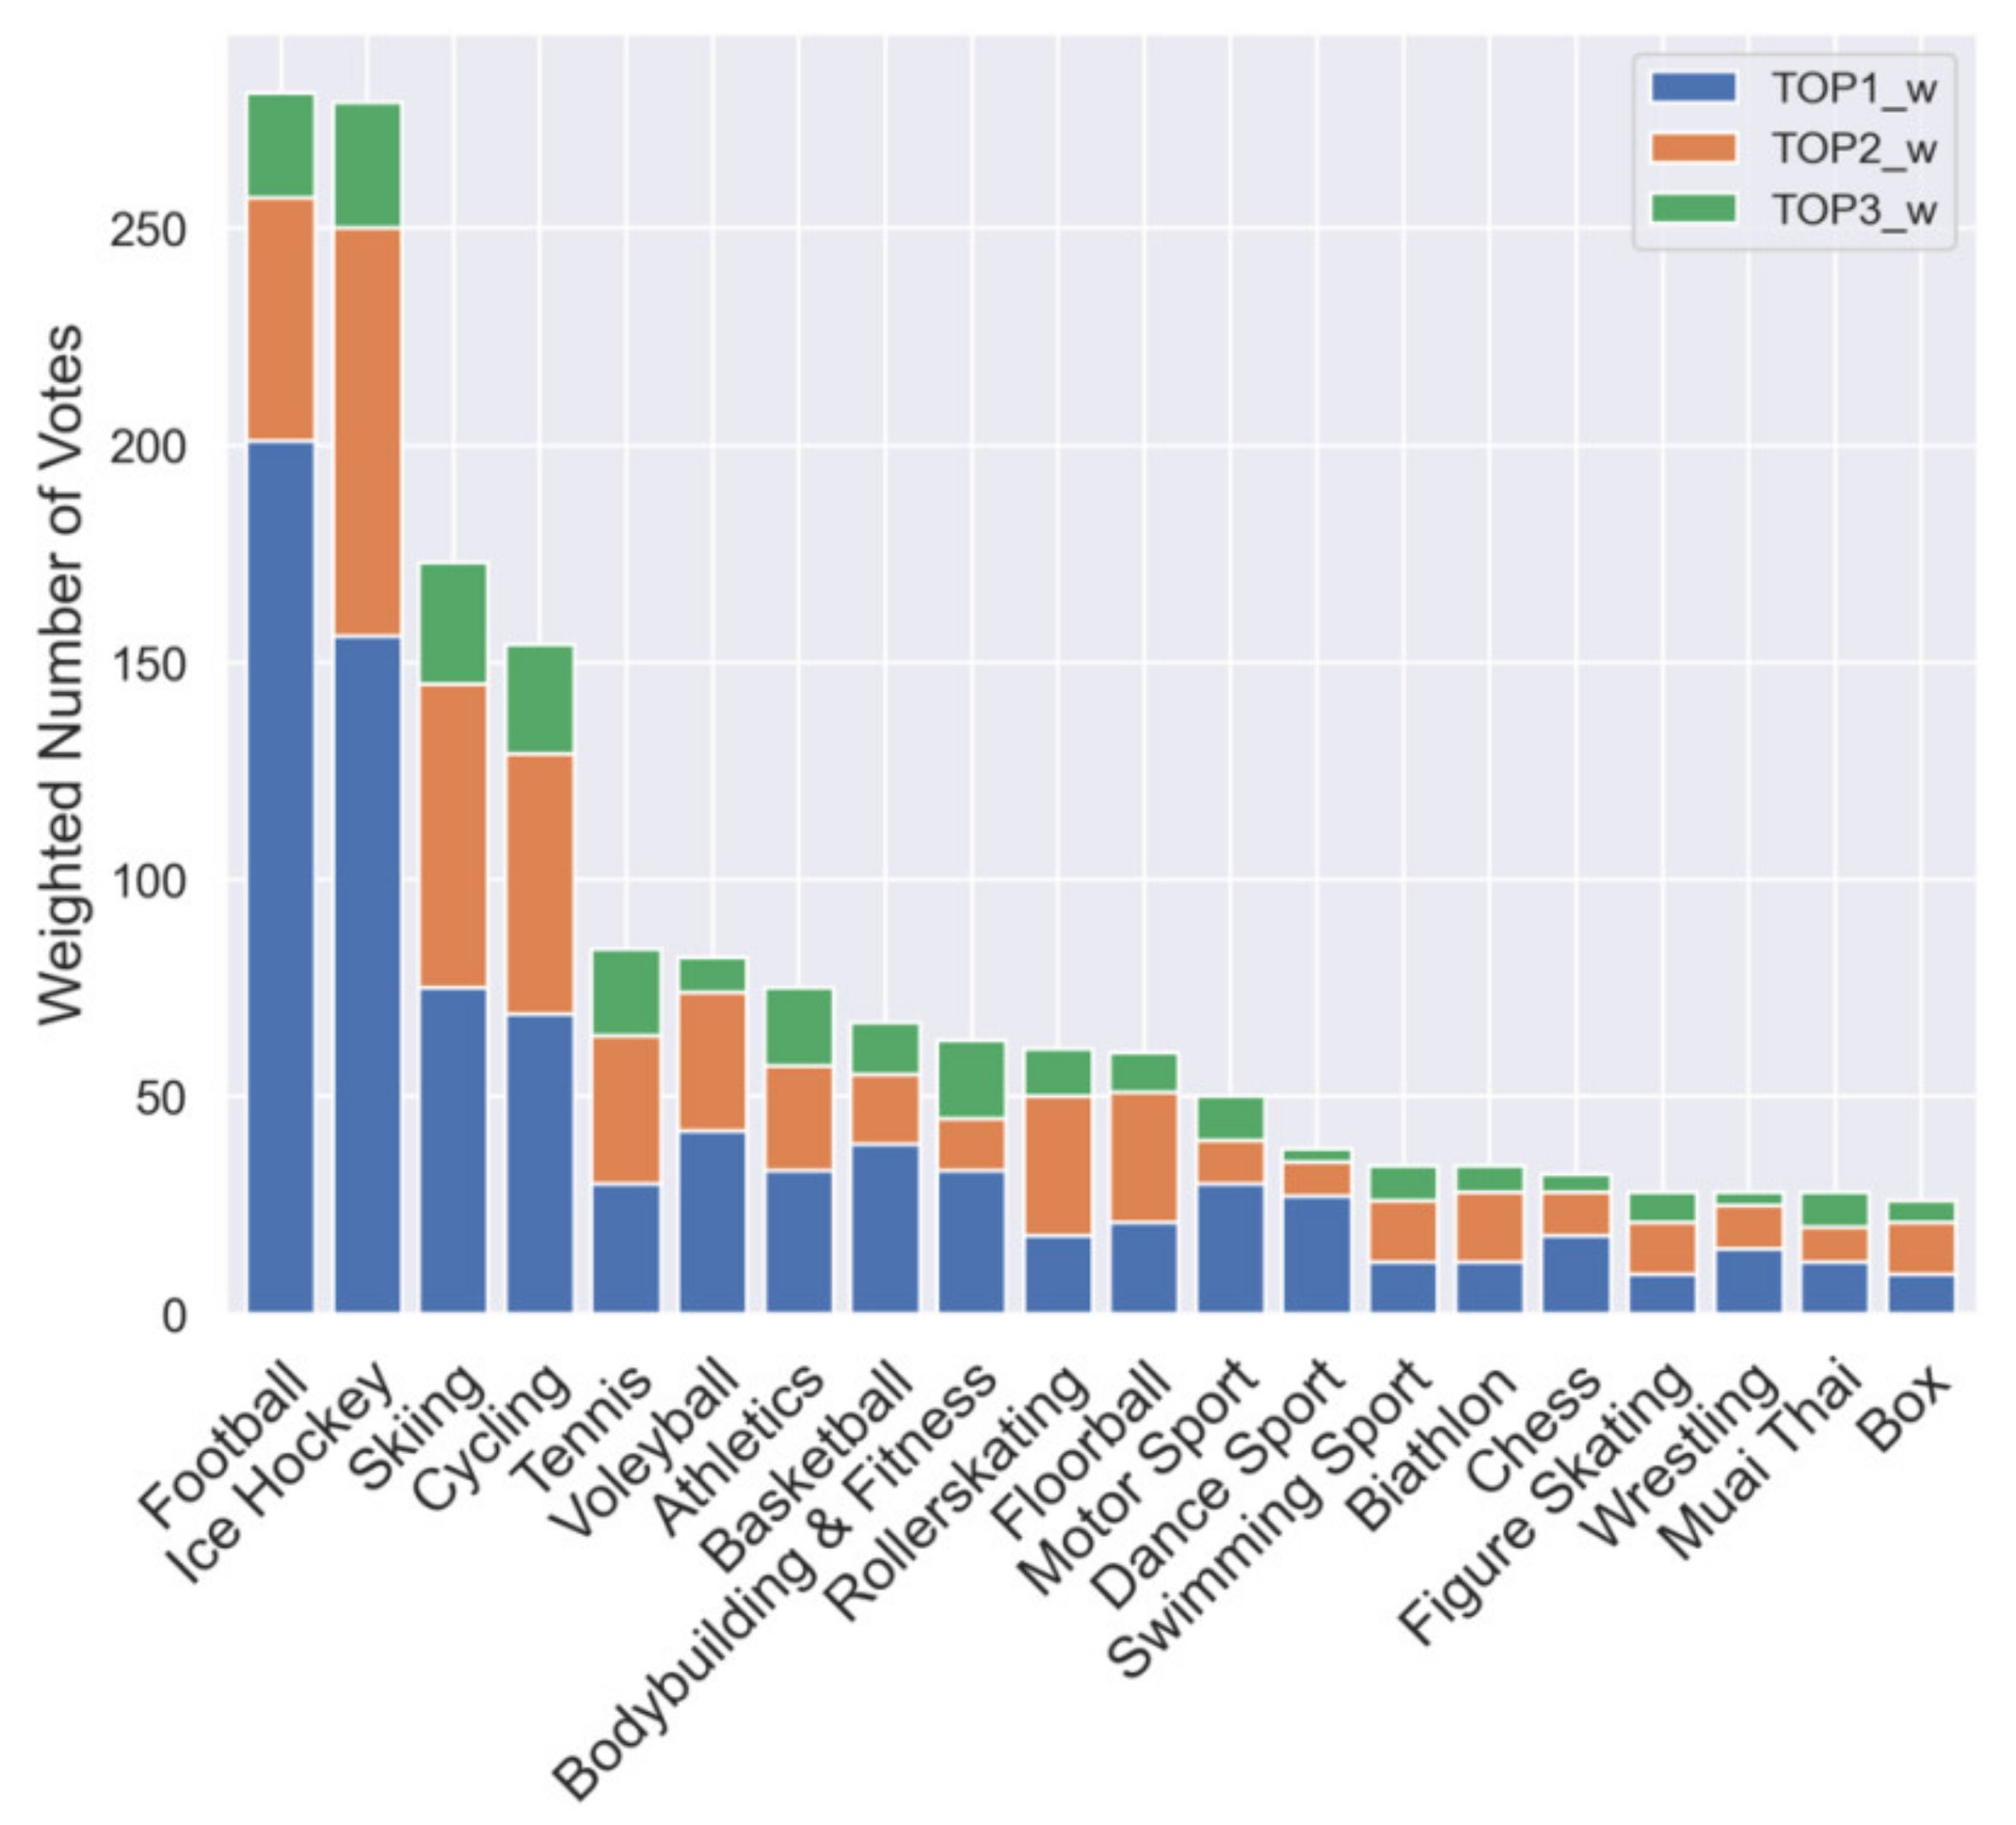
To account for the level of popularity of the individual sports, weights were applied to the results, where the TOP 1 occurrences were multiplied by three (new variable TOP 1_w), the TOP 2 occurrences were multiplied by two (new variable TOP 2_w), and the TOP 3 occurrences were left the same (or multiplied by one; new variable TOP 3_w). The results were reordered according to the sum of the responses considered. The first twenty sports are shown in the following stacked graph (Figure 2).
The post-weighting results differed from the original ones, and many sports changed their position by one (as in the case of volleyball, which overtook athletics, or basketball, which overtook bodybuilding and fitness). Greater changes in position were also observed within the lower ranks, e.g., chess and dance sports advanced after weighting by four positions. Additionally, as could be expected from the distribution of the responses, in the duel between football and ice hockey, football moved to a higher rank after weighting (Table 2).
Whether the weighted or the original results were more relevant for evaluating the resulting popularity was left for further debate. However, the original results were used for the hypothesis testing and other parts of the data analysis.
4.3. Hypothesis Testing
The results of the hypothesis testing are divided to clearly present the arguments needed to test the validity of each of the hypotheses that were defined. The individual hypotheses incorporated into the literature review section were logically drawn from the relevant knowledge. Therefore, their formulation was approached from the research perspective. However, their testing was based on the statistical approach where each hypothesis was defined as the alternative hypothesis, logically connected to the corresponding null hypothesis. The null hypotheses are deliberately not stated in the text.
4.3.1. H1 Hypothesis Testing
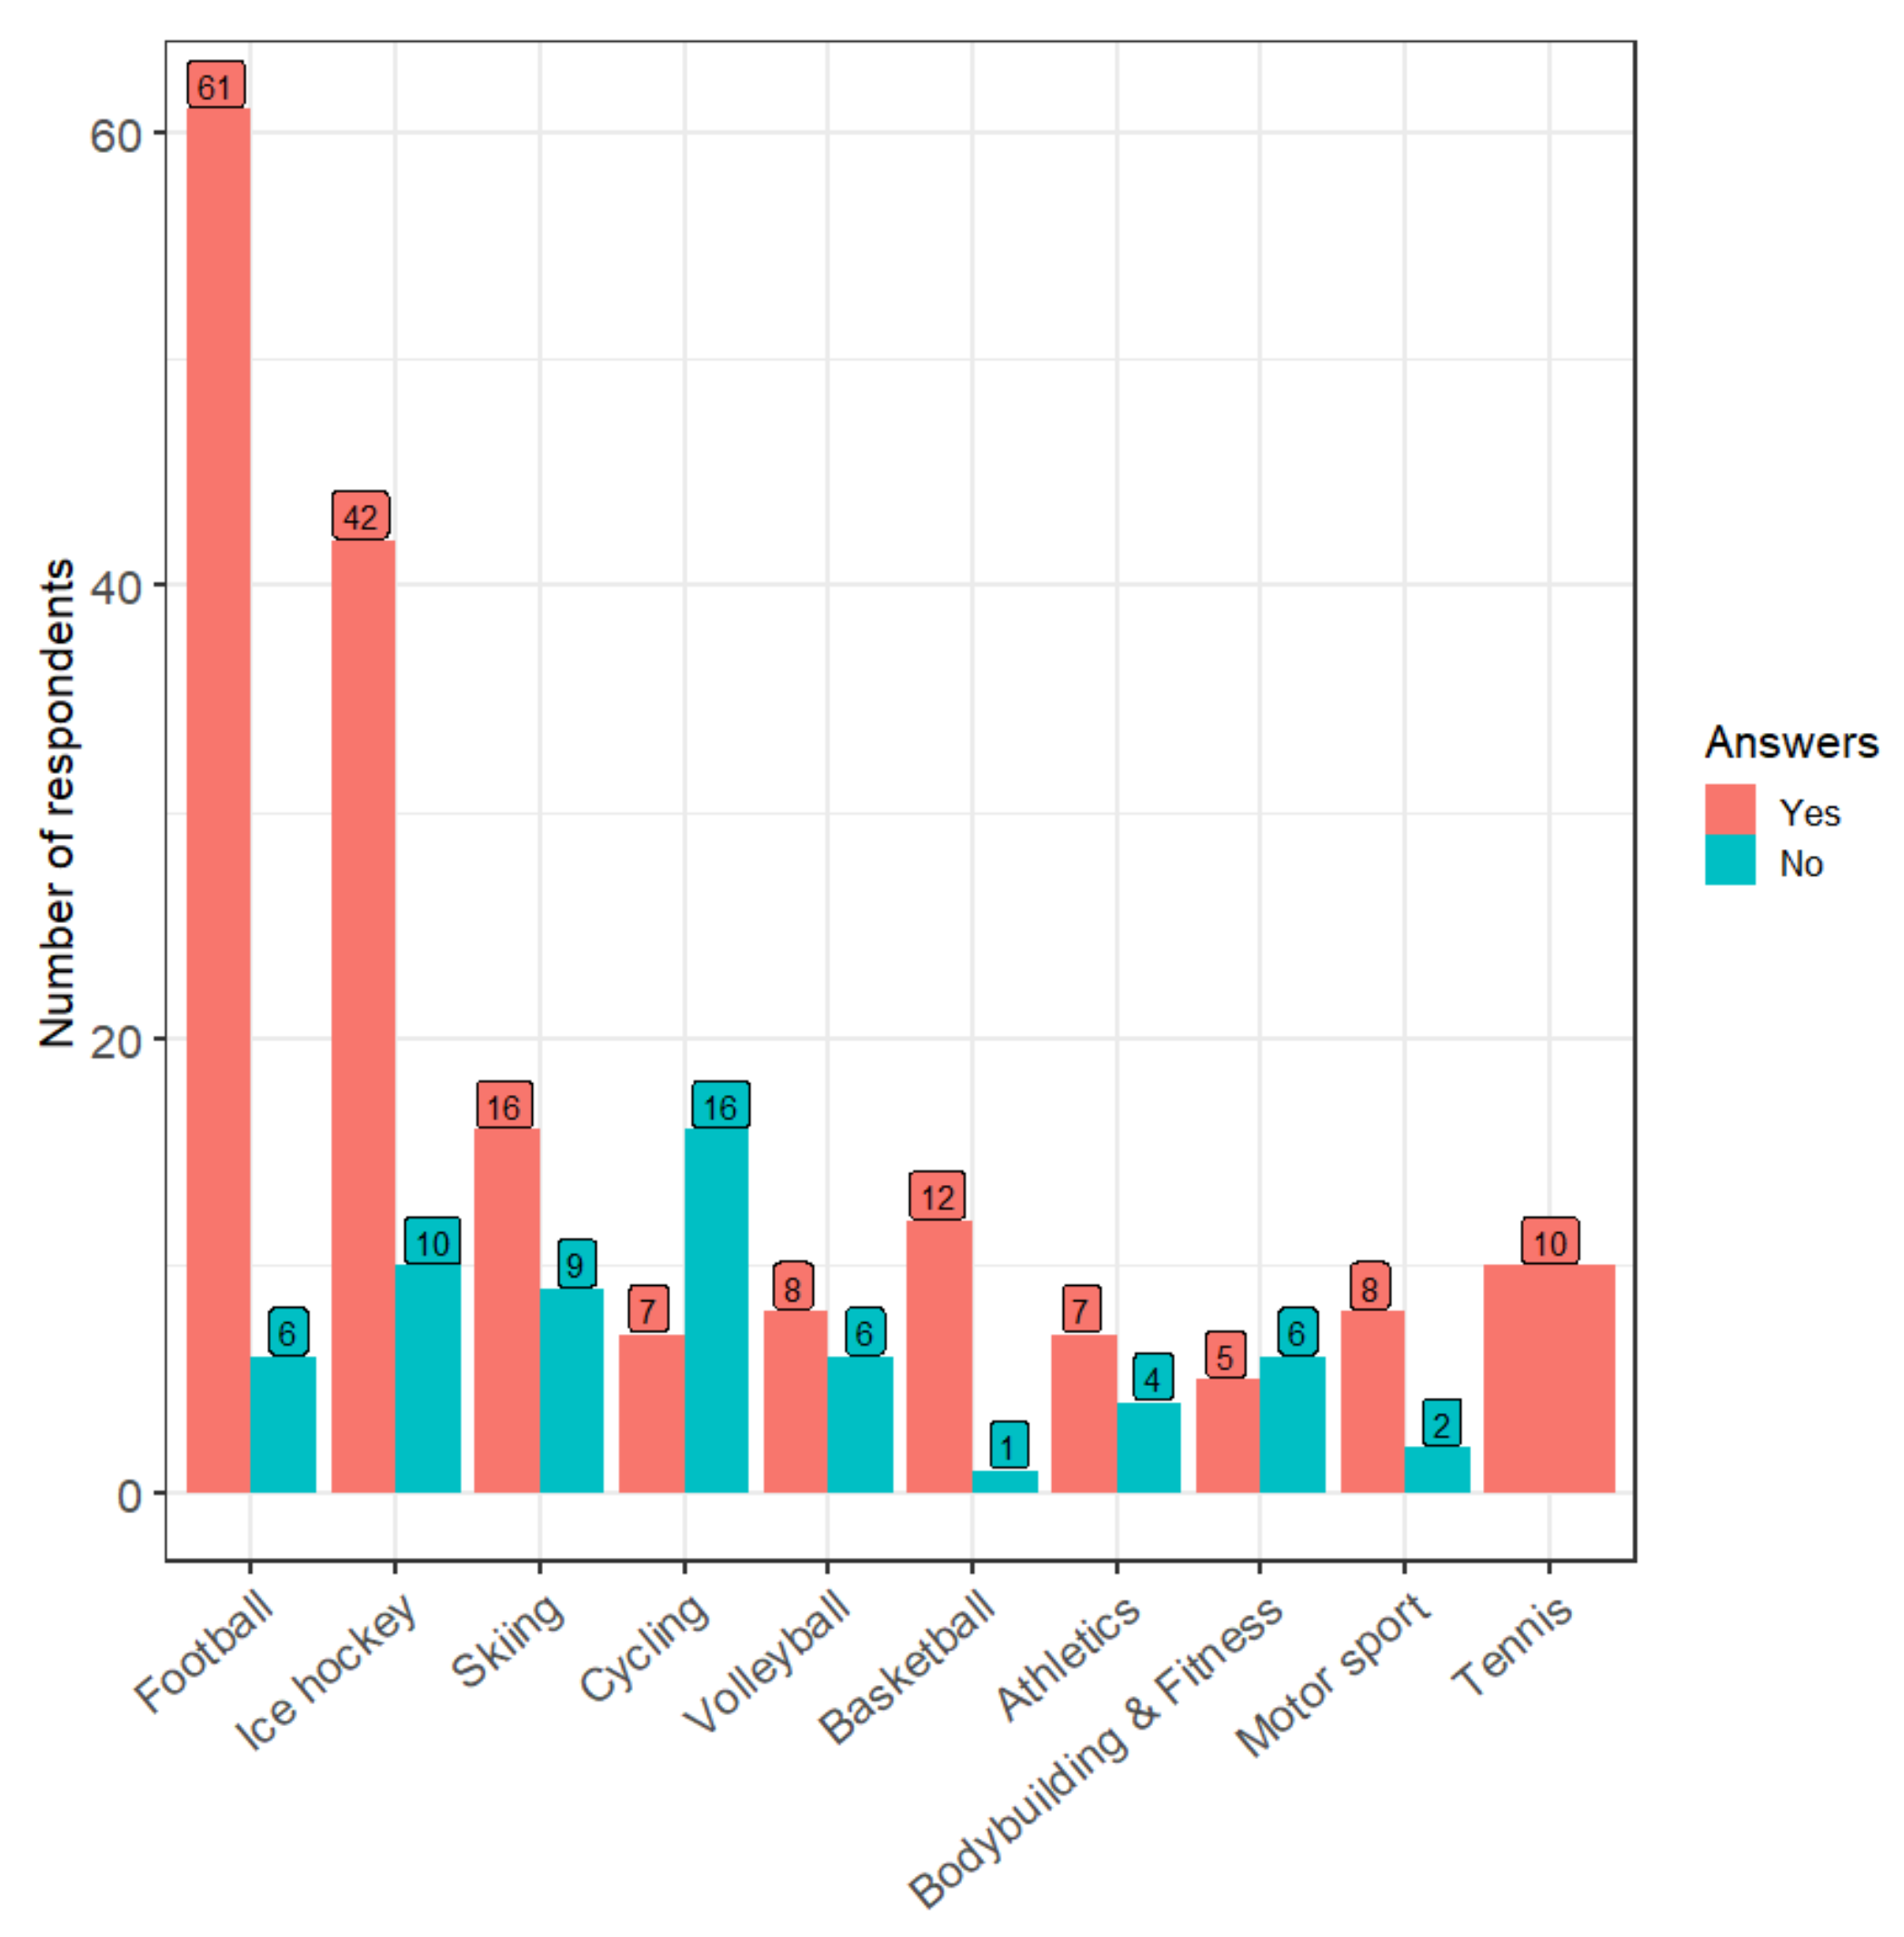
For the top ten sports from the TOP 1 category, in terms of fans’ self-identification, Figure 3 was constructed for the purpose of visual analysis. Respondents were asked to indicate whether they considered themselves fans of their favorite sports. The hypothesis for examining the differences in the fans’ self-identification among different sports is stated as follows:
H1: The distribution of a country’s population in terms of their identification as fans of particular sports, which is one of the elements of the subjectivity of sports’ popularity, is statistically different among the sports people consider as their favorite.
In most cases, a tendency to label oneself as a fan of a particular sport was observed (without the respondents’ theoretical knowledge regarding fan behavior). For example, the respondents who chose tennis as their favorite sport answered the question entirely positively. In proportion, the greatest propensity for the self-identification of fans was observed in the case of football, hockey, and basketball (irrespective of the number of subgroups). Attention should also be paid to the fact that the respondents who chose cycling as their favorite sport type mostly answered the question negatively. The situation was similar for bodybuilding and fitness. The results of the chi-squared test for this hypothesis are shown in Table 3.
The resulting p-value (0.0009 when rounded down to four decimal places) was lower than the significance level (0.05), indicating that enough evidence was collected to accept the H1 hypothesis on the non-uniform distribution. This suggests that across the most popular sports, the numbers of respondents identifying themselves as fans were statistically significantly different. Asking a sample of people whose favorite sport is football whether they also consider themselves fans of this sport would have a statistically significant chance for a positive answer.
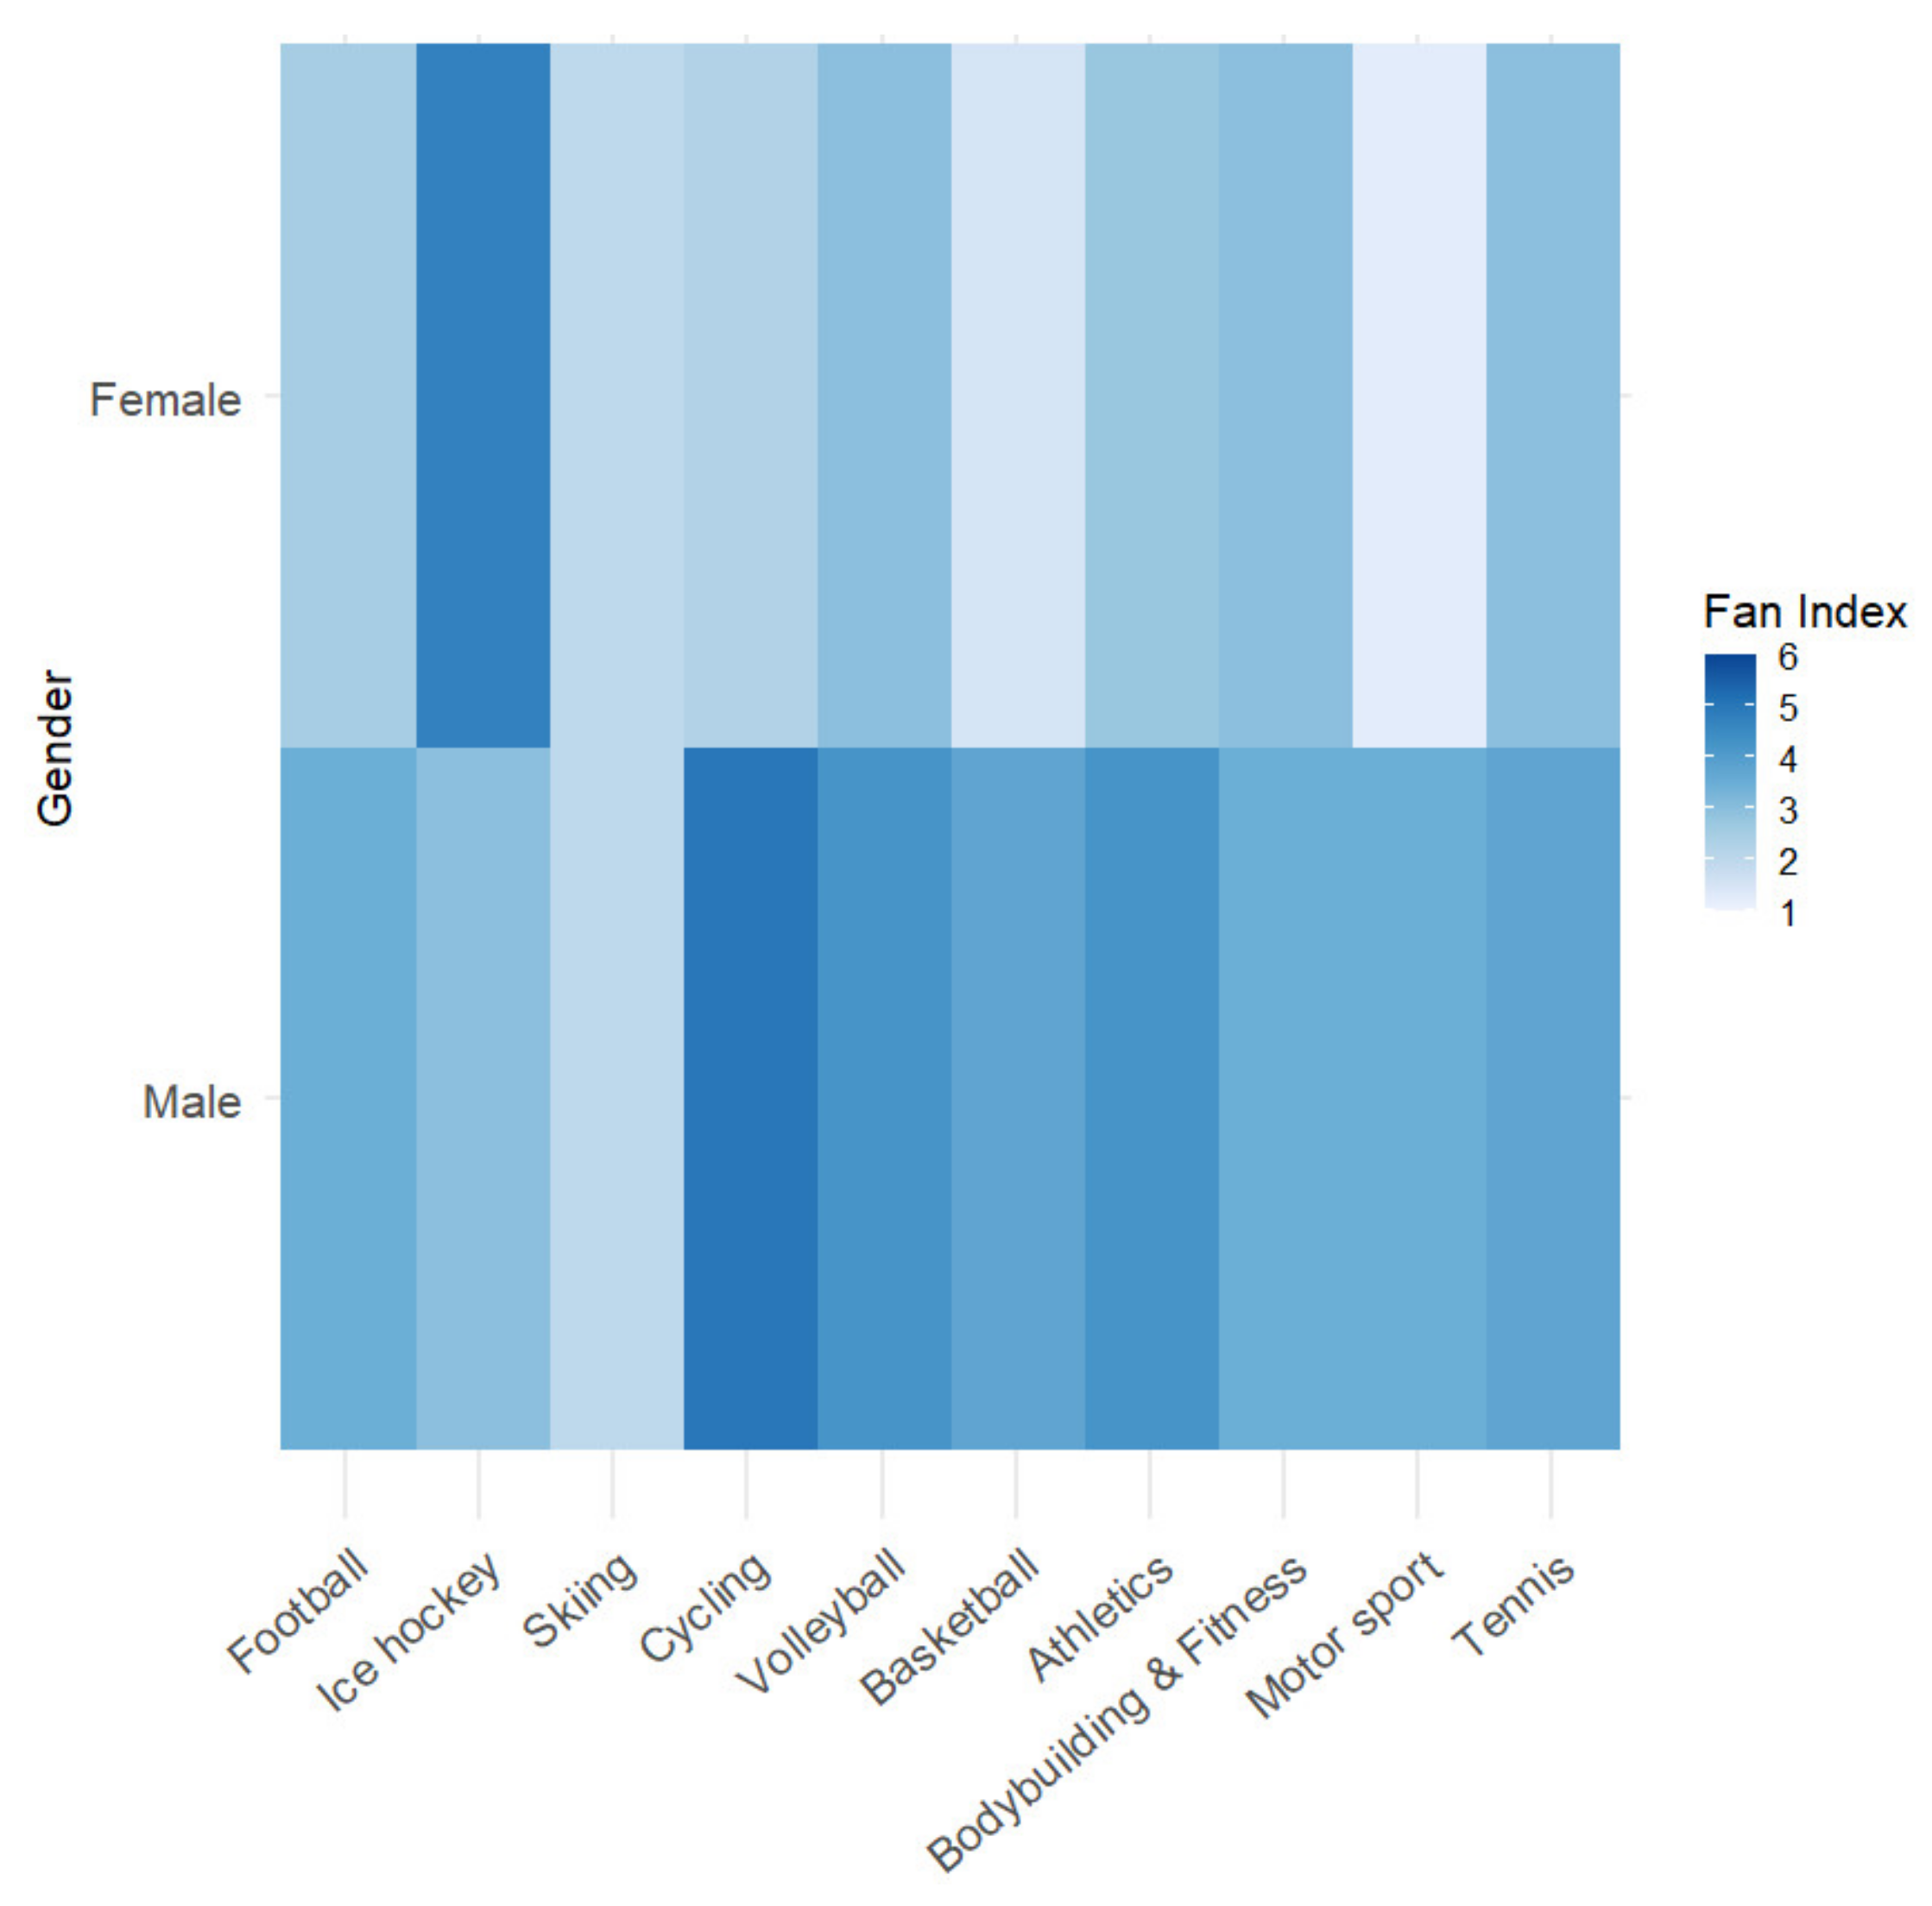
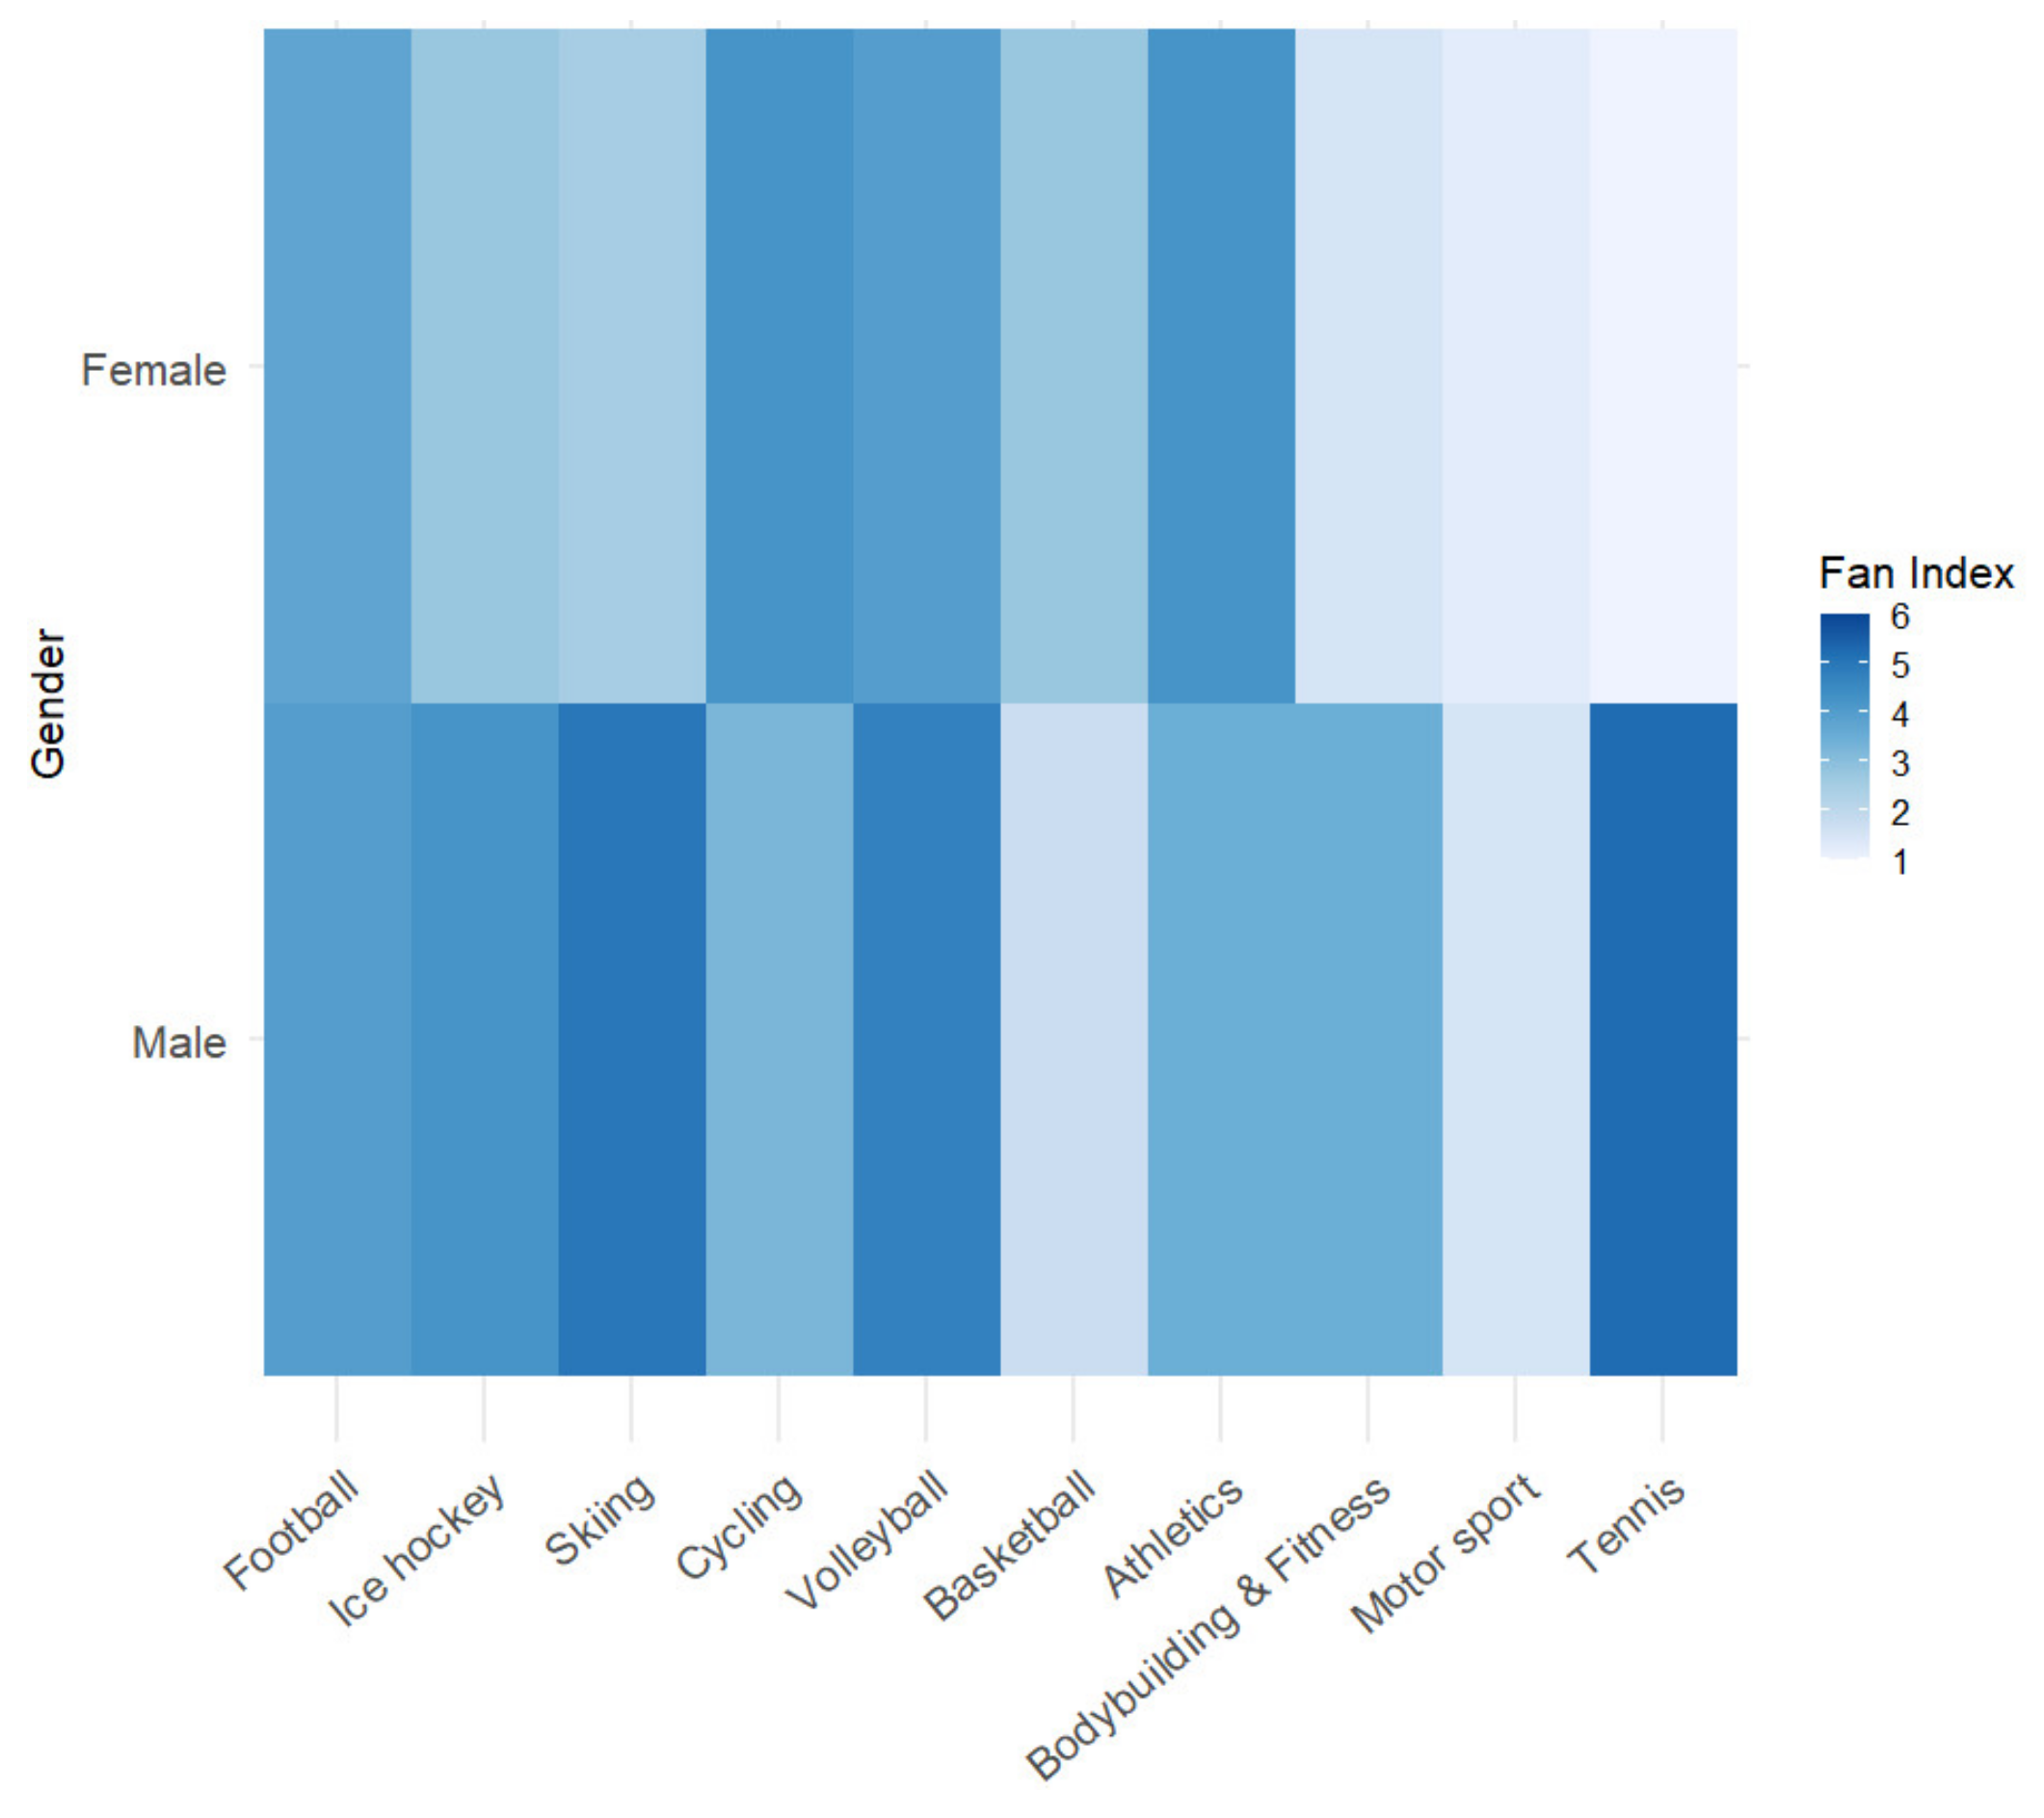
The next level of analysis was a heat map with three variables, where a fan index was added to the relationship between gender and sports (Figure 4). The findings created a bridge towards the H2 hypothesis in which the factor of gender is studied and the H4 hypothesis using the fan index as a variable. This was created as an artificial variable, calculated by averaging four variables on a scale of 1 to 6 (1—never/not at all; 6—always/very often). All the embedded variables were gained from the questions describing a theoretically justified fan behavior, for example: “How often do you think about your favorite sport/sports team/athlete?”; “How often do you feel emotions when consuming sports products?”; “How often do you buy sports merchandise?”; and “How often do you buy tickets to live sports events of your favorite sports?”. Thus, the fan index variable represents the fan level on a scale from 1 to 6, where 6 represents strong fan behavior. The heatmap shows stronger fan behavior in a darker color.
From the visual analysis, it can be argued that men who liked cycling were significantly bigger fans of the sport than women. In addition, it was found that women whose favorite sport was hockey also exhibited the strongest fan behavior. Conversely, in the case of motorsports, women did not achieve high fan index values. When considering skiing, the fan index was about the same for both genders. More men were identified as bigger fans of volleyball, basketball, athletics, tennis, and football.
The analysis presented thus far concerned the TOP 1 category. This was followed by an examination of the association between gender, sports factors, and the fan index in the TOP 2 category. In a similar way as in the previous part of the analysis, a heat map was created for the TOP 2 category (Figure 5).
The most prominent difference was observed for tennis, where men achieved significantly higher fan index values. Smaller differences within this category were observed for motorsports. Here, in the TOP 1 category, men achieved both observably higher values in the fan index (compared to the TOP 2 category) as well as significantly higher values compared to women (when analyzing the situation in the TOP 1 category). The opposite was observed for ice hockey. In the TOP 2 category, men achieved higher values of the fan index compared to women. Another finding was that women who chose bodybuilding and fitness, motorsports, or tennis as their second most favorite sport achieved low fan index values. Men who chose basketball and motorsports as their second most favorite sport also scored low on the fan index.
We further focused on other factors that affect fans’ self-identification but were not included in the fan index. The reason for their separate examination is that these factors did not include a Likert scale in the questionnaire. This represents another level of the empirical examination of the relationships between the variables studied in this research.
Such a relationship was the connection of the fan index with the question of whether the respondents had favorite sports teams. The first test applied was the Student’s t-test, which had the following results: t (336) = 12.167; C = 1.967; and p-value < 0.001. For fans who did not have a favorite sports team, their average fan index was 2.398 ± 0.135. On the other hand, for fans who had favorite sports teams, their average fan index was 3.653 ± 0.149.
Another test used was the Kolmogorov–Smirnov test, the results of which were as follows: K = 4.537; C = 1.358; and p-value < 0.001. The last test applied was the Mann–Whitney Test which had the following results: z = 10.322; C = 1.96; and p-value < 0.001. These results indicated that the respondents who had favorite sports teams were more likely to be fans of the particular sport. This aspect is an important element for building a fan base, which leads to the support of the sustainable operation of sports organizations.
4.3.2. H2 Hypothesis Testing
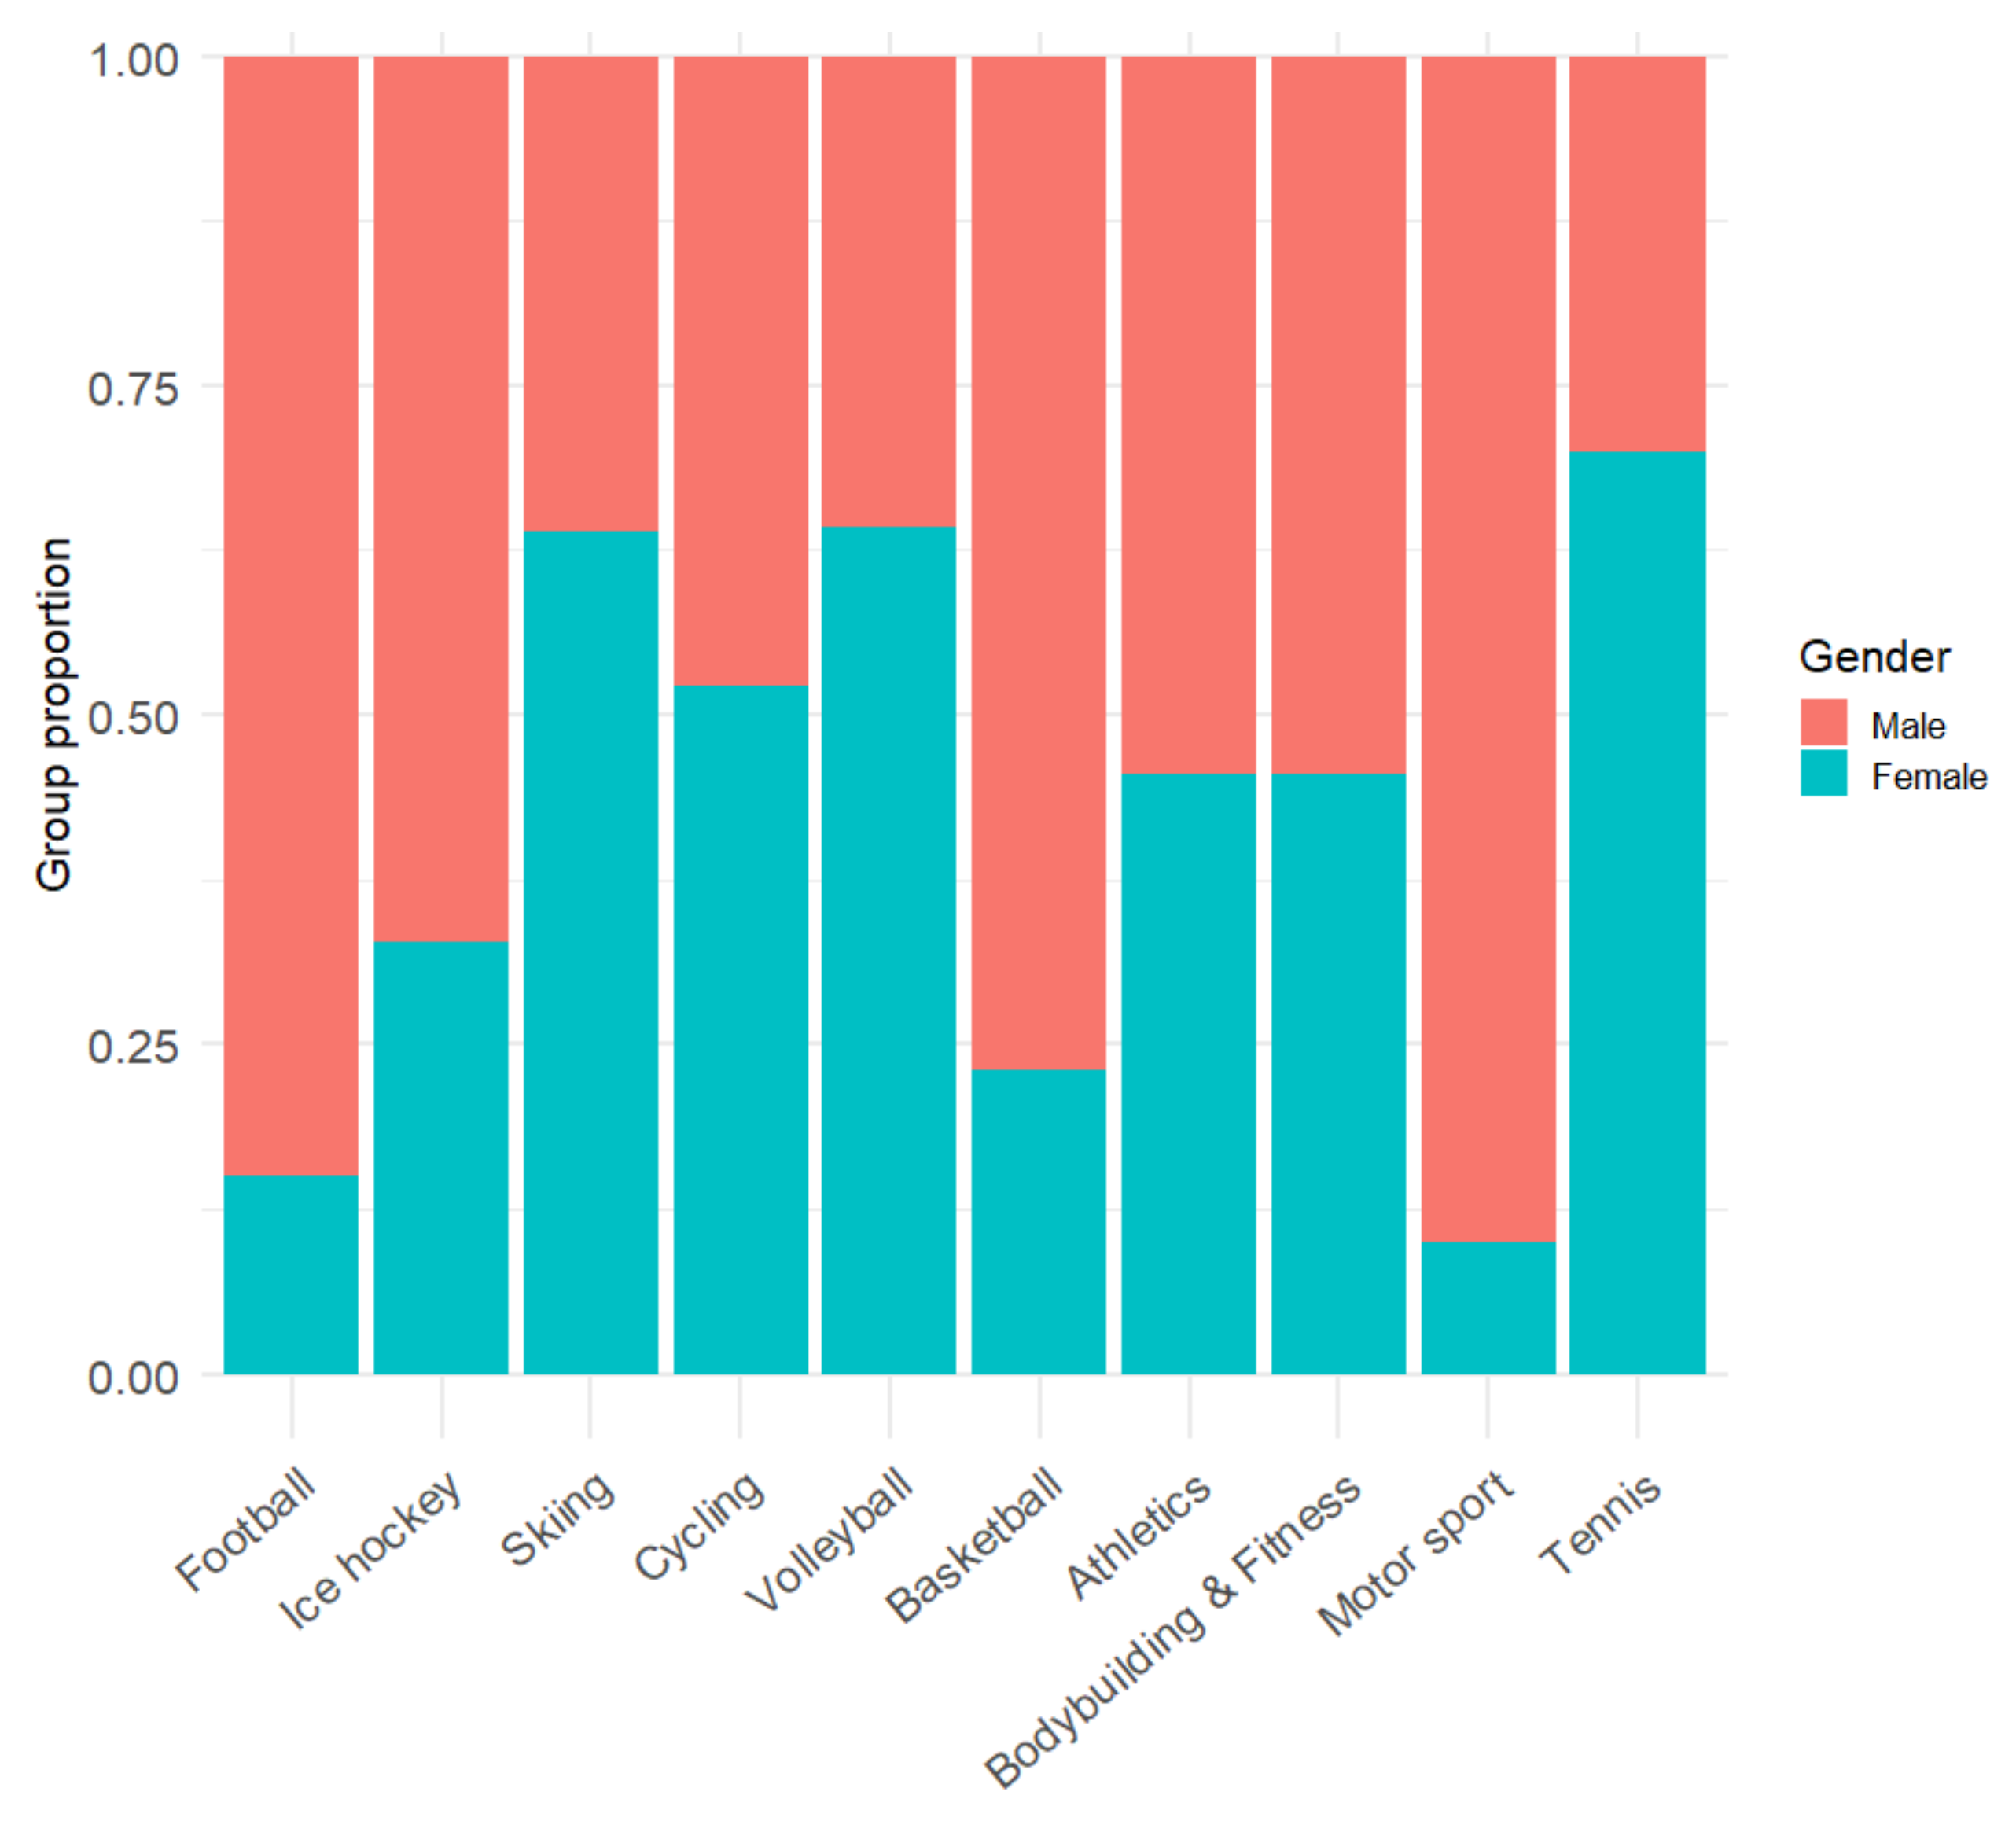
The results of studying the gender distribution among the top ten sports in the TOP 1 category are shown in Figure 6. The visual analysis revealed significant findings, as the sample distribution was closer to the gender distribution of the entire country’s population. The hypothesis for testing the association between gender and the specific sport types is stated as follows:
H2: The distribution of the country’s population in terms of gender is statistically different among the individual sports that people consider as their favorite.
Football and motorsports were almost exclusively preferred by men. A similar situation was identified for basketball. Conversely, skiing, volleyball, and tennis were more preferred by women. For athletics as well as bodybuilding and fitness, the results were almost equal, indicating no significant differences between genders. The chi-squared test’s results for this hypothesis are listed in Table 4.
Since the p-value (1.199 × 10⁻⁶) of the chi-squared test was lower than the significance level of 0.05, the H2 hypothesis on the unequal distribution of the population in terms of gender can be accepted. This means that the gender distribution ratios that were observed in the various most popular sports are statistically significantly different.
4.3.3. H3 Hypothesis Testing
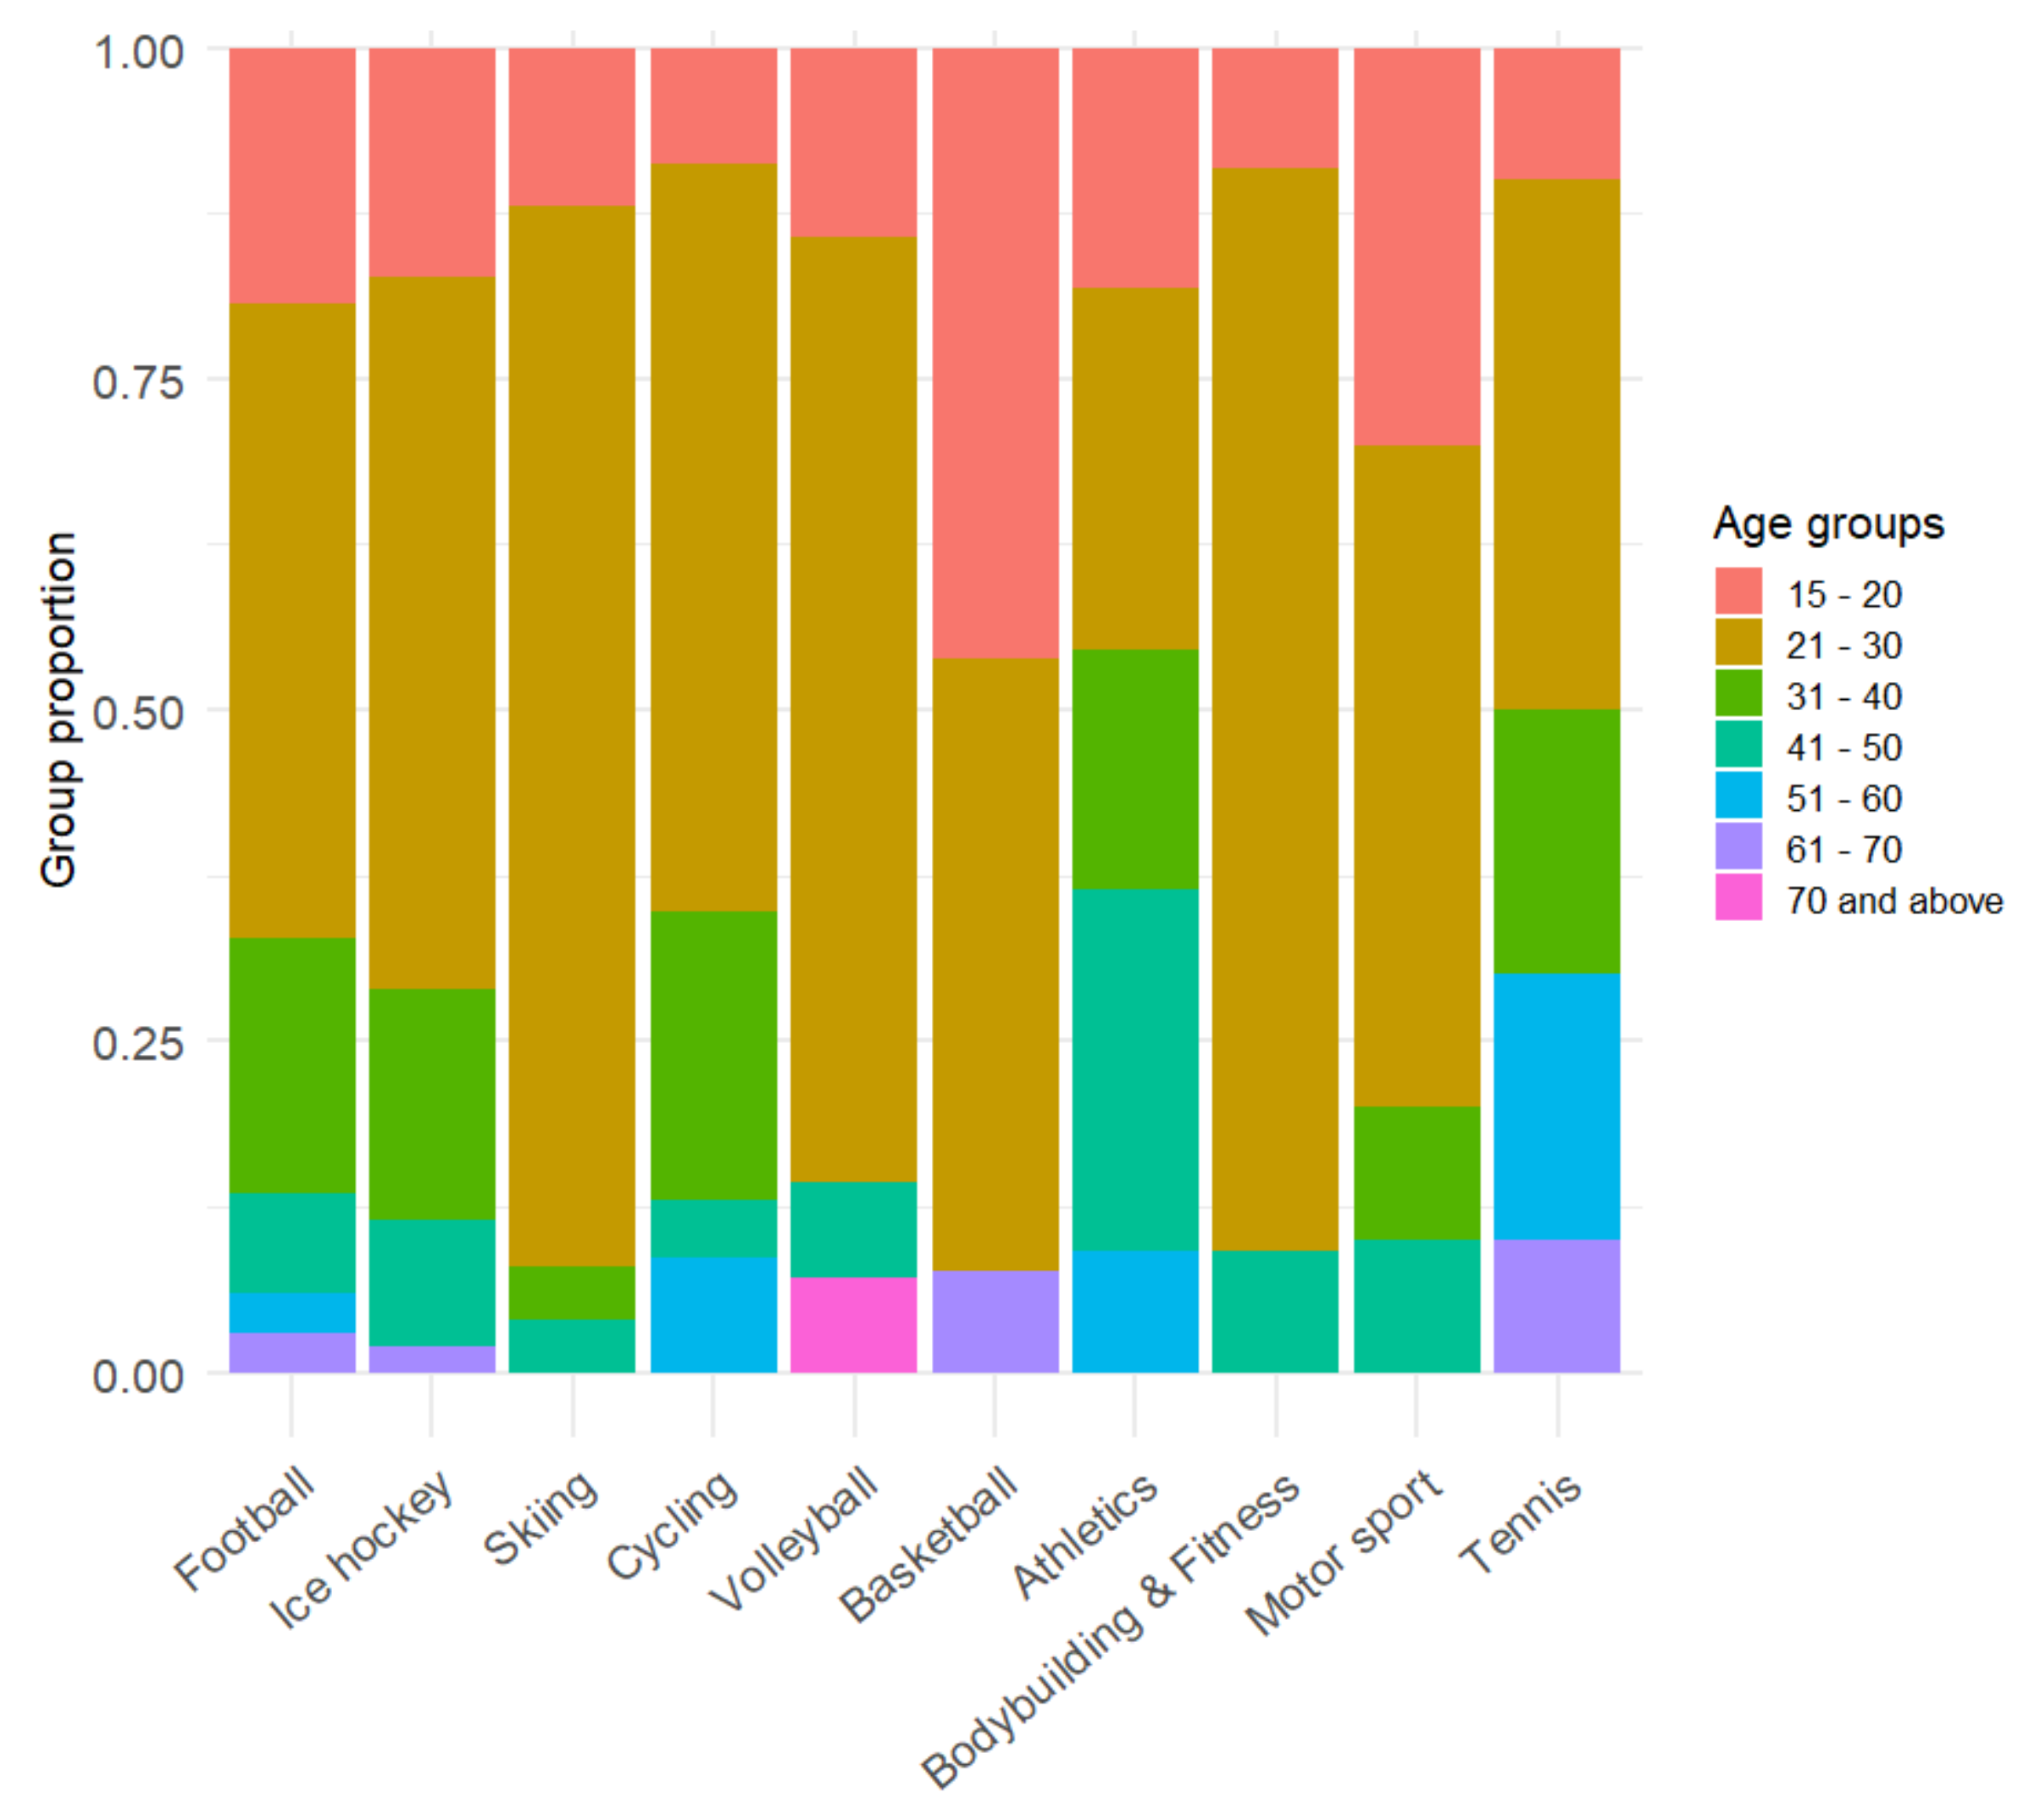
The results of the age distribution among the top 10 sports (the top ten sports were used for clarity of visualization only; all data from the relevant variables were used for the statistical test) from the TOP 1 category are shown in Figure 7. However, the results of the visual analysis may be slightly biased, as the age distribution of the sample was not uniform. The hypothesis for the test of the association between age and the preference of specific sport types is defined as follows:
H3: The distribution of the country’s population in terms of age categories is statistically different among the individual sports people consider as their favorite.
Within the visual analysis, the most significant difference was identified for the age distribution of basketball, which (compared to other sports) was preferred by the youngest respondents in the 15–20 age range. On the other hand, athletics had the largest representation (when compared with the same age group in other sports) in the 41–50 age group. Thus, athletics was mostly preferred by older respondents, and a similar conclusion was drawn for tennis. However, the results of the chi-squared test object to the assumption of an uneven distribution. The details of the test results are shown in Table 5.
Based on the high p-value (0.9396—higher than the selected significance level of 0.05), not enough evidence was collected to accept the H3 hypothesis. This means that the distribution of the age groups in each sport type was even; thus, statistically, the most popular sports had a comparable representation of each age group in their popularity.
4.3.4. H4 Hypothesis Testing
For the final hypothesis (H4: Socio-economic factors and the particular types of sports themselves positively or negatively affect the subjective popularity of different sports), the subjective popularity of sports was approached via the fan index—an artificial variable described above. This represented a dependent variable in the mathematical-statistical modelling used for a multivariate analysis. The independent variables studied included age groups, education levels, gender, favorite sports (TOP 1 category), and employment status.
Since all the independent variables were categorical in nature, dummy variables were applied. The results of the modelling are listed in Table 6.
The results of the multiple regression showed the differences between the conditional means. This followed the application of dummy variables in the modelling caused by the categorical nature of the data. The reference categories for individual variables were as follows: male (gender), 15–20 years (age group), athletics (TOP 1), elementary (education), and pensioners (employment status). Some of these variables were already explained in the text above (including all their possible values). Other values for the education category included: secondary, undergraduate, graduate, and postgraduate. Other values for the employment status were as follows: employed, unemployed, student, disability support, and pensioner.
The first model worked with all the socio-economic factors that were used as explanatory variables. The second model worked with the same factors plus the variable representing respondents’ favorite sports (TOP 1). The variables listed in Table 6 are those with a t-statistics’ p-value below the significance level (α = 0.05 or 0.1). Therefore, they represent statistically significantly different means in comparison with the reference categories. For example, women’s fan index was lower by 0.3687 on average compared to men. Based on these results, hypothesis H4 was confirmed.
5. Discussion
In preparing the questionnaire used in this research, we found a similar survey on sports’ popularity conducted in October 2020 in the Czech Republic by the National Sports Agency on the Czech population of the age of 15 and over. The aim of the Czech survey was to identify what the Czechs’ attitude towards sports was, which activities attracted them in terms of spectatorship, and which attracted them in terms of active practice. The survey was conducted online, and it collected 5000 responses. The respondents had to evaluate the sports according to their personal preference [60]. This other survey is a practical example of the various dimensions of the popularity of sports. The survey’s respondents were asked to rate each of a dozen sports, which may have considerably skewed the results. The survey presented in this article was therefore intentionally created differently.
To support the health of society focusing on the citizens of Slovakia aged 15 and over, and also to support the sustainability of sports organizations, a questionnaire regarding the popularity of all the legally recognized sports was conducted in this study. The creation of the questionnaire followed the analysis of scientific publications as well as the analysis of similar surveys. The purpose of the questionnaire was to help the state administration objectively approach the allocation of public funds among sports organizations (mainly sports associations), where the popularity of a sport influences the share granted to the association. The amount of the contribution is closely related to the ability to set the organization’s operation sustainably [61].
The method of redistribution of public funds within the sports industry is specific in Slovakia. The reason for this is the popularity component in the formula for calculating the share of the total budget for individual sports associations. This component is often the subject of controversy and debates. The associations of less popular sports are disadvantaged since they are granted a smaller share of the budget. Consequently, they find themselves in a difficult situation, not being able to influence the popularity of their sports because they do not have the resources necessary. Therefore, these associations’ representatives criticized the Act on Sport [62].
On the other hand, from the state’s perspective, this is considered a rational way of funding. The state acts as an investor assessing the return on investment, with the more popular sports appearing as an option with a higher return for society. Thus, public funds flow where society’s greatest attention is. However, this still does not address two fundamental issues of how the abstract concept of sports’ popularity can be quantified with as little doubt as possible and how to help the associations of less popular sports to achieve sustainability. The research presented in this article primarily addressed the first issue described. The solution can only be achieved through scientific research; thus, it is beneficial to continue studying this topic.
This article examined the issue in depth. Its broader context focused on the policymaking and the impact on social life [63]. It is essential to determine the factors influencing the popularity of sports so that it can be influenced by targeted managerial decisions. This also applies to the second issue defined above (help for the associations of less popular sports). Thus, in addition to examining the popularity of individual sports, the purpose of the questionnaire survey was to explore the links between the popularity of sports and the characteristics of human potential [64]. These factors include gender and age, as well as the person’s self-identification as a fan of a specific sport.
The results of the chi-squared tests and the multiple regression modelling showed an association between sports and gender, suggesting that some sports were more preferred by women and others by men. This finding may serve sports managers in setting their strategies and marketing communication. The results also showed a link between fan self-identification and individual sports. This result can be considered as one of the specific traits of fan behavior. The reliability of this identifier is left for further discussion. However, from a sports manager’s perspective, this a valuable conclusion. It makes it possible to predict what proportion of a particular sport event’s spectators will identify themselves as true fans. Subsequently, this translates into their purchasing behavior.
It is also possible to look at the results, for example, from the perspective of bicycle equipment retailers. It can be assumed that most people interested in cycling equipment are not genuine fans of cycling yet. Therefore, they will not be willing to spend their money on expensive pieces. Rather, they will be interested in more affordable bicycle models. Thus, the retailer may adapt based on this knowledge and procure a larger number of more affordable models. Additionally, the knowledge from the visual analyses of the heat maps can be utilized as well. According to the results, cycling fans were more likely to be male (although the result cannot be fully generalized due to the statistical test), which means that when preparing the stock, the shop owner may procure more male-oriented affordable models. The focus was deliberately aimed at the level of sports equipment retail. It is assumed that a person interested in cycling would at first want to start training on his/her own, and only later would he/she be interested in joining a sports club. Therefore, for this sport, the whole process starts with the cycling accessory retailers, ultimately affecting the size of the cycling club membership base. However, this, along with other specific aspects of the operation of individual sports clubs, may be the subject of further research in this field.
According to the information available, this is a specific situation in the Slovak Republic, and there is no similar formula by which funds are automatically redistributed among sports associations in other countries. The form of the formula valid in the Slovak Republic can be found in Section 2.2: Linking Popularity with Sustainability. The relevant pieces of information for this unique situation were obtained, based on which a set of recommendations focusing on the conditions in Slovakia was designed. However, this aspect does not prevent the application of generalized phenomena outside the Slovak Republic, leading to the sustainability of sports organizations.
All the points listed above put the novel findings of this study into the broader context of the sustainability of sports organizations [65]. Two key stakeholder groups were specifically selected for the analyses, represented by fans and the members of sports organizations. As the popularity of a sport increases, the fan and member base grow as well. This is crucial for the sustainable existence of sports organizations, as well as for their growth in the future.
6. Conclusions
The article approaches the topic of the sustainable development of sports organizations, specifically focusing on the perceived popularity of particular sports. Its contribution lies in two separate aspects. The first aspect is connected to the understanding of the concept of sports’ popularity and its definition leading to the sustainable operation of sports organizations. This unique perception of sports’ popularity can be used for other research projects as well. The second aspect concerns the practical application of the methodology for the measurement of a sport’s popularity. From the managerial perspective, the sports organizations’ managers need to understand the role of their sport’s popularity and its impact. It considerably affects their position by attracting new members as well as acquiring funds from the public budget and from private investors. Each proposition presented in this article can be used by policy makers in Slovakia and in other countries.
The main recommendation arising from this multi-stage analysis is the methodology itself, focusing on the identification of sports’ popularity within a country’s population. The basic steps include: (1) a review of the relevant secondary resources regarding the popularity of each sport type in the country; (2) a review of the country’s legislative framework and specific guidelines on sports and the operation of sports organizations; (3) the selection of a specific, graspable aspect of a sport’s popularity in relation to the previous points; (4) the design of a tool for collecting the necessary additional up-to-date primary data; (5) the collection of the defined primary data in connection with the researched aspect of sports’ popularity; (6) the application of the mathematical-statistical methods for the analysis of the data collected; and (7) the interpretation of the results, drawing conclusions for the perceived popularity of individual sports in each country, leading to the sustainable operation of sports organizations.
The presented methodology can be recommended for policy makers on how to approach this area. It provides them with information on what decisions need to be made, what information and data to obtain, and how to work with their interpretation. The popularity of sports is only one aspect to consider. Since the policies in modern countries need to respect the criterion of gender equality as well, this needs to be included in the final policy.
In this article, we also provided a suggestion for defining the popularity of sports and the popularity of sports organizations. It is assumed that an increase in popularity represents an opportunity to increase the membership base, and thus increase the number of active members of sports organizations. This will support a higher chance for the success of athletes as well as the success of the whole sports organization in the long run. Therefore, based on the results of this research, the sustainability of sports organizations, and sports in general, is promoted. The proposed definitions should be used in policy making, especially as there are currently only general explanations of the terms used in the legislation [36].
While focusing on the applicability of the topics studied, the area of state policy is underlined. By utilizing the results of this research and adapting the methodology to the country’s conditions, the state will be able to set a policy for redistributing financial support only to those sports that are identified as the most popular. However, on the other hand, the results and their implementation open space for further research projects oriented towards the support of the sustainability of those sports organizations that cater to generally less popular sports. In this case, the focus should be on exploring other options to achieve the sustainability of these entities. Again, it is appropriate to analyze the specifics of this more narrowly defined group of sports organizations and look for the application of relevant business principles to achieve long-term sustainable operation. Only then it will be possible to provide the desired diversity of sports opportunities and sports products for society that do not discriminate against the minority preferences of spectators, fans, or the athletes themselves.
A possible direction for future research is the analysis of the reasons for the popularity of individual sports, using the historical context (the impact of individual athletes’ significant sports achievements) or the application of marketing and promotion concepts when adapting them to a sports product. Another possible direction is to uncover the reasons why popular sports are gradually being replaced by other, newer sports. Specifically, whether there is a change in the preference towards less expensive sports, such as floorball. It is also appropriate to comprehensively study the various factors that influence the level of an individual sport’s popularity. Finally, further research in this area should also focus on a better understanding of the concept of sports’ popularity so that the managers of sports organizations can better manage the overall operations. The management needs to know that the fans’ and spectators’ expectations to be able to set the whole process more efficiently. This will move the operations of sports organizations towards their long-term sustainability.
The results of the research presented have their limitations in terms of generalizability. The research findings are drawn in relation to just one possible aspect of sports’ popularity. As presented in the introduction and the discussion section, there are many possible perspectives and specifications of this concept. The second significant limitation, in terms of drawing binding conclusions valid for the whole environment studied, is the sample of respondents obtained in the survey. The characteristics of this sample were described in detail earlier in the article. However, only focusing on differences between sports fans in terms of age proved problematic.
Overall, the application of these findings and recommendations in the sports industry can be focused on in the Slovak practice or in global practice. The main benefits of the application of the proposed solutions for practice in Slovakia include: (1) the benefit for associations (sports clubs), which will achieve higher popularity of their sports after the implementation of the methodology and recommendations—as popularity is one of the parameters of the formula, the benefits for the association will also transform into increased funds; (2) another quantitative parameter of the formula is the fan base, which will also expand after the application of these recommendations; (3) the synergy of the presented elements will be reflected as a better negotiating position for attracting sponsors; (4) there will be an increase in the number of members in clubs operating at the city level; and (5) the benefits for sports practice include a higher media interest in the particular sport type.
Regarding the application of these recommendations in the world, the following applies: The validity of the benefits that were identified for the conditions in Slovakia is similar, even the same in some cases, for the world sports market. The main difference is the presence of the formula. Even though the formula for the contribution to recognized sports is specific to the Slovak market, it does not negate the validity of the other benefits of knowing how popular a sport is for the global sports market in relation to the sustainable development of sports organizations. The methodology and the definitions used in this article can be applied in other research projects in the future.
Author Contributions
Conceptualization, M.V. and M.K.; methodology, P.B.; software, M.K. and P.B.; validation, M.M. and P.B.; formal analysis, P.B.; resources, M.M.; data curation, P.B.; writing—original draft preparation, M.V.; writing—review and editing, M.M.; visualization, M.M.; supervision, M.V.; project administration, M.K.; funding administration, M.V. All authors have read and agreed to the published version of the manuscript.
Funding
This research was funded by Slovak Research and Development Agency, grant number APVV-20-0481.
Institutional Review Board Statement
Not applicable.
Informed Consent Statement
Not applicable.
Data Availability Statement
The data are available on demand from the correspondent author.
Conflicts of Interest
The authors declare no conflict of interest. The funders had no role in the design of the study; in the collection, analyses, or interpretation of data; in the writing of the manuscript, or in the decision to publish the results.
References
- Baker, R.E.; Esherick, C. Fundamentals of Sport Management, 1st ed.; Human Kinetics: Champaign, IL, USA, 2013; 254p, ISBN 9780736091084. [Google Scholar]
- Ratten, V. Sport business and entrepreneurship. In Sport Entrepreneurship 2018, Management for Professionals; Springer: Cham, Switzerland, 2018; pp. 79–96. ISBN 978-3-319-73009-7. [Google Scholar] [CrossRef]
- Brawley, L.R.; Paskevich, D.M. Conducting Team Building Research in the Context of Sport and Exercise. J. Appl. Sport Psychol. 1997, 9, 11–40, ISSN 1041-3200. [Google Scholar] [CrossRef]
- Taki, T.; Hasegawa, J. Dominant Region: A Basic Feature for Group Motion Analysis and Its Application to Teamwork Evaluation in Soccer Games. In Proceedings of the Videometrics VI Conference, San Jose, CA, USA, 23–29 January 1999; El-Hakim, S.F., Gruen, A., Eds.; Book Series Proceedings of SPIE. SPIE: Bellingham, WA, USA, 1998; Volume 3641, pp. 48–57, ISSN 0277-786X. [Google Scholar] [CrossRef]
- Holubčík, M.; Falát, L. Possible Implementations of Prediction Models for Forming Global Cooperation Relations. In Proceedings of the 16th International Scientific Conference Proceedings, PTS I–V, Rajecke Teplice, Slovak Republic, 5–6 October 2016; p. 670, ISBN 978-80-8154-191-9. [Google Scholar]
- Segrave, J.O. Sport as Escape. J. Sport Soc. Issues 2000, 24, 61–77. [Google Scholar] [CrossRef]
- Wann, D.L.; Allen, B.; Rochelle, A.R. Using Sport Fandom as an Escape: Searching for Relief from Under-Stimulation and Over-Stimulation. Int. Sports J. 2004, 8, 104–113, ISSN 10940480. [Google Scholar]
- Schweizer, A.-M.; Leiderer, A.; Mitterwallner, V.; Walentowitz, A.; Mathes, G.H.; Steinbauer, M.J. Outdoor Cycling Activity Affected by COVID-19 Related Epidemic-Control-Decisions. PLoS ONE 2021, 16, e0249268. [Google Scholar] [CrossRef] [PubMed]
- Barbieri. P.N. Healthy by Association: The Relationship between Social Participation and Self-Rated Physical and Psychological Health. Health Soc. Care Community 2021, 29, 1925–1935. [Google Scholar] [CrossRef]
- Toroi, N. “Yoga Is Like Medicine”: Yoga as a Form of Trauma Relief in Rwanda. Sports Peacebuild. Ethics Book Ser. Peace Policy 2017, 18, 69–84. [Google Scholar] [CrossRef]
- Jeitler, M.; Hogl, M.; Peters, A.; Schumann, D.; Murthy, V.; Bringmann, H.; Seifert, G.; Michalsen, A.; Stockigt, B.; Kessler, C.S. Qualitative Study of Yoga for Young Adults in School Sports. Complement. Ther. Med. 2020, 55, 102584, ISSN 0965-2299. [Google Scholar] [CrossRef]
- Nicolau, J.L. The Effect of Winning the 2010 FIFA World Cup on the Tourism Market Value: The Spanish Case. Omega 2012, 40, 503–510, ISSN 0305-0483. [Google Scholar] [CrossRef]
- Radojevic, J.; Ilic, J.; Visnjic, D.; Jovanovic, S. Popularity of Sport among Pupils of Primary Schools in Serbia. Probl. Educ. 21st Century 2011, 36, 51–59, ISSN 1822-7864. [Google Scholar]
- Schwede, I. The Popularity of Football in the Sporting Life of the Republic of Estonia in 1920–1940. Ajalooline Ajak.—Estonian Hist. J. 2019, 168, 331–363, ISSN 1406-3859. [Google Scholar] [CrossRef]
- Chien, C.J. A Comparison of Motives across Psychologically Committed Fans of Professional Baseball in Taiwan. Ph.D. Thesis, University of Minnesota, Twin Cities, MN, USA, 2006; 414p. [Google Scholar]
- Gupta, A.; Mittal, N.; Kohli, N. Analysis of a Sporting Event on a Social Network: True Popularity & Popularity Bond. In Proceedings of the International Conference on Data Engineering and Communication Technology; Springer: Singapore, 2016; Volume 469, pp. 261–273. ISBN 978-981-10-1677-6. [Google Scholar] [CrossRef]
- Gong, X.; Wang, Y. Exploring Dynamics of Sports Fan Behavior Using Social Media Big Data—A Case Study of the 2019 National Basketball Association Finals. Appl. Geogr. 2021, 129, 102438. [Google Scholar] [CrossRef]
- Go4insight. Koľko Slovákov je na Sociálnych Sieťach? Go4insight. Available online: https://www.go4insight.com/post/ko%C4%BEko-slov%C3%A1kov-je-na-soci%C3%A1lnych-sie%C5%A5ach (accessed on 14 November 2021).
- Wang, R.T.; Zhang, J.J.; Tsuji, Y. Examining Fan Motives and Loyalty for the Chinese Professional Baseball League of Taiwan. Sport Manag. Rev. 2011, 14, 347–360, ISSN 1441-3523. [Google Scholar] [CrossRef]
- Veble, M. Television Sport. Ars Humanit. 2012, 6, 61–72, ISSN 1854-9632. [Google Scholar] [CrossRef]
- Zhao, L.; Zhao, J.H. On the Popularity of Chinese Traditional Sports in College Physical Education. In Proceedings of 2013 International Conference on Sports Medicine and Sport Management, Hong Kong, 28–29 October 2013, Book Series—Advances in Public, Environmental and Occupational Health; Singapore Management and Sports Science Institute Pte.Ltd.: Singapore, 2013; Volume 2, pp. 3–8, ISSN 2339-5125. [Google Scholar]
- Funk, D.; Lock, D.; Karg, A.; Pritchard, M. Sport Consumer Behavior Research: Improving Our Game. J. Sport Manag. 2016, 30, 113–116. [Google Scholar] [CrossRef] [Green Version]
- Zhai, L.; Yang, T.C. Outdoor Sports Popularity—“Experiential Participation” Concept and Empirical Research. In Proceedings of the ISSGBM International Conference on Information, Communication and Social Sciences, Dubai, United Arab Emirates, 8–9 October 2016; Singapore Management and Sports Science Institute Pte.Ltd.: Singapore, 2016; Volume 67, pp. 514–521, ISBN 9789810997588. [Google Scholar]
- Pizzo, A.D.; Baker, B.J.; Na, S.; Lee, M.A.; Kim, D.; Funk, D.C. eSport vs. Sport: A Comparison of Spectator Motives. Sport Mark. Q. 2018, 27, 108–123, ISSN 1061-6934. [Google Scholar]
- De Almeida, B.S.; Coakley, J.; Junior, W.; Starepravo, F.A. Federal Government Funding and Sport: The Case of Brazil, 2004–2009. Int. J. Sport Policy Politics 2012, 4, 411–426. [Google Scholar] [CrossRef]
- Liu, Y. Investment and Circulating Funds Strategies in Sport Industry in China-To Establish the Investing Funds in Sport Industry in Our Country. In Proceedings of the 9th China National Convention on Sports Science, Shanghai, China, 1–4 December 2011; Volume iii: Sports Sociology. pp. 105–110, ISBN 9781846260957. [Google Scholar]
- Nova, J.; Strachova, M. Assessing the Impact of European Union Funding for Sport Facilities at Local Level. In Proceedings of the 8th International Scientific Conference on Kinesiology, Opatija, Croatia, 10–14 May 2017; pp. 456–460, ISBN 978-953-317-049-7. [Google Scholar]
- Weber, A.C.; De Bosscher, V.; Kempf, H. Positioning in Olympic Winter Sports: Analyzing National Prioritization of Funding and Success in Eight Nations. Eur. Sport Manage. Q. 2018, 18, 8–24, ISSN 1618-4742. [Google Scholar] [CrossRef]
- Dallmeyer, S.; Wicker, P.; Breuer, C. The relationship between Sport-Related Government Spending and Sport and Exercise Participation: The Role of Funding Size, Period, and Consistency. Int. J. Health Promot. Educ. 2018, 56, 237–247. [Google Scholar] [CrossRef]
- Feiler, S.; Wicker, P.; Breuer, C. Public Subsidies for Sports Clubs in Germany: Funding Regulations vs. Empirical Evidence. Eur. Sport Manag. Q. 2019, 19, 562–582. [Google Scholar] [CrossRef] [Green Version]
- De Bosscher, V.; Shibli, S.; Weber, A.C. Is Prioritization of Funding in Elite Sport Effective? An Analysis of the Investment Strategies in 16 Countries. Eur. Sport Manag. Q. 2019, 19, 221–243. [Google Scholar] [CrossRef] [Green Version]
- Hallmann, K. Women’s 2011 Football World Cup: The Impact of Perceived Images of Women’s Soccer and the World Cup 2011 on Interest in Attending Matches. Sport Manag. Rev. 2012, 15, 33–42. [Google Scholar] [CrossRef]
- Agnew, D.; Pill, S.; Drummond, M. Investigating the Elements That Encourage or Inhibit the Participation of Children and Youth in Australian Football. Ann. Leis. Res. 2016, 19, 27–46. [Google Scholar] [CrossRef]
- Gong, H.; Watanabe, N.M.; Soebbing, B.P.; Brown, M.T.; Nagel, M.S. Do Consumer Perceptions of Tanking Impact Attendance at National Basketball Association Games? A Sentiment Analysis Approach. J. Sport Manag. 2021, 35, 254–265. [Google Scholar] [CrossRef]
- SLOV-LEX. Act No. 440/2015 Coll.—Law on Sports and on Amendments to Certain Acts. 2021. Available online: https://www.slov-lex.sk/pravne-predpisy/SK/ZZ/2015/440/ (accessed on 14 November 2021).
- Wann, D.L.; Melnick, M.J.; Russell, G.W.; Pease, D.G. Sport Fans: The Psychology and Social Impact of Spectators, 1st ed.; Routledge: New York, NY, USA, 2001; 256p, ISBN 978-0415924641. [Google Scholar]
- Milne, G.R.; McDonald, M.A. Sport Marketing: Managing the Exchange Process; Jones and Bartlett Learning: Burlington, MA, USA, 1999; 169p, ISBN 0763708739. [Google Scholar]
- Fisher, R.J.; Wakefield, K. Factors Leading to Group Identification: A Field Study of Winners and Losers. Psychol. Mark. 1998, 15, 23–40. [Google Scholar] [CrossRef]
- Laverie, D.A.; Arnett, D.B. Factors Affecting Fan Attendance: The Influence of Identity Salience and Satisfaction. J. Leis. Behav. 2000, 32, 225–246. [Google Scholar] [CrossRef]
- Da Silva, E.C.; Las Casas, A. Sport Fans as Consumers: An Approach to Sport Marketing. Br. J. Mark. Stud. 2017, 5, 36–48. [Google Scholar]
- Yoshida, M.; James, J.D. Customer Satisfaction with Game and Service Experiences: Antecedents and Consequences. J. Sport Manag. 2010, 24, 338–361. [Google Scholar] [CrossRef]
- Kudlacek, M.; Fromel, K.; Groffik, D. Gender Differences in Preferences of Martial Arts in Polish Adolescents. Arch. Budo 2015, 11, 227–234, ISSN 1643-8698. [Google Scholar]
- Rus, C.-M.; Radu, L.-E.; Vanvu, G.I. Motivation for Participating to Sports Competitions in School. Rev. Cercet. Interv. Soc. 2016, 52, 195–203, ISSN 1583-3410. [Google Scholar]
- Meier, H.E.; von Uechtriz, C. The Key Role of Sport Policies for the Popularity of Women’s Sports: A Case Study on Women’s Soccer in Germany. Sociol. Sport J. 2020, 37, 328–345. [Google Scholar] [CrossRef]
- Ahmed, M.D.; Yan Ho, W.K.; Al-Haramlah, A.; Mataruna-Dos-Santos, L.J. Motivation to Participate in Physical Activity and Sports: Age Transition and Gender Differences among India’s Adolescents. Cogent Psychol. 2020, 7. [Google Scholar] [CrossRef]
- Lindsey, I. Conceptualising Sustainability in Sports Development. Leis. Stud. 2008, 27, 279–294. [Google Scholar] [CrossRef] [Green Version]
- Hu, K.H.; Chen, F.H.; Tzeng, G.H. Evaluating the Improvement of Sustainability of Sports Industry Policy Based on MADM. Sustainability 2016, 8, 606. [Google Scholar] [CrossRef] [Green Version]
- Trail, G.T.; McCullough, B.P. Marketing Sustainability through Sport: Testing the Sport Sustainability Campaign Evaluation Model. Eur. Sport Manag. Q. 2019, 20, 109–129. [Google Scholar] [CrossRef]
- Koman, G.; Bubeliny, O. Building Enterprise Reputation by Doing Sustainable Socially Responsible Business. In Proceedings of the 35th International-Business-Information-Management-Association Conference (IBIMA), Sevill, Spain, 1–2 April 2020; pp. 7109–7118, ISBN 978-0-9998551-4-0. [Google Scholar]
- Han, L.M.; Wang, Z.Q. On-Line Marketing Strategies for Sports Products. In Proceedings of the 2012 Pre-Olympic Congress on Sports Science and Computer Science in Sport, Liverpool, UK, 24–25 July 2012; pp. 404–407, ISBN 9781846260940. [Google Scholar]
- Vamplew, W. The Commodification of Sport: Exploring the Nature of the Sports Product. Int. J. Hist. Sport 2018, 35, 659–672. [Google Scholar] [CrossRef]
- Siani, M.G.; Mohammadi, S.; Hosseini, M.S.; Dickson, G. Comparing Young Adult Responses to Rational and Emotional Sports Product Advertisements: The Moderating Role of Product Type and Gender. Int. J. Sports Mark. Spons. 2021, 22, 798–815. [Google Scholar] [CrossRef]
- Nemec, M.; Admcak, S.; Michal, J.; Bartik, P. Opinions of Teachers from the Central Slovak Region on Teaching Sports Games at Elementary Schools. Eur. J. Contemp. Educ. 2019, 8, 157–166, e-ISSN 2305-6746. [Google Scholar] [CrossRef]
- Spehar, N.; Gosnik, J.; Reichel, K.F. The Preferences toward Sports of Students in Institutions of Higher Education. In Proceedings of the 5th International Scientific Conference on Kinesiology, Proceedings Book, Zagreb, Croatia, 10–14 September 2008; pp. 561–565, ISBN 978-953-6378-79-1. [Google Scholar]
- Petric, V.; Novak, D.; Neljak, B. Sporting Activity Preferences of People of Different Age and Gender in Rural Areas. In Proceedings of the 6th International Scientific Conference on Kinesiology: Integrative Power of Kinesiology, Zagreb, Croatia, 8–11 September 2011; pp. 353–357, ISBN 978-953-6378-79-1. [Google Scholar]
- Jankal, R.; Jankalová, M. How to Characterize Business Excellence and Determine the Relation between Business Excellence and Sustainability. Sustainability 2020, 12, 6198. [Google Scholar] [CrossRef]
- Lysenko-Ryba, K.; Zimon, D. Customer Behavioral Reactions to Negative Experiences during the Product Return. Sustainability 2021, 13, 448. [Google Scholar] [CrossRef]
- Statdat. Bilancia Podľa Rodinného Stavu, Pohlavia a Veku—SR, Oblasti, Kraje—IBM Cognos Viewer. Available online: http://statdat.statistics.sk/cognosext/cgi-bin/cognos.cgi?b_action=cognosViewer&ui.action=run&ui.object=storeID%28%22i615DF56BF8C54392A82735F2C0BA5CCB%22%29&ui.name=Bilancia+pod%C4%BEa+rodinn%C3%A9ho+stavu%2C+pohlavia+a+veku+-+SR%2C+oblasti%2C+kraje+%5Bom7004rr%5D&run.outputFormat=&run.prompt=true&cv.header=false&ui.backURL=%2Fcognosext%2Fcps4%2Fportlets%2Fcommon%2Fclose.html# (accessed on 14 November 2021).
- Wang, R.; Jia, T.; Qi, R.; Cheng, J.; Zhang, K.; Wang, E.; Wang, X. Differentiated Impact of Politics- and Science-Oriented Education on Pro-Environmental Behavior: A Case Study of Chinese University Students. Sustainability 2021, 13, 616. [Google Scholar] [CrossRef]
- National Sports Agency—Czech Republic. Sports Popularity Survey. 2020. Available online: https://agenturasport.cz/ (accessed on 8 November 2021).
- Blašková, M.; Tumová, D.; Blaško, R. Spirals of Sustainable Academic Motivation, Creativity, and Trust of Higher Education Staff. Sustainability 2021, 13, 7057. [Google Scholar] [CrossRef]
- Slovak Olympic Team. 2021. Available online: https://www.olympic.sk/ (accessed on 10 November 2021).
- Tumová, D. Social Policy of University Based on Decision Making on Academic Staff Motivation. In Proceedings of the 12th International Scientific Conference on Reproduction of Human Capital—Mutual Links and Connections (RELIK), Prague, Czech Republic, 7–8 November 2019; pp. 442–452, ISBN 978-80-245-2329-3. [Google Scholar]
- Kucharcikova, A.; Tokarcikova, E.; Durisova, M. Human Capital Efficiency in Trading Company. In Proceedings of the 9TH International Days of Statistics and Economics, Prague, Czech Republic, 10–12 September 2015; pp. 892–901, ISBN 978-80-87990-06-3. [Google Scholar]
- Varmus, M.; Kubina, M.; Adamik, R. Strategic Sport Management: Sustainability of Sports Clubs; Springer: Berlin/Heidelberg, Germany, 2021; ISBN 978-3-030-66732-0. [Google Scholar]
Figure 1.
The top 20 sports determined by the sum of the responses.

Figure 2.
The top 20 sports determined by the sum of the responses after weighting.

Figure 3.
Self-identification of fans in the top 10 sports from the TOP 1 category.

Figure 4.
Heatmap of the fan index in the top 10 sports from the TOP 1 category by gender.

Figure 5.
Heat map of the fan index in the top 10 sports from the TOP 2 category by gender.

Figure 6.
Gender distribution in the top 10 sports from the TOP 1 category.

Figure 7.
Age distribution in the top 10 sports from the TOP 1 category.


Table 1.
Comparison of population distribution and sample distribution.
| Age Group | Population | Sample | |||
|---|---|---|---|---|---|
| Count | % | Count | % | ||
| 1 | 15–20 | 317,915.0 | 6.92 | 62 | 18.34 |
| 2 | 21–30 | 671,427.0 | 14.62 | 197 | 58.28 |
| 3 | 31–40 | 854,059.0 | 18.60 | 44 | 13.02 |
| 4 | 41–50 | 841,963.5 | 18.33 | 19 | 5.62 |
| 5 | 51–60 | 701,721.0 | 15.28 | 8 | 2.37 |
| 6 | 61–70 | 675,806.0 | 14.71 | 7 | 2.07 |
| 7 | >70 | 529,928.5 | 11.54 | 1 | 0.30 |
Table 2.
Comparison of results for the top 20 sports by the sum of the responses and by the sum of the responses after weighting.
Table 2.
Comparison of results for the top 20 sports by the sum of the responses and by the sum of the responses after weighting.
| Sports | TOP 1 | TOP 2 | TOP 3 | SUM | Sports_w | TOP 1_w | TOP 2_w | TOP 3_w | SUM_w | |
|---|---|---|---|---|---|---|---|---|---|---|
| 1 | Ice Hockey | 52 | 47 | 29 | 128 | Football | 201 | 56 | 24 | 281 |
| 2 | Football | 67 | 28 | 24 | 119 | Ice Hockey | 156 | 94 | 29 | 279 |
| 3 | Skiing | 25 | 35 | 28 | 88 | Skiing | 75 | 70 | 28 | 173 |
| 4 | Cycling | 23 | 30 | 25 | 78 | Cycling | 69 | 60 | 25 | 154 |
| 5 | Tennis | 10 | 17 | 20 | 47 | Tennis | 30 | 34 | 20 | 84 |
| 6 | Athletics | 11 | 12 | 18 | 41 | Volleyball | 42 | 32 | 8 | 82 |
| 7 | Volleyball | 14 | 16 | 8 | 38 | Athletics | 33 | 24 | 18 | 75 |
| 8 | Bodybuilding and Fitness | 11 | 6 | 18 | 35 | Basketball | 39 | 16 | 12 | 67 |
| 9 | Basketball | 13 | 8 | 12 | 33 | Bodybuilding and Fitness | 33 | 12 | 18 | 63 |
| 10 | Roller-skating | 6 | 16 | 11 | 33 | Roller-skating | 18 | 32 | 11 | 61 |
| 11 | Floor Ball | 7 | 15 | 9 | 31 | Floor Ball | 21 | 30 | 9 | 60 |
| 12 | Motorsports | 10 | 5 | 10 | 25 | Motorsports | 30 | 10 | 10 | 50 |
| 13 | Swimming Sports | 4 | 7 | 8 | 19 | Dance Sports | 27 | 8 | 3 | 38 |
| 14 | Biathlon | 4 | 8 | 6 | 18 | Swimming Sports | 12 | 14 | 8 | 34 |
| 15 | Badminton | 2 | 5 | 10 | 17 | Biathlon | 12 | 16 | 6 | 34 |
| 16 | Figure Skating | 3 | 6 | 7 | 16 | Chess | 18 | 10 | 4 | 32 |
| 17 | Dance Sports | 9 | 4 | 3 | 16 | Figure Skating | 9 | 12 | 7 | 28 |
| 18 | Muay Thai | 4 | 4 | 8 | 16 | Wrestling | 15 | 10 | 3 | 28 |
| 19 | Chess | 6 | 5 | 4 | 15 | Muay Thai | 12 | 8 | 8 | 28 |
| 20 | Boxing | 3 | 6 | 5 | 14 | Boxing | 9 | 12 | 5 | 26 |
Table 3.
Results of the Pearson’s chi-squared test for self-identification of fans of the most popular sports.
Table 3.
Results of the Pearson’s chi-squared test for self-identification of fans of the most popular sports.
| Pearson’s Chi-Squared Test (Data: tabFAN vs. TOP) | ||
|---|---|---|
| Chi-Squared | df | p-Value |
| 79.039 | 44 | 0.0009314 |
Table 4.
Pearson’s chi-squared test results for the population’s distribution in terms of gender among the most popular sports.
Table 4.
Pearson’s chi-squared test results for the population’s distribution in terms of gender among the most popular sports.
| Pearson’s Chi-Squared Test (Data: tabGEN vs. TOP) | ||
|---|---|---|
| Chi-Squared | df | p-Value |
| 103.1 | 44 | <0.001 |
Table 5.
Results of the Pearson’s chi-squared test for the population’s age distribution among the most popular sports.
Table 5.
Results of the Pearson’s chi-squared test for the population’s age distribution among the most popular sports.
| Pearson’s Chi-Squared Test (Data: tabAGE vs. SPORTS) | ||
|---|---|---|
| Chi-Squared | df | p-Value |
| 229.32 | 264 | 0.9396 |
Table 6.
Multiple regression results.
| Models | OLS Regression Results | Significant Variables | Coefficients | Effect | t-Statistics’ p-Value | 𝛼 | |
|---|---|---|---|---|---|---|---|
| Model 1 | R-squared: | 0.1050 | Gender: women | 0.3687 | Negative | 0.004 | 0.05 |
| Adj. R-squared: | 0.0630 | Age group: 31–40 | 0.5802 | Positive | 0.045 | ||
| F-statistic’s p-value: | 0.0016 | Education: postgraduate | 1.0273 | Negative | 0.038 | ||
| Model 2 | R-squared: | 0.3730 | TOP 1: biathlon | 1.2811 | Positive | 0.034 | 0.05 |
| TOP 1: football | 1.2332 | Positive | <0.001 | ||||
| Adj. R-squared: | 0.2400 | TOP 1: fishing equipment | 2.6490 | Positive | 0.012 | ||
| TOP 1: dance sport | 0.9250 | Positive | 0.046 | ||||
| TOP 1: wrestling | 1.3055 | Positive | 0.020 | ||||
| F-statistic’s p-value: | <0.001 | Age group: 31–40 | 0.5005 | Positive | 0.070 | 0.1 | |
| TOP 1: riding | 1.2812 | Positive | 0.052 | ||||
| TOP 1: kickbox | 1.8181 | Negative | 0.087 | ||||
| TOP 1: motorsports | 1.8653 | Positive | 0.075 | ||||
| TOP 1: ice hockey | 0.6364 | Positive | 0.061 | ||||
Publisher’s Note: MDPI stays neutral with regard to jurisdictional claims in published maps and institutional affiliations. |
© 2022 by the authors. Licensee MDPI, Basel, Switzerland. This article is an open access article distributed under the terms and conditions of the Creative Commons Attribution (CC BY) license (https://creativecommons.org/licenses/by/4.0/).
Share and Cite
MDPI and ACS Style
Varmus, M.; Kubina, M.; Boško, P.; Mičiak, M. Application of the Perceived Popularity of Sports to Support the Sustainable Management of Sports Organizations. Sustainability 2022, 14, 1927. https://doi.org/10.3390/su14031927
AMA Style
Varmus M, Kubina M, Boško P, Mičiak M. Application of the Perceived Popularity of Sports to Support the Sustainable Management of Sports Organizations. Sustainability. 2022; 14(3):1927. https://doi.org/10.3390/su14031927
Chicago/Turabian StyleVarmus, Michal, Milan Kubina, Pavol Boško, and Martin Mičiak. 2022. "Application of the Perceived Popularity of Sports to Support the Sustainable Management of Sports Organizations" Sustainability 14, no. 3: 1927. https://doi.org/10.3390/su14031927
Note that from the first issue of 2016, this journal uses article numbers instead of page numbers. See further details here.