
Spatiotemporal Analysis of Road Crashes with Animals in Poland


Faculty of Transport, Warsaw University of Technology, Koszykowa 75, 00-662 Warsaw, Poland
*
Author to whom correspondence should be addressed.
Sustainability 2022, 14(3), 1253; https://doi.org/10.3390/su14031253
Submission received: 8 December 2021
/
Revised: 3 January 2022
/
Accepted: 18 January 2022
/
Published: 23 January 2022
(This article belongs to the Special Issue Traffic Flow, Road Safety, and Sustainable Transportation)
Abstract
:This article describes the issue of the influences of the time factor and wildlife populations on road animal–vehicle crashes. The article presents problems associated with animal–vehicle crashes in Poland. They are the subject of many court disputes. For the purposes of the study, data on animal–vehicle road crashes were obtained from the SEWiK database, as well as data on the numbers of animals in hunting districts from 2016–2020. The relationship between the number of road crashes and time was analysed, and the relationships between the numbers of road crashes and the animal populations, as well as the locations, types, and categories of the hunting districts, were analysed as well. The factors related to changes in the wildlife populations, road crashes in previous years, and the lengths of the road networks were also analysed. The research shows no relationship between the abundance of a particular species and the number of road crashes. Instead, there is a correlation between the number of crashes in previous years and the road network length.
1. Introduction
1.1. The Problem of Road Animal–Vehicle Crashes
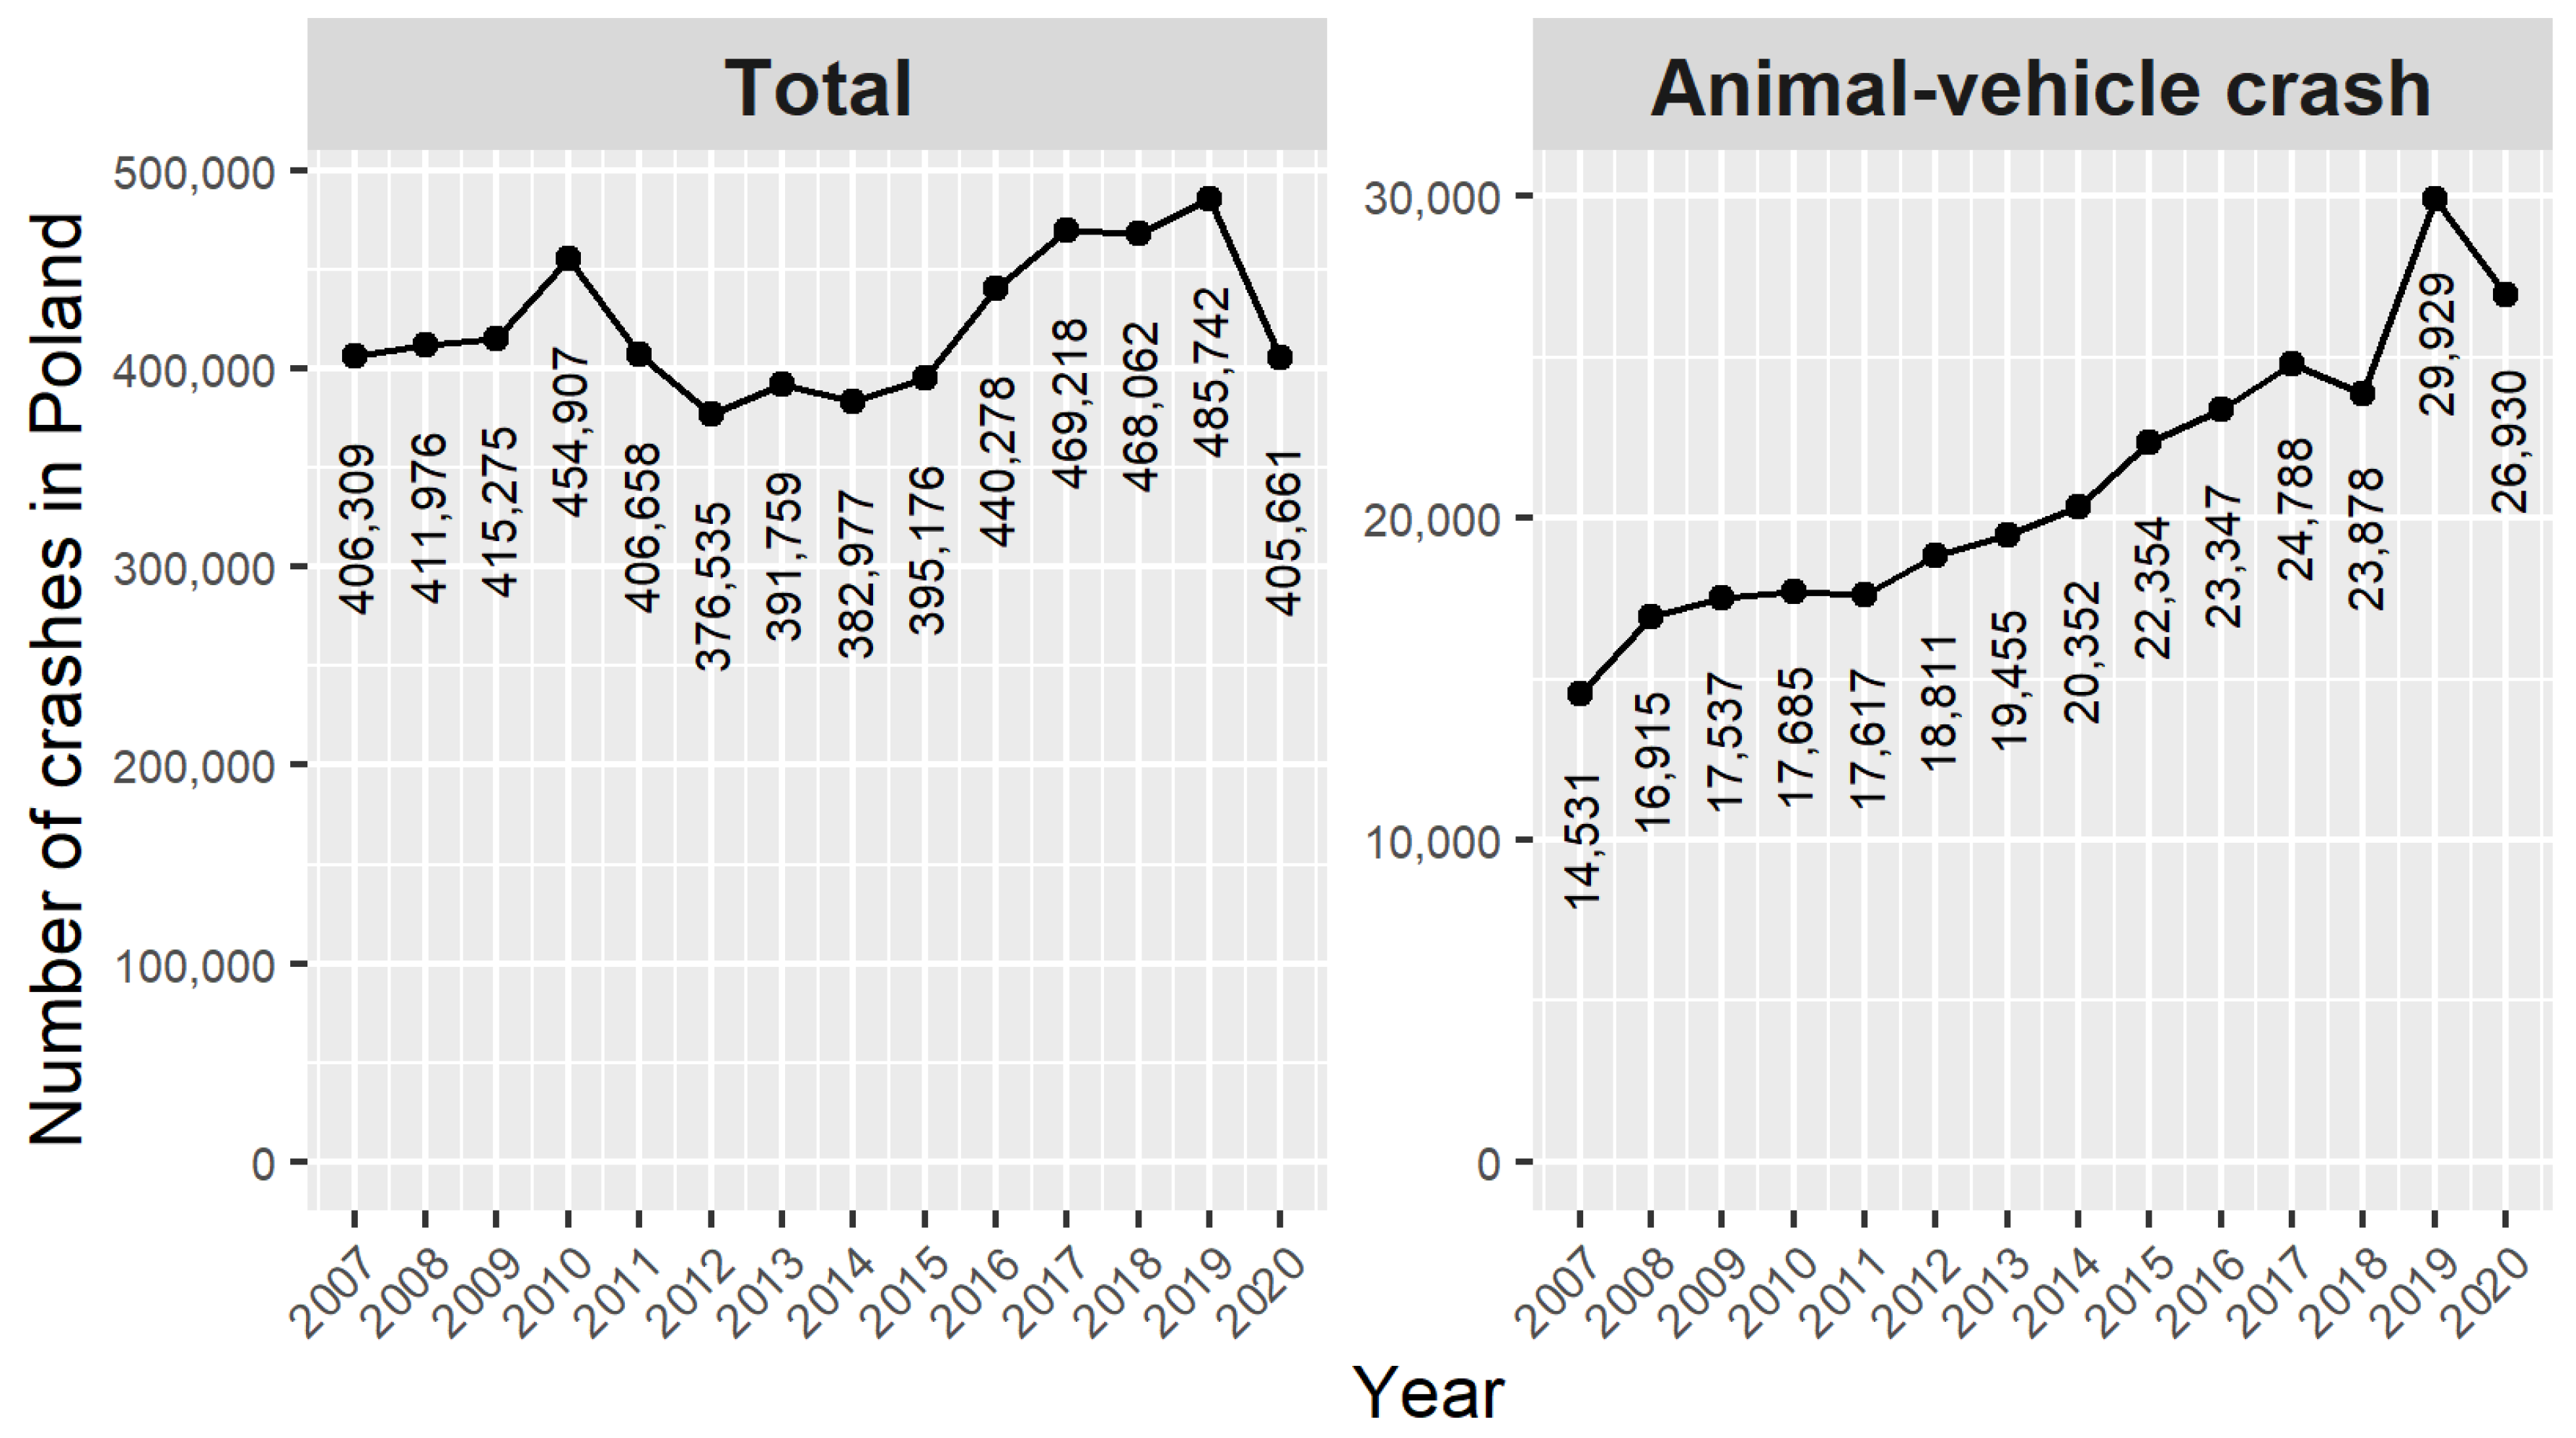
Although many traffic safety issues are related to intersections [1], especially controlled ones [2,3], certain types of crashes occur primarily on sections outside of the intersections [4]. For several years, the number of animal–vehicle crashes in Poland has been on the rise. Between 2007 and 2019, the number of animal–vehicle crashes practically doubled, while the total number of road crashes shows a variation of no more than 20% [5] (Figure 1). This trend indicates that this phenomenon needs to be studied in detail. An analysis of the police statistics reveals that the number+ of crashes varies for roads of different categories. There are relatively few crashes on motorways. A large number of crashes occur on national roads (including expressways) and voivodeship roads. National roads and motorways constitute less than 5% of the length of roads in Poland [6], and about ¼ of animal–vehicle crashes occur there. Similarly, voivodeship roads constitute about 7% of the road network in Poland, and they are involved in about 25% of the accidents (Table 1) [5,6]. These roads are characterised by fairly high travel speeds and traffic volumes, and most are not physically protected from wildlife access. Appropriate fences and animal bridges are mainly used on motorways and expressways. On the other hand, on roads of lower technical classes, the A-18b warning sign, “wild animals”, is the most frequently used solution.
According to the provisions of [7], this sign is used in places where animals frequently cross the carriageway, at the entrances to forests with a lot of wildlife, and at the intersections of roads with routes to water holes. Such locations can be determined on the basis of the Forest Service information on wildlife migration routes. The ambiguous nature of these provisions results in a high number of court disputes related to road crashes [8]. The injured parties sue the road authorities, claiming that the accident was caused by a warning sign not being in place where it should have been. The judgements of the courts on this issue are divergent, while the presence of animals in the vicinity of the scene has been the argument of the parties many times. One of the article’s authors crafted opinions as a court expert in the field of road traffic engineering. He was repeatedly faced with court questions about the relationship between the numbers of wild animals and the occurrence of animal–vehicle crashes. Therefore, it is reasonable to investigate whether the population of animals of a given species in an area affects the number of road crashes.
1.2. Literature Review
The literature on animal–vehicle crashes is very abundant, and it addresses the issue from many perspectives. The environmental impact of road construction and traffic is negative [9,10], so it is important to minimise it. The reference literature refers to research conducted in 12 countries: Poland, the United States, the Czech Republic, Spain, Canada, Russia, Brazil, Finland, Lithuania, Australia, Sweden, and the United Kingdom. The largest number of papers relate to Poland—the location of the research presented in this paper.
Many papers describe the issue from the perspective of the statistical data covering larger areas, such as the entire country [11,12,13,14], a state [11,15], or a voivodeship [16,17]. Analyses have also been conducted for entire long road sections [18,19]. The smallest units for which the area analyses were conducted is the counties [20,21]. Counties in Poland (excluding cities with county rights) range in size, from 158 km² to 2976 km² [22]. With such large areas, the risk of a crash with an animal varies greatly. Global analyses have also been conducted in conjunction with other factors, such as the forest cover of the area [23], and the number of registered vehicles [24].
As different animal species have different effects on the consequences of a road crash, publications often focus on selected species. Approximately 75% of fatal animal–vehicle crashes involve large mammals [25]. A similar position is presented in publications concerning Polish conditions: the authors of [26,27] define the concept of the “big four”, which includes roe deer, deer, moose, and wild boar. This group does not include animals under species protection, such as the European bison or the brown bear, because of the small numbers of these individuals in Poland. The most common publication topic is road crashes with moose [17,28,29,30,31,32,33,34,35,36]. Other large animals studied include roe deer [37], deer [32,38,39], reindeer [11], and wild boar [38]. In terms of small animals, the research has focused on wolves [40]. Small animals [41], turtles [42], and snakes and lizards [43] are important for the functioning of the ecosystem, but are less important for road safety. Research comparing different groups of animals has also been conducted [44,45].
Significant underreporting has been a problem in studying the phenomenon of animal–vehicle crashes. This issue is described in many works [46,47,48,49]. Similar conclusions can be drawn by analysing data from different countries [5,19]. Therefore, the challenges are to obtain reliable data on animal–vehicle crashes and to build an appropriate database [50]. In other countries, as well, cases involving animal–vehicle crashes are making their way to the courts [51].
Most research work focuses on determining the local factors that cause concentrations of road crashes on a given road section or in a selected area. Among the factors analysed are the road crash data from the police and insurance companies [52,53,54], as well as information on the location of animal carcasses [26,49]. Numerous studies have analysed the factors related to crash scenes, which may include:
There are also review articles in the literature detailing the selection of factors affecting animal–vehicle crashes [77,78].
A similar problem to vehicle–animal crashes are animal–train crashes, which are described in the research [79,80,81].
The research and guidelines also address the various safeguards against animal–vehicle crashes. The most numerous entries are on animal bridges [19,82,83,84,85,86], but there are also entries on electronic warning systems that are based on animal detection [87] or fencing [19,45,84], and even entries on the use of scents to deter animals [19]. However, there are no analyses on the effectiveness of warning signs, and there are no formulated rules for their use.
Only a few isolated studies address animal–vehicle crashes in large cities [88]. This is because of the lower frequency of crashes in such areas, as well as the lower speeds in urban areas, which reduces the severity of crashes.
The issue of animal–vehicle crashes has also been analysed in terms of animal injuries [89], as well as in terms of the injuries of the accident participants [29,34]. The research indicates that an effective method for avoiding a crash is reducing the speed, which allows one to perform defensive manoeuvres [35,36,56]. Some of the models developed have good performances, as they can predict about 85% of the animal–vehicle crash locations [90].
Although the wording of court judgements often includes wording regarding the population size of the wildlife in the vicinity of the crash scene [8], this issue appears in a small number of studies, with the impacts described as insignificant [46,91]. There has been no research on this issue conducted in Poland. For this reason, investigating this relationship seems to be an interesting research topic. The literature analysis shows that there are many studies on animal–vehicle collisions at the macro scale. They concern statistical data for the whole country [11,12,13,14], or for a state [15] or a voivodship [16,17]. Similarly, there are numerous studies covering the immediate vicinity of the AVC. Analyses have been conducted, for example, for a radius of 300 m [65], and for a radius of 1000 m [90]. However, the aforementioned authors did not find studies conducted for areas smaller than a county (except for [36], but the article concerns the areas of only 35 hunting districts). Performing area analyses for small areas allows for an AVC risk assessment and detailed microscale analyses for the most dangerous places. The mesoscale analysis is not as labour intensive as analysing each animal–vehicle collision, and it can be performed in much less time. By commencing a microscale analysis of the most endangered areas, road sign warnings against wild animals will be erected more quickly.
1.3. Article Content
The article is structured as follows: Section 1 presents the rationale for the topic and a literature review. Section 2 presents the research methodology of the conducted research. Section 3 presents the results of the research. The last part of the article (Section 4) discusses the results in relation to the literature analysis. The aim of the paper is to show the factors affecting the number of road crashes on a meso scale. The analysis covers smaller areas than the administrative division into counties and communes/municipalities, as well as the population sizes of animals of different species, but it is conducted at a higher level than the area immediately adjacent to the scene of an animal–vehicle crash, as is the case in many other studies. The article’s main aim is to investigate the relationship between the number of wild animals in a given area and the number of animal–vehicle collisions. In addition, the article investigates the relationship between the times (day of the year, month, and time) and the occurrences of such crashes. The influence of the parameters of the hunting district, and its category and location, are also examined.
2. Methods
2.1. Road Crash Data
The SEWiK database [5] contains information on all of the road crashes in Poland to which the police were called. In Poland, there is no obligation to call the police if only material damage has occurred in a crash. SEWiK is a nationwide database, covering all road categories. The scope of the data collected is defined by the Order of the Police Chief Commander [92]. For the purposes of the analysis, data were obtained from the aforementioned database. This database has a hierarchical structure [93], and the participating vehicles and persons are assigned to each crash. The data extracted from the police were converted into a relational form. For the purpose of the analyses, crashes with the “running into an animal” cause were filtered out. This allowed for the extraction of data on 128,878 animal–vehicle crashes between 2016 and 2020 (a five-year period). Note that the database does not include the species of animal involved in the crash. An analogical situation also occurs in other countries [94]. The SEWiK database is the only nationwide database related to animal–vehicle crashes. Other research has also been conducted on the basis of these data [14,16,18,20,48,53]. Partial data are also available from forest inspectorates (in Poland, there are 429 [95]) and the road authorities: 16 branches of the General Directorate for National Roads and Motorways; 16 voivodeship road authorities; 314 counties (including cities with county rights); and 2411 communes (excluding municipalities that are cities with county rights). The data from the road authorities are stored in a different format and are usually related to the disposal of animal carcasses; they do not provide information on the circumstances of the road crash.
Since 2015, the SEWiK database has stored the coordinates of all road crashes. The coordinates are entered into the WGS-84 system, in DD*MM’SSs format (s is a decimal of a second), or in DD.ddddd format (ddddd is a decimal of a degree). More than 2,000,000 road crashes occurred during the period under review. The data formally meeting the requirements of the above notation accounted for 92%. No coordinates have been provided for 0.44% of the crashes in the database. The other cases include: one digit missing from the data, or values over 59 in the minute or second positions. In these cases, an adjustment was made to the coordinate values on the basis of the statistics of the occurrence of the type of error in question. The crash data were linked to the crash participant data in order to assess whether it was a crash involving injuries or fatalities. A fatal crash is defined as a crash in which at least one participant dies, either at the scene, or within 30 days of the crash.
2.2. Data on Wildlife Population Sizes and Hunting Districts
The wildlife population size data for 2016–2020 were obtained from the Forest Data Bank [96] in May 2021. There are 4985 hunting districts in Poland. These districts have areas ranging from 13 km2 to 403 km2, many times smaller than the counties for which the research was conducted [20,21]. Hunting districts are established by way of a resolution of the voivodeship assembly. The vector layers of hunting districts for particular voivodeships were also obtained in the ESRI shapefile format. An inventory of the wildlife is conducted annually in hunting districts, until March 10. It includes the following species:
- Big game:
- ○
- Moose (Alces alces);
- ○
- Red deer (Cervus elaphus);
- ○
- Sika deer (Cervus nippon);
- ○
- European fallow deer (Dama dama);
- ○
- Roe deer (Capreolus);
- ○
- European mouflon (Ovis aries musimon);
- ○
- Wild boar (Sus scrofa).
- Small game:
- ○
- Red fox (Vulpes vulpes);
- ○
- Racoon dog (Nyctereutes);
- ○
- European badger (Meles meles);
- ○
- Golden jackal (Canis aureus);
- ○
- Marten (Martes);
- ○
- European mink (Mustela lutreola);
- ○
- European polecat (Mustela putorius);
- ○
- Raccoon (Procyon lotor);
- ○
- Muskrat (Ondatra zibethicus);
- ○
- European hare (Lepus europaeus);
- ○
- European rabbit (Oryctolagus cuniculus).
For each hunting district, the data on the numbers of individual animal species in the following years were obtained: a total of 90 data for each hunting district for the period of five years, and 448,650 data on the number of animals for Poland. The data were combined with the geometries of the hunting districts.
Hunting districts do not cover the whole area of Poland. The areas of national parks, among others, are excluded. Data were obtained from Kampinos National Park. These data include other species not inventoried in the hunting districts (e.g., lynx, wolves, and beavers). In addition, statistical data on animal mortality in the National Park area were obtained, with detailed information for the largest road passing through the park. Because of the different scopes of the data, they were not used in further research, as no data were obtained from other national parks.
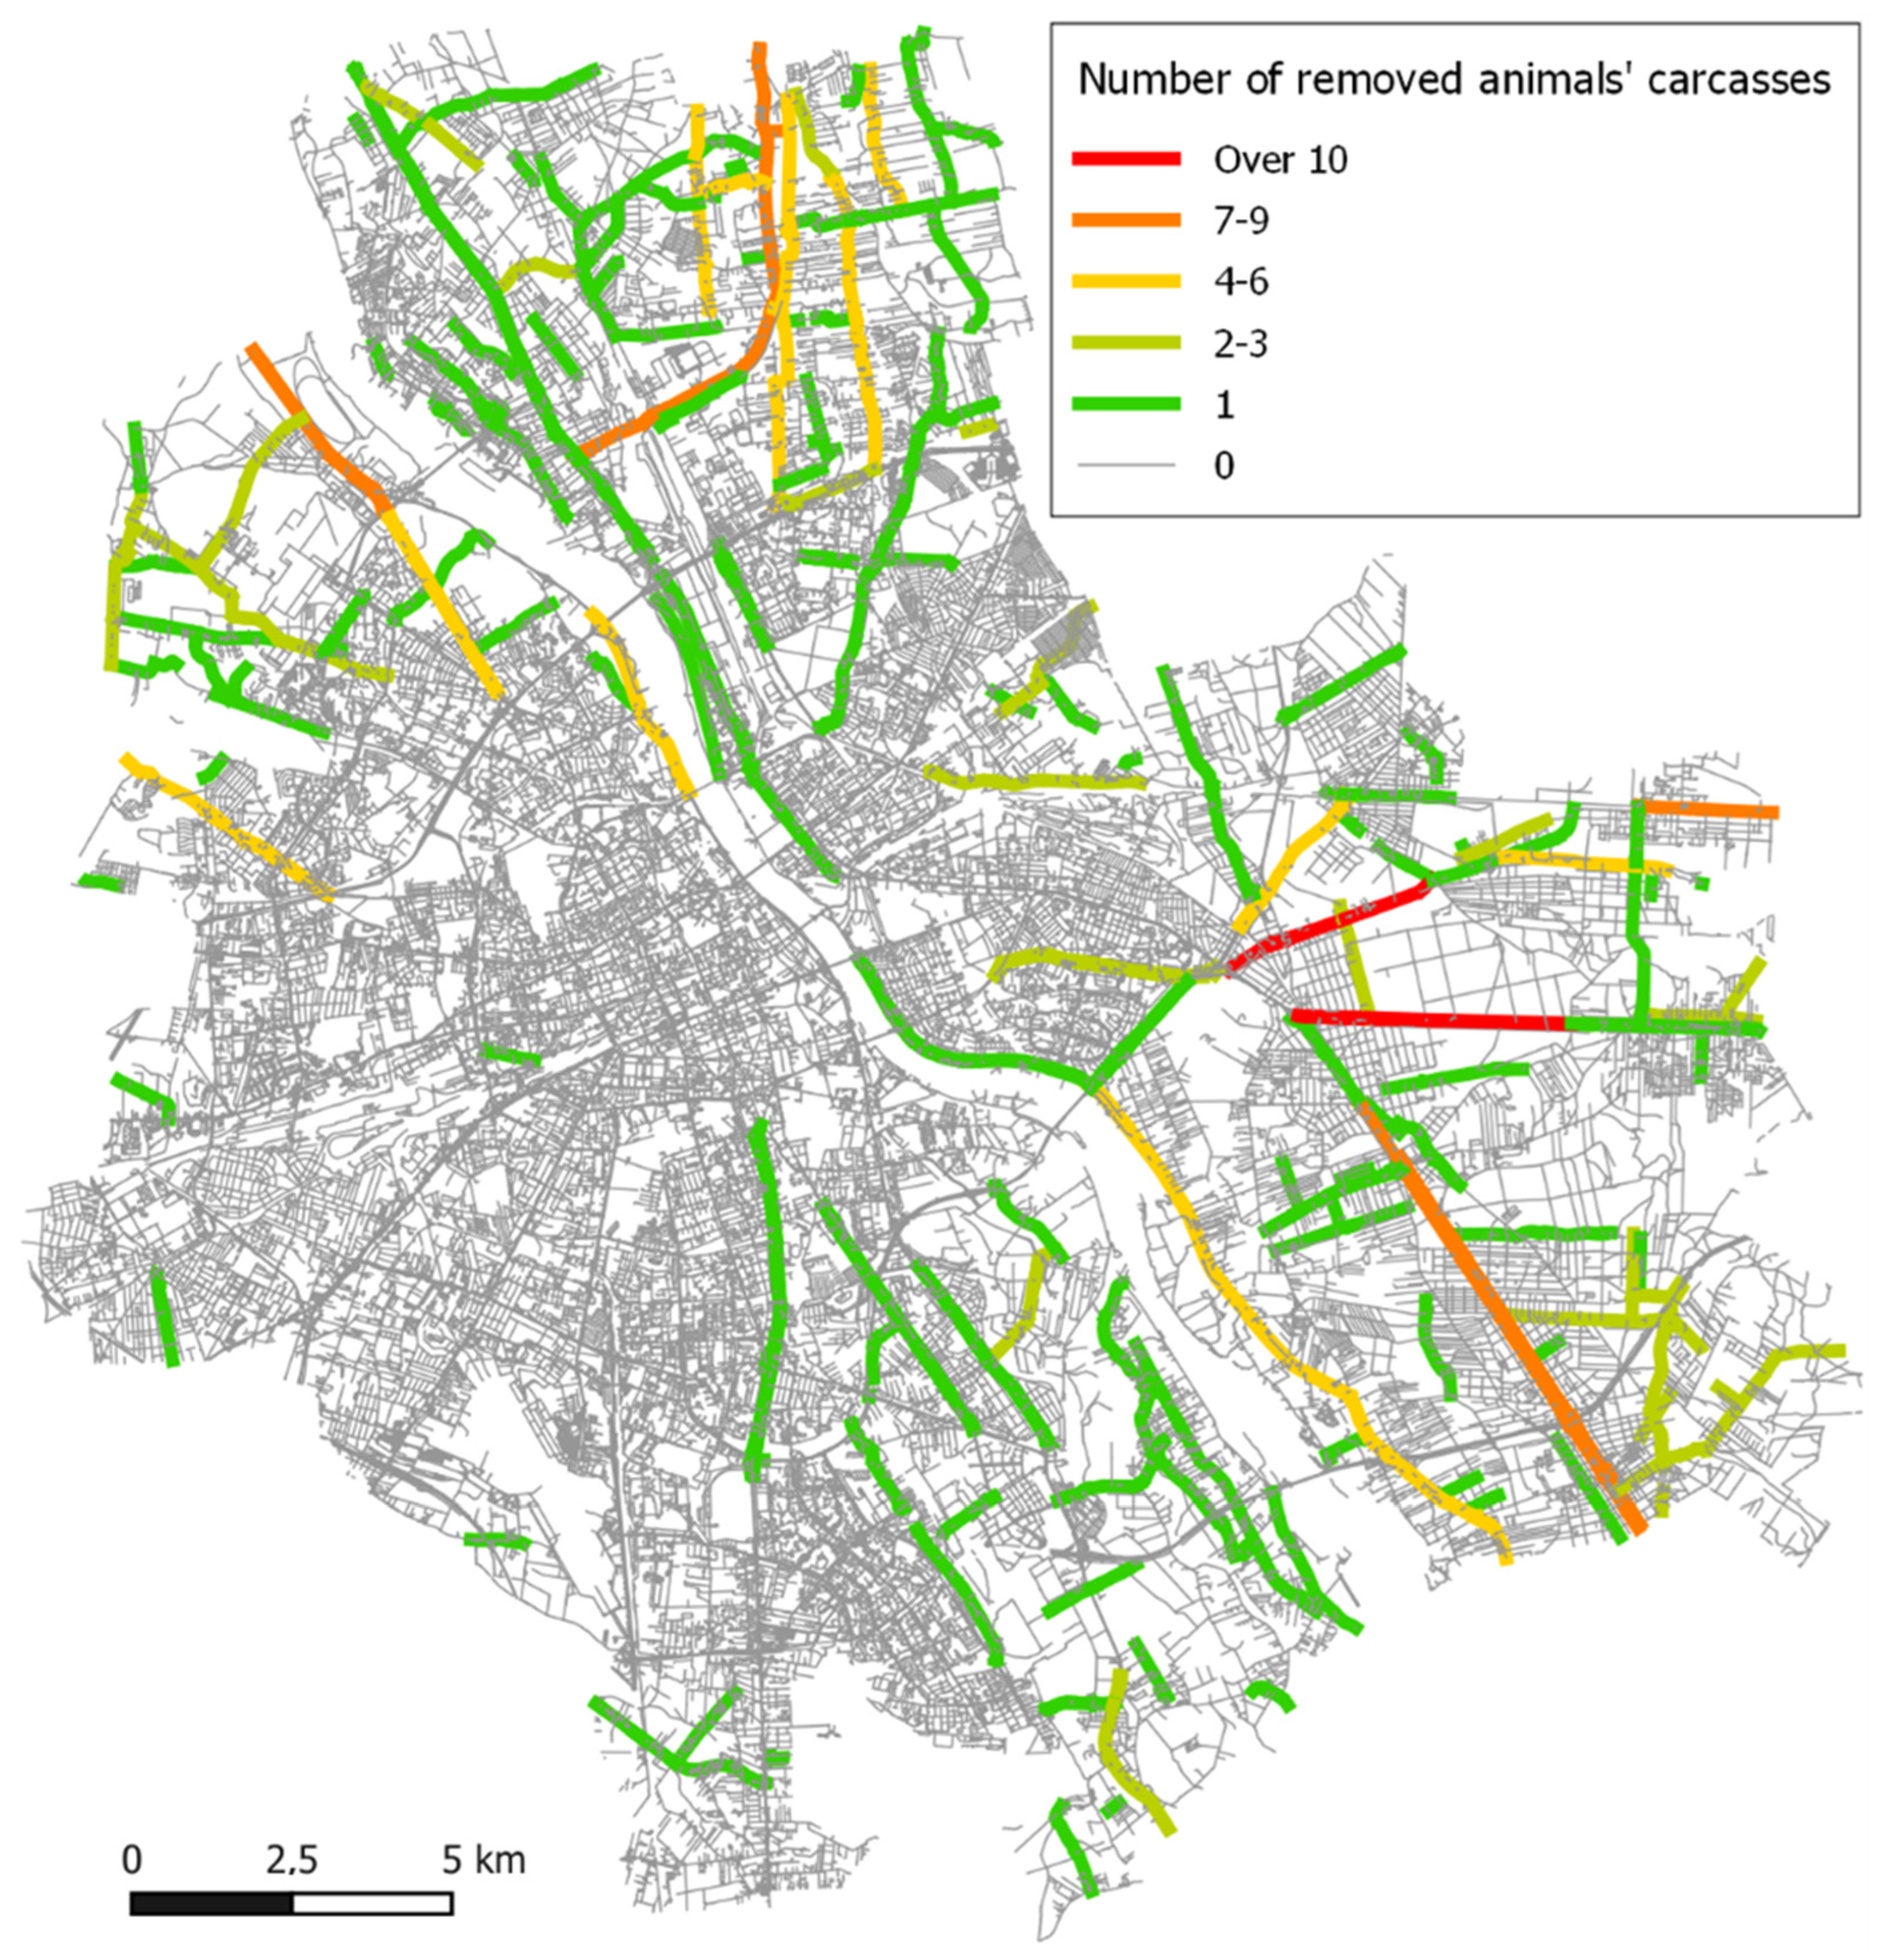
Large cities are not covered by the hunting districts either. No game inventory is conducted in such areas. In cities, only disposed animal carcasses are recorded. A sample map, prepared on the basis of data obtained from the City Forests of Warsaw, is shown in Figure 2. The data were cleaned up for the errors in the street names and neighbourhoods.
2.3. Road Network Data
The road network data were obtained from OpenStreetMap [97], using snapshots provided by Geofabrik [98]. Because of the occurrences of animal–vehicle crashes primarily on roads with higher speeds and traffic volumes, roads with a category lower than “secondary” or “tertiary” were filtered out, in particular, pedestrian roads, bicycle roads, etc. The road categorisation described in the OpenStreetMap documentation [99] was used for this purpose.
2.4. Geospatial Analysis
QGIS 3.16 software was used for the spatial analysis [100]. The data on road crashes were loaded with coordinates as a point layer, while the data on game were loaded with the borders of hunting districts as a polygon layer. The area was calculated for each of the hunting districts.
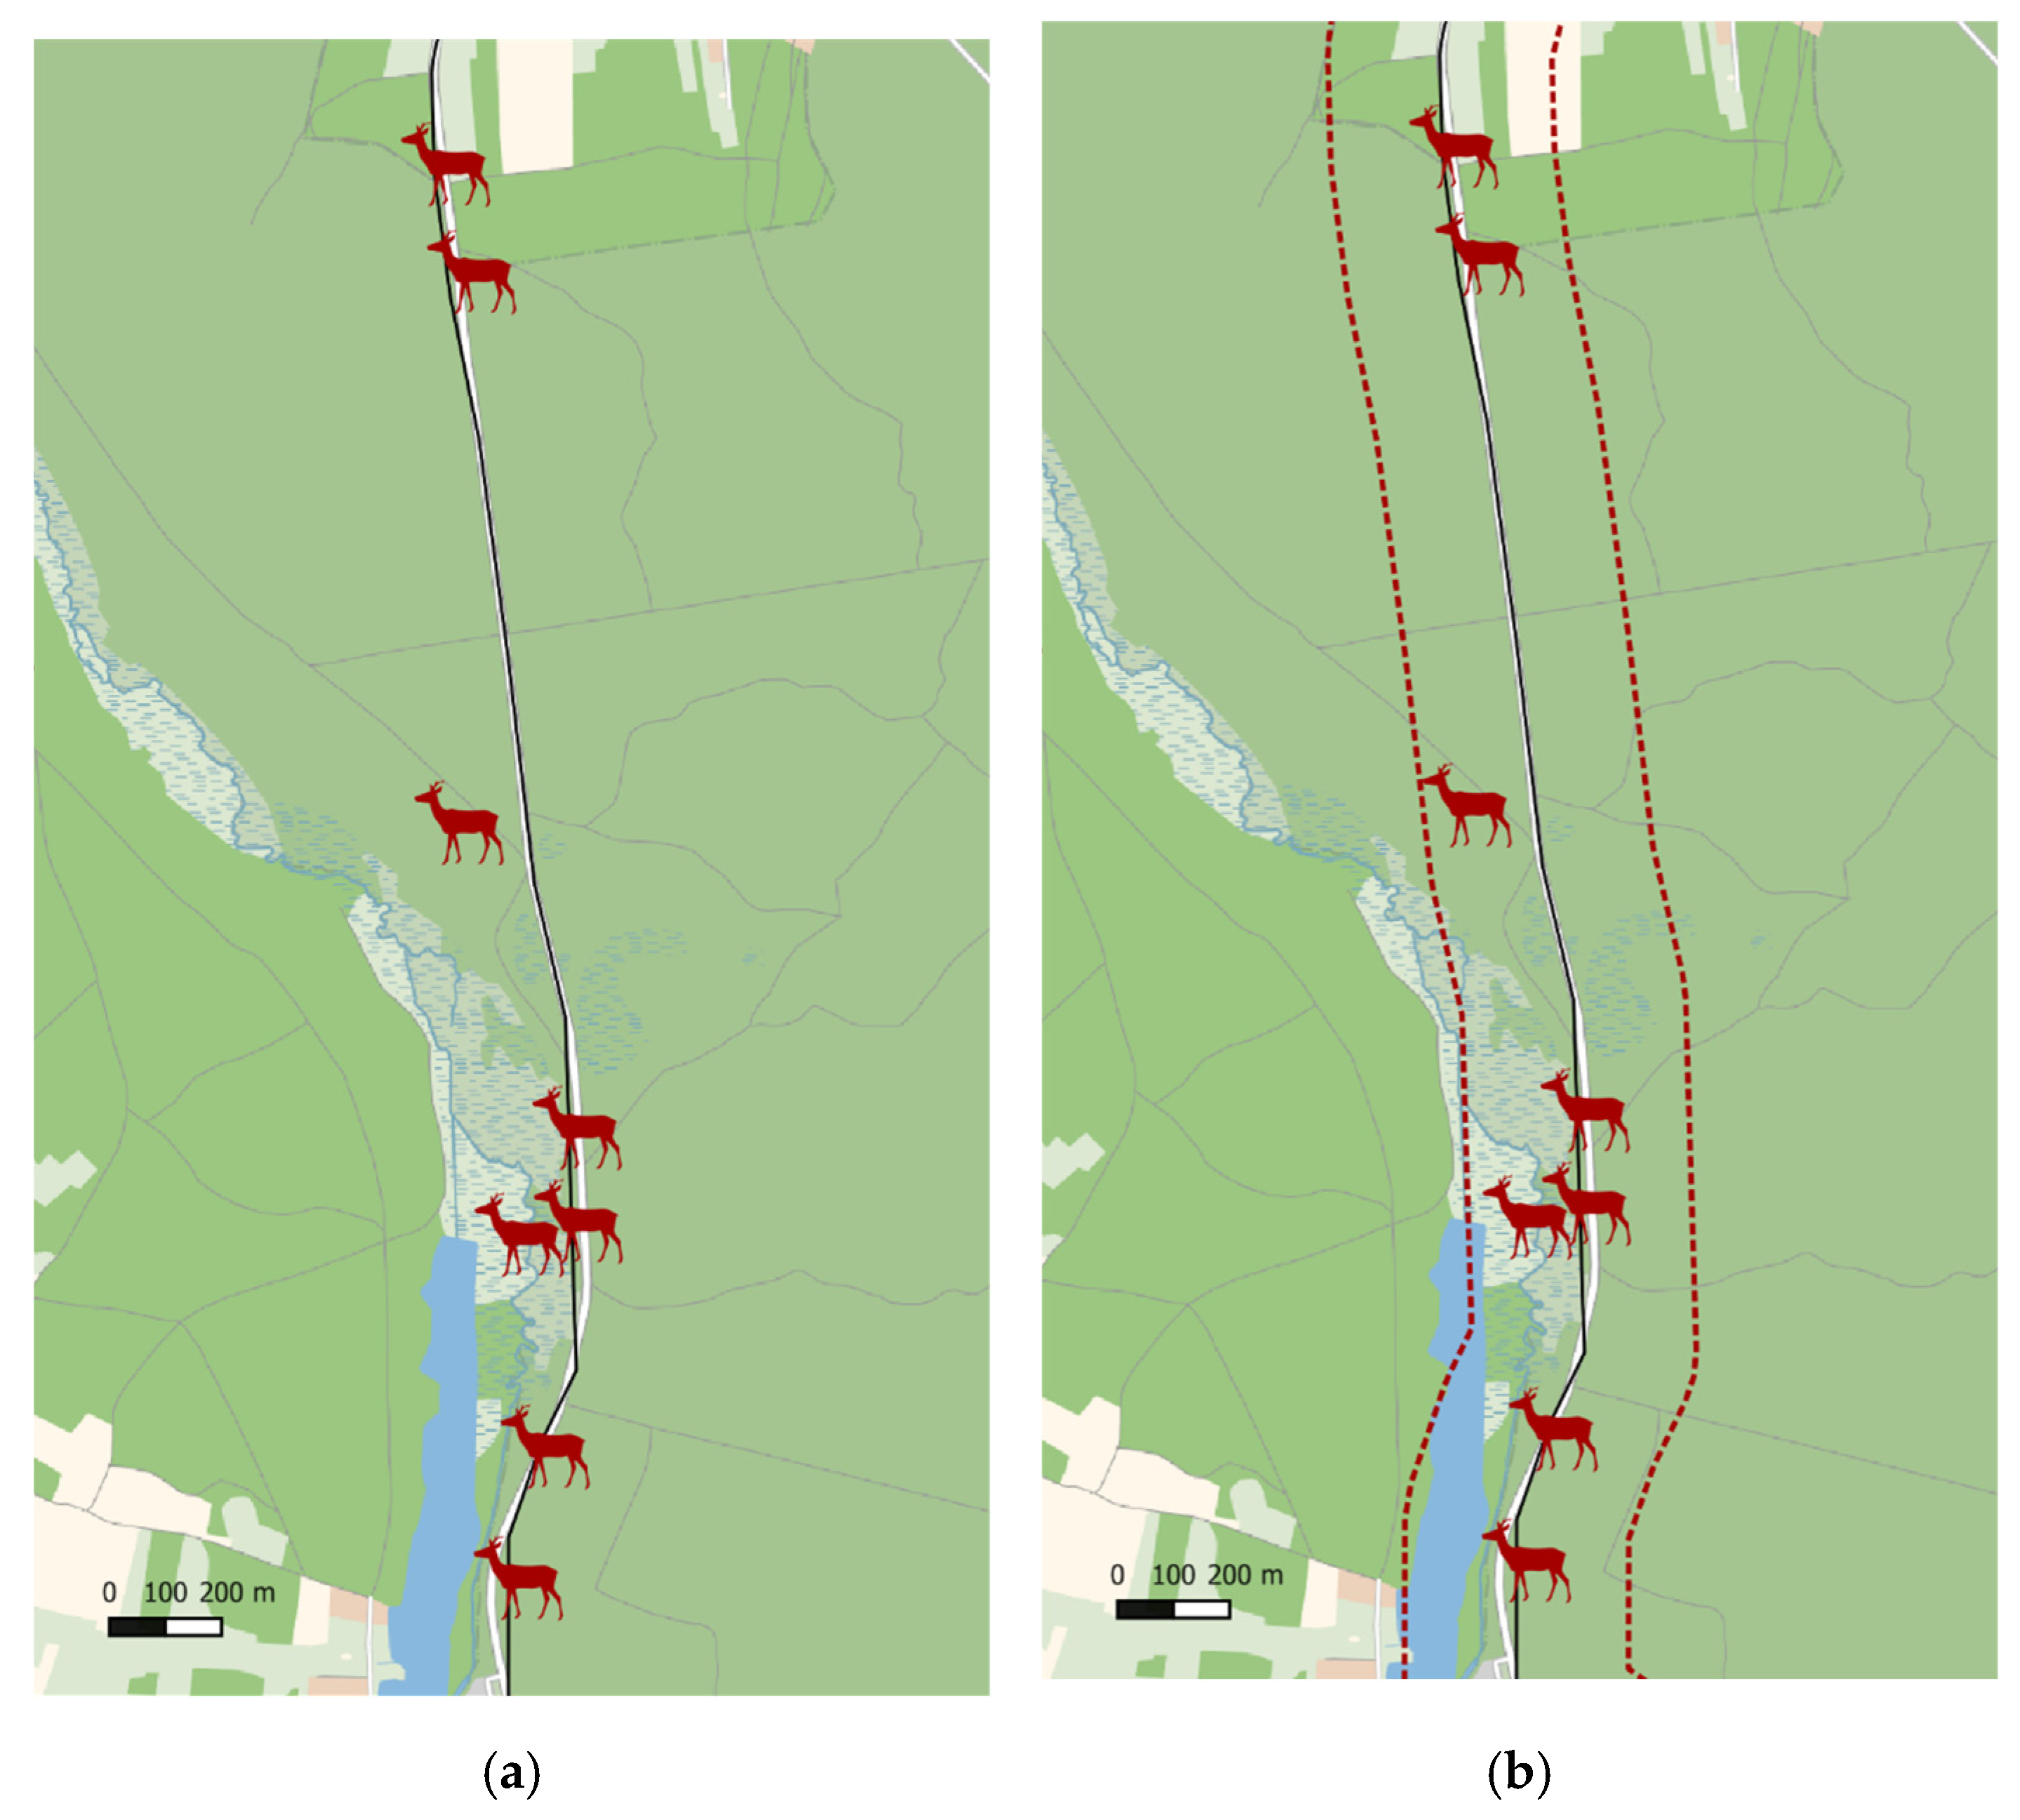
The route of the district boundaries along roads is a problem associated with assigning a given crash to a hunting area. Therefore, crashes on a given road are assigned partly to one hunting district, and partly to another hunting district (Figure 3a). Therefore, 200-m buffers were set for each hunting district (Figure 3b). Because of the application of that measure, the crashes on the boundary roads are ranked as statistics in the hunting districts on both sides of the road.
All layers used during the work were converted to a PL-1992 coordinate system (EPSG2180). This system provides a sufficient accuracy of 80 cm throughout Poland. At the next stage, using the geoprocessing algorithms [101], the numbers of crashes in each district were calculated, taking into account the consequences of the crash–all crashes, the crashes involving the injured and fatal crashes, and 15 data for a five-year period for each district were obtained (74,775 data for the area of Poland).
At the next stage, using the road data [98], the lengths of the roads of categories not less than secondary and not less than tertiary, in each hunting district, were calculated.
2.5. Determination of Indicators
The data calculated in QGIS were imported into the R software [102]. The data were converted to a form that allows for statistical analysis [103] and visualisation [104]. Analyses were performed for the data to determine the following indicators:
- The number of crashes, by year, month, and day of the week, broken down by the crash impacts;
- The number of crashes at particular hours by month;
- An analysis of the impact of the district type, category, and location on the number of crashes;
- An analysis of the impact of the number of crashes with the number of individual animal species;
- An analysis of the impact of the number of crashes with the number of animals per unit area;
- An analysis of the impact of the number of crashes per unit area with the number of animals;
- An analysis of the impact of the number of crashes with the number of animals per unit length of roads (in the variants for the secondary and tertiary categories);
- An analysis of the impact of the number of crashes per unit length of roads (in the variants for the secondary and tertiary categories) with the number of animals;
- An analysis of the impact of the changes in the numbers of animals in a district on the number of road crashes.
The correlation coefficient was used to analyse the impact of one variable on another variable. The selection of the correlation coefficient used (Pearson’s or Spearman’s) was based on an analysis of the normality of the distribution, using Shapiro–Wilk and Pearson’s chi-square tests. We also evaluated whether a given correlation is statistically significant; a level of significance of 0.05 was assumed. The part of the correlation matrix determining the impact of the population size of one game species on another was disregarded in the article, as it is not important because of the objective of the research.
3. Results
3.1. Temporal Analysis of Animal–Vehicle Crashes
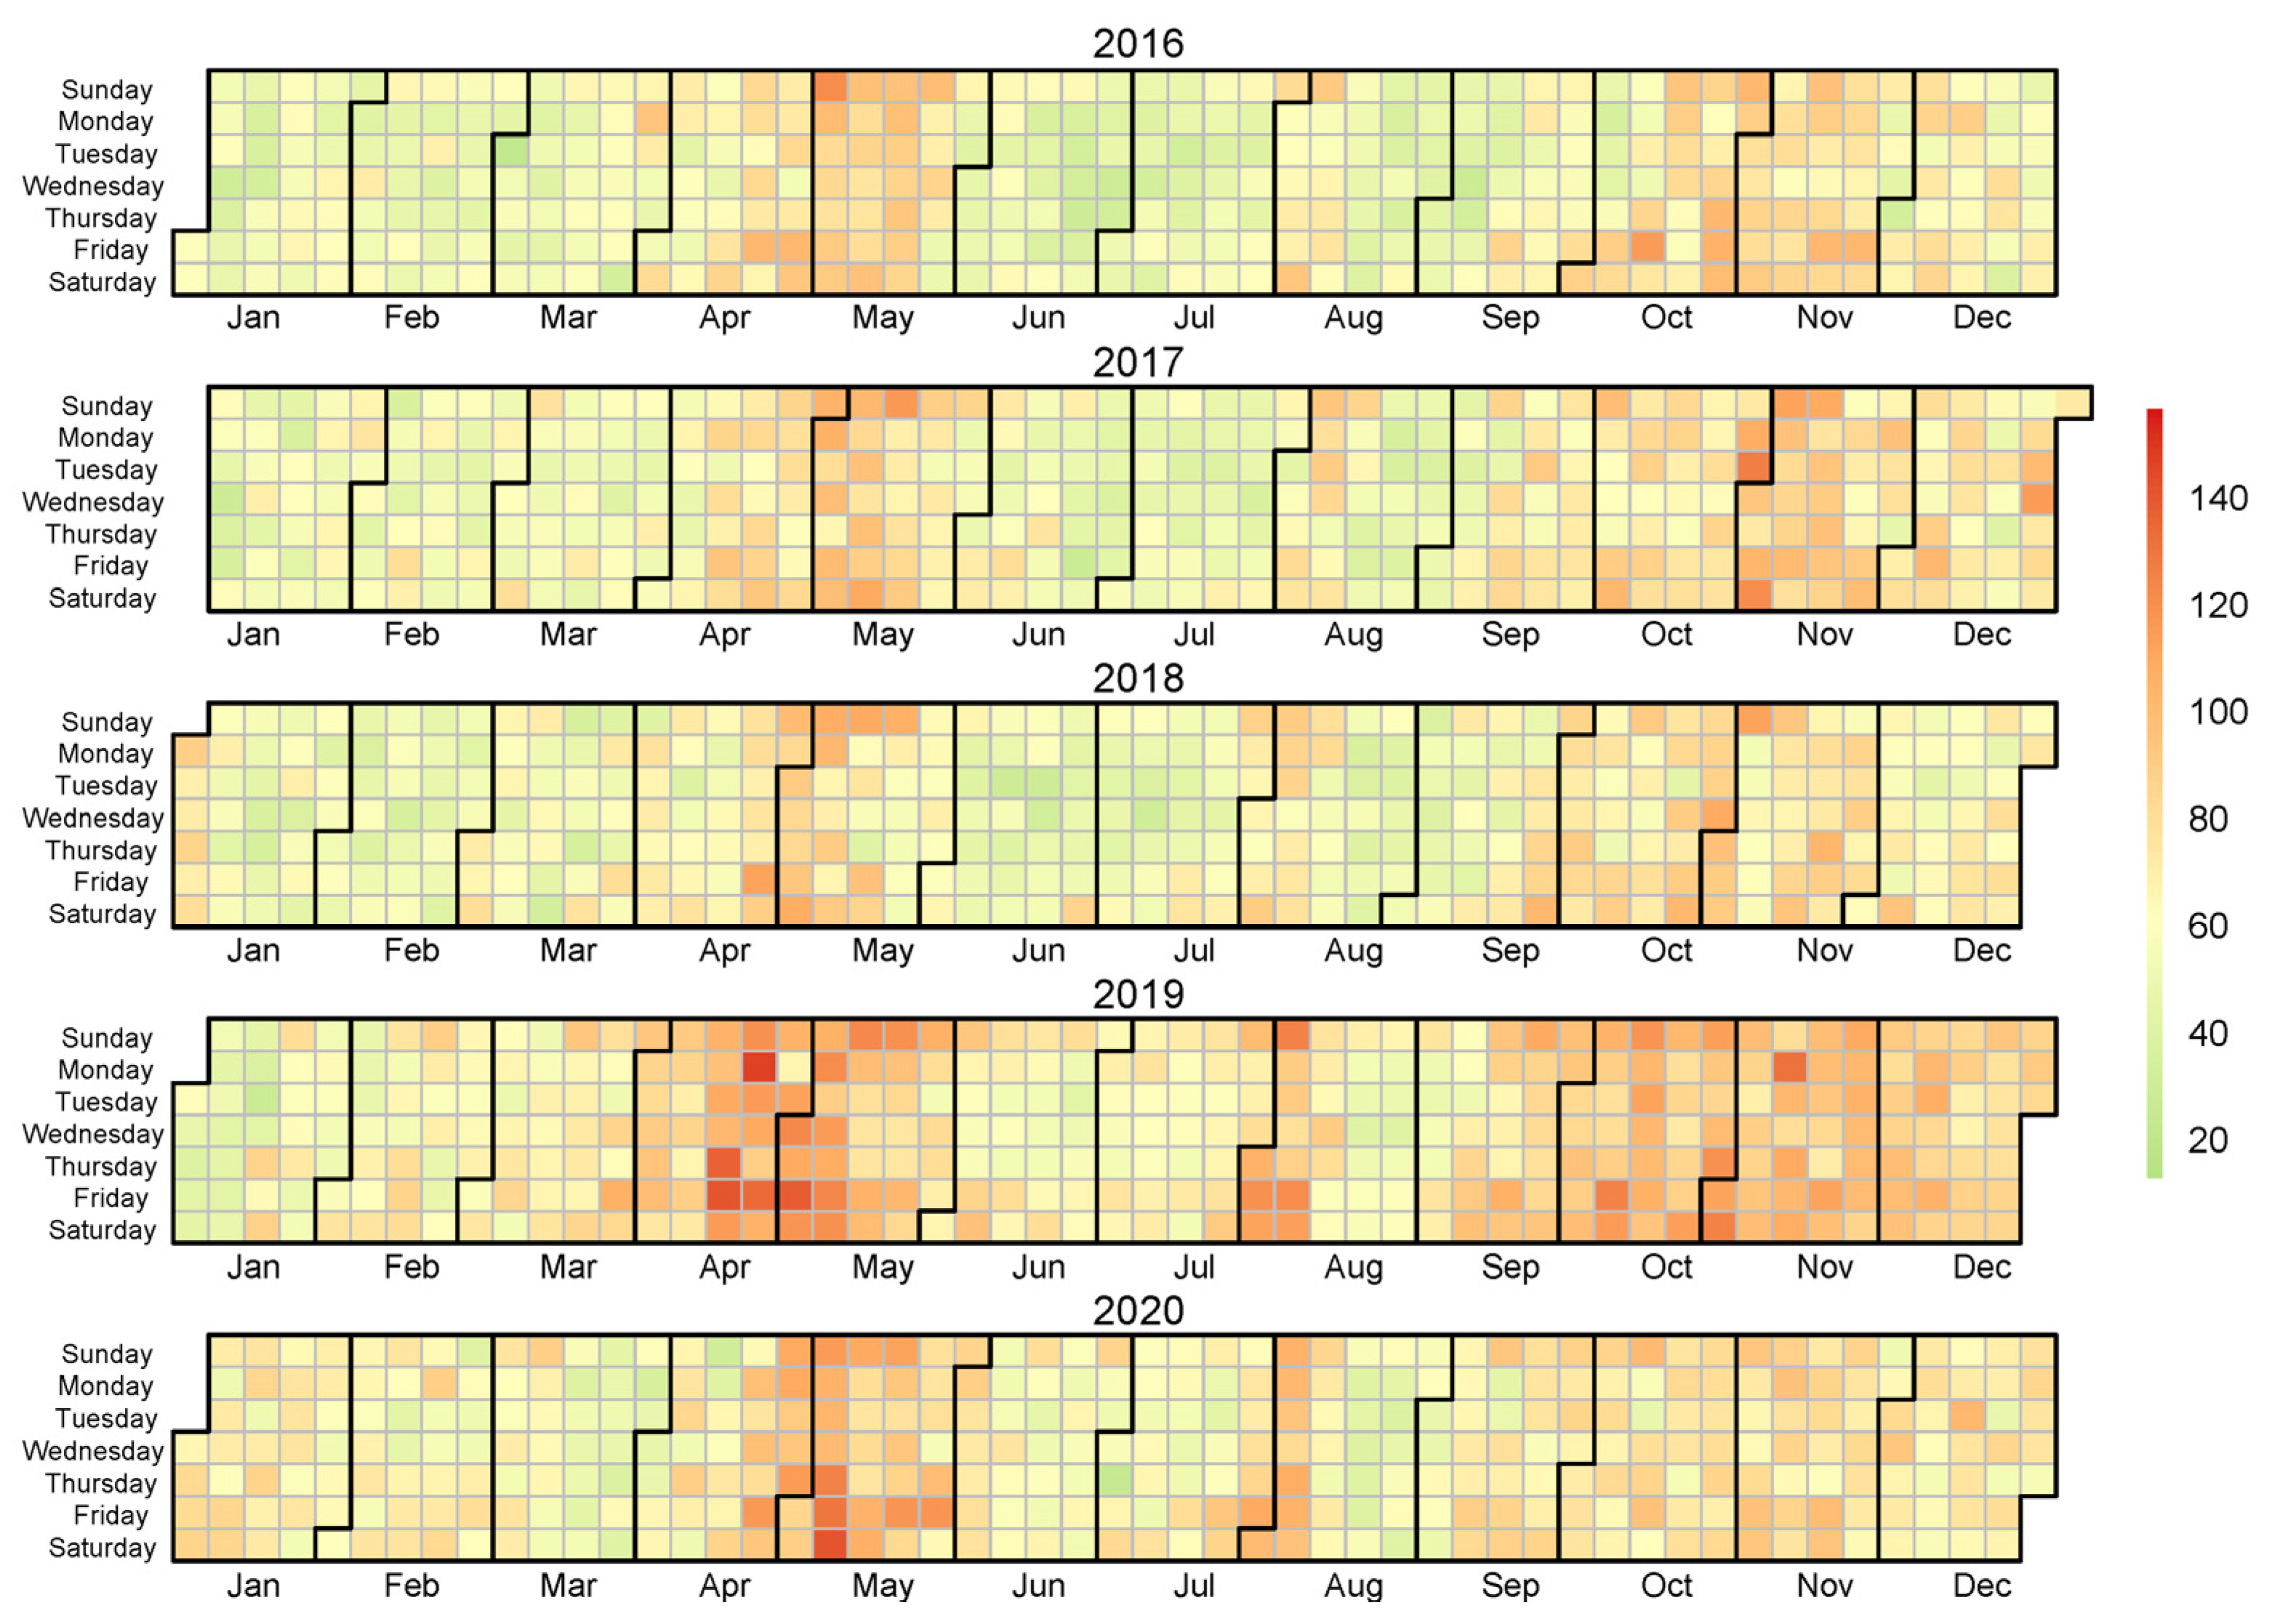
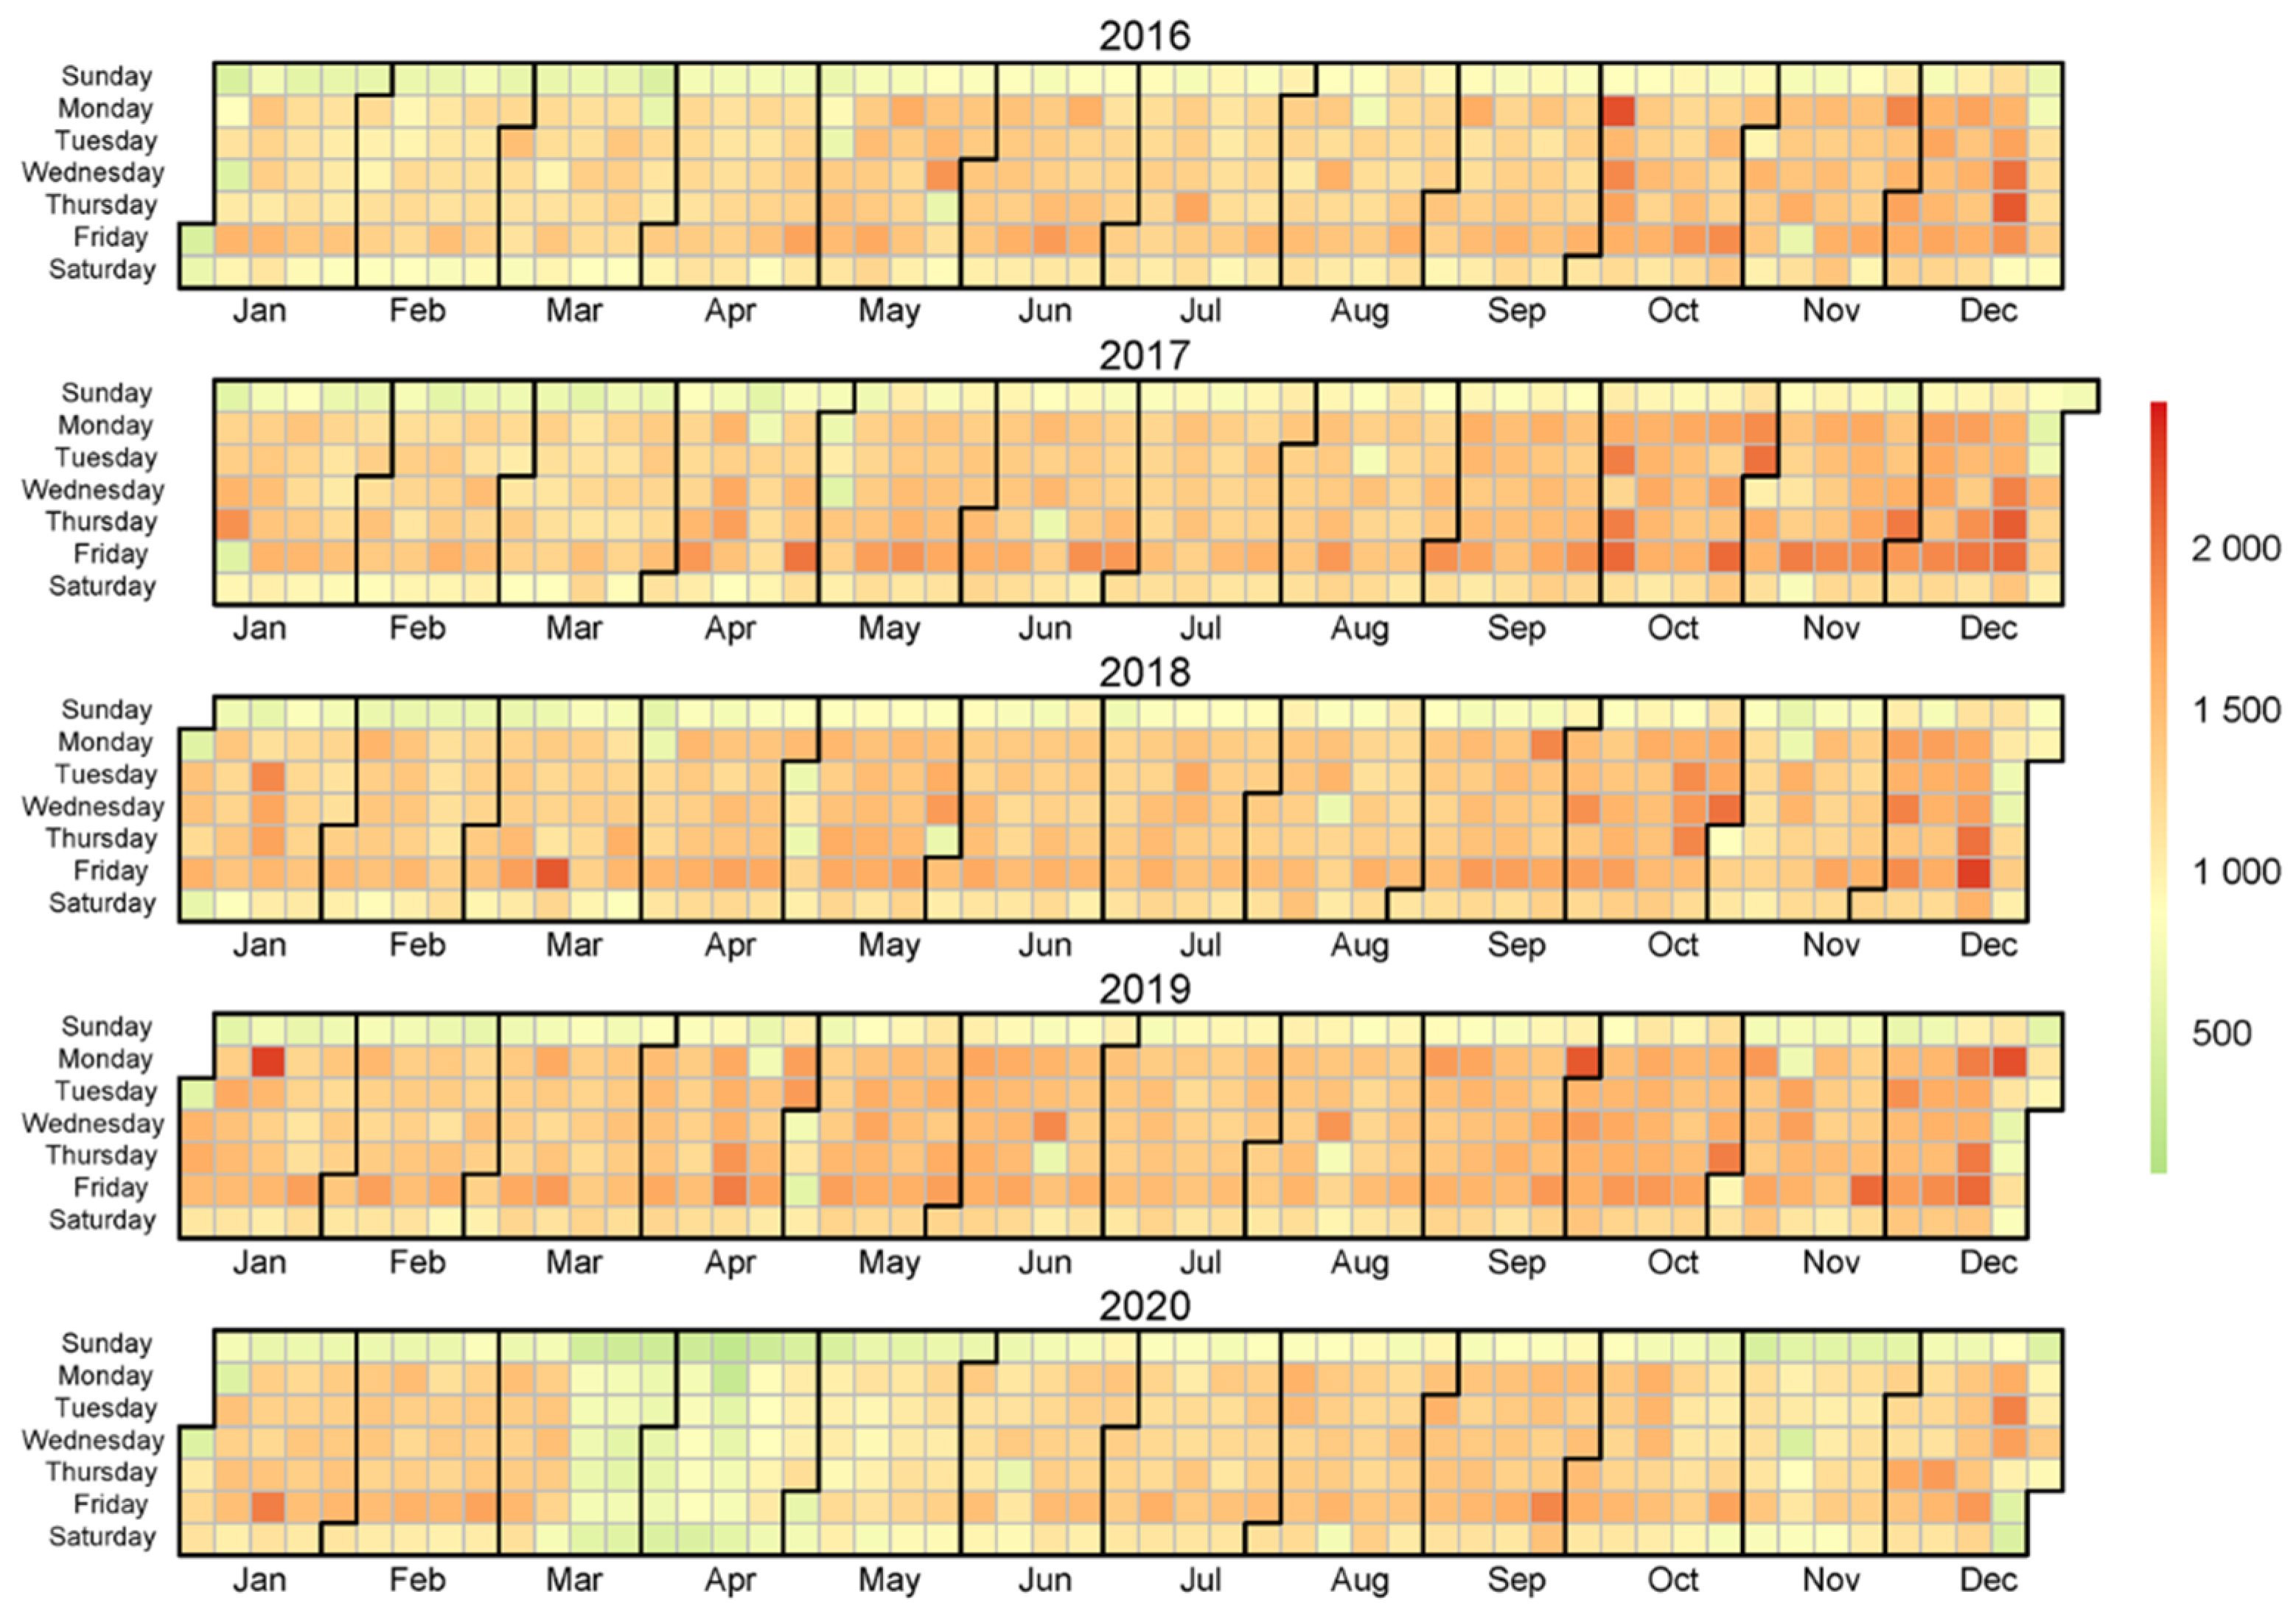
The results of the analyses are presented in the graphs. Figure 4 shows calendar heatmaps of road animal–vehicle crashes to show the numbers of crashes, by year, month, and day of the week. For comparison, Figure 5 presents an analogous graph for all road crashes in Poland.
3.2. Impact of Parameters of the Hunting District, Its Category, and Location
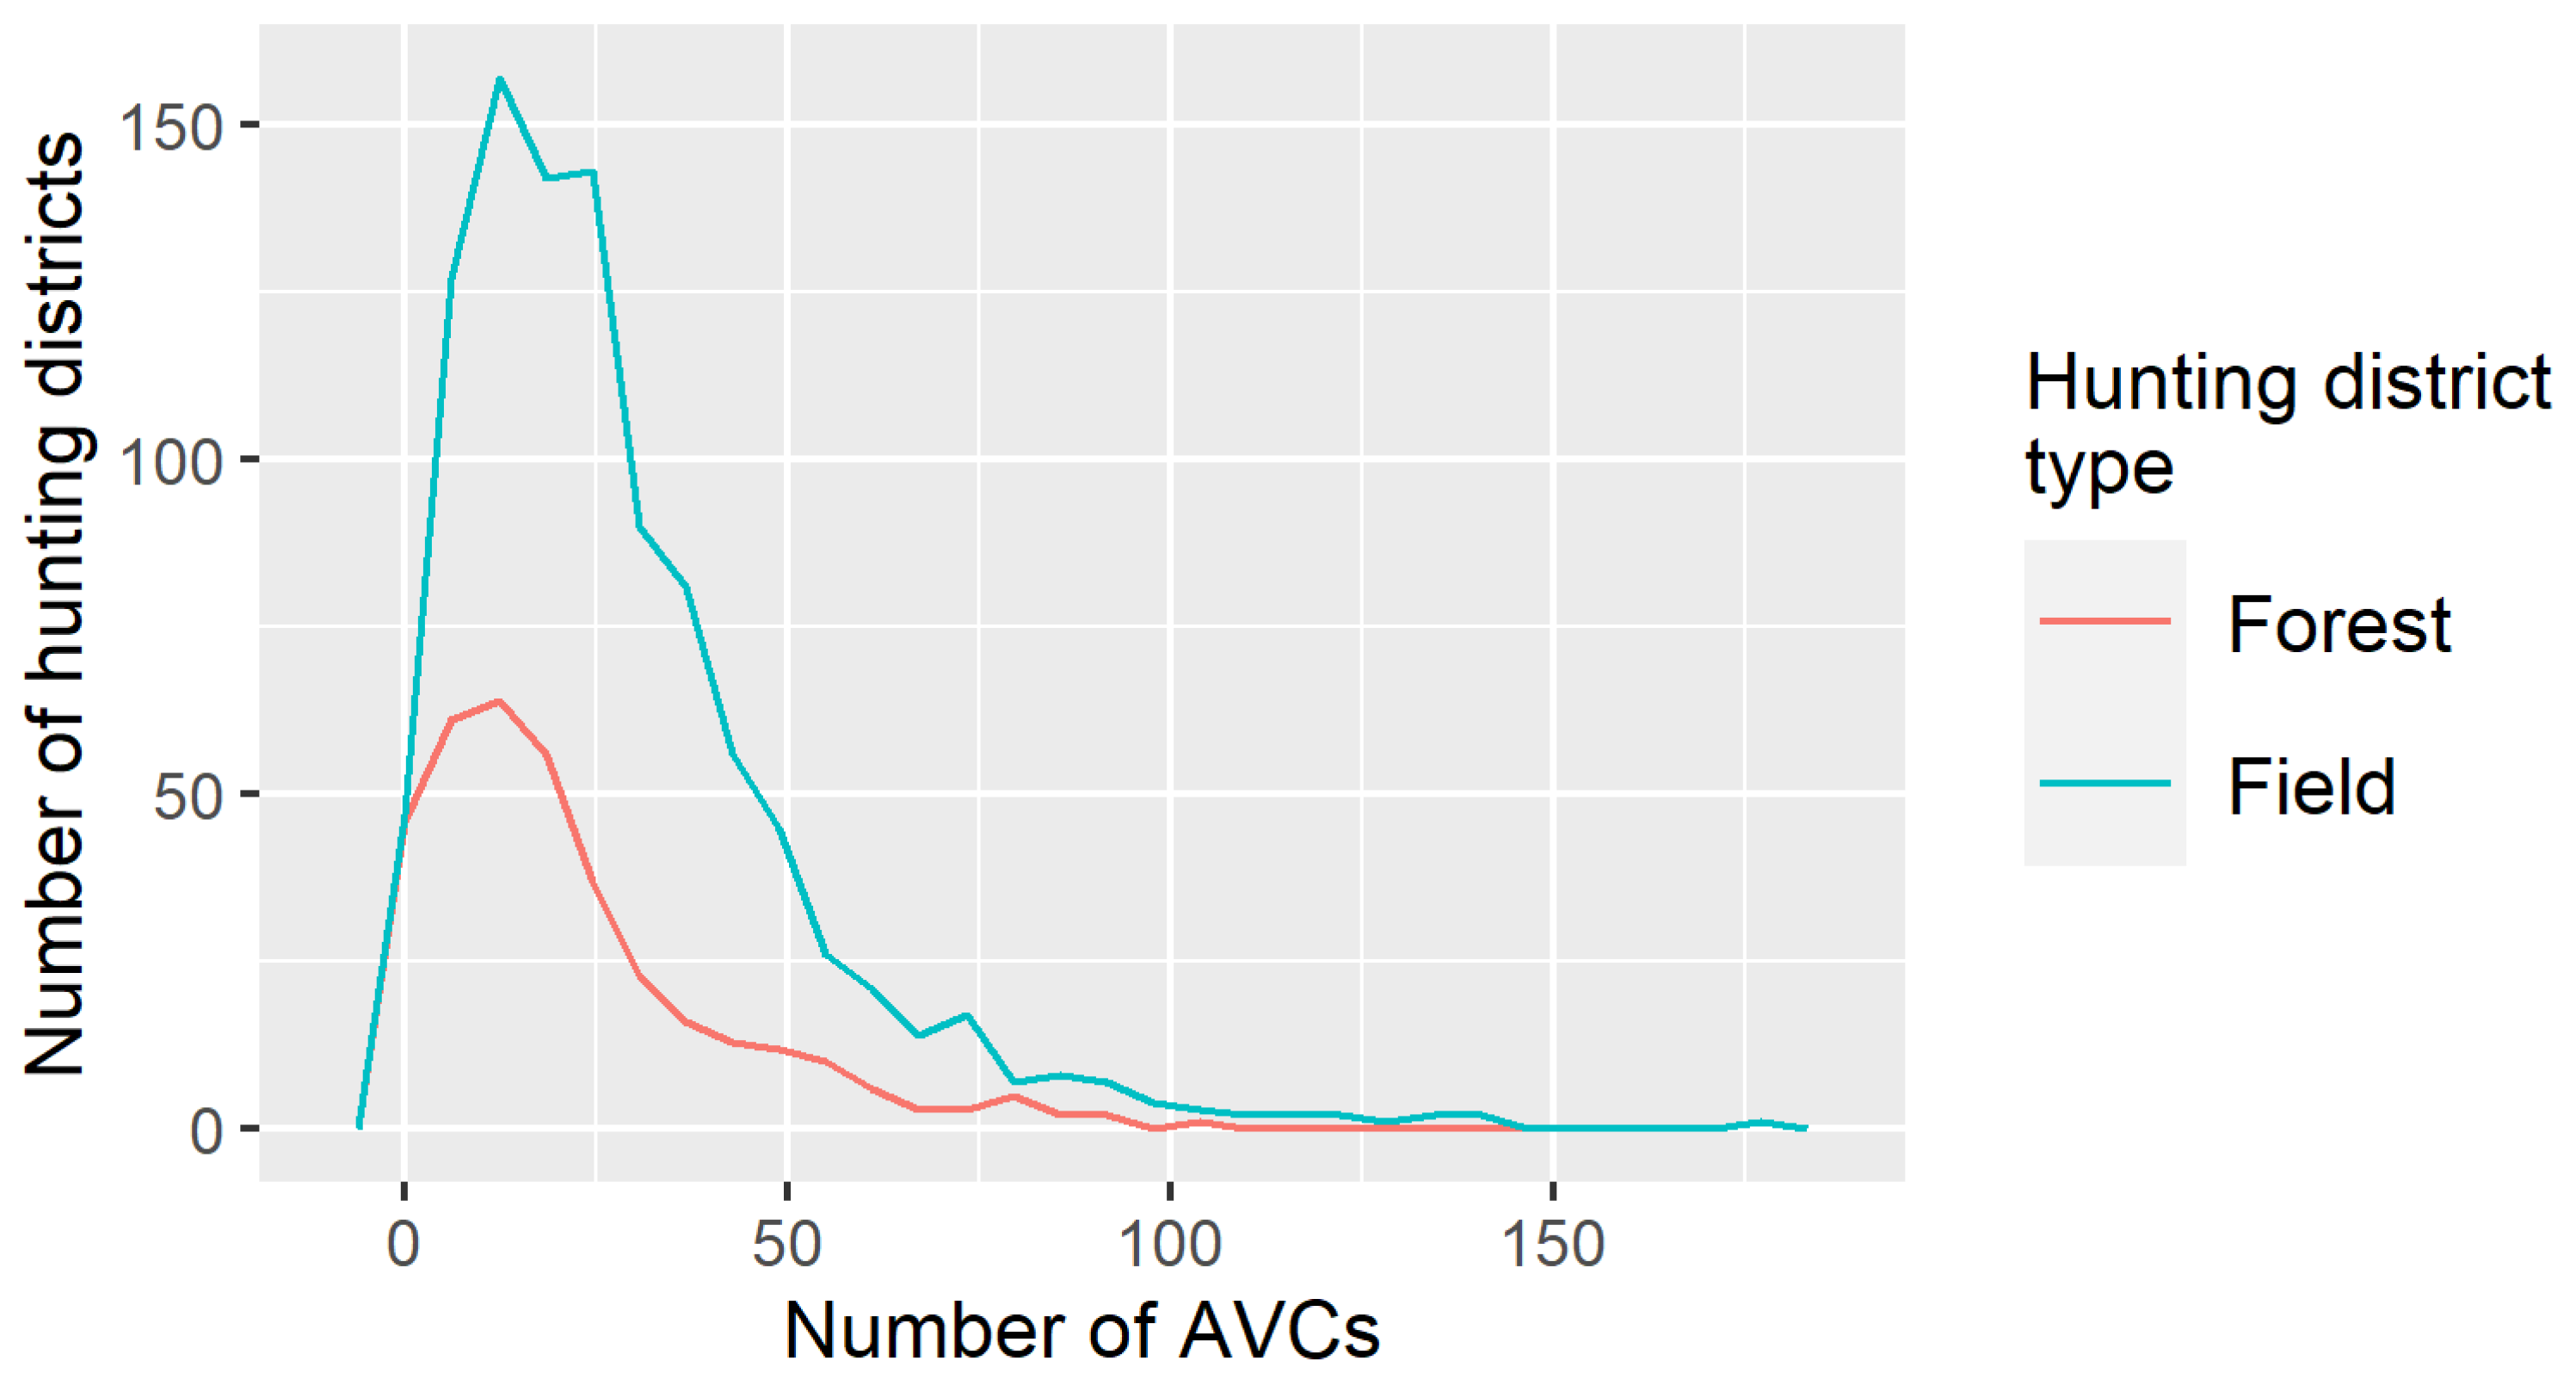
An analysis of the effect of the hunting district type (field or forest) on the number of crashes was also conducted. District type data were available for only four voivodeships and they are presented in Table 2.
Next, the normalities of the distributions of the numbers of crashes in the field and forest districts in the aforementioned voivodeships were evaluated. The Shapiro–Wilk test was used. In both cases, a p-value < 2 × 10⁻¹⁶ indicates that the population is likely not normally distributed. Similar conclusions are obtained using the Anderson–Darling, Cramér-von Mises, Lilliefors, chi-square (Pearson’s), and Shapiro–Francia tests. The verification of the hypothesis was performed using the nonparametric Wilcoxon–Mann–Whitney test. The results of the test for the alternative hypothesis, that the number of crashes is higher in forest districts, provides a p-value = 0. Because of the large sample size (1007 field distances and 361 forest districts), it is also possible to use the t-test for this analysis. The obtained result is analogous. The distributions of the numbers of crashes in the districts of each type are shown in Figure 9.
The category of the hunting district is determined on the basis of regulations [105]. The determination of the categories of hunting districts takes into account the abundance of game, as well as the environmental factors related to the forest cover, the type of forest, and the size of the district. Negative factors, such as the size of the road network, the continuity of the district, and the presence of people, are also taken into account. Data on the category of the hunting district were available for only three voivodeships, and they are presented in Table 3.
Pairwise comparisons of the average numbers of crashes for each district type were performed using a pairwise t-test function. The results of calculations are included in Table 4.
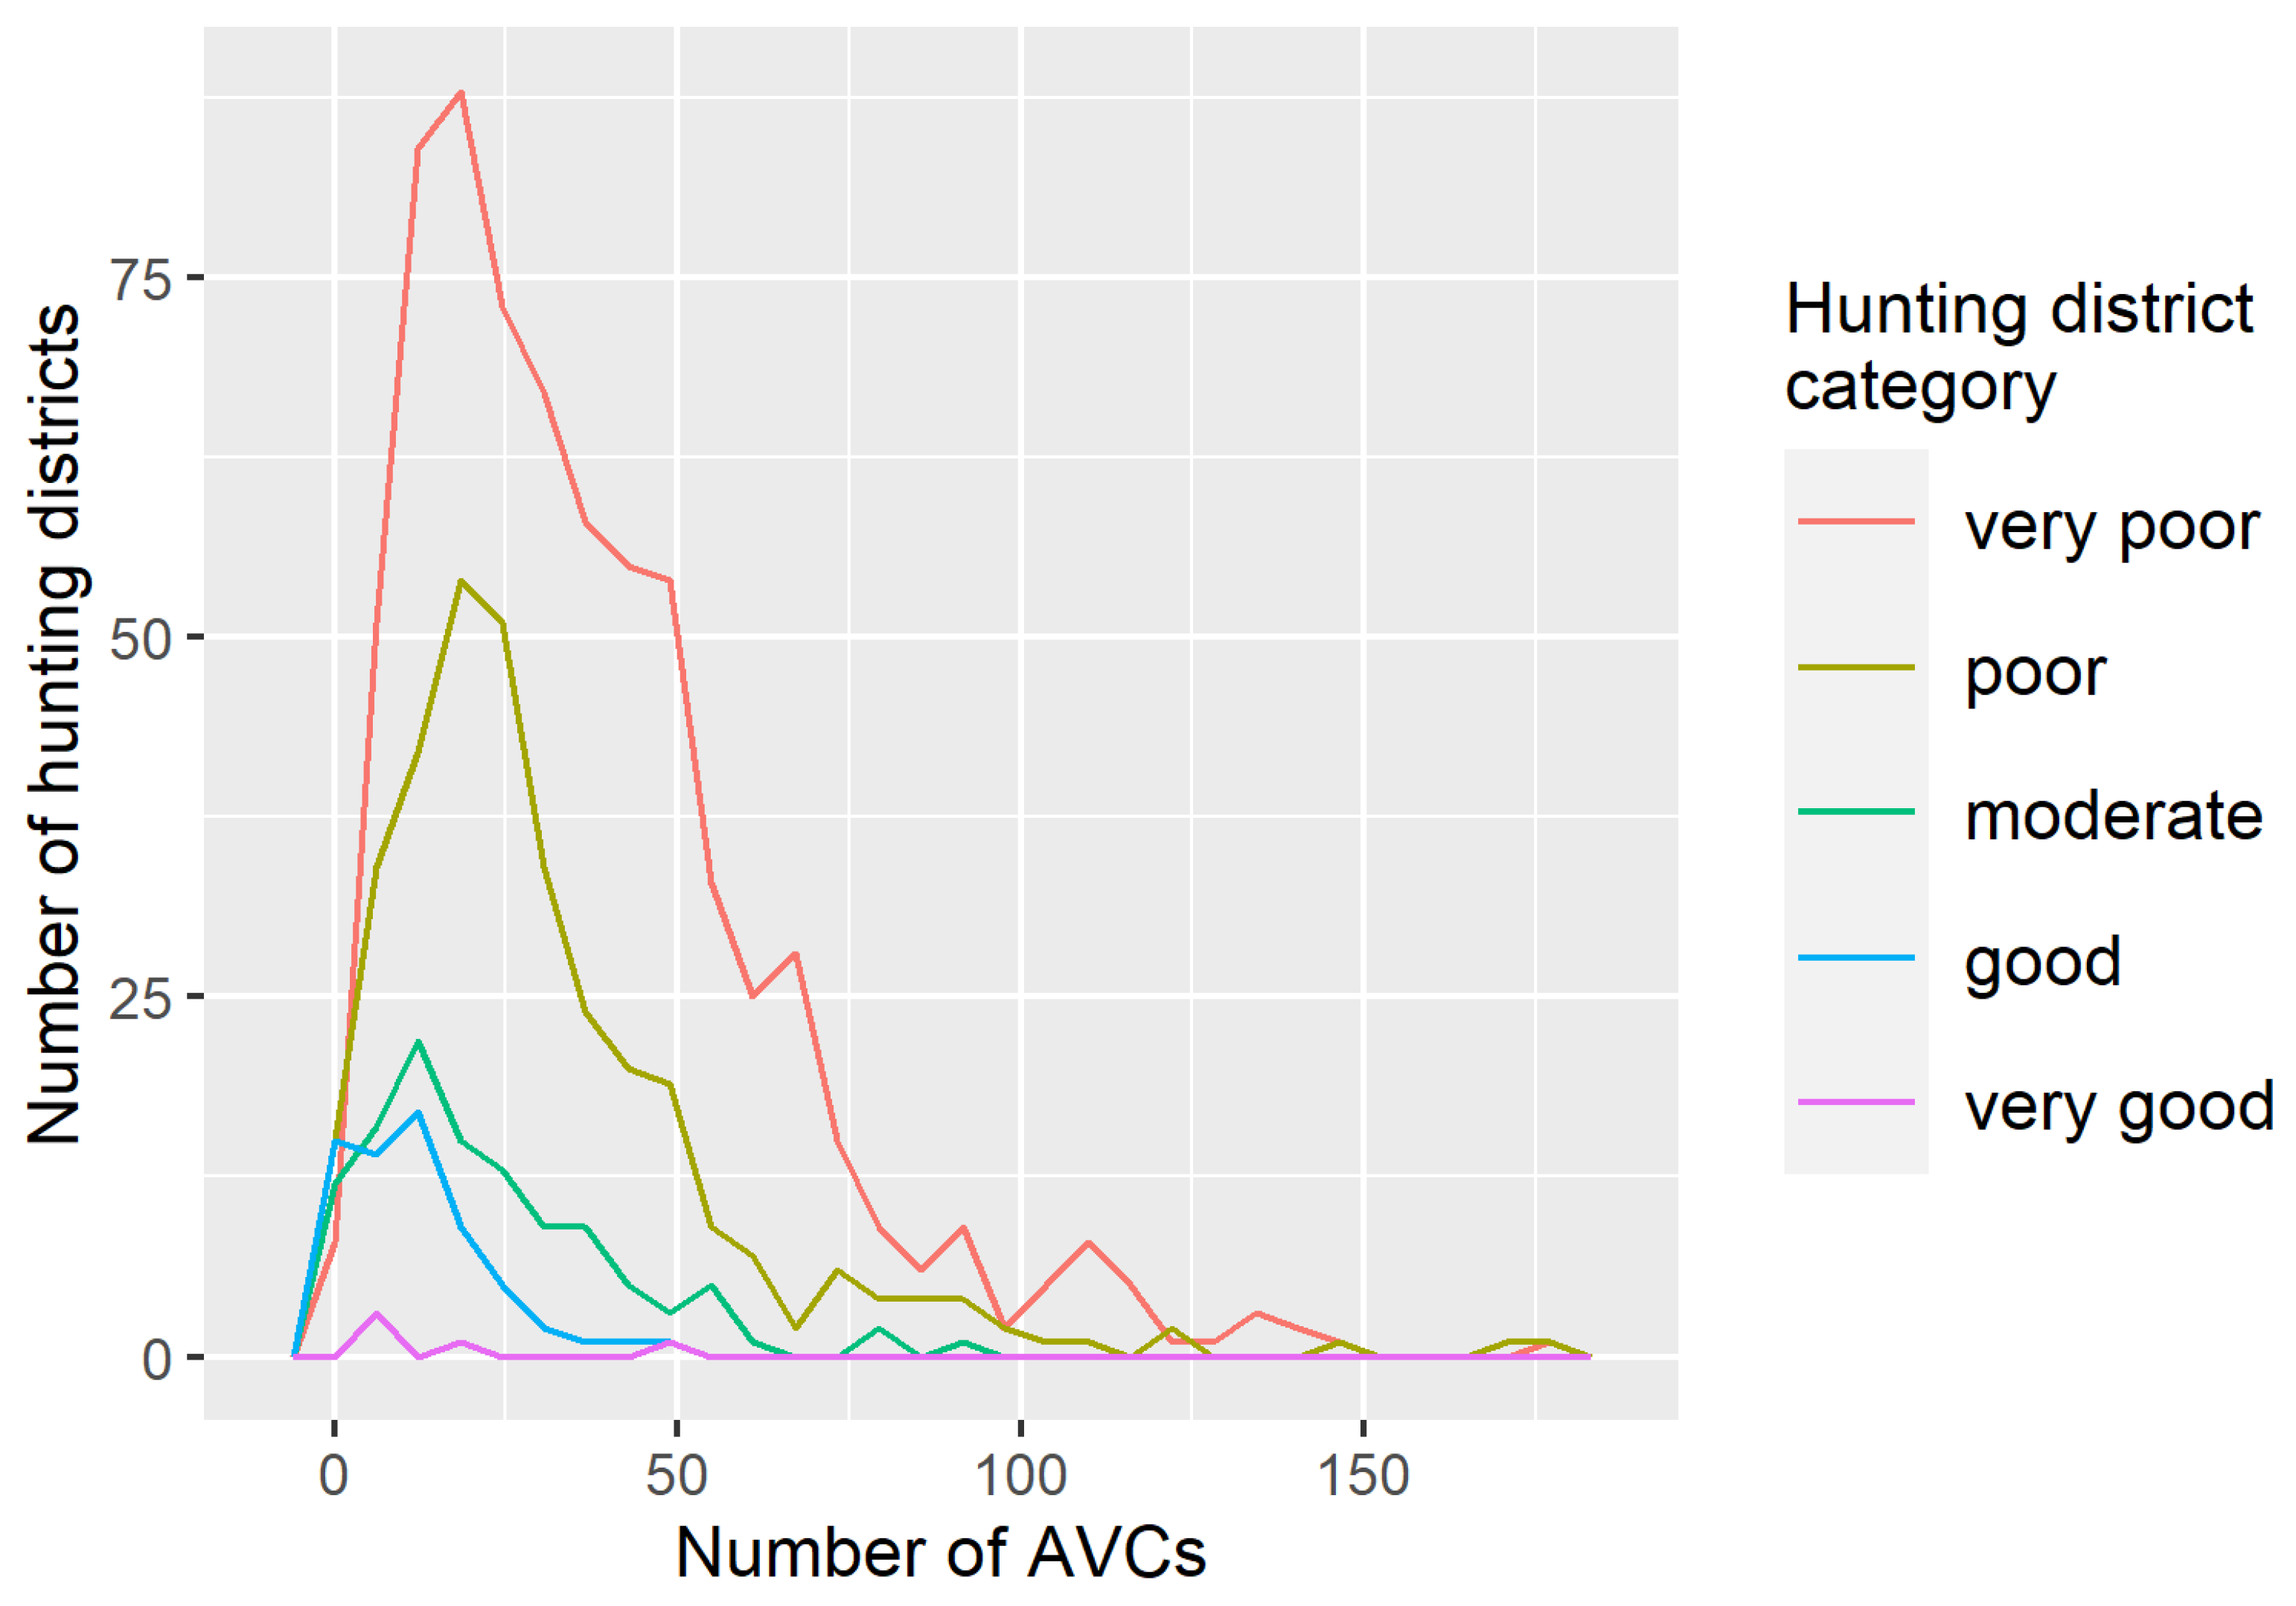
The results of the comparisons indicate that there is a difference in the average numbers of crashes between districts of different categories, except for very good districts (there are only five in the sample). The distributions of the numbers of crashes in the districts of each category are shown in Figure 10.
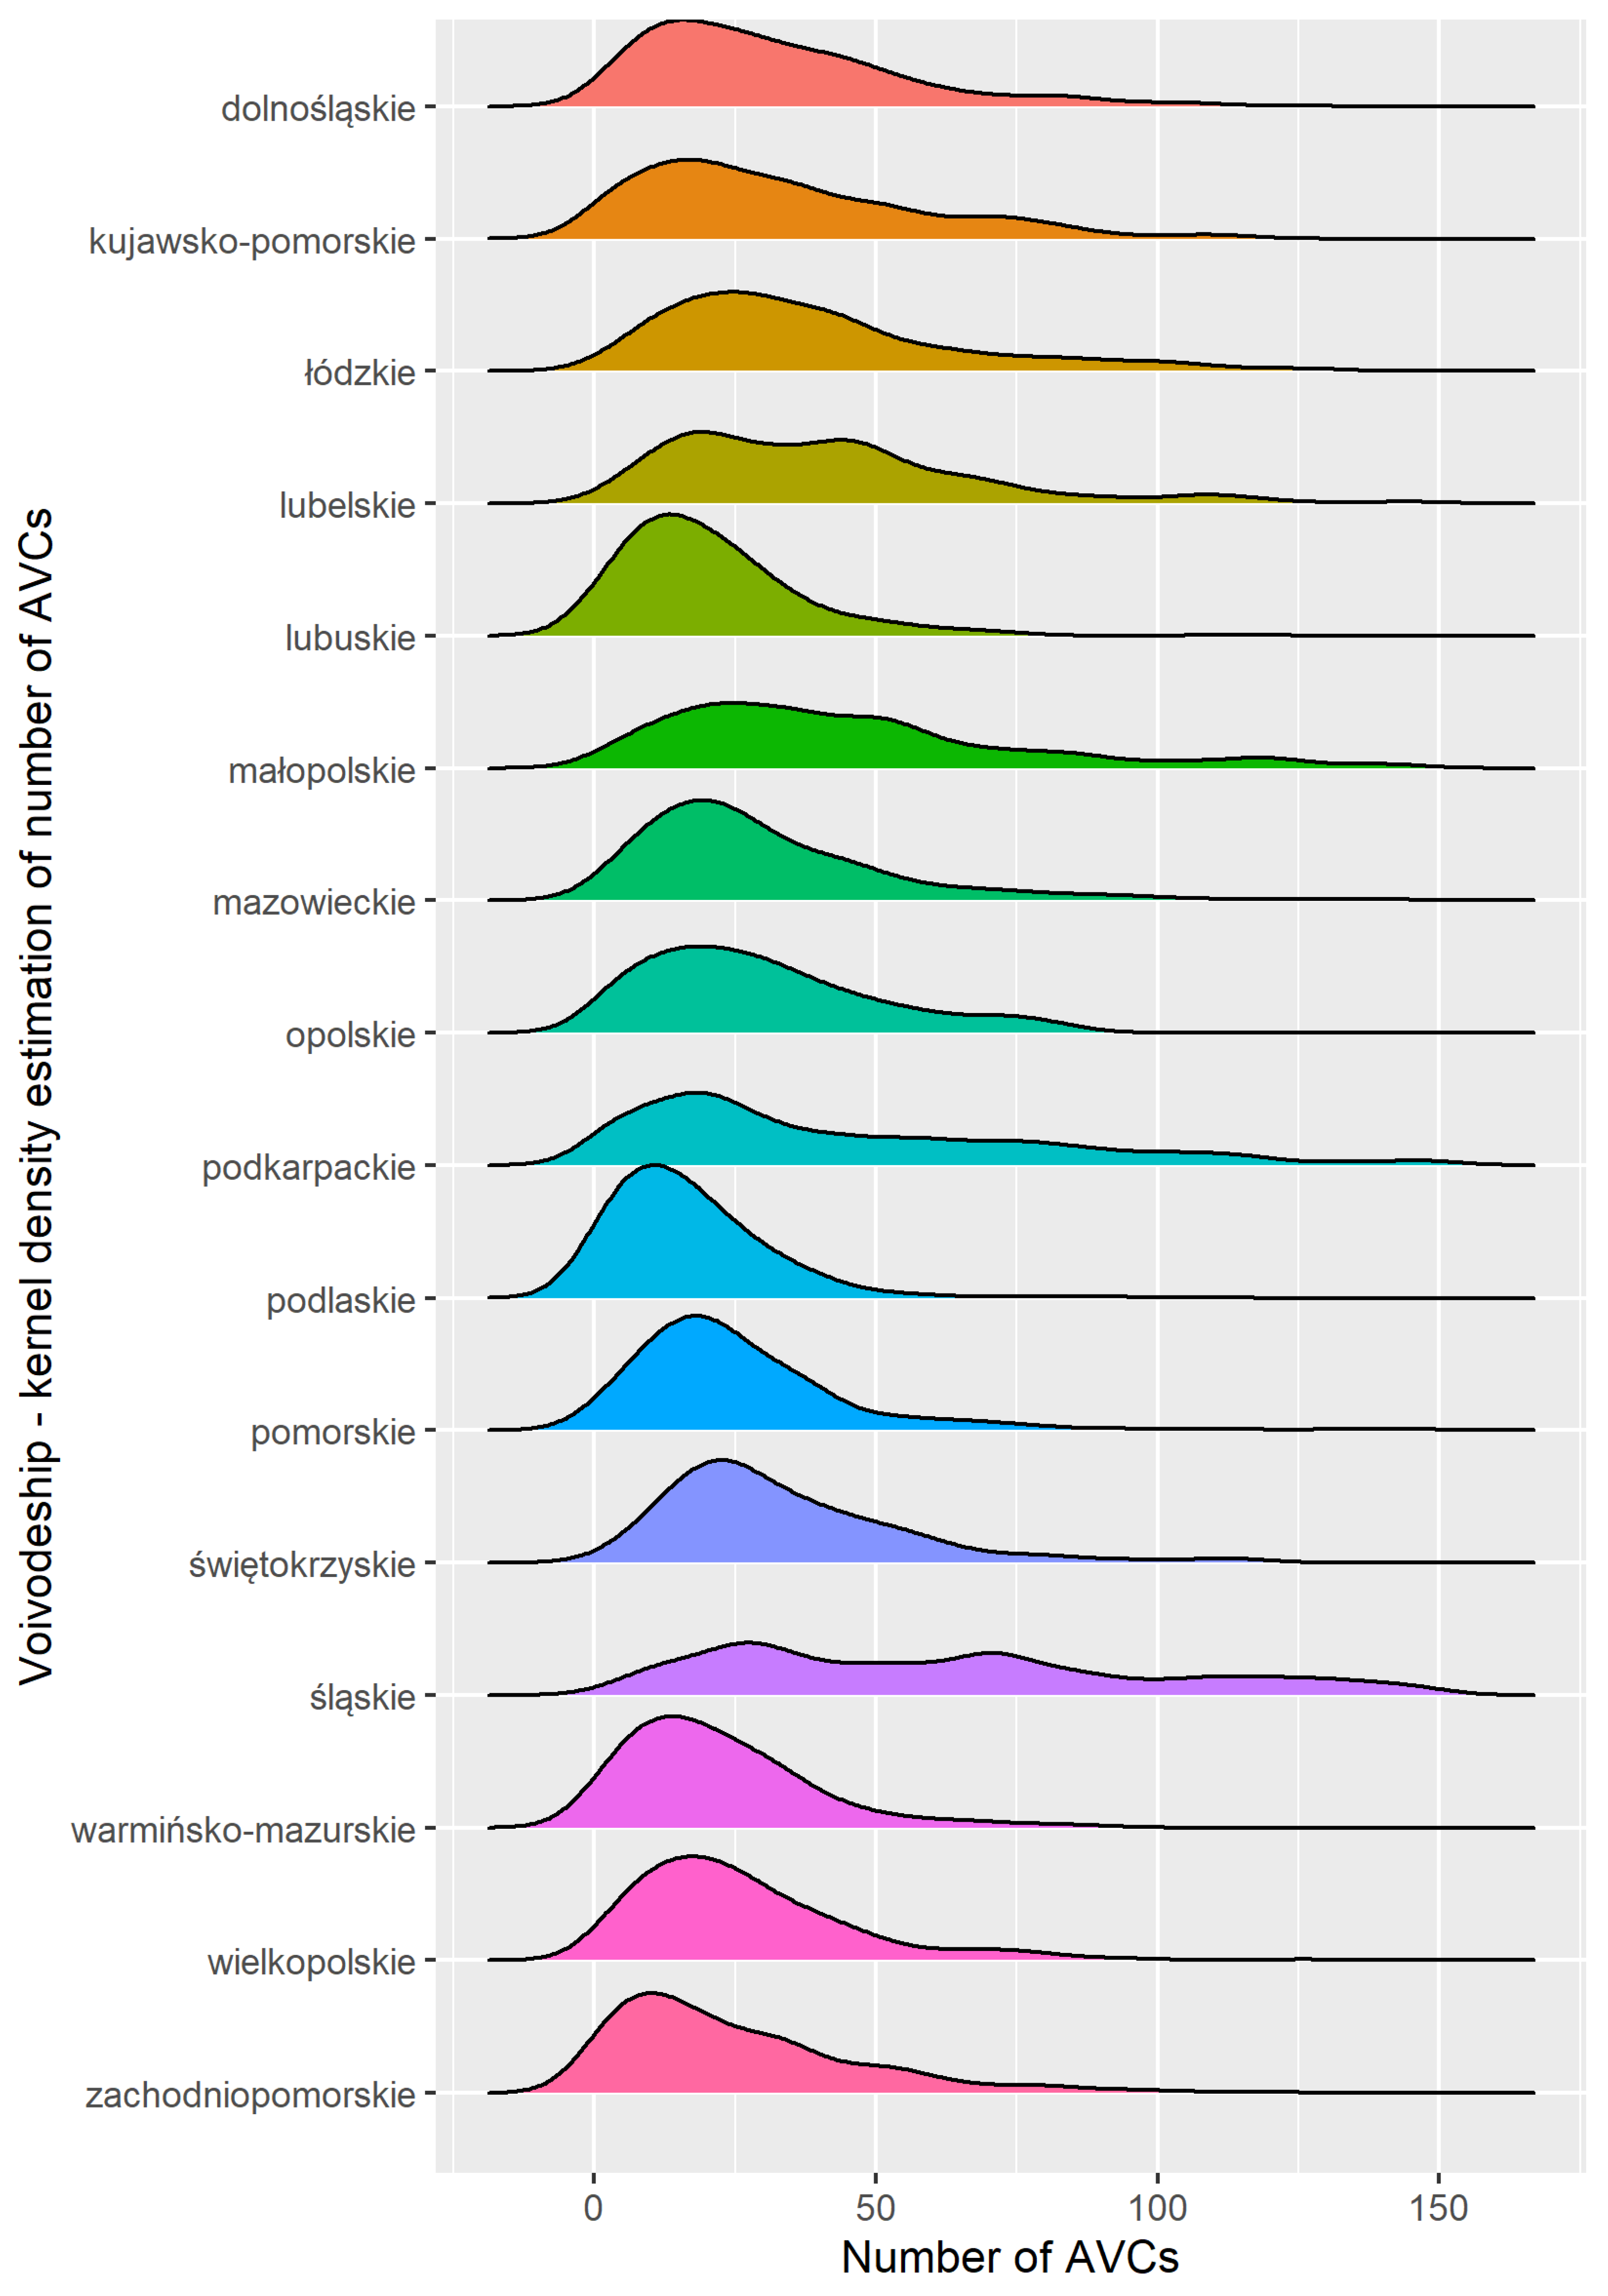
However, the results of the analysis are surprising. The worse the category that the district is from, the higher its average number of road crashes between 2016 and 2020. The number of road crashes varies similarly between voivodeships. The maximum number of crashes per hunting district, from 2016 to 2020, is 527. We filtered out the outliers, i.e., more than 150 occasional crashes, and the distributions of the numbers of crashes per hunting district in each voivodeship are presented in Figure 11.
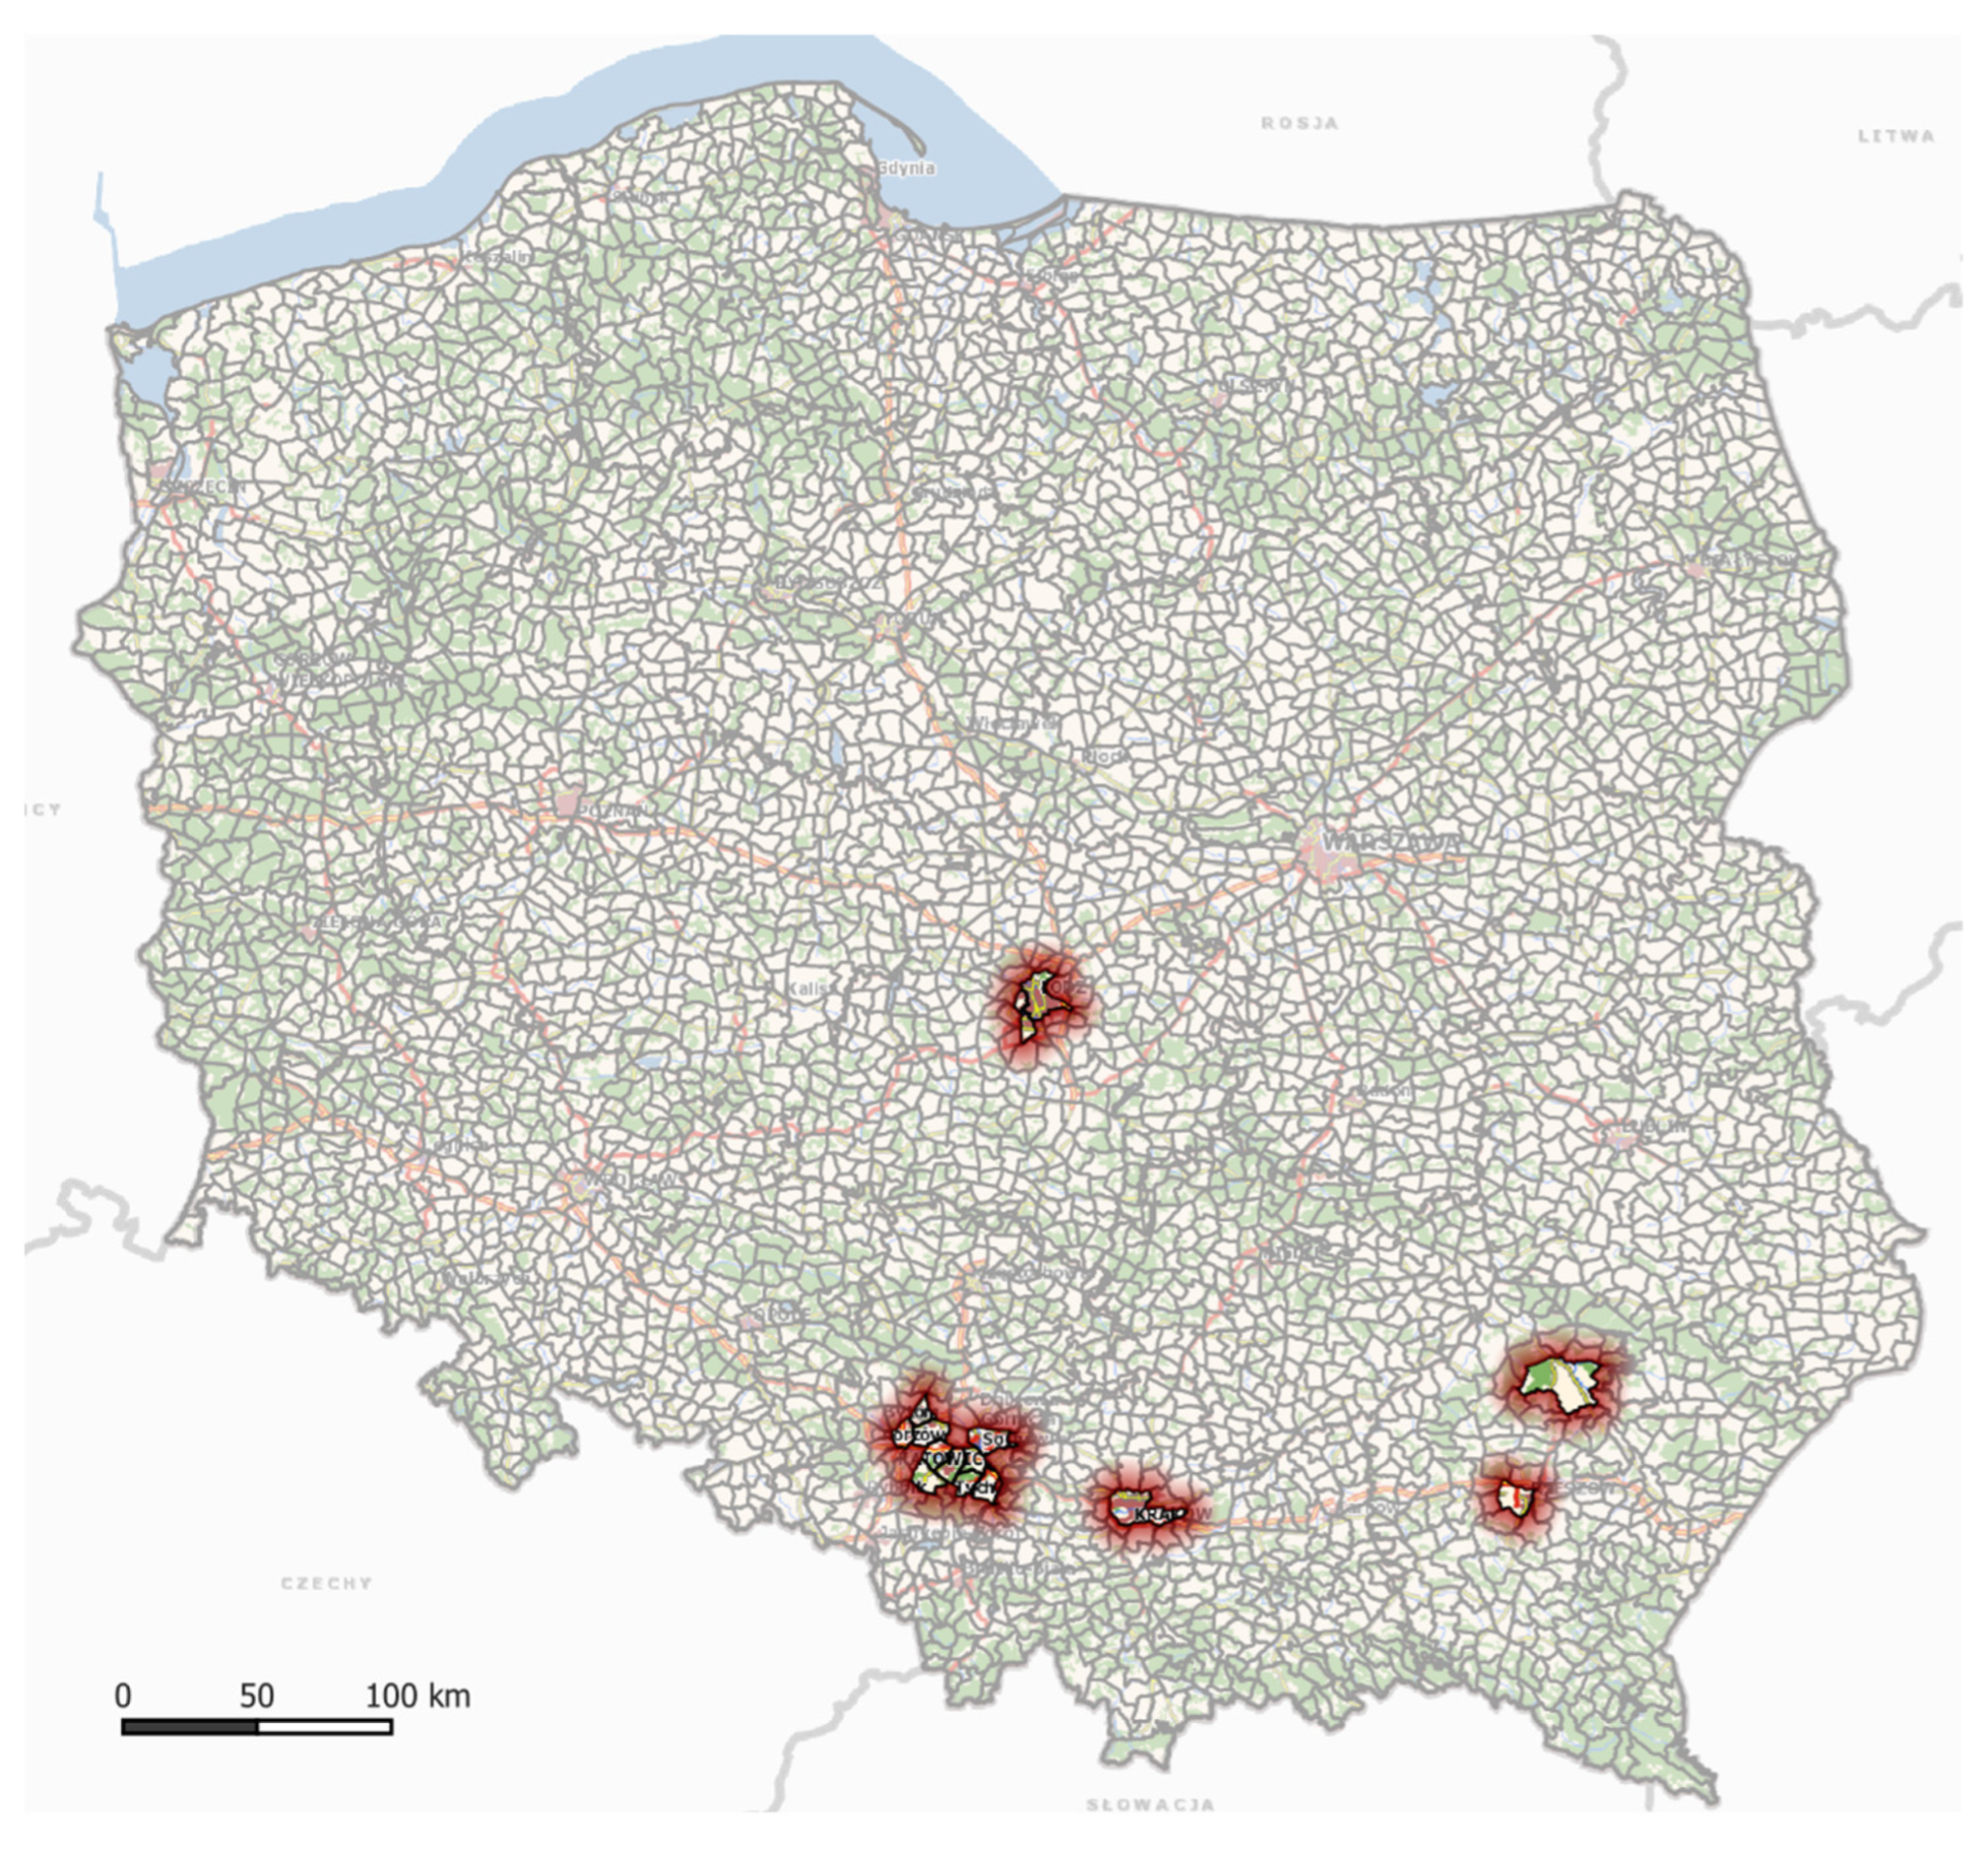
On the basis of Figure 11, it can be concluded that the voivodeships of Śląskie, Podkarpackie, and Małopolskie are characterised by hunting districts with large numbers of crashes. The 15 hunting districts in Poland with the highest numbers of crashes are presented in Figure 12.
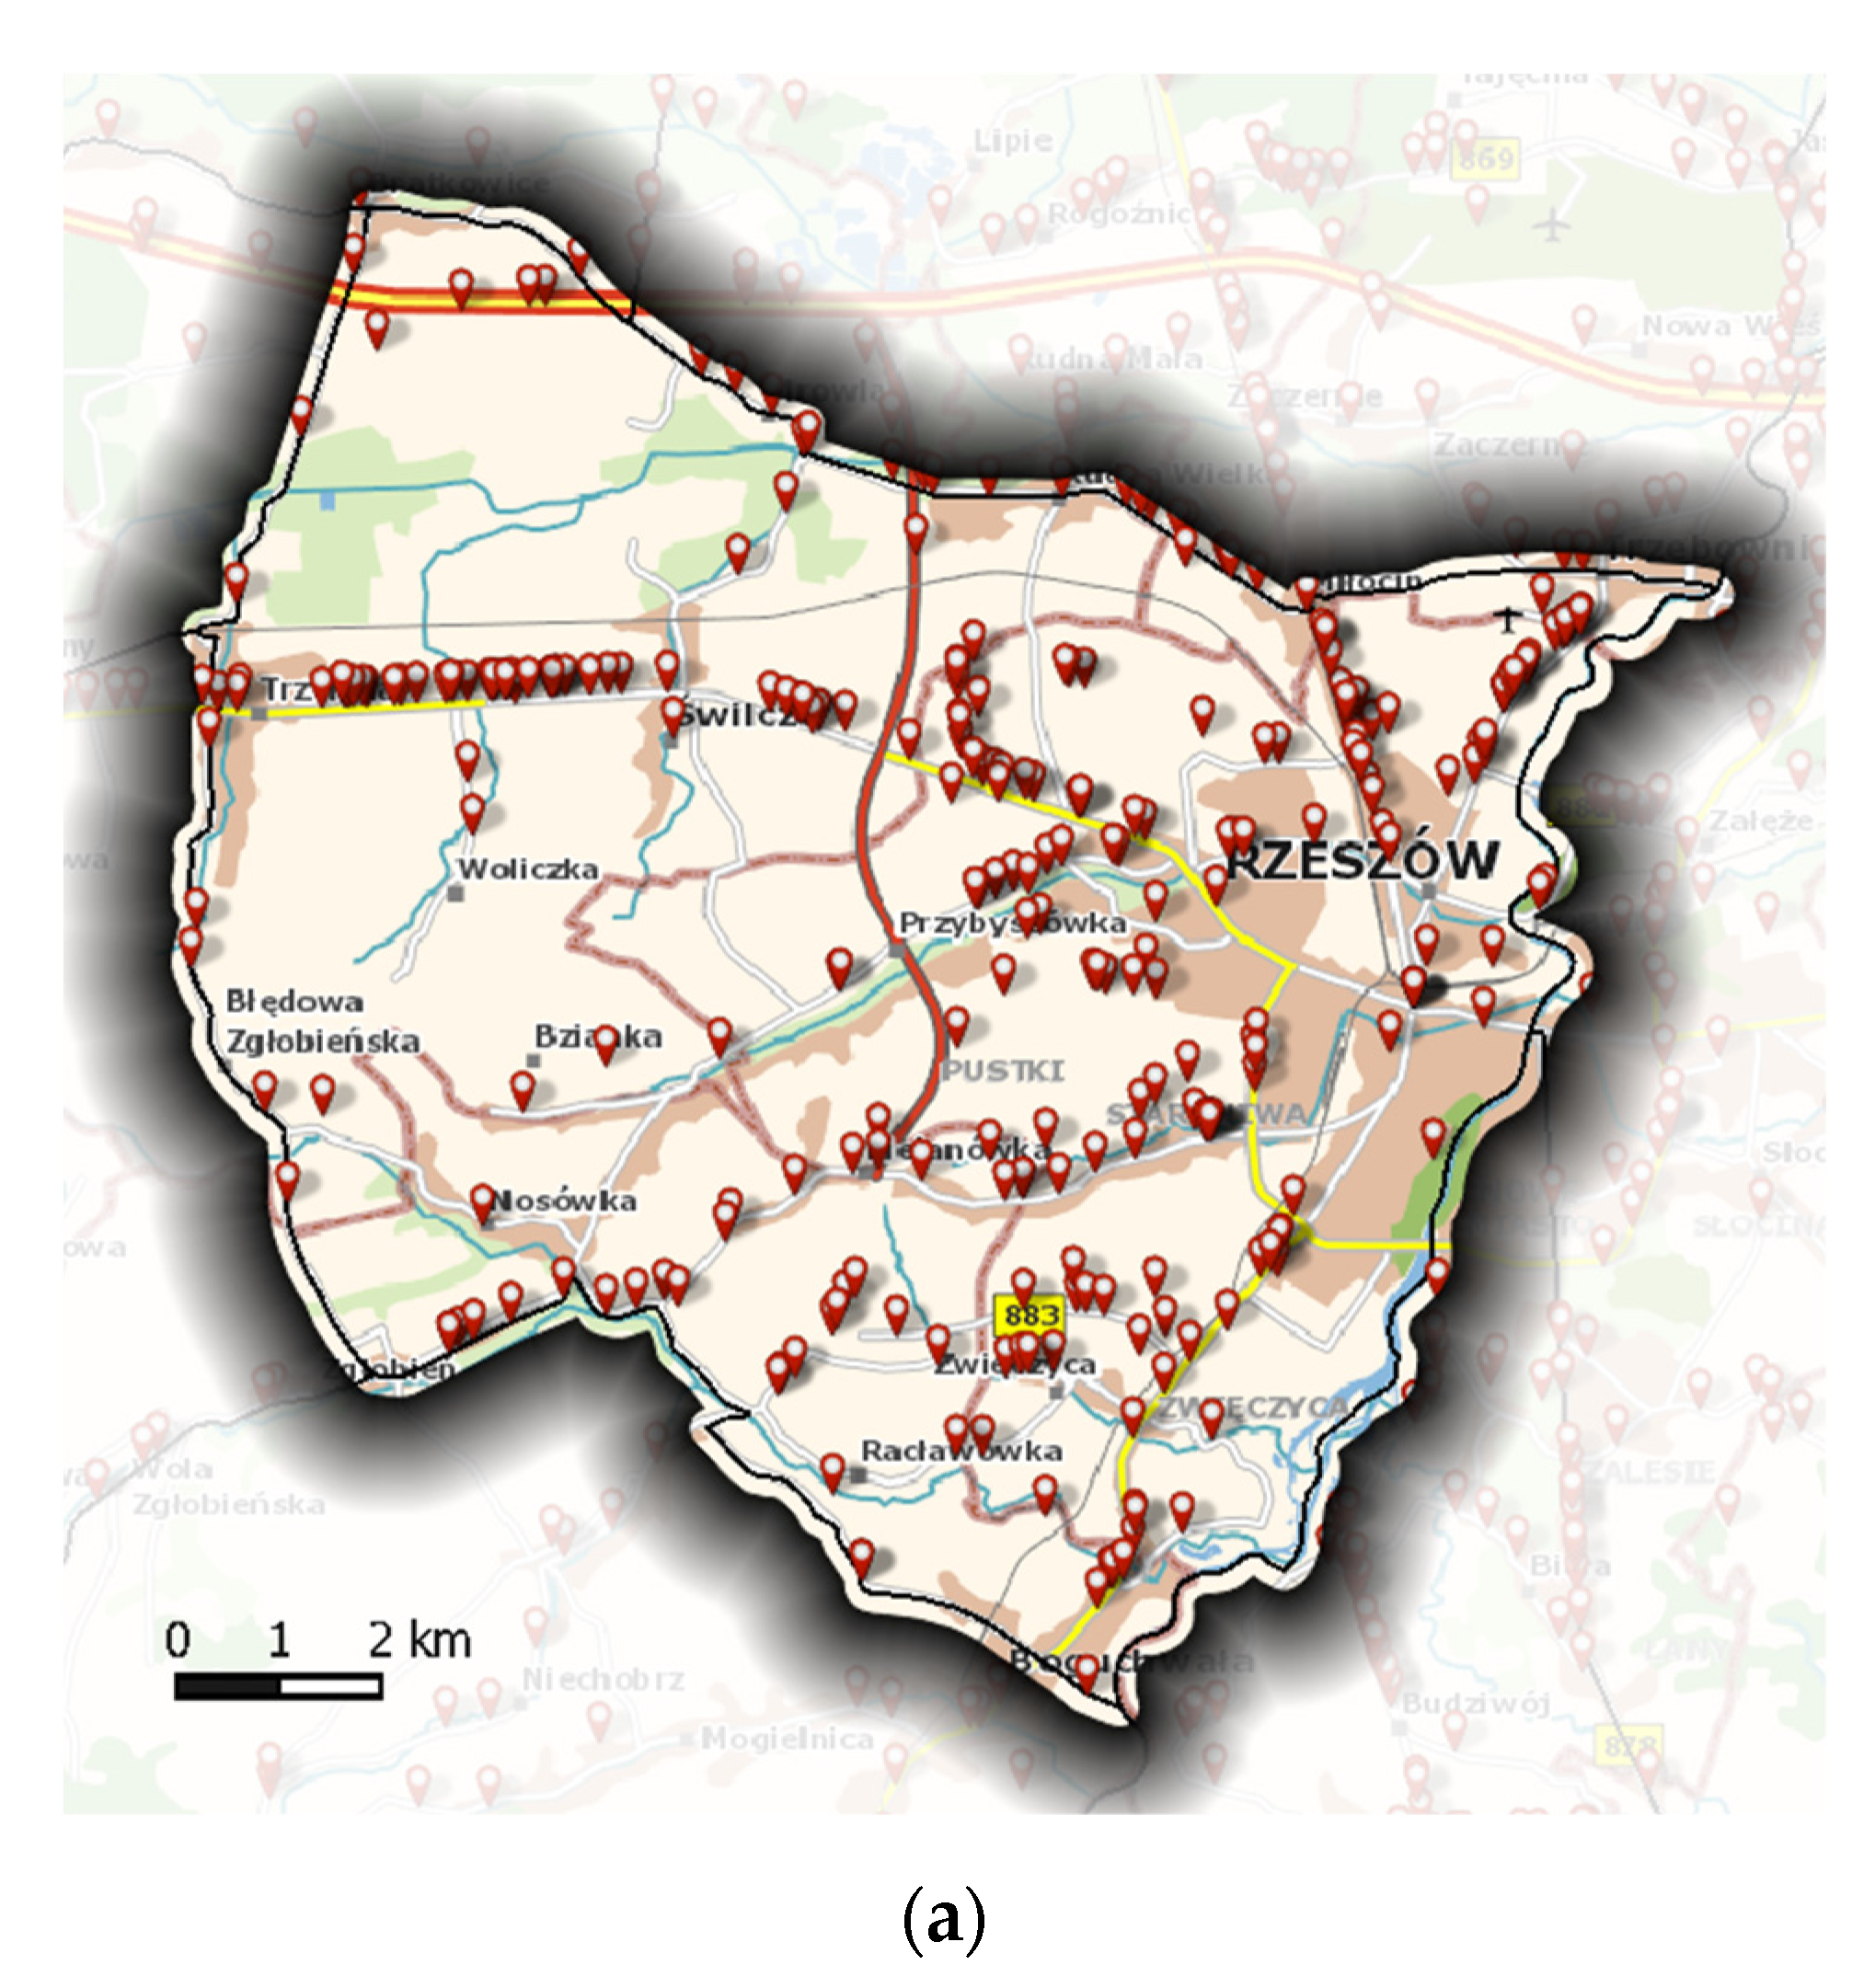
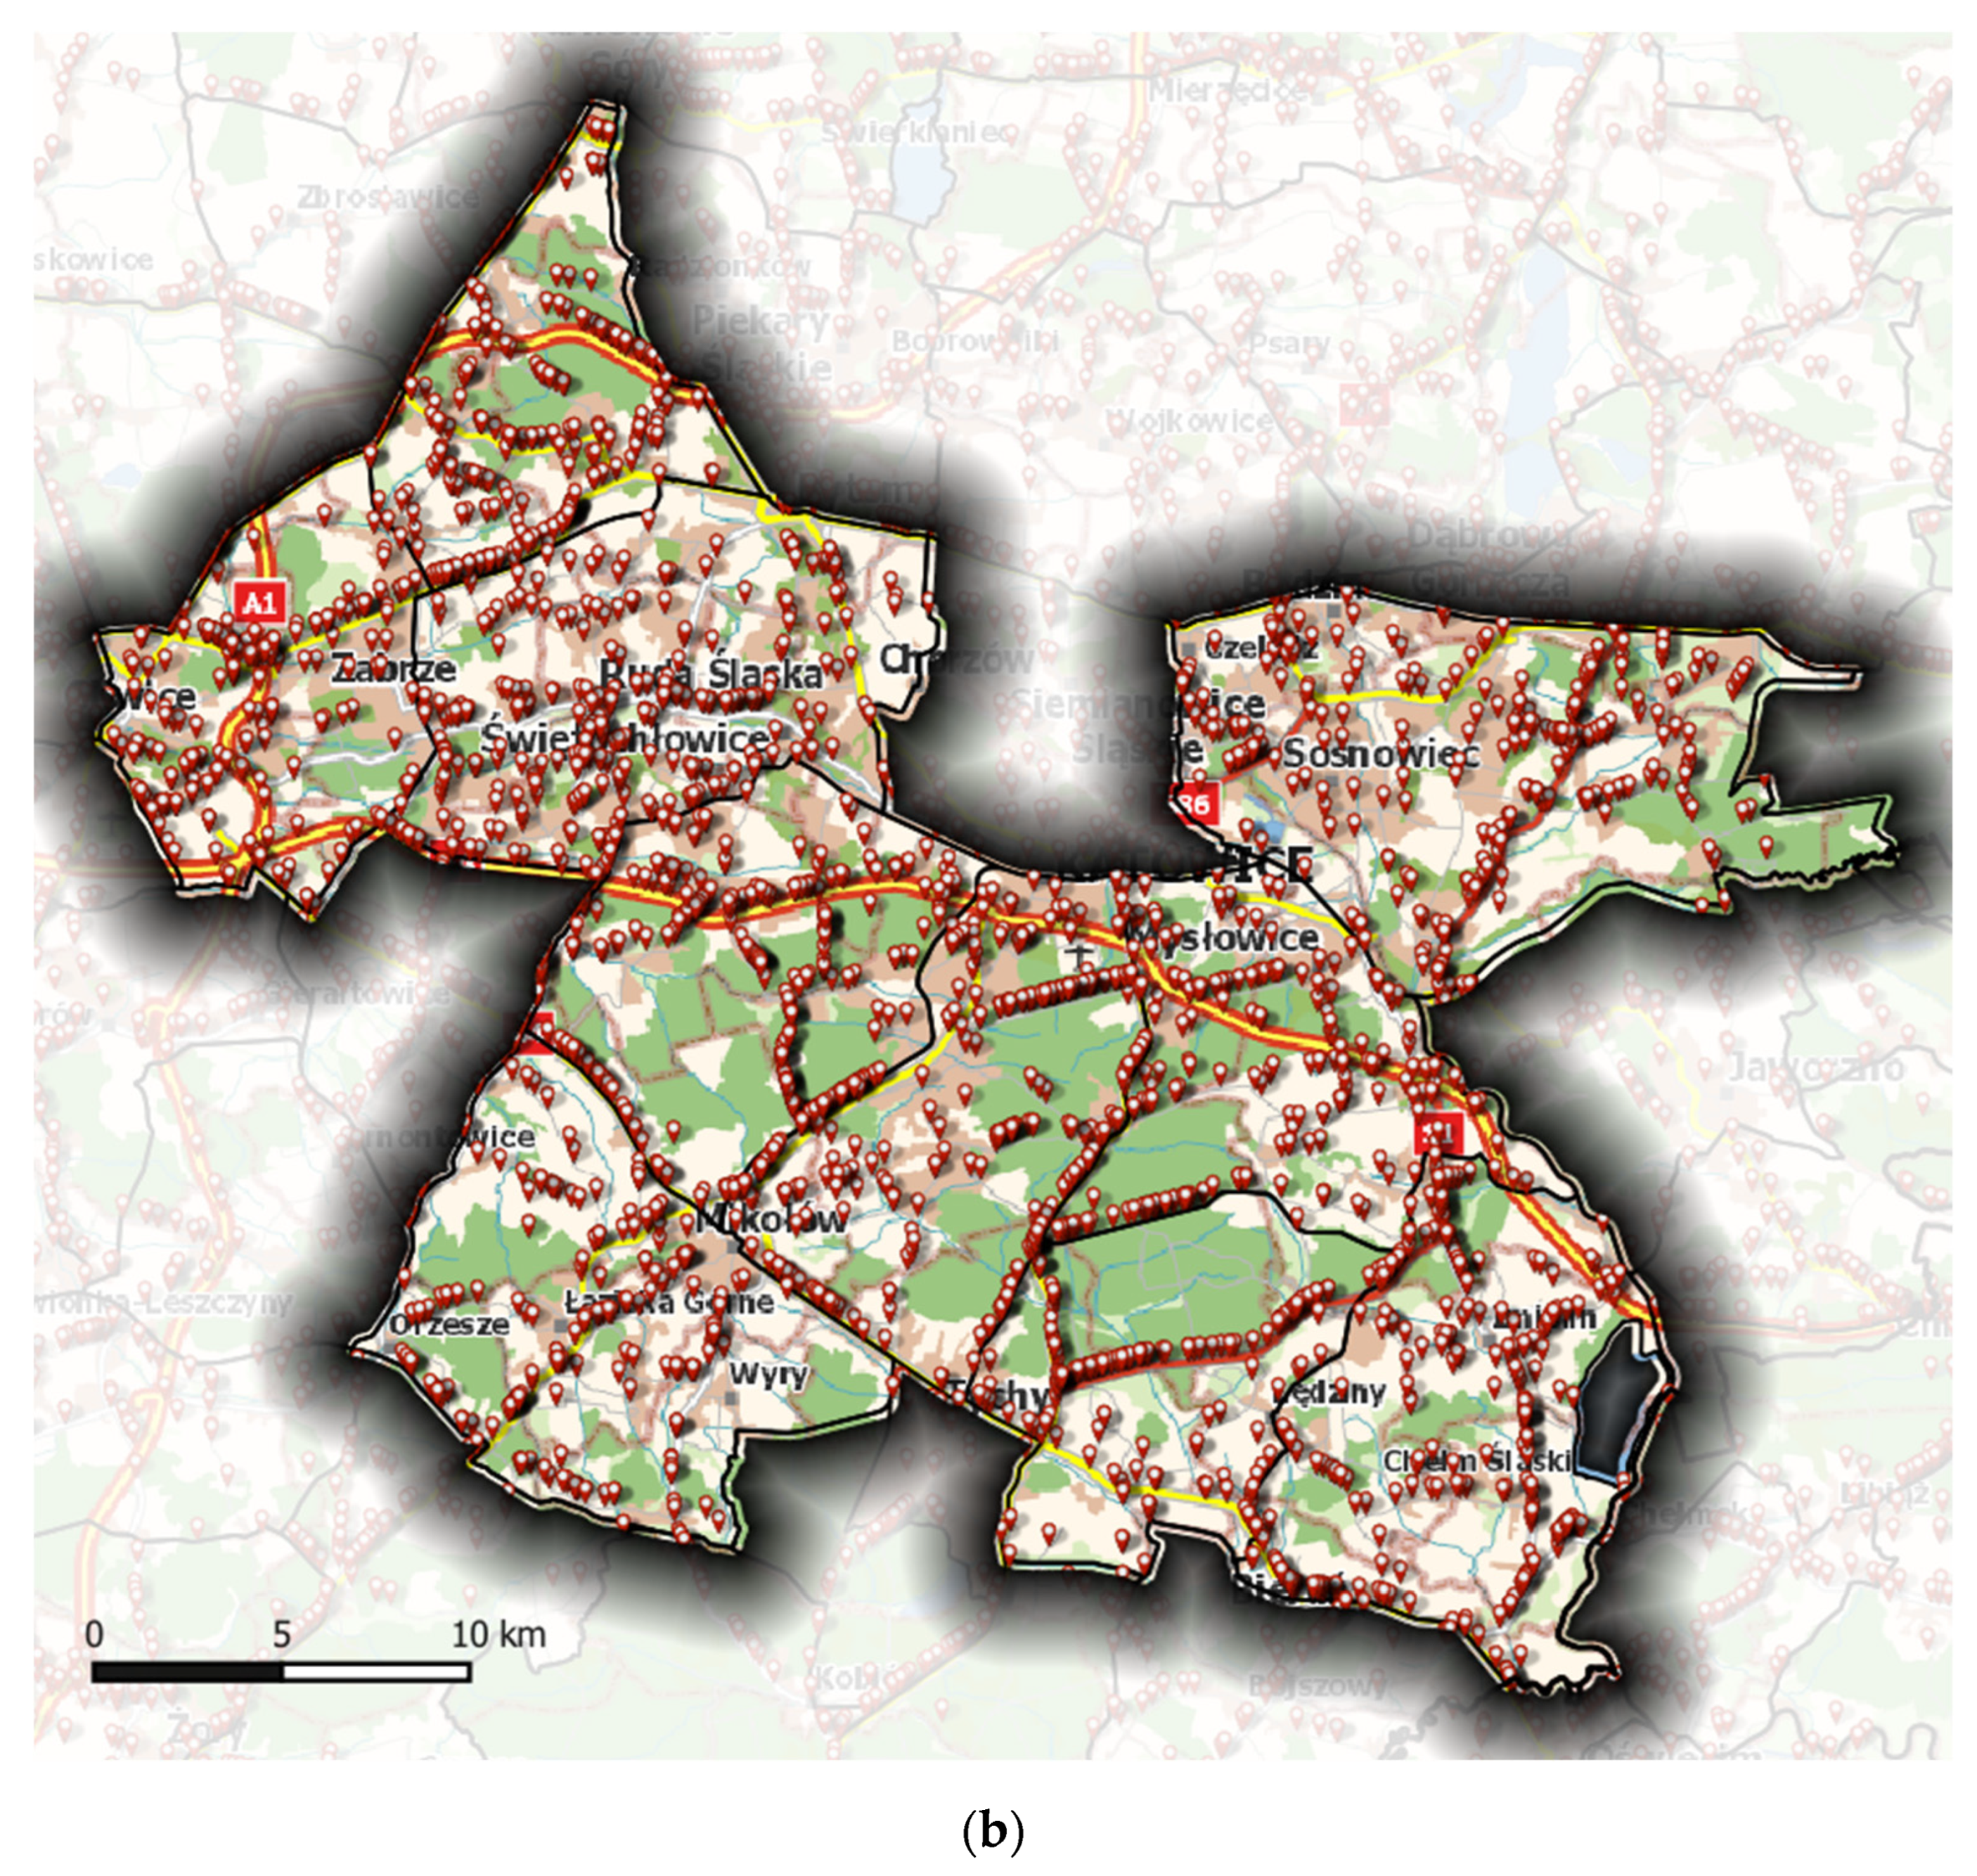
Districts with the highest numbers of crashes often include suburban areas and the outskirts of large cities. Examples of the crash locations in such districts are shown in Figure 13.
3.3. Relationship between the Number of Crashes and the Wildlife Population Sizes
For further analysis, an evaluation of the normal distribution was performed on each of the analysed variables: the animal population size, and the number of crashes in particular years. Research was not conducted for jackals in 2016 and 2017, as no inventory data are available for those animals during this period. The results of the Shapiro–Wilk and Pearson’s chi-square tests show a lack of compliance with the normal distribution (highest p-values: 7.409583 × 10−52 and 1.482668 × 10−306, respectively). Therefore, further analyses were conducted using the Spearman’s nonparametric correlation coefficient. It was accepted that p > 0.05 does not provide evidence of correlation significance.
Correlation analyses were conducted and are presented between:
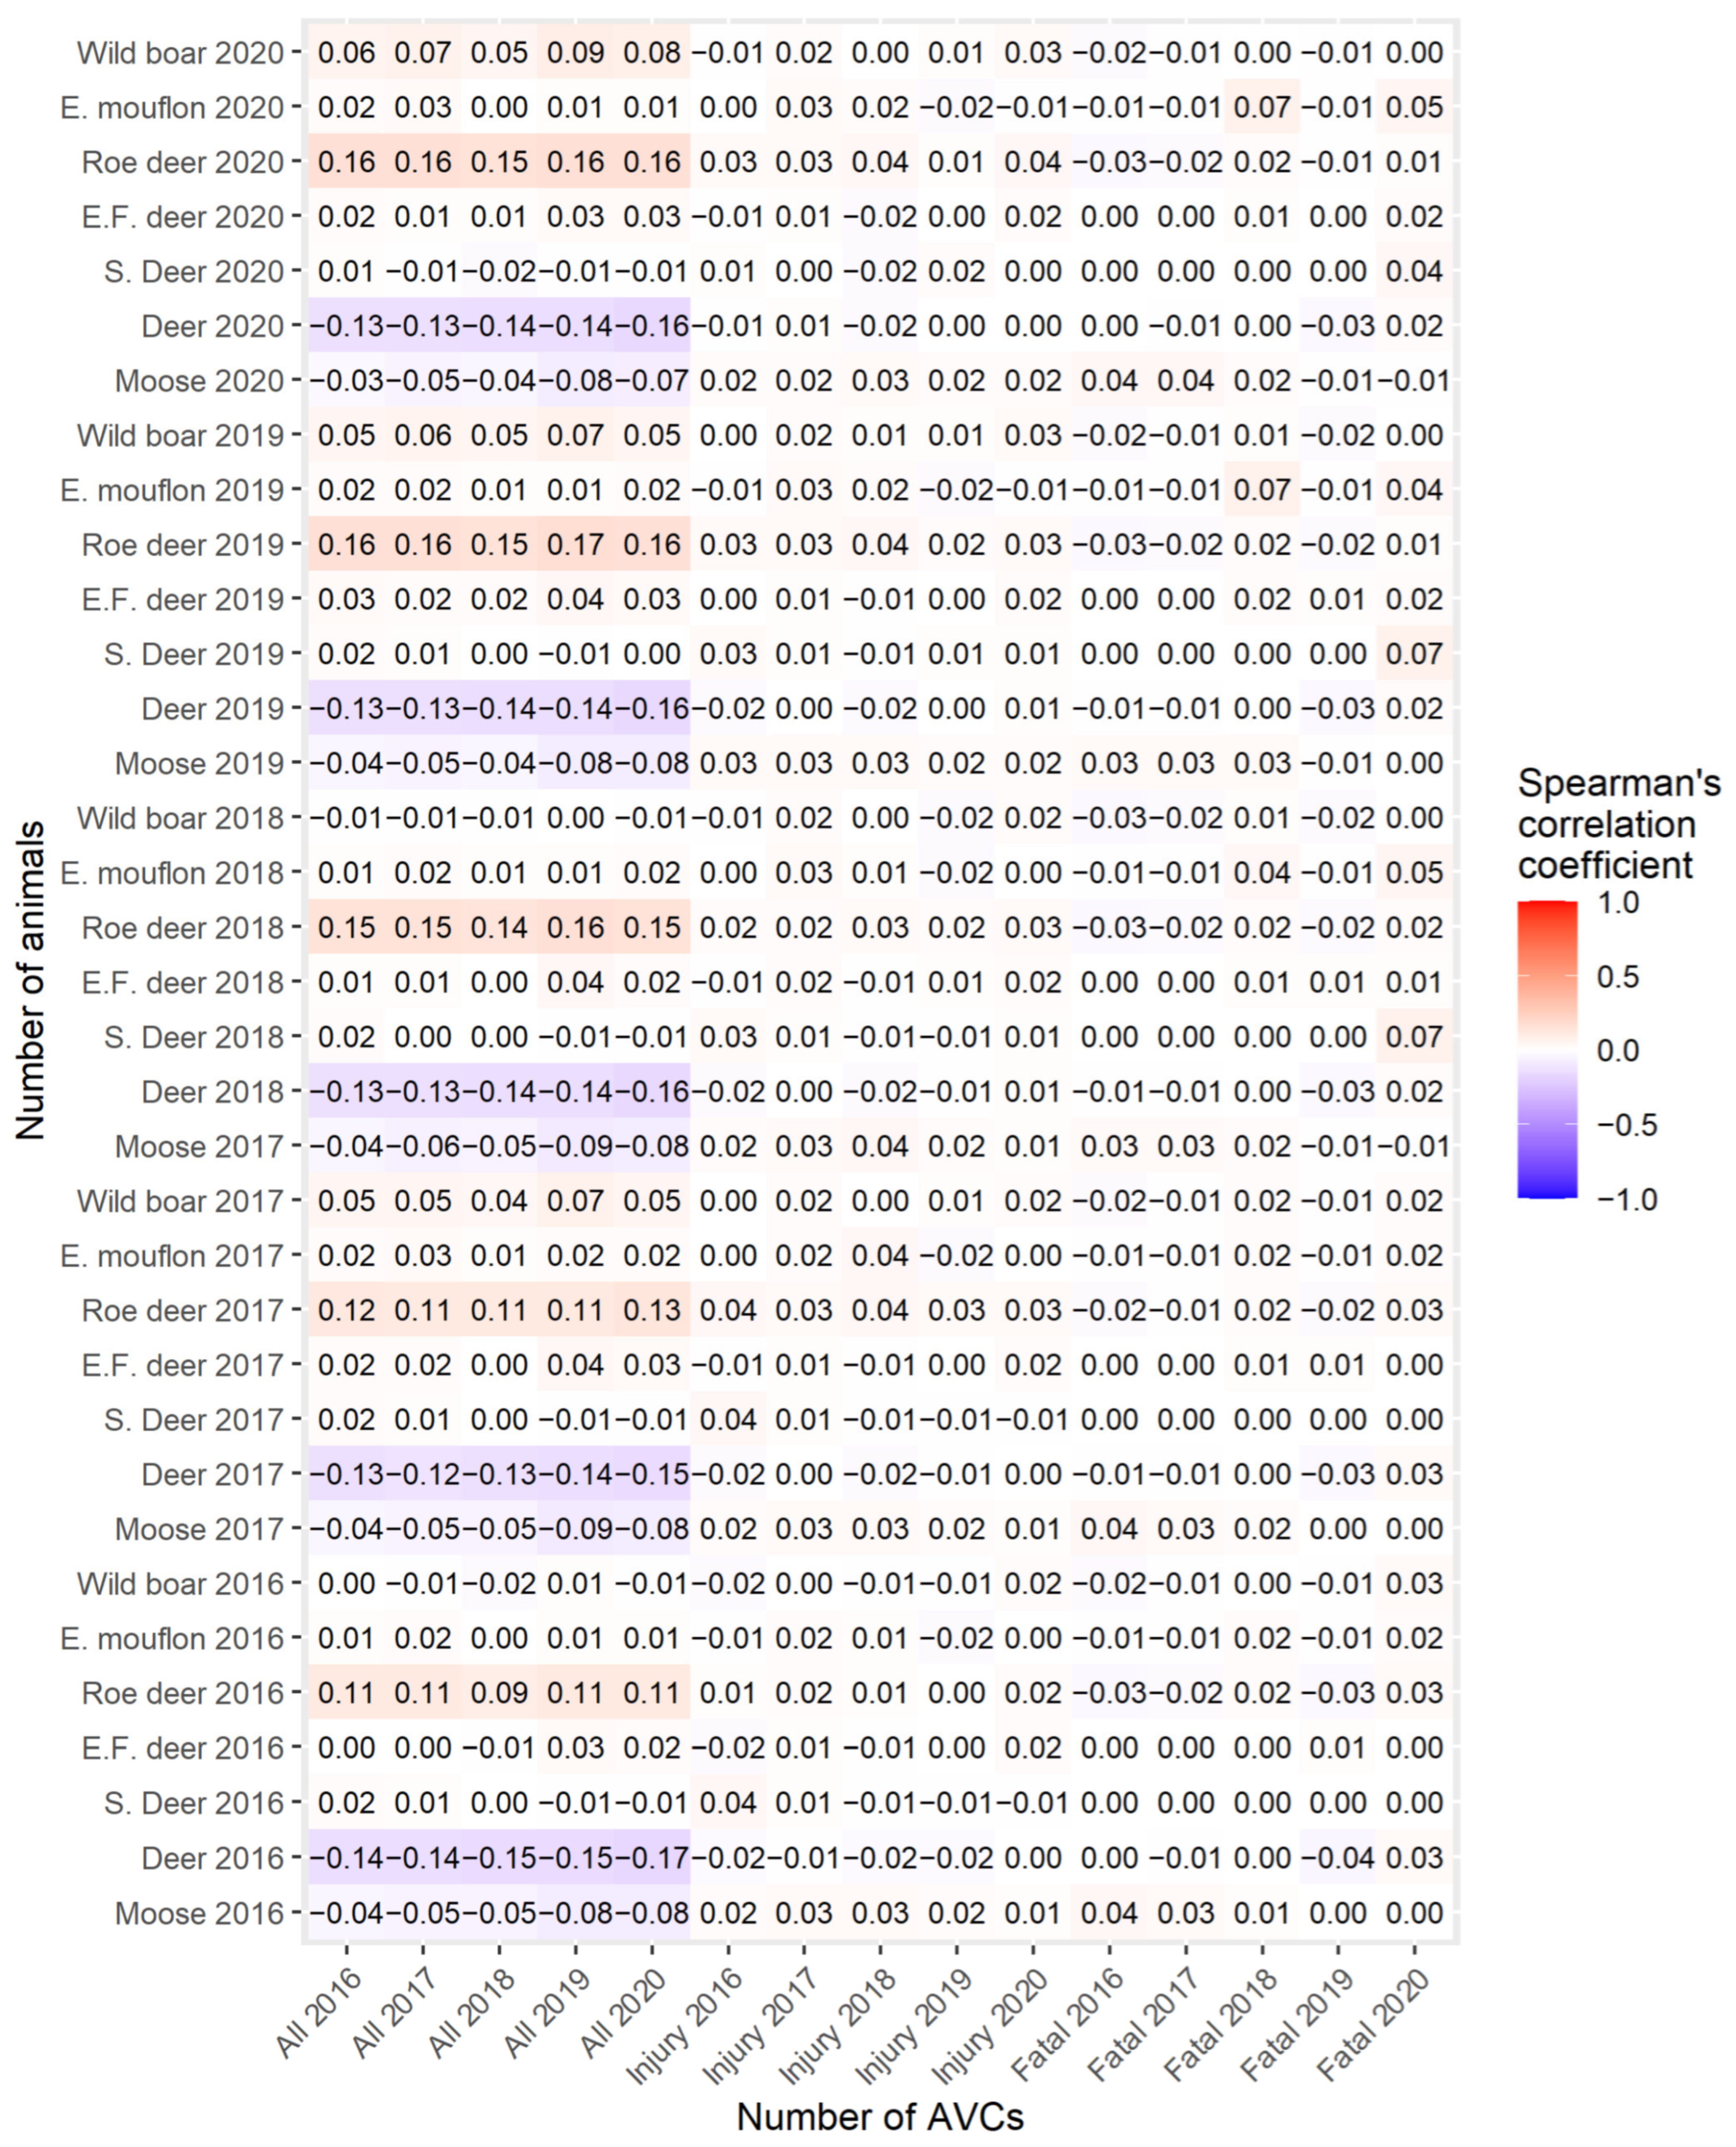
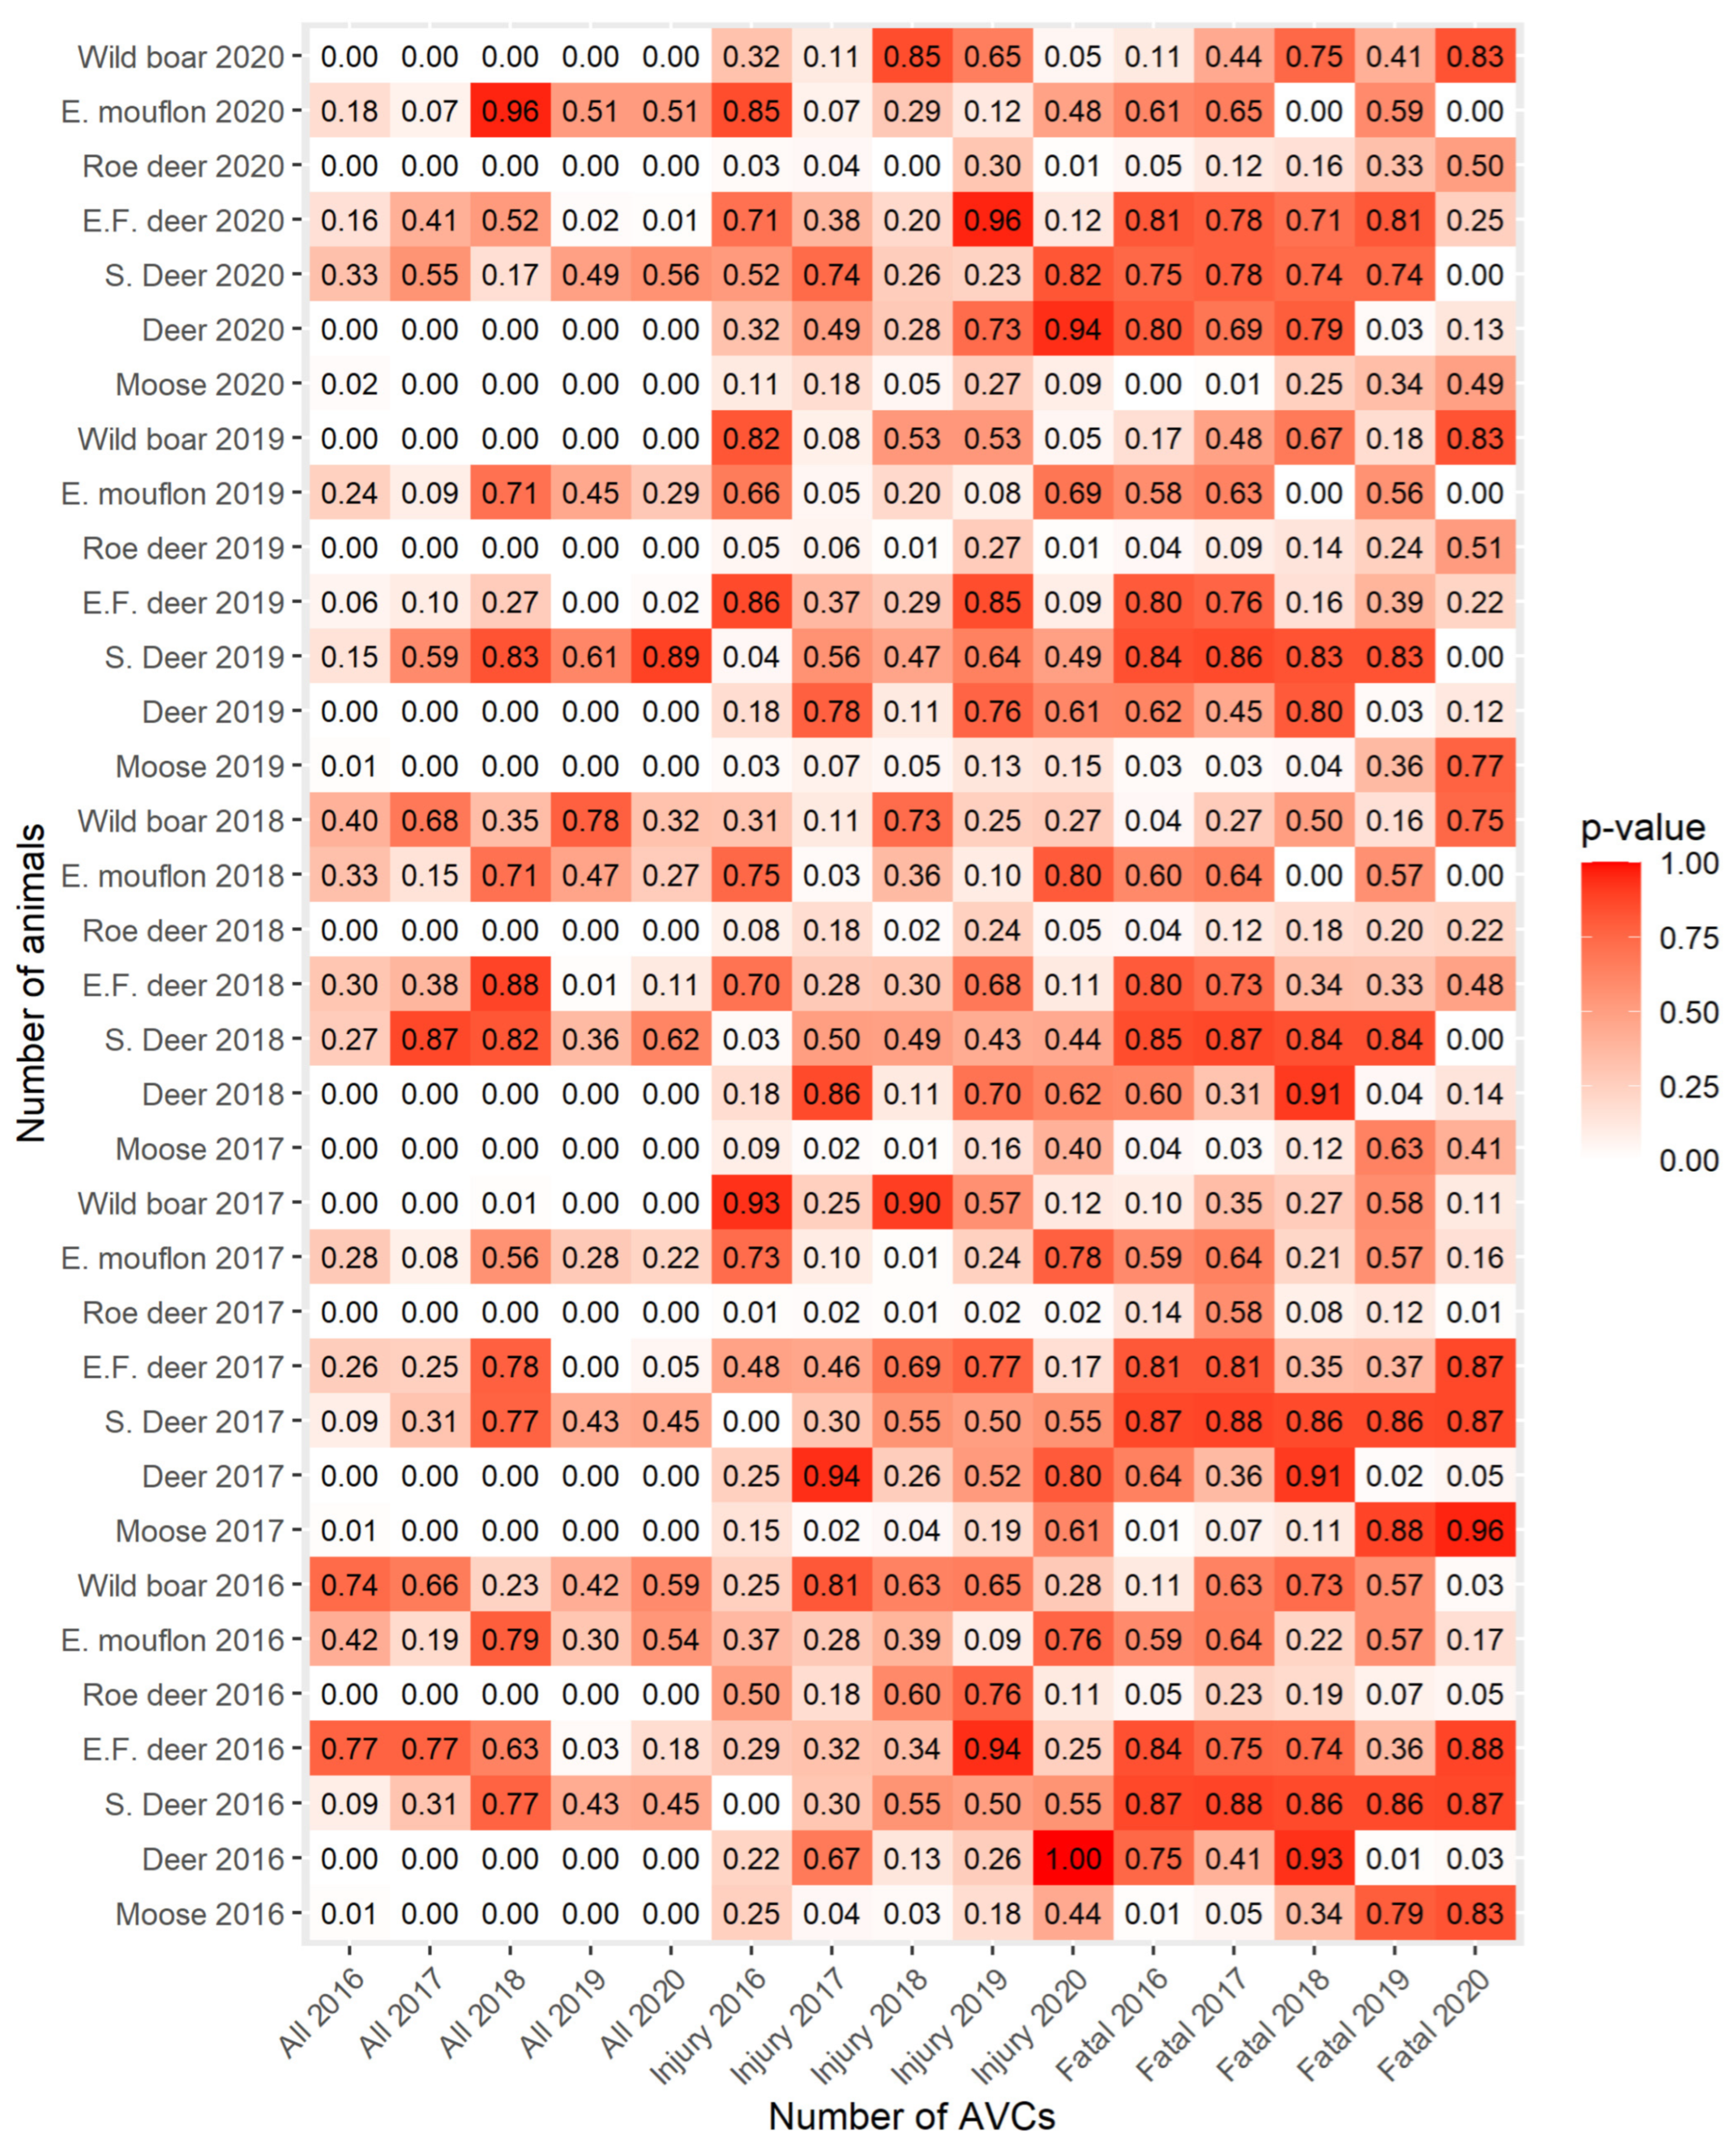
- The number of big game and the number of AVCs, the number of AVCs with injuries, and the number of fatal AVCs (Figure 14);
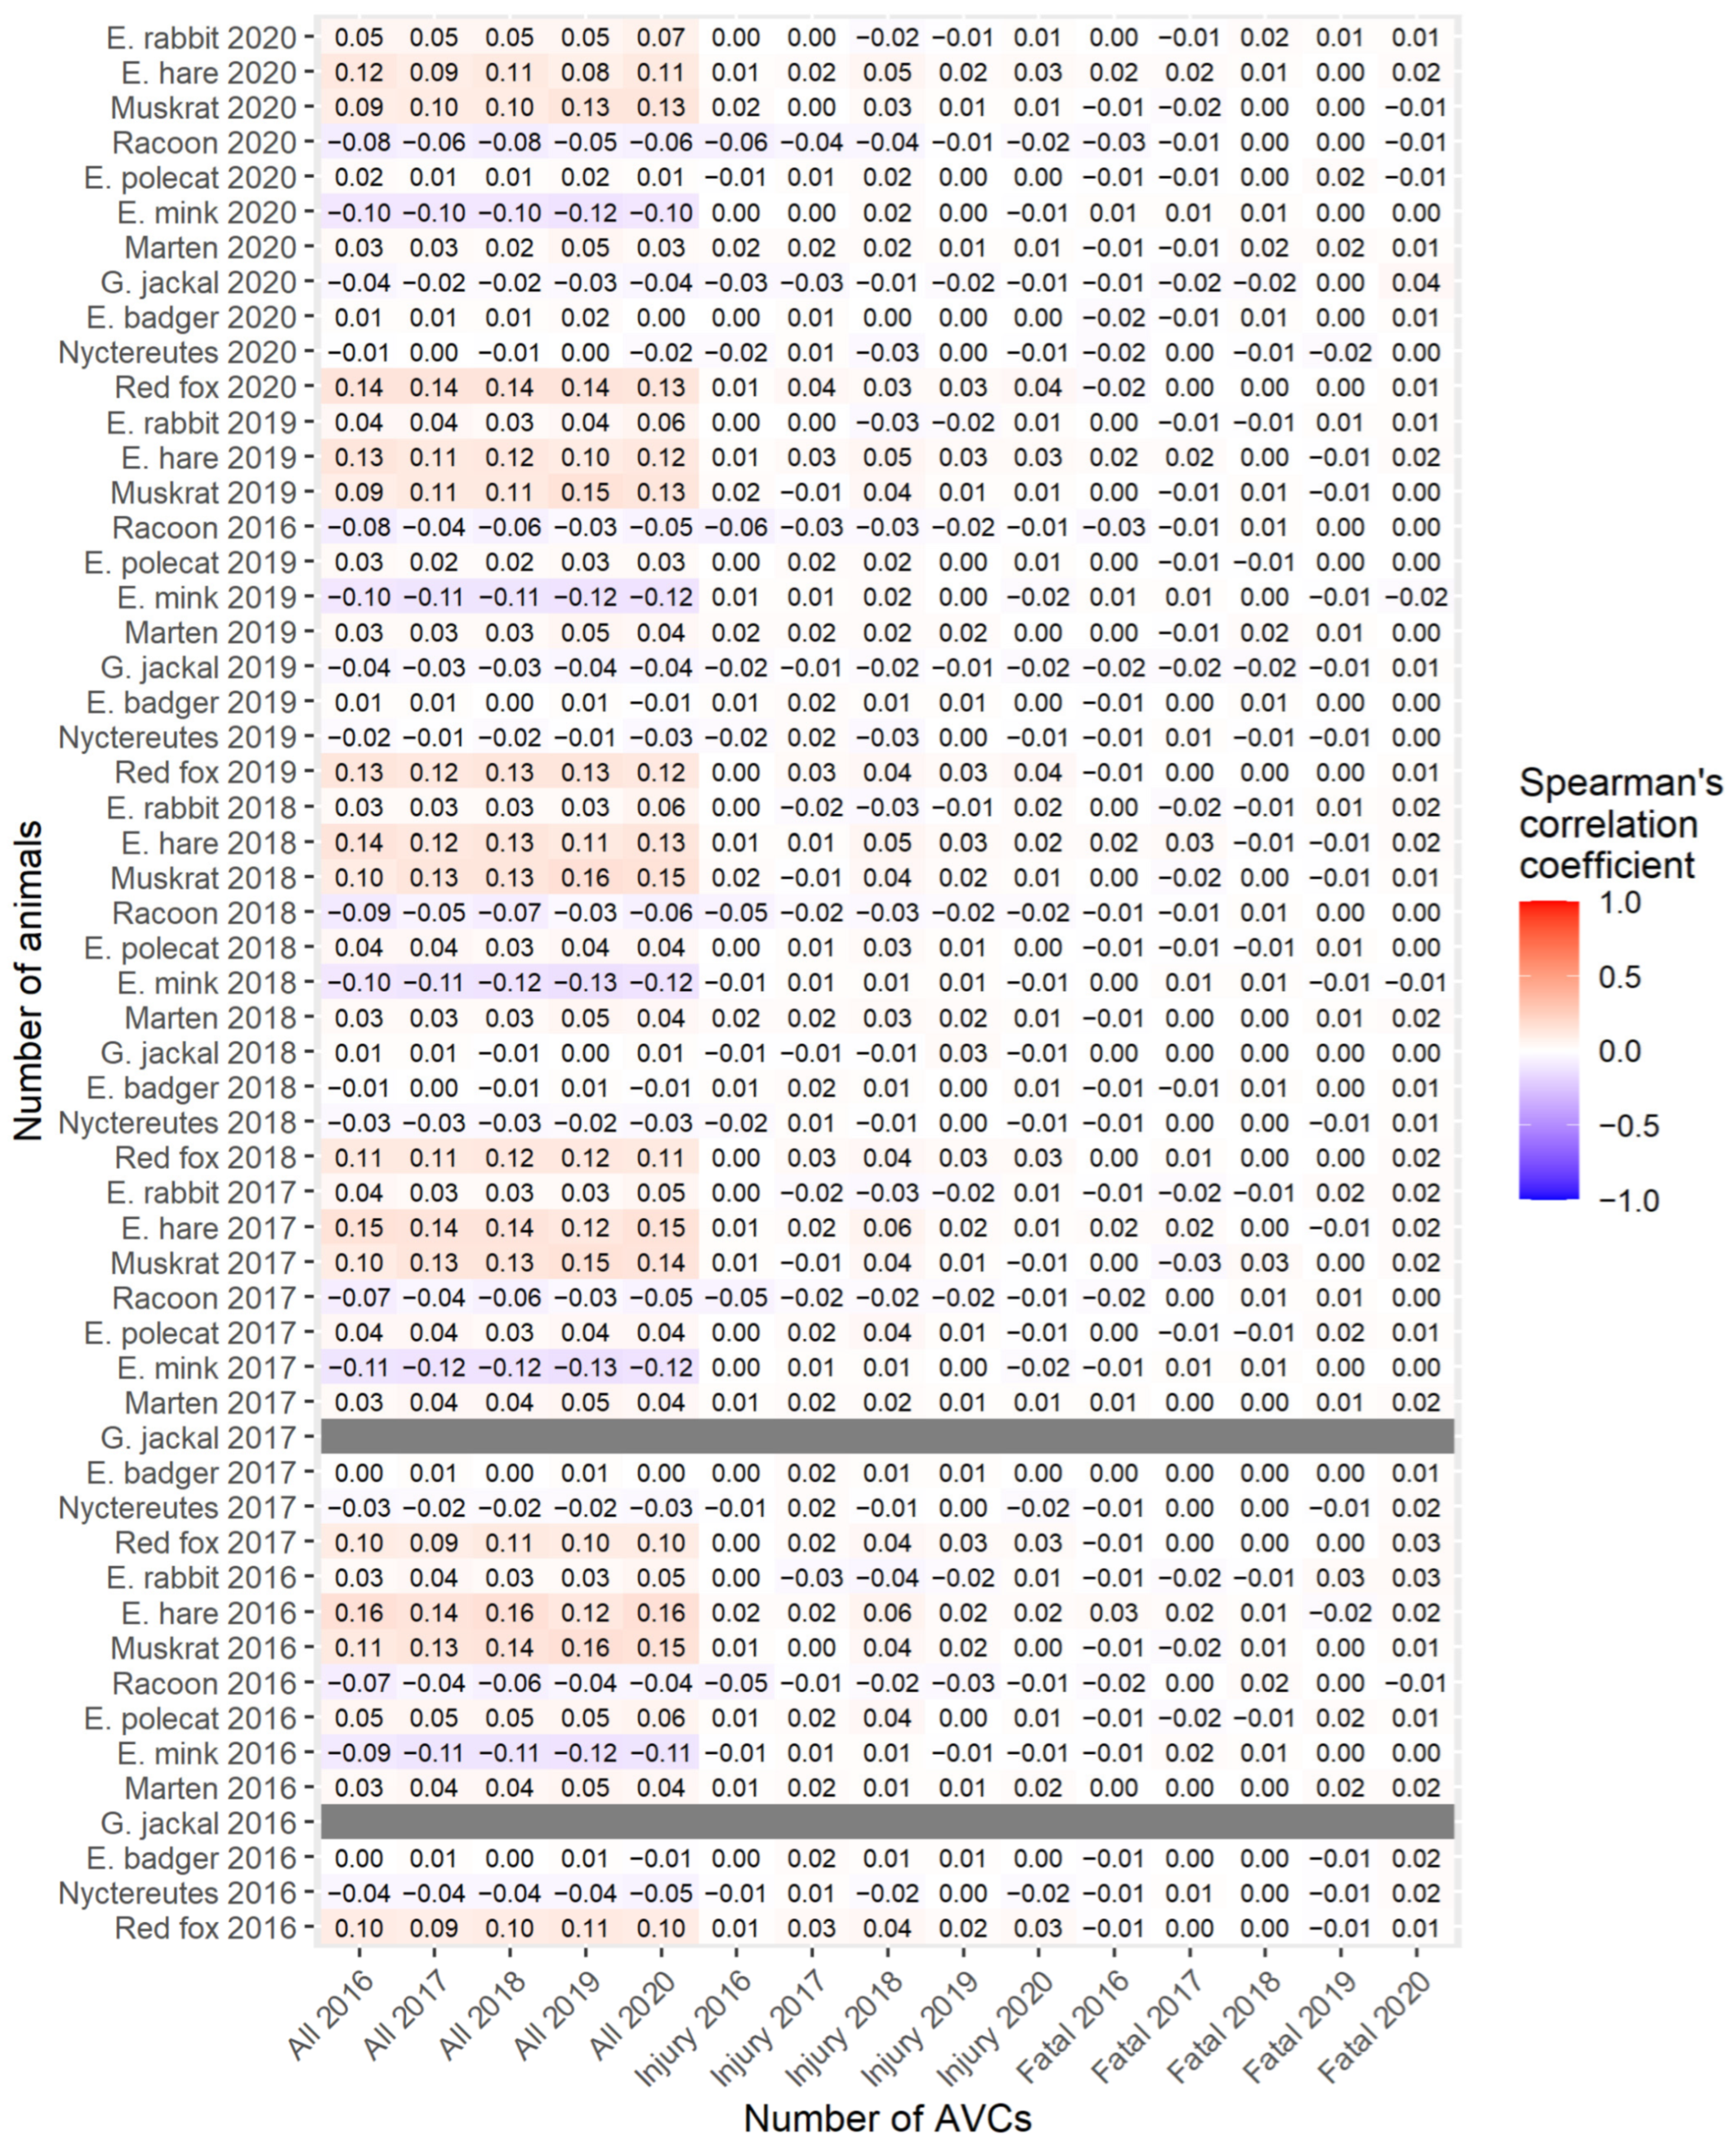
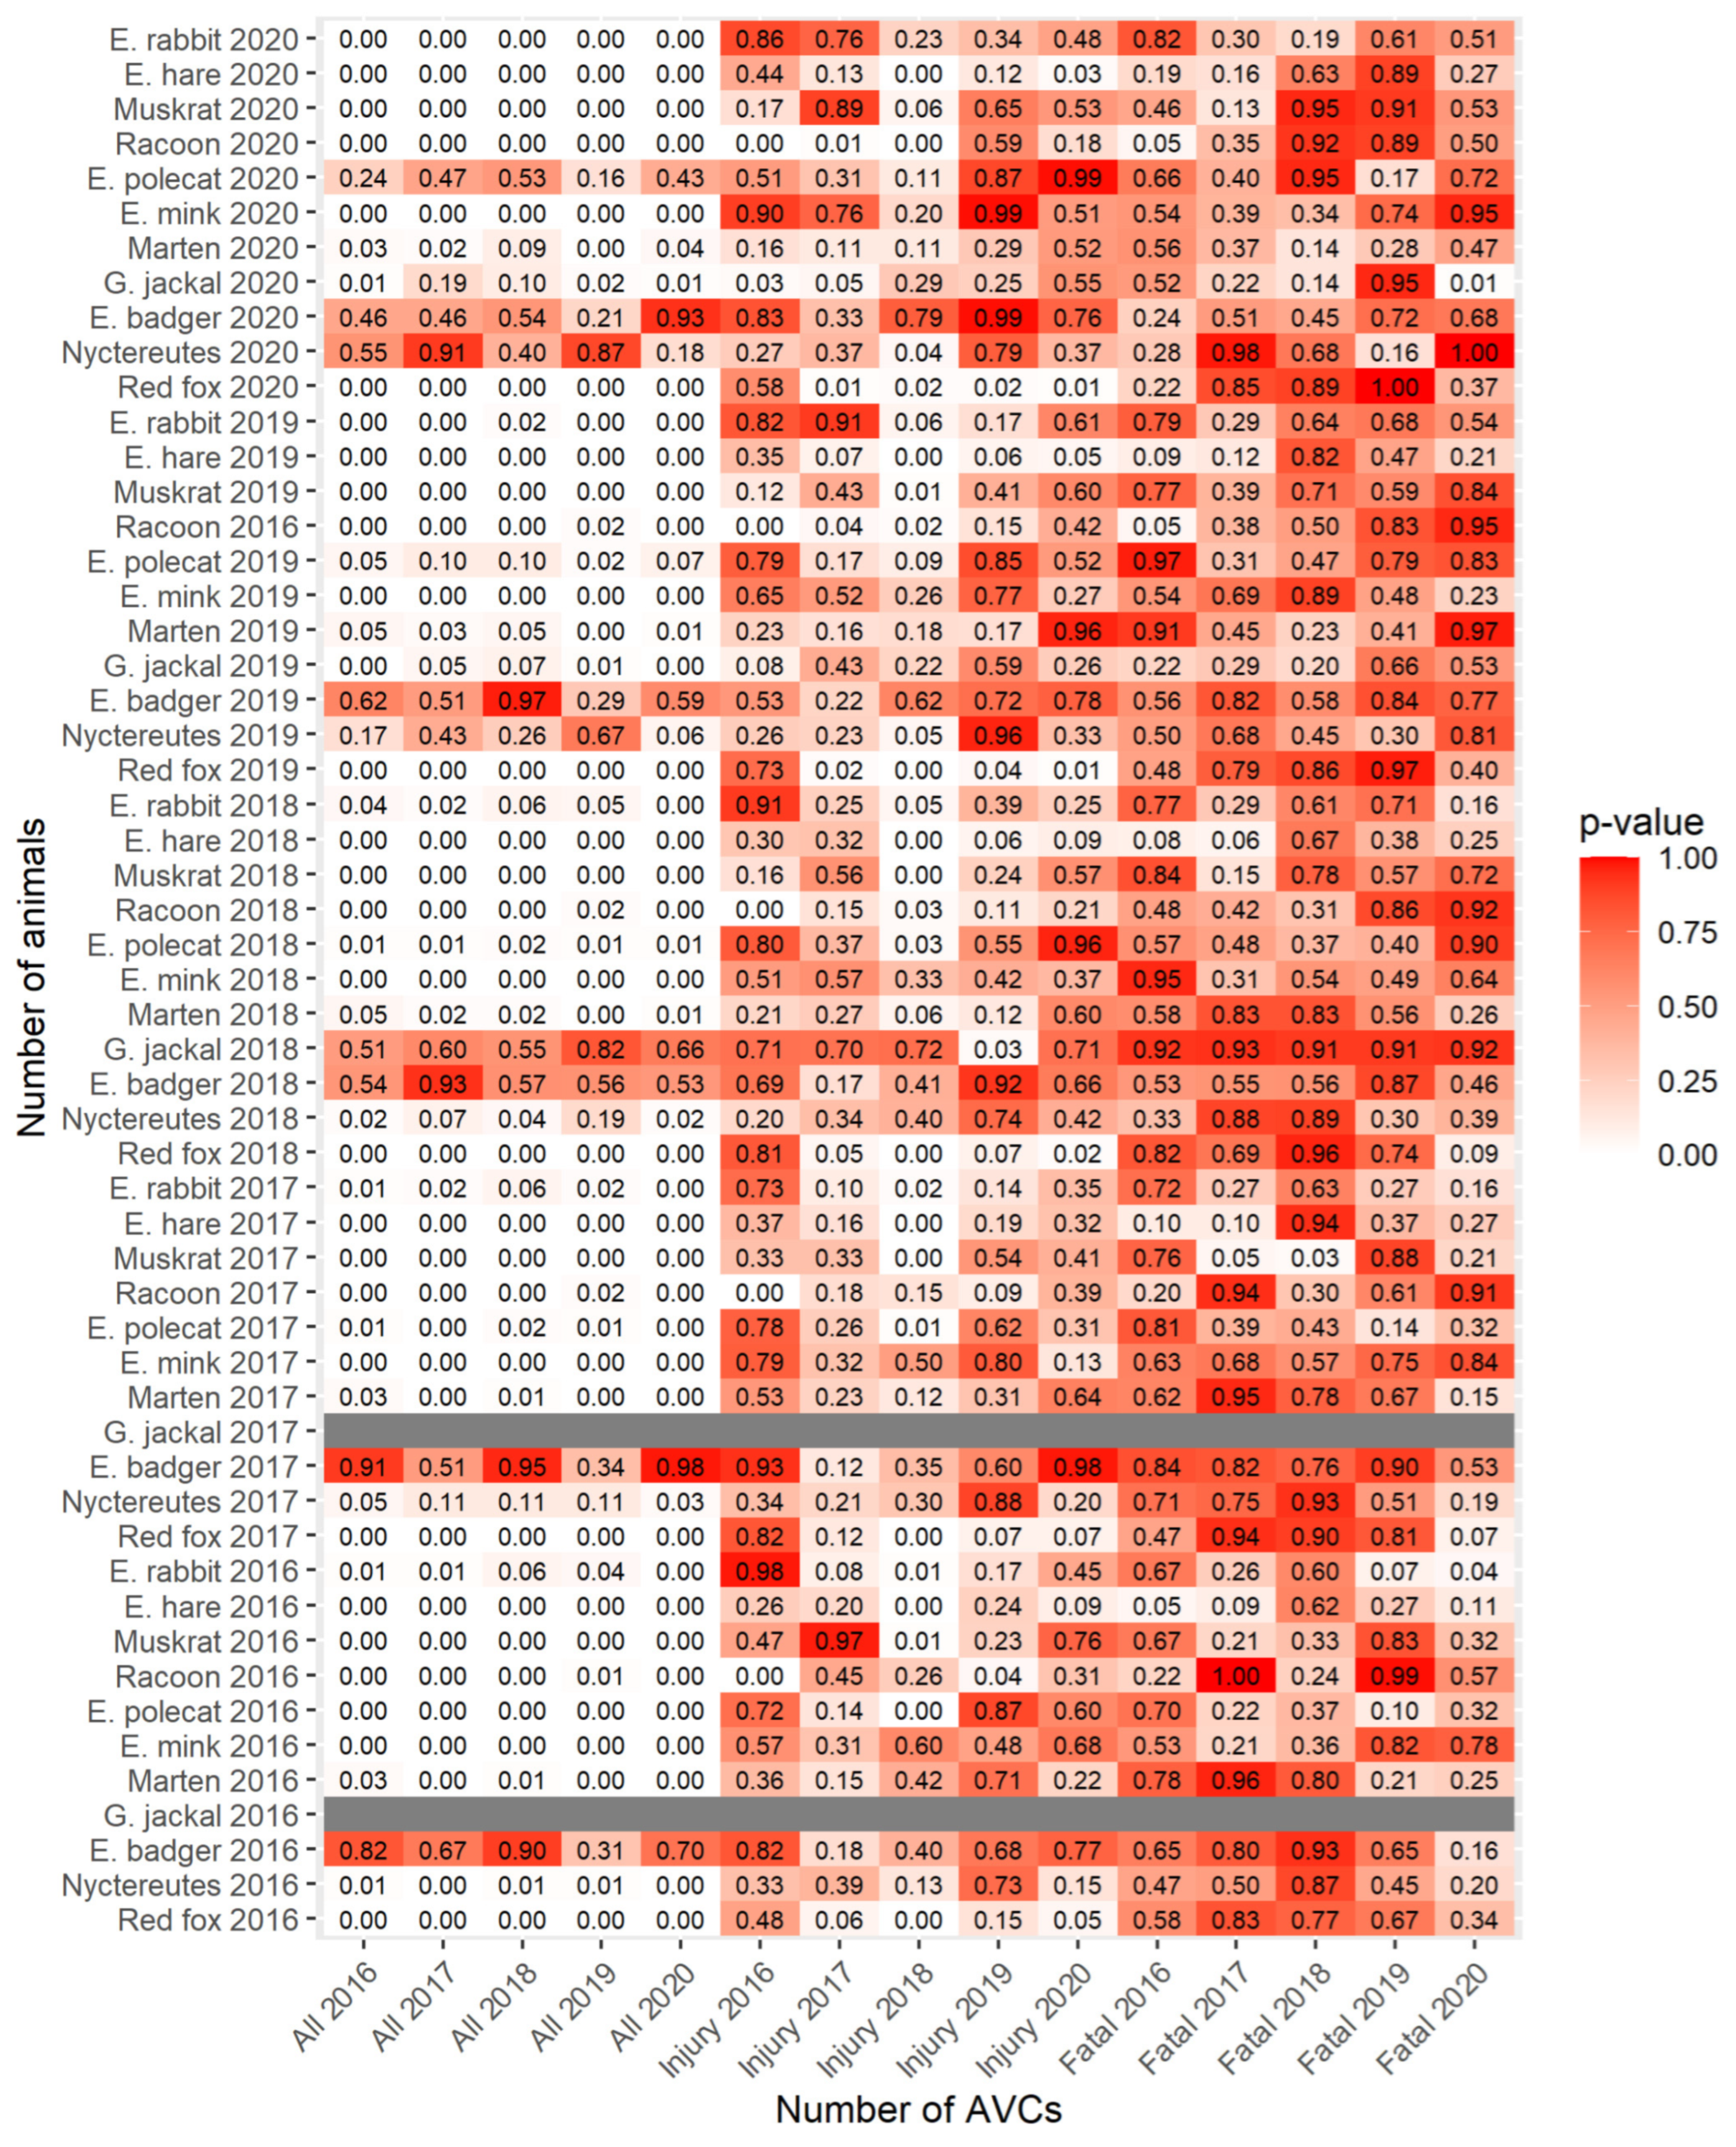
- The number of small game and the number of AVCs, the number of AVCs with injuries, and the number of fatal AVCs (Figure 15);
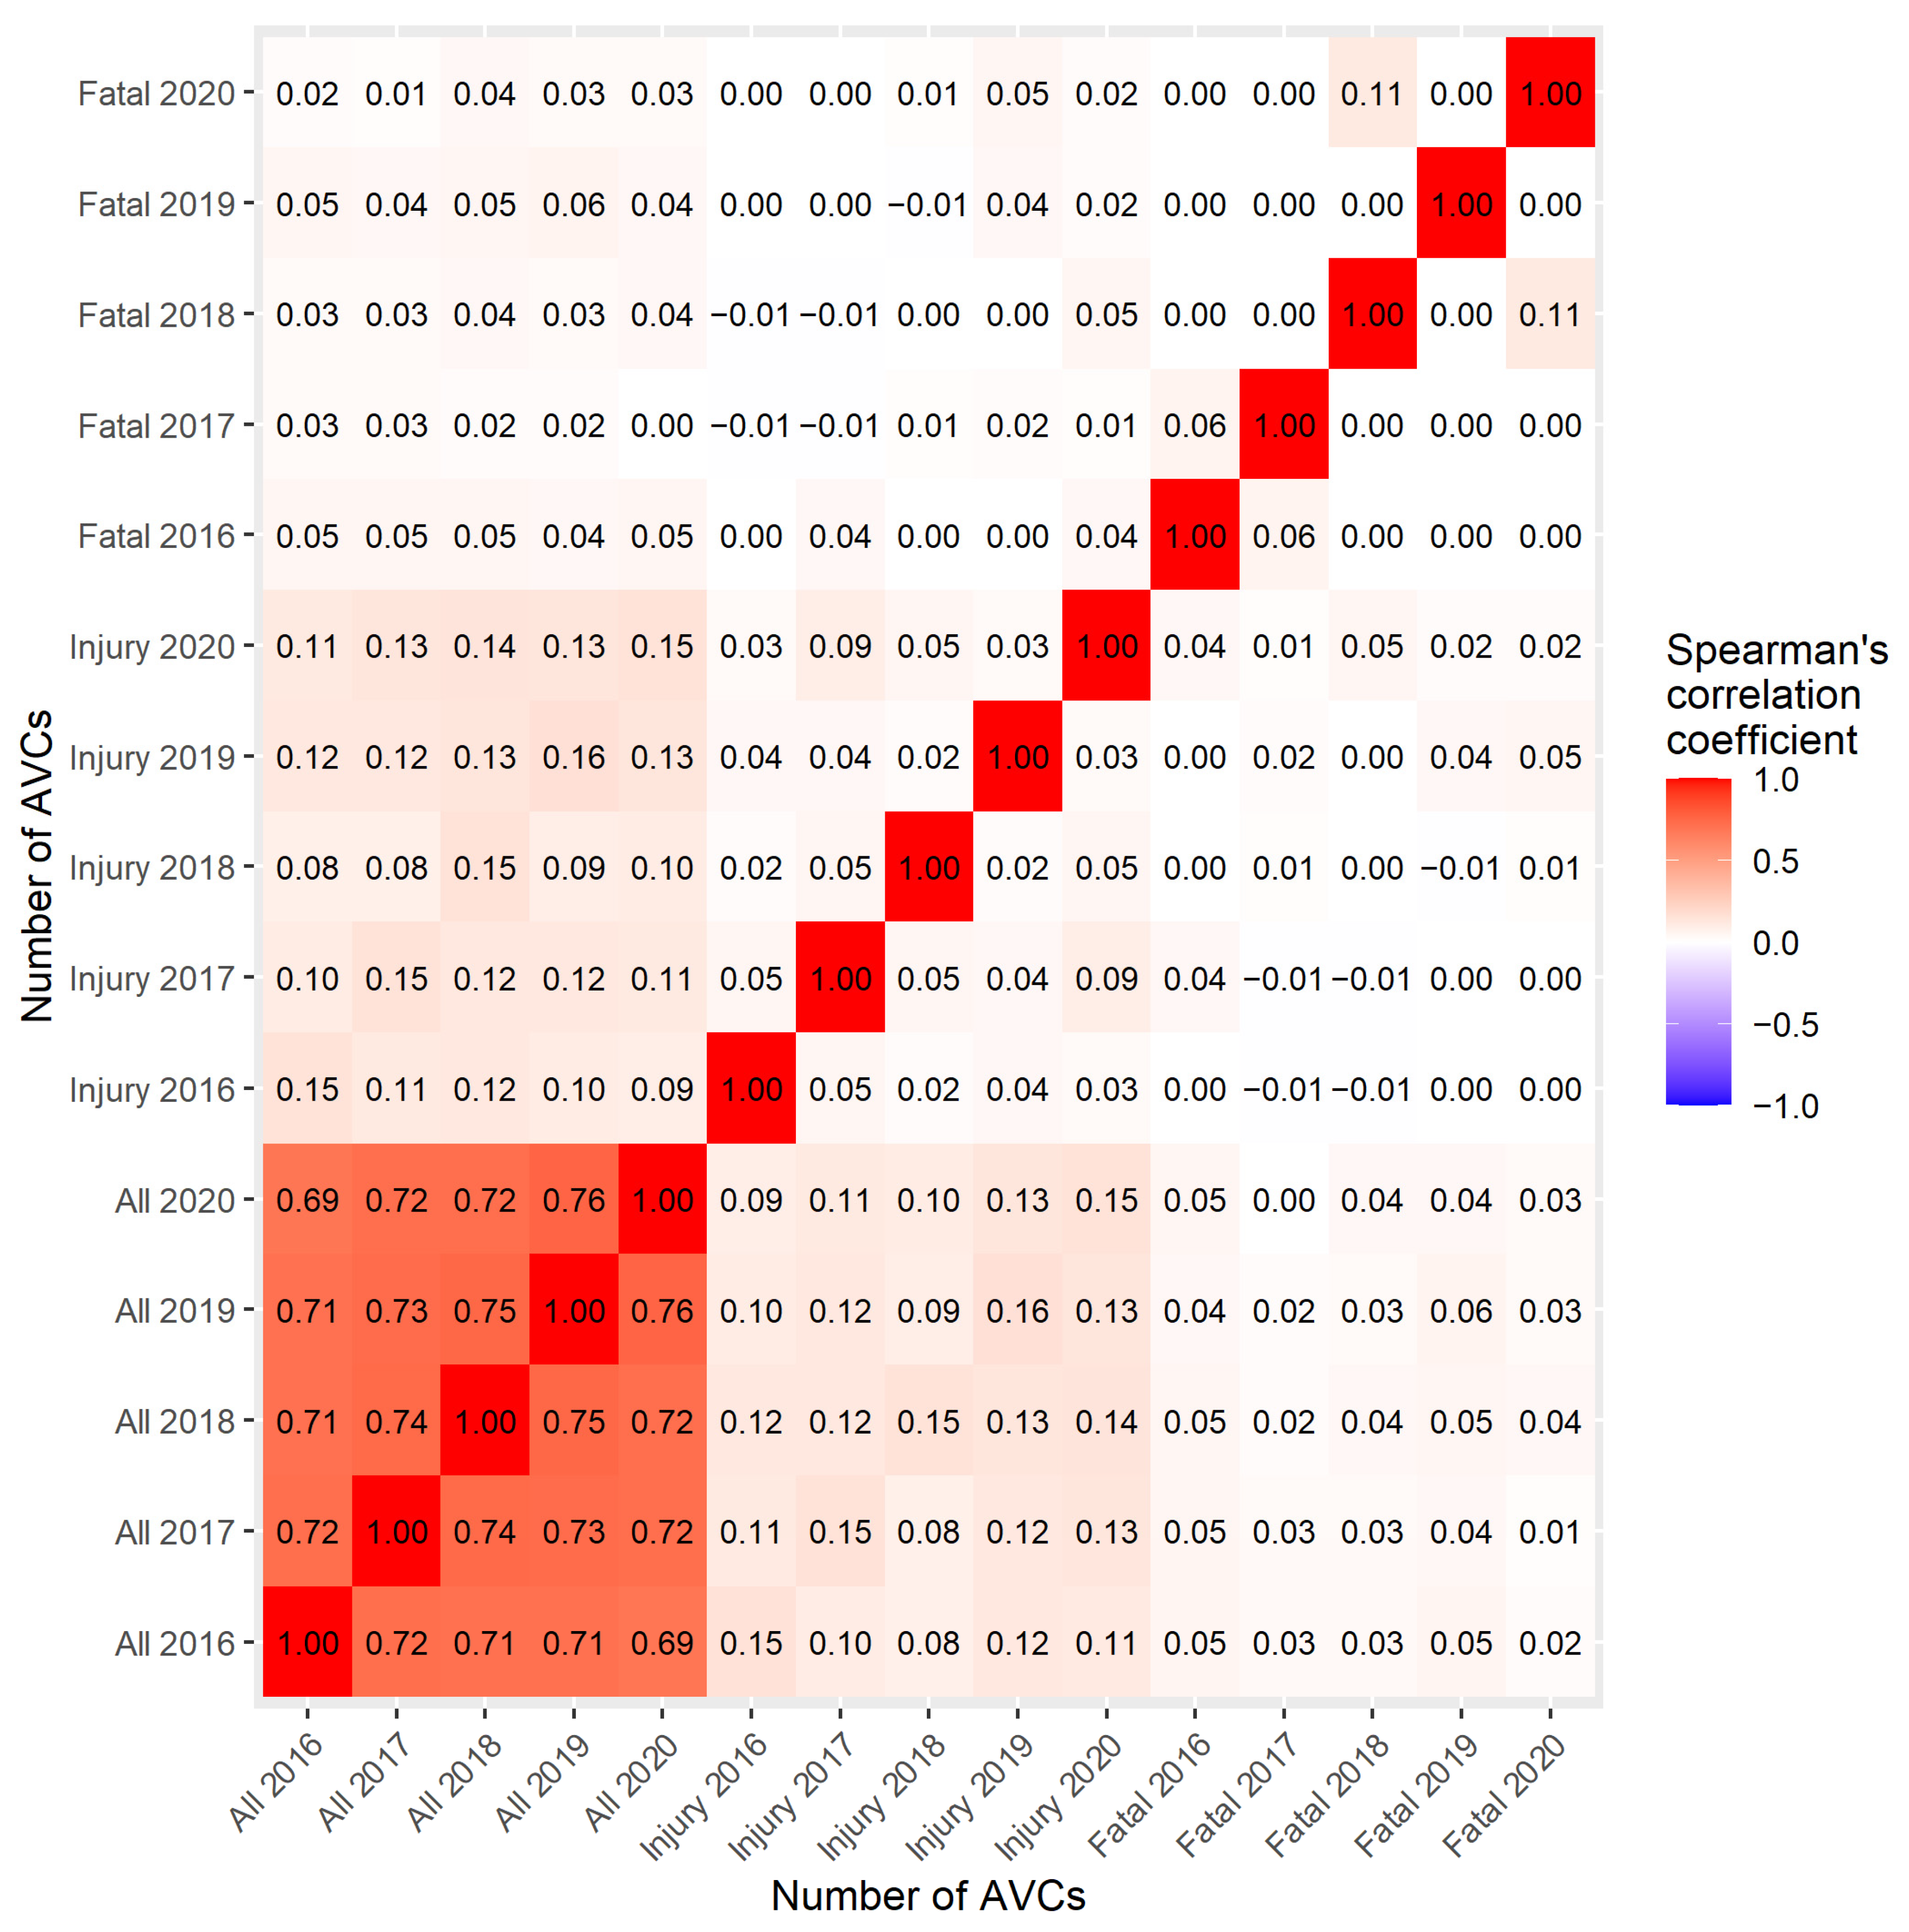
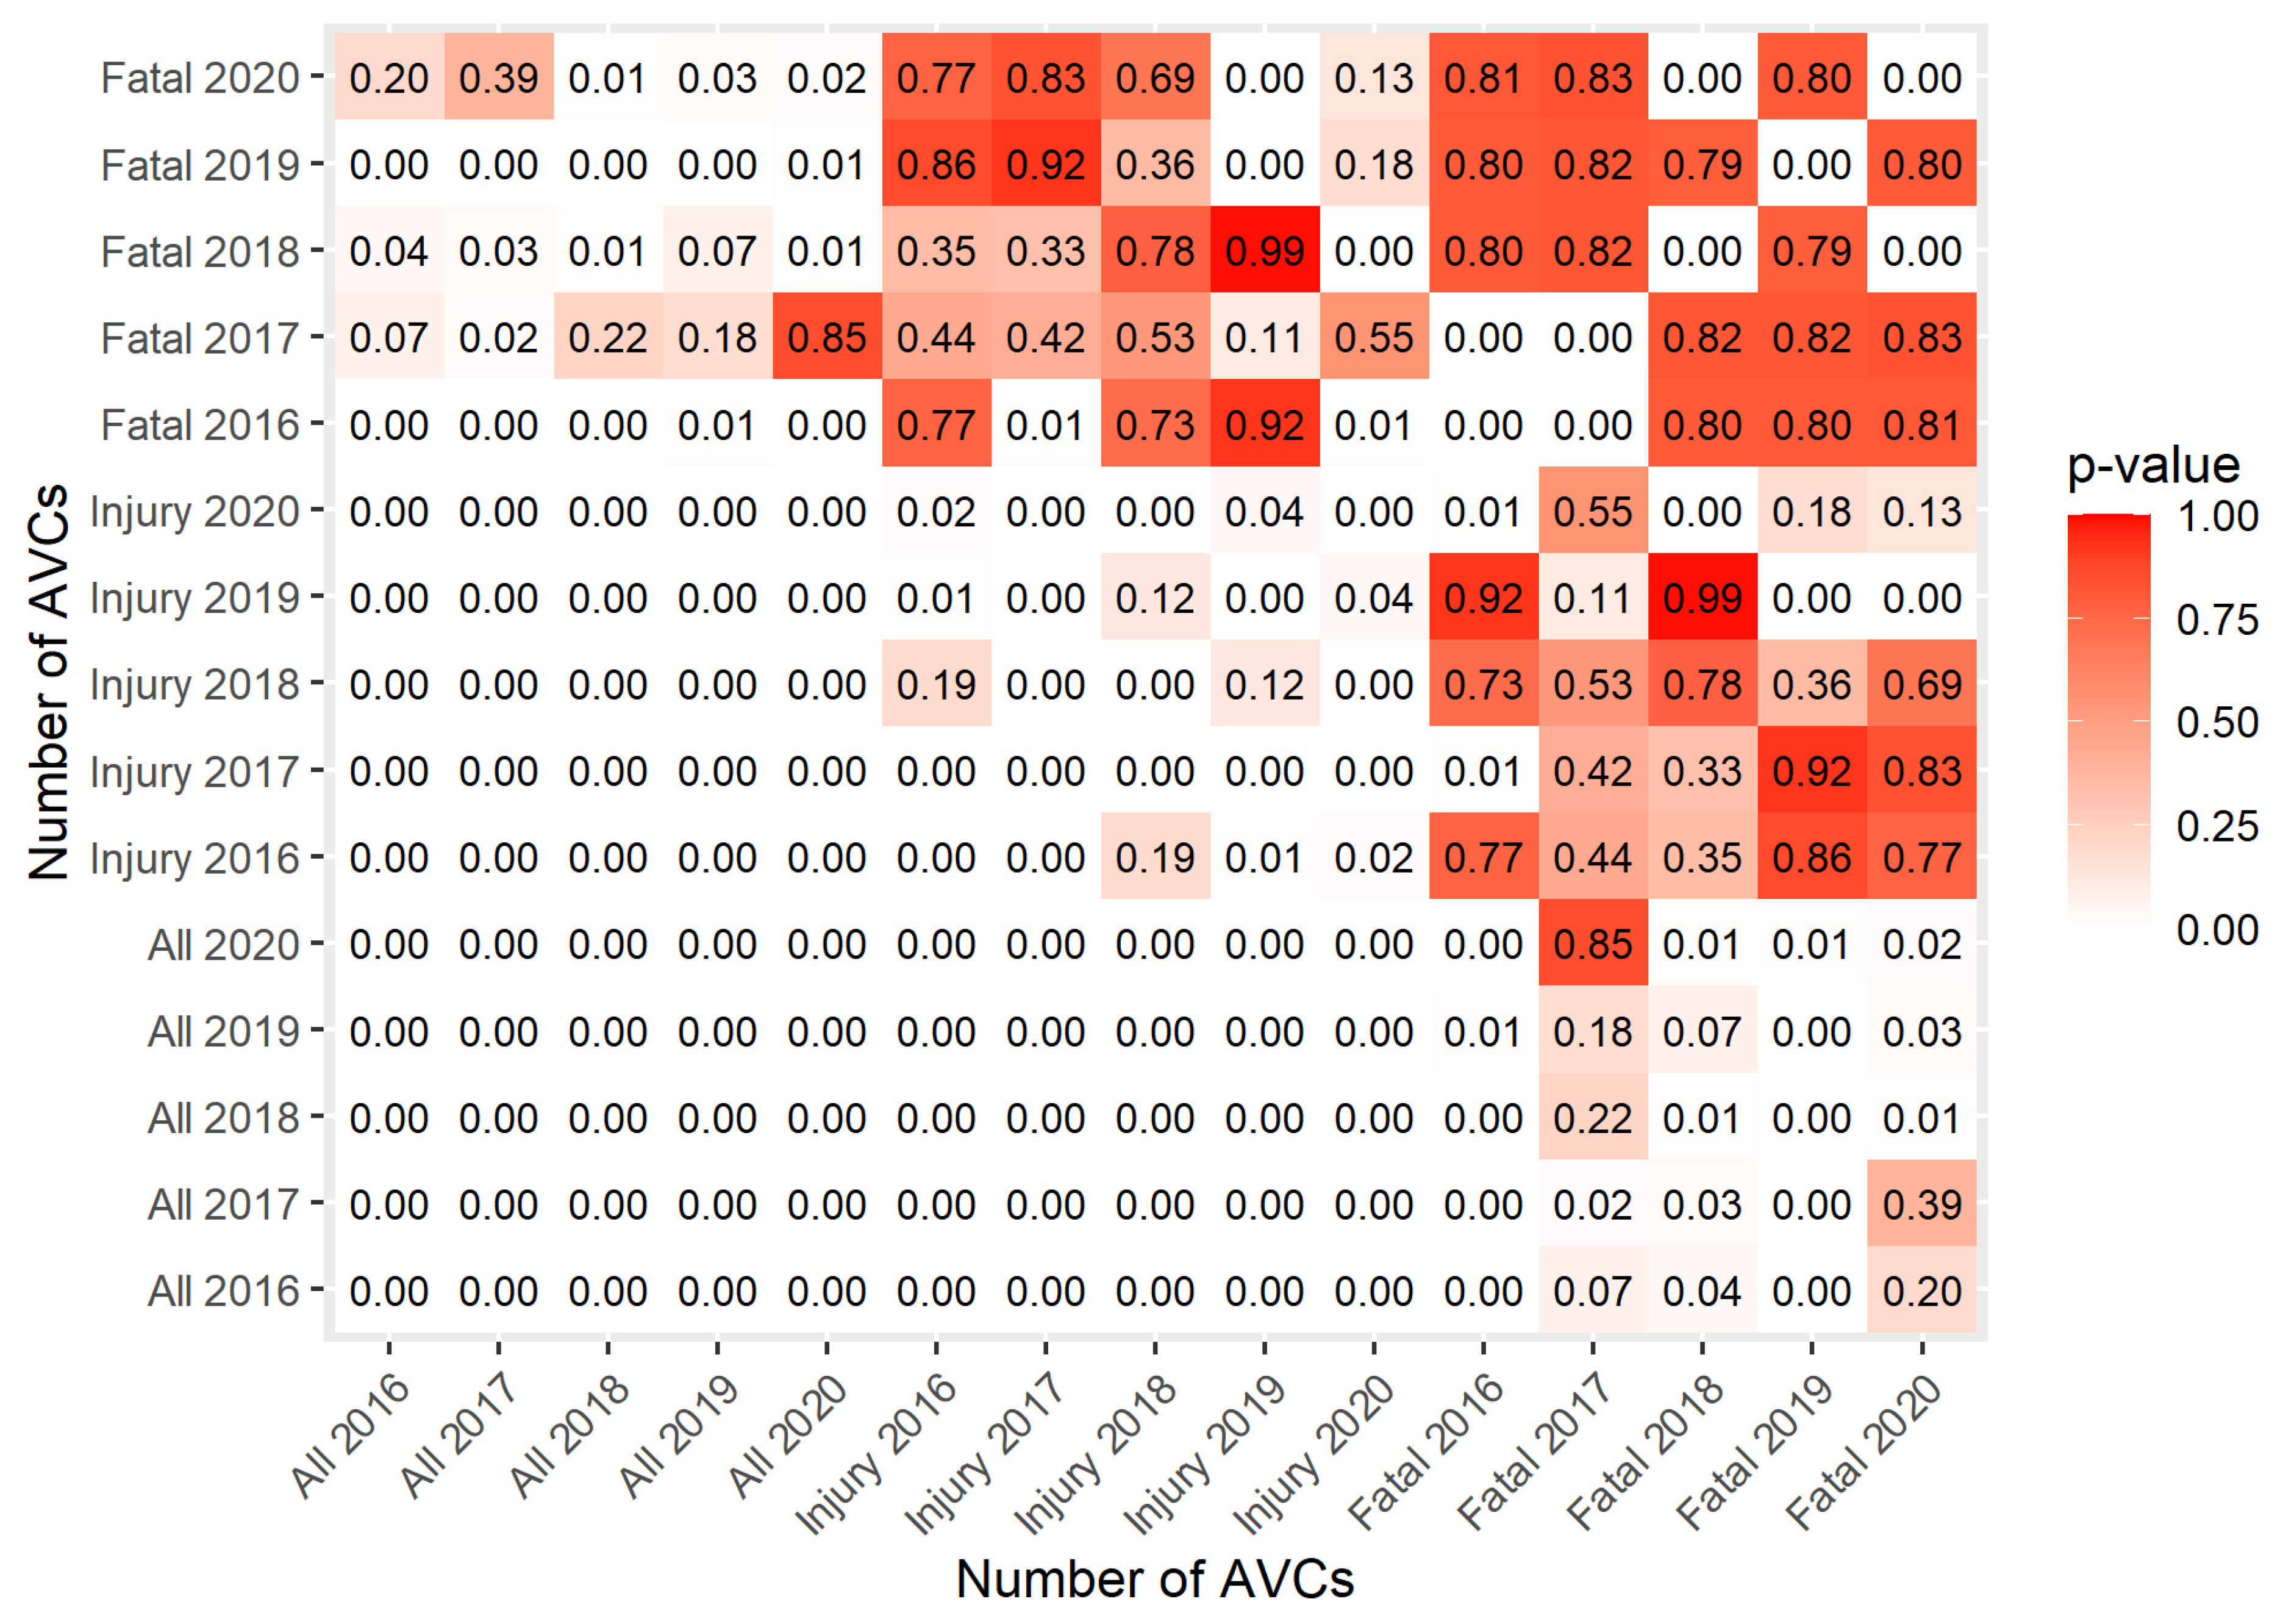
- The number of AVCs, the number of AVCs with injuries, and the number of fatal AVCs, and the number of AVCs, the number of AVCs with injuries, and the number of fatal AVCs (Figure 16).
The results of the correlation between the numbers of different species of animals are not presented, as they are not important from the point of view of road traffic engineering. Data on animals and crashes are presented for the years from 2016–2020, which allows for an analysis of the impact of the situation in earlier years on road safety.
Red indicates a positive correlation and blue indicates a negative correlation. The results are presented for each of the heatmaps of the correlation coefficients. Additionally, the significance of the correlation related to the size of the research sample was examined. The correlation significance calculations are also presented for each calculation as a heatmap (Figure 17, Figure 18 and Figure 19). The conclusions from the analysis are presented in Section 4.3.
Other indicators were analysed in a similar way: the number of crashes with the number of animals per unit area; the number of crashes per unit area with the number of animals; the number of crashes with the number of animals per unit road length (in the variants for the secondary the tertiary categories); and the number of crashes per unit road length (in the variant for the secondary category). The conclusions of the analysis do not differ from the analysis for the numbers of animals, so they are not presented in the article because of the large volume. The lowest correlation coefficient between the number of crashes in 2016 and the number of crashes in 2020 exceeded 0.5.
3.4. Impact of Changes in the Animal Population Sizes
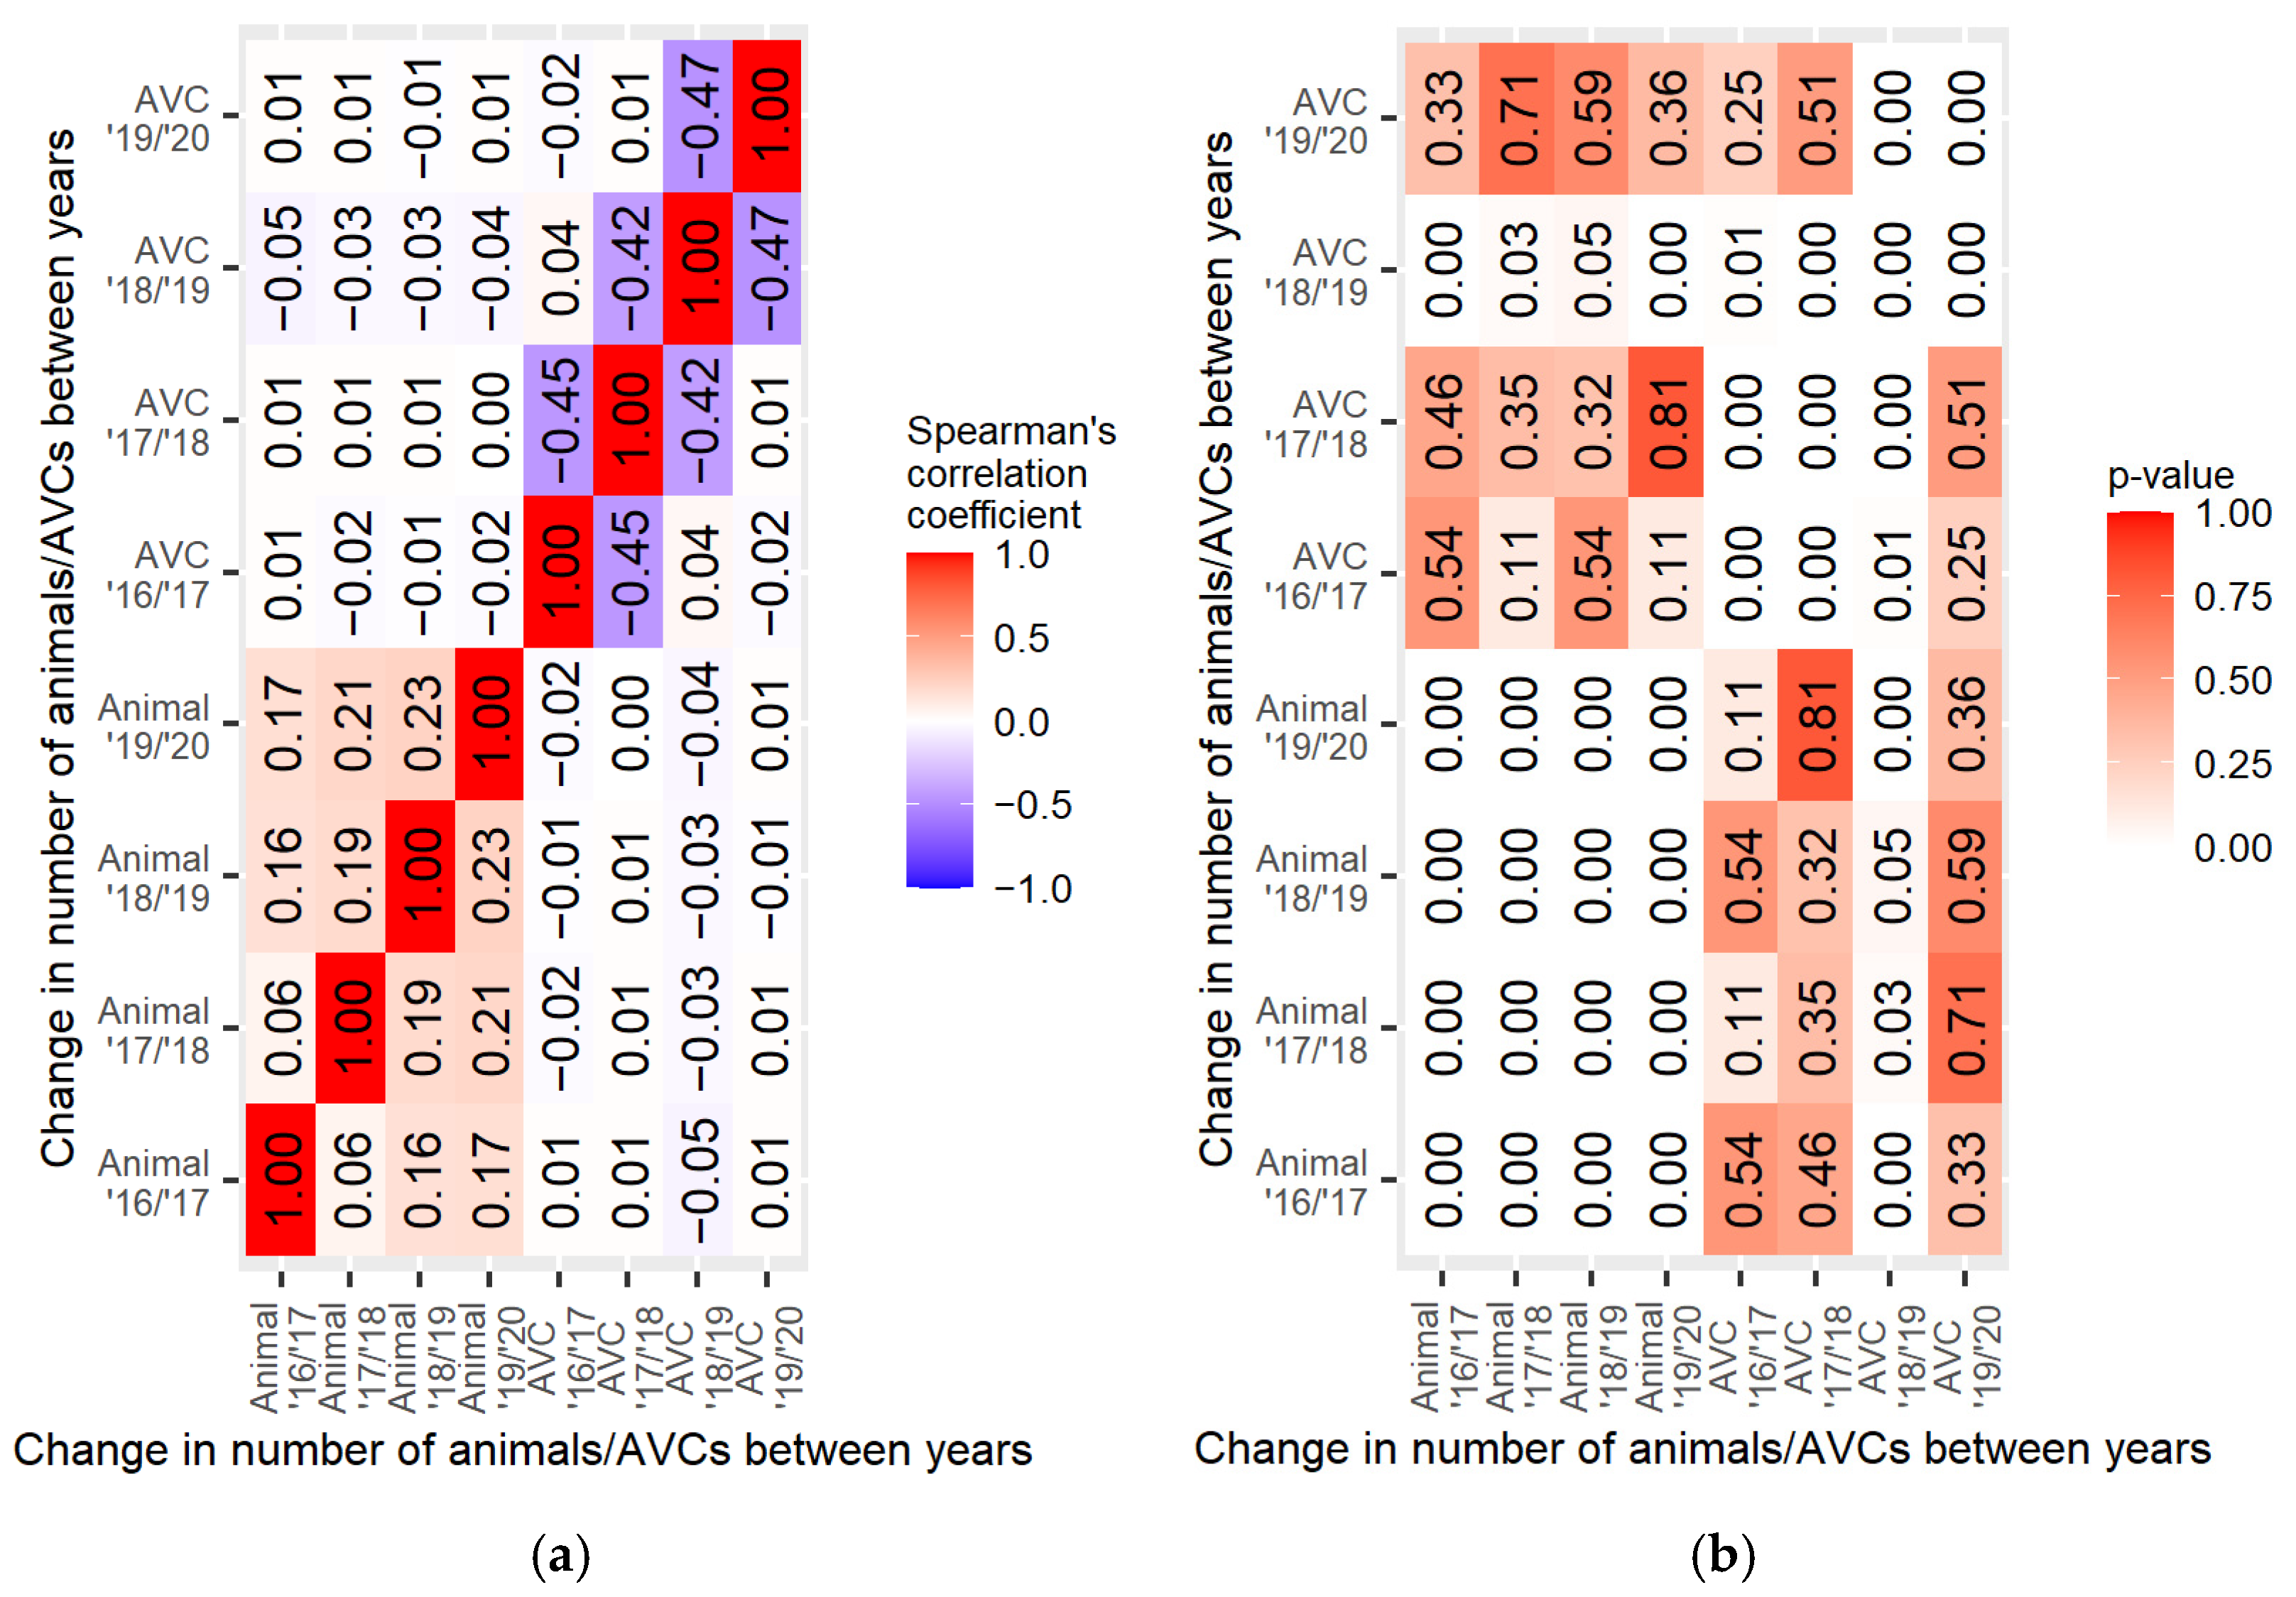
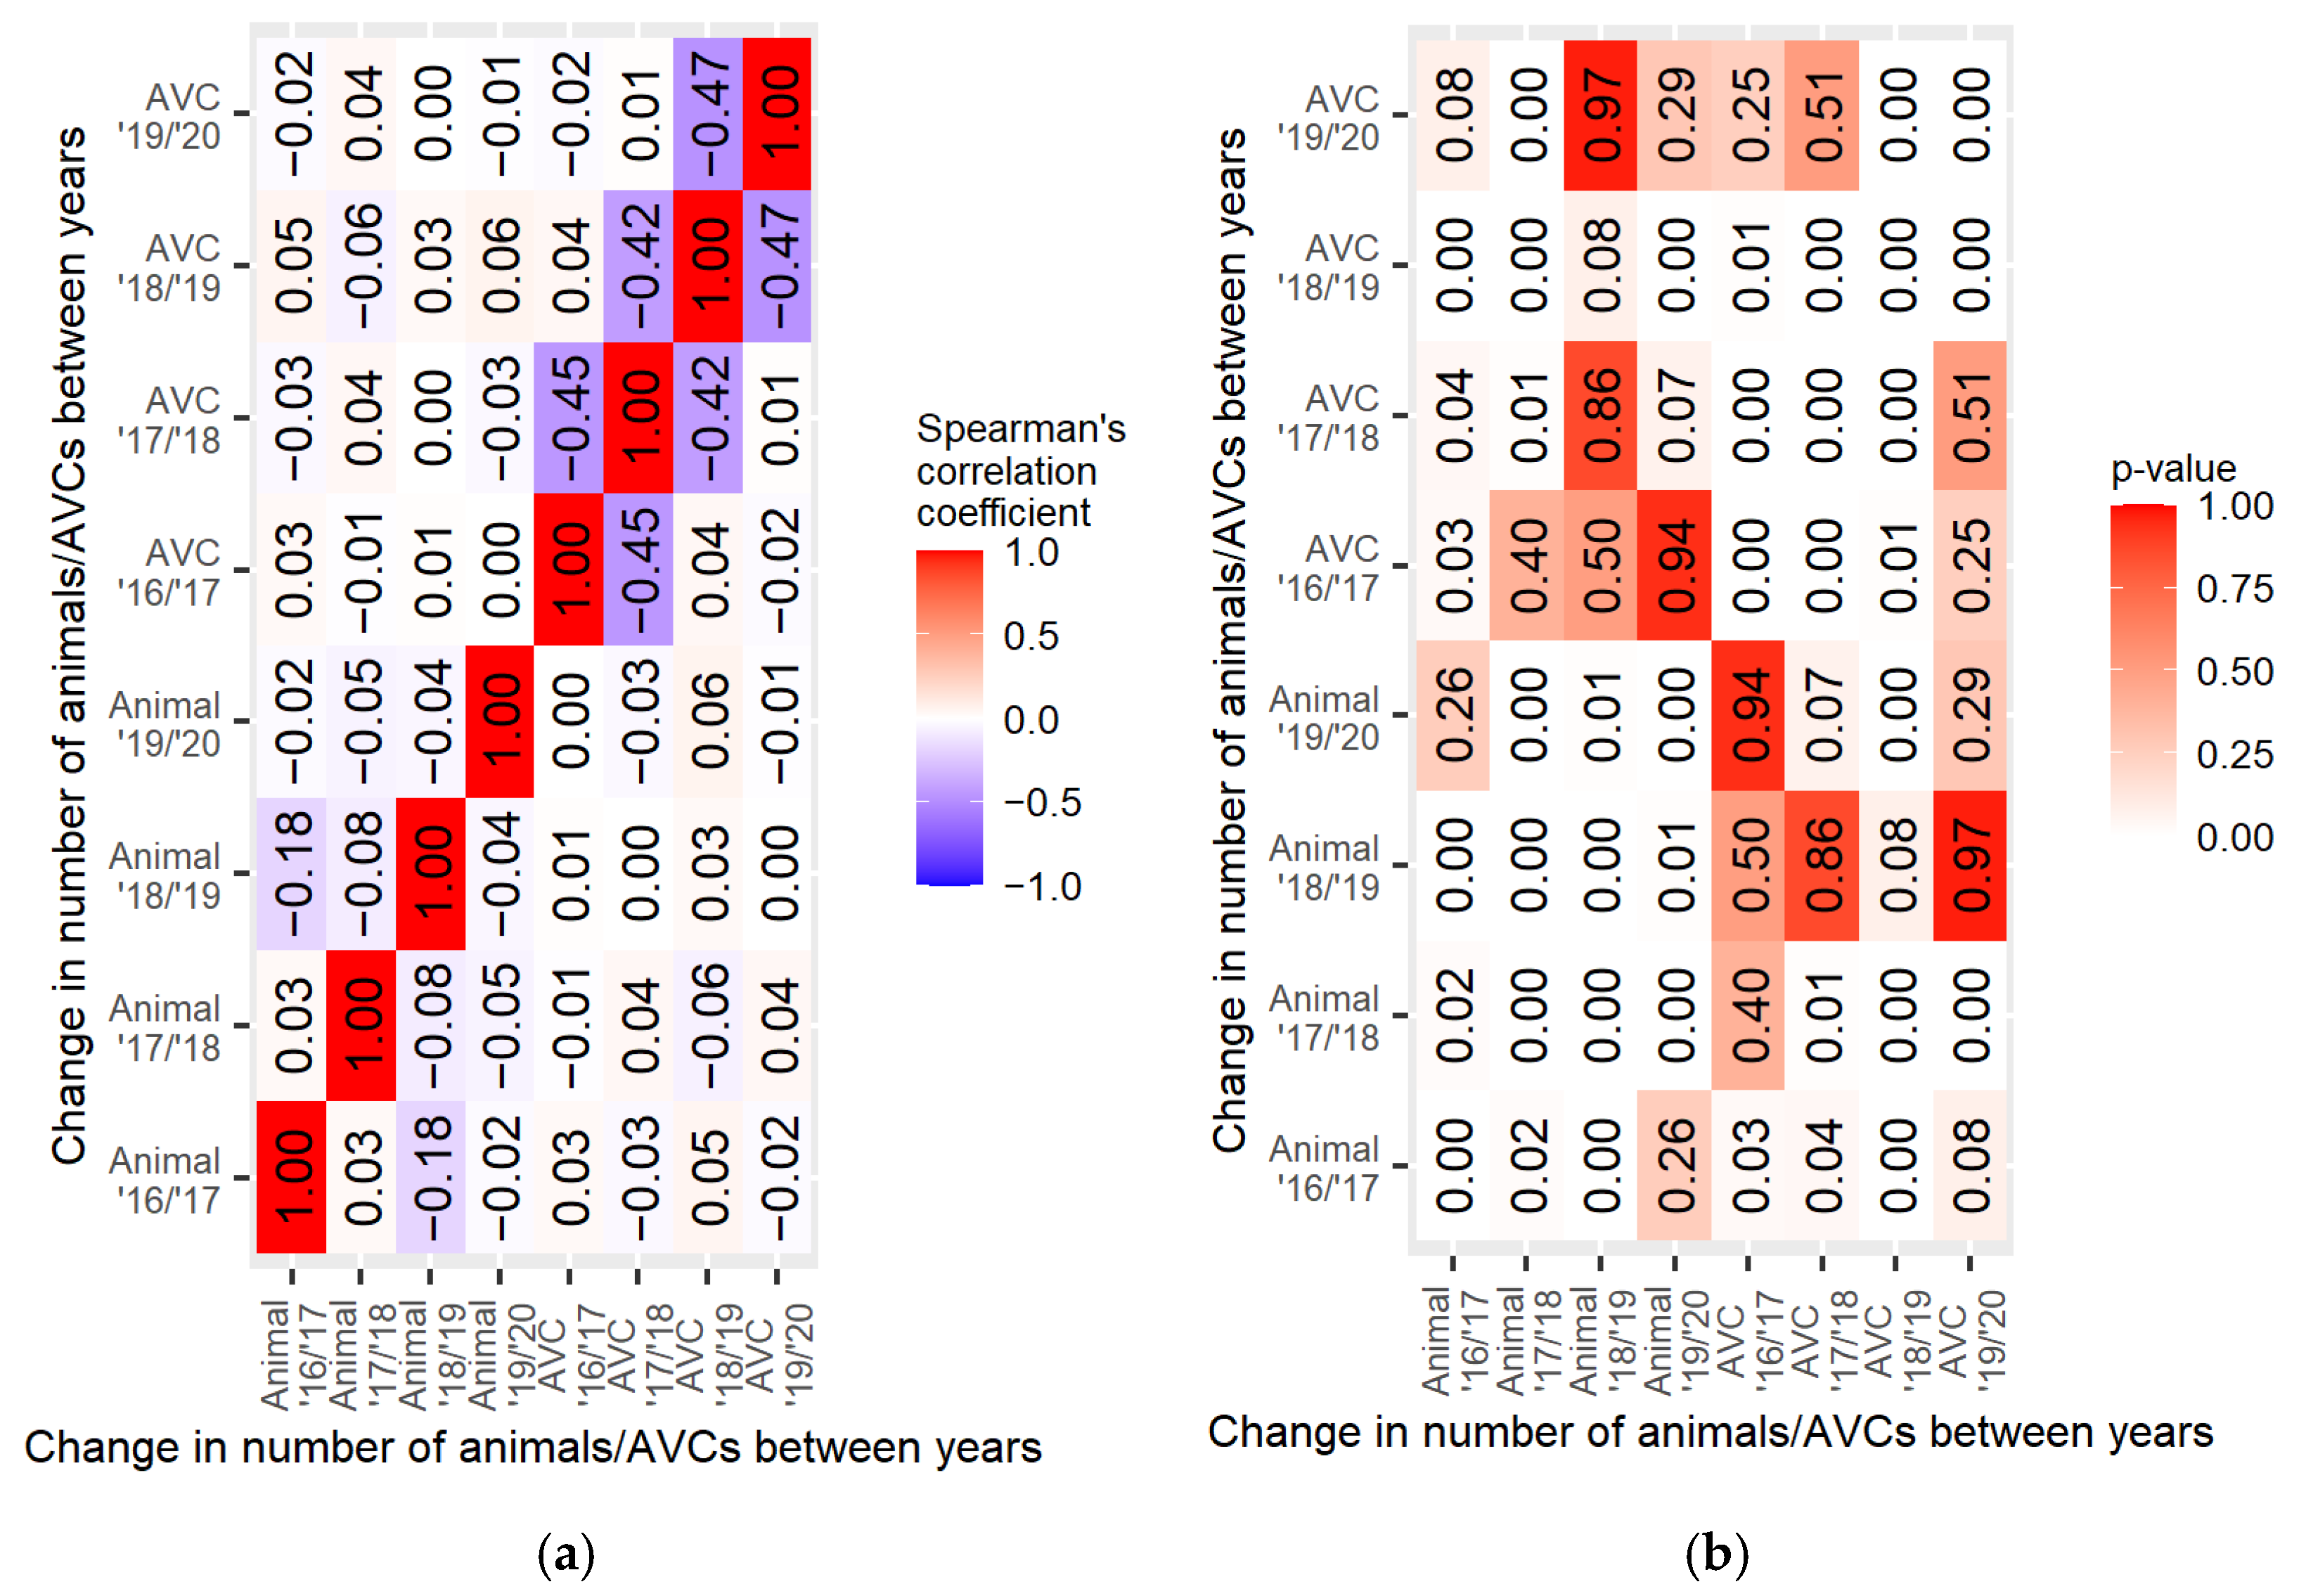
The analysis also included the impact of the changes in the species population sizes on the number of road crashes in a given hunting district. The results of the analysis were conducted for big game (moose, deer, sika deer, fallow roe deer, mouflon, and wild boar). The results were processed in the form of a correlation matrix and a correlation significance matrix. The example results for two species are presented as heatmaps of the correlation coefficients. Red indicates a positive correlation and blue indicates a negative correlation. Additionally, the significance of the correlation related to the size of the research sample was examined. A correlation significance calculation is also presented for each calculation as a heatmap. For a p-value above 0.05, the correlation is not statistically significant. For moose, the correlation matrix is shown in Figure 20a, and the correlation significance matrix is shown in Figure 20b. For wild boar, the correlation matrix is shown in Figure 21a, and the correlation significance matrix is shown in Figure 21b. The conclusions of the study are presented in Section 4.4.
4. Discussion
4.1. Temporal Analysis of Animal–Vehicle Crashes
An analysis of the timing of animal–vehicle crashes revealed interesting temporal patterns. The periods of increased frequencies of animal–vehicle crashes are late April and May, late July and August, and the autumn season (Figure 4). Temporal variability in the numbers of animal–vehicle crashes has also been observed in other studies. Regardless of the factors associated with the biological cycle of individual animal species, during these periods in Poland, there is increased traffic in recreational and environmentally attractive areas, associated with May Day trips (the first and third of May are public holidays in Poland) and changing holidays during school summer vacations (July and August).
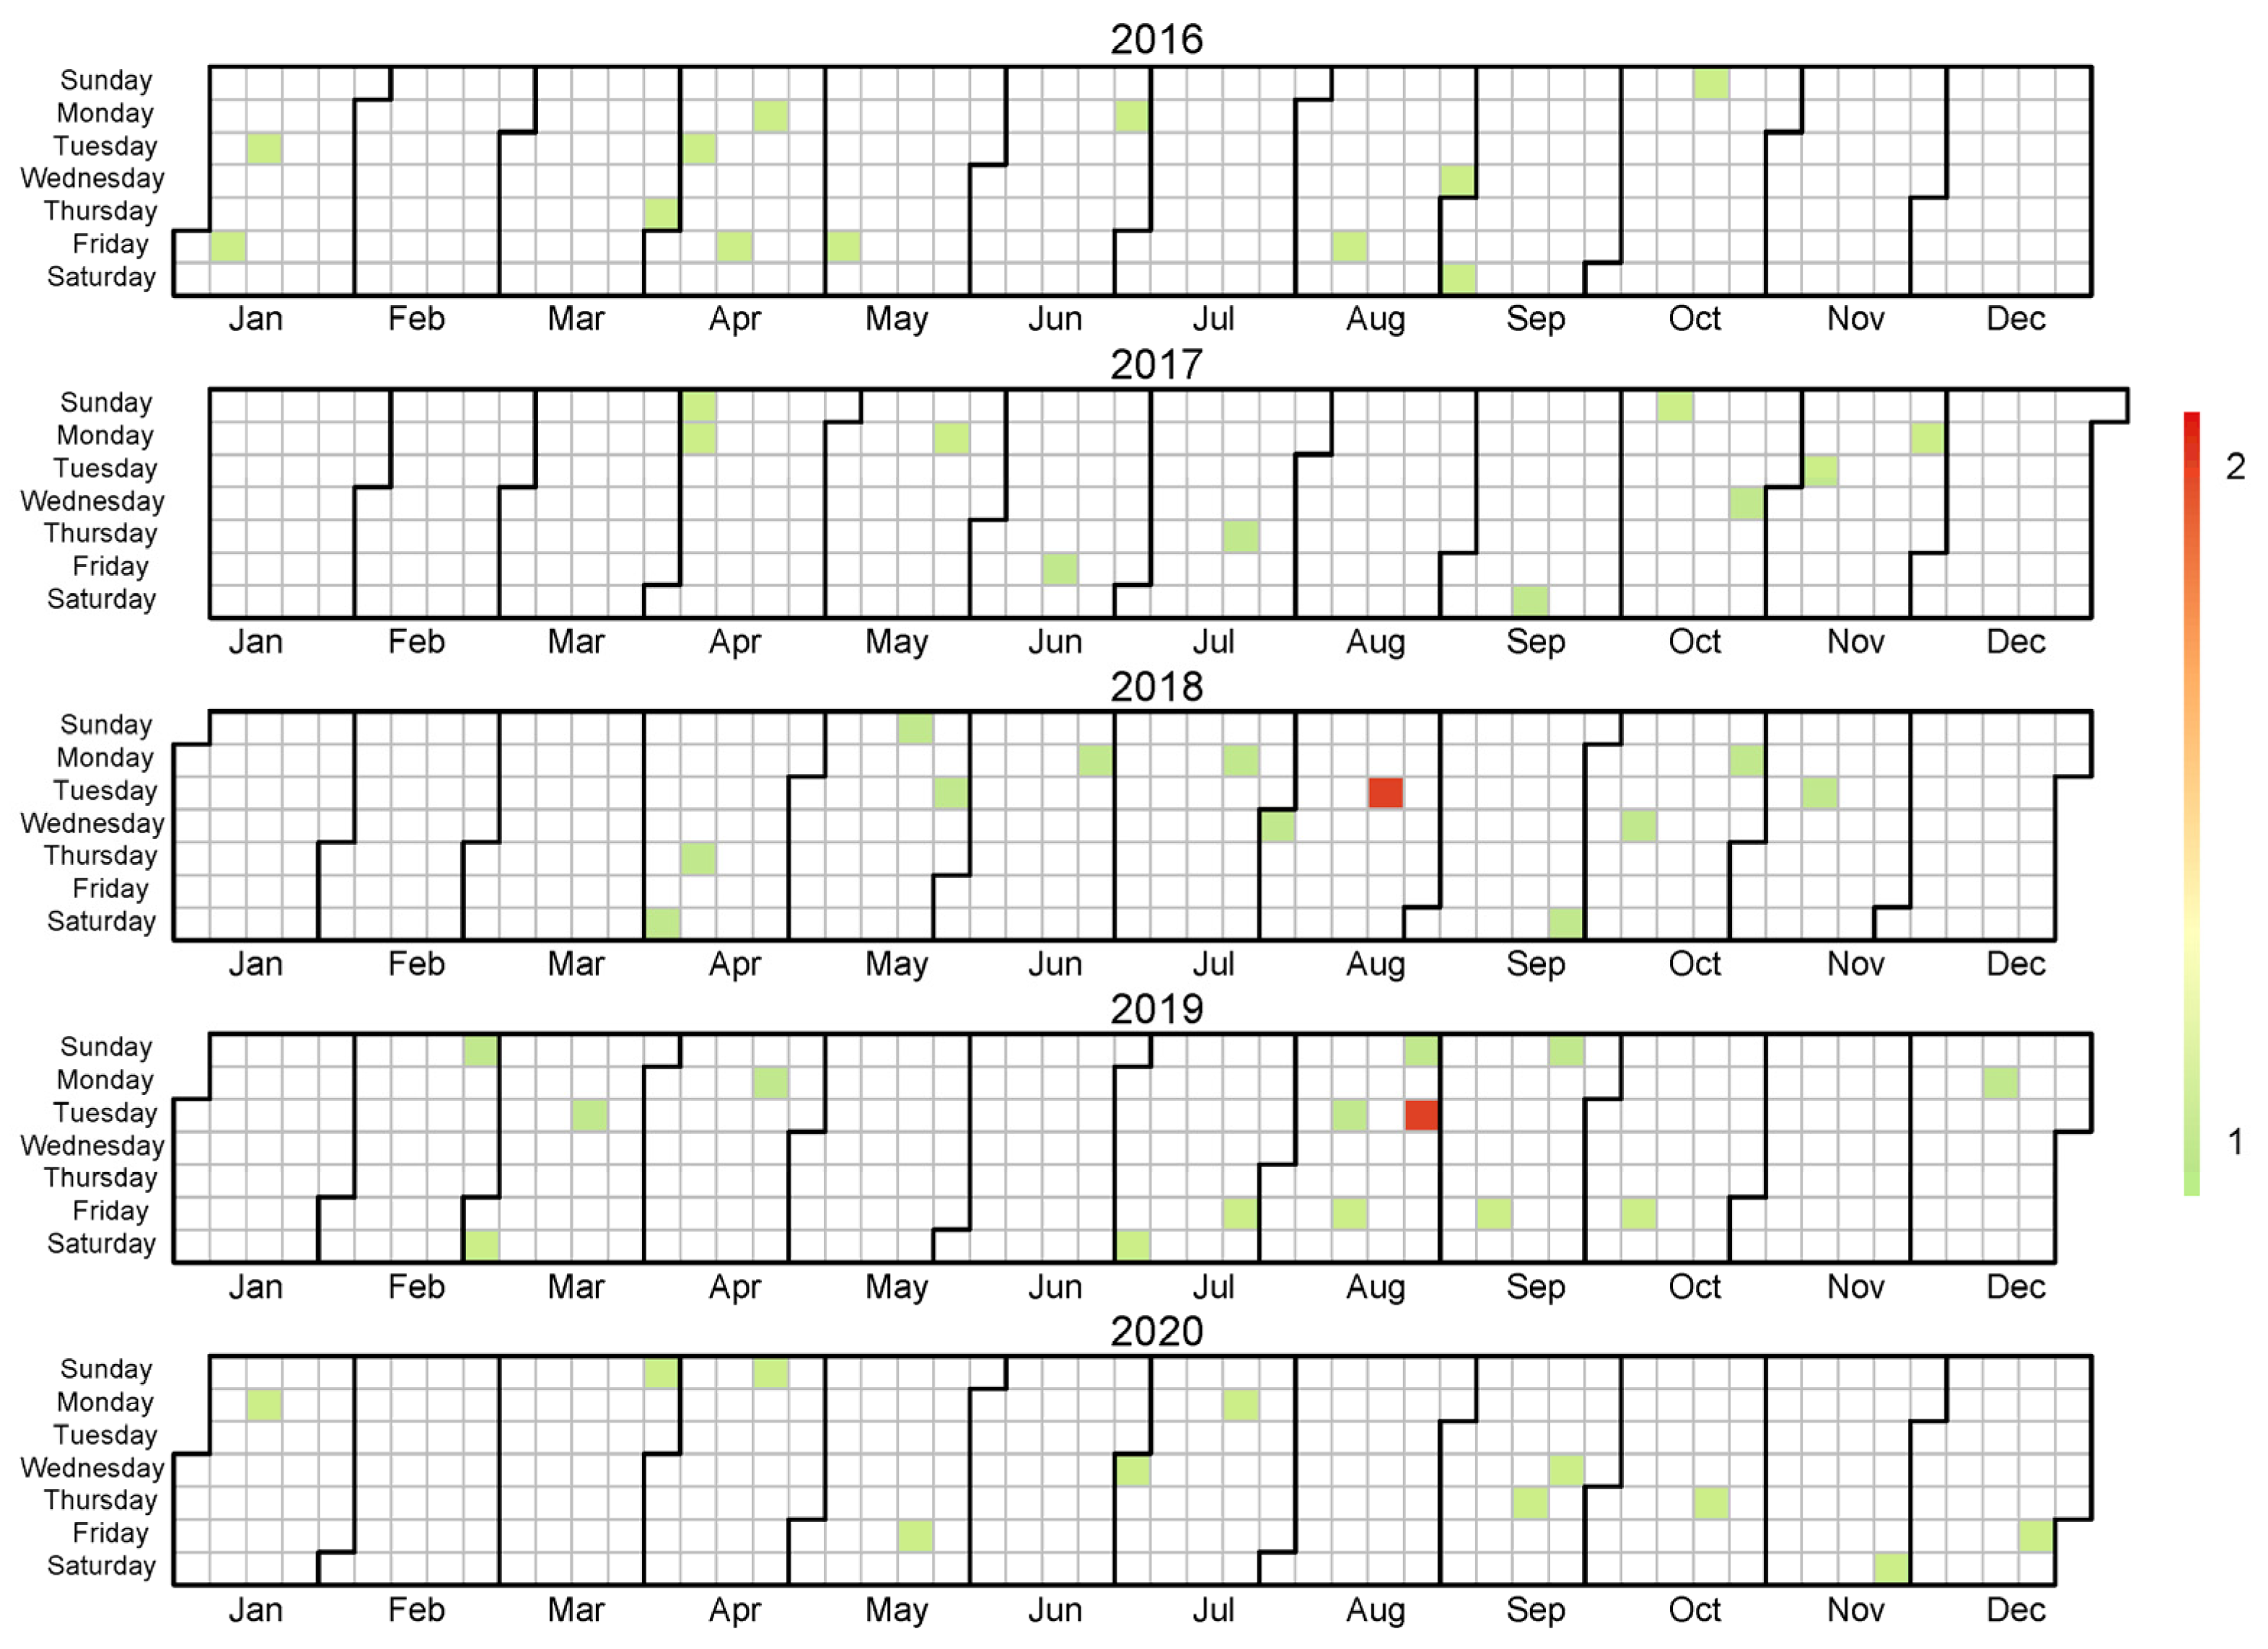
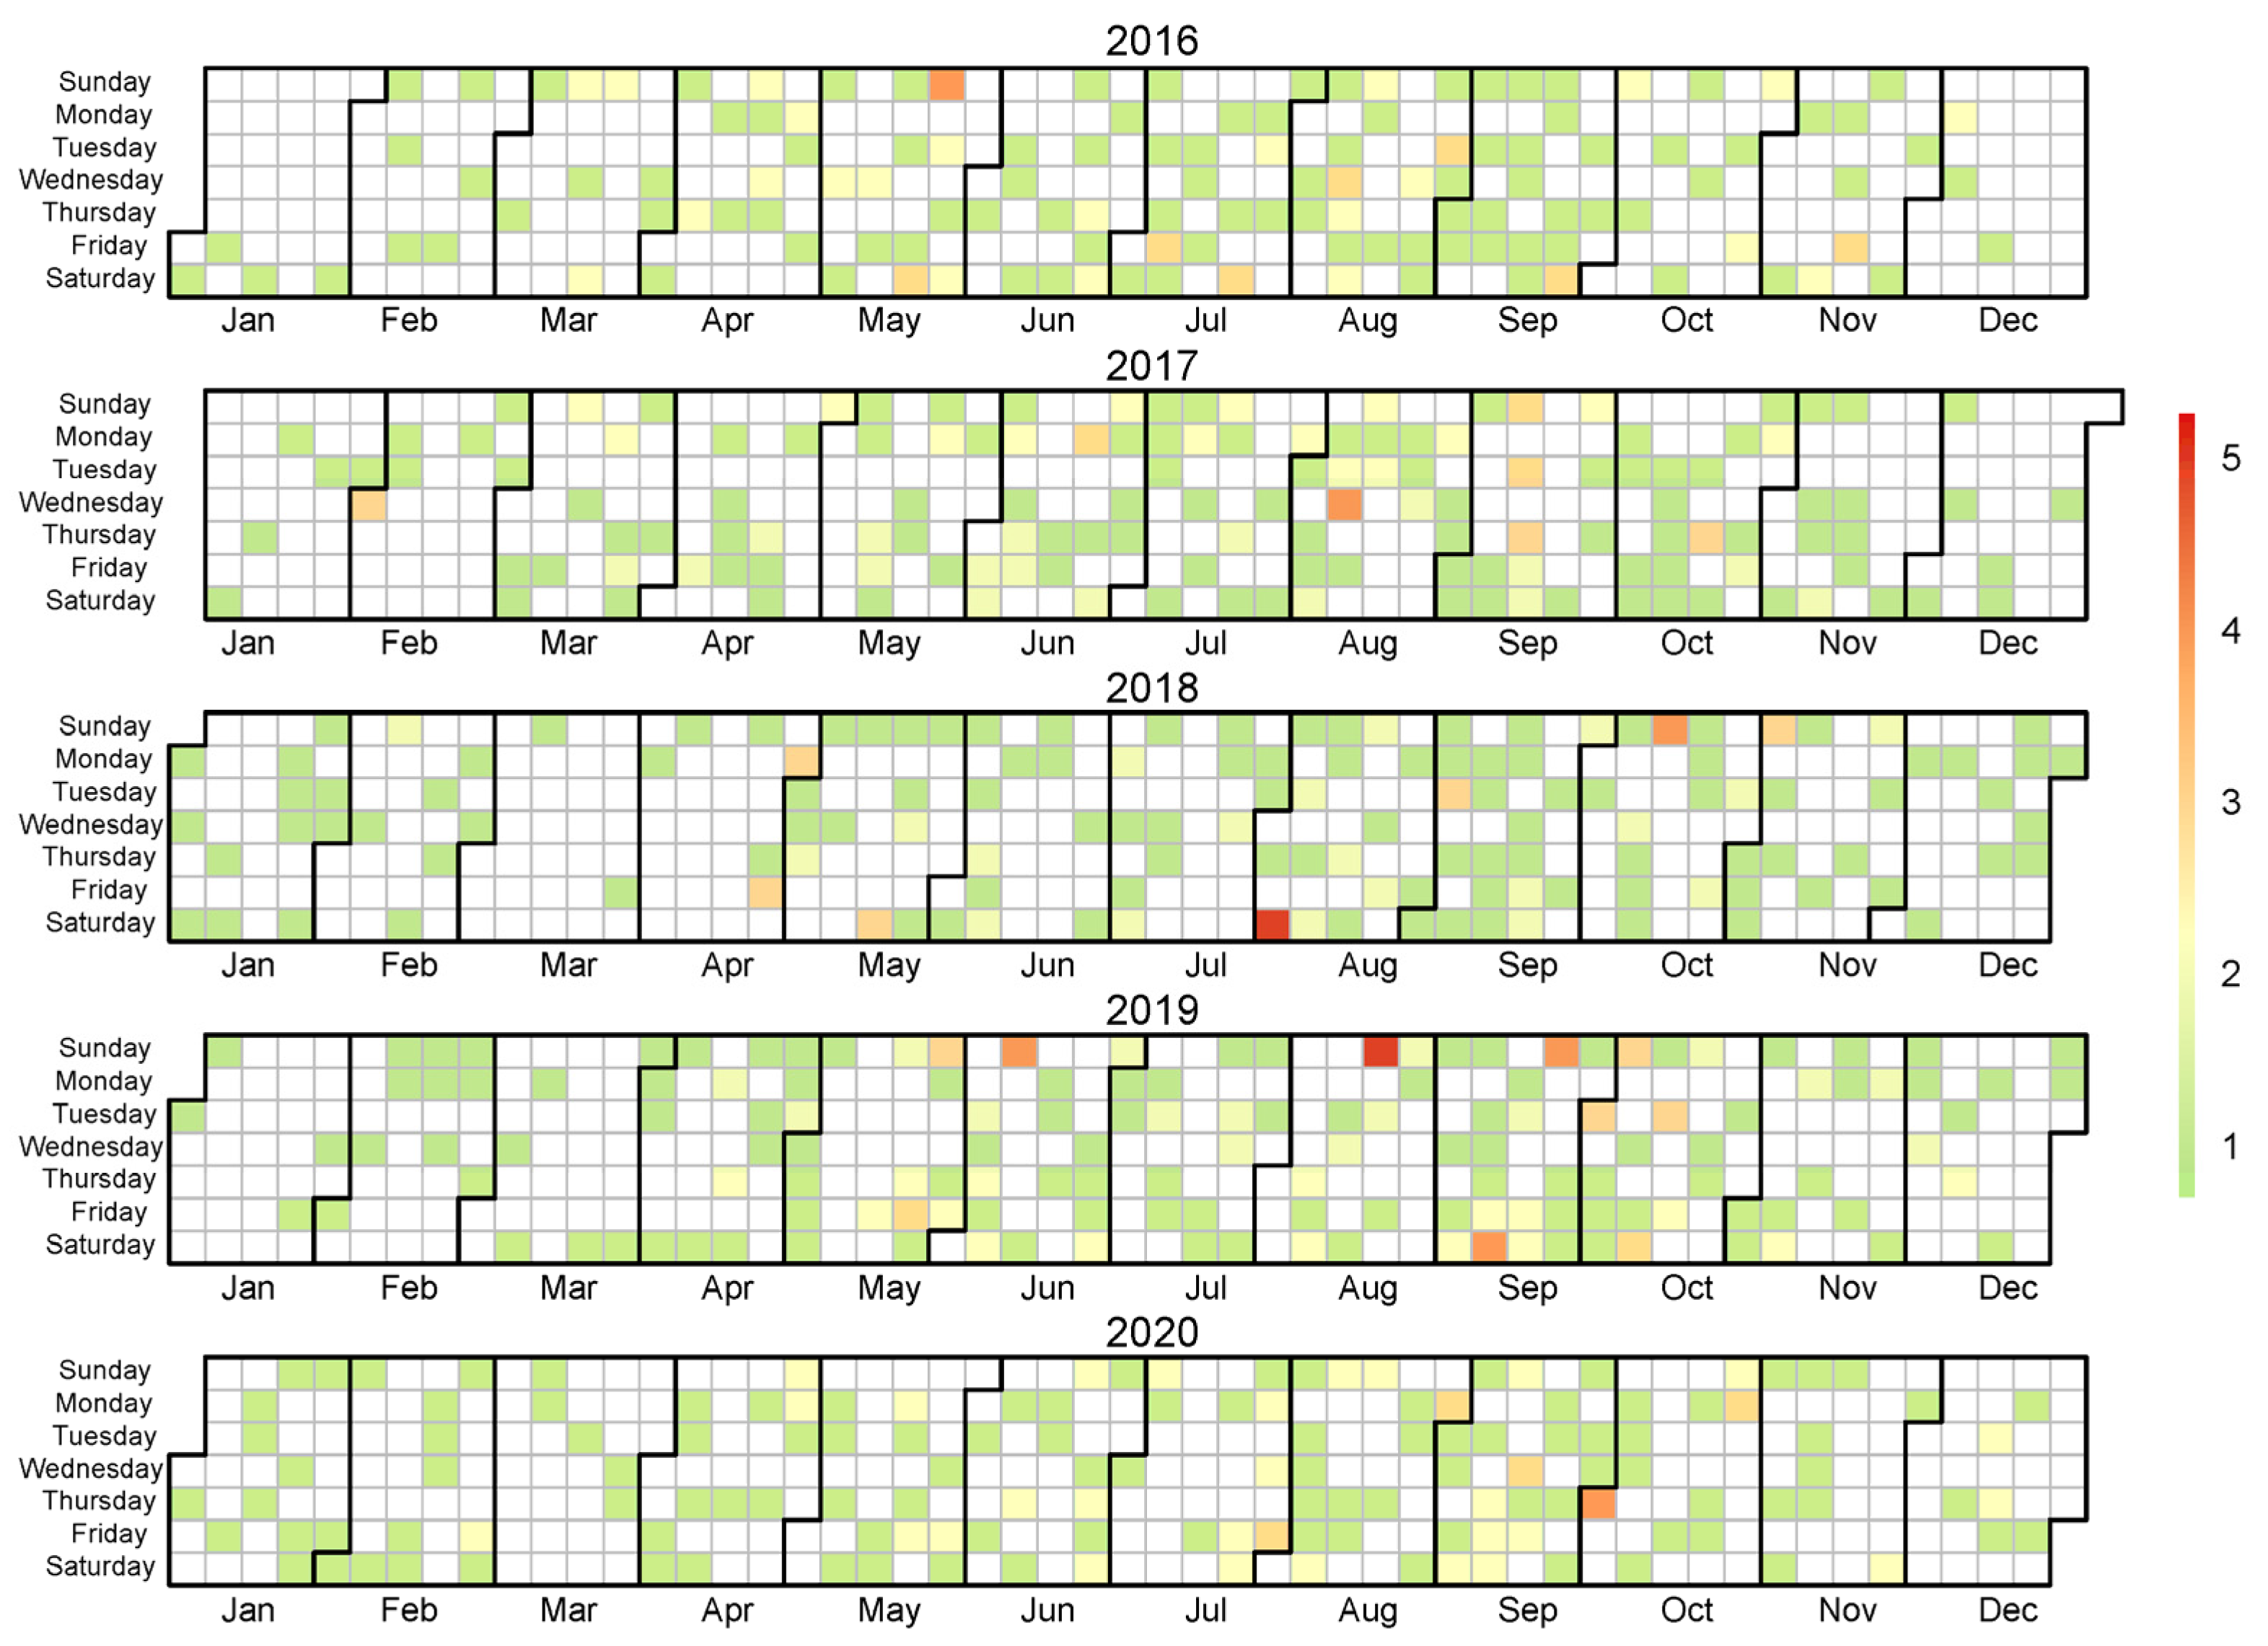
The timing of the increased numbers of animal–vehicle crashes is significantly different from the timing of road crashes overall (Figure 5). There is no reduction in the numbers of animal–vehicle crashes on Sundays and, to a lesser extent, on Saturdays. Similarly, the number of animal–vehicle crashes does not decrease on public holidays, including: New Year’s Day (01.01); Epiphany (06.01); Easter (movable holiday); Corpus Christi (movable feast); 1–3 May; the Polish Army Holiday (15.08); All Saints Day (01.11); Independence Day (11.11); and during the period from 24–31 December (Christmas). Moreover, during the lockdown in the initial period of the COVID-19 pandemic (March–April 2020), the overall number of road crashes decreased significantly, and no impacts were observed for the animal–vehicle crashes. This confirms the nonlinear dependence of the number of road crashes on the traffic volume [9,27]. However, there is no temporal pattern for crashes involving injuries and fatalities (Figure 6 and Figure 7). These crashes are random in nature, and their usefulness for analysing the occurrence of animal–vehicle crashes is low in general.
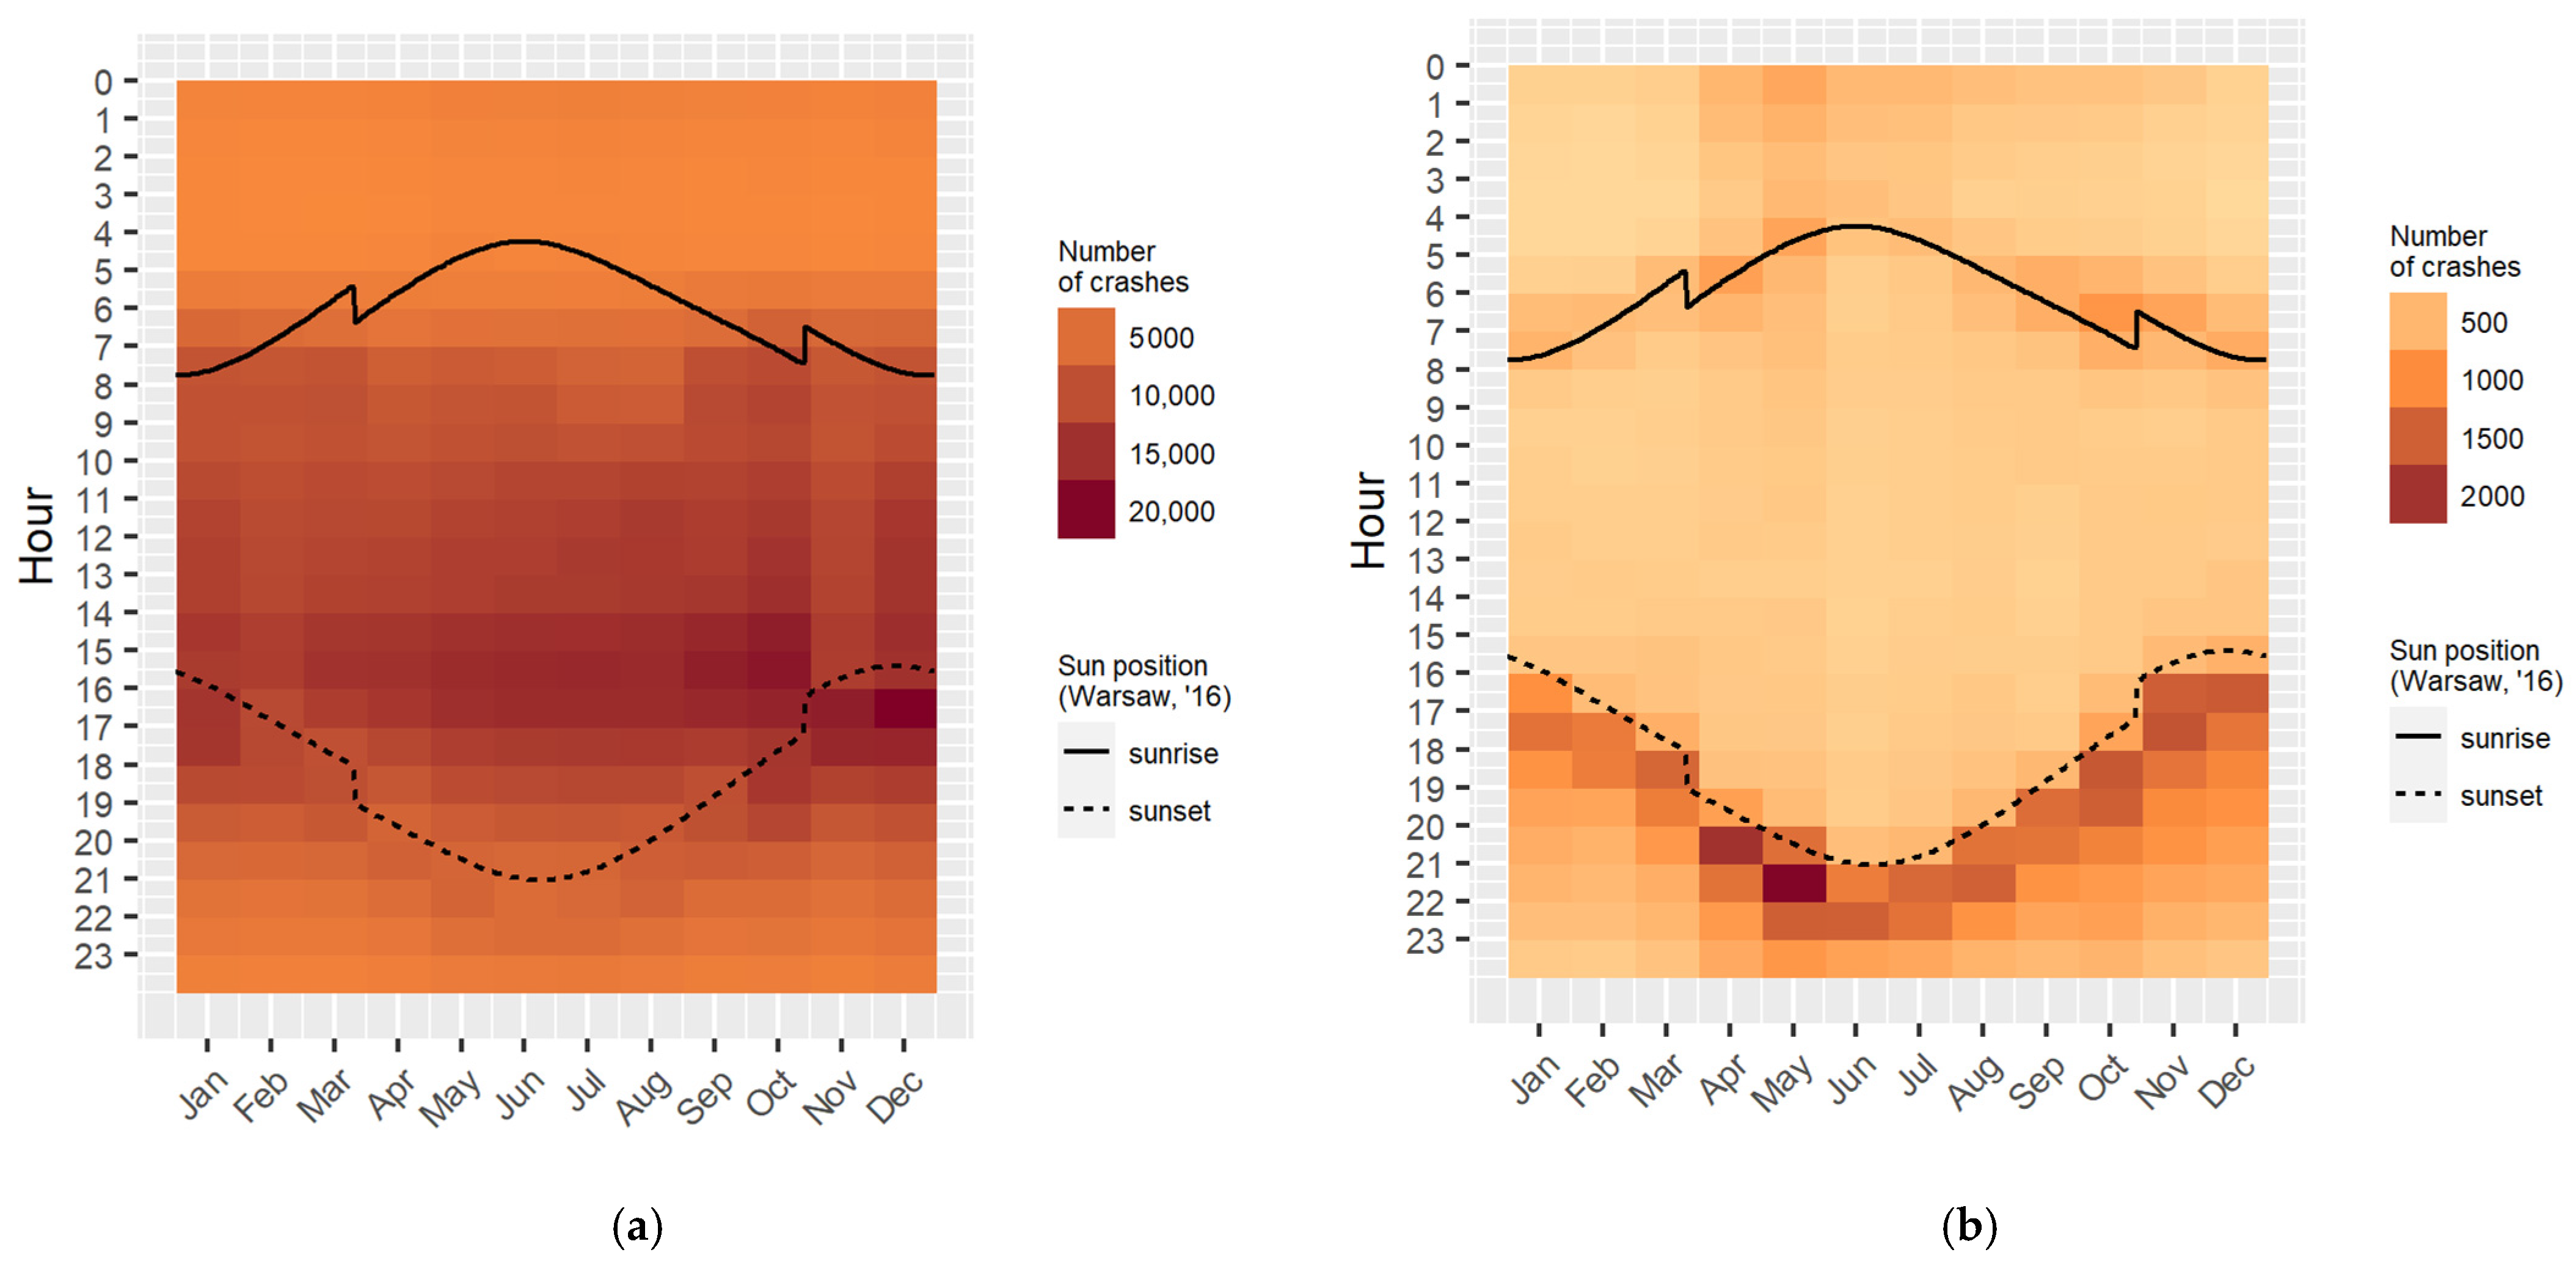
It should also be noted that there are significant differences between the temporal patterns of the numbers of crashes, depending on the times of the occurrences and the months of the crashes. For animals, the highest number of crashes occur after dusk, with an increased number of crashes occurring before dawn (Figure 8b). For simplicity, the sunrise and sunset times calculated for 2016, for Warsaw, were used in the analysis, and Daylight Saving Time was used. In contrast, for all crashes, the crash counts are similar, and they coincide with the hours of human activity (Figure 8a). There are fewer crashes during the morning peaks in July and August because of the reduced traffic (summer holidays).
A comparison of the results obtained with other studies shows that they are different from those of studies conducted in other countries, where the highest numbers of crashes occur in summer [30,31,32,51,87] or autumn [13,69]. Moreover, the studies of collisions with trains [79,80] show a different temporal pattern, with one peak in autumn and one in winter. In turn, the research [76] shows a variation in the temporal pattern depending on the road studied, and the research [72,75], depending on the species; although, in no case did it coincide with the research obtained in Poland. Moreover, wolf studies [40] show a different relationship between the number of crashes and the month. The dependence of the number of crashes on the time of day and month is similar to that in the Czech Republic [55,60], Lithuania [74], Spain (but only for wild boars) [38,54], and the United States [12], as well as to other studies conducted in Poland [28]. A similar temporal pattern of the monthly numbers of animal–vehicle crashes was obtained for deer in Utah (the United States) [39] and Poland [88], and for the total crashes in the study [14], which are based on older data than the studies in this article. In this study, there were peaks in May and in autumn. Turtle studies [42] do not cover the entire year, but it is possible to observe the occurrence of the highest numbers of crashes in May. By contrast, [53] shows the highest numbers of crashes in the autumn period, without the May peak.
4.2. Impact of Parameters of the Hunting District, and Its Category and Location
The research found that, contrary to popular belief, there were a higher number of field road crashes than forest road crashes (Figure 9, Table 2). For the district category, the distributions of the numbers of crashes per district are shifted towards more crashes for poor and very poor districts, which is also surprising (Figure 10, Table 3). There is a large variation in the distributions of the numbers of crashes, depending on the voivodeship (Figure 11). A large number of districts with large numbers of crashes are located in the Śląskie Voivodeship. A similar phenomenon, although on a smaller scale, can be observed in the Podkarpackie and Małopolskie Voivodeships. When analysing the hunting districts with the highest number of crashes, we noted that most of them are adjacent to large cities, or they cover the peripheral parts of cities (Figure 12). This phenomenon can be observed in the Silesian conurbation (Śląskie Voivodeship), in the vicinities of Kraków, Łódź, and Rzeszów. A more detailed analysis shows the occurrences of road crashes on the exit roads from cities (Figure 13a) and on roads connecting large cities located near one another (Figure 13b).
Comparing the results of the study with other results is difficult. Only one work, [88], deals with AVCs within large cities. The outskirts of large cities are the places of AVC concentration because of the high volumes of vehicle traffic and human activity. The other areas of concentration are in larger areas or nonurban areas. The studies covering larger areas often concern issues related to the timing of the AVCs [12,14]. The research concerning entire voivodeships [16] does not allow for ceasing the introduction of warning road signs. On the other hand, studies on the analysis of the places of events on a microscale [60,62,65] do not analyse the dependence of the influence of the hunting circuit parameters on road collisions.
4.3. Relationship between the Numbers of Crashes and the Wildlife Population Sizes
The study concludes that there was no relationship between the population sizes of particular game species in a given hunting district and the number of road crashes. The correlation was determined for five consecutive years, through which the influence of the animal population sizes in previous years on the number of crashes in the future was also analysed. This study was conducted on 18 animal species (7 big game species, and 11 small game species). However, a strong correlation was observed for the number of animal–vehicle crashes in total, and the number of animal–vehicle crashes in total in previous years. This correlation decreased with greater time intervals between the numbers of crashes analysed. The Spearman’s correlation coefficient was 0.72–0.76, and it then decreased, to a maximum of 0.69. When analysing with consideration to the district area (animal density and road crash density), as well as to the road network length (animal density and road crash density), the results are analogical, with a minimum correlation coefficient for crashes occurring four years earlier of 0.54. Of the variables analysed, the number of road crashes in previous years is the value most strongly associated with the number of road crashes. For crashes involving injuries and fatalities, the correlation turned out to be much weaker.
An attempt to describe the relationship between game population sizes using regression models did not yield positive results. For example, the model based on the sum of the crashes and the sum of the animals showed statistical significance (p-value < 2 × 10⁻¹⁶), but the coefficients were four orders of magnitude smaller than the intercept, resulting in a virtually constant function. The quality of the model was also low, with an R² coefficient of 0.015. Similar results were obtained for the analysis of big game only.
The thesis, often put forth by the attorneys of plaintiffs, that a site is at risk for crashes involving wildlife because of high wildlife numbers is, therefore, unfounded. However, the occurrences of animal–vehicle crashes in the previous periods should prompt the use of appropriate road signs to warn drivers, or other measures, in order to prevent animal–vehicle crashes.
An analysis of the Spearman’s correlation coefficients for the variables, namely, the total number of animal–vehicle crashes over five years and the area of the hunting district, the length of the roads up to the secondary category, and the length of the roads up to the tertiary category, according to [99], produced the following values, respectively: 0.299, 0.635, and 0.631. In each case, the correlation coefficient is statistically significant (p-value < 2 × 10⁻¹⁶). This means that the number of road crashes is strongly related to the lengths of the roads in the aforementioned categories.
The most important part of the study is the analysis of the impact of the numbers of animals on the occurrences of road crashes. Comparing different studies is difficult because of the differences in the authors’ approaches, the differences between countries, the scope of the analysed data, and the different methodologies. An analysis of the literature shows that the authors of this article were able to use detailed data, compared to other studies. In many studies, the authors use indirect measures, such as the number of hunted animals, and the data are aggregated for much larger areas. Thus, the conclusions drawn by other authors differ. The advantage of this study is that it covers almost the entire territory of Poland (excluding national parks and large cities), as well as a large number of AVCs (all crashes in the police database from 2016–2020). Many other articles cover smaller areas. However, the data in the police SEWiK database [5] does not contain information about the species of the killed or hit animals.
Other studies [47] have investigated the numbers of animals in an area in relation to the AADT. This is a much more general approach than the one presented in this article. The number of AVCs was found to be related to the distance of the road. Although formulated under different assumptions, this conclusion is consistent with the conclusion from our research. The authors of [46] show that the numbers of animals have a small effect on the number of AVCs. In [32], the numbers of deer were small, allowing them to freely choose their place of habitation. However, no correlation was found between the sites of the deer and the sites of the AVCs. On the other hand, [36] does not show the relationship with the numbers of game, but shows the relationship between the number of AVCs with moose, depending on the number of harvested moose. This relationship is significant and positive. Moreover, [33] shows a correlation between the number of observed moose and the number of AVCs with moose, but it refers to the area of the whole country (Finland). There is less correlation between the numbers of AVCs and injured persons. In our study, we did not find any significant correlation between the numbers of animals and the numbers of AVCs. On the other hand, the correlation was stronger for the total AVCs than for the AVCs with injuries. The authors of [91] show that, for most years, the coefficients in the regression model with regard to the presence of deer are statistically insignificant (confidence intervals covering the value, 0). This study was conducted with accuracy to the county. The numbers of hunted animals were also used to estimate the number of deer. The study by the authors of [30] is also based on data on moose harvesting, although it stipulates that this method of obtaining data on animal abundance is not perfect. The use of such data is burdened by a much greater methodological error than the data obtained in the survey of the annual game inventory made in Poland. A study on wolves [40] indicates that the amount of carrion influences their presence. However, this was not directly related to the number of AVCs. The studies presenting animal number statistics for the whole country [29] are much less accurate than our proposed methodology. The authors of [31] present different conclusions from the results of our research. Their study concerns only moose, and it finds a correlation between the density of the moose in the area and the number of AVCs with moose. The study is based on approx. 200 km of roads, and, thus, on a much smaller area than in our study. The areas in which moose were counted are not indicated, and the data on the crashes come from a different period than the data on the numbers of moose. The study [21] was conducted for one voivodeship. The territory of Poland is divided into 16 voivodeships. It includes an analysis of the numbers of deer and AVCs at the county level. This is a much larger area than the hunting districts analyzed in our study. The correlation between the number of deer and the number of AVCs was statistically significant, but only slightly positive. There was a greater correlation between the number of AVCs and the number of registered vehicles.
Our study, because it uses a different methodology, cannot be directly compared with the microscale studies [78], which include the features of the road traffic [55,56,57] and of the environment around the road [59,60,61,62,67,68,69], as well as the geometric features of the road [65,66]. It is also impossible to compare our studies with the studies based on the numbers of carcasses of animals found on roads, e.g., [43,59,72]. Moreover, an analysis of [88] does not allow for comparisons. Although the title uses the words, “density of mammals”, in the article, there is no data on the numbers of the game.
4.4. Impact of Changes in the Animal Population Sizes
As in the case of the population sizes of the big game species, no relationship was found between the changes in the game population sizes and the change in the numbers of road crashes in a given hunting district (Figure 20 and Figure 21). However, a moderate negative correlation was observed for the changes in the numbers of crashes in the following years. A decrease in the number of crashes in a given year results, to some extent, in an increase in the number of crashes in the following year, and vice versa.
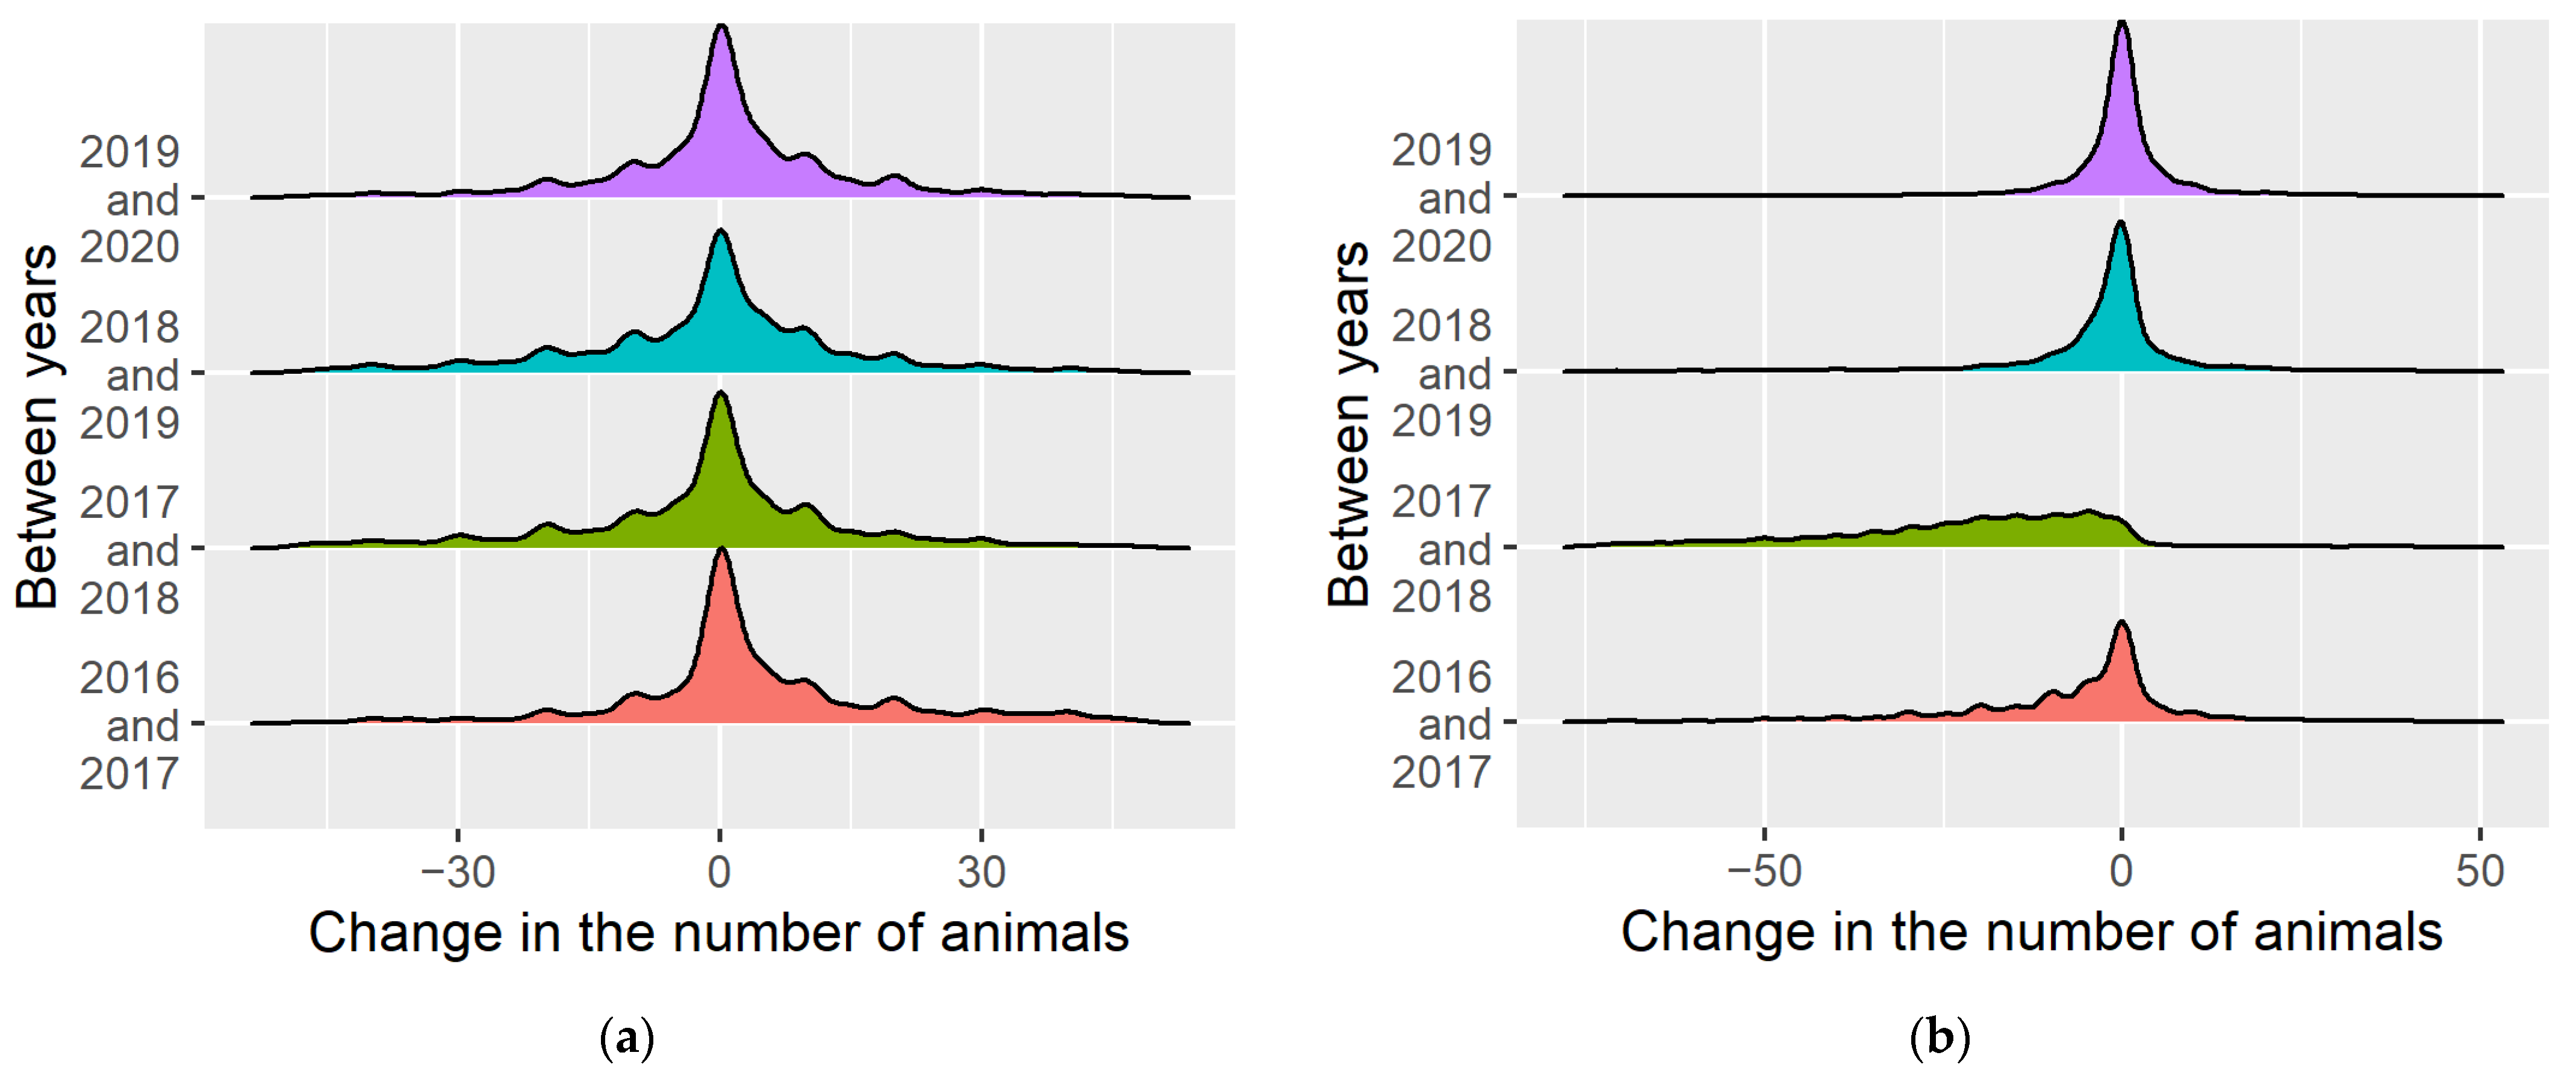
The analysis of the changes in the population sizes of animals shows that, in most cases, the numbers of inventoried animals do not change significantly (Figure 22). The distributions of the changes in the numbers of animals are symmetrical to 0. For wild boar, there is a shift towards negative values in 2016–2017 and 2017–2018, which was caused by the African Swine Fever (ASF) outbreak.
The authors did not find any studies on the effect of changes in the game abundance on the number of AVCs. The literature discussed in Section 4.3, concerning the size of the game population, applies to this issue.
5. Conclusions
The research that was conducted answers the basic question, and it indicates that there is no direct relationship between the population sizes of particular game species in a given area and the number of road crashes. A good indicator to predict the number of animal–vehicle crashes in a given hunting district are the numbers of animal–vehicle crashes in the previous years. Using the previous year’s data is the best method. With greater time distance, the correlation coefficient decreases. There is also no impact of the changes in the game numbers on the changes in the numbers of crashes.
Animal–vehicle crashes have a very different temporal pattern than general road crashes. From the point of view of drivers, it is important to note that the highest number of these crashes occur at dawn and dusk. People should exercise extreme caution and they should reduce their speeds in AVC-prone areas during this period. What is important for the road authority, on the other hand, is that a particularly large number of these crashes occur in April/May, in July/August, and in the autumn. Using the results of the current year’s game inventory (conducted by March 10) to verify road signing prior to the first of these periods may be difficult because of the short time interval, but it is recommended that such an analysis be conducted prior to the holiday period.
The problem of the underreporting of road crashes constitutes one of the limitations of the study. Often, participants flee the scene, leaving a dead animal on the road (or taking it with them). The accuracy of the crash locations in the SEWiK database is also a problem. Further work in this area is recommended. Similarly, there is a lack of data on specific animal species in the police database, which makes it difficult to find more detailed relationships between the animal population sizes of particular species and the road crashes involving that species. Another problem concerns the detail of the game population size data. In the data provided by the Forest Data Bank, data for some hunting districts are missing. However, there are no more accurate and reliable data covering the whole territory of Poland.
The impact of transport on the natural environment has not been sufficiently studied yet. Understanding this phenomenon will help to reduce this impact. While in the case of road noise [106] or pollutant emissions [107], there is only a negative impact on the surroundings, in the case of animal–vehicle crashes, the negative impact is two-sided. Road users also feel the effects of such incidents. An interesting issue may also be the study of animal detection by autonomous vehicles [108]. Further research related to the search for the factors influencing the occurrence of road crashes is recommended. These studies should be conducted separately for each country because of the differences in the animal species present in each country, as well as the differences in land use, forest cover, and relief.
Author Contributions
Conceptualisation, T.K.; data curation, T.K. and P.C.; formal analysis T.K. and K.F.; investigation T.K. and K.F.; methodology, T.K.; software, T.K. and P.C.; resources, K.F.; visualization, T.K. and. K.F.; writing—original draft, T.K. and K.F.; writing—review and editing, T.K. and K.F. All authors have read and agreed to the published version of the manuscript.
Funding
This research was co-funded by the Scientific Council of the discipline Civil Engineering & Transportation at Warsaw University of Technology.
Institutional Review Board Statement
Not applicable.
Informed Consent Statement
Not applicable.
Data Availability Statement
Not applicable.
Acknowledgments
The authors would like to thank Kampinos National Park and the City Forests of the capital city of Warsaw for the provided materials related to game numbers and animal–vehicle crashes. Thanks also to the Road Traffic Office of the Police Headquarters for providing data from the SEWiK database.
Conflicts of Interest
The authors declare no conflict of interest.
References
- Kieć, M.; Ambros, J.; Bąk, R.; Gogolín, O. Evaluation of Safety Effect of Turbo-Roundabout Lane Dividers Using Floating Car Data and Video Observation. Accid. Anal. Prev. 2019, 125, 302–310. [Google Scholar] [CrossRef] [PubMed]
- Ostrowski, K.; Tracz, M. Availability and Reliability of a Signalised Lane. Transp. B Transp. Dyn. 2019, 7, 1044–1061. [Google Scholar] [CrossRef]
- Bąk, R.; Chodur, J.; Stamatiadis, N. Type II Dilemma Zone at High-Speed Signalized Intersections in Poland. Arch. Civ. Eng. 2021, 67, 673–685. [Google Scholar]
- Ostrowski, K.; Budzynski, M. Measures of Functional Reliability of Two-Lane Highways. Energies 2021, 14, 4577. [Google Scholar] [CrossRef]
- SEWiK. System Ewidencji Wypadków i Kolizji [Accident and Collision Record System]. 2021. Available online: http://sewik.pl/ (accessed on 1 September 2021).
- Rodzaje Dróg w Polsce—Ministerstwo Infrastruktury—Portal Gov.pl. Available online: https://www.gov.pl/web/infrastruktura/rodzaje-drog-w-polsce (accessed on 5 November 2021).
- Rozporządzenie Ministra Infrastruktury z Dnia 3 Lipca 2003 r. w Sprawie Szczegółowych Warunków Technicznych dla Znaków i Sygnałów Drogowych Oraz Urządzeń Bezpieczeństwa Ruchu Drogowego i Warunków ich Umieszczania na Drogach (Dz.U. 220 poz. 2181 z 2003 r.). Available online: https://dziennikustaw.gov.pl/du/2003/s/220/2181 (accessed on 1 September 2021).
- Krukowicz, T. Problematyka oznakowania dróg znakiem ostrzegawczym A-18b “zwierzęta dzikie”. Drogownictwo 2020, 9, 242–249. [Google Scholar]
- Seiler, A. Ecological Effects of Roads: A Review; Introductory Research Essay; SLU Department of Conservation Biology: Uppsala, Sweden, 2000; pp. 1–40. [Google Scholar]
- Coffin, A. From Roadkill to Road Ecology: A Review of the Ecological Effects of Roads. J. Transp. Geogr. 2007, 15, 396–406. [Google Scholar] [CrossRef]
- Pless, I. Collisions with Animals. Lancet 1996, 348, 492. [Google Scholar] [CrossRef]
- Sullivan, J.M. Trends and Characteristics of Animal-Vehicle Collisions in the United States. J. Saf. Res. 2011, 42, 9–16. [Google Scholar] [CrossRef]
- Wildlife-Vehicle Collision Reduction Study: Report to Congress, August 2008—FHWA-HRT-08-034. Available online: https://www.fhwa.dot.gov/publications/research/safety/08034/08034.pdf (accessed on 5 July 2021).
- Czerniak, A.; Tyburski, L. Zdarzenia drogowe z udziałem zwierzyny. Infrastrukt. Ekol. Teren. Wiej. 2011, 2, 275–283. [Google Scholar]
- Rowden, P.; Steinhardt, D.; Sheehan, M. Road Crashes Involving Animals in Australia. Accid. Anal. Prev. 2008, 40, 1865–1871. [Google Scholar] [CrossRef] [Green Version]
- Tereszkiewicz, K.; Choroszy, K. Analiza zdarzeń drogowych z udziałem zwierząt w Polsce w latach 2006–2015. Autobusy Tech. Eksploat. Syst. Transp. 2016, 17, 467–473. [Google Scholar]
- Sergeyevna, I.Y. Improving the System of Environmental Protection on the Moose Migration Paths (Case Study, Leningradskaya Oblast). Available online: https://dspace.spbu.ru/bitstream/11701/7523/1/VKR_Katya_Irxina.pdf (accessed on 3 November 2021).
- Bukała, B.; Tereszkiewicz, K. Kolizje drogowe z udziałem zwierząt na głównych szlakach drogowych w aspekcie natężenia ruchu drogowego w województwie podkarpackim. Autobusy Tech. Eksploat. Syst. Transp. 2013, 14, 1543–1554. [Google Scholar]
- Trofimenko, Y.V. Measures to reduce the number of hazardous areas and increase the attractiveness of toll roads when they are laid on the migration routes of wild animals. In Proceedings of the III Mezhregional’naya Konferentsiya “Bezopasnaya Doroga. Proyektirovaniye, Stroitel’stvo, Ekspluatatsiya i Servis”, Kaluga, Russia, 4–6 April 2018. (In Russian). [Google Scholar]
- Bukała, B.; Tereszkiewicz, K. Zdarzenia z udziałem zwierząt na drogach województwa podkarpackiego, ich skutki i możliwości ograniczania. Logistyka 2014, 6, 2467–2474. [Google Scholar]
- Tajchman, K.; Gawryluk, A.; Leszek, D.; Czyżowski, P.; Karpiński, M.; Goleman, M. Deer-Vehicle Collisions in Lubelskie Region in Poland. Safety Coefficients. Appl. Ecol. Environ. Res. 2017, 15, 1485–1498. [Google Scholar] [CrossRef]
- Available online: http://geoportal.gov.pl (accessed on 5 November 2021).
- Szczęsny, P.; Orlicz-Szczęsna, G. Identyfikacja wypadków drogowych z udziałem zwierząt na terenie Polski. Logistyka 2014, 6, 10289. [Google Scholar]
- Tyburski, L.; Czerniak, A. Zdarzenia drogowe z udziałem zwierzyny w Polsce w latach 2001–2011. Infrastrukt. Ekol. Teren. Wiej. 2013, 3, 5–13. [Google Scholar]
- Vanlaar, W.G.M.; Barrett, H.; Hing, M.M.; Brown, S.W.; Robertson, R.D. Canadian Wildlife-Vehicle Collisions: An Examination of Knowledge and Behavior for Collision Prevention. J. Saf. Res. 2019, 68, 181–186. [Google Scholar] [CrossRef]
- Smits, R.; Bohatkiewicz, J.; Haługa, M. Badania wpływu urządzeń ekoinfrastruktury dla zwierząt dziko żyjących na bezpieczeństwo ruchu drogowego. In Proceedings of the VI Krakowskie Dni BRD 2019, Kraków, Poland, 14–15 February 2019. [Google Scholar]
- Smits, R.; Bohatkiewicz, J.; Bohatkiewicz, J.; Hałucha, M. A Geospatial Multi-Scale Level Analysis of the Distribution of Animal-Vehicle Collisions on Polish Highways and National Roads. In Proceedings of the Vision Zero for Sustainable Road Safety in Baltic Sea Region, Vilnius, Lithuania, 5–6 December 2018; Varhelyi, A., Žuraulis, V., Prentkovskis, O., Eds.; Springer International Publishing: Cham, Switzerland, 2018; pp. 74–84. [Google Scholar]
- Borowik, T.; Ratkiewicz, M.; Maślanko, W.; Kowalczyk, R.; Duda, N.; Żmihorski, M. Temporal Pattern of Moose-Vehicle Collisions. Transp. Res. Part D Transp. Environ. 2021, 92, 102715. [Google Scholar] [CrossRef]
- Clark, D.E.; Fulton, G.; Ontengco, J.B.; Lachance, T.; Sutton, J.E. Moose–Motor Vehicle Collision: A Continuing Hazard in Northern New England. J. Am. Coll. Surg. 2019, 228, 941–947. [Google Scholar] [CrossRef]
- Danks, Z.D.; Porter, W.F. Temporal, Spatial, and Landscape Habitat Characteristics of Moose-Vehicle Collisions in Western Maine. J. Wildl. Manag. 2010, 74, 1229–1241. [Google Scholar] [CrossRef]
- Dussault, C.; Poulin, M.; Courtois, R.; Ouellet, J.-P. Temporal and Spatial Distribution of Moose-Vehicle Accidents in the Laurentides Wildlife Reserve, Quebec, Canada. Wildl. Biol. 2006, 12, 415–425. [Google Scholar] [CrossRef] [Green Version]
- Laliberté, J.; St-Laurent, M.-H. In the Wrong Place at the Wrong Time: Moose and Deer Movement Patterns Influence Wildlife-Vehicle Collision Risk. Accid. Anal. Prev. 2020, 135, 105365. [Google Scholar] [CrossRef] [PubMed]
- Niemi, M.; Rolandsen, C.M.; Neumann, W.; Kukko, T.; Tiilikainen, R.; Pusenius, J.; Solberg, E.J.; Ericsson, G. Temporal Patterns of Moose-Vehicle Collisions with and without Personal Injuries. Accid. Anal. Prev. 2017, 98, 167–173. [Google Scholar] [CrossRef] [PubMed] [Green Version]
- Pynn, T.P.; Pynn, B.R. Moose and Other Large Animal Wildlife Vehicle Collisions: Implications for Prevention and Emergency Care. J. Emerg. Nurs. 2004, 30, 542–547. [Google Scholar] [CrossRef]
- Rea, R.V.; Johnson, C.J.; Aitken, D.A.; Child, K.N.; Hesse, G. Dash Cam Videos on YouTubeTM Offer Insights into Factors Related to Moose-Vehicle Collisions. Accid. Anal. Prev. 2018, 118, 207–213. [Google Scholar] [CrossRef]
- Seiler, A. Predicting Locations of Moose-Vehicle Collisions in Sweden. J. Appl. Ecol. 2005, 42, 371–382. [Google Scholar] [CrossRef]
- Ahmed, S.S.; Cohen, J.; Anastasopoulos, P.C. A Correlated Random Parameters with Heterogeneity in Means Approach of Deer-Vehicle Collisions and Resulting Injury-Severities. Anal. Methods Accid. Res. 2021, 30, 100160. [Google Scholar] [CrossRef]
- Rodríguez-Morales, B.; Diaz-Varela, E.; Marey-Perez, M. Spatiotemporal Analysis of Vehicle Collisions Involving Wild Boar and Roe Deer in NW Spain. Accid. Anal. Prev. 2013, 60, 121–133. [Google Scholar] [CrossRef]
- Bissonette, J.A.; Rosa, S. An Evaluation of a Mitigation Strategy for Deer-Vehicle Collisions. Wildl. Biol. 2012, 18, 414–423. [Google Scholar] [CrossRef] [Green Version]
- Colino-Rabanal, V.J.; Lizana, M.; Peris, S.J. Factors Influencing Wolf Canis Lupus Roadkills in Northwest Spain. Eur. J. Wildl. Res. 2011, 57, 399–409. [Google Scholar] [CrossRef]
- Bellamy, P.E.; Shore, R.F.; Ardeshir, D.; Treweek, J.R.; Sparks, T.H. Road Verges as Habitat for Small Mammals in Britain. Mammal Rev. 2000, 30, 131–139. [Google Scholar] [CrossRef]
- Cureton, J.C., II; Deaton, R. Hot Moments and Hot Spots: Identifying Factors Explaining Temporal and Spatial Variation in Turtle Road Mortality. J. Wildl. Manag. 2012, 76, 1047–1052. [Google Scholar] [CrossRef]
- D’Amico, M.; Roman, J.; de los Reyes, L.; Revilla, E. Vertebrate Road-Kill Patterns in Mediterranean Habitats: Who, When and Where. Biol. Conserv. 2015, 191, 234–242. [Google Scholar] [CrossRef]
- Ha, H.; Shilling, F. Modelling Potential Wildlife-Vehicle Collisions (WVC) Locations Using Environmental Factors and Human Population Density: A Case-Study from 3 State Highways in Central California. Ecol. Inform. 2017, 43, 212–221. [Google Scholar] [CrossRef]
- Fahrig, L.; Rytwinski, T. Effects of Roads on Animal Abundance: An Empirical Review and Synthesis. Ecol. Soc. 2009, 14, 21. [Google Scholar] [CrossRef]
- Snow, N.; Porter, W.; Williams, D. Underreporting of Wildlife-Vehicle Collisions Does Not Hinder Predictive Models for Large Ungulates. Biol. Conserv. 2015, 181, 44–53. [Google Scholar] [CrossRef] [Green Version]
- Balčiauskas, L.; Stratford, J.; Balčiauskienė, L.; Kučas, A. Importance of Professional Roadkill Data in Assessing Diversity of Mammal Roadkills. Transp. Res. Part D Transp. Environ. 2020, 87, 102493. [Google Scholar] [CrossRef]
- Borowska, S. Śmiertelność Zwierząt na Drogach w Polsce; WWF Polska: Warsaw, Poland, 2010; pp. 1–25. [Google Scholar]
- Kustusch, K.; Wuczyński, A. Śmiertelność Zwierząt na Drogach w Polsce w Roku 2016. Raport Roczny „Ogólnopolskiego Rejestru Śmiertelności Zwierząt na Drogach”. Available online: https://zwierzetanadrodze.pl/files/Zwierzeta_na_Drodze_-_Raport_2016.pdf (accessed on 3 November 2021).
- Bíl, M.; Kubeček, J.; Sedoník, J.; Andrášik, R. Srazenazver.Cz: A System for Evidence of Animal-Vehicle Collisions along Transportation Networks. Biol. Conserv. 2017, 213, 167–174. [Google Scholar] [CrossRef]
- Abra, F.D.; Granziera, B.M.; Huijser, M.P.; Ferraz, K.M.P.M.d.B.; Haddad, C.M.; Paolino, R.M. Pay or Prevent? Human Safety, Costs to Society and Legal Perspectives on Animal-Vehicle Collisions in São Paulo State, Brazil. PLoS ONE 2019, 14, e0215152. [Google Scholar] [CrossRef] [Green Version]
- Post-Audit Report R/13/014. Supreme Audit Office; 2013. Available online: https://www.nik.gov.pl/kontrole/wyniki-kontroli-nik/pobierz,llu~r_13_009_201312101233401386678820~id1~01,typ,k.pdf (accessed on 5 July 2021). (In Polish)
- Czarnecka, W. Prędkość i jej wpływ na wypadki na drogach z udziałem zwierząt. Bud. Archit. 2016, 15, 249–257. [Google Scholar] [CrossRef]
- Diaz-Varela, E.; Vazquez-Gonzalez, I.; Marey-Perez, M.; Álvarez-López, C. Assessing Methods of Mitigating Wildlife–Vehicle Collisions by Accident Characterization and Spatial Analysis. Transp. Res. Part D Transp. Environ. 2011, 16, 281–287. [Google Scholar] [CrossRef]
- Kušta, T.; Keken, Z.; Ježek, M.; Holá, M.; Šmíd, P. The Effect of Traffic Intensity and Animal Activity on Probability of Ungulate-Vehicle Collisions in the Czech Republic. Saf. Sci. 2017, 91, 105–113. [Google Scholar] [CrossRef]
- Drapalyuk, M.; Zelikov, V.; Denisov, G.; Zlobina, N.; Zelikova, N. Investigation and analysis of emergency situations on the permanent highways. For. Eng. J. 2021, 11, 108–120. [Google Scholar] [CrossRef]
- Iwiński, M.; Zydroń, A.; Antkowiak, M.; Szczepański, P. Rozwój infrastruktury drogowej a kolizje z udziałem zwierzyny leśnej. Studia Pr. WNEiZ US 2017, 3, 207–219. [Google Scholar] [CrossRef] [Green Version]
- Bramati, P.S.; Heinert, L.F.; Narloch, L.B.; Hostetter, J.; Finkielman, J.D. Animal-Related Motorcycle Collisions in North Dakota. Wilderness Environ. Med. 2012, 23, 65–69. [Google Scholar] [CrossRef] [Green Version]
- Clevenger, A.; Chruszcz, B.; Gunson, K. Spatial Patterns and Factors Influencing Small Vertebrate Fauna Road-Kill Aggregations. Biol. Conserv. 2003, 109, 15–26. [Google Scholar] [CrossRef]
- Bartonička, T.; Andrášik, R.; Duľa, M.; Sedoník, J.; Bíl, M. Identification of Local Factors Causing Clustering of Animal-Vehicle Collisions. J. Wildl. Manag. 2018, 82, 940–947. [Google Scholar] [CrossRef]
- Hurley, M.V.; Rapaport, E.K.; Johnson, C.J. Utility of Expert-Based Knowledge for Predicting Wildlife-Vehicle Collisions. J. Wildl. Manag. 2009, 73, 278–286. [Google Scholar] [CrossRef]
- Keken, Z.; Sedoník, J.; Kušta, T.; Andrášik, R.; Bíl, M. Roadside Vegetation Influences Clustering of Ungulate Vehicle Collisions. Transp. Res. Part D Transp. Environ. 2019, 73, 381–390. [Google Scholar] [CrossRef]
- Jensen, R.R.; Gonser, R.A.; Joyner, C. Landscape Factors That Contribute to Animal–Vehicle Collisions in Two Northern Utah Canyons. Appl. Geogr. 2014, 50, 74–79. [Google Scholar] [CrossRef]
- Kanda, L.L.; Fuller, T.K.; Sievert, P.R. Landscape Associations of Road-Killed Virginia Opossums (Didelphis virginiana) in Central Massachusetts. Am. Midl. Nat. 2006, 156, 128–134. [Google Scholar] [CrossRef]
- Bíl, M.; Andrášik, R.; Duľa, M.; Sedoník, J. On Reliable Identification of Factors Influencing Wildlife-Vehicle Collisions along Roads. J. Environ. Manag. 2019, 237, 297–304. [Google Scholar] [CrossRef] [PubMed]
- Litvaitis, J.A.; Tash, J.P. An Approach Toward Understanding Wildlife-Vehicle Collisions. Environ. Manag. 2008, 42, 688–697. [Google Scholar] [CrossRef] [PubMed]
- Keken, Z.; Kušta, T.; Langer, P.; Skaloš, J. Landscape Structural Changes between 1950 and 2012 and Their Role in Wildlife–Vehicle Collisions in the Czech Republic. Land Use Policy 2016, 59, 543–556. [Google Scholar] [CrossRef]
- Orłowski, G.; Nowak, L. Factors Influencing Mammal Roadkills in the Agricultural Landscape of South-Western Poland. Pol. J. Ecol. 2006, 54, 283–294. [Google Scholar]
- Wilkins, D.C.; Kockelman, K.M.; Jiang, N. Animal-Vehicle Collisions in Texas: How to Protect Travelers and Animals on Roadways. Accid. Anal. Prev. 2019, 131, 157–170. [Google Scholar] [CrossRef]
- Bukała, B.; Tereszkiewicz, K. Czynniki determinujące występowanie zdarzeń drogowych z udziałem zwierząt na terenie województwa podkarpackiego. Logistyka 2014, 3, 899–906. [Google Scholar]
- Al-Bdairi, N.S.S.; Behnood, A.; Hernandez, S. Temporal Stability of Driver Injury Severities in Animal-Vehicle Collisions: A Random Parameters with Heterogeneity in Means (and Variances) Approach. Anal. Methods Accid. Res. 2020, 26, 100120. [Google Scholar] [CrossRef]
- Caro, T.M.; Shargel, J.A. Frequency of Medium-Sized Mammal Road Kills in an Agricultural Landscape in California. Am. Midl. Nat. 2000, 144, 362. [Google Scholar] [CrossRef]
- Colino-Rabanal, V.J.; Langen, T.A.; Peris, S.J.; Lizana, M. Ungulate: Vehicle Collision Rates Are Associated with the Phase of the Moon. Biodivers. Conserv. 2018, 27, 681–694. [Google Scholar] [CrossRef]
- Kučas, A.; Balčiauskas, L. Temporal Patterns of Ungulate-Vehicle Collisions in Lithuania. J. Environ. Manag. 2020, 273, 111172. [Google Scholar] [CrossRef]
- Steiner, W.; Leisch, F.; Hackländer, K. A Review on the Temporal Pattern of Deer–Vehicle Accidents: Impact of Seasonal, Diurnal and Lunar Effects in Cervids. Accid. Anal. Prev. 2014, 66, 168–181. [Google Scholar] [CrossRef] [PubMed]
- Ascensão, F.; Yogui, D.; Alves, M.; Medici, E.P.; Desbiez, A. Predicting Spatiotemporal Patterns of Road Mortality for Medium-Large Mammals. J. Environ. Manag. 2019, 248, 109320. [Google Scholar] [CrossRef]
- Gunson, K.; Mountrakis, G.; Quackenbush, L. Spatial Wildlife-Vehicle Collision Models: A Review of Current Work and Its Application to Transportation Mitigation Projects. J. Environ. Manag. 2011, 92, 1074–1082. [Google Scholar] [CrossRef] [PubMed]
- Pagany, R. Wildlife-Vehicle Collisions—Influencing Factors, Data Collection and Research Methods. Biol. Conserv. 2020, 251, 108758. [Google Scholar] [CrossRef]
- Nezval, V.; Bíl, M. Spatial Analysis of Wildlife-Train Collisions on the Czech Rail Network. Appl. Geogr. 2020, 125, 102304. [Google Scholar] [CrossRef]
- Krauze-Gryz, D.; Żmihorski, M.; Jasińska, K.; Kwaśny, Ł.; Werka, J. Temporal Pattern of Wildlife-train Collisions in Poland. J. Wildl. Manag. 2017, 81, 1513–1519. [Google Scholar] [CrossRef]
- Kulińska, E.; Wojtynek, L.; Budzik, R.; Kulińska, A. Wypadki z udziałem zwierząt w transporcie drogowym i kolejowym w Polsce. Autobusy Tech. Eksploat. Syst. Transp. 2017, 18, 1460–1463. [Google Scholar]
- Kurek, R. Poradnik Projektowania Przejść dla Zwierząt i Działań Ograniczających Śmiertelność Fauny Przy Drogach. Available online: https://korytarze.pl/publikacje/poradnik-projektowania-przejsc-dla-zwierzat-i-dzialan-ograniczajacych-smiertelnosc-fauny-przy-drogach-rafal-t-kurek (accessed on 5 July 2021).
- Kurek, R. Przejścia dla zwierząt przy drogach—Rozwiązania optymalne oraz doświadczenia i problemy w zakresie projektowania, cz. 1. Nowocz. Bud. Inżynieryjne 2011, 3, 78–81. [Google Scholar]
- Selezneva, A.V.; Grigoreva, T.U. The efficiency evaluation of measures to reduce the number of road accidents involving wild animals. Eur. J. Nat. Hist. 2020, 2, 90–95. (In Russian) [Google Scholar]
- Order No. 174 on Approval and Implementation of the Standard of the State Company “Russian Automobile Roads” STO AVTODOR 7.4-2016 “Requirements for Eco-Codes on the Motor Roads of the State Company Avtodor”. Available online: https://russianhighways.ru/upload/iblock/98b/Prikaz174_ot_010916_174_01_09_2016_ver1_.pdf (accessed on 3 November 2021). (In Russian).
- Order No. 373 on Approval and Implementation of the Standard of the State Company “Russian Automobile Roads” STO AVTODOR 7.6-2017 “Requirements for Monitoring the Efficiency of Eco-Ducts on Motor Roads”. Available online: https://www.russianhighways.ru/upload/iblock/ea9/prikaz_373_ot_25.12.2017_Monitoring_effektivnosti.pdf (accessed on 3 November 2021). (In Russian).
- Grace, M.K.; Smith, D.J.; Noss, R.F. Reducing the Threat of Wildlife-Vehicle Collisions during Peak Tourism Periods Using a Roadside Animal Detection System. Accid. Anal. Prev. 2017, 109, 55–61. [Google Scholar] [CrossRef] [PubMed]
- Tajchman, K.; Drozd, L.; Karpiński, M.; Czyżowski, P.; Goleman, M.; Chmielewski, S. Wildlife-Vehicle Collisions in Urban Area in Relation to the Behaviour and Density of Mammals. Pol. J. Nat. Sci. 2017, 32, 49–59. [Google Scholar]
- Karpiński, M.; Czyżowski, P.; Drozd, L.; Słowik, T. Kolizje drogowe z udziałem zwierząt wolno żyjących—Opis przypadku. Życie Weter. 2012, 87, 313–315. [Google Scholar]
- Malo, J.E.; Suárez, F.; Díez, A. Can We Mitigate Animal–Vehicle Accidents Using Predictive Models? J. Appl. Ecol. 2004, 41, 701–710. [Google Scholar] [CrossRef]
- Snow, N.P.; Zhang, Z.; Finley, A.O.; Rudolph, B.A.; Porter, W.F.; Williams, D.M.; Winterstein, S.R. Regional-Based Mitigation to Reduce Wildlife–Vehicle Collisions. J. Wildl. Manag. 2018, 82, 756–765. [Google Scholar] [CrossRef]
- Zarządzenie nr 31 Komendanta Głównego Policji z Dnia 22 Października 2015 r. w Sprawie Metod i Form Prowadzenia przez Policję Statystyki Zdarzeń Drogowych. 2015. Available online: https://edziennik.policja.gov.pl/legalact/2015/85/ (accessed on 5 July 2021).
- Beaulieu, A. Learning SQL Generate, Manipulate, and Retrieve Data, 3rd ed.; O’Reilly Media: Sebastopol, CA, USA, 2020; ISBN 978-1-4920-5761-1. [Google Scholar]
- Ahmed, I.; Sohel, M.; Hainin, M.R.; Ramli, I. A Review of Selected Traffic Engineering Parameters in Police Crash Report Forms of Selected Countries. J. Teknol. 2014, 70, 51–55. [Google Scholar] [CrossRef] [Green Version]
- Lasy Państwowe—Organizacja. Available online: https://www.lasy.gov.pl/pl/nasza-praca/pgl-lasy-panstwowe/organizacja (accessed on 6 November 2021).
- Bank Danych o Lasach. Available online: https://www.bdl.lasy.gov.pl/portal/ (accessed on 6 November 2021).
- OpenStreetMap. Available online: https://www.openstreetmap.org/ (accessed on 6 November 2021).
- Geofabrik Download Server. Available online: http://download.geofabrik.de/europe.html (accessed on 1 July 2021).
- Wiki. Pl:Key:Highway—OpenStreetMap. Available online: https://wiki.openstreetmap.org/wiki/Pl:Key:highway (accessed on 6 November 2021).
- QGIS Association. QGIS Geographic Information System. 2021. Available online: http://www.qgis.org/ (accessed on 6 March 2021).
- Iwańczak, B.M. QGIS 3.14: Tworzenie i Analiza Map; Wydawnictwo Helion: Gliwice, Poland, 2021; ISBN 978-83-283-7564-2. [Google Scholar]
- R Core Team. R: A Language and Environment for Statistical Computing; R Foundation for Statistical Computing: Vienna, Austria, 2021. [Google Scholar]
- Wickham, H.; Grolemund, G. R for Data Science Import, Tidy, Transform, Visualize, and Model Data; O’Reilly Media: Sebastopol, CA, USA, 2016; ISBN 978-1-4919-1039-9. [Google Scholar]
- Wickham, H. Ggplot2: Elegant Graphics for Data Analysis; Use R! series; Springer: New York, NY, USA, 2016; ISBN 978-3-319-24277-4. [Google Scholar]
- Rozporządzenie Ministra Środowiska z Dnia 12 Marca 2019 r. w Sprawie Wskaźników i Czynników Służących Kategoryzacji Obwodu Łowieckiego (Dz. U. poz. 536). 2019. Available online: https://www.dziennikustaw.gov.pl/DU/rok/2019/pozycja/536 (accessed on 11 October 2021).
- Motylewicz, M.; Gardziejczyk, W. Statistical Model for Traffic Noise Prediction in Signalised Roundabouts. Bull. Pol. Acad. Sci. Tech. Sci. 2020, 68, 937–948. [Google Scholar] [CrossRef]
- Jacyna, M.; Wasiak, M.; Lewczuk, K.; Chamier-Gliszczyński, N.; Dąbrowski, T. Decision Problems in Developing Proecological Transport System. Annu. Set Environ. Prot. 2018, 20, 1007–1025. [Google Scholar]
- Magyari, Z.; Koren, C.; Kieć, M.; Borsos, A. Sight Distances at Unsignalized Intersections: A Comparison of Guidelines and Requirements for Human Drivers and Autonomous Vehicle. Arch. Transp. 2021, 59, 7–19. [Google Scholar] [CrossRef]
Figure 1.
Numbers of road crashes in Poland (own study based on data from the police SEWiK database [5]): total (left), and with animals (right).
Figure 1.
Numbers of road crashes in Poland (own study based on data from the police SEWiK database [5]): total (left), and with animals (right).

Figure 2.
Streets from which animal carcasses were removed in Warsaw in 2020. (background map: © OpenStreetMap contributors).
Figure 2.
Streets from which animal carcasses were removed in Warsaw in 2020. (background map: © OpenStreetMap contributors).

Figure 3.
(a) Animal–vehicle crashes on both sides of a road that is a boundary of hunting districts; and (b) hunting districts with 200-m buffers. (background map: Head Office of Geodesy and Cartography).
Figure 3.
(a) Animal–vehicle crashes on both sides of a road that is a boundary of hunting districts; and (b) hunting districts with 200-m buffers. (background map: Head Office of Geodesy and Cartography).

Figure 4.
Numbers of animal–vehicle crashes in Poland between 2016 and 2020.

Figure 5.
Numbers of road crashes in Poland between 2016 and 2020.

Figure 6.
Numbers of fatal animal–vehicle crashes in Poland between 2016 and 2020.

Figure 7.
Numbers of animal–vehicle crashes involving the injured in Poland between 2016 and 2020.

Figure 8.
Numbers of road crashes from 2016 to 2020, by month and hour: (a) all crashes; and (b) animal–vehicle crashes.
Figure 8.
Numbers of road crashes from 2016 to 2020, by month and hour: (a) all crashes; and (b) animal–vehicle crashes.

Figure 9.
Distributions of total numbers of crashes in different types of hunting districts, from 2016–2020.
Figure 9.
Distributions of total numbers of crashes in different types of hunting districts, from 2016–2020.

Figure 10.
Distributions of total numbers of crashes in different types of hunting districts, from 2016–2020.
Figure 10.
Distributions of total numbers of crashes in different types of hunting districts, from 2016–2020.

Figure 11.
Distributions of the total numbers of crashes in hunting districts in different voivodeships, from 2016–2020 (with outliers removed).
Figure 11.
Distributions of the total numbers of crashes in hunting districts in different voivodeships, from 2016–2020 (with outliers removed).

Figure 12.
Hunting districts with the highest numbers of animal–vehicle crashes between 2016 and 2020. (background map: Head Office of Geodesy and Cartography).
Figure 12.
Hunting districts with the highest numbers of animal–vehicle crashes between 2016 and 2020. (background map: Head Office of Geodesy and Cartography).

Figure 13.
Examples of hunting districts with high numbers of crashes, covering the surroundings of the large cities and their outskirts: (a) the city of Rzeszow (western part); (b) the southern part of the Upper Silesian conurbation. (background map: Head Office of Geodesy and Cartography).
Figure 13.
Examples of hunting districts with high numbers of crashes, covering the surroundings of the large cities and their outskirts: (a) the city of Rzeszow (western part); (b) the southern part of the Upper Silesian conurbation. (background map: Head Office of Geodesy and Cartography).


Figure 14.
Correlation matrix of the numbers of big game and the numbers of animal–vehicle crashes.

Figure 15.
Correlation matrix of the numbers of small game and the numbers of animal–vehicle crashes.
Figure 15.
Correlation matrix of the numbers of small game and the numbers of animal–vehicle crashes.

Figure 16.
Correlation matrix of the numbers of animal–vehicle crashes in previous years and the numbers of animal–vehicle crashes.
Figure 16.
Correlation matrix of the numbers of animal–vehicle crashes in previous years and the numbers of animal–vehicle crashes.

Figure 17.
Correlation significance matrix of the numbers of big game and the numbers of animal–vehicle crashes.
Figure 17.
Correlation significance matrix of the numbers of big game and the numbers of animal–vehicle crashes.

Figure 18.
Correlation significance matrix of the numbers of small game and the numbers of animal–vehicle crashes.
Figure 18.
Correlation significance matrix of the numbers of small game and the numbers of animal–vehicle crashes.

Figure 19.
Correlation significance matrix of the numbers of animal–vehicle crashes in previous years and the numbers of animal–vehicle crashes.
Figure 19.
Correlation significance matrix of the numbers of animal–vehicle crashes in previous years and the numbers of animal–vehicle crashes.

Figure 20.
The impact of the changing moose population size on the number of crashes: (a) correlation matrix; and (b) correlation significance matrix.
Figure 20.
The impact of the changing moose population size on the number of crashes: (a) correlation matrix; and (b) correlation significance matrix.

Figure 21.
The impact of the changing wild boar population size on the number of crashes: (a) correlation matrix; and (b) correlation significance matrix.
Figure 21.
The impact of the changing wild boar population size on the number of crashes: (a) correlation matrix; and (b) correlation significance matrix.

Figure 22.
Year-on-year changes in animal population sizes: (a) roe deer; and (b) wild boar.


Table 1.
Numbers of crashes on roads of different categories.
| Road Category | Number of Crashes |
|---|---|
| Motorway | 1484 |
| National road | 34,913 |
| Voivodeship road | 35,221 |
| County road | 38,165 |
| Commune road | 12,919 |
| Other | 165 |
| Not defined | 6005 |
Table 2.
Numbers of hunting districts of different types.
| Voivodeship | Number of Hunting Districts | |
|---|---|---|
| Forest | Field | |
| Mazowieckie | 104 | 495 |
| Opolskie | 44 | 114 |
| Podlaskie | 79 | 242 |
| Zachodniopomorskie | 134 | 156 |
Table 3.
Numbers of hunting districts of different categories.
| Voivodeship | Category of Hunting District | ||||
|---|---|---|---|---|---|
| Very Poor | Poor | Moderate | Good | Very Good | |
| Lubelskie | 263 | 63 | 3 | - | - |
| Mazowieckie | 373 | 210 | 15 | 1 | - |
| Zachodniopomorskie | 56 | 65 | 95 | 64 | 5 |
Table 4.
Results of comparisons of the numbers of crashes in districts of different categories.
| Category of Hunting District | Category of Hunting District | |||
|---|---|---|---|---|
| Very Poor | Poor | Moderate | Good | |
| Poor | 0.00058 | - | - | - |
| Moderate | 7.6 × 10⁻⁸ | 0.01641 | - | - |
| Good | 1.9 × 10⁻¹³ | 4 × 10⁻⁷ | 0.03745 | - |
| Very good | 0.28708 | 0.67554 | 1 | 1 |
Publisher’s Note: MDPI stays neutral with regard to jurisdictional claims in published maps and institutional affiliations. |
© 2022 by the authors. Licensee MDPI, Basel, Switzerland. This article is an open access article distributed under the terms and conditions of the Creative Commons Attribution (CC BY) license (https://creativecommons.org/licenses/by/4.0/).
Share and Cite
MDPI and ACS Style
Krukowicz, T.; Firląg, K.; Chrobot, P. Spatiotemporal Analysis of Road Crashes with Animals in Poland. Sustainability 2022, 14, 1253. https://doi.org/10.3390/su14031253
AMA Style
Krukowicz T, Firląg K, Chrobot P. Spatiotemporal Analysis of Road Crashes with Animals in Poland. Sustainability. 2022; 14(3):1253. https://doi.org/10.3390/su14031253
Chicago/Turabian StyleKrukowicz, Tomasz, Krzysztof Firląg, and Paweł Chrobot. 2022. "Spatiotemporal Analysis of Road Crashes with Animals in Poland" Sustainability 14, no. 3: 1253. https://doi.org/10.3390/su14031253
Note that from the first issue of 2016, this journal uses article numbers instead of page numbers. See further details here.