
GGE Biplot Analysis to Explore the Adaption Potential of Italian Common Wheat Genotypes


Department of Agricultural Food Sciences, Alma Mater Studiorum, Università di Bologna, Vial Fanin 44, 40127 Bologna, Italy
*
Author to whom correspondence should be addressed.
Sustainability 2022, 14(2), 897; https://doi.org/10.3390/su14020897
Submission received: 30 November 2021
/
Revised: 29 December 2021
/
Accepted: 10 January 2022
/
Published: 13 January 2022
(This article belongs to the Special Issue Sustainable Organic Agriculture)
Abstract
:Given the substantial variation in global wheat yield, insufficient research in cultivar selection for climate change, and the lack of suitable germplasm in sustainable agroecosystems, there is a requisite for soft wheat genotypes, with stable grain yield as well as quality parameters. The present study was aimed at genotype evaluation (GGE biplot for “mean performance versus stability”) not only for yield, but also for technological, phytosanitary and functional quality parameters of 24 Triticum aestivum L. genotypes (eight landraces, old and modern varieties, respectively) within a single organic farm location (Argelato, Emilia-Romagna, Italy) over three consecutive years. Overall, high yield stability was shown for the landraces and old varieties. In particular, the landraces Piave and Gamba di Ferro, as well as the old variety Verna, showed high stability with above-average means for numerous quality parameters of interest. Additionally, relative stability combined with above-average mean for quality parameters was also demonstrated for the high-yielding Gentil Bianco and Guà 113. Aside from Verna, these “unrecognized” resilient genotypes were also shown to meet the requisites for suitable germplasm in sustainable agroecosystems. Future potential utilization of these more stable landraces in addressing climate change would also ultimately facilitate the survival of valuable genetic resources.
1. Introduction
Approximately 90 to 95% of wheat production worldwide is comprised of common or bread wheat (Triticum aestivum L. 2n = 6x = 42, genome AABBDD), constituting one of the key staple crops for global food security [1]. Nonetheless, ensuring global food security, while protecting the environment, non-agricultural lands and biodiversity, is considered to be the single greatest scientific challenge facing humankind [2]. Food security is also inextricably linked to climate change, which was shown to account for approximately 32–39% of the annual yield variability in global wheat production, mostly cultivated under rainfed conditions. Climate change was also shown to account for 31–51% of the yield variability in Western Europe [3]. Within the European context, the large genetic yield gap [4] and the decline in climate resilience of European wheat [5] amidst future projected climate changes [6] are testimony to the challenges facing wheat cultivation. More specifically, the Mediterranean climate is characterized by low and erratic distribution of rainfall, along with increasing temperature towards the end of the crop cycle, conditions that compromise yield stability [7,8]. Not surprisingly, climate-change induced wheat yields are projected to decrease by up to 49% by 2050 in Southern Europe [6], evidencing the insufficient preparation of wheat breeding programs and cultivar selection for climatic uncertainty and variability [5]. Moreover, despite being the world’s most widely cultivated crop, research investments in wheat lag behind those in other crops [9].
Due to their ecological homogeneity, modern monoculture systems are particularly vulnerable to climate change as well as to biotic stresses, a condition that also constitutes a major threat to food security [10,11]. Given that environmental variation (climate, and low or irregular levels of soil fertility) and stressors (diseases) cannot be mitigated by synthetic inputs in sustainable and organic farming, the latter provide ideal systems to evaluate wheat crop genetic diversity for resilience to environmental variation [10,11,12].
From a bibliometric assessment of the literature (2000–2018), the importance of sustainability in agroecosystems for a major crop like wheat was highlighted [1]. To this end, there has been a growing interest in on-farm conservation of wheat landraces, which are domesticated, traditional, regional ecotypes, locally adapted to their respective natural and cultural agricultural environments. Emerging research on soft wheat has emphasized the role of landraces and old varieties (released before 1950, or the phase commonly referred to as the “Green Revolution”), individually or in mixed populations, as genetic resources to improve sustainability in Mediterranean rainfed agroecosystems [7,12,13,14,15,16]. In Italy, soft wheat comprising 40% of the total wheat cultivated, showed a negative trend in gross production in 2021 that was −5.43% compared to the previous five-year average [17]. Within the framework of soft wheat cultivation in Italy, sustainable agroecosystems are constrained, with a limited selection of adapted varieties [15,16]. Hence, the search for stable soft wheat genotypes adapted to environmental variation remains an important consideration [15,16].
Noteworthy, although yield selection remains a preeminent selection criterion, an evaluation of crop resilience is an important auxiliary to yield [5], as are functional and technological properties [7,14,15,16]. This is reflected in the Organic Regulation EU 848/2018 prescribing cultivars, suitable for organic agriculture, with the following attributes: enhanced genetic diversity, disease resistance or tolerance, adaptive potential to diverse local soil and climate conditions, and the ability to produce high-quality food [18]. Understanding the interaction between genotype performance (G) and the target environment (E), as well as the interaction between the two (GxE), is the key to improving genetic gain [11]. In particular, the stability of a genotype reveals its consistency in performance (resilience) across environments for economically important traits such as grain yield and quality, and is of particular importance in environments where conditions vary periodically [5].
Traditionally, data originating from cultivation assessment trials are processed using the Analysis of Variance (ANOVA), followed by other statistical visual tests known as Principal Component Analysis (PCA). However, to better understand which cultivars show an overall best performance and stability across locations, or within a single location, the G + G × E model (GGE Biplot), developed by Yan et al. [19], has been shown to be an effective tool in assessing performance [16]. Depending on the complexity of the data, the GGE Biplot can used for mega-environment analysis (“which-won-where” pattern, whereby specific genotypes can be recommended to specific mega-environments), genotype evaluation (the mean performance and stability), and test-environmental evaluation [20]. GGE biplot analysis has been found suitable for the selection of stable soft wheat landraces under organic cultivation in Mediterranean countries [13,15,16], and merits more extensive use as an approach in assessing the performance stability of soft wheat in sustainable agroecosystems.
Given the need for soft wheat genotypes adapted to changing environmental conditions, with stable grain yield and quality parameters, this study was aimed at genotype evaluation (GGE biplot for mean performance versus stability) of 24 soft wheat genotypes, on an organic farm at a single location (Emilia-Romagna, Italy) over multiple years to encompass seasonal variation. As the organic sector has a limited choice of specifically adapted varieties, landraces, old and modern varieties (certified for use in organic agriculture) were evaluated for yield, as well as functional and phytosanitary parameters, respectively.
2. Materials and Methods
2.1. Genetic Material
The germplasm selected comprised eight landraces (local ecotypes: Andriolo, Benco, Bianco Nostrale, Canove, Gentil Rosso, Gentil Bianco, Gamba di Ferro, and Piave), largely of unknown origins, that were widely adopted in the provinces of Tuscany, Emilia-Romagna and Veneto between the mid-1800s and early-1900s (Table 1). In general, old varieties (released before 1950) were developed using landraces as parental varieties, and the earlier old varieties were in turn used to produce additional old varieties. Of the collection of old varieties, eight were selected in the present study. The eight old varieties (spanning the time period between 1920–1950) included Abbondanza, Autonomia A, Fiorello, Frassi-neto, Guà 113, Inallettabile, Mentana and Verna (Table 1). Included in the study were eight modern varieties, defined as those varieties released after the period of extensive cross-breeding, commonly referred to as the “Green Revolution (around the 1950s) that was instrumental in the development of high-yielding varieties. The eight varieties selected also covered a range of Italian flour classification grades determined by the Synthetic Quality Index [21]. These encompassed ordinary bread making wheat (frumento panificabile [FP] including Aquilante, Bilancia, Bolero and Palesio), superior bread making wheat (frumento panificabile superiore [FPS]—Blasco) and improved wheat (frumento di forza [FF]—Bologna, Rebelde and Sagittario), respectively (Table 1). The latest information pertaining to varietal registration [22] and the historical background of the respective varieties are provided from sources reported at the bottom of Table 1.
2.2. Test Location and Cultivation Conditions
The cultivation of the analyzed cultivars was carried out at the organic farm “Podere Santa Croce” (30 ha), located in the municipality of Argelato (Bologna) in Emilia-Romagna, Italy (44°39′57″ N, 11°19′43″ E, 16 m a.s.l.). Podere Santa Croce presently contains a “catalogue” field, consisting of a large collection of 130 Triticum landraces and old varieties from all over Italy. In collaboration with the University of Bologna, on-farm selection is conducted to search for varieties with the best qualitative properties.
All 24 accessions described in the materials, were grown individually in plots of 1.1 m × 6.5 m (7.15 m2), respectively, according to a randomized complete block design with two replicate plots for each accession. The performance of the material was analyzed over three consecutive years (2016–2017, 2017–2018 and 2018–2019). Seed material was sown with a plot seeder (sowing density of 180 kg/ha seed) on 9 December 2016, 17 November 2017 and 25 November 2018, and then harvested with a plot combine harvester in the second week of July of the following year, respectively. According to organic cultivation principles, neither fertilization nor phytosanitary treatments were carried out during the cultivation cycle. Each year, the study material was included in a three-year rotation scheme. Horticultural cops (tomato and salad) preceded the sowing of the soft wheat. After the harvest, forage clover, an improvement crop, was sown.
Meteorological data (rainfall, average maximum and minimum temperatures) during the three cultivation seasons, was recorded by the Regional Agency for Prevention, Environment and Energy meteorological station (Arpae, Emilia-Romagna), located near Saletto in the municipality of Bentivoglio (Bologna, Italy, 44°37′56″ N, 11°26′28″ E, 18 m asl), less than 10 km from the experimental field. The soil type was loamy clay, with clay: sand: loam fractions of 26%, 32%, and 42%, respectively (Agriparadigma laboratories). Seasonal meteorological data and soil parameters, distinguishing environmental parameters for each cultivation year, are presented in the results section.
In the present study, yield (and various potentially related agronomical measurements) as well as technological, phytosanitary and functional quality parameters were analyzed.
2.3. Yield and Agronomic Parameters
Prior to harvest for each cultivation year, plant height on 10 random mature plants within each plot was measured from the ground level to the base of the spike. Lodging was measured on all plants within each plot and expressed as a percentage of the total number of plants. At the end of the crop cycle, yield was measured within each plot and expressed as t/ha−1. Hectolitre weight (HW) of the kernels was determined by the Infratec 1241 Grain Analyzer (FOSS Analytical A/S, Hillerød, Denmark) based on the manufacturer’s guidelines. Moreover, the following agronomical parameters, with potential effect on yield, were determined: number of spikes/m2, number of kernels/spike (five replicates per plot), and thousand kernel weight (TKW, two replicates per plot).
2.4. Technological Quality
The technological quality analyses used in the present study included total protein content, the Zeleny sedimentation value and wet gluten. These parameters were determined on the kernel material (two replicates per variety with 10 internal readings for each replicate) using the Infratec 1241 Grain Analyzer (FOSS, Hillerød, Denmark) based on the manufacturer’s guidelines.
2.5. Phytosanitary Quality
Disease assessment analyses were carried out prior to harvest by randomly selecting 10 wheat plants within each experimental plot and providing a visual disease rating estimate of the flag leaf and the leaf below. Fungal disease assessments were made collectively for brown leaf rust (Puccinia triticina), head blight (Fusarium graminearum) and leaf blotch (Septoria tritici). In all instances, brown leaf rust, head blight and leaf blotch severities were estimated based on the modified Cobb’s Scale (0–100%) [22,23,24,25]. Disease ratings were calculated using a descriptive assessment scale with different classes of scale ratings (i.e., 0–10), in which each rating corresponds to a specific infection percentage over the surface area of tissue under investigation. The scoring scale adopted was as follows: 0 = no infection, 1 = 1–10%, 2 = 11–20%, 3 = 21–30%, 4 = 31–40%, 5 = 41–50%, 6 = 51–60%, 7 = 61–70%, 8 = 71–80%, 9 = 81–90% and 10 = 91–100%.
Deoxynivalenol (DON), a mycotoxin produced by Fusarium was measured on the seed material using the the AgraQuant® Deoxynivalenol ELISA test kit (Romer Labs, Division Holding GmbH, Inzersdorf-Getzersdorf, Austria) according to the manufacturer’s instructions, described and validated by Zheng et al. [26]
2.6. Functional Properties
The functional quality analyses included insoluble dietary fiber (IDF), soluble dietary fiber (SDF), total polyphenol content (TPC), total flavonoid content (TFC), total anti-radical activity using the 1,1-diphenyl-2-picrylhydrazyl (DPPH) radical and ferric reducing antioxidant potential (FRAP). All the standard (gallic acid and catechin) and chemicals were of analytical grade and purchased from Merk Life Science S.r.l. (Milan, Italy).
For the analysis of functional quality parameters, the kernels were ground to produce wholegrain flour and two replicates were performed for each variety per year, respectively. IDF and SDF were extracted and measured according to the instruction protocol provided with the Megazyme Total Dietary Fibre Assay Procedure kit (Megazyme International,Co. Wicklow, Ireland), that was based on previously reported methods [27,28]. TPC, comprising both free and bound polyphenols, were extracted as described previously [29]. Free and bound polyphenols were then measured according to the Folin-Ciocalteau spectrophotometric (765 nm) method using gallic acid as a reference standard [30] and the total calculated. Likewise, the free and bound flavonoids were individually measured using a spectrophotometric (510 nm) colorimetric assay with catechin as a reference standard [31] and then summed to produce the total. The DPPH assay was performed by measuring the reduction (515 nm) of DPPH to 1,1-diphenyl-2-picryl hydrazine [32]. FRAP (reduction of Fe2+) was determined using a spectrophotometric (593 nm) method reported previously [33]. As with the polyphenols and flavonoids, anti-oxidant activity in the free and bound fraction were summed and expressed as total DPPH and FRAP, respectively.
2.7. Statistical Analysis
Statistical analyses were performed with the general linear model using the SPSS software, considering the “variety” factor as a fixed factor and the “year” factor as a variable factor. The post hoc comparisons between the observed means were performed using the Duncan test.
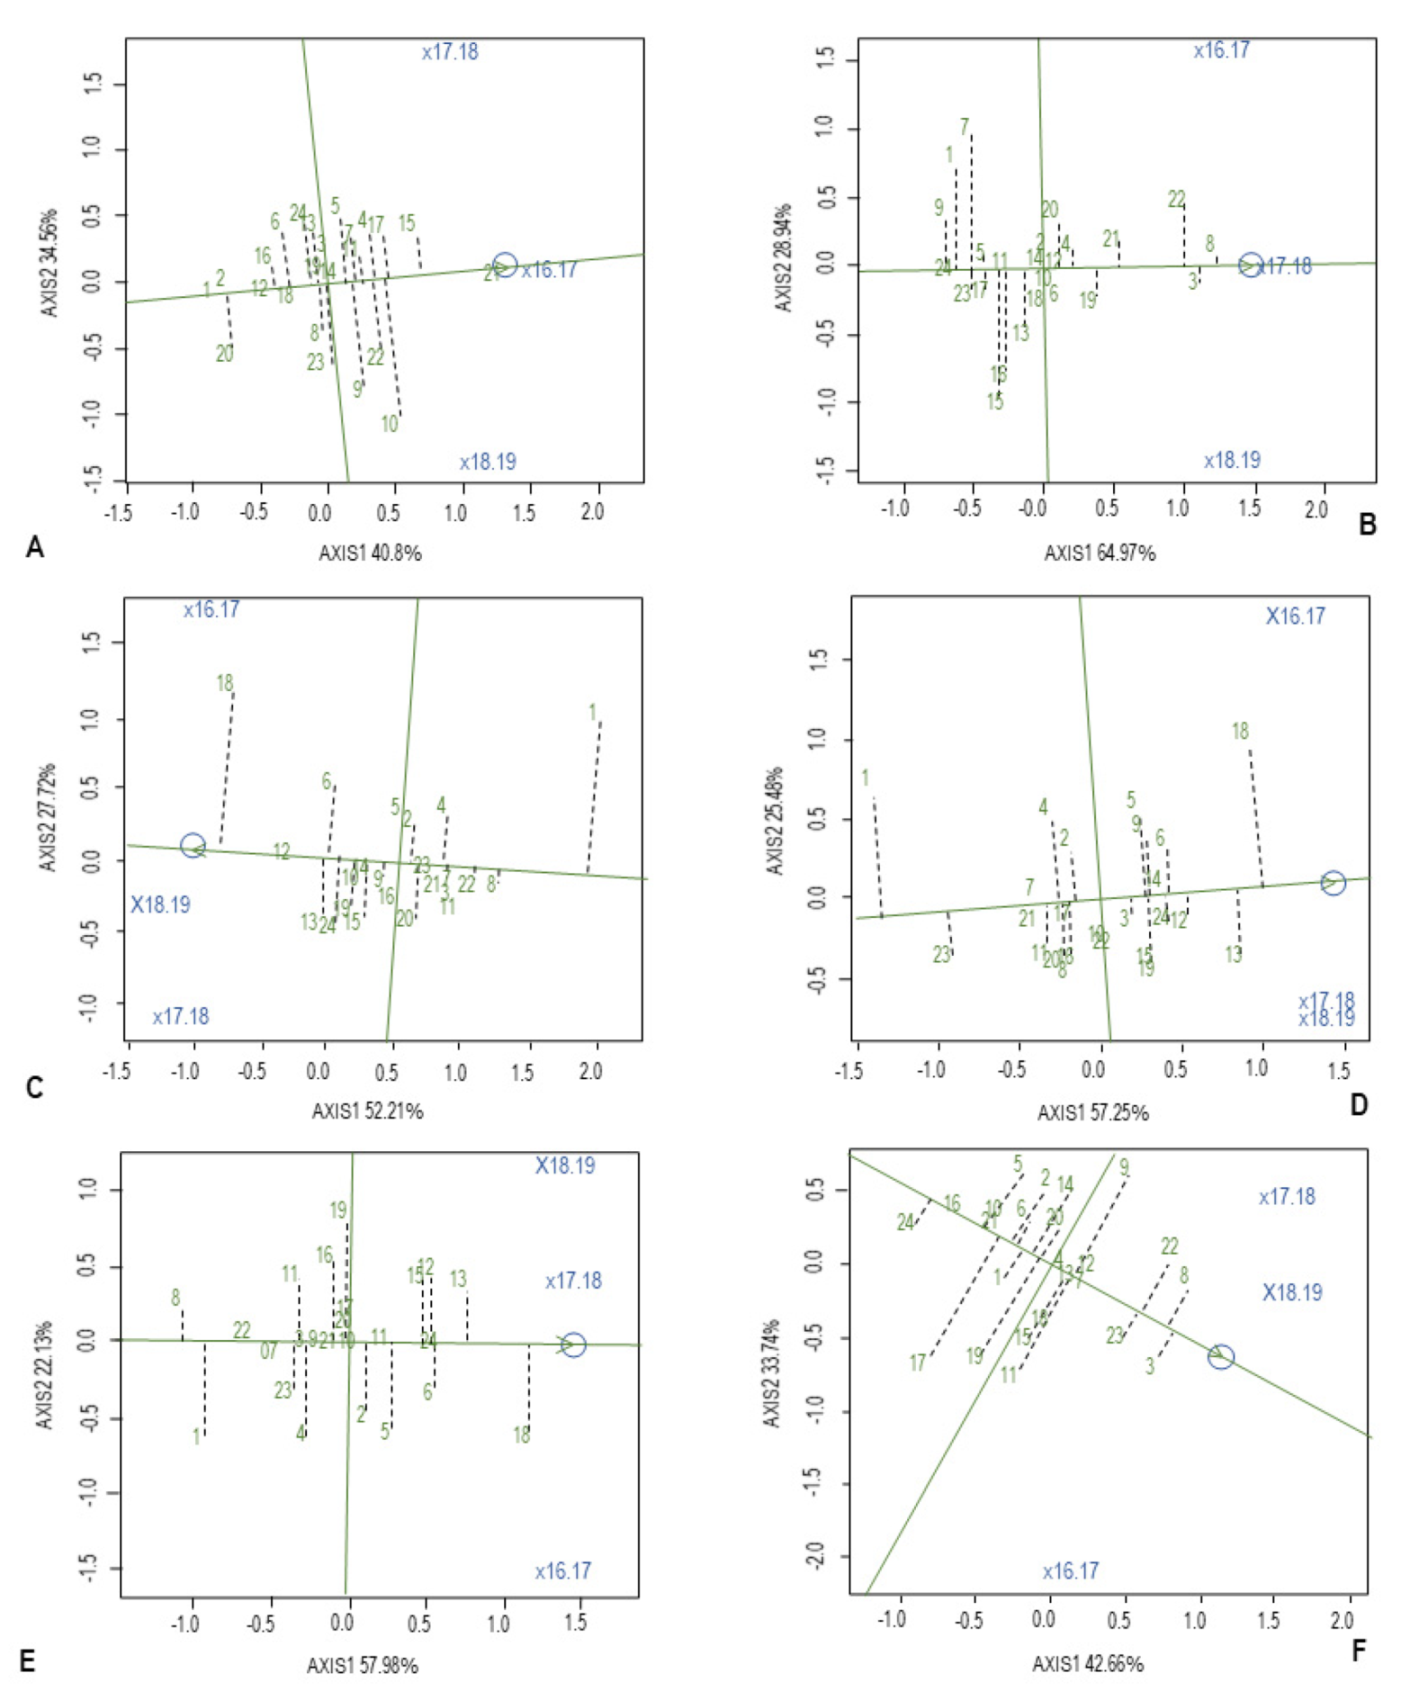
In the present study, the GGE biplot tool selected was “mean versus stability”. The software used was the R version 4.0.2 of the GGEBiplotGUI package, in which a new interactive computational implementation in R language was proposed to perform the main functions of the GGE biplot methods [34]. The “mean versus stability” tool facilitates the visualization of the mean performance and stability of a genotype. The biplot is presented with two principal components (PC), namely principal component 1 (PC1, x axis) versus PC2 (y axis), individually accounting for a percentage of the G + G × E effects, respectively. The additive percentage from the sum of PC1 and PC1 explains the total significance of G + G × E. The single-arrowed line is the average or mean environmental axis (AEA or MEA), and points to higher mean performance across environments in the direction of the arrow. On the MEA, the average environment is defined as the average values of PC1 and PC2 and is presented with a circle. Any genotype occurring within the circle is the ideotype or ideal genotype, combining both high mean performance and stability. The line perpendicular to the MEA is the mean ordinate environment (MEO) and the point of intersection is the point of origin, representing both the average mean performance and high stability. Increased variability (poorer stability) of the genotypes is defined by an increased positioning away from the MEA, in either direction of the MEO, towards the positioning of specific environments [20,34,35].
3. Results
3.1. Meteorological Data and Soil Parameters
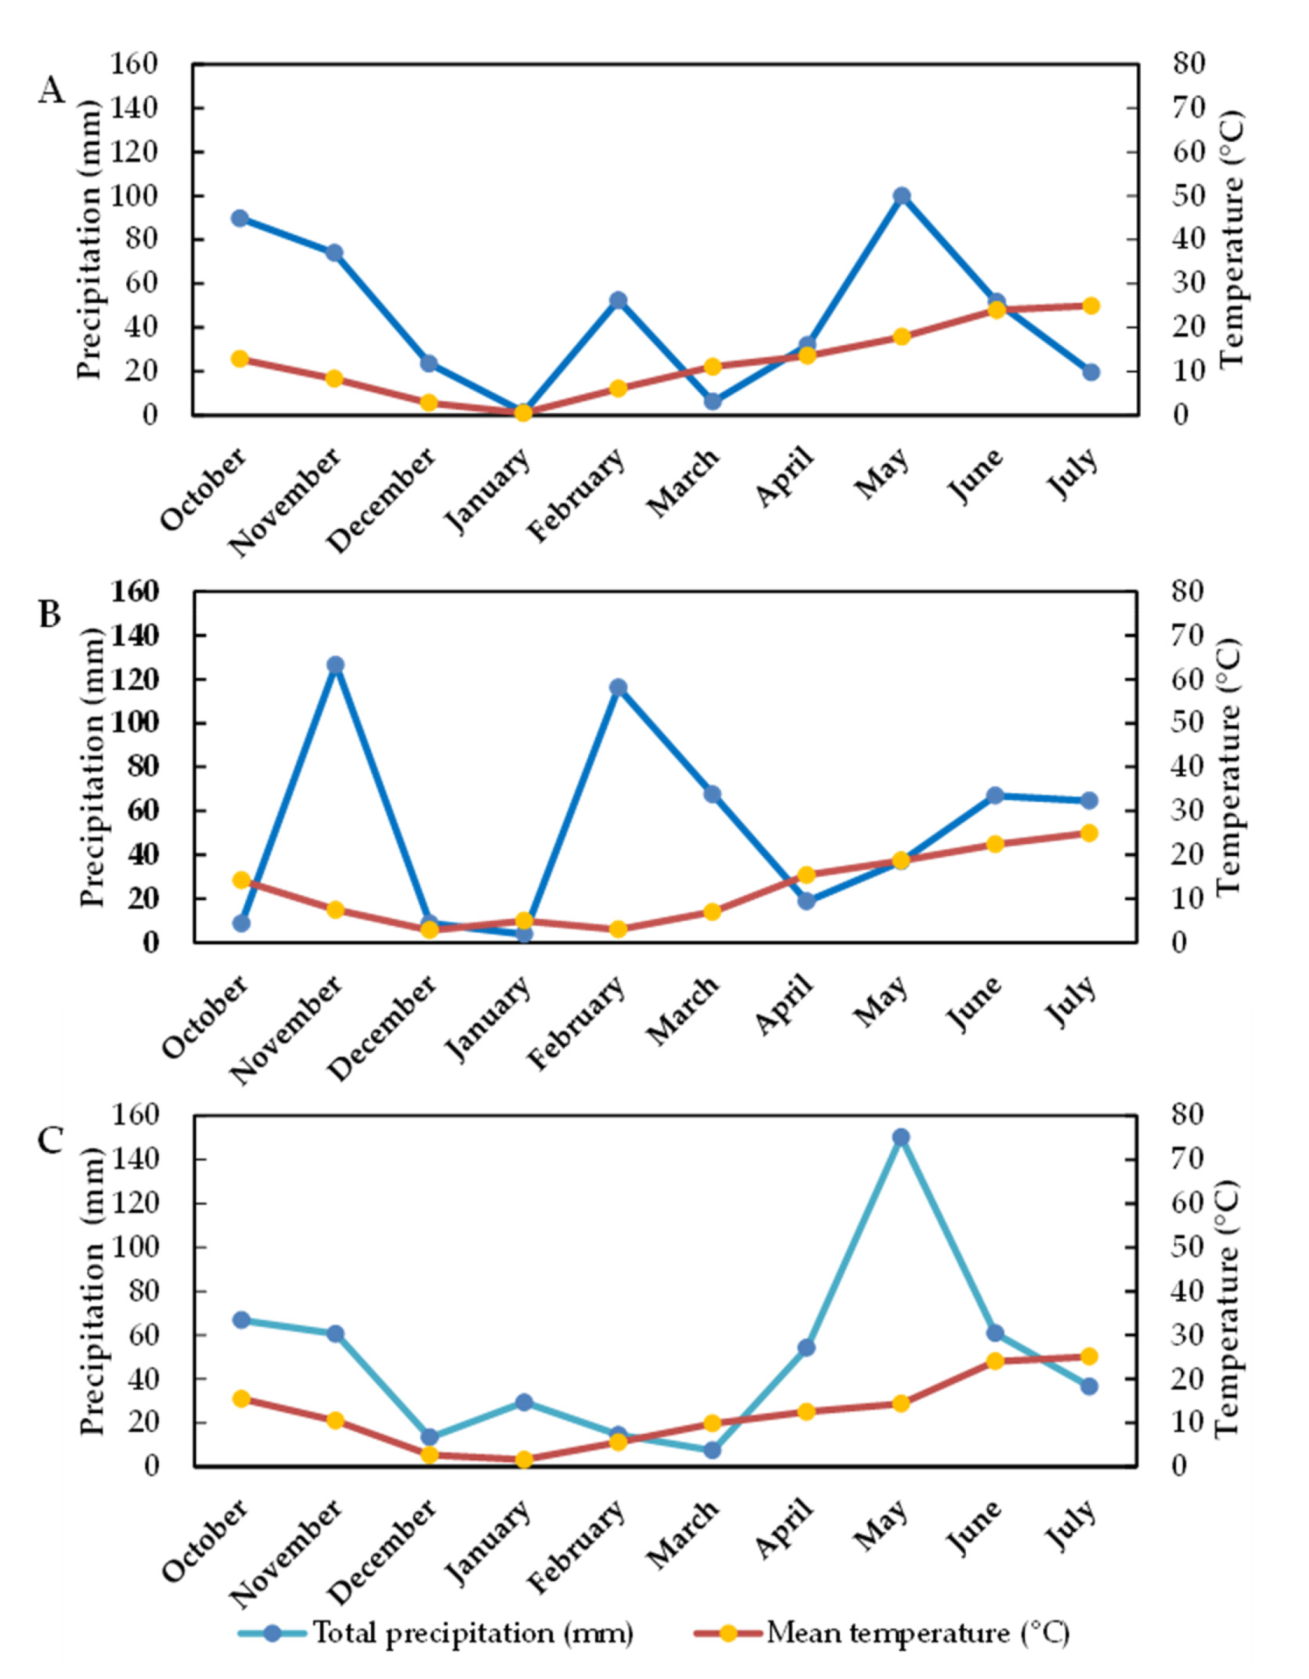
The source of variation in the single environment of Podere Santa Croce, Argelato (Bologna), over the three years, included the meteorological data and soil parameters. The distribution of total rainfall was varied over the different years (Figure 1).
In 2017–2018, rainfall was the highest and lowest during the entire cultivation (December–June) and the maturation period (April–June), respectively (Table 2).
The year 2017–2018 differed from the remaining two years for the lowest rate of minimum and maximum temperature increase over the maturation period. The first year, 2016–2017, was distinctive from the second and third cultivation years, for both intermediate rainfall and the rate of temperature increase over maturation (Table 2). Instead, the final cultivation year, 2018–2019, was distinctive for the highest rainfall and highest rate of temperature increase over the April–June maturation period (Table 2). For the soil parameters, the first year (2016–2017) was also distinctive from the second and third cultivation years for lowest organic matter content, total N and C/N ratio, respectively (Table 2). The year 2017–2018 differed from the remaining two years for the lowest assimilable P (Table 2).
3.2. Yield and Related Agronomical Parameters
The yield was significant for year, and the G × E interaction for genotype and year (Table 3). HW, or test weight, is indication of grain-soundness, used by millers as an indication of expected flour yield. HW was significantly different over year, genotype and the G × E interaction. Similar to yield, HW was not distinctive between landraces, old and modern varieties, respectively, and overall HW was slightly lower that the recommended 80 kg/hL market requirement (Table 3). Additional agronomical parameters of interest generally investigated in relation to yield are reported in Table 3, and were all shown to be significantly different for year, genotype (with the exception of TKW) and the G × E interaction for genotype and year, respectively. As is widely reported for mean plant height, all of the modern varieties were significantly shorter, and were shown to display the lowest propensity for lodging (Table 3).
Collectively, the landraces and older varieties were significantly taller for plant height, with a varying tendency for lodging (Table 3). Lodging was significantly higher 2017–2018, coinciding with the highest rainfall between December-June (Table 2). However, lodging was shown to occur late during the maturation period and had no effect on yield. The number of spikes/m2, the number of kernels per spike and TKW (useful for the assessment of the potential milling yield) were not correlated to yield (results not shown). As is widely reported, the modern varieties were higher for TWK, albeit not significantly different in the present study.
3.3. Technological, Phytosanitary and Functional Quality Parameters
The technological quality parameters included the Zeleny sedimentation value, a chemical parameter used in breeding and in rapid analysis to predict the overall baking quality of wheat, as well as total protein and wet gluten. These parameters varied significantly for year, genotype and G × E interaction (with the exception of wet gluten). The range of values reported in Table 4 were not distinctive for either the landraces or old and modern varieties, respectively.
The phytosanitary quality parameters included pathogen incidence and DON content. Pathogen incidence over the three years was attributable to the collective presence of brown leaf rust (Puccinia triticina) and leaf blotch (Septoria tritici). In the year 2018–2019, head blight (Fusarium graminearum) was shown to be present on only Mentana and Bolero (results not shown). Manifestation of pathogen incidence was significantly higher in the cultivation year 2018–2019 (Table 4), coinciding with the highest rainfall and the highest rate of temperature increase over the maturation period (Table 2). DON levels, produced by the Fusarium genus, in the kernels for all 24 genotypes were below the threshold level of 1250 ppb (Table 4), permissible for soft wheat set by the amending Regulation (EC) No 1881/2006 for maximum levels (EC, 2007) [35,36].
The functional quality parameters, reported in Table 5, included the IDF (celluloses and hemicelluloses) and SDF (highly fermentable hemicelluloses, pectins and gums, important for gut microbiota). IDF is also considered important as a baking parameter, however, in the present study, IDF is included among the functional parameters given that higher levels are associated with increased fecal bulk and transit times. The well-documented antioxidants (TPC and FPC) and antioxidant activities (FRAP and DPPH) were also included. The range of values for each parameter investigated were not distinctive for either the landraces or old and modern varieties, respectively (Table 5). The G × E interaction was highly significant for all functional parameters (Table 5).
3.4. GGE Biplot for “Mean Performance versus Stability”
GGE biplot analyses reported in the literature on crops of interest are performed almost exclusively on yield, which is considered the most important parameter. In the present study, GGE biplot analyses were extended to include various technological, phytosanitary and functional quality parameters in order to investigate mean performance versus stability, with the objective of individuating genotypes with both a stable and stable above-average mean performance for a variety of parameters.
Given the importance of yield, variation in grain yield was mainly affected the joint effects of genotype and interaction (G + G × E), accounting for 75.38% of the total variance (40.80% PC1 and 34.86% PC2) of the GGE sum of squares (Figure 2A). The landrace Piave (Code 21) was within the mean environment (circle) on the MEA, and was thus considered the ideotype, stable with the greatest mean (ranked number 1) of all 24 genotypes. The landrace Gentil Bianco (Code 15) and the old variety Guà 113 (Code 17) ranked in position 2 and 3, respectively for yield performance and with relative stability. An additional genotype of interest was the landrace Gamba di Ferro (Code 14), with high stability positioned on the MEA close to the center of origin, representing the average mean (Figure 2A). Interestingly, the majority of landraces and old varieties collectively showed higher stability, either with above-average mean performance (Piave, Gentil Bianco, Gùa113, Gamba di Ferro) or below-average mean performance (Mentana [Code 19], Inallettabile [Code 18], Gentil Rosso [Code 16], Fiorello [Code 12], Andriolo [(Code 2], Abbondanza [Code 1]). In contrast, the modern varieties were distributed along the MEA for both for above-average yield (Bologna [Code 10], Rebelde [Code 22] and Bolero [Code 9]) and below-average yield (Blasco [Code 8], Sagittario [Code 23] and Palesio [Code 20]), respectively. However, the modern varieties showed the highest variability being distributed the greatest distance from the MEA towards specific years, respectively (Figure 2A). The agronomical parameters (number of spikelets, number of seeds, seed weight/spike, TSW) were not shown to be associated with the higher yielding genotypes and were all below average mean (results not shown).
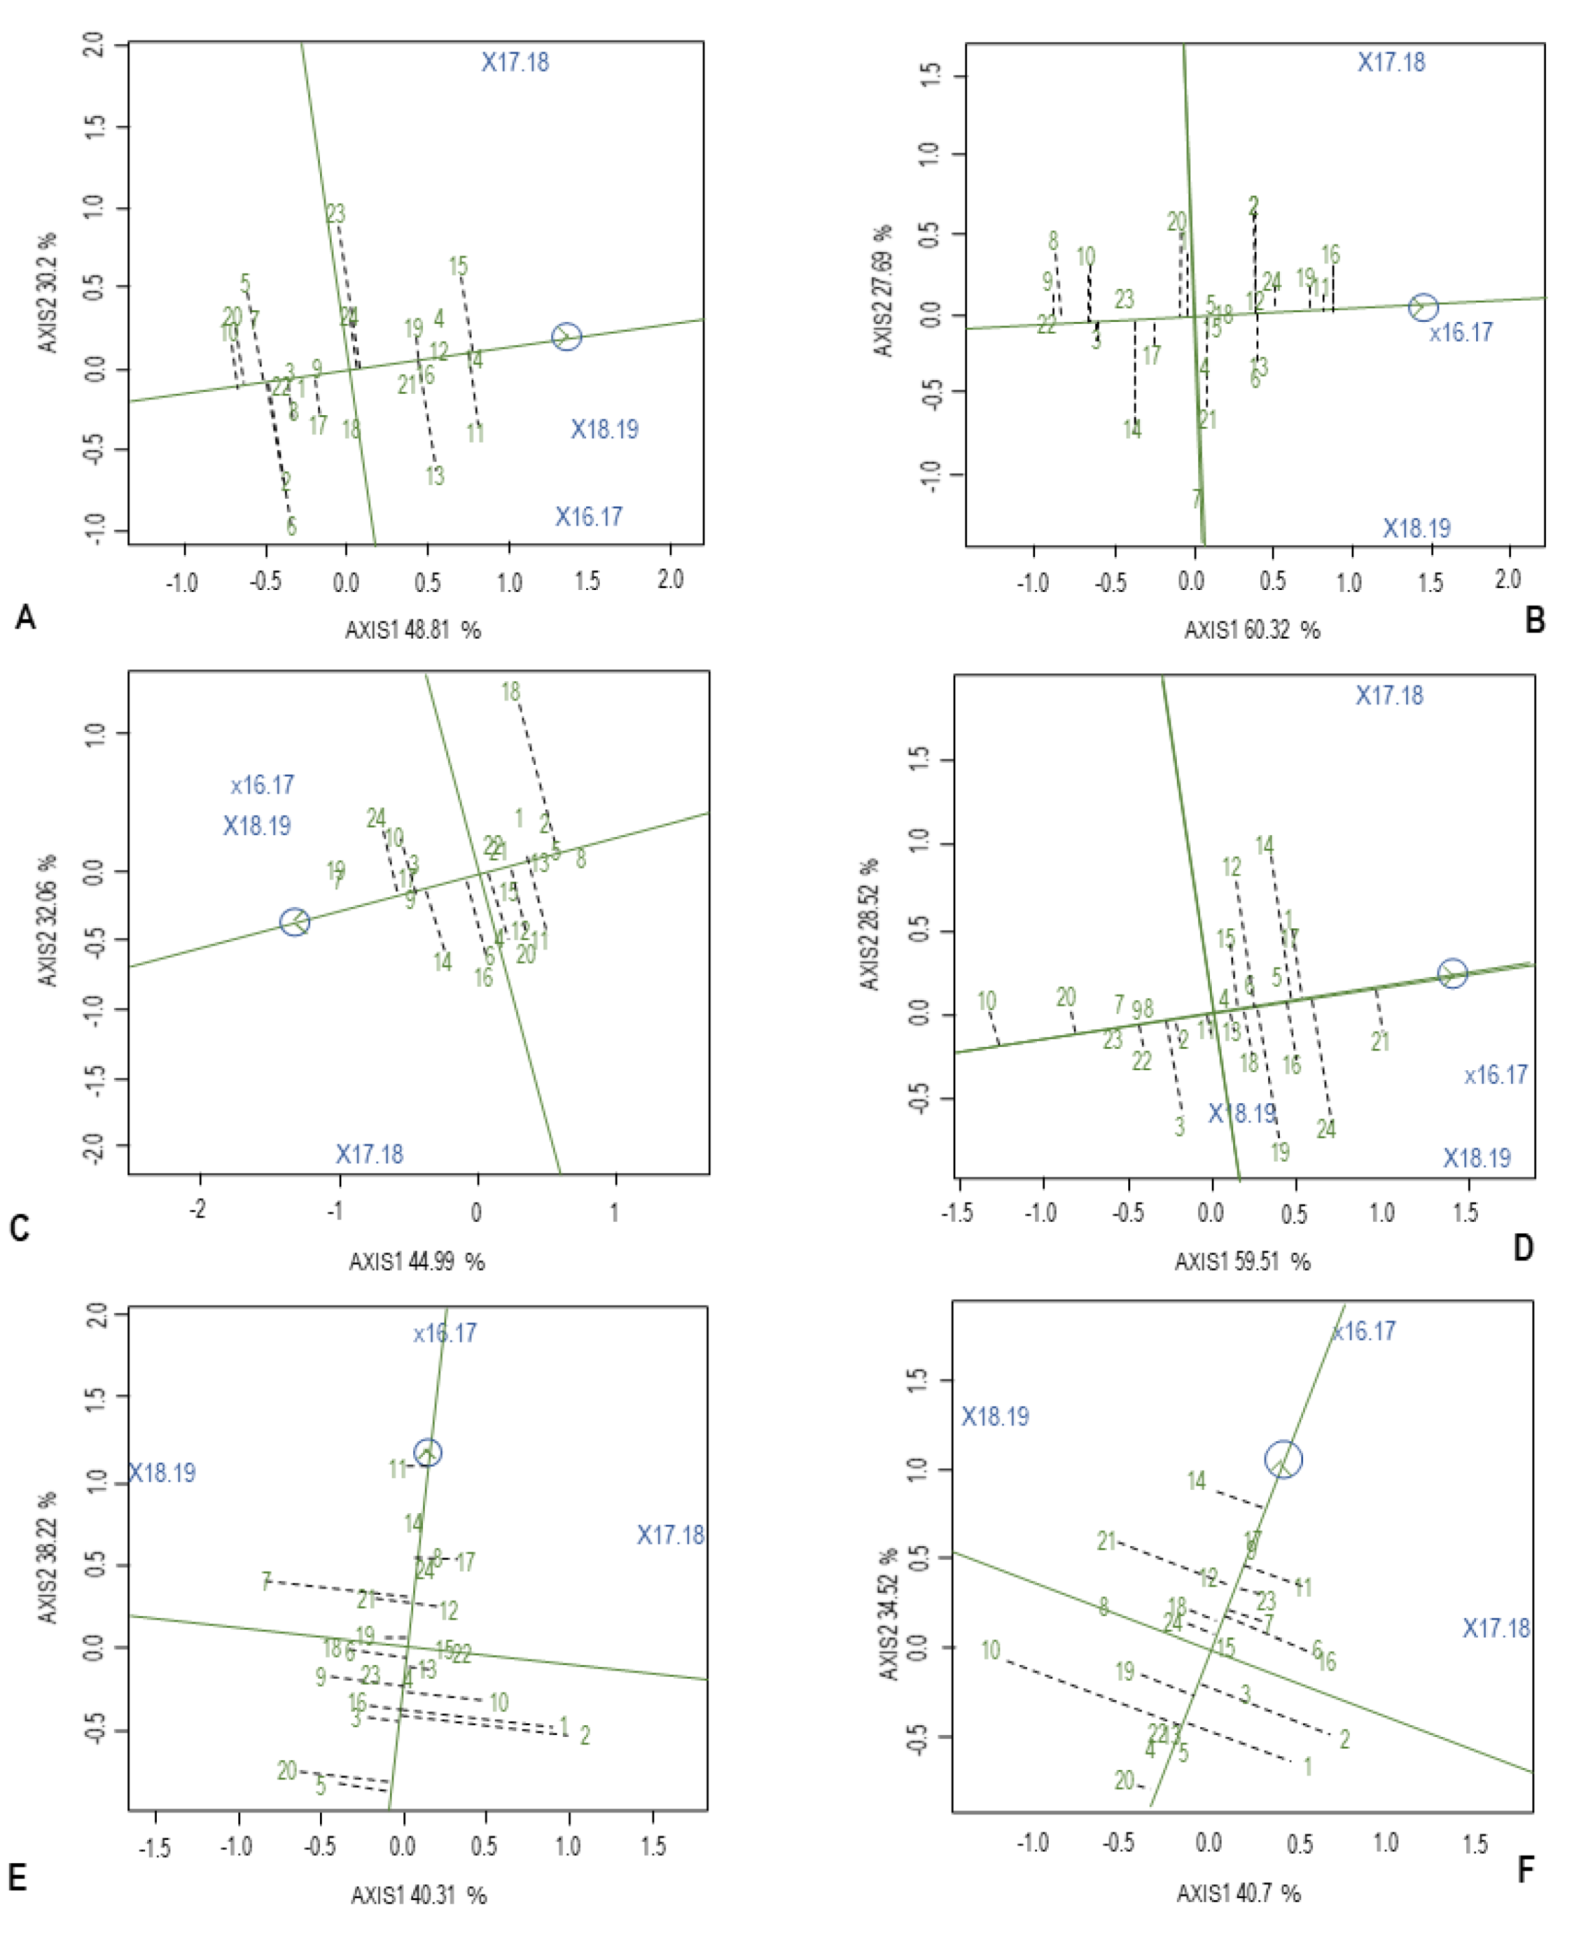
In addition to the stable and high yield (ideotype), Piave was a landrace of interest also for high HW (ranked 4) with relative stability (Figure 2B), as well as high stability with low mean pathogen incidence (ranked 22, Figure 2F). Moreover, Piave showed high above-average high means and relative stability for TFC, FRAP and DPPH. Though the latter were not positioned at a great distance from the MEA, there was the tendency towards being more specifically suited to seasonal conditions of 2018–2019 (Figure 3D–F).
Gamba di Ferro was a landrace of interest for the high stability of several parameters. For both yield and HW, Gamba di Ferro was placed close to the center of origin at the intersection of the co-ordinates, showing closer to average mean performance but with high stability for seasonal variation over the three years (Figure 2A,B). For the technolo-gical properties, Gamba di Ferro was positioned on the MEA, ranking in position 9, 5 and 7 above the average mean in the direction of the arrow for the Zeleny sedimentation value (Figure 2C), total protein (Figure 2D) and wet gluten (Figure 2E), respectively. Similarly, for the functional parameters, this landrace showed high stability and ranked second highest of all the genotypes (position 2) directly on the MEA for both IDF (Figure 3A) and FRAP (Figure 3E), respectively. Gamba di Ferro ranked in position 5 along the MEA for both TPC (Figure 3C) and TFC (Figure 3D), but also was distant from the MEA, with specific suitability to the environmental parameters distinguishing the year x17.18. More-over, this landrace showed the highest DPPH activity (Figure 3F) of all the genotypes (position 1), but with specific suitability to x18.19. However, of note, Gamba di Ferro was ranked the tallest plant with the highest propensity for lodging (Table 3). Both traits showed low stability, being most likely to occur under specific conditions in x18.19 (GGE biplot results not shown), characterized by higher rainfall (Table 2). As mentioned previously, the lodging reported occurred later during maturity and had no effect on yield.
Another genotype of interest was the old variety, Verna (Code 24), for combined stability and above-average mean performance for all technological qualities, as well as for pathogen incidence and some functional parameters. Verna was ranked in position 4, 5 and 3 along the MEA for mean performance in the Zeleny sedimentation value (Figure 2C), total protein (Figure 2D) and wet gluten (Figure 2E), respectively. Being placed directly on the MEA, Verna showed high stability for all of the above traits. Verna demonstrated the lowest propensity for pathogen incidence (position 24) and was relatively close to the MEA (Figure 2F). The old variety was ranked 4 with relative stability for SDF (Figure 3B) and 5 with high stability for FRAP (Figure 3E). For TPC and TFC, Verna ranked in position 3 and 2, respectively for mean performance, but both showed high variability, being more specifically suitable for the conditions of x18.19. However, Verna ranked just below the center of origin for mean yield performance (Figure 2A) and was more suited to x17.18 conditions. Although being a tall plant (ranked 3 in height), unlike Gamba di Ferro, Verna was lodging resistant (ranked 19) showing high stability for both traits (Table 3, GGE biplot results not shown).
Unlike Gamba di Ferro and Verna, that were more suited to broad selection for high stability, the landrace Gentil Bianco (Code 15) and the old variety Guà 113 (Code 17) showed relative yield stability. Gentil Bianco also showed above-average performance for the Zeleny sedimentation value, total protein, wet gluten, IDF and TFC, with relative stability, positioned close to but not on the MEA (Figure 2C–E and Figure 3A,D), and with average mean with relative stability for FRAP and DPPH (Figure 3E,F).
Although close to the MEA, all of the above mentioned factors were potentially better suited to the environment distinctive for 2017–2018. Similarly, Guà 113 showed above-average mean performance for TFC and FRAP with more specific suitability for 2017–2018 (Figure 2C–E and Figure 3D,E). Noteworthy, Guà 113 was highly stable with above average mean for TPC (ranked 4) and DPPH (ranked 2) (Figure 3C,F).
Interestingly, the landrace Abbondanza (Code 1) showed high stability with low yield (Figure 2A) and very low stability with the lowest means for the technological parameters (Figure 2 C–E). Moreover, low means with low stability were also noted for TPC, FRAP and DPPH (Figure 3C,E,F). Similarly, low means with low stability were also demonstrated for the functional parameters in the both the below-average yielding landrace Andriolo (Code 2) and the modern variety Palesio (Code 20), respectively (Figure 2A and Figure 3A,C,E,F).
4. Discussion
The cultivation of resilient crops with stable yield performance amidst unpredictable short term weather variations is of fundamental importance towards ensuring food security. Given the substantial variation in current global wheat yield [3], insufficient efforts towards cultivar selection for climatic uncertainty [5], and the lack of suitable germplasm in sustainable agroecosystems (ideal towards evaluating genetic diversity for resilience) [15], there is increasing interest in the use of seeds of landraces and old varieties, conserved in ex situ genebanks, for on-farm conservation in centers of crop diversity [12]. Podere Santa Croce in Argelato (Emilia-Romagna, Italy) is one such center and the objective of the present study was aimed at addressing the requisite for germplasm with above-average mean performance and stability over three consecutive years, not only for yield but also for technological, phytosanitary and functional quality parameters using the “mean production versus stability” GGE-biplot feature. To date, GGE biplot analyses have been predominantly employed for yield evaluations of agricultural crops and there is a lack of information regarding the mean performance versus stability of quality parameters. The present study, focusing on a collection of 24 soft wheat genotypes, including landraces (eight), old (eight) and modern (eight) varieties, individuated three of the best potential candidates for broad selection based on above-average mean performance and high stability for numerous quality parameters of interest. These included the landraces, Piave and Gamba di Ferro, and the old variety, Verna. Moreover, an additional two candidates, with above-average mean performance and relative stability for numerous parameters of interest, but potentially more suited to specific selection, included the landrace Gentil Bianco and the old variety Guà 113.
With the exception of the old variety Verna, the best performing landraces (Piave, Gamba di Ferro and Gentil Bianco) and old variety (Guà 113) in the present study have not as of yet have been recognized as showing sufficient potential to be registered in the Italian National Register of Conservation Varieties [22] and are currently conserved in either genebanks or on-farm diversity centers. In Italy, The Ministry of Agricultural, Food and Forestry Policies established the Italian National Register of Conservation Varieties in the Legislative Decree of 29 October 2009 [37], thereby permitting the registration of local varieties. The possibility to register the latter would facilitate trading and ultimately the survival of genetic resources that are at present maintained by “guardian farmers” [38]. Hence results of the present study provide incentive for the more extensive use of these old (heritage) genetic resources, not only for yield but also for quality parameters.
The landrace Piave was considered the ideal genotype for yield, combining the highest yield performance with stability, despite variability in both climate and soil parameters over the three year period. Interestingly, although prevalent in Treviso (Veneto) in the 1800s to early 1900s, Piave in that period was considered low-yielding and not sufficiently competitive compared to other landraces and was consequently replaced [23]. Hence, in Emilia-Romagna, Piave performed well as an heirloom variety (landrace taken out of their native habitat to be grown in a different location). Aside from Piave, the collection of landraces (Gentil Bianco, Gamba di Ferro, Gentil Rosso and Andriolo), and old varieties (Guà 113, Mentana, Inallettabile, Fiorello and Abbondanza) ranged from highly stable to relatively stable in yield over the three years period. Though not all the aforementioned landraces and old varieties were a result of natural selection in Emilia-Romagna, these could be considered well-adapted heirloom varieties to the test location. The test location was characterized by varying soil fertility and an erratic distribution of rainfall, along with increasing temperature towards the end of the crop cycle, conditions ty-pical of the Mediterranean climate that compromise yield stability [7,8]. Hence, the present results corroborated previous studies, highlighting the importance of investigating the potential of landraces and old varieties for increased stability amidst unpredictable environmental conditions [13,14,15,16]. Of interest, it was shown that the evolutionary populations, consisting of varietal mixtures, were better able to gradually evolve to adapt to different environments outside the area of origins [16]. In the present study, the soft wheat landraces and old varieties were analyzed in individual stands and not in mixtures, but nonetheless showed yield stability over the three years.
Aside from the quantitative trait of yield, Piave, and more specifically Gamba di Ferro and Verna, displayed both high mean performance combined with high stability for various combinations of technological, phytosanitary and functional parameters, respectively. A major contributory factor to the potential success facilitating the registration of wheat genotypes in the National Register is related to technological (baking) parameters, used for predicting end-use quality [38]. In the present study, both Gamba di Ferro and Verna were highly stable with above-average mean performance for protein and wet gluten content, with Gamba di Ferro demonstrating a highly stable Zeleny sedimentation value, an analogous measure to the gluten index in predicting end-use bread quality. Interestingly, Gentil Bianco showed above-average mean performance for all the technolo-gical parameters measured, although the technological parameters were more specifically suited to specific environmental conditions (2017–2018). Given that there is still limited research on bread-making parameters for both common wheat and durum wheat landraces, together with the need to further improve optimal processing parameters, the requisite for baking tests has been highlighted to provide reliable assessments of technological parameters [38,39]. In the present study, baking tests were not performed. Therefore, in order to further promote the candidate landraces of interest (aside from Verna), it will be necessary to include baking trials in future experiments.
Present results showed that pathogen incidence was significantly higher in 2018–2019, coinciding with the highest rainfall and the highest rate of temperature increase over the maturation period. The effects of climate change are inextricably linked to changes affecting the distribution and outbreak of pathogens [16], with humid and warmer climates favoring leaf rust and other fungal agents. GGE biplot analysis has been effectively used to visually display both the resistance and stability of pure lines selected from wheat landraces as source of genetic diversity to improve breeding efficacy for rust resistant genotypes [40]. Both Piave and Verna were identified as two of the most resistant/stable genotypes to fungal agent attack.
The health promoting benefits of IDF, SDF, TPC, TFC and antioxidant activity are widely reported in the literature and represent functional parameters of interest to investigate the performance of wheat genotypes for resilience or stability to climate change, for which information is scarce. Verna demonstrated both high stability and high means for SDF and FRAP, as well as high means for TPC and TFC but with variable expression, more likely to be favored under conditions of increased rainfall and increased temperature increases during maturation (distinctive for 2018–2019). The beneficial cytoprotective and antiproliferative effects of Verna on cell lines [41], as well as significant beneficial effects on total cholesterol, LDL-cholesterol, as well as for blood glucose in human subjects [42,43], provide motivation for the selection of this old variety in the context of the highly stable FRAP together with phytosanitary and technological quality parameters. Gamba di Ferro also displayed both high stability with high means for IDF and FRAP in addition to high stability for both technological and yield parameters. Instead, the high-yielding old variety Guà 113 displayed high mean performance combined with high stability for TPC and DPPH. In contrast, the below-average yielding varieties, Abbondanza, Andriolo and Palesio all showed below-average performance for functional parameters combined with high variability.
5. Conclusions
Using the “mean performance versus stability” feature of the GGE biplot analysis, high yield stability was shown for the landraces and old varieties in the environmental location of Podere Santa Croce in Emilia-Romagna over three consecutive years. Of the 24 genotypes selected, the landraces Piave and Gamba di Ferro, as well as the old variety, Verna, showed high stability combined with above-average mean for a number of quality parameters of interest, respectively. Additionally, relative stability combined with above-average mean for various quality parameters of interest, aside from yield, was also demonstrated for Gentil Bianco and Guà 113, respectively. Collectively, the above-mentioned genotypes were shown to meet the requisites for suitable germplasm in sustainable agroecosystems, according to the Organic Regulation EU 848/2018 [18] requesting cultivars with the following attributes: enhanced genetic diversity, disease resistance or tolerance, and adaptive potential to diverse local soil and climate conditions. The potential to produce high-quality food was shown, but further investigations including baking tests are required.
Author Contributions
Conceptualization, S.B., L.N. and G.D.; Data curation, S.B., L.N., A.F. and G.O.; Funding acquisition, G.D.; Investigation, S.B., L.N., A.F. and G.O.; Methodology, S.B., L.N. and G.D.; Project administration, S.B.; Writing—original draft, S.B., L.N. and A.W.; Writing—review & editing, S.B., L.N. and A.W. All authors have read and agreed to the published version of the manuscript.
Funding
This research was carried out in the framework of the project “SAVE” (Protection and promotion of ancient common wheat varieties in the Emilia-Romagna region), Project Code: 5015855. The project was funded by Regione Emilia Romagna under the “PSR 2014–2020” program, Focus Area 4A.
Institutional Review Board Statement
Not applicable.
Informed Consent Statement
Not applicable.
Data Availability Statement
Not applicable.
Conflicts of Interest
The authors declare no conflict of interest.
References
- Giraldo, P.; Benavente, E.; Manzano-Agugliaro, F.; Gimenez, E. Worldwide Research Trends on Wheat and Barley: A Bibliometric Comparative Analysis. Agronomy 2019, 9, 352. [Google Scholar] [CrossRef] [Green Version]
- Cassman, K.G. What do we need to know about global food security? Glob. Food Secur. 2012, 1, 81–82. [Google Scholar] [CrossRef]
- Ray, D.K.; Gerber, J.S.; MacDonald, G.K.; West, P.C. Climate variation explains a third of global crop yield variability. Nat. Commun. 2015, 6, 5989. [Google Scholar] [CrossRef] [Green Version]
- Senapati, N.; Semenov, M.A. Large genetic yield potential and genetic yield gap estimated for wheat in Europe. Glob. Food Sec. 2020, 24, 100340. [Google Scholar] [CrossRef] [PubMed]
- Kahiluoto, H.; Kaseva, J.; Balek, J.; Olesen, J.E.; Ruiz-Ramos, M.; Gobin, A.; Kersebaum, K.C.; Tak’ac, J.; Ruget, F.; Ferrise, R.; et al. Decline in climate resilience of European wheat. Proc. Natl. Acad. Sci. USA 2019, 116, 123–128. [Google Scholar] [CrossRef] [Green Version]
- Hristov, J.; Toreti, A.; Pérez Domínguez, I.; Dentener, F.; Fellmann, T.; Elleby, C.; Ceglar, A.; Fumagalli, D.; Niemeyer, S. Analysis of Climate Change Impacts on EU Agriculture by 2050; EUR 30078 EN; Publications Office of the European Union: Luxembourg, 2020. [Google Scholar] [CrossRef]
- Carranza-Gallego, G.; Guzmán, G.I.; Garcia-Ruíz, R.; González de Molina, M.; Aguilera, E. Addressing the Role of Landraces in the Sustainability of Mediterranean Agroecosystems. Sustainability 2019, 11, 6029. [Google Scholar] [CrossRef] [Green Version]
- de Lima, V.J.; Gracia-Romero, A.; Rezzouk, F.Z.; Diez-Fraile, M.C.; Araus-Gonzalez, I.; Kamphorst, S.H.; do Amaral Júnior, A.T.; Kefauver, S.C.; Aparicio, N.; Araus, J.L. Comparative Performance of High-Yielding European Wheat Cultivars Under Contrasting Mediterranean Conditions. Front. Plant. Sci. 2021, 12, 687622. [Google Scholar] [CrossRef]
- Reynolds, M.P.; Lewis, J.M.; Ammar, K.; Basnet, B.R.; Crespo-Herrera, L.; Crossa, J.; Dhugga, K.S.; Dreisigacker, S.; Juliana, P.; Karwat, H.; et al. Harnessing translational research in wheat for climate resilience. J. Exp. Bot. 2021, 72, 5134–5157. [Google Scholar] [CrossRef]
- Wolfe, M.S.; Baresel, J.P.; Desclaux, D.; Goldringer, I.; Hoad, S.; Kovacs, G.; van Bueren, E.T.L. Developments in breeding cereals for organic agriculture. Euphytica 2008, 163, 323–346. [Google Scholar] [CrossRef] [Green Version]
- Altieri, M.A.; Nicholls, C.I.; Henao, A.; Lana, M.A. Agroecology and the design of climate change-resilient farming systems. Agron. Sustain. Dev. 2015, 35, 869–890. [Google Scholar] [CrossRef] [Green Version]
- Bellon, M.R.; van Etten, J. Climate change and on-farm conservation of crop landraces in centres of diversity. In Plant Genetic Resources and Climate Change; Jackson, M., Ford-Lloyd, B., Parry, M., Eds.; CABI-ebooks: Wallingford, UK, 2014; pp. 137–150, Chapter 8. [Google Scholar] [CrossRef] [Green Version]
- Koutis, K.G.; Mavromatis, A.; Baxevanos, D.; Koutsika-Sotiriou, M. Multienvironmental evaluation of wheat landraces by GGE Biplot Analysis for organic breeding. Agric. Sci. 2012, 3, 66–74. [Google Scholar] [CrossRef] [Green Version]
- Ghiselli, L.; Rossi, E.; Whittaker, A.; Dinelli, G.; Baglio, A.P.; Andrenelli, L.; Benedetteli, S. Nutritional characteristics of ancient Tuscan varieties of Triticum aestivum L. Ital. J. Agron. 2016, 11, 750. [Google Scholar] [CrossRef] [Green Version]
- Migliorini, P.; Spagnolo, S.; Torria, L.; Arnoulet, M.; Lazzerini, G.; Ceccarelli, S. Agronomic and quality characteristics of old, modern and mixture wheat varieties and landraces for organic bread chain in diverse environments of northern Italy. Eur. J. Agron. 2016, 79, 131–141. [Google Scholar] [CrossRef]
- Bocci, R.; Bussi, B.; Petitti, M.; Franciolini, R.; Altavilla, V.; Galluzzi, G.; Di Luzio, P.; Migliorini, P.; Spagnolo, S.; Floriddia, R.; et al. Yield, yield stability and farmers’ preferences of evolutionary populations of bread wheat: A dynamic solution to climate change. Eur. J. Agron. 2020, 121, 126156. [Google Scholar] [CrossRef]
- AGRI-Food Data Portal—Cereals Production. Directorate-General for Agriculture and Rural Development of the European Union. Available online: https://agridata.ec.europa.eu/extensions/DashboardCereals/CerealsProduction.html (accessed on 30 September 2021).
- European Regulation (EU) 2018/848 of the European Parliament and of the Council of 30 May 2018. Available online: https://eur-lex.europa.eu/eli/reg/2018/848/2020-11-14#B-1 (accessed on 8 November 2021).
- Yan, W.; Hunt, L.A.; Sheng, Q.; Szlavnics, Z. Cultivar evaluation and mega-environment investigation based on the GGE biplot. Crop. Sci. 2000, 40, 597–605. [Google Scholar] [CrossRef]
- Ding, M.; Tier, B.; Yan, W.; Wu, H.X.; Powell, M.B.; McRae, T.A. Application of GGE biplot analysis to evaluate Genotype (G), Environment (E), and G×E interaction on Pinus radiata: A case study. N. Z. J. For. Sci. 2008, 38, 132–142. [Google Scholar]
- Borasio, E. Classificazione merceologica del frumento con indici di qualità. Agricoltura 1997, 9, 59–61. [Google Scholar]
- Assosementi (Associazione Italiana Sementi). Available online: http://www.sementi.it/articoli/163/registro-nazionale-varieta-specie-agrarie. (accessed on 7 October 2021).
- Informazioni Storiche —Biodiversità del Veneto. Available online: http://biodiversita.provincia.vicenza.it/pagstor/h_ita0340001.htm (accessed on 7 October 2021).
- Frumento Tenero—Co.Na.Se. Available online: https://www.conase.it/prodotti/cereali/frumento-tenero (accessed on 7 October 2021).
- Peterson, R.F.; Campbell, A.B.; Hannah, A.E. A diagrammatic scale for estimating rust intensity on leaves and stems of cereals. Can. J. Res. 1948, 26, 496–500. [Google Scholar] [CrossRef]
- Zheng, Z.; Humphrey, C.W.; King, R.S.; Richard, J.L. Validation of an ELISA test kit for the detection of total aflatoxins in grain and grain products by comparison with HPLC. Mycopathologia 2005, 159, 255–263. [Google Scholar] [CrossRef] [PubMed]
- Prosky, L.; Asp, N.-G.; Schweizer, T.F.; De Vries, J.W.; Furda, L. Determination of insoluble, soluble, and total dietary fibre in foods and food products. J. Assoc. Off. Anal. Chem. 1988, 71, 1017–1023. [Google Scholar]
- Lee, S.C.; Prosky, L.; De Vries, J.W. Determination of total, soluble and insoluble fibre in foods-enzymatic–gravimetric method. J. Assoc. Off. Anal. Chem. 1992, 75, 395–416. [Google Scholar]
- Dinelli, G.; Segura-Carretero, A.; Di Silvestro, R.; Marotti, I.; Arráez-Román, D.; Benedettelli, S.; Ghiselli, L.; Fernadez-Gutierrez, A. Profiles of phenolic compounds in modern and old common wheat varieties determined by liquid chromatography coupled with time-of-flight mass spectrometry. J. Chromatogr. A 2011, 1218, 7670–7681. [Google Scholar] [CrossRef]
- Singleton, V.L.; Orthofer, R.; Lamuela-Raventós, R.M. Analysis of total phenols and other oxidation substrates and antioxidants by means of folin-ciocalteu reagent. Methods Enzymol. 1999, 299, 152–178. [Google Scholar] [CrossRef]
- Adom, K.K.; Sorrells, M.E.; Liu, R.H. Phytochemical profiles and antioxidant activity of wheat varieties. J. Agric. Food Chem. 2003, 51, 7825–7834. [Google Scholar] [CrossRef] [PubMed]
- Floegel, A.; Kim, D.O.; Chung, S.J.; Koo, S.I.; Chun, O.K. Comparison of ABTS/DPPH assays to measure antioxidant capacity in popular antioxidant-rich US foods. J. Food Compos. Anal. 2011, 24, 1043–1048. [Google Scholar] [CrossRef]
- Benzie, I.F.F.; Strain, J.J. The ferric reducing ability of plasma (FRAP) as a measure of “antioxidant power”: The FRAP assay. Anal. Biochem. 1996, 239, 70–76. [Google Scholar] [CrossRef] [Green Version]
- Frutos, E.; Galindo, M.P.; Leiva, V. An interactive biplot implementation in R for modeling genotype-by-environment interaction. Stoch. Environ. Res. Risk Assess. 2014, 28, 1629–1641. [Google Scholar] [CrossRef]
- Neisse, A.; Kirch, J.; Hongyu, K. AMMI and GGE Biplot for genotype × environment interaction: A medoid–based hierarchical cluster analysis approach for high–dimensional data. Biom. Lett. 2018, 55, 97–121. [Google Scholar] [CrossRef] [Green Version]
- EC. Commission Regulation (EC) No 1126/2007 of 28 September 2007. Available online: https://eur-lex.europa.eu/LexUriServ/LexUriServ.do?uri=OJ:L:2007:255:0014:0017:EN:PDF35 (accessed on 14 October 2021).
- Decreto Legislativo 29 ottobre 2009, n.149-—Camera.it. Available online: https://www.camera.it/parlam/leggi/deleghe/09149dl.htm (accessed on 5 November 2021).
- Spina, A.; Dinelli, G.; Palumbo, M.; Whittaker, A.; Cambrea, M.; Bosi, S. Evaluation of standard physico-chemical and rheological parameters in predicting bread-making quality of durum wheat (Triticum turgidum L. ssp. durum [Desf.] Husn.). Int. J. Food Sci. Technol. 2021, 56. [Google Scholar] [CrossRef]
- Boukid, F.; Gentilucci, V.; Vittadini, E.; De Montis, A.; Rosta, R.; Bosi, S.; Dinelli, G.; Carini, E. Rediscovering bread quality of “old” Italian wheat (Triticum aestivum L. ssp. aestivum) through an integrated approach: Physicochemical evaluation and consumers’ perception. LWT Food Sci. Technol. 2020, 122, 109043. [Google Scholar] [CrossRef]
- Akan, K.; Akcura, M. GGE biplot analysis of reactions of bread wheat pure lines selected from central anatolian landraces of Turkey to leaf rust disease (Puccinia triticina) in multiple location-years. Cereal Res. Commun. 2018, 46, 311–320. [Google Scholar] [CrossRef] [Green Version]
- Leoncini, E.; Prata, C.; Malaguti, M.; Marotti, I.; Segura-Carretero, A.; Catizone, P.; Dinelli, G.; Hrelia, S. Phytochemical profile and nutraceutical value of old and modern common wheat cultivars. PLoS ONE 2012, 7, e45997. [Google Scholar] [CrossRef] [Green Version]
- Sofi, F.; Ghiselli, L.; Cesari, F.; Gori, A.M.; Mannini, L.; Casini, A.; Vazzana, C.; Vecchio, V.; Gensini, G.F.; Abbate, R.; et al. Effects of short-term consumption of bread obtained by an old Italian grain variety on lipid, inflammatory, and haemorheological variables: An intervention study. J. Med. Food 2010, 13, 1–6. [Google Scholar] [CrossRef] [PubMed]
- Sereni, A.; Cesari, F.; Gori, A.M.; Maggini, N.; Marcucci, R.; Casini, A.; Sofi, F. Cardiovascular benefits from ancient grain bread consumption: Findings from a double-blinded randomized crossover intervention trial. Int. J. Food Sci. Nutr. 2016, 68, 97–103. [Google Scholar] [CrossRef] [PubMed]
Figure 1.
Total precipitation and mean temperature over the cultivation years for 2016–2017 (A) 2017–2018 (B) and 2018–2019 (C) at Podere Santa Croce, Argelato (Emilia-Romagna, Italy).
Figure 1.
Total precipitation and mean temperature over the cultivation years for 2016–2017 (A) 2017–2018 (B) and 2018–2019 (C) at Podere Santa Croce, Argelato (Emilia-Romagna, Italy).

Figure 2.
GGE-biplot analysis for “mean performance versus stability” for yield (A), hectrolitre weight (B), Zeleny sedimentation value (C), total protein (D), wet gluten (E) and pathogen incidence (F) for 1 (Abbondanza), 2 (Andriolo), 3 (Aquilante), 4 (Autonomia A), 5 (Benco), 6 (Bianco Nostrale), 7 (Bilancia), 8 (Blasco), 9 (Bolero), 10 (Bologna), 11 (Canove), 12 (Fiorello), 13 (Frassineto), 14 (Gamba di ferro), 15 (Gentil Bianco), 16 (Gentil Rosso), 17 (Guà 113), 18 (Inallettabile), 19 (Mentana), 20 (Palesio), 21 (Piave), 22 (Rebelde), 23 (Sagittario) and 24 (Verna). x16.17, x17.18 and x18.19 represent the three cultivation years.

Figure 3.
GGE-biplot analysis for “mean performance versus stability” for IDF (A), SDF (B), TPC (C), TFC (D), FRAP (E) and DPPH (F) for 1 (Abbondanza), 2 (Andriolo), 3 (Aquilante), 4 (Autonomia A), 5 (Benco), 6 (Bianco Nostrale), 7 (Bilancia), 8 (Blasco), 9 (Bolero), 10 (Bologna), 11 (Canove), 12 (Fiorello), 13 (Frassineto), 14 (Gamba di ferro), 15 (Gentil Bianco), 16 (Gentil Rosso), 17 (Guà 113), 18 (Inallettabile), 19 (Mentana), 20 (Palesio), 21 (Piave), 22 (Rebelde), 23 (Sagittario) and 24 (Verna). x16.17, x17.18 and x18.19 represent the three cultivation years.


Table 1.
The landraces, old and modern Triticum aestivum L. varieties cultivated at Podere Santa Croce (Emilia Romagna) over three consecutive cultivation years (2016–2019).
Table 1.
The landraces, old and modern Triticum aestivum L. varieties cultivated at Podere Santa Croce (Emilia Romagna) over three consecutive cultivation years (2016–2019).
| Code | Genotype | Classification | Year | Breeder | Area of Origin/Adaptability |
|---|---|---|---|---|---|
| 1 | Abbondanza | Old | 1950 | M. Michahelles | Tuscany/hills, mountains |
| 2 | Andriolo | Landrace | - | - | Tuscany (1800s)/mountains |
| 3 | Aquilante | Modern (FP) | 2006 | CO.NA.SE (ER) | |
| 4 | Autonomia A | Old | 1938 | M. Michahelles | Central Italy/lowlands |
| 5 | Benco | Landrace | - | - | Diffuse Tuscany |
| 6 | Bianco Nostrale | Landrace | - | - | Tuscany/mountains |
| 7 | Bilancia | Modern (FP) | 1996 | Psb, (ER) | - |
| 8 | Blasco | Modern (FPS) | 2002 | CO.NA.SE (ER) | - |
| 9 | Bolero | Modern (FP) | 1987 | Venturoli Sementi, (ER), C.C. Beniost (France), | |
| 10 | Bologna | Modern (FF) | 1999 | SIS (ER), C.C. Benoist (France) | |
| 11 | Canove | Landrace | - | - | Veneto/mountains |
| 12 | Fiorello | Old | 1947 | IABO | Emilia-Romagna |
| 13 | Frassineto | Old | 1932 | M. Michahelles | Tuscany/mountains, hills |
| 14 | Gamba di Ferro | Landrace | - | - | - |
| 15 | Gentil Bianco | Landrace | - | - | Tuscany (1800s)/hills |
| 16 | Gentil Rosso | Landrace | - | - | Central Italy |
| 17 | Guà 113 | Old | 1936 | Ricciarelli. | Veneto/lowlands |
| 18 | Inallettabile | Old | 1920 | F. Todaro | north-central Italy/lowlands, |
| 19 | Mentana | Old | 1923 | N. Strampelli | Central Italy |
| 20 | Palesio | Modern (FP) | 2000 | SIS (ER) | - |
| 21 | Piave | Landrace | - | - | Veneto (1800s)/hills |
| 22 | Rebelde | Modern (FF) | 2012 | CO.NA.SE (ER) | - |
| 23 | Sagittario | Modern (FF) | 1995 | Psb (ER) | - |
| 24 | Verna | Old | 1941 | M. Gasperini | Tuscany/mountains |
Consorzio Nazionale Sementi (CO.NA.SE), Emilia-Romagna (ER), Istituto Allevamento Vegetale Bologna (IABO), Società Italiana Sementi (SIS), Società Produttori Sementi (Psb); ordinary bread making wheat (FP), superior bread making wheat (FPS), improved wheat (FF). The information was obtained from the following sources: [22,23,24].
Table 2.
Soil parameters prior sowing and meteorological conditions during growth crop as distinctive parameters for the three cultivation years of 24 soft wheat genotypes.
Table 2.
Soil parameters prior sowing and meteorological conditions during growth crop as distinctive parameters for the three cultivation years of 24 soft wheat genotypes.
| Soil Parameters Prior to Sowing | Year 2016–2017 | Year 2017–2018 | Year 2018–2019 |
|---|---|---|---|
| pH | 7.61 | 6.57 | 7.57 |
| Organic matter (%/DM) | 1.2 | 3.3 | 3.7 |
| Total N (%/DM) | 0.7 | 1.4 | 1.5 |
| C/N ratio | 9.7 | 13.6 | 14.7 |
| Assimilable P (mg/kg DM) | 38.6 | 19.0 | 31.5 |
| Assimilable K (mg/kg DM) | 229 | 215 | 215 |
| Meteorological Conditions during Crop Growth | |||
| December–June: cumulative rainfall (mm) | 287 | 384 | 337 |
| April–June: cumulative rainfall (mm) | 184 | 123 | 265 |
| April–June: number of rainfall days | 16 | 28 | 35 |
| April–June: T max increase (°C/month) | 3.51 | 2.46 | 4.10 |
| April–June: T min increase (°C/month) | 3.21 | 2.12 | 3.33 |
| T max at harvest (°C) | 31.20 | 30.09 | 31.19 |
Meterological data provided by the Regional Agency for Prevention, Environment and Energy meteorological station (Arpae, Emilia-Romagna). The soil parameters were supplied by Agriparadigma laboratories.
Table 3.
Mean yield and agronomic parameters of 24 Triticum aestivum L. varieties over three consecutive cultivation years (2016–2019).
Table 3.
Mean yield and agronomic parameters of 24 Triticum aestivum L. varieties over three consecutive cultivation years (2016–2019).
| Yield | HW | Height | Lodging | Spikes/m2 | Kernels/Spike | TKW | |
|---|---|---|---|---|---|---|---|
| (t/ha) | (kg/hL) | (cm) | (%) | (Number) | (Number) | (g) | |
| Year | *** | *** | *** | *** | *** | *** | *** |
| 2016/2017 | 3.35 b | 76.5 a | 104.8 a | 20.9 b | 151.9 b | 50.0 a | 48.4 a |
| 2017/2018 | 3.00 c | 76.6 a | 91.9 b | 51.0 a | 150.0 b | 48.5 a | 42.9 b |
| 2018/2019 | 3.87 a | 74.9 b | 106.7 a | 17.2 c | 258.0 a | 37.0 b | 43.0 b |
| Variety | ns | *** | *** | *** | *** | ** | ns |
| Abbondanza | 2.25 | 73.4 h | 86.5 g | 5.00 a | 119.4 h | 45.5 c–f | 42.3 |
| Andriolo | 2.69 | 76.0 c–f | 115.7 de | 21.7 bc | 144.5 f–h | 47.2 b–f | 42.4 |
| Aquilante | 3.38 | 79.7 a | 72.8 h | 0 a | 136.0 gh | 56.3 a | 45.3 |
| Autonomia A | 3.63 | 76.6 cde | 105.6 f | 37.5 ef | 173.0 c–h | 47.8 b–f | 44.9 |
| Benco | 3.46 | 74.5 fgh | 124.9 c | 80.0 j | 234.0 bc | 33.9 h | 46.4 |
| Bianco Nostrale | 3.01 | 76.5 cde | 125.6 c | 81.7 j | 208.9 b–f | 33.9 h | 45.8 |
| Bilancia | 3.51 | 73.8 gh | 60.7 j | 5.83 a | 161.1 d–h | 50.5 a–d | 44.3 |
| Blasco | 3.42 | 80.0 a | 71.3 hi | 2.50 a | 177.6 c–h | 51.8 a–c | 43.2 |
| Bolero | 3.68 | 73.4 h | 70.3 hi | 0 a | 180.8 c–h | 46.6 c–f | 46.6 |
| Bologna | 3.79 | 76.2 c–f | 72.2 h | 0 a | 154.8 e–h | 54.9 ab | 49.3 |
| Canove | 3.61 | 75.2 e–h | 118.0 d | 68.3 h | 213.2 b–e | 42. 8 d–g | 41.5 |
| Fiorello | 3.06 | 76.5 cde | 89.70 g | 5.00 a | 164.4 d–h | 41.4 e–h | 45.7 |
| Frassineto | 3.32 | 75.8 c–f | 124.0 c | 32.5 de | 221.3 b–d | 35.3 gh | 47.5 |
| Gamba di Ferro | 3.55 | 75.9 c–f | 140.2 a | 88.3 j | 246.3 b | 33.8 h | 45.1 |
| Gentil Bianco | 4.00 | 75.5 d–g | 117.1 de | 34.2 de | 210.8 b–e | 46.6 c–f | 43.1 |
| Gentil Rosso | 3.08 | 75.5 d–g | 132.0 b | 81.3 j | 165.7 d–h | 48.2 b–e | 44.5 |
| Guà 113 | 3.83 | 74.7 e–h | 115.9 de | 51.7 g | 177.8 c–h | 50.2 a–d | 44.6 |
| Inallettabile | 3.11 | 76.1 c–f | 114.1 de | 26.7 cd | 199.8 b–g | 40.1 f–h | 43.6 |
| Mentana | 3.25 | 77.4 cd | 111.7 e | 43.3 f | 191.1 b–g | 40.6 e–h | 43.4 |
| Palesio | 2.86 | 76.2 c–f | 75.7 h | 0 a | 135.7 gh | 47.5 b–f | 45.5 |
| Piave | 4.81 | 77.7 bc | 116.6 de | 32.5 de | 367.5 a | 37.4 gh | 41.1 |
| Rebelde | 3.89 | 79.1 ab | 74.4 h | 0 a | 181.7 c–h | 53.2 a–c | 47.0 |
| Sagittario | 3.43 | 74.4 f–h | 65.8 ij | 0 a | 151.3 e–h | 51.8 a–c | 49.2 |
| Verna | 3.14 | 73.8 gh | 126.6 bc | 15.0 b | 162.6 d–h | 46.1 c–f | 42.2 |
| Year × Variety | *** | *** | *** | *** | ** | *** | *** |
Two-way ANOVA for Year and Variety and their interaction (Year × Variety). ** p ≤ 0.01 *** p ≤ 0.01, ns: not significant. Different letters (a–j) denote significant differences between the varieties.
Table 4.
Mean technological and phytosanitary quality parameters of 24 Triticum asetivum L. varieties over three consecutive cultivation years (2016–2019).
Table 4.
Mean technological and phytosanitary quality parameters of 24 Triticum asetivum L. varieties over three consecutive cultivation years (2016–2019).
| Total Protein | Zeleny Value | Wet Gluten | Pathogens | DON | |
|---|---|---|---|---|---|
| (%) | (mL) | (%) | (0–10 Scale) | (ppb) | |
| Year | *** | *** | *** | *** | *** |
| 2016/2017 | 13.0 a | 34.5 a | 26.9 a | 1.27 c | 212.2 a |
| 2017/2018 | 12.7 a | 34.0 a | 25.6 a | 1.73 b | 202.3 b |
| 2018/2019 | 11.5 b | 25.0 b | 21.5 b | 4.77 a | 200.0 b |
| Variety | *** | * | ** | ns | *** |
| Abbondanza | 10.4 j | 21.5 m | 21.2 fg | 2.17 | 211 a–d |
| Andriolo | 12.2 d–h | 29.9 g–k | 25.2 b–e | 2.33 | 200 d |
| Aquilante | 12.6 c–g | 27.6 i–l | 23.4 c–g | 4.33 | 220 ab |
| Autonomia A | 12.0 e–h | 28.2 i–l | 23.7 c–g | 2.50 | 200 d |
| Benco | 12.8 b–f | 30.7 f–i | 25.8 b–e | 1.83 | 222 ab |
| Bianco Nostrale | 13.1 b–d | 35.3 b–d | 26.9 a–c | 2.17 | 200 d |
| Bilancia | 11.6 hi | 26.6 kl | 22.7 d–g | 2.83 | 200 d |
| Blasco | 11.9 f–h | 25.4 l | 20.3 g | 4.17 | 217 a–c |
| Bolero | 12.8 b–f | 31.9 d–g | 23.7 b–g | 3.00 | 200 d |
| Bologna | 12.3 c–h | 33.0 c–f | 24.6 b–f | 1.83 | 200 d |
| Canove | 11.8 f–h | 28.1 i–l | 23.2 c–g | 3.00 | 200 d |
| Fiorello | 13.3 bc | 37.5 b | 26.8 a–c | 2.83 | 200 d |
| Frassineto | 13.7 ab | 35.5 bc | 27.6 ab | 2.83 | 200 d |
| Gamba di Ferro | 13.1 b–d | 32.9 c–f | 25.7 b–e | 2.67 | 201 cd |
| Gentil Bianco | 12.8 b–f | 33.0 c–g | 26.4 a–d | 2.50 | 200 d |
| Gentil Rosso | 12.1 d–h | 31.8 e–h | 24.3 b–f | 1.33 | 200 d |
| Guà 113 | 12.2 d–h | 30.5 f–j | 24.8 b–f | 1.83 | 200 d |
| Inallettabile | 14.2 a | 41.4 a | 29.6 a | 2.83 | 200 d |
| Mentana | 13.0 b–d | 34.6 b–e | 24.7 b–f | 2.33 | 212 a–d |
| Palesio | 11.9 f–h | 29.6 g–k | 24.5 b–f | 2.67 | 207 b–d |
| Piave | 11.7 g–i | 28.3 i–l | 24.2 b–f | 2.00 | 200 d |
| Rebelde | 12.4 c–h | 27.1 j–l | 22.3 e–g | 3.50 | 226 a |
| Sagittario | 10.8 ij | 28.5 h–l | 23.3 c–g | 3.50 | 200 d |
| Verna | 12.9 b–e | 33.8 c–f | 26.7 a–c | 1.17 | 200 d |
| Year × Variety | *** | *** | ns | *** | *** |
Two-way ANOVA for Year and Variety and their interaction (Year × Variety). * p ≤ 0.05 ** p ≤ 0.01 *** p ≤ 0.01, ns: not significant. Different letters (a–m) denote significant differences between the varieties.
Table 5.
Mean functional quality parameters of 24 Triticum aestivum L. varieties over three consecutive cultivation years (2016–2019).
Table 5.
Mean functional quality parameters of 24 Triticum aestivum L. varieties over three consecutive cultivation years (2016–2019).
| IDF | SDF | TPC | TFC | FRAP | DPPH | |
|---|---|---|---|---|---|---|
| (g/100 g) | (g/100 g) | (mg/100 g) | (mg/100 g) | (mmol/100 g) | (mmol/100 g) | |
| Year | ns | ** | *** | ** | *** | *** |
| 2016/2017 | 15.5 | 5.16 a | 275 b | 90.5 b | 1.01 a | 2.78 b |
| 2017/2018 | 16.7 | 4.53 b | 291 a | 111 a | 0.62 b | 3.96 a |
| 2018/2019 | 16.4 | 4.96 a | 211 c | 92.4 b | 1.00 a | 2.65 b |
| Variety | ns | ** | ns | * | ns | ns |
| Abbondanza | 15.5 | 4.81 c–f | 234 | 119.5 ab | 0.67 | 2.54 |
| Andriolo | 14.5 | 5.38 a–d | 233 | 89.5 gh | 0.70 | 2.74 |
| Aquilante | 15.3 | 4.11 g–i | 275 | 82.4 ij | 0.83 | 3.05 |
| Autonomia A | 17.9 | 5.00 c–f | 260 | 101 d–f | 0.82 | 2.70 |
| Benco | 15.2 | 5.02 c–f | 233 | 112 bc | 0.68 | 2.71 |
| Bianco Nostrale | 14.3 | 5.39 a–d | 265 | 106 c–e | 0.84 | 3.44 |
| Bilancia | 15.1 | 4.90 c–f | 301 | 82.5 h–j | 0.99 | 3.18 |
| Blasco | 15.2 | 3.80 i | 226 | 86.1 hi | 1.02 | 2.57 |
| Bolero | 15.8 | 3.73 i | 280 | 84.7 h–j | 0.86 | 3.77 |
| Bologna | 14.7 | 4.05 hi | 278 | 61.8 k | 0.87 | 3.02 |
| Canove | 18.0 | 5.92 a | 248 | 95.4 fg | 0.96 | 3.16 |
| Fiorello | 17.7 | 5.39 a–d | 255 | 115 a–c | 0.95 | 3.43 |
| Frassineto | 16.8 | 5.40 a–d | 239 | 99.05 d–f | 0.89 | 2.76 |
| Gamba di Ferro | 18.1 | 4.42 e–i | 281 | 122.48 a | 1.01 | 3.90 |
| Gentil Bianco | 18.6 | 5.05 c–f | 252 | 107.3 cd | 0.92 | 3.22 |
| Gentil Rosso | 17.3 | 5.99 a | 270 | 106.5 c–e | 0.85 | 3.43 |
| Guà 113 | 15.4 | 4.57 e–h | 279 | 117.5 ab | 0.99 | 3.80 |
| Inallettabile | 15.9 | 5.14 b–e | 224 | 100.3 d–f | 0.89 | 2.85 |
| Mentana | 17.4 | 5.80 ab | 299 | 97.6 e–g | 0.84 | 3.07 |
| Palesio | 14.7 | 4.76 d–g | 256 | 75.4 j | 0.74 | 2.75 |
| Piave | 17.0 | 5.00 c–f | 249 | 123.8 a | 0.92 | 3.39 |
| Rebelde | 15.2 | 3.73 i | 249 | 82.5 h–j | 0.94 | 2.75 |
| Sagittario | 17.2 | 4.35 f–i | 249 | 79.4 ij | 0.91 | 3.49 |
| Verna | 16.7 | 5.52 a–c | 280 | 106.9 c–e | 0.93 | 3.45 |
| Year × Variety | *** | *** | *** | *** | *** | *** |
Two-way ANOVA for Year and Variety and their interaction (Year × Variety). * p ≤ 0.05 ** p ≤ 0.01 *** p ≤ 0.01, ns: not significant. Different letters (a–k) denote significant differences between the varieties.
Publisher’s Note: MDPI stays neutral with regard to jurisdictional claims in published maps and institutional affiliations. |
© 2022 by the authors. Licensee MDPI, Basel, Switzerland. This article is an open access article distributed under the terms and conditions of the Creative Commons Attribution (CC BY) license (https://creativecommons.org/licenses/by/4.0/).
Share and Cite
MDPI and ACS Style
Bosi, S.; Negri, L.; Fakaros, A.; Oliveti, G.; Whittaker, A.; Dinelli, G. GGE Biplot Analysis to Explore the Adaption Potential of Italian Common Wheat Genotypes. Sustainability 2022, 14, 897. https://doi.org/10.3390/su14020897
AMA Style
Bosi S, Negri L, Fakaros A, Oliveti G, Whittaker A, Dinelli G. GGE Biplot Analysis to Explore the Adaption Potential of Italian Common Wheat Genotypes. Sustainability. 2022; 14(2):897. https://doi.org/10.3390/su14020897
Chicago/Turabian StyleBosi, Sara, Lorenzo Negri, Antonio Fakaros, Giulia Oliveti, Anne Whittaker, and Giovanni Dinelli. 2022. "GGE Biplot Analysis to Explore the Adaption Potential of Italian Common Wheat Genotypes" Sustainability 14, no. 2: 897. https://doi.org/10.3390/su14020897
Note that from the first issue of 2016, this journal uses article numbers instead of page numbers. See further details here.