
Empirical Analysis of Evidence-Based Policymaking in R&D Programmes


1
Technology Management, Economics and Policy Program, Seoul National University, 1, Gwanak-ro, Gwanak-gu, Seoul 08826, Korea
2
Research Institute of Basic Sciences, Seoul National University, 1, Gwanak-ro, Gwanak-gu, Seoul 08826, Korea
*
Author to whom correspondence should be addressed.
Sustainability 2022, 14(1), 311; https://doi.org/10.3390/su14010311
Submission received: 30 November 2021
/
Revised: 22 December 2021
/
Accepted: 23 December 2021
/
Published: 28 December 2021
(This article belongs to the Section Economic and Business Aspects of Sustainability)
Abstract
:This study explores evidence-based policymaking (EBP) in public research and development (R&D) programmes. Governments develop and implement R&D programmes to promote innovation, the key driver of sustainable economic growth. For effective management, public policies should be planned, executed, and terminated based on their impact evaluation and feedback. Although many studies have investigated the impact of R&D support, few have analysed whether it evolves on the basis of evidence. Using a dataset of Korean programmes, this study adopted the propensity score matching with a difference-in-differences method. We distinguished four determinants of performance evidence: R&D intensity, assets, sales, and profits growth. The following are the main results: (1) while R&D intensity, sales, and profits growth reveal the efficiency of the EBP mechanism, the performance of assets do not differ across the abolished and continued programmes; (2) the EBP process classified by subsidy amount reveals no statistically significant differences in terms of R&D intensity and profits. This suggests that policymakers need to consider the amount of subsidy granted under the budget limitation. This study contributes to the empirical research on EBP using heterogeneous evidence indicators and describes how policymakers exploit policy evaluation to implement and monitor policies for sustainable development.
1. Introduction
Many governments have launched research and development (R&D) programmes to promote private innovation, the key driver of sustainable economic growth [1,2]. The major legitimacy of policy intervention is stimulating economic growth by fixing market failures [3,4,5]. A market failure is a phenomenon by which the private sector avoids R&D expenditure. Firms rarely enjoy full appropriability for the knowledge created from their R&D activities, and this knowledge spillover keeps private R&D investment below the socially optimal level. Moreover, information asymmetry among stakeholders restricts external financing for R&D investment causing small- and medium-sized enterprises (SMEs), especially those vulnerable to financial constraints, to struggle to finance their R&D and innovation activities [1]. This type of market failure, characterised by underinvestment in R&D activities, has compelled public intervention.
A large body of scholarly work has analysed R&D programme performance and impact evaluation. Ideally, the measure of innovation activities that have occurred purely due to government intervention is the key factor in such evaluations [6]. Accordingly, many studies use the term additionality to refer to the additional impact of public support and categorise it into input and output additionality. Input additionality focuses on the impact of public R&D support on private R&D investment. Output additionality is generally measured via technological performance, including new product development and patent application or managerial performance, such as revenue and sales.
Evidence-based policymaking (EBP) encourages policymakers to look for the best evidence available, prioritising provable and demonstrable results when designing policies [7,8]. The effective management of public policies requires planning, execution, and termination based on the performance evaluation and feedback received from the available evidence. Recent studies emphasise the evolutionary process, which involves evidence of policy performance to modify and improve a programme design [9,10,11]. A virtuous cycle of promoting high-performing programmes and eliminating or modifying poorly performing programmes is created when evaluation results are used [12,13].
While there has been a vast amount of theoretical literature focused on EBP and the impact evaluation of public R&D support, the scope of research on public R&D programmes has generally been limited to performance analysis. Some studies have analysed components that can better reflect evidence into policies [10,14], but the evolutionary perspective of policies has not been fully explored. Thus, the existing studies do not draw insights into policy implications from the decisions regarding whether to continue, eliminate, or modify a policy programme based on performance. To address this gap, this study analyses the question of whether a policy has been established or terminated based on the results of a performance evaluation. From an evidence-based viewpoint, a high performing policy should be continued, and a poor performing policy should be terminated.
To identify whether such an evolutionary approach is employed, this study sought to empirically analyse whether R&D programmes evolve based on evidence. Specifically, our research questioned whether poorly performing programmes are typically abolished. To answer this question, we analysed the performance of SMEs supported by R&D programmes that were abolished between 2013 and 2017. To consider the long-term effects, firm-level data were collected for a period of five years before the programme was terminated [15]. R&D programmes that support SMEs not only solve a firms’ financial constraints, but also promote their R&D activities. Thus, we used heterogeneous variables, such as R&D intensity and managerial performance, to assess input and output additionality. Methodologically, we used propensity score matching with the difference-in-differences (PSM–DID) that favours randomised control trials (RCTs) [16].
The remainder of this paper is structured as follows: Section 2 presents the existing theory on evidence-based policymaking and additionality related to R&D programmes. Section 3 explains the data and methodology used for our empirical analysis. Section 4 presents the results, while Section 5 analyses them and presents their implications.
2. Literature Review
2.1. Evidence-Based Policymaking
Governments establish policies by using evidence derived from practice, which is known as EBP [17,18,19]. In the policymaking process, policy evidence logically supports the potential outcome of a public policy. For example, Adam et al. [12] point out that EBP can enhance instrumentality, which is linked to policy effectiveness, and legitimise decision-making. According to Widmer [11], public policies are designed and implemented in a way that ensures high performance. The more evidence-based the process of defining a policy goal and instrument, which satisfies the requirement of fidelity, the more likely it is to be adopted by those who may disagree with the policy’s normative orientation [16,20]. EBP is considered as the basis for establishing public policy results in a rational-technical approach of policy making, in which stakeholders share principles for selection, action and evaluation [21].
Since the early 2000s, there has been a growing interest in the importance of EBP and the determination of the best methods to achieve it [22,23]. Although some scholars have cited the importance of knowledge creation in policymaking to improve rationality [24], this approach has been burdened by the need for realistic trust and acceptance to thoroughly introduce evidence in the policymaking process. However, the UK Cabinet Office [25] has emphasised the significance of evidence in policy management, good practice, and evaluation. Recently, the widespread support of using evidence as the basis for designing public policy appears uncontroversial [21].
Various types of evidence can be used in policymaking. Much of the evidence determines how a policy is formulated, and the way task performance will be measured [17]. However, stakeholders have often disagreed vehemently on what information can be regarded as evidence because subjective interpretation is possible in the process of analysis and reporting by humans [18,26]. Head [27] classifies knowledge as evidence into three categories: political, scientific, and practical. He advises that scientific knowledge emerges from rigorous research and experiments that evaluate the causal relationship between policy measures and goals. Improving the links between research evidence and policymaking is being increasingly seen as one of the key requirements in government organisations [8,10,11]. Other studies emphasise that important scientific research evidence can be obtained from statistical modelling and policy impact assessments [12,13,23,28]. Sanderson [23] and Cairney [16] argue that policy evaluation helps in identifying the best practices or determining which policies are good and why and insists that policy evaluation results provide the evidence necessary to improve future policy performance.
To work on this research paradigm, this study collected performance evaluation data of the SMEs that were granted the Korean R&D programme support. When dealing with the effects of public policy, we should take into account the conditions under which the evidence has been generated [11]. R&D programmes that support SMEs not only solve a firms’ financial constraints, but also promote their R&D activities [29,30]. Therefore, we considered the performance evidence relevant to the purpose of the R&D policy and examined whether the policy was designed and implemented using the evidence.
2.2. Additionality in Public R&D Programmes
Public R&D programmes play a critical role in ensuring high-quality and sustainable economic development through scientific and technological innovation [1,2]. The quality of the programmes is directly related to their impact on firms’ performance. Additionality is a widely used concept to identify the changes that a firm experiences under policy intervention through the evaluation of its performance [31,32,33]. In the impact assessments of public R&D programmes, additionality also refers to additional firm R&D activities arising from public support. This study used the concept of input and output additionality.
Input additionality mainly refers to the changes in private R&D investment caused by R&D programmes. Firms’ R&D expenditure plays an important role in enhancing product innovation and increasing the sales performance of innovative products [34]. Scholars debate whether public support, including subsidies, complements or substitutes private R&D activity. Although no consensus exists, most scholars suggest that public R&D supports do not demonstrate a crowding-out effect [35,36,37,38,39]. For instance, Lach [38] analysed the impact of Israeli R&D programmes to conclude that a complementary effect occurs on private R&D expenditure in SMEs, but no significant effect is observed in large firms. Hussinger [37] points out that the private R&D investment of supported firms in Germany increased by over EUR 1 for every EUR 1 of R&D subsidy received. Lee [39] reviewed the World Bank data on 1500 firms and confirms that R&D support is positively related to private R&D intensity. Some studies performed meta-analyses and summarised that although the impact depends on a firm’s characteristics, industry, and country, R&D programmes generally demonstrate positive input additionality [40,41].
Output additionality mainly focuses on the changes caused by public support to the R&D outcome. Technological factors, including new product or process generation; patent application; and managerial performance, such as revenue, sales, and value-added, are used as indicators to evaluate output additionality [42,43,44,45,46]. For instance, Branch and Song [45] analysed the output additionality of government subsidies for Canadian firms, concluding that subsidised firms enjoy higher revenue, salary, and profits growth than non-subsidised firms. Vanino et al. [46] suggest that government support positively affects employment retention and a reduction in the turnover rate as per their analysis of the projects conducted by the UK Research Council from 2004 to 2016. Finally, Hong [47] and Cin et al. [48] found a positive correlation between R&D support and value-added.
2.3. Research Hypothesis
The existing literature on EBP has been focused on theoretical issues as well as the impact evaluation of policy support. Some studies, especially in health science, tried to empirically analyse the process of EBP [10,14]. According to Ouimet et al. [10], both public servants’ educational level and their propensity to acquire research evidence from academic researchers are associated significantly. However, to the best of our knowledge, limited empirical studies have explored the evolutionary process of EBP.
This study sought to confirm the performance of R&D support at the firm level and, based on evidence, investigated whether R&D policymaking evolved in Korea. We reasoned that an EBP mechanism could be observed if the performance of the abolished programmes was lower than that of the sustained programmes. Thus, we formulated our hypothesis as follow:
Hypothesis 1 (H1).
Public R&D programmes with poor performance are abolished.
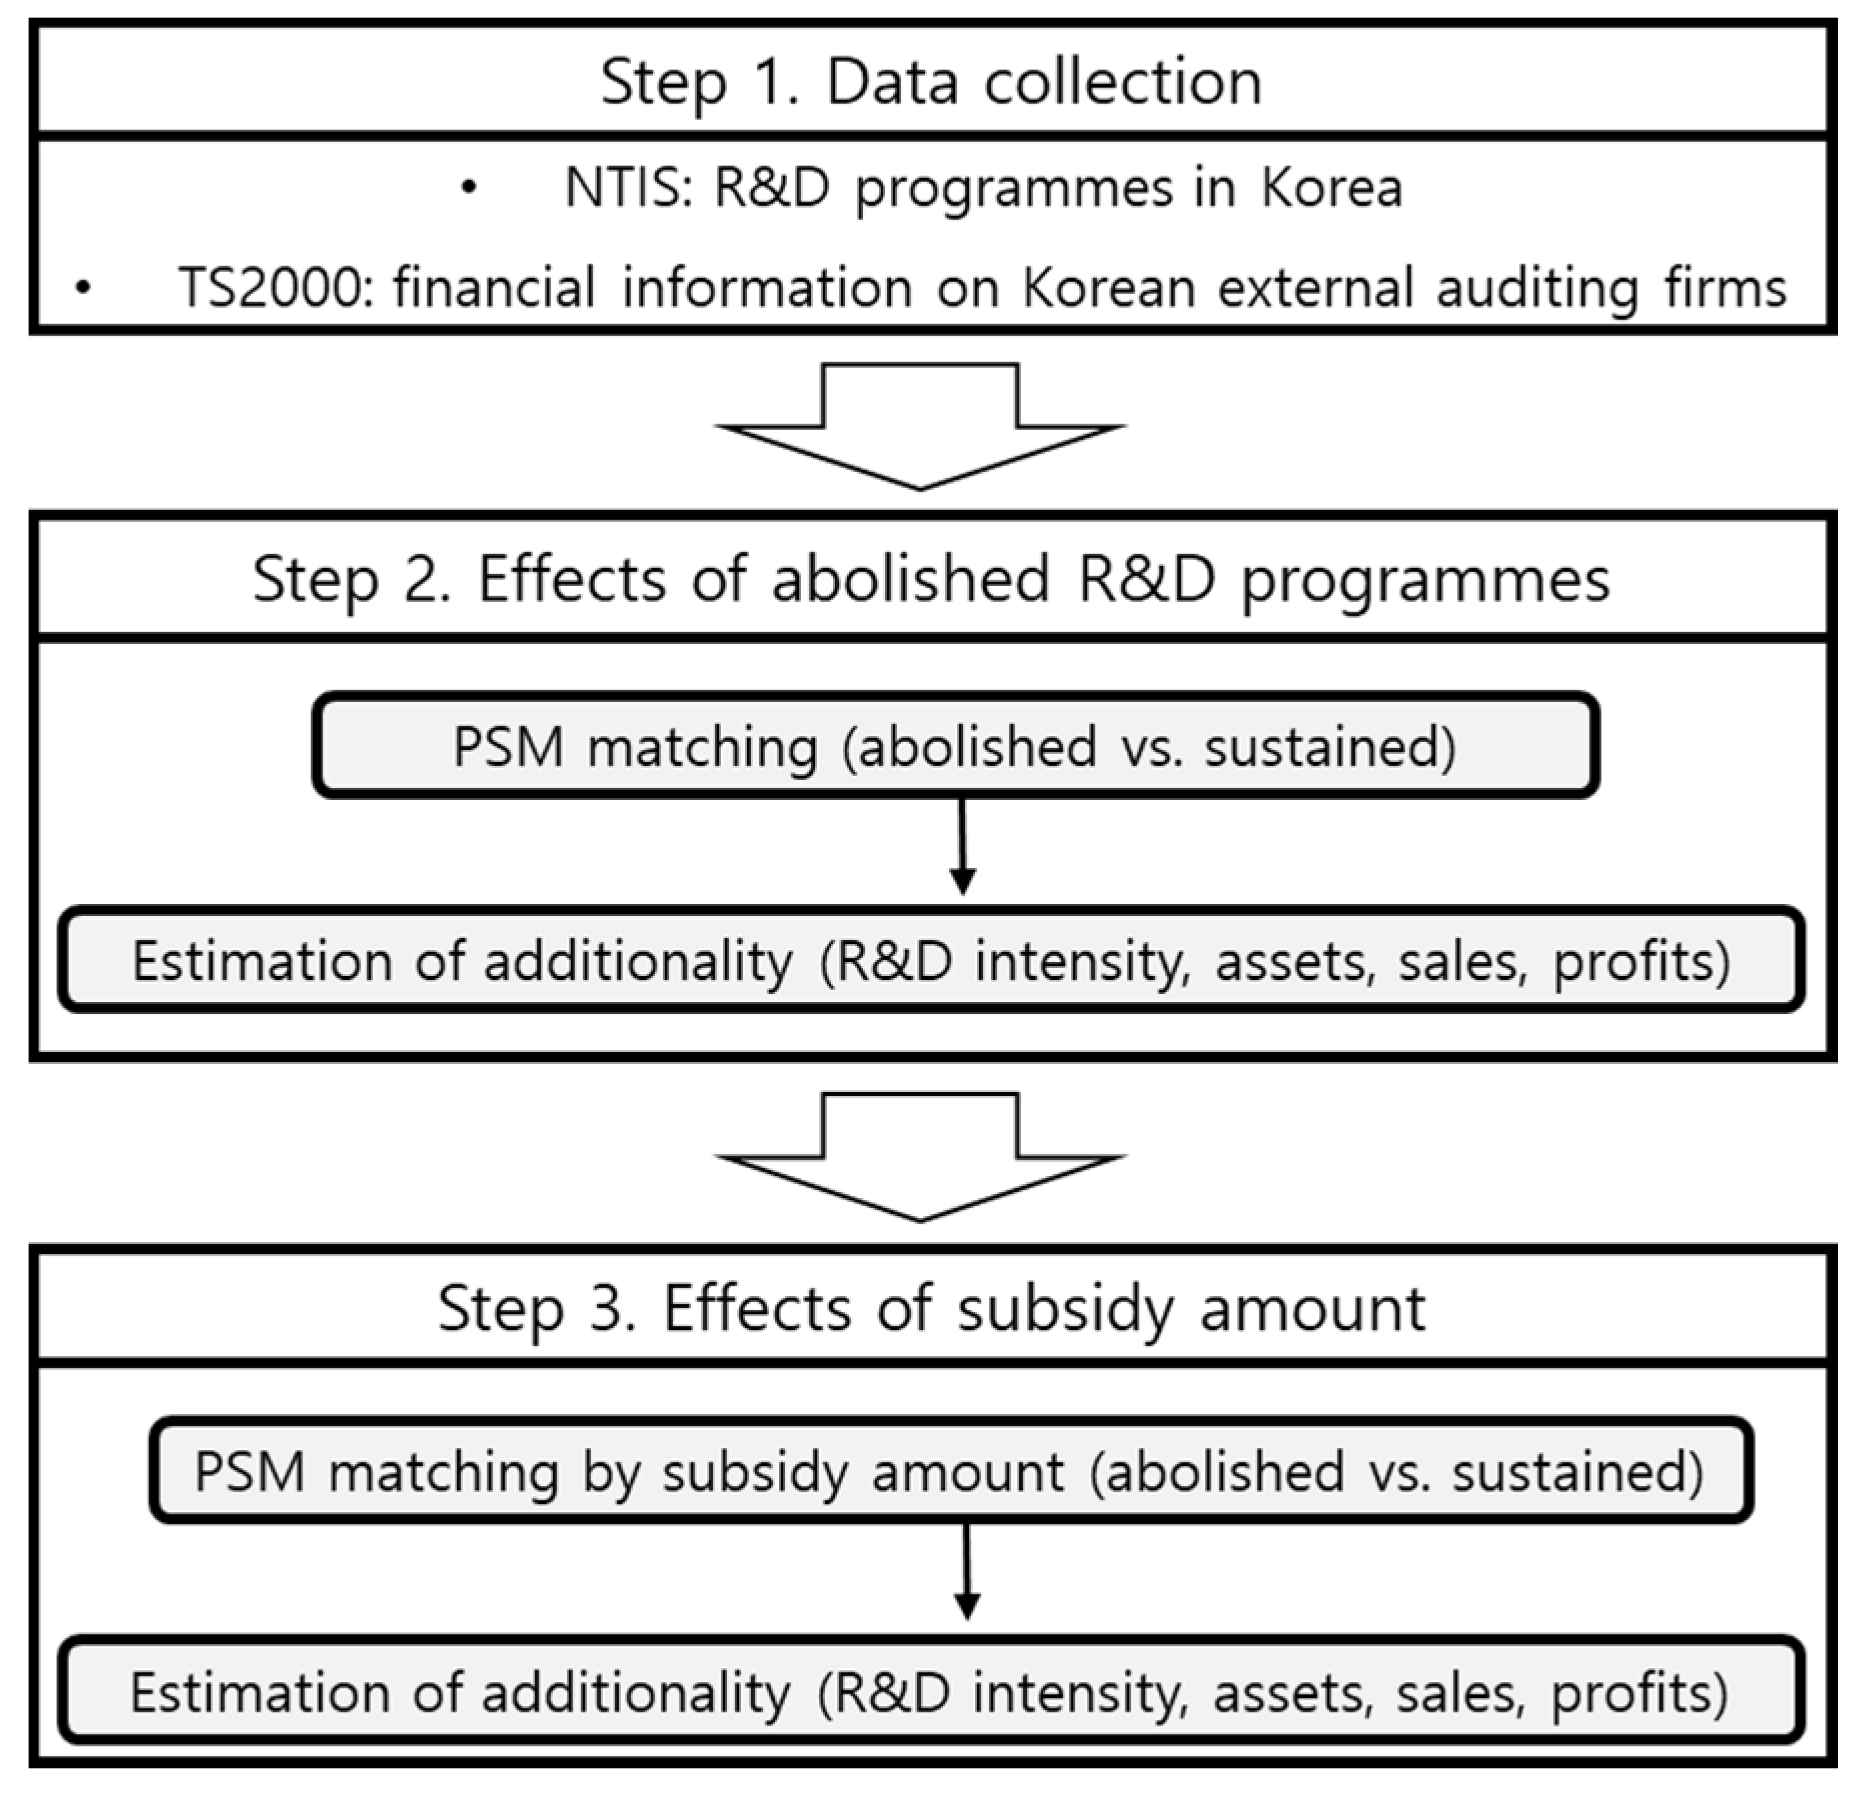
We tested our hypothesis through the following three stages (Figure 1):
- Data collection. We collected two datasets; R&D programmes and Firm information.
- Measuring the effect of abolished R&D programmes (EBP). We compared the effects of R&D programmes ending during the period of 2013 to 2017 to that of sustained programmes. We matched the control group by the year the programme was abolished from t − 5 to t − 1 and then calculated the time effect for five years among the matched groups.
- Dose Response Functions (DRFs). This study used DRFs to analyse the influence of the amount of subsidy on EBP [30]. It is important for governments to allocate their R&D budget efficiently. Larger subsidies should be used more efficiently, implying that the provision of larger subsidies requires the formulation of relevant policy decisions based on evidence and monitoring.
3. Data and Methods
3.1. Data
We used two datasets. The first was the list of Korean R&D programmes conducted by governmental organisations, which is available online through the National Science and Technology Information Service platform [49]. It provides information on the R&D programmes, the names of participating firms, and subsidy amounts. The evaluation period was from 2013 to 2017, and we collected data from t − 5, 2008, to analyse the lag effect (Table 1).
For the second dataset, we collected the following financial information on Korean external auditing firms from the Listed Companies Association [50]: private R&D investment, assets, sales, profits, and age of SMEs. To ensure reliability, the firms that participated in both abolished and sustained programmes simultaneously were excluded because analysing and comparing the effects of each programme was difficult due to the interaction caused by overlapping support. Our analysis classified firms into a treated group of abolished participating R&D programmes (935 observations) and a control group of sustained participating R&D programmes (13,274 observations).
The dependent variables included R&D intensity (RDINT), which is the ratio of R&D expenditure to total sales, as the indicator of input additionality, and the number of assets (LnAssets), sales (LnSales), and profits (LnProfits) to measure output additionality. A recent debate has clarified that other output variables should be considered, such as employment rate or innovation efficiency (e.g., patents) [51]. The data in this study limited the scope of our analysis as they lacked information on employers. Nevertheless, we were able to analyse the R&D intensity correlated with patent production [52,53].
3.2. Propensity Score Matching with Difference-in-Differences (PSM—DID)
Our basic statistical analysis revealed differences in various characteristics among groups before participating in later-abolished R&D programmes. Following these conditions, we ran the risk of overestimating or underestimating the causal effects of R&D support due to the influence of the differences among characteristics. To address this endogenous selection bias, we established an appropriate control group using the PSM technique.
The presence of technological or other kinds of characteristic differences across firms in addition to the benefits of public support can render the analyses of the effect of public programmes on firm performance inaccurate. In general, , which is the dependent variable of company , can have two different values depending on whether it receives government support. When is designated as a dummy variable for participation in the programme (1 if firm receives government support, 0 otherwise), the dependent variable is defined as follows [42,54]:
The average treatment effect (ATT) for the treatment group is
and is the average effect of on .
However, the problem is that this allows us to observe only if the firm was supported. In the case of R&D support, proposal evaluation usually determines which firms participate based on specific criteria. As selection bias may exist, the sample cannot be randomly assigned. We solved this problem by forming a treatment group and a control group, simply ensuring that the firms under analysis had the same technological and firm characteristics. The conditional independence assumption was implemented to make the influence similar for factors other than the treatment, as expressed in Equation (3).
where X represents observable covariates and . Under the assumption of conditional independence, we can interpret the difference between the two groups only with respect to whether they received government R&D support [55,56].
The most frequently used method to solve selection bias is the econometric matching procedure. The PSM approach is introduced to the select comparison group for each treatment unit [57]. It can remove selection bias, which favours randomised control trials [16]. As proposed by Rosenbaum and Rubin [58], many studies apply the method when characteristic differences exist between comparison groups to solve for selection bias or when a large difference exists in the number of comparison groups.
The PSM technique involves three steps: obtaining a propensity score, matching, and estimating the treatment effect. If the number of covariates is large, a ‘dimensional problem’ may occur: the number of cases in which we may find a pair for each variable increases by the power of two. The propensity score, the likelihood of receiving R&D support over observable covariates, is effective in solving dimensional problems because it calculates scores for these variables in a one-dimensional form, such that . We estimated the propensity score using a multivariate logistic regression model with the possible covariates [59].
Subsequently, we formed comparison groups by one-to-three nearest neighbour matching (NNM) based on the calculated propensity score; 1 − k NNM is a matching method that constructs a control group by matching the firms in a treatment group with the closest scores. In general, as k increases, the standard error of the treatment effect estimates will be reduced, although the bias might increase. We used a one-to-three NNM with a caliper of 0.1; the trade-off between matching quality and data loss is considered.
We applied DID analysis to estimate the actual effect of the policy through the treatment effect in our study. Since the observed difference in variables before and after the treatment was used, unobservable heterogeneous firms’ characteristic variables invariant with time can be controlled [38,60,61]. We compared the difference in performance growth between two matched groups by configuring the growth variables in a differential form as expressed in Equation (4) [62].
4. Results
4.1. Effects of Abolished R&D Programmes
4.1.1. Descriptive Statistics before Matching
We analysed the basic statistics from the PSM covariates that may affect the probability of receiving public support (Table 2). The covariates used in the analysis were selected based on the existing empirical literature and information available. First, to reflect the technological capabilities of each firm, we considered whether the firm had received R&D support from the government in the past five years and whether it had an experience with R&D expenditure (History and LnR&D_exp). Failing to past R&D activities can lead to misinterpreting the causes of by-products as the performance of the R&D support itself [63]. We found that more sustained R&D support was given to firms that had received public support in the past and had incurred R&D expenditure. Second, we considered firm age (Age). Although the more experienced firms generally had easier access to government support, start-ups faced more financial constraints and accordingly applied for government support more frequently. Our data showed that no significant difference exists between abolished and sustained support. Third, we considered firm size (LnAssets) [38]. SMEs generally have restrictions on innovation activities, which emerges as a market failure. The outcome variables (LnSales, LnProfits) in period t − 1 were used to capture a firm’s innovation activity. Finally, we considered group membership (Group) [34]. Group members are more likely to benefit from R&D programmes because they have more opportunities to access government support information.
We included year and industry dummies as control variables. Year dummy variables can control the cyclical effect of the programme or changes in the grant budget. Industrial dummy variables can control the divergence of technological opportunities across sectors. We classified our dummies into 24 sectors corresponding to manufacturing and services by referring to the Bank of Korea’s industry-related index (see Appendix A).
4.1.2. Matching Quality
To check the balance of matching, we compared the significance across the treated and control groups for the covariates. Table 3 show the probability of participation in abolished R&D programmes before and after matching for all covariates. The statistical significance of all covariates disappeared after matching. We also ran two-tailed t-tests to observe the equality of firm characteristics between the two groups, and no significant difference was observed. Accordingly, we satisfied the conditional independence assumption that the selection bias did not drive our findings [55]. This result confirms the validity of matching quality.
4.1.3. Estimation of Additionality
The first step in our analysis involved determining whether R&D programmes were abolished based on their performance. Table 4 show the results of analysing the effects of abolished R&D programmes on the firms’ performance using the PSM–DID method.
In terms of R&D intensity (input additionality) and managerial performance (output additionality), the effect of abolished R&D programmes was lower than that of sustained programmes. There was a time lag in all outcomes, and the overall effects of the sustained R&D programmes were high. Statistically significant effects were found for R&D intensity in the second and third periods (t + 1–t + 2), sales from the second period to the last period (t + 1–t + 4) and profits in the third period (t + 2).
The estimates suggest that the effects on the participation in sustained programmes increased by 0.002 in R&D intensity growth, approximately 0.053 to 0.106 in sales growth, and 4.355 in profits growth relative to the abolished programmes’ mean. Hence, these findings convey that EBP occurs in the growth of R&D intensity and managerial performance of sales and profits, showing the different time effects. No statistically significant difference in the output additionality of assets between the treated and control groups was present. We reasoned that in terms of growth in assets, policy evolution did not occur based on evidence.
4.2. Effects of Subsidy Amount
Next, this study analysed the difference in the effect of the number of subsidies across abolished R&D programmes and sustained R&D programmes. It is important that governments efficiently allocate their R&D budget. Larger subsidies should be used more efficiently, implying that for larger subsidies, policy decisions should be undertaken based on evidence and monitoring.
Meanwhile, in order to interpret the causal relationship of R&D programmes through DRFs, the number of subsidies granted and participation in public support must be independent. In other words, the amount of subsidies granted is exogenous [63]. While this is important to note for reproducibility, this problem did not arise in our study because the purpose, target, and amount of R&D programme subsidies were determined in advance, and only the beneficiaries of support were selected through evaluation.
In this study, we divided the number of subsidies into three sections based on the amount of support provided to the firms that received abolished programmes (Table 5).
The first section included firms that received subsidies of less than KRW 293 million (less than USD 247,000) per year, the second consisted of firms that received subsidies of KRW 293–584 million (USD 247,000–492,000) per year, and the third consisted of firms with subsidies of KRW 584 million or more (USD 492,000 or more) per year.
Across the three sections, we compared R&D intensity and managerial performance between two matched groups according to firms’ participation in the abolished programme. Table 6 show the difference in R&D intensity growth. The effect is not statistically significant. Managerial performance is better in the context of continued programmes than abolished programmes (Table 7) when subsidies were KRW 293–584 million (assets growth in the fifth year, and sales growth from 2 to 5 years). In the case of growth in sales, other subsidy sections also showed significant results; the first section in the first year and in the third year with subsidies of KRW 584 million or more.
These results reveal two implications. First, the evidence of performance indicators can differ when the subsidy amount is considered. As detailed above, the EBP process based on the firm’s characteristics demonstrated a significant effect on R&D intensity in the second and third years after receiving support; classification on the basis of subsidy amount revealed no statistically significant differences. This suggests that the EBP process needs to determine the amount of subsidy that can be granted under budget limitations.
Second, in terms of growth in sales, the second section of KRW 293–584 million supported EBP. This finding suggests that the managerial performance of sales played a role in deciding whether to eliminate or sustain programmes. Although different time effects of sales performances, especially for large subsidy amounts in the third year, showed that the policy evolution process was based on evidence, most of the other subsidy amount and time effects were insignificant. As Zhao et al. [64] mentioned, this result shows a weak correlation between R&D programme award decisions and recipients’ performance. This implies that programmes with large amounts of subsidy are difficult to judge whether to abolish due to political meaning. While evidence-based policymaking plays a significant role in the sustainability of R&D programmes, the probability of abolishing R&D programmes will be influenced not only by evidence-based policymaking, but also by other political factors.
4.3. Robustness Checks
To check the robustness of the results, we measured the effect of the abolished R&D programmes using k-nearest matching (one-to-one, one-to-two) and Kernel matching; in addition, we re-applied PSM–DID. We found that the effects of receiving R&D support that was later abolished were similar to those observed in our main results (cf., Table 8 and Table 9).
5. Conclusions
We aimed to determine whether the R&D programmes supporting Korean SMEs evolve based on performance evidence obtained by comparing the characteristics of sustained and abolished programmes using empirical analysis, that is, by using the PSM–DID method.
We found that different effects occur according to the performance indicators, suggesting that because the R&D programmes for various purposes are mixed, heterogeneous effects occur according to performance indicators [46]. In terms of growth in R&D intensity (input additionality), sales, and profits (output additionality), we confirmed that sustained programmes demonstrated more positive correlations than the abolished programmes. Meanwhile, there was no significant difference in performance for assets growth between them. Thus, the hypothesis presented was partly supported by the results of our analyses. Conversely, the results of the analyses also revealed that the amount of subsidy did not have any significant impact on R&D intensity and profits growth across abolished and sustained programmes. Hence, the amount of subsidy has no effects on the performance of R&D programmes except for sales growth, and the hypothesis of this study is partly unsupported.
Our empirical analysis has the following implications: thus far, EBP has mainly been conducted through theoretical analysis. There has been a perception that academic research is irrelevant to practical public policy [65]. In addition, the scope of research on R&D policies has been limited to performance analysis and fails to analyse the evolutionary process thereafter. To overcome these limitations, this study sought to uncover whether EBP is being correctly implemented. Accordingly, this study is the first attempt to link EBP with an impact evaluation of R&D support.
Methodologically, we applied the PSM–DID method and demonstrated that evidence is translated into practice in the policymaking process. The quasi-experimental method enhanced our results with strong evidence [16]. Additionally, there are ongoing debates about the potential role of different types of evidence and how evidence should be used to formulate policies [8]. We considered the purpose of R&D policies supporting SMEs’ innovation activities and analysed the process of EBP based on various performance evidence.
For policymakers, this study describes how policymakers exploit policy evaluation to implement and monitor policies for sustainable development. The results imply that the policy’s impacts are not observed as societally desirable, and the intervention used is not thought to contribute to those outcomes under budget limitation [20]. We suggest policymakers move to improve or modify policies based on performance in the process of establishing, executing, and evaluating R&D programmes. We also suggest that the policymaker should consider a mismatch between demanding and beneficiary firms in sustaining the large number of R&D programmes, which result in low effectiveness in emerging economies such as China and Korea [64,66].
Our study has the following limitations: we did not consider the bias of the results according to various R&D programme instruments, such as subsidies, low interest rates, and tax credits. The existing literature generally advises governments to implement direct subsidies to encourage long-term research and offer tax breaks to encourage short-term applied research [67,68]. Depending on the purpose of each instrument, certain performance indicators may serve as relatively better evidence in policymaking decisions. However, given our data, we could only confirm whether the observed programmes were supported. In future studies, we hope to reduce this bias by considering the role of different support measures. Additionally, we considered industrial characteristics as control variables by classifying dummies into 24 sectors. However, the analysis of EBP by industries is not the scope of this study. It is expected to present policy implications by reflecting each industry difference in future studies.
Author Contributions
Conceptualization, H.S. and K.S.; data curation, H.S.; formal analysis, H.S.; methodology, H.S. and K.S.; resources, K.S.; software, H.S.; supervision, K.S.; validation, H.S.; writing—original draft, H.S. and K.S.; writing—review and editing, H.S. and K.S. All authors have read and agreed to the published version of the manuscript.
Funding
This research received no external funding.
Institutional Review Board Statement
Not applicable.
Informed Consent Statement
Not applicable.
Data Availability Statement
No new data were created or analyzed in this study. Data sharing is not applicable to this article.
Acknowledgments
The Institute of Engineering Research at Seoul National University provided research facilities for this work.
Conflicts of Interest
The authors declare no conflict of interest.
Appendix A. Classifications of Industry

Table A1.
Classifications of 24 industries.
| Classifications | |
|---|---|
| 1 | Food, beverages, and tobacco products |
| 2 | Textile and leather products |
| 3 | Wood and paper products, printing, and reproduction of recorded media |
| 4 | Petroleum and coal products |
| 5 | Chemical products |
| 6 | Non-metallic mineral products |
| 7 | Basic metal products |
| 8 | Fabricated metal products, except machinery and furniture |
| 9 | Computing machinery, electronic equipment |
| 10 | Optical instruments |
| 11 | Electrical equipment |
| 12 | Machinery and equipment and transport equipment |
| 13 | Other manufactured products, utility, and construction |
| 14 | Wholesale and retail trade and commodity brokerage services |
| 15 | Transportation |
| 16 | Food services and accommodation |
| 17 | Communications and broadcasting |
| 18 | Finance and insurance |
| 19 | Real estate services |
| 20 | Professional, scientific, and technical services |
| 21 | Business support services |
| 22 | Health and social care services |
| 23 | Art, sports, and leisure services |
| 24 | Other services |
References
- Liu, W.; Bai, Y. An Analysis on the influence of R&D fiscal and tax subsidies on regional innovation efficiency: Empirical evidence from China. Sustainability 2021, 13, 12707. [Google Scholar]
- Kaygusuz, K. Energy for sustainable development: A case of developing countries. Renew. Sustain. Energy Rev. 2012, 16, 1116–1126. [Google Scholar] [CrossRef]
- Arrow, K. Economic welfare and the allocation of resources for invention. In The Rate and Direction of Inventive Activity: Economic and Social Factors; Princeton University Press: Princeton, NJ, USA, 1962; pp. 609–626. ISBN 0-87014-304-2. [Google Scholar]
- Bronzini, R.; Piselli, P. The impact of R&D subsidies on firm innovation. Res. Policy 2016, 45, 442–457. [Google Scholar]
- Nelson, R.R. The simple economics of basic scientific research. J. Political Econ. 1959, 67, 297–306. [Google Scholar] [CrossRef] [Green Version]
- Klette, T.J.; Møen, J.; Griliches, Z. Do subsidies to commercial R&D reduce market failures? Microeconometric evaluation studies. Res. Policy 2000, 29, 471–495. [Google Scholar]
- Mulgan, G. Government, knowledge and the business of policy-making. Canberra Bull. Public Adm. 2003, 1–5. Available online: https://search.informit.org/doi/abs/10.3316/agispt.20033579 (accessed on 10 October 2021).
- Nutley, S.; Morton, S.; Jung, T.; Boaz, A. Evidence and policy in six European countries: Diverse approaches and common challenges. Evid. Policy 2010, 6, 131. [Google Scholar] [CrossRef]
- McFadgen, B.; Huitema, D. Experimentation at the interface of science and policy: A multi-case analysis of how policy experiments influence political decision-makers. Policy Sci. 2018, 51, 161–187. [Google Scholar] [CrossRef] [Green Version]
- Ouimet, M.; Landry, R.; Ziam, S.; Bédard, P.-O. The absorption of research knowledge by public civil servants. Evid. Policy J. Res. Debate Pract. 2009, 5, 331–350. [Google Scholar] [CrossRef]
- Widmer, T. The contribution of evidence-based policy to the output-oriented legitimacy of the state. Evid. Policy J. Res. Debate Pract. 2009, 5, 351–372. [Google Scholar] [CrossRef]
- Adam, C.; Steinebach, Y.; Knill, C. Neglected challenges to evidence-based policy-making: The problem of policy accumulation. Policy Sci. 2018, 51, 269–290. [Google Scholar] [CrossRef]
- Bauer, M.W.; Knill, C. Understanding policy dismantling: An analytical framework. Dismantling Public Policy Prefer. Strateg. Eff. 2012, 30–51. [Google Scholar] [CrossRef]
- Upton, D.; Upton, P. Knowledge and use of evidence-based practice of GPs and hospital doctors. J. Eval. Clin. Pract. 2006, 12, 376–384. [Google Scholar] [CrossRef]
- Ho, M.H.-C.; Liu, J.S.; Lu, W.-M.; Huang, C.-C. A new perspective to explore the technology transfer efficiencies in US universities. J. Technol. Transf. 2014, 39, 247–275. [Google Scholar] [CrossRef]
- Cairney, P. Evidence-based best practice is more political than it looks: A case study of the ‘Scottish Approach’. Evid. Policy 2017, 13, 499–515. [Google Scholar] [CrossRef]
- Freeman, R.; Griggs, S.; Boaz, A. The practice of policy making. Evid. Policy 2011, 7, 127. [Google Scholar] [CrossRef] [Green Version]
- Newman, J.; Cherney, A.; Head, B.W. Policy capacity and evidence-based policy in the public service. Public Manag. Rev. 2017, 19, 157–174. [Google Scholar] [CrossRef]
- Plewis, I. Educational Inequalities and Education Action Zones. In Tackling Inequalities: Where are We Now and What Can Be Done; The Policy Press: Bristol, UK, 2000; pp. 87–100. [Google Scholar]
- Boon, W.; Edler, J. Demand, challenges, and innovation. Making sense of new trends in innovation policy. Sci. Public Policy 2018, 45, 435–447. [Google Scholar] [CrossRef] [Green Version]
- Pearce, W.; Wesselink, A.; Colebatch, H. Evidence and meaning in policy making. Evid. Policy 2014, 10, 161. [Google Scholar] [CrossRef]
- De Marchi, G.; Lucertini, G.; Tsoukiàs, A. From evidence-based policy making to policy analytics. Ann. Oper. Res. 2016, 236, 15–38. [Google Scholar] [CrossRef] [Green Version]
- Sanderson, I. Evaluation, policy learning and evidence-based policy making. Public Adm. 2002, 80, 1–22. [Google Scholar] [CrossRef]
- Lasswell, H.D. The emerging conception of the policy sciences. Policy Sci. 1970, 1, 3–14. [Google Scholar] [CrossRef]
- Thomson Reuters Practical Law. White Paper: Modernising Government; Thomson Reuters: London, UK, 1999. [Google Scholar]
- Watts, R. Truth and politics: Thinking about evidence-based policy in the age of spin. Aust. J. Public Adm. 2014, 73, 34–46. [Google Scholar] [CrossRef]
- Head, B.W. Three lenses of evidence-based policy. Aust. J. Public Adm. 2008, 67, 1–11. [Google Scholar] [CrossRef]
- Rescher, N. Complexity: A Philosophical Overview; Routledge: London, UK, 1998. [Google Scholar]
- Martí, J.; Quas, A. A beacon in the night: Government certification of SMEs towards banks. Small Bus. Econ. 2018, 50, 397–413. [Google Scholar] [CrossRef]
- Srhoj, S.; Lapinski, M.; Walde, J. Impact evaluation of business development grants on SME performance. Small Bus. Econ. 2021, 57, 1285–1301. [Google Scholar] [CrossRef]
- Buisseret, T.J.; Cameron, H.M.; Georghiou, L. What difference does it make? Additionality in the public support of R&D in large firms. Int. J. Technol. Manag. 1995, 10, 587–600. [Google Scholar]
- Georghiou, L. Impact and additionality of innovation policy. IWT-Studies 2002, 40, 57–65. [Google Scholar]
- Quintas, P.; Guy, K. Collaborative, pre-competitive R&D and the firm. Res. Policy 1995, 24, 325–348. [Google Scholar]
- Conte, A.; Vivarelli, M. Succeeding in innovation: Key insights on the role of R&D and technological acquisition drawn from company data. Empir. Econ. 2014, 47, 1317–1340. [Google Scholar]
- Aerts, K.; Czarnitzki, D. Using Innovation Survey Data to Evaluate R&D Policy: The Case of Belgium. ZEW-Centre for European Economic Research Discussion Paper No. 04-055. 2004. Available online: https://ssrn.com/abstract=572086 (accessed on 1 November 2021).
- Huergo, E.; Moreno, L. Subsidies or loans? Evaluating the impact of R&D support programmes. Res. Policy 2017, 46, 1198–1214. [Google Scholar]
- Hussinger, K. R&D and subsidies at the firm level: An application of parametric and semiparametric two-step selection models. J. Appl. Econom. 2008, 23, 729–747. [Google Scholar]
- Lach, S. Do R&D subsidies stimulate or displace private R&D? Evidence from Israel. J. Ind. Econ. 2002, 50, 369–390. [Google Scholar]
- Lee, C.-Y. The differential effects of public R&D support on firm R&D: Theory and evidence from multi-country data. Technovation 2011, 31, 256–269. [Google Scholar]
- Dimos, C.; Pugh, G. The effectiveness of R&D subsidies: A meta-regression analysis of the evaluation literature. Res. Policy 2016, 45, 797–815. [Google Scholar]
- Zúñiga-Vicente, J.Á.; Alonso-Borrego, C.; Forcadell, F.J.; Galán, J.I. Assessing the effect of public subsidies on firm R&D investment: A survey. J. Econ. Surv. 2014, 28, 36–67. [Google Scholar]
- Czarnitzki, D.; Hanel, P.; Rosa, J.M. Evaluating the impact of R&D tax credits on innovation: A microeconometric study on Canadian firms. Res. Policy 2011, 40, 217–229. [Google Scholar]
- Duch, N.; Montolio, D.; Mediavilla, M. Evaluating the impact of public subsidies on a firm’s performance: A two-stage quasi-experimental approach. Investig. Reg.-J. Reg. Res. 2009, 143–165. [Google Scholar]
- Kang, K.-N.; Park, H. Influence of government R&D support and inter-firm collaborations on innovation in Korean biotechnology SMEs. Technovation 2012, 32, 68–78. [Google Scholar]
- Branch, S.B.; Song, M. Canada Small Business Financing Program: Updated and Extended Economic Impact Analysis; Web Services Centre: Ottawa, ON, Canada, 2014. [Google Scholar]
- Vanino, E.; Roper, S.; Becker, B. Knowledge to money: Assessing the business performance effects of publicly-funded R&D grants. Res. Policy 2019, 48, 1714–1737. [Google Scholar]
- Hong, J.-P. Causal relationship between ICT R&D investment and economic growth in Korea. Technol. Forecast. Soc. Chang. 2017, 116, 70–75. [Google Scholar]
- Cin, B.C.; Kim, Y.J.; Vonortas, N.S. The impact of public R&D subsidy on small firm productivity: Evidence from Korean SMEs. Small Bus. Econ. 2017, 48, 345–360. [Google Scholar]
- NTIS, National Science and Technology Information Service. 2020. Available online: https://www.ntis.go.kr/en/GpIndex.do (accessed on 10 October 2021).
- KOCOINFO, Total Solution 2000 (TS2000). 2020. Available online: http://www.kocoinfo.com/ (accessed on 1 October 2021).
- Takalo, T.; Tanayama, T.; Toivanen, O. Estimating the benefits of targeted R&D subsidies. Rev. Econ. Stat. 2013, 95, 255–272. [Google Scholar]
- Czarnitzki, D.; Hussinger, K. Input and output additionality of R&D subsidies. Appl. Econ. 2018, 50, 1324–1341. [Google Scholar]
- Hall, B.H.; Griliches, Z.; Hausman, J.A. Patents and R and D: Is there a lag? Int. Econ. Rev. 1986, 27, 265–283. [Google Scholar] [CrossRef]
- Petelski, N.; Milesi, D.; Verre, V. Public support to innovation: Impact on technological efforts in Argentine manufacturing firms. Econ. Innov. New Technol. 2020, 29, 66–88. [Google Scholar] [CrossRef]
- Caliendo, M.; Tübbicke, S. Design and effectiveness of start-up subsidies: Evidence from a policy reform in Germany. Econ. Anal. Policy 2021, 70, 333–340. [Google Scholar] [CrossRef]
- Rosholm, M.; Mikkelsen, M.B.; Svarer, M. Bridging the gap from welfare to education: Propensity score matching evaluation of a bridging intervention. PLoS ONE 2019, 14, e0216200. [Google Scholar] [CrossRef] [Green Version]
- Heckman, J.J.; Ichimura, H.; Todd, P. Matching as an econometric evaluation estimator. Rev. Econ. Stud. 1998, 65, 261–294. [Google Scholar] [CrossRef]
- Rosenbaum, P.R.; Rubin, D.B. The central role of the propensity score in observational studies for causal effects. Biometrika 1983, 70, 41–55. [Google Scholar] [CrossRef]
- Liu, S.; Yin, S.; Yin, C.; Sheng, Y. Does the price of natural resources affect firms’ total factor productivity? Evidence from a natural experiment in China. Econ. Anal. Policy 2021, 70, 37–50. [Google Scholar] [CrossRef]
- Smith, J.A.; Todd, P.E. Does matching overcome LaLonde’s critique of nonexperimental estimators? J. Econom. 2005, 125, 305–353. [Google Scholar] [CrossRef] [Green Version]
- Wang, Z.; Wu, M.; Li, S.; Wang, C. The effect evaluation of China’s energy-consuming right trading policy: Empirical analysis based on PSM-DID. Sustainability 2021, 13, 11612. [Google Scholar] [CrossRef]
- Bellucci, A.; Pennacchio, L.; Zazzaro, A. Public R&D subsidies: Collaborative versus individual place-based programs for SMEs. Small Bus. Econ. 2019, 52, 213–240. [Google Scholar]
- Nilsen, Ø.A.; Raknerud, A.; Iancu, D.-C. Public R&D support and firm performance: A multivariate dose-response analysis. Res. Policy 2020, 49, 104067. [Google Scholar]
- Zhao, S.; Xu, B.; Zhang, W. Government R&D subsidy policy in China: An empirical examination of effect, priority, and specifics. Technol. Forecast. Soc. Chang. 2018, 135, 75–82. [Google Scholar]
- Mead, L.M. Only connect: Why government often ignores research. Policy Sci. 2015, 48, 257–272. [Google Scholar] [CrossRef]
- Jun, S.-P.; Kim, S.-G.; Park, H.-W. The mismatch between demand and beneficiaries of R&D support programs for SMEs: Evidence from Korean R&D planning programs. Technol. Forecast. Soc. Chang. 2017, 116, 286–298. [Google Scholar]
- David, P.A.; Hall, B.H.; Toole, A.A. Is public R&D a complement or substitute for private R&D? A review of the econometric evidence. Res. Policy 2000, 29, 497–529. [Google Scholar]
- OECD. Measuring Innovation: A New Perspective; OECD: Paris, France, 2010. [Google Scholar]
Figure 1.
Research framework.

Table 1.
Descriptive statistics of R&D programmes conducted from 2013 to 2017.
| Obs. | Mean | S.D. | Min | Max | |
|---|---|---|---|---|---|
| Total | 1171 | 234.2 | 24.68 | 199 | 261 |
| Abolished programmes | 91 | 18.2 | 5.02 | 12 | 24 |
| Sustained programmes | 1080 | 216 | 19.79 | 187 | 237 |
Table 2.
Means of main variables by type of public support.
| Total | Non-Supported Firms | Supported Firms | Difference of Means (t-Test) | |||
|---|---|---|---|---|---|---|
| Total Supported Firms | Abolished Supported Firms (1) | Sustained Supported Firms (2) | (1) vs. (2) | |||
| Covariates | ||||||
| History (0/1) | 0.049 | 0.027 | 0.340 | 0.295 | 0.343 | (0.002) *** |
| LnRD_expt−1 | 2.350 | 1.970 | 7.500 | 6.944 | 7.540 | (0.007) *** |
| Aget−1 (year) | 15.206 | 15.043 | 17.417 | 17.815 | 17.388 | (0.291) |
| LnAssetst−1 | 17.119 | 17.100 | 17.346 | 17.462 | 17.338 | (0.001) *** |
| LnSalest−1 | 16.594 | 16.544 | 17.158 | 17.332 | 17.146 | (0.000) *** |
| LnProfitst−1 | 13.773 | 13.737 | 14.133 | 14.237 | 14.126 | (0.069) * |
| Groupt−1 (0/1) | 0.033 | 0.030 | 0.065 | 0.072 | 0.065 | (0.422) |
| Number of firms | 38,156 | 33,129 | 5027 | 618 | 4409 | |
| Total Obs. | 206,673 | 192,464 | 14,209 | 935 | 13,274 | |
Note: *** nd * indicate 1% and 10% levels of significance, respectively. Industry dummies were included but not reported. ( ) represents the p-value.
Table 3.
Participation in abolished R&D programmes (multivariate logit model).
| Dependent Variables: Abolished R&D Programmes | ||||||
|---|---|---|---|---|---|---|
| Before Matching | After Matching | |||||
| dy/dx | S.E. | dy/dx | S.E. | t-Statistics | ||
| Covariates | ||||||
| History (0/1) | −0.264 *** | 0.089 | 0.079 | 0.105 | −0.708 | (0.479) |
| LnRD_expt−1 | −0.013 ** | 0.006 | 0.003 | 0.007 | −0.166 | (0.867) |
| Aget−1 (year) | 0.001 | 0.004 | −0.000 | 0.005 | 0.116 | (0.908) |
| LnAssetst−1 | 0.017 | 0.086 | 0.012 | 0.104 | −0.037 | (0.970) |
| LnSalest−1 | 0.128 * | 0.076 | −0.037 | 0.092 | 0.245 | (0.806) |
| LnProfitst−1 | −0.020 | 0.036 | −0.004 | 0.044 | 0.159 | (0.873) |
| Groupt−1 (0/1) | 0.053 | 0.168 | −0.186 | 0.204 | 0.406 | (0.685) |
| Industry dummies | Yes | Yes | ||||
| Log-likelihood | −2494.18 | −922.69 | ||||
| Total Obs. | 10,432 | 2342 | ||||
Notes: Marginal effects (dy/dx) were computed at sample means. S.E. represents standard errors. ***, **, and * indicate 1%, 5%, and 10% levels of significance, respectively. ( ) represents the p-value.
Table 4.
Regression results of the abolished R&D programmes.
| t | t + 1 | t + 2 | t + 3 | t + 4 | |
|---|---|---|---|---|---|
| ΔR&D intensity (Treated_n = 687) | 0.000 (0.001) | −0.002 ** (0.001) | −0.002 * (0.001) | −0.001 (0.001) | −0.001 (0.001) |
| Managerial performance (Treated_n = 667) | |||||
| −ΔLnAssets | 0.005 (0.011) | −0.008 (0.020) | −0.041 (0.032) | −0.051 (0.042) | −0.078 (0.051) |
| −ΔLnSales | −0.020 (0.014) | −0.053 ** (0.021) | −0.070 *** (0.026) | −0.106 *** (0.035) | −0.091 * (0.047) |
| −ΔLnProfits | 0.085 (0.916) | −1.008 (0.760) | −4.355 * (2.267) | −1.279 (0.777) | −0.681 (1.445) |
Notes: ( ) denotes standard errors. ***, **, and * indicate 1%, 5%, and 10% levels of significance, respectively. Treated_n represents the number of treated firms. Each value represents the difference in the change rate of variables between treated and control firms compared to the base year (i.e., the year before receiving public support).
Table 5.
Descriptive statistics of the subsidy amount.
| Abolished Programmes | Obs. | Percentile | Centile (KRW, Million) | 95% Confidence Interval (KRW, Million) | |
|---|---|---|---|---|---|
| Subsidy Amount | 935 | 33 | 293 | 262 | 327 |
| 66 | 584 | 542 | 601 | ||
Table 6.
DRFs results for R&D intensity (input additionality).
| Subsidy Amount (KRW, Million) | t | t + 1 | t + 2 | t + 3 | t + 4 |
|---|---|---|---|---|---|
| >293 (N = 693) | 0.001 (0.001) | −0.001 (0.001) | −0.001 (0.002) | 0.000 (0.001) | 0.001 (0.002) |
| 293–584 (N = 685) | 0.001 (0.001) | −0.001 (0.002) | −0.004 (0.003) | 0.001 (0.003) | −0.001 (0.003) |
| <584 (N = 782) | 0.000 (0.001) | −0.001 (0.001) | 0.001 (0.002) | 0.001 (0.003) | −0.006 (0.009) |
Notes: ( ) denotes standard errors. Each value represents the difference in the change rate of variables between treated and control firms compared to the base year (i.e., the year before receiving public support).
Table 7.
DRFs results for managerial performance (output additionality).
| Subsidy Amount (KRW, Million) | t | t + 1 | t + 2 | t + 3 | t + 4 |
|---|---|---|---|---|---|
| ΔAssets | |||||
| >293 (N = 641) | −0.003 (0.018) | −0.009 (0.032) | 0.008 (0.053) | 0.025 (0.068) | 0.017 (0.078) |
| 293–584 (N = 612) | 0.029 * (0.017) | −0.003 (0.037) | −0.050 (0.069) | −0.138 (0.089) | −0.180 * (0.097) |
| <584 (N = 762) | −0.020 (0.022) | −0.023 (0.032) | −0.053 (0.052) | −0.073 (0.087) | −0.141 (0.140) |
| ΔSales | |||||
| >293 (N = 641) | −0.041 * (0.024) | −0.062 (0.038) | −0.055 (0.051) | −0.051 (0.057) | −0.231 (0.304) |
| 293–584 (N = 612) | −0.039 (0.025) | −0.071 * (0.038) | −0.130 ** (0.057) | −0.176 ** (0.081) | −0.255 * (0.136) |
| <584 (N = 762) | −0.026 (0.027) | −0.020 (0.035) | −0.090 * (0.046) | −0.107 (0.067) | −0.099 (0.105) |
| ΔProfits | |||||
| >293 (N = 641) | −0.015 (0.413) | −0.642 (0.655) | −1.354 (1.342) | 0.877 (1.454) | −0.164 (0.700) |
| 293–584 (N = 612) | 0.640 (1.068) | −0.524 (3.216) | 3.565 (3.758) | 0.271 (3.427) | −4.729 (2.865) |
| <584 (N = 762) | −1.680 (1.083) | 2.105 (1.535) | −1.530 (1.818) | −0.292 (1.624) | −1.011 (5.192) |
Notes: ( ) denotes standard errors. ** and * indicate 5% and 10% levels of significance, respectively. Each value represents the difference in the change rate of variables between treated and control firms compared to the base year (i.e., the year before receiving public support).
Table 8.
Results of robustness checks: input additionality.
| Abolished Programme | t | t + 1 | t + 2 | t + 3 | t + 4 |
|---|---|---|---|---|---|
| ΔR&D Intensity | |||||
| K-nearest matching | |||||
| 1:1 (Treated_n = 686) | −0.002 (0.001) | −0.002 (0.001) | −0.003 (0.002) | −0.000 (0.002) | −0.000 (0.002) |
| 1:2 (Treated_n = 687) | −0.000 (0.001) | −0.002 ** (0.001) | −0.003 * (0.001) | −0.001 (0.001) | −0.001 (0.002) |
| Kernel matching (Treated_n = 686) | 0.000 (0.001) | −0.001 * (0.001) | −0.002 *** (0.001) | −0.001 (0.001) | −0.001 (0.001) |
Notes: ( ) denotes standard errors. ***, **, and * indicate 1%, 5%, and 10% levels of significance, respectively. Treated_n represents the number of treated firms. Each value represents the difference in the change rate of variables between treated and control firms compared to the base year (i.e., the year before receiving public support).
Table 9.
Results of robustness checks: output additionality.
| Abolished Programmes | t | t + 1 | t + 2 | t + 3 | t + 4 |
|---|---|---|---|---|---|
| ΔLnAssets | |||||
| K-nearest matching | |||||
| 1:1 (Treated_n = 667) | 0.005 (0.012) | 0.009 (0.022) | −0.012 (0.033) | −0.038 (0.046) | −0.090 (0.057) |
| 1:2 (Treated_n = 667) | 0.006 (0.011) | −0.001 (0.021) | −0.031 (0.035) | −0.034 (0.046) | −0.048 (0.053) |
| Kernel matching (Treated_n = 663) | 0.003 (0.009) | −0.011 (0.017) | −0.038 (0.027) | −0.046 (0.037) | −0.091 ** (0.044) |
| ΔLnSales | |||||
| K-nearest matching | |||||
| 1:1 (Treated_n = 667) | −0.003 (0.016) | −0.037 (0.025) | −0.058 * (0.032) | −0.097 ** (0.043) | −0.125 ** (0.058) |
| 1:2 (Treated_n = 667) | −0.011 (0.015) | −0.045 * (0.023) | −0.051 * (0.029) | −0.087 ** (0.039) | −0.071 (0.050) |
| Kernel matching (Treated_n = 663) | -0.030 ** (0.012) | −0.061 *** (0.018) | −0.083 *** (0.022) | −0.109 *** (0.029) | −0.145 *** (0.053) |
| ΔLnProfits | |||||
| K-nearest matching | |||||
| 1:1 (Treated_n = 667) | −0.610 (0.465) | −0.812 (0.757) | −3.296 * (1.915) | −0.874 (0.805) | −0.496 (1.615) |
| 1:2 (Treated_n = 667) | 0.486 (1.320) | −1.124 (0.776) | −4.628 * (2.439) | −1.221 (0.861) | −0.525 (1.407) |
| Kernel matching (Treated_n = 663) | 0.496 (1.149) | −0.571 (0.744) | −3.866 * (2.048) | −1.729 * (0.941) | −0.887 (1.483) |
Notes: ( ) denotes standard errors. ***, **, and * indicate 1%, 5%, and 10% levels of significance, respectively. Treated_n represents the number of treated firms. Each value represents the difference in the change rate of variables between treated and control firms compared to the base year (i.e., the year before receiving public support).
Publisher’s Note: MDPI stays neutral with regard to jurisdictional claims in published maps and institutional affiliations. |
© 2021 by the authors. Licensee MDPI, Basel, Switzerland. This article is an open access article distributed under the terms and conditions of the Creative Commons Attribution (CC BY) license (https://creativecommons.org/licenses/by/4.0/).
Share and Cite
MDPI and ACS Style
Shim, H.; Shin, K. Empirical Analysis of Evidence-Based Policymaking in R&D Programmes. Sustainability 2022, 14, 311. https://doi.org/10.3390/su14010311
AMA Style
Shim H, Shin K. Empirical Analysis of Evidence-Based Policymaking in R&D Programmes. Sustainability. 2022; 14(1):311. https://doi.org/10.3390/su14010311
Chicago/Turabian StyleShim, Hyensup, and Kiyoon Shin. 2022. "Empirical Analysis of Evidence-Based Policymaking in R&D Programmes" Sustainability 14, no. 1: 311. https://doi.org/10.3390/su14010311
Note that from the first issue of 2016, this journal uses article numbers instead of page numbers. See further details here.