
Sustainable Development Indicators—Untapped Tools for Sustainability and STEM Education: An Analysis of a Popular Czech Educational Website


1
Department of Teaching and Didactics of Chemistry, Faculty of Science, Charles University, 128 00 Prague, Czech Republic
2
Department of Mathematics Education, Faculty of Mathematics and Physics, Charles University, 186 75 Prague, Czech Republic
*
Author to whom correspondence should be addressed.
Sustainability 2022, 14(1), 121; https://doi.org/10.3390/su14010121
Submission received: 20 November 2021
/
Revised: 15 December 2021
/
Accepted: 21 December 2021
/
Published: 23 December 2021
(This article belongs to the Collection Towards a Sustainable Future through Innovative STEM Education)
Abstract
:Environmental education has been included in Czech curricula since the 1980s, albeit without clear evidence of education for sustainable development (SD), which addresses complex socio-economic issues using SD indicators (SDIs), such as charts, single numbers, tables, maps, and (interactive) images. However, understanding such a comprehensive topic requires developing basic mathematical knowledge and skills. In this study, we aimed to analyse the nature, quality, and availability of teaching materials for SD, primarily using SDIs, which could be applied by Czech teachers. For this purpose, we performed a qualitative and basic quantitative content analysis of several descriptors of documents retrieved from a website for teachers, provided by the National Pedagogical Institute of the Czech Republic. A full-text search identified 1376 records, which were analyzed for SD pillars and SDIs. Our results showed that most records (95%) do not contain SDIs in teaching materials. Only 59 records mentioned (128) SDIs, mostly covering the environmental pillar, 26 of which contain a single SDI. The most frequent issues were waste production, treatment, savings, water parameters, and energy consumption. Mathematical skills were used in 56 SDIs, primarily for evaluating data sets and quantitative expressions of an amount. Overall, only a small number of SDIs are used in education for SD, economic and social SDIs are in the minority, and the STEM potential remains untapped.
1. Introduction
Sustainable development (SD) has emerged as a leading concept in the last 30 years. As its integral element (e.g., the work of [1,2]), education for sustainable development (ESD) empowers learners with complex knowledge, skills, perspectives, values, and attitudes to make informed decisions and take action in caring for the natural and social environment [3]. The central question for educators is how to develop their school curricula to effectively communicate information about sustainability [4].
Sustainable development indicators (SDIs) translate such information about complex phenomena into a simple message, which can be (easily) interpreted [5]. SDIs were first defined in the 1990s [6], and the list of SDIs is still under development. SDIs play a key role in SD planning, in both promoting positive changes or delaying changes to a methodical planning process [7], thus highlighting a crucial aspect of SDIs, that is, they can serve multiple and sometimes vague or contradictory purposes when they are not understood properly. Accordingly, when fulfilling appropriate communicative criteria (see, e.g., the work of [8]), SDIs may be regarded as a key educational tool, providing their users with a complex perspective of sustainability themes. However, understanding such indicators requires developing complex skills to interpret data presented in different forms, such as charts, single numbers, tables, maps, and (interactive) images, among others. In other words, learners must be able to understand and analyze empirical data, including their critical analysis, and to systematically and critically assess complex problems using logical reasoning. All these skills are included in science, technology, engineering, and mathematics (STEM) or STEAM (plus Art) skills (see, e.g., the work of [9]).
STEM was officially introduced in 2001 by scientific administrators in the U.S. [10] as an umbrella term expressing an educational concept based on interdisciplinary and applied approaches. Bringing together all four disciplines, STEM offers real-world applications and teaching methods for applying interdisciplinary knowledge and practices to tackle and solve various problems. Science, technology, engineering, and mathematics should be integrated into the teaching process in combination with teaching methods that fulfill the principle of STEM and address worldwide problems [11]. STEM and education for sustainable development are thus interlinked and can benefit from each other in that learning about the environment can be a pathway to STEM learning [12,13], and STEM learning can be a pathway to understanding sustainability.
In line with the above, international programs and organizations have been established to support and improve education for sustainable development (e.g., the work of [14,15]). Furthermore, the field-specific literature contains evidence of the successful combination of STEM and sustainability education. For example, in their review, Nguyen et al. [16] discuss how teaching approaches in STEM can be employed in sustainability education development. According to Steiner and Posch [17], a transdisciplinary case study approach can be a suitable tool for educating sustainable development. As a case in point, Del Cerro Velásquez and Loyano Rivas [18] present how to implement a concrete type of eco-urban projects in the classroom related to the learning objectives and key competences to promote sustainable development goals (SDGs). Therefore, teachers can help students understand sustainability concepts by combining ESD with STEM.
ESD is an integral part of sustainable development, not only as one of the sustainable development goals (SDGs) but also as a key enabler of all other SDGs [19]. Studies on ESD have analyzed its different aspects, e.g., preservice teachers’ understanding of education, SD and ESD [20], ESD in 48 business/management courses at Australian universities [21], national and international declarations in terms of definitions and frameworks for sustainability in higher education [22] and a questionnaire survey among UNESCO chairs on ESD implementation in the Balkans [23]. The progress and quality of ESD have been discussed in the literature (e.g., the work of [24,25]), using indicators to assess the specified parameters. These indicators are known as education for sustainable development indicators (ESDI). An extensive analysis of the sustainability assessment tools was performed by Findler et al. [26]. However, the SDIs that are used in ESD have not been studied yet, although indicators for sustainable development are solid and well-established tools for communicating SD concepts and results. Moreover, the nature of SDIs enables the development of social and cultural competencies (including citizenship) and critical thinking skills, which are emphasized in 21st-century skills [27]. To our best knowledge, only one study has analyzed teaching materials on SD and established an evaluation framework at elementary school, albeit without focusing on specific SDIs [28].
In our study, we aimed to understand the role of SDIs and their connection to sustainability and STEM education by analyzing teaching materials available from a website for Czech teachers, www.rvp.cz [29]. Using qualitative methods (content analysis), we analyzed 1376 articles on sustainability, assessing whether the teaching materials mentioned any SDI, and if so, how students should work with SDI and how they acquire such complex information. This complexity is understood as the ability of SDIs to provide information on all three pillars of sustainability, meaningfully linked. Lastly, we determined whether the articles developed STEM education, especially in the mathematical field, identifying the mathematical topics that are contained in the teaching materials and the extent to which they are incorporated into those materials. Logical and critical thinking, and therefore mathematics, are very important when it comes to sustainability issues. In order to be able to critically evaluate sustainability issues, we must have a basic mathematical education. By understanding mathematical concepts, we can critically evaluate and interpret real sustainability data.
The Role of Sustainable Development Indicators
Sustainable development indicators help to communicate complex information about sustainable development with different types of stakeholders in a simplified manner [5]. As tools for increasing transparency and accountability, these indicators provide extensive access to information and foster engagement with stakeholders in sustainable development [30]. Based on such information, the public can make informed choices and decisions while addressing environmental and sustainable development issues in their own communities [31]. The importance of communication of sustainability issues (including information provided by indicators) is reflected in Goal 16 listed in Sustainable Development Goals, which include universal public access to information [1]. Although the importance of raising public awareness of the universality of the 2030 Agenda is clearly defined, a consensus on effective communication with the public, especially the use of indicators, has not been reached yet [32].
Several factors affect the ability of the general public to understand the concept of sustainable development. First, indicators and metrics represent a relatively abstract view of things [33]. Sustainability reports based on sustainability indicators present techno-scientific issues often abstracted from lived conditions. Understanding such issues (i.e., scientific terms and concepts, scientific processes, and the impact of science and technology) requires “scientific literacy for citizenship”, which can be regarded as the level of socio-scientific knowledge or skills required to function effectively in society [34]. To achieve such a level of scientific literacy for citizenship, the gap between school science and public science must be bridged (see, e.g., the work of [35,36]). However, as indicated in the study by Dimopoulos and Koulaidis [36], summarizing the findings of other authors, several obstacles hinder efforts to bridge these gaps. In schools, these limitations are the pedagogical and epistemological repertoires of the teachers and the lack of appropriate teaching materials. In the press, as a public source of information, which can be used complementarily to conventional school materials [36] to clarify crucial aspects of sustainability to the students, the number of articles on appropriate environmental, social and economic themes strongly linked to the sustainability concept remains limited [37].
In addition to these obstacles to understanding sustainable development, knowledge about sustainability is not limited to data and information provided by indicators, but it requires contextualization in a specific context [38]. Different stakeholders can interpret indicators differently based on their values, interests, or cultural context [39]. This disparity puts a great demand on teachers, who must ensure a balanced interpretation of information provided by sustainability indicators while finding suitable narratives to approach the concept of sustainable development and encouraging learners to take their knowledge and skills into action in their everyday life [40]. Interrelating science education to the relevance and issues of society enables the transdisciplinary educational approach STEAM-ED proposed by Holbrook et al. [41].
In terms of the role of mathematics in STEM, mathematical interpretation of data in the context of sustainability issues goes beyond mechanical calculations [42]. Many issues in environmental sciences can be expressed, described, or predicted by measuring, statistically processing, or modeling data. We must thus be able to interpret and use quantitative information to assess many aspects of sustainability questions [43]. Roe et al. [44] categorized key concepts and methods in the study of sustainability from the mathematical point of view, namely measuring (the standard units for time and distance, area and volume, and other common physical measurements, estimates, and precision, as well as quantitative information and graphical communication), flowing (processes that change the amount of stock, energy stocks and flows, equilibrium state), connecting (the study of networks and connections, graphs theory, and the exponential model), changing (logarithms and change, growth rates, and changes in equilibrium), risking (data and distribution, descriptive statistics, probability and prediction, expectation, and extreme values), and deciding (the market paradigm and game theory).
Because sustainable development is a complex concept, education for sustainable development is necessarily a multi-skills discipline, including proactive approaches by teachers, established content, and pedagogical content knowledge (CK, PCK). Guidelines and sources for ESD, as well as framework and well-defined learning objectives, are therefore needed, as shown in the UNESCO book [45], which summarizes learning objectives for each SDG (grouped into cognitive, socio-emotional, and behavioral learning objectives), alongside suggested topics and examples of learning approaches and methods. The authors highlight ESD within action-oriented transformative pedagogy, which includes (1) a learner-centered approach whereby students autonomously and actively develop their knowledge by constructing their own knowledge base [46]; for more details, see, e.g., the work of [47,48,49,50]. Within (2) action-oriented learning, students are engaged in action to reflect their experience in the learning process and personal development. Kolb’s theory of the experimental learning cycle [51] (1. having a concrete experience; 2. observing and reflecting; 3. forming abstract concepts for generalization; and 4. applying them in new situations) reflects Bandura’s social cognitive theory (e.g., the work of [52]). Finally, recommended (3) transformative learning aims to empower learners to question and change the ways they see and think about the world in order to deepen their understanding of it [53,54]. The third aforementioned approach is based on evidence for which SDIs provide authentic evidence-based data.
Considering the above, tackling sustainability questions in education also requires maintaining a reasonable level of applied mathematics. For example, advanced mathematics, which is a standard tool in climate models, cannot be included in school mathematics. This should be the goal of STEM/STEAM/STEAM-ED education, that is, to come up with sustainable development issues, in a proper STEM context, with appropriate claims for students.
The educational potential of SDIs developing the (scientific) literacy and STEM, together with the aforementioned research gap, has lead us to formulate the following research questions:
- (1)
- To which extension are SDIs found in Czech teaching materials of the teachers’ favorite website rvp.cz? What sustainable development pillars do they address?
- (2)
- What sustainable development goals do the SDIs identified in the studied records address? What are the most frequent SDGs?
- (3)
- What mathematical operations are used and developed when handling SDIs?
2. Materials and Methods
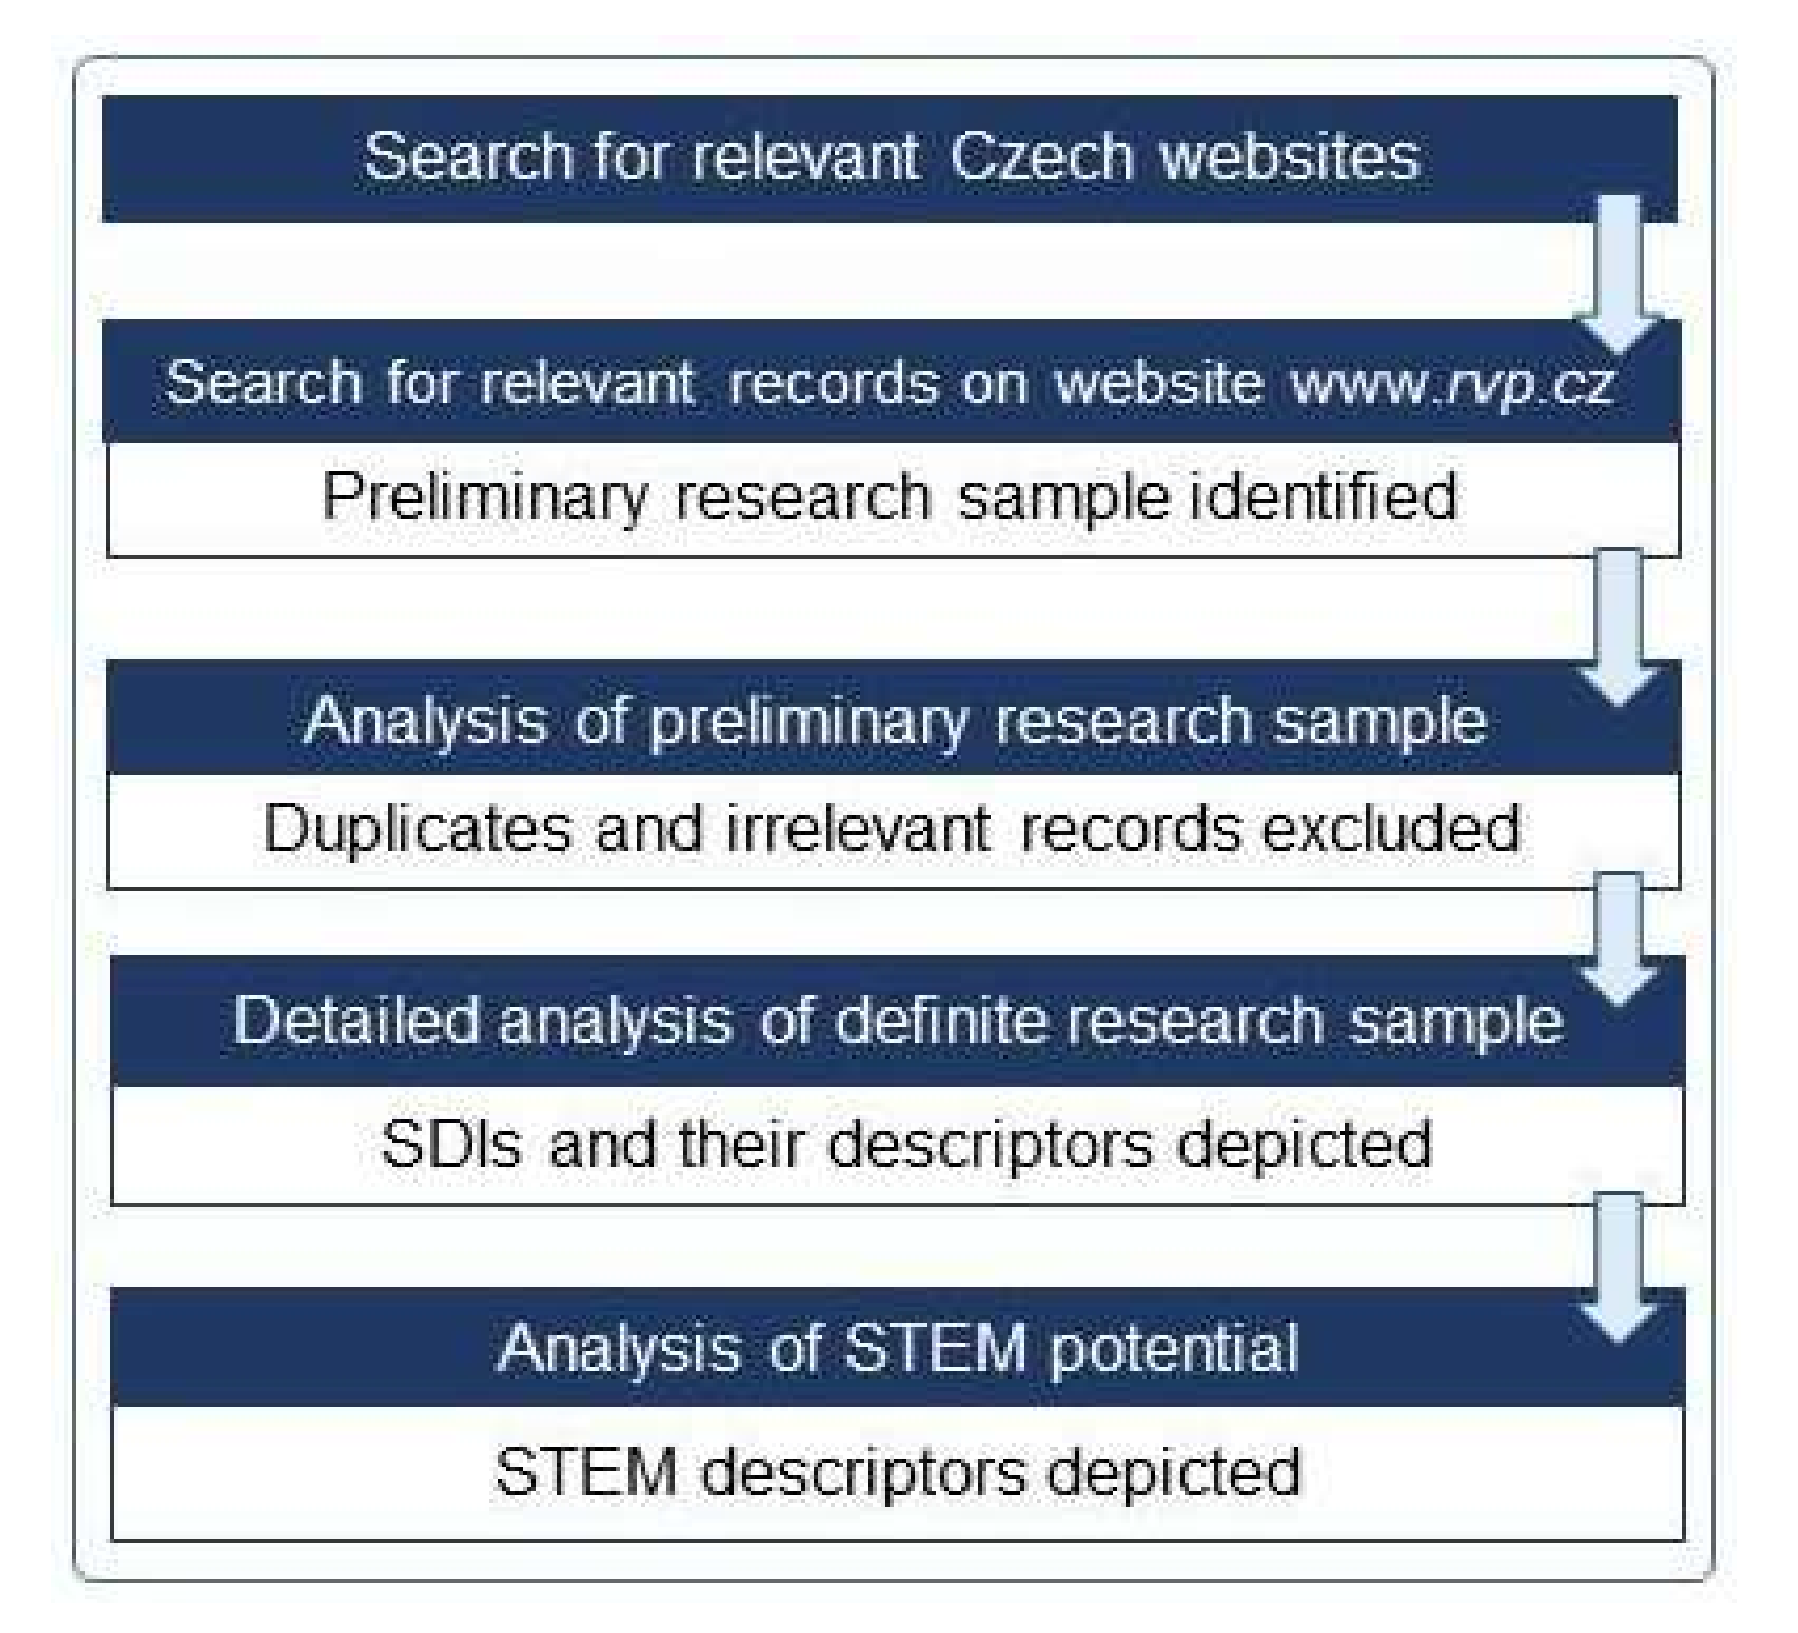
Toward achieving the goals of our research, we performed a qualitative content analysis of online materials available to Czech teachers. Our research approach is summarized in Figure 1.
The first step was to choose the most relevant Czech website(s), based on the following selection criteria: (a) website(s) that is/are well known among science teachers and (2) that provide materials free of charge. We chose the webpage www.rvp.cz [17] for our analysis because this publicly available platform provides relevant and high-quality reviewed teaching materials, including SD materials. Moreover, 43% of cities undergoing the formal assessment based on “Methodology of the sustainable cities assessment: A sustainability audit for LA21 applicants in the Czech Republic” (for further information, see LA21 [55]) explicitly mention this webpage as one of the important sources of SD materials for schools. Some public libraries also refer to this webpage as an important source of information for schools.
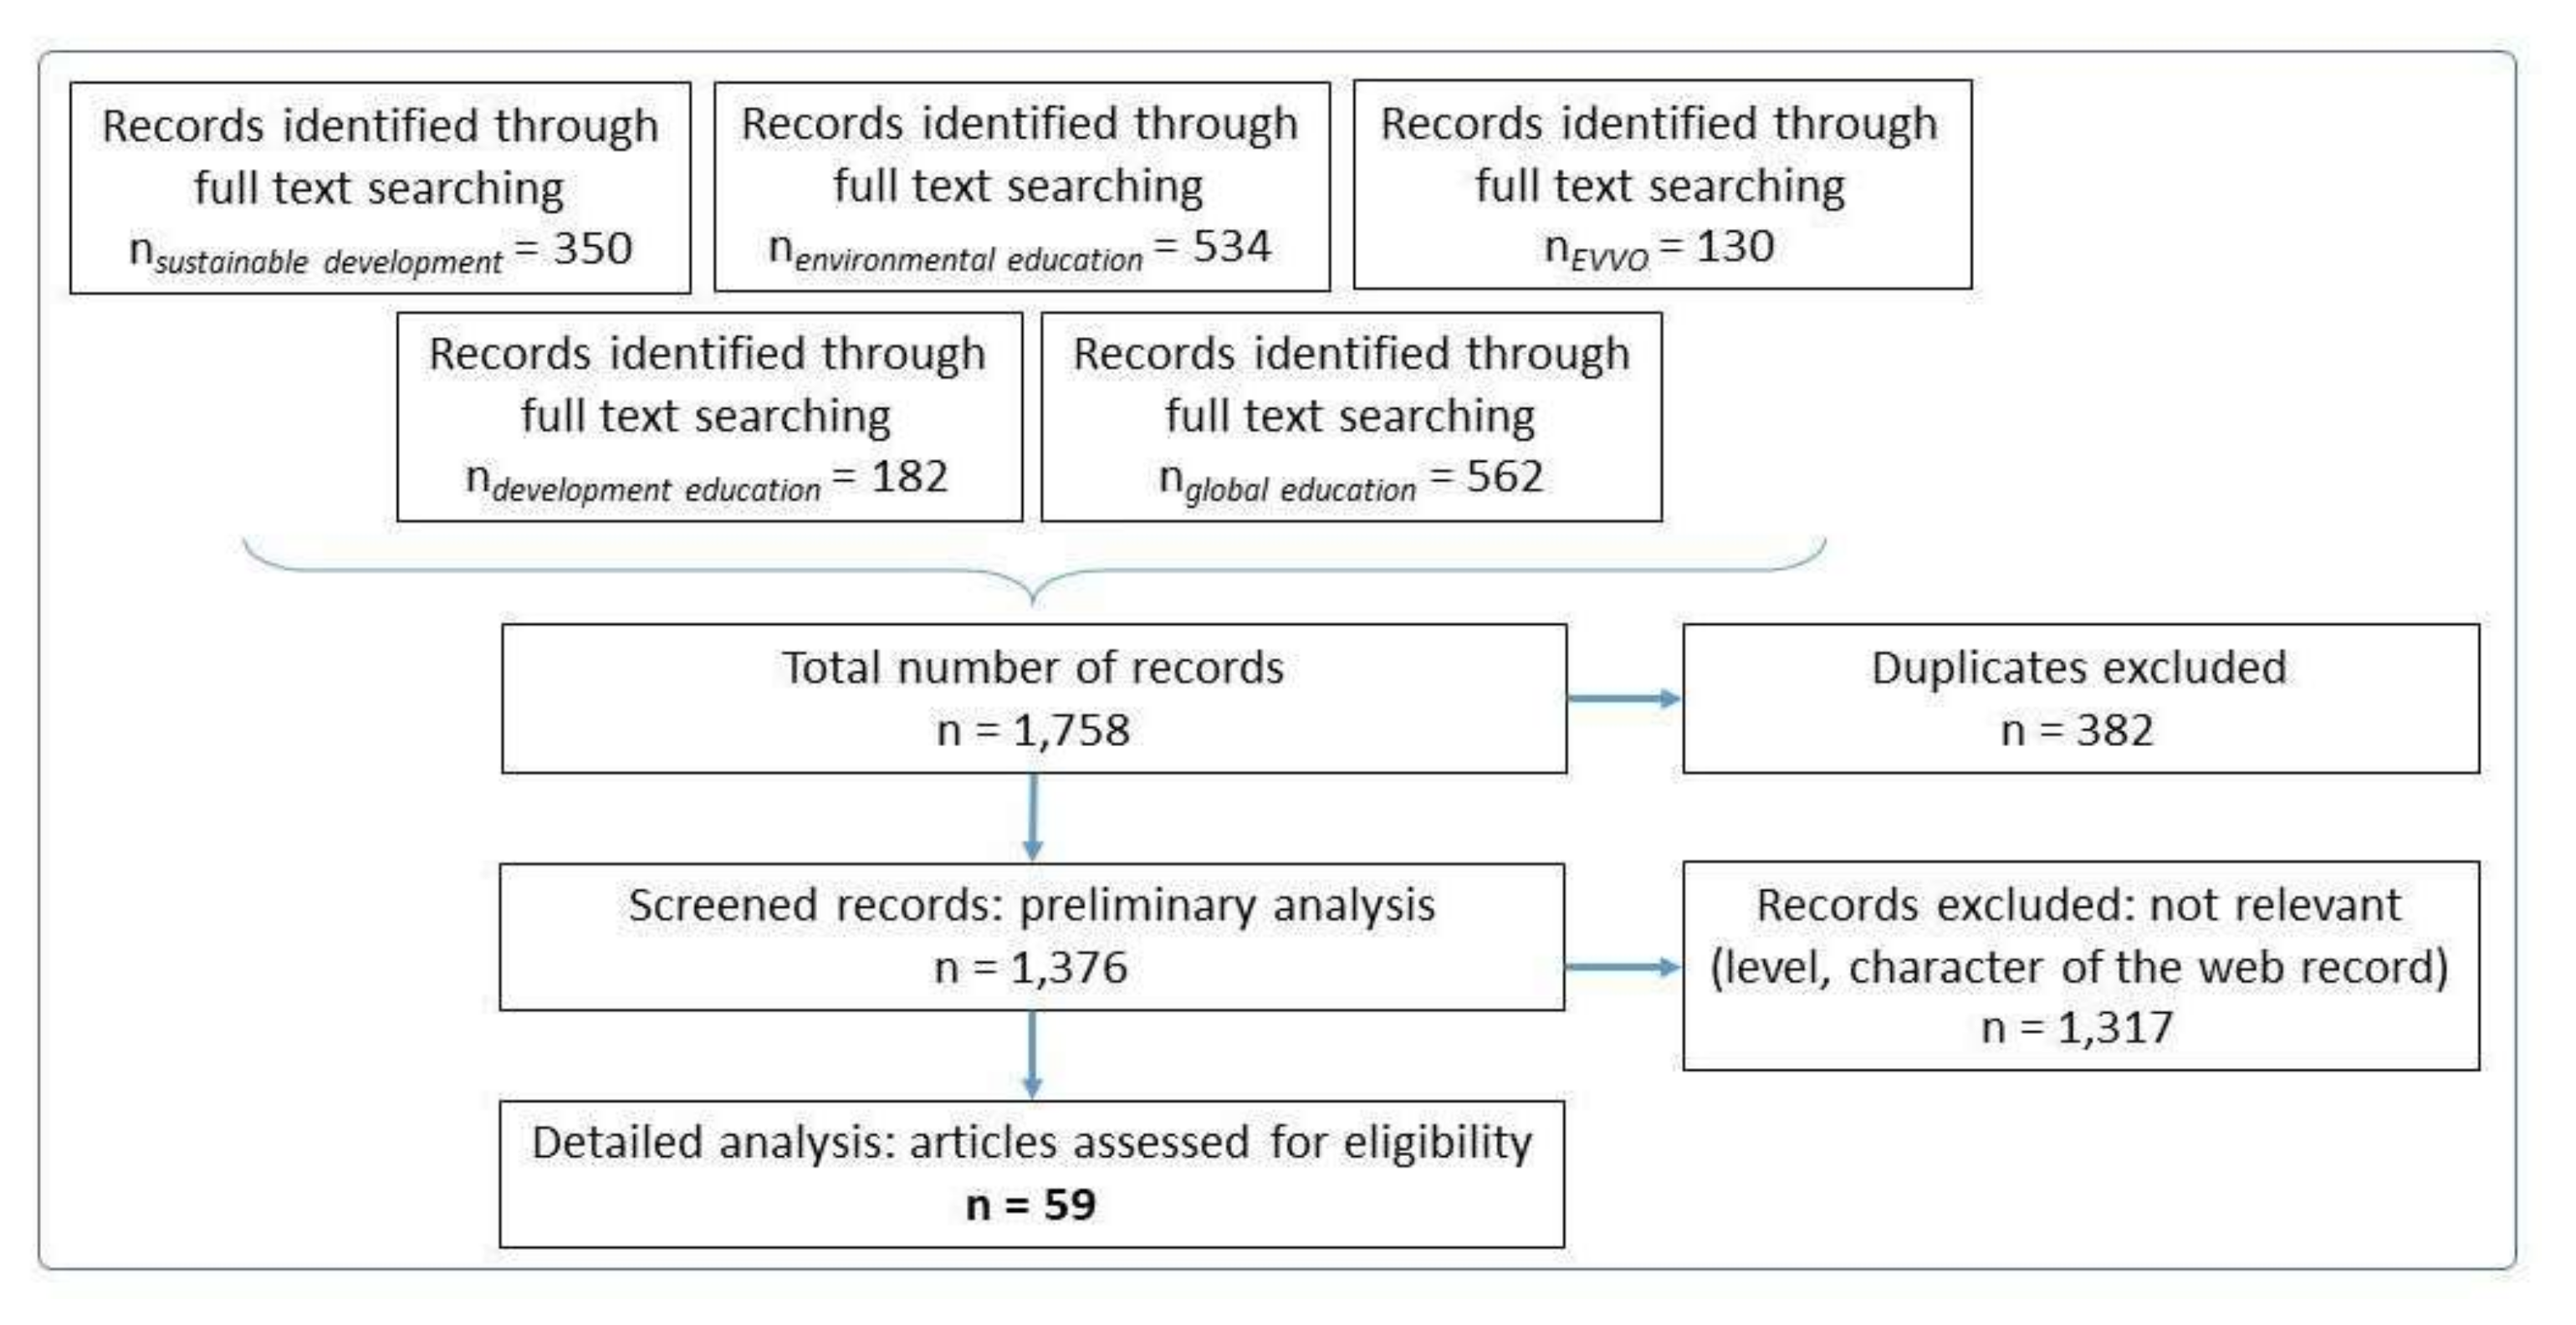
This webpage is administered by the National Pedagogical Institute of the Czech Republic (Národní Pedagogický Institut—NPI) and is focused on teachers of all levels and on informal education. In addition to teaching materials, articles on education, webinars on different school issues, blogs, discussions, and several useful platforms and tools are also available to teachers. We performed a full-text search on the webpage www.rvp.cz to retrieve records of teaching materials (mostly short texts with worksheets attached) and comprehensive educational texts for lower and higher secondary education that could be used for teaching sustainable development issues using SDIs. After asking five secondary school teachers, we identified the keywords (1) sustainable development, (2) EVVO (Czech known abbreviation for the broader concept of environmental education), and (3) environmental education, which mostly cover the environmental pillar of SD. Following a consultation with a subject matter expert from the Charles University Environmental Centre, the keywords (4) development education and (5) global education were included to collect documents covering not only environmental but also economic and social pillars. The total number of records, initially 1758 (see Figure 2), subsequently decreased to 1376 after excluding duplicates. The preliminary analysis of records aimed at a brief reading to identify irrelevant results, SD pillars, and SDIs in eligible records.
SDIs were identified in the materials using common and accepted SDIs in the global indicator framework for SDG [56]: e.g., SDG1 (No Poverty) 1.2.1 Proportion of population living below the national poverty line, by sex and age, SDG2 (Zero hunger) 2.2.3 Prevalence of anemia in women aged 15 to 49 years, by pregnancy status (percentage), SDG3 (Good Health and Well-being) 3.2.1 Under-5 mortality rate, or SDG12 (Responsible Consumption and Production) 12.2.1 Material footprint, material footprint per capita, and material footprint per GDP, 12.2.2 Domestic material consumption, domestic material consumption per capita, and domestic material consumption per GDP, or 12.5.1 National recycling rate, tons of material recycled. However, more indicators were identified in the records, so the list of SDIs was extended (e.g., SDG11 (Sustainable Cities and Communities)) subjective indicator way to school. The identified SDIs and the research process were validated with the help of the aforementioned expert on SDIs from the Charles University Environmental Centre.
After our preliminary analysis, 95% of the records were excluded, and the remaining records (n = 59) were subjected to a more detailed analysis focused on specifying SDIs. The third level of analysis focused on identifying STEM potential in the records, particularly mathematical outputs, i.e., mathematical operations students use when handling specific SDIs. All three levels of analysis (preliminary, detailed, and STEM) were performed by both researchers, and all disagreements were discussed during the analysis, encouraging a feedback loop and checking the reliability. After completing the analysis, all data were confirmed to validate the results.
3. Results
3.1. Types of Indicators Used in Teaching Materials
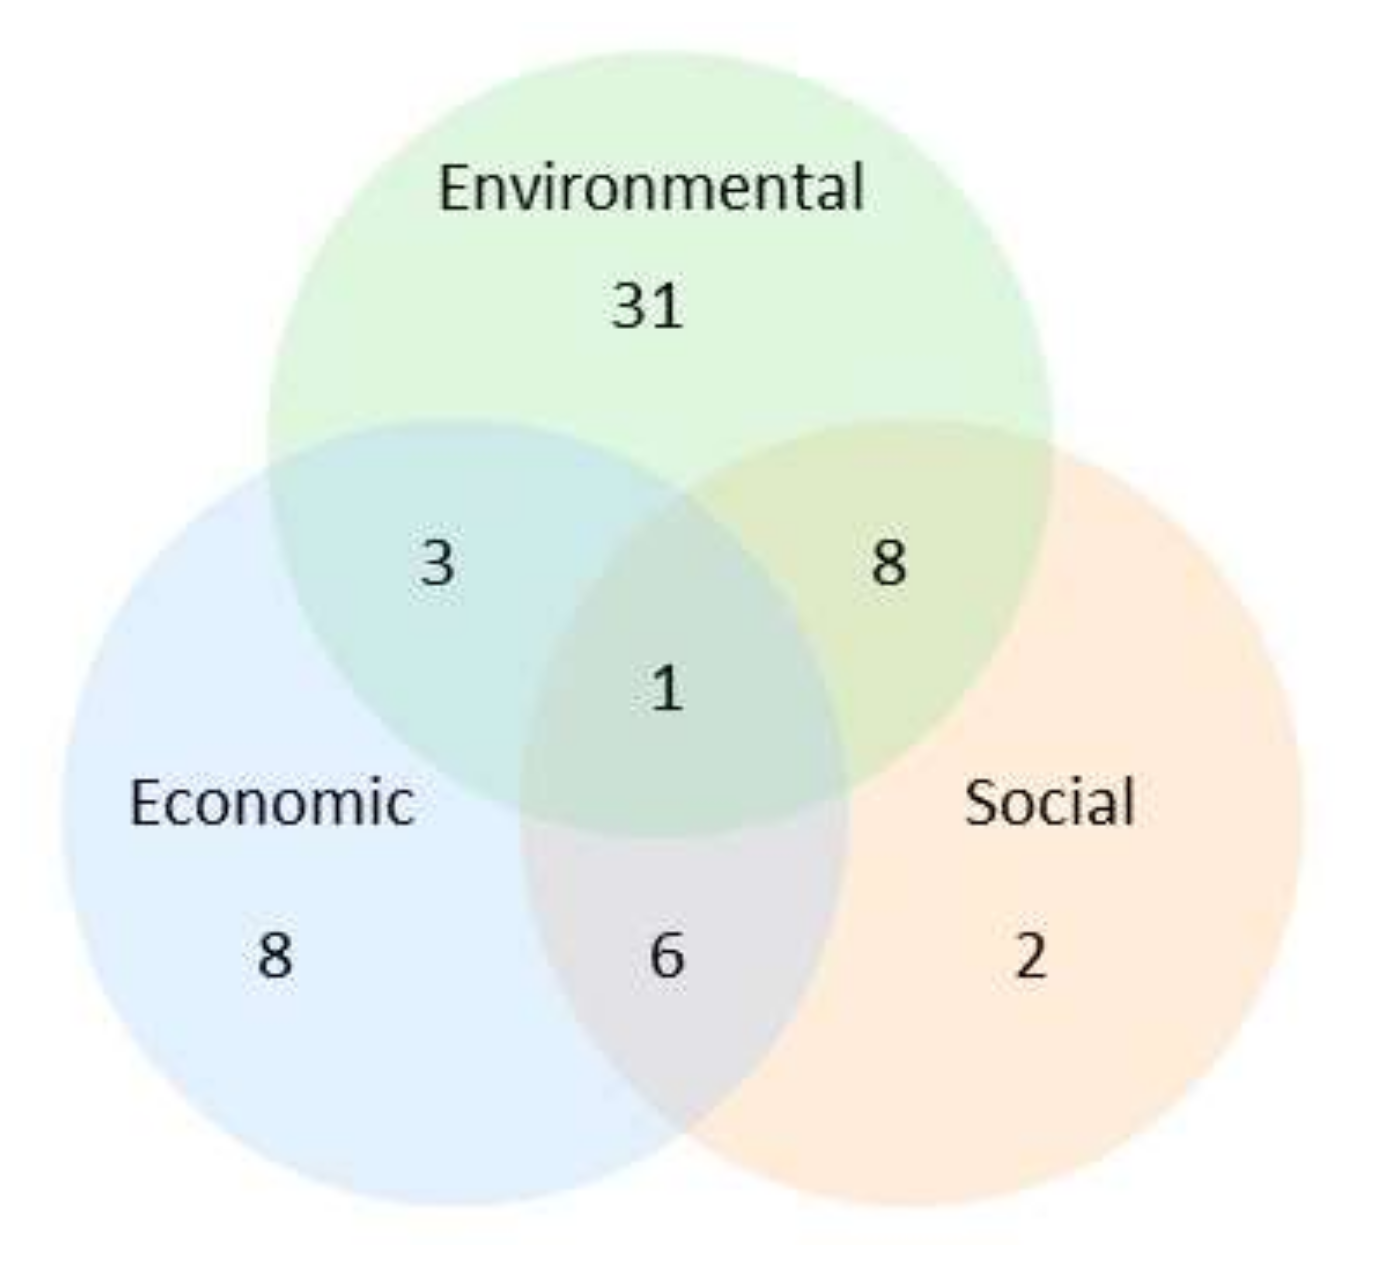
The most commonly found SD pillar in teaching materials using SDIs is the environmental pillar (Figure 3), with 73% of the records (n = 43) addressing environmental indicators. More precisely, 31 records focused on the environmental pillar only. Eight records contained both environmental and social SDIs, and three records contained indicators from environmental and economic pillars. Records containing only economic (13%, n = 8) or social (3%, n = 2) indicators were in the minority, and the number of records combining these two pillars was similar (10%, n = 6). Indicators related to all three pillars were found in only one record. Nevertheless, most indicators in this teaching material belong to the environmental pillar, with just one indicator related to social and one to economic pillar. One of the activities in this record (named Environment behind the school) was focused on performing the school audit when students collect questionnaire data from their schoolmates. Students evaluate the school in terms of the areas that directly affect the environment by using statements and the Likert scale during this activity.
More detailed results were obtained by analyzing all SDIs. We identified 128 indicators in 59 records; consequently, some records contain more than one indicator. Almost half of the records (44%; n = 26) contained a single SDI, 15 records (25%) contained 2 SDIs, and 10 records (17%) contained 3 SDIs; 6 records contained more than 4 indicators.
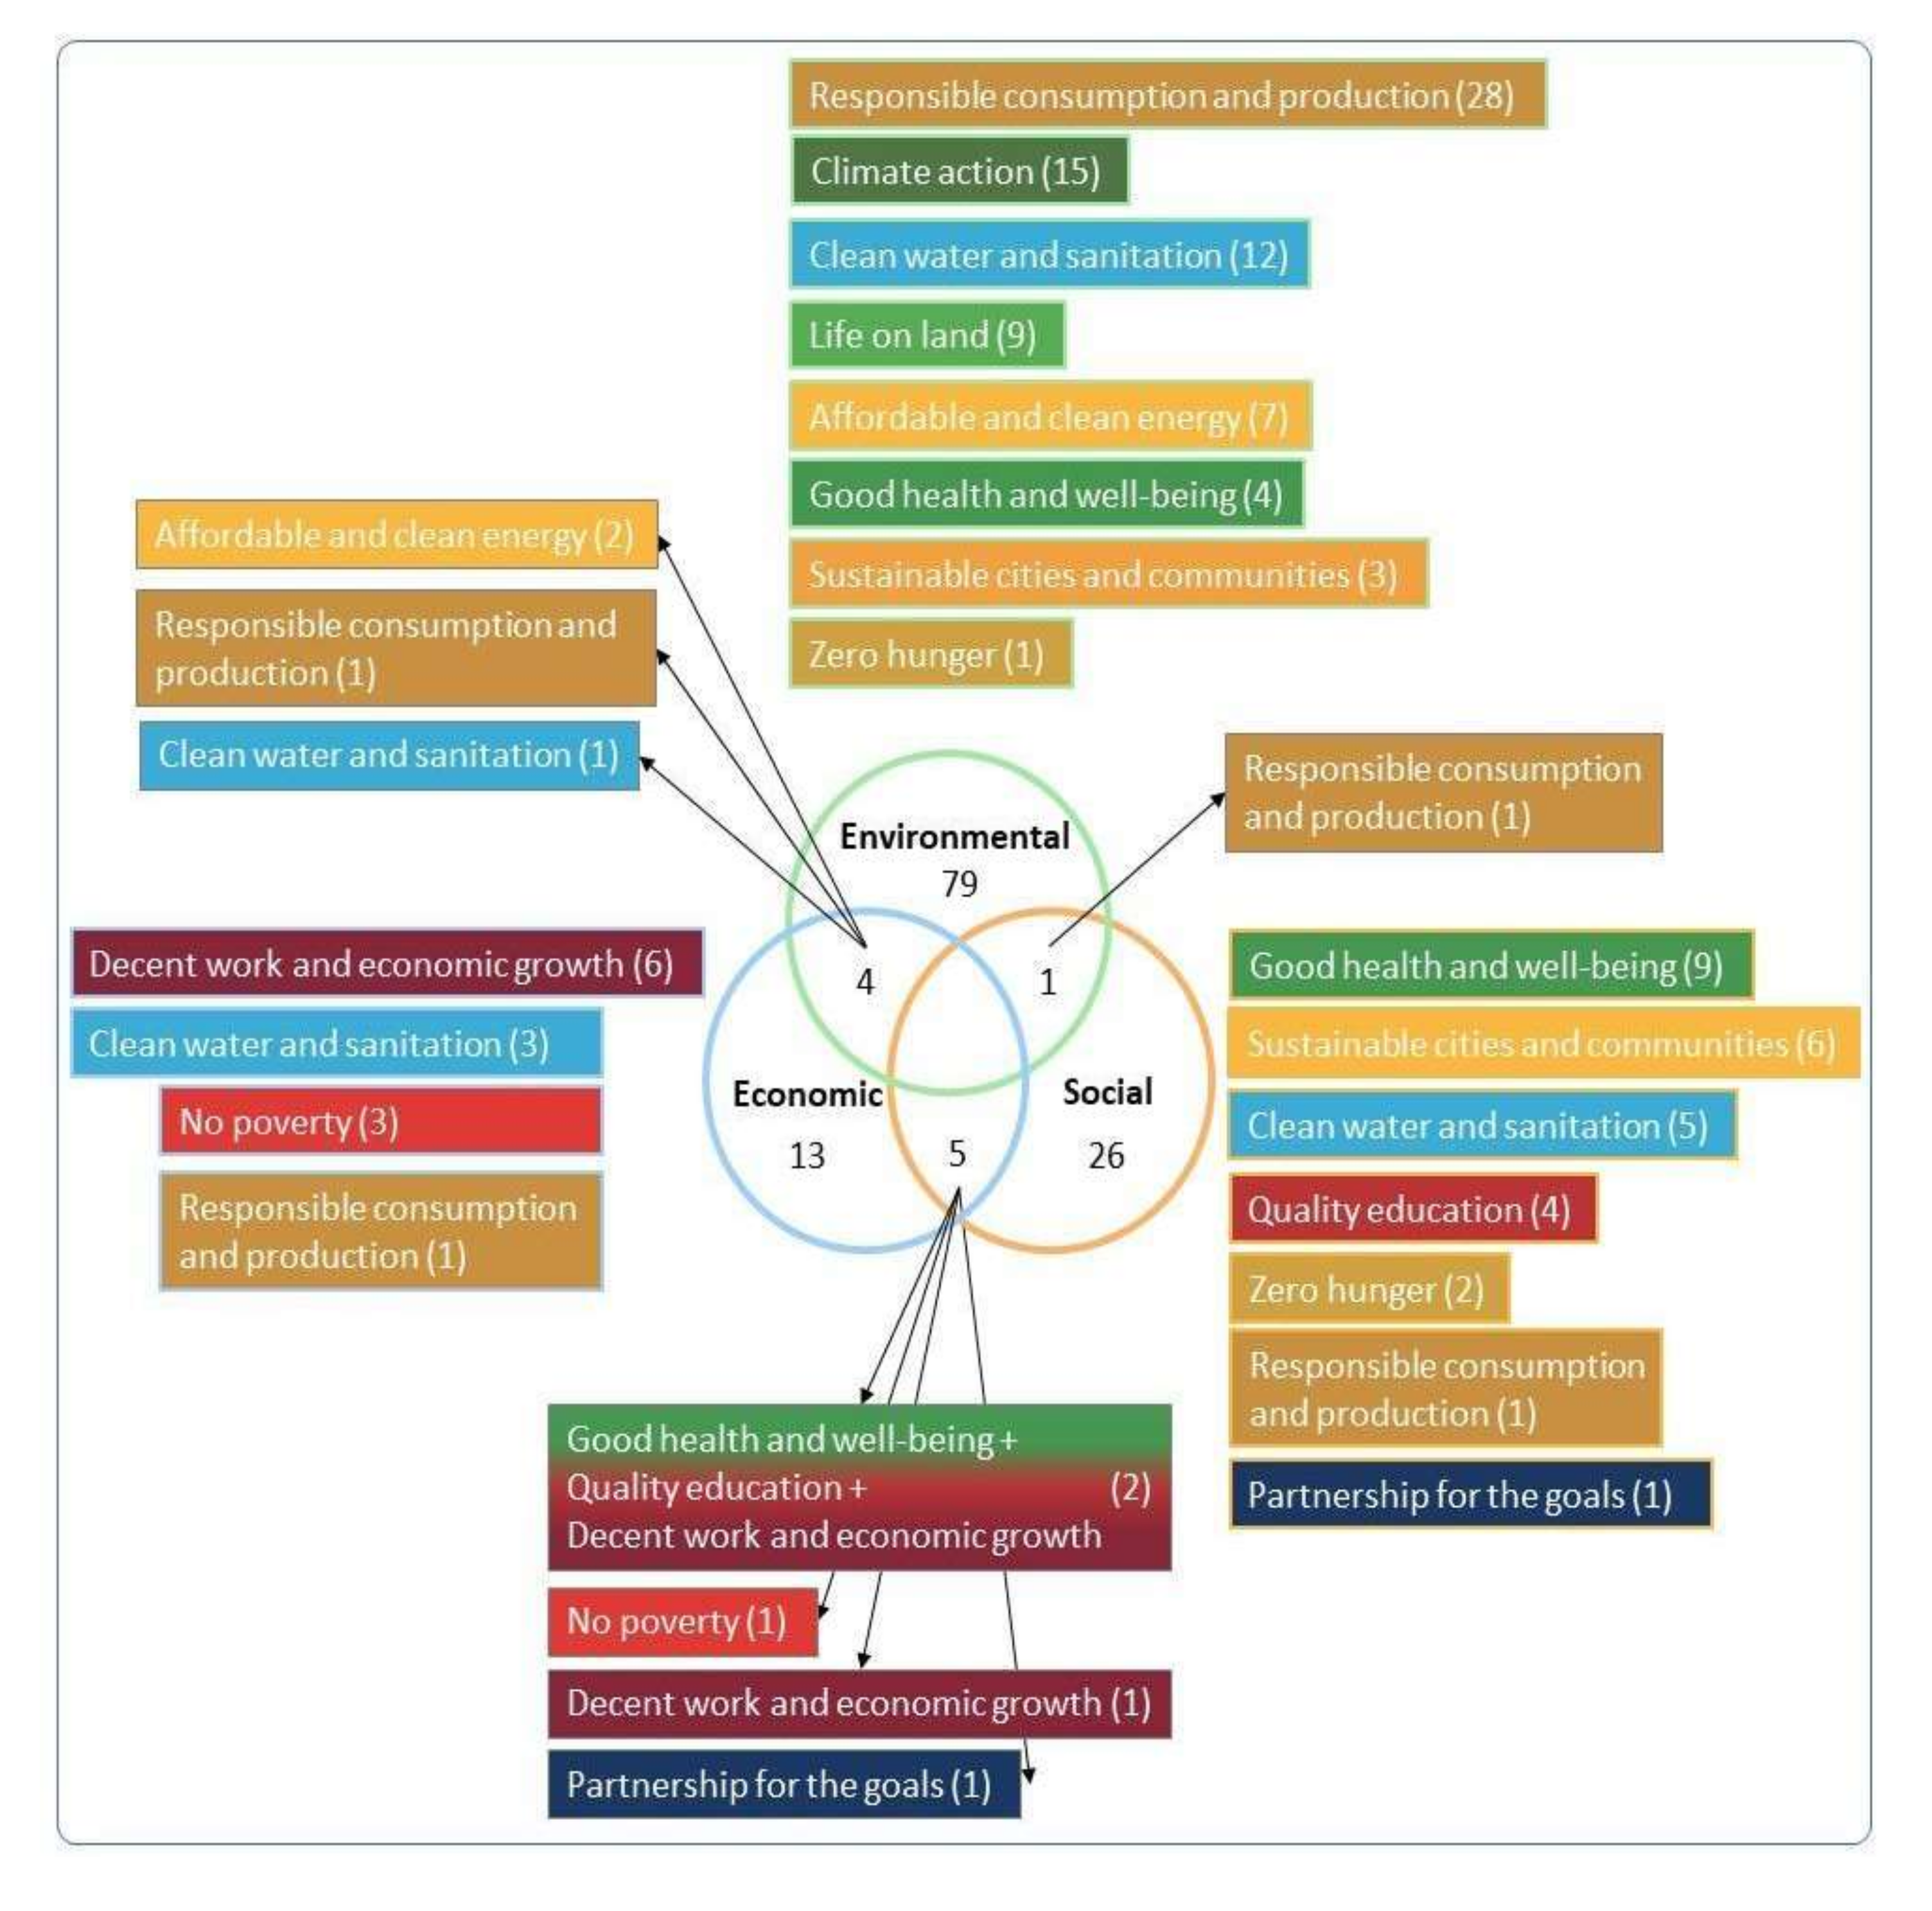
The individual SDIs were then assigned by theme and content to the SDGs specified by the UN [56]. The distribution of SDIs among pillars and SDGs is shown in Figure 4.
Similar to the records, most indicators (62%, n = 79) were connected to the environmental pillar. More specifically, 28 indicators (35%) addressed SDG 12: Responsible Consumption and Production. This was the highest number of all indicators, not just environmental. The themes included in the records related to SDG 12 primarily focused on waste prevention, reduction, recycling, and reuse, whether plastic, glass, or general. The themes related to energy consumption, namely the sustainable management and efficient use of natural resources (SDG 12.2), were also common in teaching materials. Other indicators identified in the records matched SDG 12.2 or addressed consumption and usage of materials and their footprint. The remaining SDIs related to SDG 12 in teaching materials address the reduction in chemical release into air, water, and soil.
Fifteen environmental indicators (18%) referred to SDG13: Climate Action, mainly following trends in temperature parameters, precipitation parameters, and greenhouse gas emissions (SDG 13.2), and 12 SDIs addressed SDG 6: Clean Water and Sanitation. Themes such as measuring water consumption and wastewater production (SDG 6.4) across all sectors and drinking water quality indicators (SDG 6.3) were also present in the teaching materials. Nine SDIs addressed SDG 15: Life on Land, mainly through various indicators of environmental quality, such as coverage by protected areas (SDG 15.1), sustainable forest management (SDG 15.2), or loss of biodiversity (SDG 15.5). Seven SDIs referred to SDG 7: Affordable and Clean Energy, such as share of non/renewable sources for electricity production (SDG 7.2), consumption, and improvement in the efficiency of energy (SDG 7.3). SDG 3: Good Health and Well-being was represented by four indicators related to air quality parameters, such as the concentration of pollutants in the air or the number of smog situations (SDG 3.9). The results show that some indicators on major topics are grouped into different SDGs, depending on the context and on how they are expressed. For example, the topic of air pollution is found both in SDG 3 (Good Health and Well-being), in relation to emissions that affect health, smog, and emission standards, and in SDG 13 (Climate action), in relation to CO2 emissions and impacts on climate. Similarly, the topic of energy is quite broad: in terms of effectivity of primary sources or non/renewable sources, energy-saving measures, the SDI belongs to SDG 7 (Affordable and Clean Energy) and in terms of, e.g., heat loss of the building or energy consumption in sustainable housing we speak about SDG12 (Responsible Consumption and Production).
The social pillar is represented by 26 indicators (20% of 128 SDIs), 7 of which belong to SDG 3: Good Health and Well-being. Almost all these indicators work with life expectancy or child mortality (SDG 3.2), and one addresses the number of HIV-positive citizens (SDG 3.3). Six SDIs were assigned to SDG 11: Sustainable Cities and Communities, including safety transport to school or the number of traffic accidents (11.2) and emotional maps to record problematic places in towns (SDG 11.1 and 11.2). Five SDIs on accessibility to water are found in SDG 6: Clean Water and Sanitation (SDG 6.1). SDG 1: Zero Hunger is discussed within the global hunger index (SDG 2.1) and food safety.
We have also identified two records on quality-of-life indicators related to two SD goals, SDG 3: Good Health and Well-being and SDG 4: Quality Education. Indeed, these records, i.e., teaching materials, describe activities in which students assess different places from the perspective of living conditions, use the indicators to evaluate the environment around the school, and assess their perception of those places.
The third economic pillar is not highlighted in the teaching materials, at least based on the number of records containing economic SDIs, which was only 13 (10%). The most represented SDG, with 6 records (5%), was SDG 8: Decent Work and Economic Growth. Two records address gross domestic product (GDP) (SDG 8.1), two the price of oil (SDG 8.4), and two debt issues (SDG 8.10). Three other SDIs on poverty reduction belong to SDG1: No Poverty (in particular SDG 1.2), and three SDIs on the price of water belong to SDG 6: Clean Water and Sanitation.
Similar to the quality-of-life indicators mentioned above, several more complex SDIs belong to more SDGs or pillars (see Figure 4). One indicator expressing the consumption of food commodities by the level of development of the countries belongs to SDG 12: Responsible Consumption and Reduction and is related to environmental and social pillars. Four SDIs related to the environmental and economic pillar were found: two SDIs were more complex indicators dealing with electric energy consumption (SDG 7), one with sustainable consumption (SDG 12), and one with household water consumption (SDG 6). At least five indicators belonged to the social and economic pillar: one SDI was related to fair trade (SDG 17: Partnership for the goals), one to costs for migrants (SDG 8: Decent Work and Economic Growth), and one to extreme poverty (SDG 1: No Poverty). The two remaining indicators referred to the Human Development Index (HDI) [57]. HDI is complex in both dimensions: this indicator is included in different pillars and SDGs—SDG 3 Good Health and Well-being, SDG 6 Decent Work and Economic Growth together with SDG 4 Quality Education.
3.2. Descriptors of SDIs
A more in-depth analysis of the 128 SDIs revealed other details. Most SDIs were objective (87%) rather than subjective (13%; n = 16), which was not surprising because most of the official data in reports are expressed as numbers in tables and graphs. These numbers are objectively measured using well-established methods and tools. Conversely, subjective SDIs are assessed by individuals, so the answers from respondents, such as results in emotional maps or answers to a satisfaction questionnaire, can differ considerably. In our records, most subjective SDIs belonged to the environmental pillar (n = 12), with only one-quarter belonging to the social pillar (n = 4), because an above-mentioned ecological audit of the school performed via a questionnaire contained several items using environmental SDIs.
We also examined how SDIs were interpreted in the records. SDIs were included in texts, tables, maps, graphs, and schemes (a figure with numbers), and one SDI was presented in time-lapse photographs of melting glaciers. However, not all indicators were used or addressed in the activities. In fact, 38 SDIs were present in the record, but students were not expected to actively work with them in any way. Most of these SDIs were formulated in text, which, as shown by the decrease in the text representation number from 93 to 59 (Table 1), except for 4 SDIs presented in maps, but not used in any task either. Nevertheless, most SDIs (n = 90, 70%) should be actively used by students. In other words, students should answer questions and interpret, collect, and/or analyze data/information using those indicators, albeit also mostly presented in text form (see Table 1). In those activities, students were asked to look the information up in resources or to count the share of a variable, for example, in a total of 59 texts, 13 tables, 5 maps, 9 graphs, schemes, and photos.
As mentioned above, 90 SDIs require students to actively work using those indicators, but the nature of the task varies from activity to activity. We identified two main approaches. Most SDIs require rational work (n = 61; 68%) in which students treat and interpret data and do calculations, while the other tasks require an empirical approach in which students perform a hands-on activity (typically measuring a variable of water or air properties) or collect data (i.e., water or energy consumption or data for emotional maps). Among these 90 SDIs, most require either basic or advanced mathematical literacy.
3.3. STEM Potential
The STEM potential of SDIs is highlighted by the percentage of indicators that require mathematical literacy, with 62% (56 of 90) SDIs requiring students to use mathematical skills. The nature of those skills is outlined by mathematical content in Table 2. However, the total number of occurrences exceeds 56 SDIs because some indicators require more than one mathematical skill. The frequencies of the selected mathematical topics are presented in Table 2. As expected, and in line with the literature [44], teaching materials involving mathematical operations and skills mainly refer to measuring, exemplifying, describing the characteristics of functions, quantitative expressions, including percentages, ratios, and fractions, using descriptive statistics, interpreting data in graphs, tables, charts, and diagrams, or evaluating and comparing data sets.
The item designated as ‘Others’ in Table 2 covers rare mathematical topics addressed in the teaching materials. These topics include calculating (water and fuel) consumptions, drawing graphs, recording data into tables, calculating the area of a planar domain, or linear equations. Overall, all mathematical topics require fundamental arithmetic operations.
4. Discussion and Conclusions
4.1. SDIs in Czech Teaching Materials
Our analysis of the records led to several conclusions. First, only 5% of all studied teaching materials on SD and related themes use SDIs in some way for activities of lower and higher secondary education. Not all teaching materials should use such indicators, but evidence available in the literature provides clear information for steering policies (see, e.g., the work of [58]) and for decision making on education for sustainable development supporting the use of SDIs. Overlooking SDIs, and above all, their untapped potential as teaching materials and thus in the educational process will necessarily affect the educational process and learning outcomes.
By applying SDIs in lessons, teachers empower students to achieve their learning objectives. Using graphs and tables with data in lessons helps students develop higher-order thinking skills, such as interpretation in a broader context or data evaluation [59,60,61,62]. These skills are crucial for handling and understanding data presented to the public. According to Skovsmose [63], mathematical knowing refers to competencies we normally describe as mathematical skills and are usually represented in mathematics curricula. Beyond formal mathematical methods, including statistical or prediction methods (often used in climate change), mathematical knowing encompasses mathematical aspects of climate change communication, such as the formal properties of graphs and charts. Therefore, mathematical knowledge is essential for understanding information about environmental challenges.
4.2. Social and Economic SDIs
In our research sample of teaching materials, SDIs are predominantly found in the environmental pillar, as expected because environmental education has been established in Czech education since the 1980s [64]. Czech teachers are therefore used to addressing environmental topics, which is probably not the case for economic and social SDIs. Such SDIs are scarcely used in the teaching materials analyzed in this study even though SD is part of the national curriculum [65], and at least some appropriate themes and data are often presented by the media [37]. Perhaps a long tradition in environmental education inhibits, to some extent, a broader perspective necessary for understanding the broad scope of sustainable development. Alternatively, social and economic sustainability may not be as well conceptualized as environmental sustainability yet [66]. Still, some social and economic SDIs can be easily used to connect social and natural environments. For example, topics such as waste recycling, water or energy consumption, and climate change are naturally addressed using not only environmental but also economic and social indicators, and information presented to the public by the media or in sustainability reports can be used for this purpose. In short, the second untapped potential of SDIs is the broader use of existing social and economic indicators to understand the complex conception of sustainable development.
4.3. Appropriate Sources
SDIs were represented in teaching materials the way they are in various SD reports but primarily included in texts, in addition to tables, graphs, maps, and schemes, among other visuals. By contrast, in official reports, the text mainly serves to help readers interpret the data. We also observed that the teaching materials underuse accompanying visual representations, such as pictograms, traffic lights, or tachometers, because most authors of the teaching materials are also the authors of the visual representation. As a result, they use mostly the text form of an SDI or create a different representation. This often applies to the SDIs that are actively treated by students, especially in hands-on activities, such as measuring the consumption of water or energy when collecting data outlined in a table or plotting a graph. Unfortunately, very few SDIs were represented in professional visualization, although many authors allow the use of their materials for educational purposes. Hence, this is the third untapped potential of Czech teaching materials for ESD, that is, readily available and free resources, such as national (Czech Environment Information Agency (Česká informační agentura životního prostředí—CENIA), [67]) or international ([68,69]) reports and websites of appropriate organizations (e.g., people in need [70]), as well as leaflets and other informational materials, that provide professional and accurate information on the state of the environment.
Using readily available materials published by relevant offices (ministries and research centers) supports meaningful learning and also helps teachers struggling with implementing SD topics into education. The significance of the topic regards not only the STE(A)M concepts but also scientific literacy because reading and understanding complex information within SDIs supports citizenship skills. When citizens fail to grasp information shared with them in such documents, they remain at the level of simple awareness, which has a weak relationship with personal change [71]. In this context, mathematical skills can be a catalyst for personal conduct knowledge by helping people understand a class of sustainable development subjects simply and easily grasped, thereby lending themselves to changes in their behaviors without requiring detailed comprehension [71]. However, our analysis of records showed that the mathematical skills required in activities involving SDIs more often entail basic operations, such as percentage calculation and recording data in a table or comparing and evaluating data. Conversely, several practical activities were more in line with the recommendations of Barwell [42]. Students should engage with sustainable development topics by communicating with peers about those topics and, e.g., by meeting stakeholders, rather than using SD data as a ‘fun’ way to learn statistics. We argue that combining personal engagement with the development of STEM competencies, such as mathematical modeling, would be the ideal approach to education for sustainable development, especially considering currently available sources for mathematical modeling education (e.g., the work of [72]). However, the mathematical concept in the studied teaching materials seems to be the fourth untapped potential.
4.4. Education for Sustainable Development and STEM
STEM education has gained global recognition [73], especially considering the impact of the COVID-19 pandemic because STEM jobs have been less affected than many others. Global economic changes have also led to an increased number of experts in STEM jobs [74]. In this context, worldwide problems can be used to teach science-related content, but they require students to follow scientific practices, manage technological or engineering knowledge, and interpret data using mathematics. As such, mathematics plays a key role in education for sustainable development [42], especially by providing teachers with real-world situations to address in mathematics [75]. Mathematics and critical thinking are crucial skills in the context of real-world questions and sustainability issues. Answering many sustainability questions in a well-informed way requires some mathematical knowledge. Subsequently, we can sort, prioritize, present, and evaluate sustainability issues or learn to avoid misinterpreting real data.
Despite several decades of SD concept and ESD, some barriers to more widespread implementation of SD into school practices remain. Some of these barriers have been identified quite early, when SD seemed too abstract and broad, lacking qualified staff to teach SD [76], leadership, and accountability mechanisms [22]. A Canadian case study [77] confirmed one of these obstacles, lack of leadership, together with an unfavorable view of the role of ESD and silo-ing of education faculties when compartmentalized and well-organized education is safer than cross/curricular attempts. Foley [78] listed the lack of interdisciplinarity and resistance to change among four barriers of the dominant social paradigm preventing ESD. Yet, interdisciplinarity seems to be one of the drivers for ESD: European countries with integrated science curriculum have topics on SD as a natural part of learning outcomes, and it is sustainability that seems to be one of the key concepts of science integration [79].
Several questions are still unanswered. Given the current Czech curricula and our results of document analysis, what is the outlook of education for sustainable development in the country? Should teachers start searching in national and international reports to become experts in SD data and methods, or shall the authors of those reports also produce educational materials for their use in schools? Albeit feasible, these strategies will unlikely be implemented, so other ways must be found to bridge the gap between sustainable development and education for sustainable development in the Czech Republic. Such an approach can be to systematically train preservice teachers on education for sustainable development by involving all participating departments in finding suitable topics and tools in STEM to address sustainable development. After all, teachers are the most important drivers for restructuring the educational process and moving educational institutions toward sustainability [80] using innovative teaching and learning instruments.
In conclusion, our study highlights the potential of SDIs in education for sustainable development, which remains untapped in Czech teaching materials, and provides some suggestions on how to effectively use SDIs to raise the interest of educators in applying these indicators during their lessons. Compared to the number of studies on ESD, SDIs seem to stay aside from the research focus, although they represent a useful tool for ESD and STEM education developing students’ competencies, especially learning for active citizenship.
4.5. Limitations of the Study
The most significant limitation of the present study is its qualitative approach to content review analysis of teaching materials, which entails researchers’ bias. Nevertheless, before conducting this study, we discussed SDIs with an expert from the Charles University Environment Centre to understand how SDIs are defined and formulated and how they could be identified in our sample. Moreover, we also discussed the preliminary results to ensure the validity of this research. However, other studies conducted by different research groups may provide slightly different results. In this study, we analyzed a single website that met our requirements as a relevant source of teaching materials, free of charge, commonly known among teachers. Notwithstanding our full-text search, some records containing SDIs may have been ignored because they were not found under the selected keywords, potentially geographic topics, which may naturally include sustainable development topics and SDIs. However, we did not use the keyword geographic education because we assumed that the teacher would enter general keywords related to SD. Another limitation is the national scope of our study because only the Czech context was analyzed in this study. Yet, such a national study was conducted for several reasons. Currently, Czech curricula are being revised, and changes may be incorporated into the new curricula to include topics or approaches reflecting current trends. Another reason is the need to describe teaching materials for SD available in our country, which had not been studied until now. To compare the Czech situation with that of other countries, we must first know the situation in our country. In turn, we cannot analyze websites of other countries because we do not know the most commonly used platforms by the teachers of those countries, and the language barrier would have also been prevented a more in-depth analysis. Unfortunately, we cannot compare Czech results with those of other studies because there is no such study on SDIs used in teaching materials. Nevertheless, the research gap stands out as an untapped potential for the scientific community as well.
Author Contributions
Conceptualization, E.S.U. and P.S.; methodology, E.S.U. and P.S.; validation, E.S.U. and P.S.; formal analysis, E.S.U. and P.S.; writing—original draft preparation, E.S.U.; writing—review and editing, E.S.U. and P.S.; visualization, E.S.U. All authors have read and agreed to the published version of the manuscript.
Funding
This work has been supported by Charles University Research Centre No. UNCE/HUM/024.
Institutional Review Board Statement
Not applicable.
Informed Consent Statement
Not applicable.
Data Availability Statement
Data will be made available on a request (a list of Czech web links and their coding).
Acknowledgments
The authors thank Svatava Janoušková for sharing her subject matter expertise with us during our consultations, for her guidance and for her constant encouragement and support, and Carlos V. Melo for editing the manuscript.
Conflicts of Interest
The authors declare no conflict of interest.
References
- United Nations. Transforming our world: The 2030 agenda for sustainable development. In Resolution Adopted by the General Assembly on 25 September 2015; RES/70/1; UN: New York, NY, USA, 2015; Available online: https://www.un.org/en/development/desa/population/migration/generalassembly/docs/globalcompact/A_RES_70_1_E.pdf (accessed on 20 December 2021).
- Kioupi, V.; Voulvoulis, N. Education for sustainable development: A systemic framework for connecting the SDGs to educational outcomes. Sustainability 2019, 11, 6104. [Google Scholar] [CrossRef] [Green Version]
- UNESCO. Framework for the Implementation of Education for Sustainable Development (ESD) Beyond 2019. 2019. Available online: https://unesdoc.unesco.org/ark:/48223/pf0000370215 (accessed on 19 November 2021).
- Seatter, C.S.; Ceulemans, K. Teaching Sustainability in Higher Education: Pedagogical Styles That Make a Difference. Can. J. High. Educ. 2017, 47, 47–70. [Google Scholar] [CrossRef]
- Stanners, D.; Bosch, P.; Dom, A.; Gabrielsen, P.; Gee, D.; Martin, J.; Rickard, L.; Weber, J.-L. Frameworks for environmental assessment and indicators at the EEA’. In Sustainable Indicators: A Scientific Assessment, Scientific Committee on Problems of the Environment; Hak, T., Moldan, B., Dahl, A., Eds.; SCOPE 67; Island Press: London, UK, 2007; pp. 125–144. [Google Scholar]
- Harger, J.R.E.; Meyer, F.-M. Definition of indicators for environmentally sustainable development. Chemosphere 1996, 33, 1749–1775. [Google Scholar] [CrossRef]
- Brugmann, J. Is there a method in our measurement? The use of indicators in local sustainable development planning. Local Environ. 1997, 2, 59–72. [Google Scholar] [CrossRef]
- Chess, C.; Johnson, B.B.; Gibson, G. Communicating about environmental indicators. J. Risk Res. 2005, 8, 63–75. [Google Scholar] [CrossRef]
- Parliament, U.K.; Science and Technology Committee–Second report. Higher Education in Science, Technology, Engineering and Mathematics (STEM) subjects. 2012. Available online: https://publications.parliament.uk/pa/ld201213/ldselect/ldsctech/37/3702.htm (accessed on 19 November 2021).
- NSF—National Science Foundation. National Science Foundation. Available online: https://www.nsf.gov/ (accessed on 19 November 2021).
- Aguilera, D.; Lupiáñez, J.L.; Vílchez-González, J.M.; Perales-Palacios, F.J. In Search of a Long-Awaited Consensus on Disciplinary Integration in STEM Education. Mathematics 2021, 9, 597. [Google Scholar] [CrossRef]
- Fraser, J.; Gupta, R.; Flinner, K.; Rank, S.; Ardalan, N. Engaging Young People in 21st Century Community Challenges: Linking Environmental Education with Science, Technology, Engineering and Mathematics, NewKnowledge Report; #PRCO.106110.06; New Knowledge Organization Ltd.: New York, NY, USA, 2013. [Google Scholar]
- Helvaci, S.C.; Helvaci, I. An Interdisciplinary Environmental Education Approach: Determining the Effects of E-STEM Activity on Environmental Awareness. Univers. J. Educ. Res. 2019, 7, 337–346. [Google Scholar] [CrossRef]
- One Planet Network. Inspiring a Global Network for Sustainable Consumption and Production. Available online: https://www.oneplanetnetwork.org/ (accessed on 19 November 2021).
- SSEC—The Smithsonian Science Education Center. Our Goals. Available online: https://www.ssec.si.edu/our-goals (accessed on 19 November 2021).
- Nguyen, T.P.L.; Nguyen, T.H.; Tran, T.K. STEM Education in Secondary Schools: Teachers’ Perspective towards Sustainable Development. Sustainability 2020, 12, 8865. [Google Scholar] [CrossRef]
- Steiner, G.; Posch, A. Higher education for sustainability by means of transdisciplinary case studies: An innovative approach for solving complex, real-world problems. J. Clean. Prod. 2006, 14, 877–890. [Google Scholar] [CrossRef]
- Del Cerro Velazquez, F.; Lozano Rivas, F. Education for sustainable development in STEM (Technical drawing): Learning approach and method for SDG 11 in classrooms. Sustainability 2020, 12, 2706. [Google Scholar] [CrossRef] [Green Version]
- UNESCO. Education for Sustainable Development. 2021. Available online: https://en.unesco.org/themes/education-sustainable-development (accessed on 13 December 2021).
- Nikel, J. Making sense of education ‘responsibly’: Findings from a study of student teachers’ understanding(s) of education, sustainable development and Education for Sustainable Development. Environ. Educ. Res. 1997, 13, 545–564. [Google Scholar] [CrossRef]
- Fisher, J.; Bonn, I. Business sustainability and undergraduate management education: An Australian study. High. Educ. 2011, 62, 563–571. [Google Scholar] [CrossRef]
- Wright, T. Definitions and frameworks for environmental sustainability in higher education. High. Educ. Policy 2002, 15, 105–120. [Google Scholar] [CrossRef]
- Dima, A.M.; Meghisan-Toma, G.M. Research on implementing education for sustainable development. In Proceedings of the 12th International Conference on Business Excellence 2018, 22–23 March 2018; Bucharest, Romania; Volume 12, pp. 300–310. Available online: https://sciendo.com/article/10.2478/picbe-2018-0027 (accessed on 20 December 2021). [CrossRef] [Green Version]
- Capelo, A.; Santos, M.C.; Pedrosa, M.A. Education for sustainable development indicators, competences and science education. In Umweltbildung, Umweltkommunikation und Nachhaltigkeit—Environmental Education, Communication and Sustainability, 1st ed.; Gonçalves, F., Pereira, R., Leal Filho, W., Azeiteiro, U.M., Eds.; Petr Lang: Lausanne, Switzerland, 2012; Volume Chapter 5, pp. 99–123. Available online: https://www.researchgate.net/publication/233391789_Education_for_sustainable_development_indicators_competences_and_science_education (accessed on 20 December 2021).
- Tilbury, D.; Janousek, S.; Elias, D.; Bacha, J. Asia-Pacific Guidelines for the Development of National ESD Indicators; UNESCO Asia and Pacific Regional Bureau for Education: Bangkok, Thailand, 2007; 122p, ISBN 9292231219. Available online: https://bangkok.unesco.org/content/asia-pacific-guidelines-development-national-esd-indicators (accessed on 20 December 2021).
- Findler, F.; Schönherr, N.; Lozano, R.; Stacherl, B. Assessing the Impacts of Higher Education Institutions on Sustainable Development—An Analysis of Tools and Indicators. Sustainability 2019, 11, 59. [Google Scholar] [CrossRef] [Green Version]
- UNESCO. Twenty-First Century Skills. 2021. Available online: http://www.ibe.unesco.org/en/glossary-curriculum-terminology/t/twenty-first-century-skills (accessed on 13 December 2021).
- Liu, Z.; Yang, H.-C.; Shiau, Y.-C. Investigation on Evaluation Framework of Elementary School Teaching Materials for Sustainable Development. Sustainability 2020, 12, 3736. [Google Scholar] [CrossRef]
- Národní Pedagogický Institut České Republiky (National Pedagogical Institute, Czech Republic). Metodický portal RVP.CZ. Available online: https://rvp.cz/ (accessed on 19 November 2021).
- Mascarenhas, A.; Coelho, P.; Subtil, E.; Ramos, T.B. The role of common local indicators in regional sustainability assessment. Ecol. Indic. 2010, 10, 646–656. [Google Scholar] [CrossRef]
- Barry, J. Communicating a Politics of Sustainable Development; Eolss Publishers: Oxford, UK, 2003. [Google Scholar]
- Hák, T.; Janouškova, S.; Moldan, B.; Dahl, A.L. Closing the sustainability gap: 30 years after “Our Common Future”, society lacks meaningful stories and relevant indicators to make the right decisions and build public support. Ecol. Indic. 2018, 87, 193–195. [Google Scholar] [CrossRef]
- Scerri, A.; James, P. Communities of citizens and ‘indicators’ of sustainability. Community Dev. J. 2010, 45, 219–236. [Google Scholar] [CrossRef]
- Miller, J.D. Scientific literacy for effective citizenship. In Science/Technology/Society as Reform in Science Education; Yager, R.E., Ed.; SUNY Press: Albany, NY, USA, 1996; pp. 185–204. [Google Scholar]
- Kolstø, S.D. Scientific literacy for citizenship: Tools for dealing with the science dimension of controversial socioscientific issues. Sci. Educ. 2001, 85, 291–310. [Google Scholar] [CrossRef]
- Dimopoulos, K.; Koulaidis, V. Science and technology education for citizenship: The potential role of the press. Sci. Educ. 2003, 87, 241–256. [Google Scholar] [CrossRef]
- Janoušková, S.; Hák, T.; Nečas, V.; Moldan, B. Sustainable development—a poorly communicated concept by mass media. Another challenge for SDGs? Sustainability 2019, 11, 3181. [Google Scholar] [CrossRef] [Green Version]
- Spangenberg, J.; Mesicek, R.; Metzner, A.; Luks, F. Sustainability Indicators for the Knowledgebased Society–Measuring the Sustainability of the Information Society. Futura 2002, 2, 85–95. [Google Scholar]
- Mascarenhas, A.; Nunes, L.M.; Ramos, T.B. Exploring the self-assessment of sustainability indicators by different stakeholders. Ecol. Indic. 2014, 39, 75–83. [Google Scholar] [CrossRef]
- Sterling, S. Sustainable Education; Green Books: Devon, UK, 2001. [Google Scholar]
- Holbrook, J.; Rannikmäe, M.; Soobard, R. STEAM Education—A transdisciplinary teaching and learning approach. In Science Education in Theory and Practice; Akpan, B., Kennedy, T.J., Eds.; Springer: Cham, Switzerland, 2020; pp. 465–477. [Google Scholar]
- Barwell, R. Some Thoughts on a Mathematics Education for Environmental Sustainability. In The Philosophy of Mathematics Education Today; Ernest, P., Ed.; ICME-13 Monographs; Springer: Cham, Switzerland, 2018; pp. 145–160. [Google Scholar] [CrossRef]
- Joutsenlahti, J.; Perkkilä, P. Sustainability Development in Mathematics Education—A Case Study of What Kind of Meanings Do Prospective Class Teachers Find for the Mathematical Symbol “2/3”? Sustainability 2019, 11, 457. [Google Scholar] [CrossRef] [Green Version]
- Roe, J.; DeForest, R.; Jamshidi, S. Mathematics for Sustainability. (Texts for Quantitative Critical Thinking); Springer International: Cham, Switzerland, 2018. [Google Scholar]
- UNESCO. Division for Inclusion, Peace and Sustainable Development, Education Sector. Education for Sustainable Development Goals: Learning Objectives; UNESCO: Paris, France, 2017; ISBN 9789231002090. Available online: https://unesdoc.unesco.org/ark:/48223/pf0000247444 (accessed on 20 December 2021).
- Barth, M. Implementing Sustainability in Higher Education: Learning in an Age of Transformation; Routledge: London, UK, 2014; ISBN 9780203488355. Available online: https://www.researchgate.net/publication/267632483_Implementing_Sustainability_in_Higher_Education_Learning_in_an_age_of_transformation (accessed on 20 December 2021).
- Tudor, I. Teacher Roles in the Learner-Centred Classroom. ELT J. 1993, 47, 22–31. Available online: https://citeseerx.ist.psu.edu/viewdoc/download?doi=10.1.1.1013.5365&rep=rep1&type=pdf (accessed on 20 December 2021). [CrossRef]
- Brandes, D.; Ginnis, P. A guide to Student-Centred Learning; Nelson Thornes: Cheltenham, UK, 1996; ISBN 0748719946. [Google Scholar]
- Weimer, M. Learner-Centered Teaching: Five Key Changes to Practice; John Wiley & Sons: San Francisco, CA, USA, 2008; ISBN 0470366419. [Google Scholar]
- Hoidn, S. Student-Centered Learning Environments in Higher Education Classrooms; Springer: Palgrave Macmillan, NY, USA, 2016; ISBN 1349949418. [Google Scholar] [CrossRef]
- Kolb, D.A. Experiential Learning: Experience as the Source of Learning and Development; Prentice-Hall: Englewood Cliffs, NJ, USA, 1984; ISBN 01329526. Available online: https://www.researchgate.net/publication/235701029_Experiential_Learning_Experience_As_The_Source_Of_Learning_And_Development (accessed on 20 December 2021).
- Bandura, A. National Inst of Mental Health. Social Foundations of Thought and Action: A Social Cognitive Theory; Prentice-Hall, Inc.: Hoboken, NJ, USA, 1986; ISBN 013815614X. [Google Scholar]
- Slavich, G.M.; Zimbardo, P.G. Transformational Teaching:Theoretical Underpinnings. Basic Principles, and Core Methods. Educ. Psychol. Rev. 2012, 24, 569–608. [Google Scholar] [CrossRef] [PubMed] [Green Version]
- Mezirow, J. Learning as Transformation: Critical Perspectives on a Theory in Progress; Jossey-Bass: San Francisco, CA, USA, 2000; ISBN 0787948454. [Google Scholar]
- The Global Development Research Center. Urban Environmental Management: The Local Agenda 21. Available online: https://www.gdrc.org/uem/la21/la21.html (accessed on 19 November 2021).
- United Nations. SDG Indicators. Available online: https://unstats.un.org/sdgs/indicators/indicators-list/ (accessed on 19 November 2021).
- United Nations Development Programme. Human Development Index (HDI). Available online: http://hdr.undp.org/en/content/human-development-index-hdi (accessed on 19 November 2021).
- Hák, T.; Janoušková, S.; Whitby, A.; Abdallah, S.; Kovanda, J. Indicator policy factsheets: A knowledge brokerage tool. Sustainability 2015, 7, 3414–3429. [Google Scholar] [CrossRef] [Green Version]
- Robert, G. Brown. Map, Globe, and Graphing Readiness Activities: Developing Universal Thinking Skills. Soc. Stud. 1986, 77, 229–233. [Google Scholar] [CrossRef]
- Friel, S.N.; Curcio, F.R.; Bright, G.W. Making sense of graphs: Critical factors influencing comprehension and instructional implications. J. Res. Math. Educ. 2001, 32, 124–158. [Google Scholar] [CrossRef] [Green Version]
- Tairab, H.H.; Khalaf Al-Naqbi, A.K. How do secondary school science students interpret and construct scientific graphs? J. Biol. Educ. 2004, 38, 127–132. [Google Scholar] [CrossRef]
- Tajudin, N.A.M.; Chinnappan, M. The Link between Higher Order Thinking Skills, Representation and Concepts in Enhancing TIMSS Tasks. Int. J. Instr. 2016, 9, 199–214. [Google Scholar] [CrossRef]
- Skovsmose, O. Towards a critical mathematics education. Educ. Stud. Math. 1994, 27, 35–57. [Google Scholar] [CrossRef]
- Dlouhá, J. Environmentální Vzdělání v České Republice. (Vývoj po roce 1989). Environmental Education in the Czech Republic (Development after Year 1989). Zivotn. Prostředí 1999, 33, 255–258. Available online: http://publikacie.uke.sav.sk/sites/default/files/1999_5_255_258_dlouha.pdf (accessed on 20 December 2021).
- Ministry of Education, Youth and Sport. The Framework Educational Programme for Basic Education (FEP BE); 2007. Available online: https://www.msmt.cz/areas-of-work/basic-education-1 (accessed on 19 November 2021).
- McGuinn, J.; Fries-Tersch, E.; Jones, M.; Crepaldi, C.; Masso, M.; Kadarik, I.; Samek Lodovic, M.; Drufuca, S.; Gancheva, M.; Geny, B.; et al. Social Sustainability: Concepts and Benchmarks: Study Requested by the EMPL Committee. European Parliament. 2020. Available online: https://www.europarl.europa.eu/RegData/etudes/STUD/2020/648782/IPOL_STU(2020)648782_EN.pdf (accessed on 19 November 2021).
- CENIA (Czech Environment Information Agency). Report on the Environment of the Czech Republic. (in Czech at the Top, in English below). Available online: https://www.cenia.cz/publikace/zpravy-o-zp/ (accessed on 19 November 2021).
- European Commission. Policy Findings and Country Reports. Available online: https://ec.europa.eu/environment/eir/country-reports/index_en.htm (accessed on 19 November 2021).
- European Commission. The EU Environmental Implementation Review 2019 Country Report—CZECH REPUBLIC. Available online: https://ec.europa.eu/environment/eir/pdf/report_cz_en.pdf (accessed on 19 November 2021).
- People in Need. Interactive Classroom Activities. Available online: https://www.peopleinneed.net/what-we-do/varianty-educational-programme/interactive-classroom-activities (accessed on 19 November 2021).
- Coyle, K. Environmental Literacy in America: What Ten Years of NEETF/Roper Research and Related Studies Say about Environmental Literacy in the US; National Environmental Education & Training Foundation: Washington, DC, USA, 2005. [Google Scholar]
- Lesh, R.; Galbraith, P.L.; Haines, C.R.; Hurford, A. Modeling Students’ Mathematical Modeling Competencies: ICTMA 13; Springer: Boston, MA, USA, 2010. [Google Scholar] [CrossRef]
- Li, Y.; Wang, K.; Xiao, Y.; Froyd, J.E. Research and trends in STEM education: A systematic review of journal publications. Int. J. STEM Educ. 2020, 7, 1–16. [Google Scholar] [CrossRef] [Green Version]
- Tyson, W.; Lee, R.; Borman, K.M.; Hanson, M.A. Science, Technology, Engineering, and Mathematics (STEM) Pathways: High School Science and Math Coursework and Postsecondary Degree Attainment. J. Educ. Stud. Placed Risk (JESPAR) 2007, 12, 243–270. [Google Scholar] [CrossRef]
- Lafuente-Lechuga, M.; Cifuentes-Faura, J.; Faura-Martínez, Ú. Mathematics Applied to the Economy and Sustainable Development Goals: A Necessary Relationship of Dependence. Educ. Sci. 2020, 10, 339. [Google Scholar] [CrossRef]
- Leal Filho, W. Dealing with misconceptions on the concept of sustainability. Int. J. Sustain. High. Educ. 2000, 1, 9–19. [Google Scholar] [CrossRef]
- Falkenberg, T.; Babiuk, G. The status of education for sustainability in initial teacher education programmes: A Canadian case study. Int. J. Sustain. High. Educ. 2014, 15, 418–430. [Google Scholar] [CrossRef] [Green Version]
- Foley, H. Education for Sustainable Development Barriers. J. Sustain. Dev. 2021, 14, 1–8. [Google Scholar] [CrossRef]
- Stratilová Urválková, E.; Blaško, M.; Janoušková, S. Sustainability as a core concept of an integrated curriculum: Can the Czech curriculum follow the western countries? In Proceedings of the ICERI2021, Florence, Italy, 8–9 November 2021; pp. 7092–7100. [Google Scholar] [CrossRef]
- UNESCO. Sustainable Development Goal 4 and its Targets. 2021. Available online: https://en.unesco.org/node/265600 (accessed on 13 December 2021).
Figure 1.
Research process to reach the results and conclusions.

Figure 2.
Reaching the research sample: analysis of full-text records.

Figure 3.
SD pillars identified in analyzed records.

Figure 4.
The distribution of 128 SDIs among particular SD pillars and SDGs, indicating the number of SDIs in brackets.
Figure 4.
The distribution of 128 SDIs among particular SD pillars and SDGs, indicating the number of SDIs in brackets.


Table 1.
Number of all and actively used SIDs.
| Form of SDI | Number of SDIs in Total (Relative) | Number of Actively Used SDIs |
|---|---|---|
| Text | 93 (72%) | 59 |
| Table | 13 (10%) | 13 |
| Map | 9 (7%) | 5 |
| Graph | 9 (7%) | 9 |
| Scheme | 3 (2%) | 3 |
| Figure/picture/photo | 1 (∼1%) | 1 |
| Total | 128 | 90 |
Table 2.
Frequencies of specific mathematical topics.
| Mathematical Topics | Frequency |
|---|---|
| Evaluating and comparing data sets | 20 |
| Quantitative expressions of an amount (using percentage, ratios, fractions) | 14 |
| Interpretations data in graphs, tables, charts, and diagrams | 11 |
| Units of mass, length, volume, energy, information | 6 |
| Descriptive statistics (absolute and relative frequency, median, modus, …) | 5 |
| Proportionality, cross-multiplication | 5 |
| Others | 11 |
Publisher’s Note: MDPI stays neutral with regard to jurisdictional claims in published maps and institutional affiliations. |
© 2021 by the authors. Licensee MDPI, Basel, Switzerland. This article is an open access article distributed under the terms and conditions of the Creative Commons Attribution (CC BY) license (https://creativecommons.org/licenses/by/4.0/).
Share and Cite
MDPI and ACS Style
Urválková, E.S.; Surynková, P. Sustainable Development Indicators—Untapped Tools for Sustainability and STEM Education: An Analysis of a Popular Czech Educational Website. Sustainability 2022, 14, 121. https://doi.org/10.3390/su14010121
AMA Style
Urválková ES, Surynková P. Sustainable Development Indicators—Untapped Tools for Sustainability and STEM Education: An Analysis of a Popular Czech Educational Website. Sustainability. 2022; 14(1):121. https://doi.org/10.3390/su14010121
Chicago/Turabian StyleUrválková, Eva Stratilová, and Petra Surynková. 2022. "Sustainable Development Indicators—Untapped Tools for Sustainability and STEM Education: An Analysis of a Popular Czech Educational Website" Sustainability 14, no. 1: 121. https://doi.org/10.3390/su14010121
Note that from the first issue of 2016, this journal uses article numbers instead of page numbers. See further details here.