
Wind Farm Site Selection Using WAsP Tool for Application in the Tropical Region


1
Energy Technology Program, Faculty of Engineering, Prince of Songkla University, Hat Yai 90110, Songkhla, Thailand
2
School of Engineering and Built Environment, Griffith University, Southport, QLD 4222, Australia
3
Department of Mechanical and Mechatronics Engineering, Faculty of Engineering, Prince of Songkla University, Hat Yai 90110, Songkhla, Thailand
4
Mechanical Engineering Department, King Fahd University of Petroleum and Minerals (KFUPM), Dhahran 31261, Saudi Arabia
5
Interdisciplinary Research Center for Renewable Energy and Power Systems (IRC–REPS), King Fahd University of Petroleum and Minerals, Dhahran 31261, Saudi Arabia
*
Author to whom correspondence should be addressed.
Sustainability 2021, 13(24), 13718; https://doi.org/10.3390/su132413718
Submission received: 2 October 2021
/
Revised: 19 November 2021
/
Accepted: 25 November 2021
/
Published: 12 December 2021
(This article belongs to the Special Issue Applications of Artificial Intelligence Model of Heat and Mass Transfer)
Abstract
:Wind energy is one of the most promising renewable energy technologies worldwide; however, assessing potential sites for wind energy exploitation is a challenging task. This study presents a site suitability analysis to develop a small–scale wind farm in south–eastern Thailand. To this aim, the most recent available data from 2017 to 2019, recorded near the surface, at nine weather stations of the Thai Meteorological Department (TMD) were acquired. The analysis was conducted using standard wind–industry software WAsP. It was found that the mountain peaks and ridges are highly suitable for small–scale wind farm development. Nevertheless, the wind data analysis indicates that regions fall in low–to–moderate wind classes. The selected sites in south–eastern Thailand have mean wind speeds ranging from 5.1 m/s to 9.4 m/s. Moreover, annual energy production (AEP) of 102 MWh to 311 MWh could be generated using an Enercon E–18 wind turbine with a rated power of 80-kW at the hub height of 28.5 m. The Levelized Cost of Energy (LCOE) reveals that the development cost of a small–scale wind farm is lowest in the Songkhla and Yala provinces of Thailand, therefore these two locations from the investigated study region are financially most suitable. The findings could encourage researchers to further investigate low–speed wind energy mechanisms in tropical regions, and the demonstrated approach could be reused for other regions.
1. Introduction
Energy is one of the leading impacts on the advancement of any nation. The prosperity of a nation largely depends on its stability of energy use [1]. Global renewable energy exploitation has increased over time, due to the urgency to meet global climate commitments that discourage the use of fossil fuels as energy sources [2,3]. Recently, wind power has evolved as a dominant sustainable energy option to mitigate energy effects on anthropogenic pollutants in the atmosphere [4,5]. Wind energy is also replenishable at the human timescale and is a cost–effective energy option in the long run. Because of these advantages, wind energy is frequently discussed and deployed by various nations [6]. A glimpse at the energy statistics reveals that the globally installed wind–generation capacity reached 651 GW in 2019 [4], and even during the pandemic, significant growth was noted in the wind energy production capacity worldwide, whereby it is expected to reach 817 GW before the year 2021 ends [7].
Being a fast–emerging economy, Thailand primarily consumes fossil fuels for its energy. Worldwide, Thailand ranks 20th in energy intensity and 34th in emissions intensity (carbon intensity). Regarding electricity generation, natural gas–fired power plants produced about 57% of the total electricity supply in 2018, while coal and lignite–based power plants accounted for about 18% [8]. It is clear that conventional energy sources such as natural gas, hard coal, and lignite are still the dominant sources of energy in electricity generation.
In 2012, the total installed electricity generating capacity in Thailand was recorded as 32,600 MW [9,10] and it had increased to 45,298 MW in 2019 [11], with 75% being generated from natural gas, coal, and lignite. Thailand’s Ministry of Energy has forecast in the power development plan for 2018–2037 (PDP 2018: Revision 1) that the total installed electricity generating capacity will reach 77,211 MW at the end of 2037. The objective of the Ministry of Energy Thailand is to replace non–renewable energy sources by renewable energy by up to 37% by the end of 2037 under the power development plan (PDP) 2018–2037 [12]. Hence, this objective clearly describes the renewable energy roadmap in Thailand under PDP 2018–2037, to which all energy–related departments are determined [12,13,14,15].
Thailand is situated near the equator. It has relatively low to moderate wind speeds that average about 3 to 5 m/s. However, there are areas with appropriate topography, such as canyons, slopes, and mountain ranges, which have higher wind speeds and a utilizable annual mean wind speed of no less than 6.4 m/s [16]. The time patterns of the surface wind direction are characterized by the monsoon system. Thailand has two types of monsoons, namely the southwest and northeast monsoons that affect Thailand annually. The southwest monsoon generally runs between May and October bringing warm and moist air from the Indian Ocean, causing strong winds in mountain ridges in the northern lowlands and southern uplands of Thailand. The northeast monsoon runs from November to March, bringing cold and dry air from the South China Sea, which causes extreme winds in the Gulf of Thailand and coastal parts of the southern peninsular of Thailand. On average, the temperature in south–eastern Thailand is high. In 2018, the minimum monthly mean temperature recorded for January was 26.4 °C and the maximum mean temperature recorded for May was 28.5 °C in south–eastern Thailand [17]. Thus, this high temperature generally substantiates the need for the inspection of south–eastern Thailand for energy purposes.
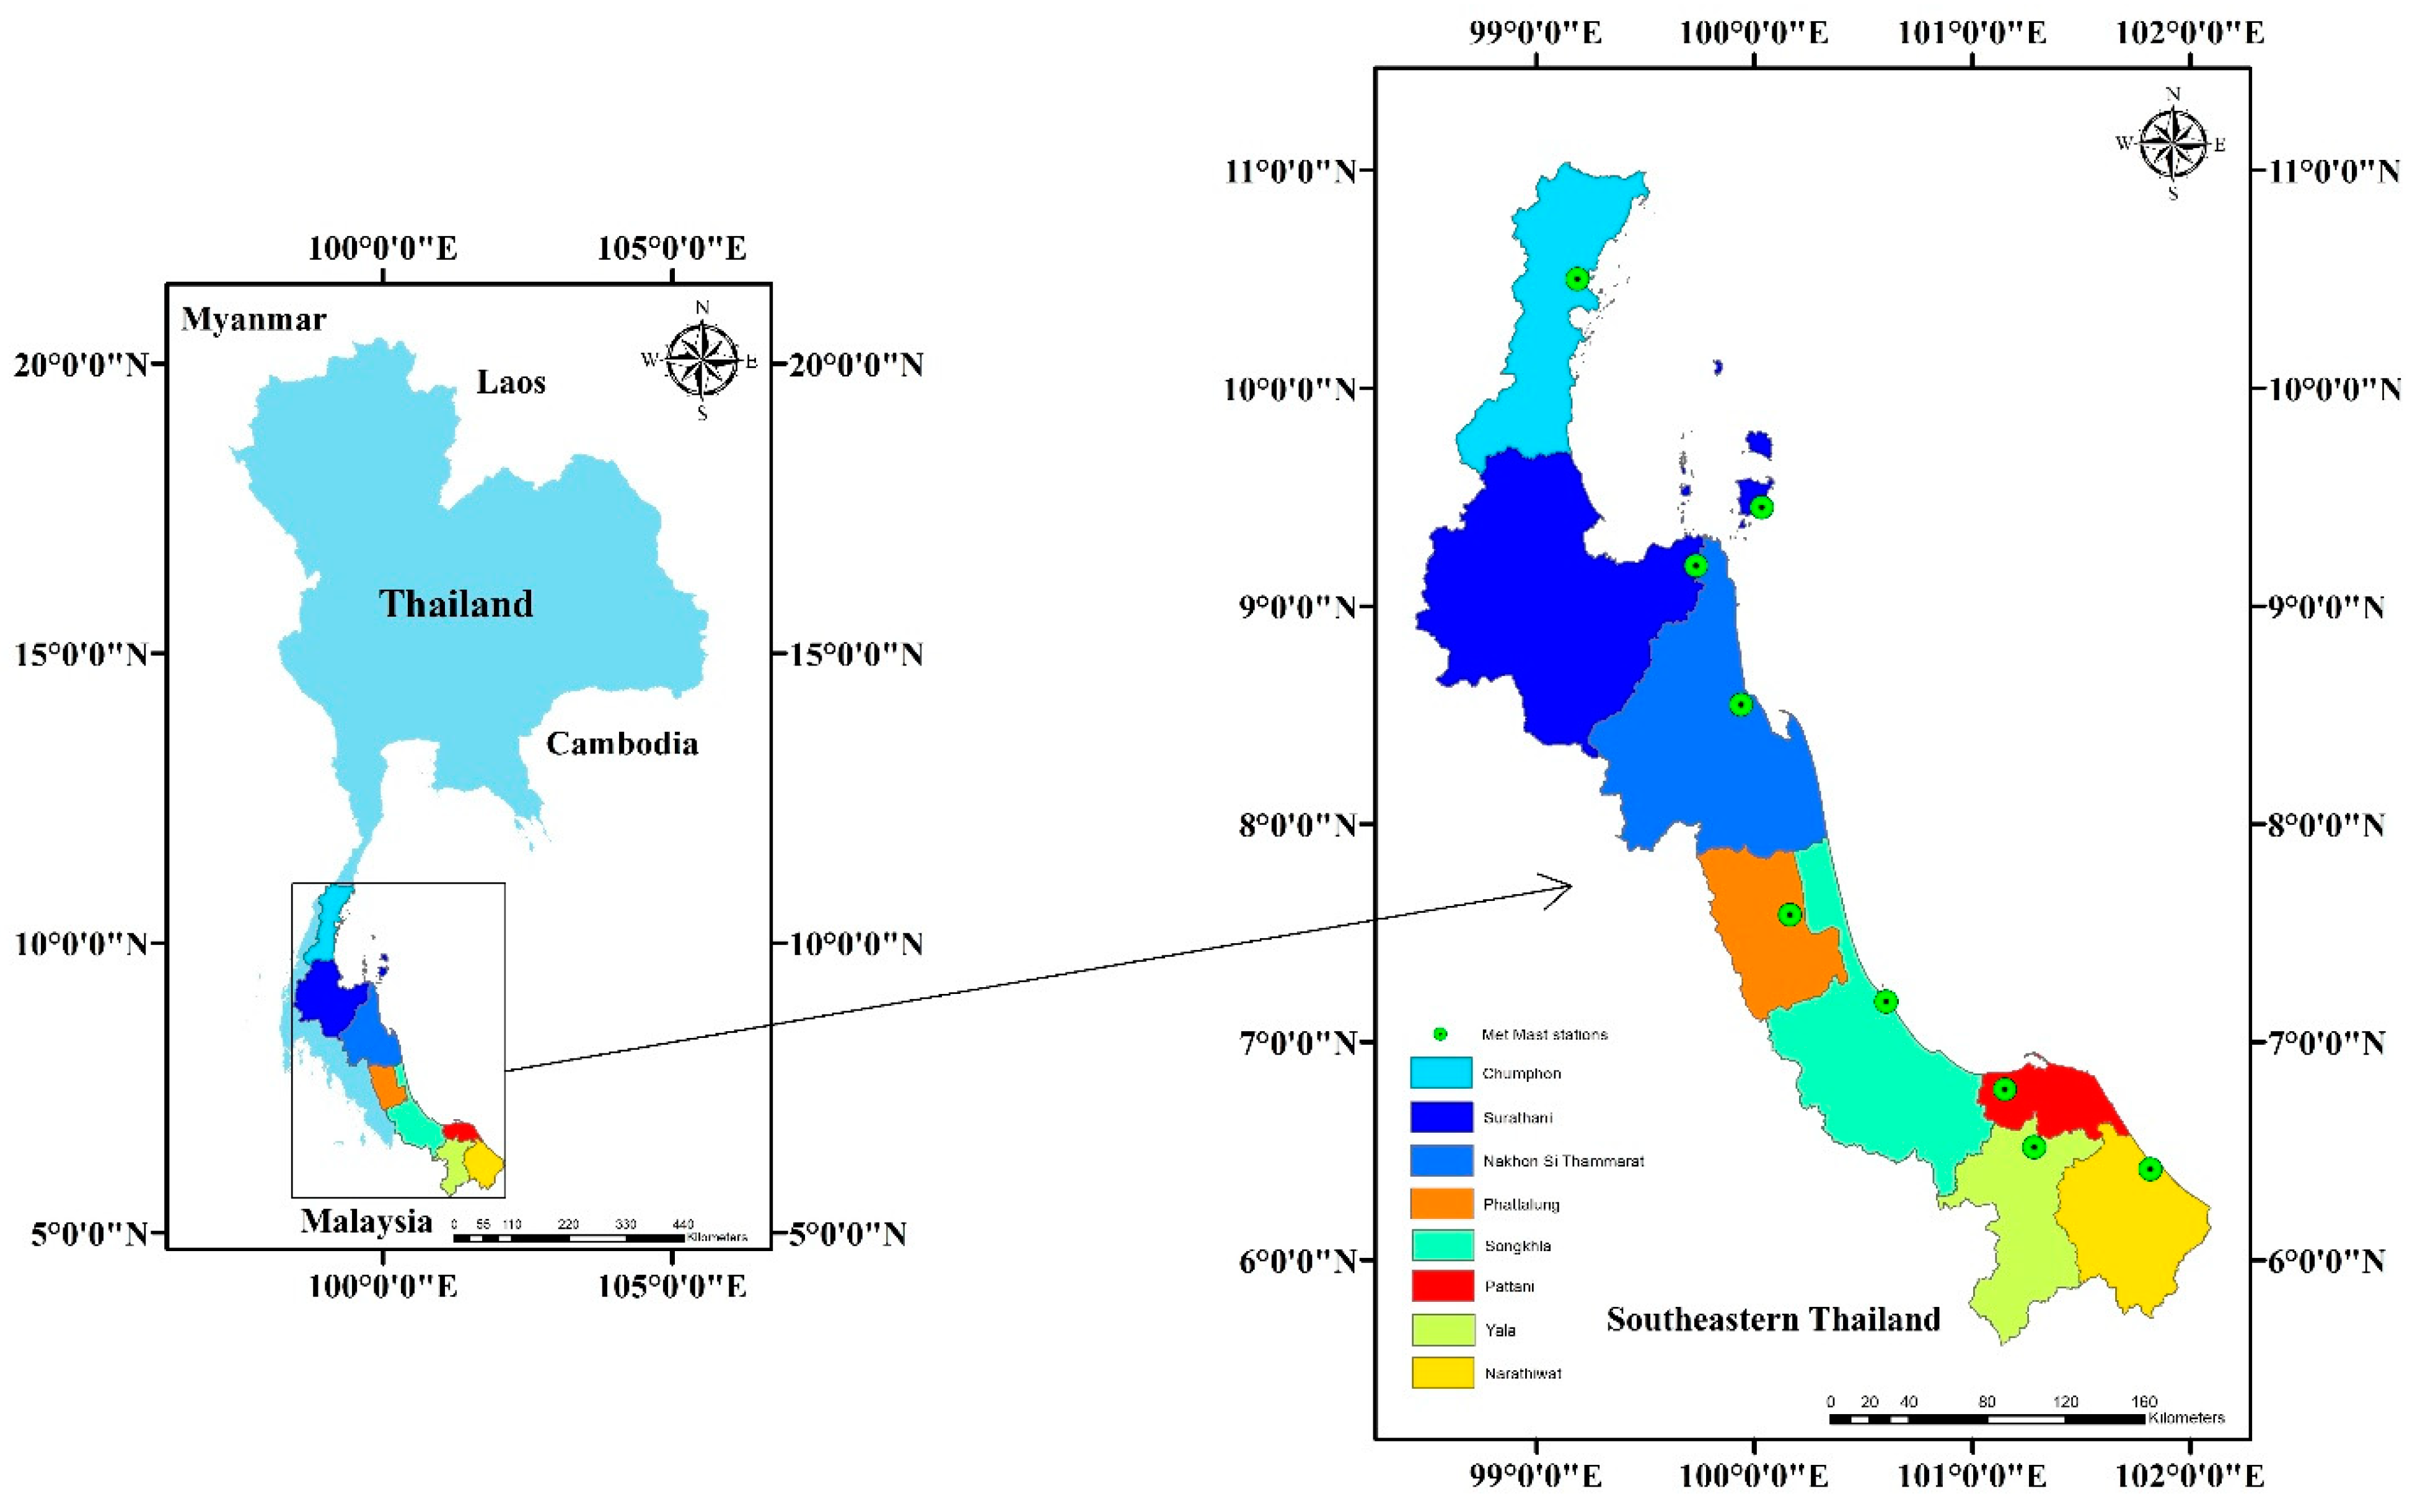
Southern parts of Thailand have shown an increasing trend in power demand by 5–6% yearly due to developments in service and tourism fields, as reported in 2018 by the Electricity Generating Authority of Thailand [18]. In particular, south–eastern Thailand is one of the most electricity–demanding regions in Thailand as a gateway to the Malaysian border in the south, and hence it receives thousands of tourists each year. South–eastern Thailand covers an area of about 50,599 km2 and has a population of more than 7.1 million people. Figure 1 displays the geographical locations of meteorological stations in the south–eastern region of Thailand.
Consequently, government organizations and wind power developers are continuously seeking the best locations for wind resource assessment. Though feasibility studies [9,10,19,20,21,22] have been conducted on wind resources for a few provinces in southern Thailand in the past, a detailed study scrutinizing wind resource assessments with a view to investigate potential areas for siting small–scale wind turbines is still lacking. Furthermore, most prior studies are somewhat obsolete due to growing industrialization and demographic changes that have affected land availability.
In the recent past, globally a significant number of scientific studies have been conducted extensively on wind energy. A short overview of some of the important investigations is briefly provided below for a better understanding of the accomplished work so far. Yang and Rojas [23] used Computational Fluid Dynamics (CFD) simulations in complex mountainous areas of north–eastern Iberian Peninsula, Spain, and showed reasonably high–speed and low–turbulence winds for turbines at the most suitable locations. Ashtine and Bello [24] conducted an evaluation of wind energy potential for small–scale wind turbines at hub heights of 10 m and 30 m in the regions of Ontario and Great Lakes in Canada. Ko and Jeong [25] used statistical models such as Weibull and Rayleigh distributions to determine the annual energy density, annual energy production (AEP), and capacity factor in Weno Island, Chuuk State, and Micronesia. Flay and King [26] applied CFD, Wind Atlas Analysis and Application Program (WAsP) models, and wind–tunnel testing in New Zealand’s installed infrastructure to improve wind speed forecasting methods for the wind pattern over complex terrain. Rogers and Ashtine [27] determined the maximum potential installed wind capacity in the Caribbean Island of Barbados. Bruck and Sandborn [28] established an innovative cost model to estimate the Levelized Cost of Energy (LCOE) obtained by a wind energy source under a Power Purchase Agreement. Saeed and Ahmed [1] used an artificial intelligence–based optimization technique along with a statistical approach to determine the Weibull parameters and performed technical and economic analyses, such as LCOE, for wind energy at eighteen locations in Pakistan.
Wind resource assessment has significant importance in the exploitation and consumption of wind energy. A precise evaluation of wind resources is crucial to the successful development of wind farms. Therefore, to improve the wind potential use, it is significant for a given site to ensure the effectiveness of the assessment.
To simplify mathematical models according to diverse assumptions, commercial companies have developed various software packages. In particular, WAsP designed by the Danish Riso National Laboratory has emerged as a convenient instrument for wind resource assessment [29]. WAsP is a computer–based industrial standard tool used all over the world for wind energy evaluation, site selection, and energy yield calculations for wind energy facilities in various terrains. The WAsP program has typically shown errors of less than 10% [30,31] and provides satisfactory results even with wind data from a single meteorological station [30]. Various researchers have promoted the WAsP tool for wind resource assessment, including [32] who used WAsP software to study climatology along with wind resource assessment and computed the regional wind atlas for South–Central Kansas, United States. Hernández Galvez and Saldaña Flores [33] applied Weather Research and Forecasting and WAsP for mesoscale and microscale wind resource modeling, respectively. Furthermore, in LCOE, the capacity factor and cost of wind turbines were calculated in the State of Tabasco, Mexico. Ramadan [34] investigated the economic viability of wind farms applying WAsP and WindPRO tools in the Egyptian Sinai Peninsula. Liu and Gao [30] used a long–term tower measurement approach for a meteorological tower with a height of 325 m and 15 levels in Beijing, China, using the Weibull function and WAsP software to calculate the potential of wind energy. Sharma and Ahmed [35] inspected wind resources of the isolated island of Kadavu and the urban Suva peninsula in the Fiji Island at a height of 34 m using WAsP. Verma [36] examined the performance and reliability of an old wind farm located at Madhya Pradesh, India, for repowering, along with an environmental impact and techno–economic analysis. Himri and Merzouk [37] used RETScreen and WAsP tools in the South–West region of Algeria to investigate wind farm financial feasibility and wind resource assessment. Thus, it has been proven that WAsP is a powerful tool for wind resource assessment. However, studies on wind resource assessment using the WAsP model in tropical areas have been limited. The study described here will provide a scientific approach for wind resource assessment in tropical nations like Thailand with a methodology compliant to international standards.
Figure 1.
Study area and distribution of meteorological stations in south–eastern Thailand (Source: Kamdar et al. [38]).
Figure 1.
Study area and distribution of meteorological stations in south–eastern Thailand (Source: Kamdar et al. [38]).

According to the authors’ knowledge, there is a gap in the literature in exploring wind resource assessments for siting small–scale wind turbines using the WAsP tool in the study region, i.e., in south–eastern Thailand. Therefore, this study deployed the WAsP tool to site small–scale wind farms through a thorough investigation of the regional wind resources. The WAsP simulation computes the mean wind speed and the mean power density for selected sites of south–eastern Thailand. The power analysis and capacity factor of the sites were calculated for the Enercon E–18 wind turbine with a rated of 80 kW. This will allow the regional energy practitioners to determine their choices to tackle the rising power demands, increasing by 5–6% annually, through renewable wind power. Moreover, this study will also contribute to the Alternative Energy Development Plan for Thailand whose objective is to substitute fossil fuels by up to 37% by 2037 under the power development plan 2018–2037.
2. Material and Methods
2.1. Overview of Methodology
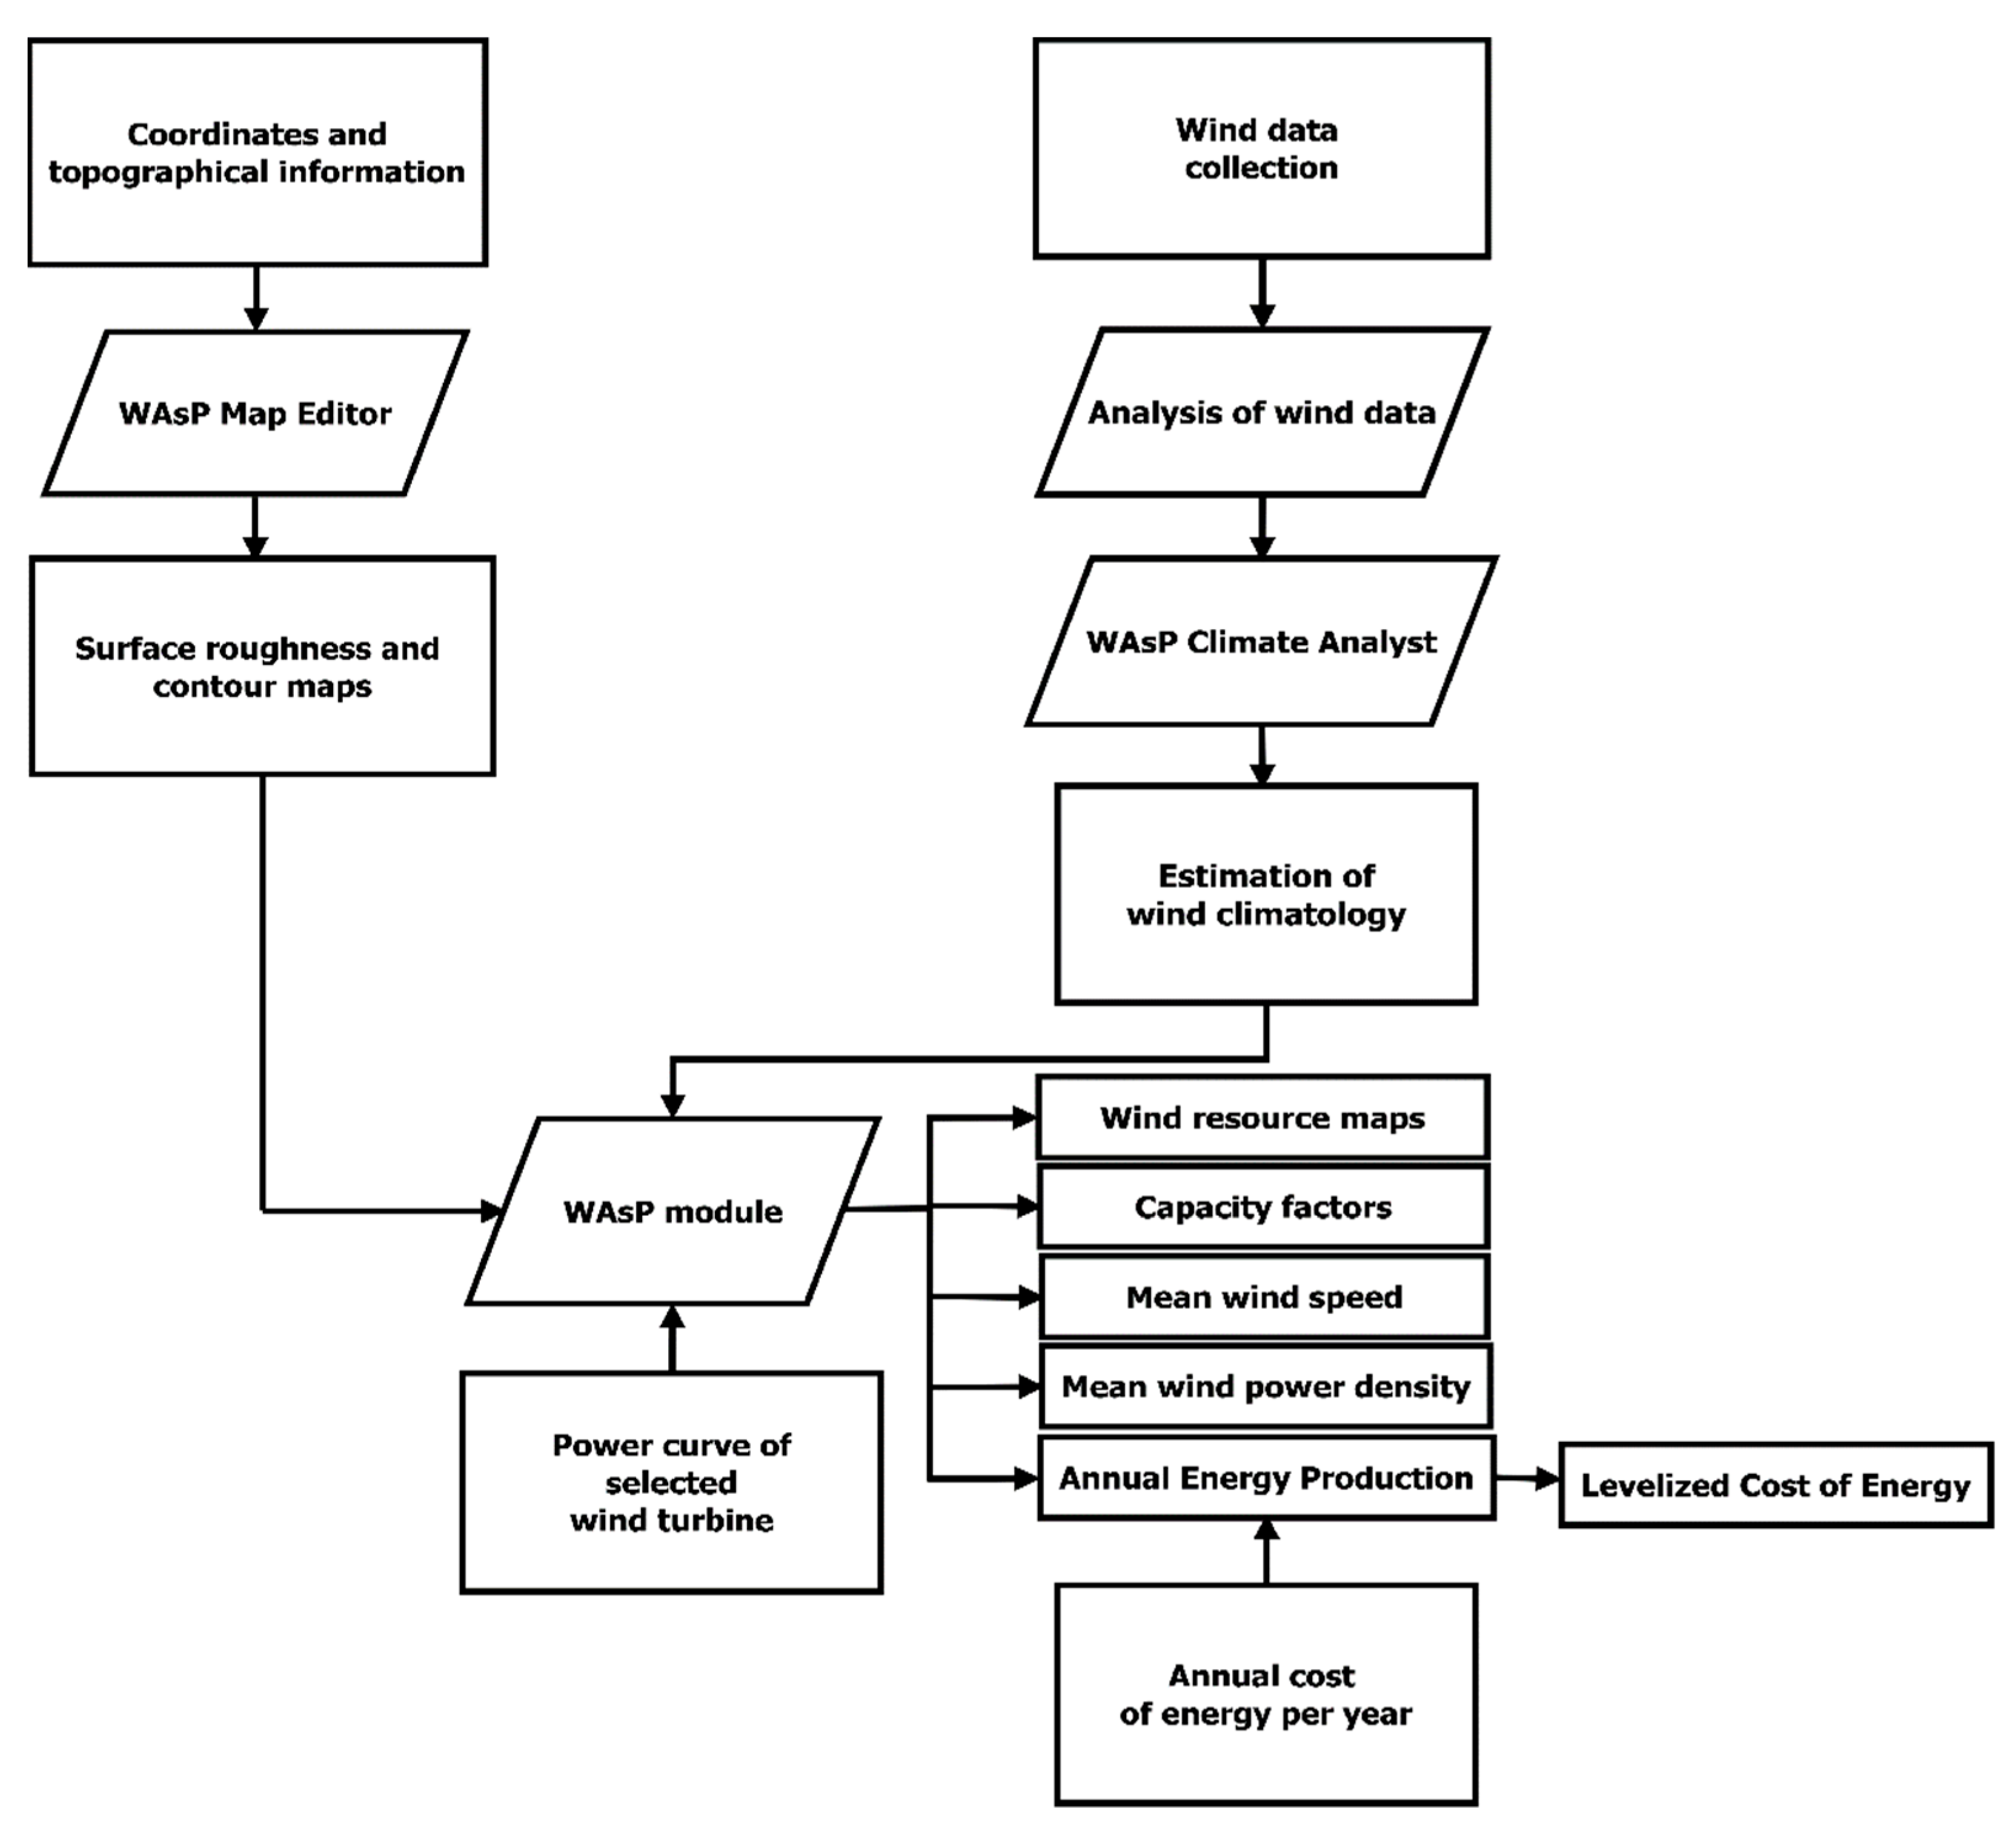
The flow diagram in Figure 2 shows the proposed scheme for siting small–scale wind turbines. The first step, as expected, is the analysis of raw wind data obtained from TMD. In the second step, the WAsP Climate Analyst tool is used to generate an estimate of wind climatology for all nine stations. It uses the 10-min average wind speed recorded at 10 m above the ground level (AGL). The WAsP Climate Analyst estimates wind climatology in the form of a wind rose and a Weibull distribution function. In the third step, the coordinates and topographic information are entered into the WAsP Map Editor tool to create the surface roughness and contour maps for the nine stations. The fourth step mainly involves the use of the WAsP module in terms of mean wind speed, power density, and AEP using the Enercon E–18 wind turbine to conduct a power analysis for the selected sites. The fifth and final step is the estimation of the levelized cost of energy.
2.2. Meteorological Mast and Wind Data Acquisition
The measurement towers in the Southern Meteorological Center (east coast) contain meteorological instruments such as anemometers, wind vanes, barometers, thermometers, rain gauges, and hygrometers. Along with these, the observation items comprise the 10–min average wind speed and wind direction, temperature, rainfall, atmospheric pressure, and relative humidity, which are mainly considered over an international standard period for wind measurement [39]. A description of the various measuring tools is provided in Table 1.
At a minimum, one year of observation data is essential to review the development possibility and to measure the potential wind energy reserve amount [25]. To avoid seasonal bias, this study observed the wind data of nine weather stations located in south–eastern Thailand, at a standard height of 10 m AGL, over a period of 3 years. The geographical coordinates and measurement periods can be seen in Table 2.
2.3. The Weibull Distribution
Wind speed is the basic factor that must be measured while selecting and designing the wind farm. Its Weibull probability distribution function (PDF) significantly influences the wind turbine performance [34].
The two–parameter Weibull probability distribution is frequently used in calculations to describe the wind speed histogram. It is also utilized in WAsP to study the wind characteristics in every direction as characterized by sectors [32]. The probability distribution function PDF of Weibull distribution is defined by Equation (1) [39,42]:
Here, represents the Weibull probability density function of observing wind speed (m/s), defines the Weibull scale parameter in m/s while indicates the dimensionless Weibull shape parameter. The Weibull shape parameter has values between 1 and 3 and describes the behavior of wind in accordance with its speed, where small values of shows variations in wind variables, while large values of indicate a rather constant wind speed [32,39].
2.4. Wind Atlas Analysis and Application Program
WAsP is a well–established industrial standard as a computer–based program and has been created by the Department of Wind Energy at the Danish Technical University in 1987 [44]. It is a widely used tool for projects related to wind energy and wind engineering [26] in wind resource evaluation, energy yield calculations, and site selection of a wind energy facility.
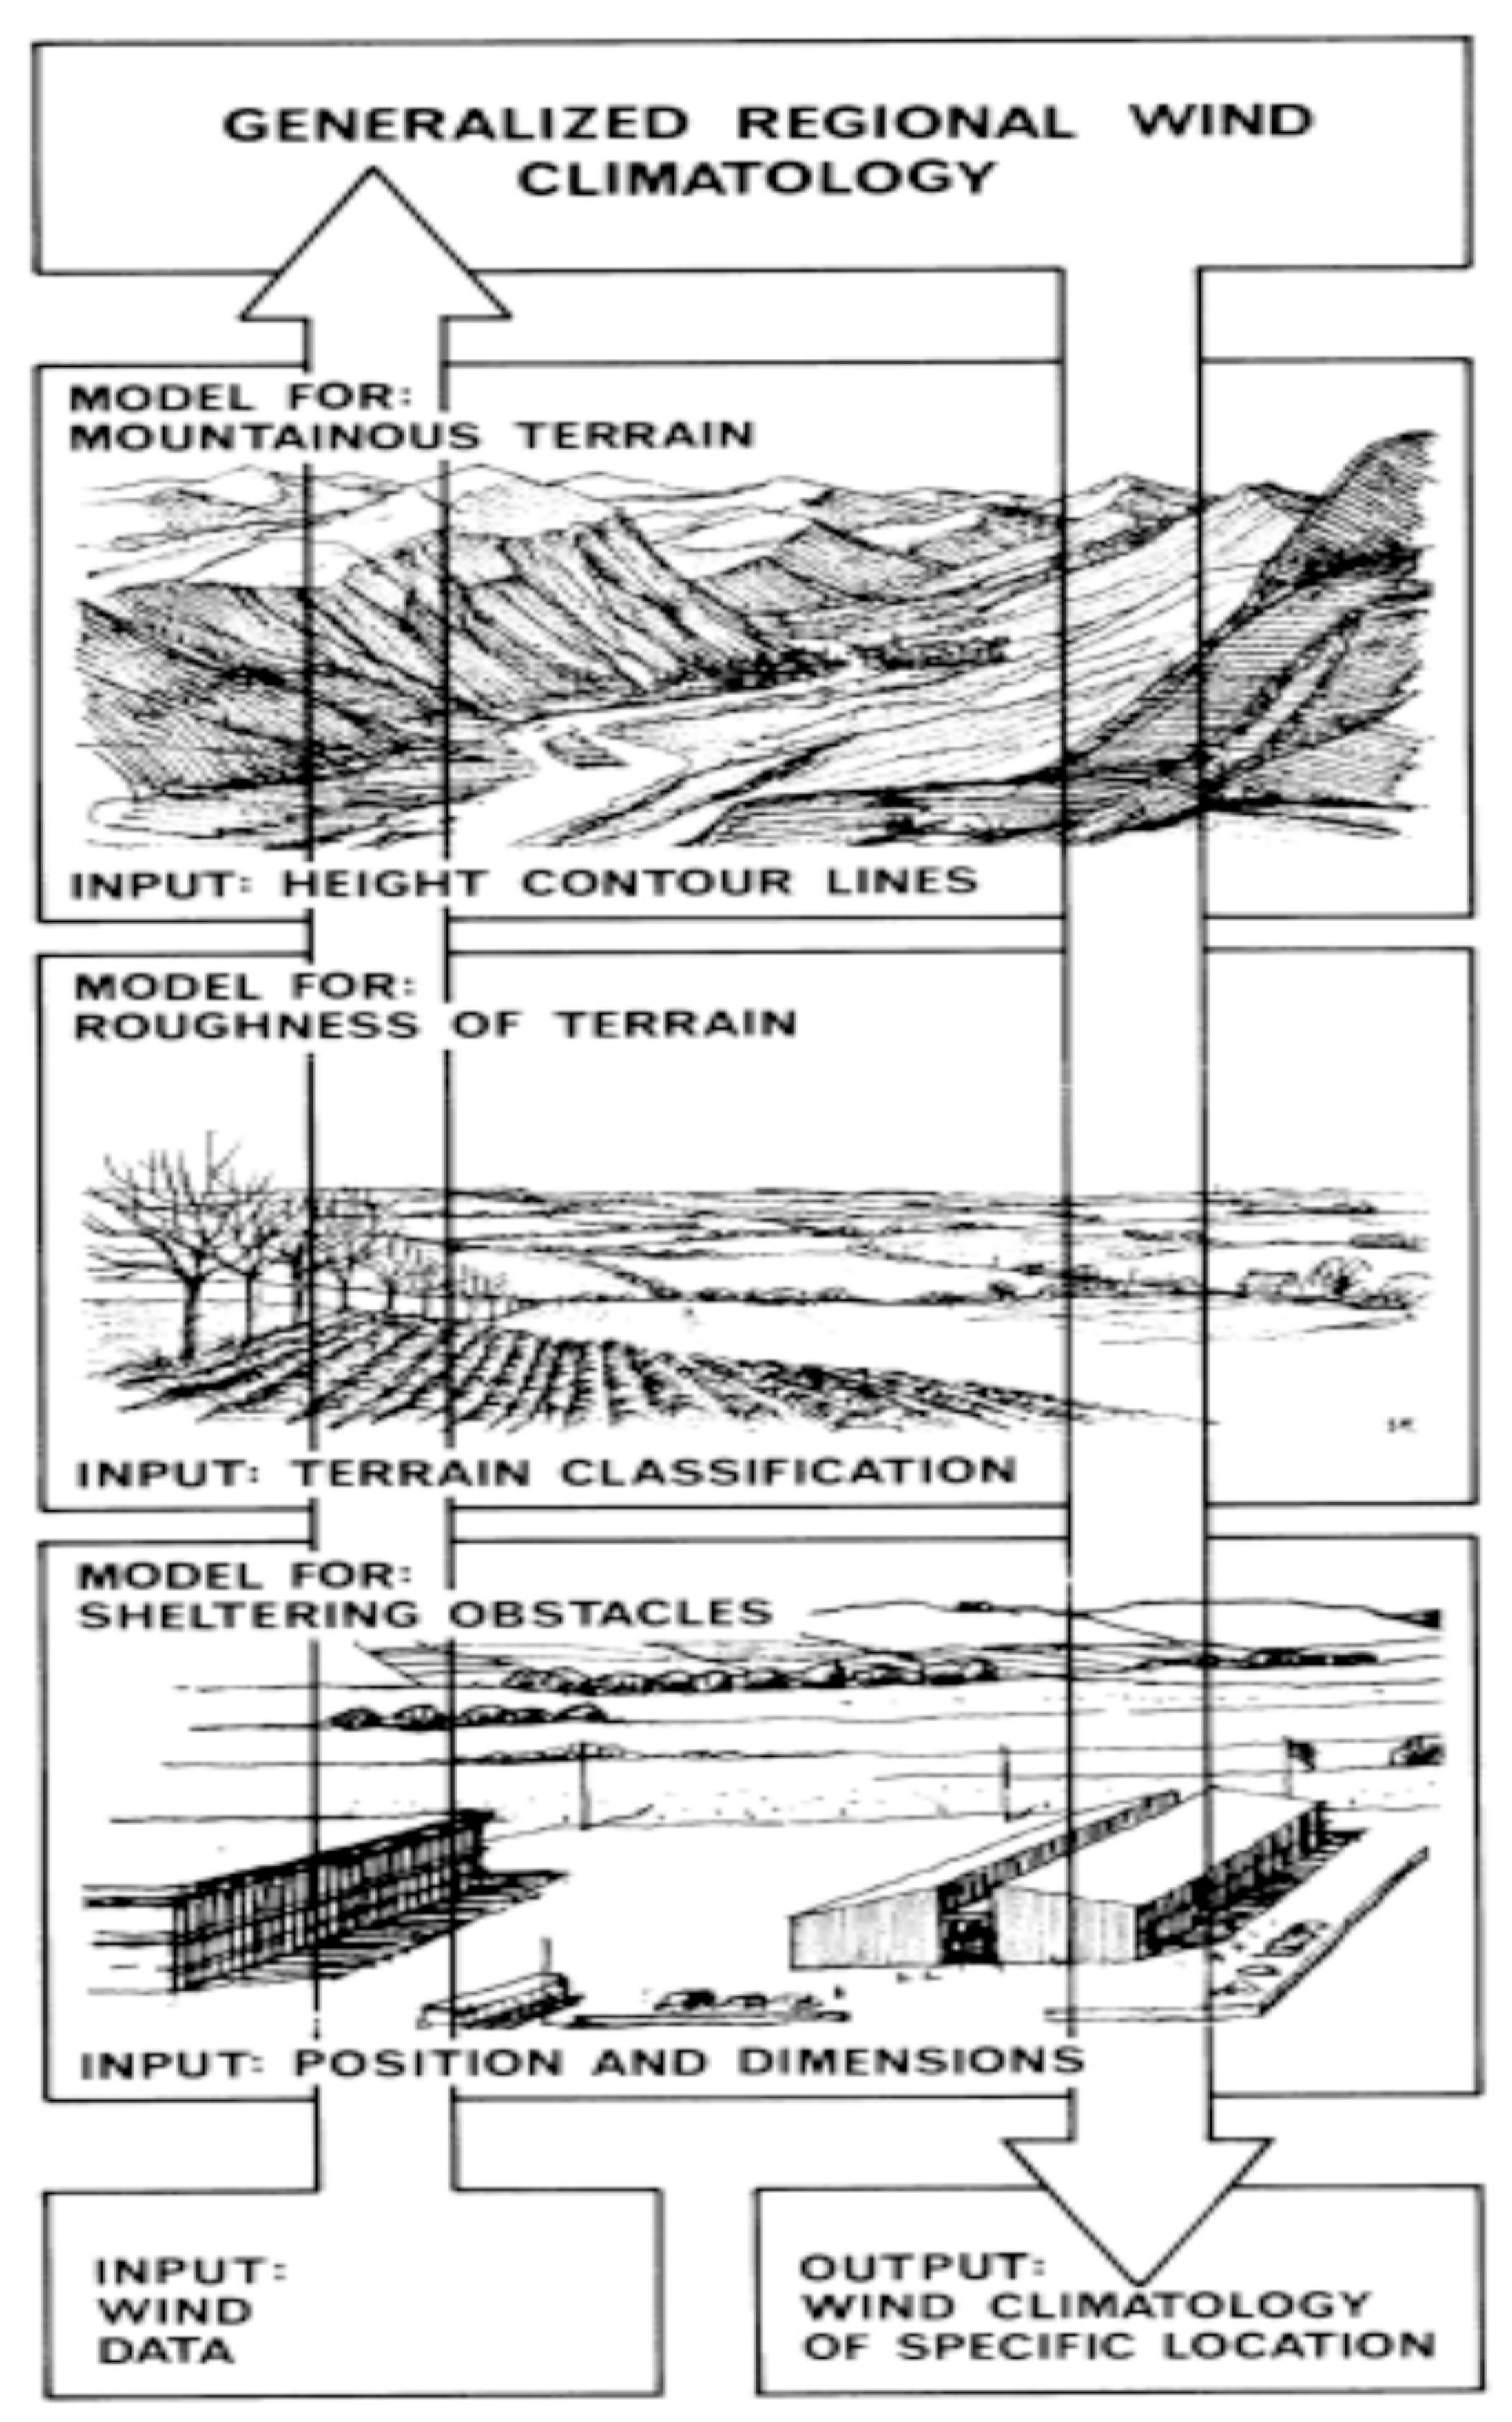
WAsP uses a linear model composed of a comprehensive collection of individual modules according to the physical characteristics of flows in the planetary boundary layer to predict the vertical and horizontal extrapolation of wind [45]. The WAsP flow model requires the following inputs: (1) Terrain height, (2) surface roughness, and (3) obstacle effects, as can be seen in Figure 3, which is also known as the wind atlas methodology. The WAsP model can calculate the energy production of a single turbine site or of a wind farm, and considers wake losses, layout, and various other factors. The wind atlas provides a hypothetical wind climate for a featureless and preferably planar topography with an even land cover in case the entire computational domain is under the same weather regime [32]. Using wind measurements in actual terrain to study the wind atlas of the region, the WAsP flow model is applied in order to eliminate the regional terrain effects as expressed in Equation (3):
Here, represents the general regional wind climate, defines the recorded wind at the measuring mast, while , , and indicate the properties of orography, roughness, and obstacles at position A, respectively. The orographic effects on the flow are calculated using the spectral BZ (Bessel Expansion on a Zooming Grid) model in WAsP, which is essentially based on the Jackson–Hunt theory. Thus, the WAsP model is primarily in the family of the Jackson–Hunt theory [46]. The internal boundary layer height () created under the influence of variations in surface roughness from to in the windward direction is calculated through the roughness model in WAsP by Equation (4):
where shows distance to the surface roughness change line and is equal to max (). This study used the newest version of WAsP software, namely WAsP 12 (Version 12.06.0024), WAsP Climate Analyst (Version 3.01.0049), and WAsP Map Editor (Version 12.3.1.54).
Figure 3.
The wind atlas methodology with inputs and outputs. Regional wind climatology is studied to predict the wind climate and resources at specific locations using the wind data from a meteorological model [47].
Figure 3.
The wind atlas methodology with inputs and outputs. Regional wind climatology is studied to predict the wind climate and resources at specific locations using the wind data from a meteorological model [47].

2.5. Surface Elevation and Roughness Maps
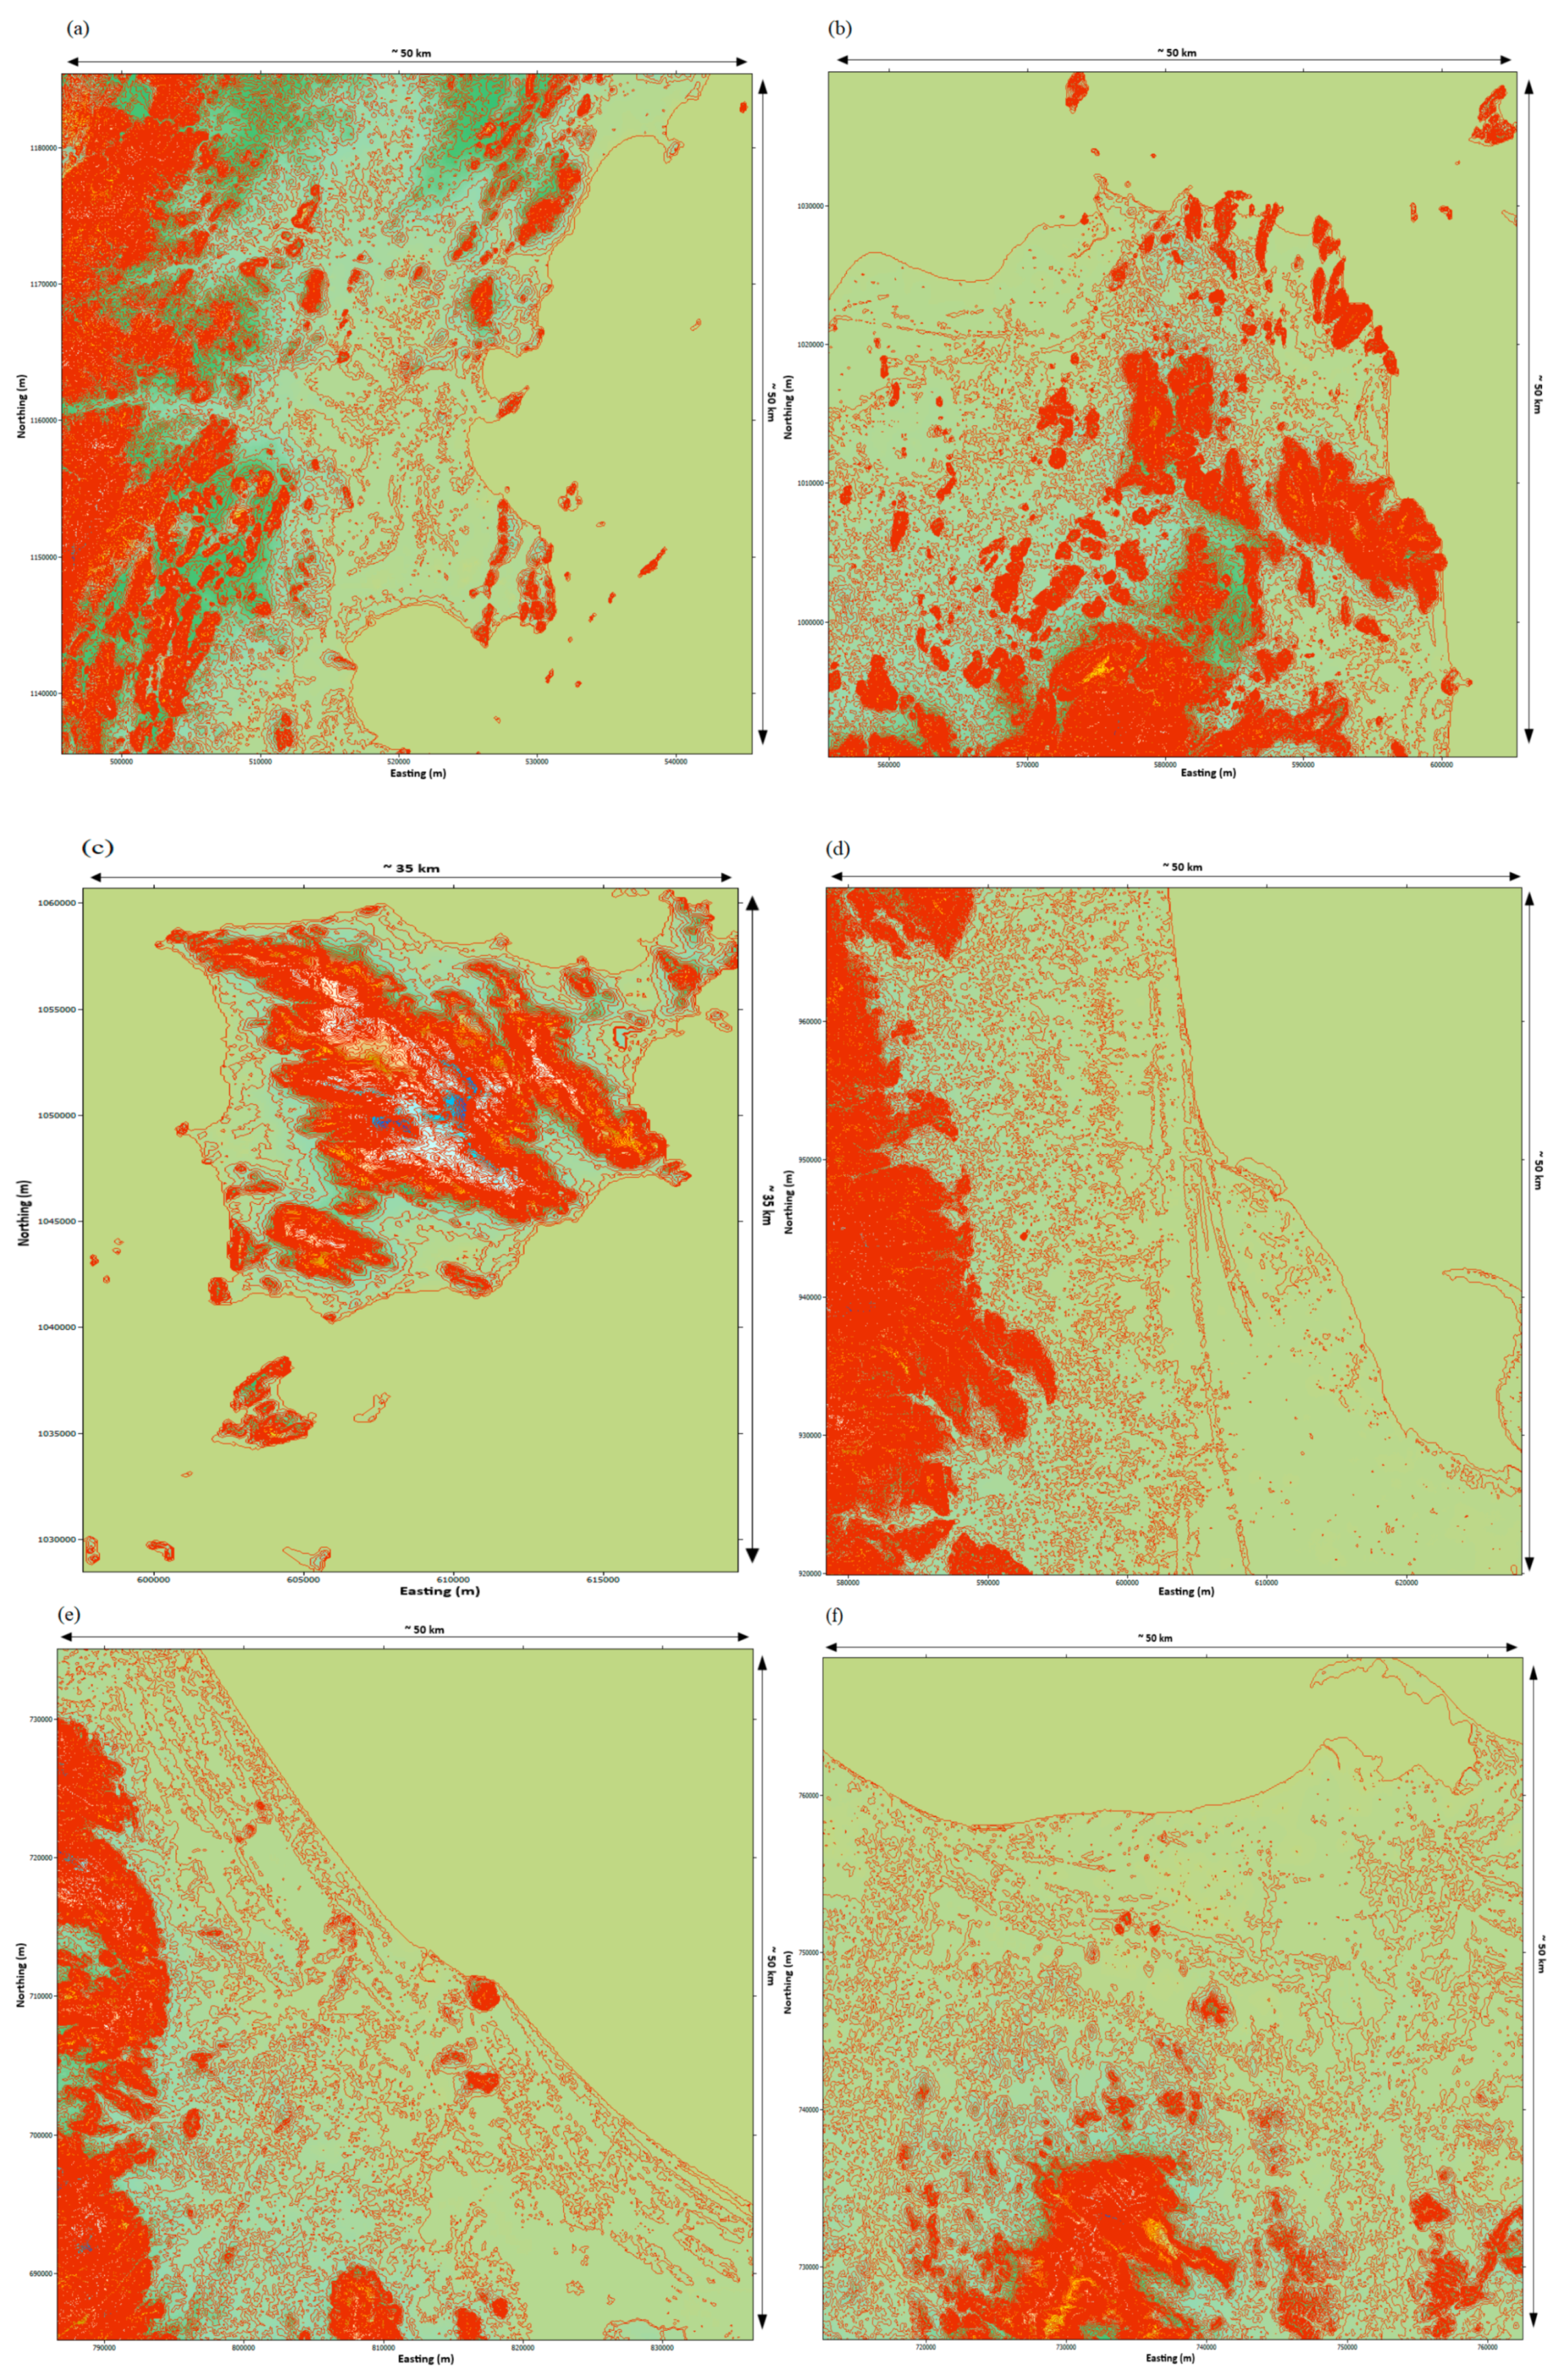
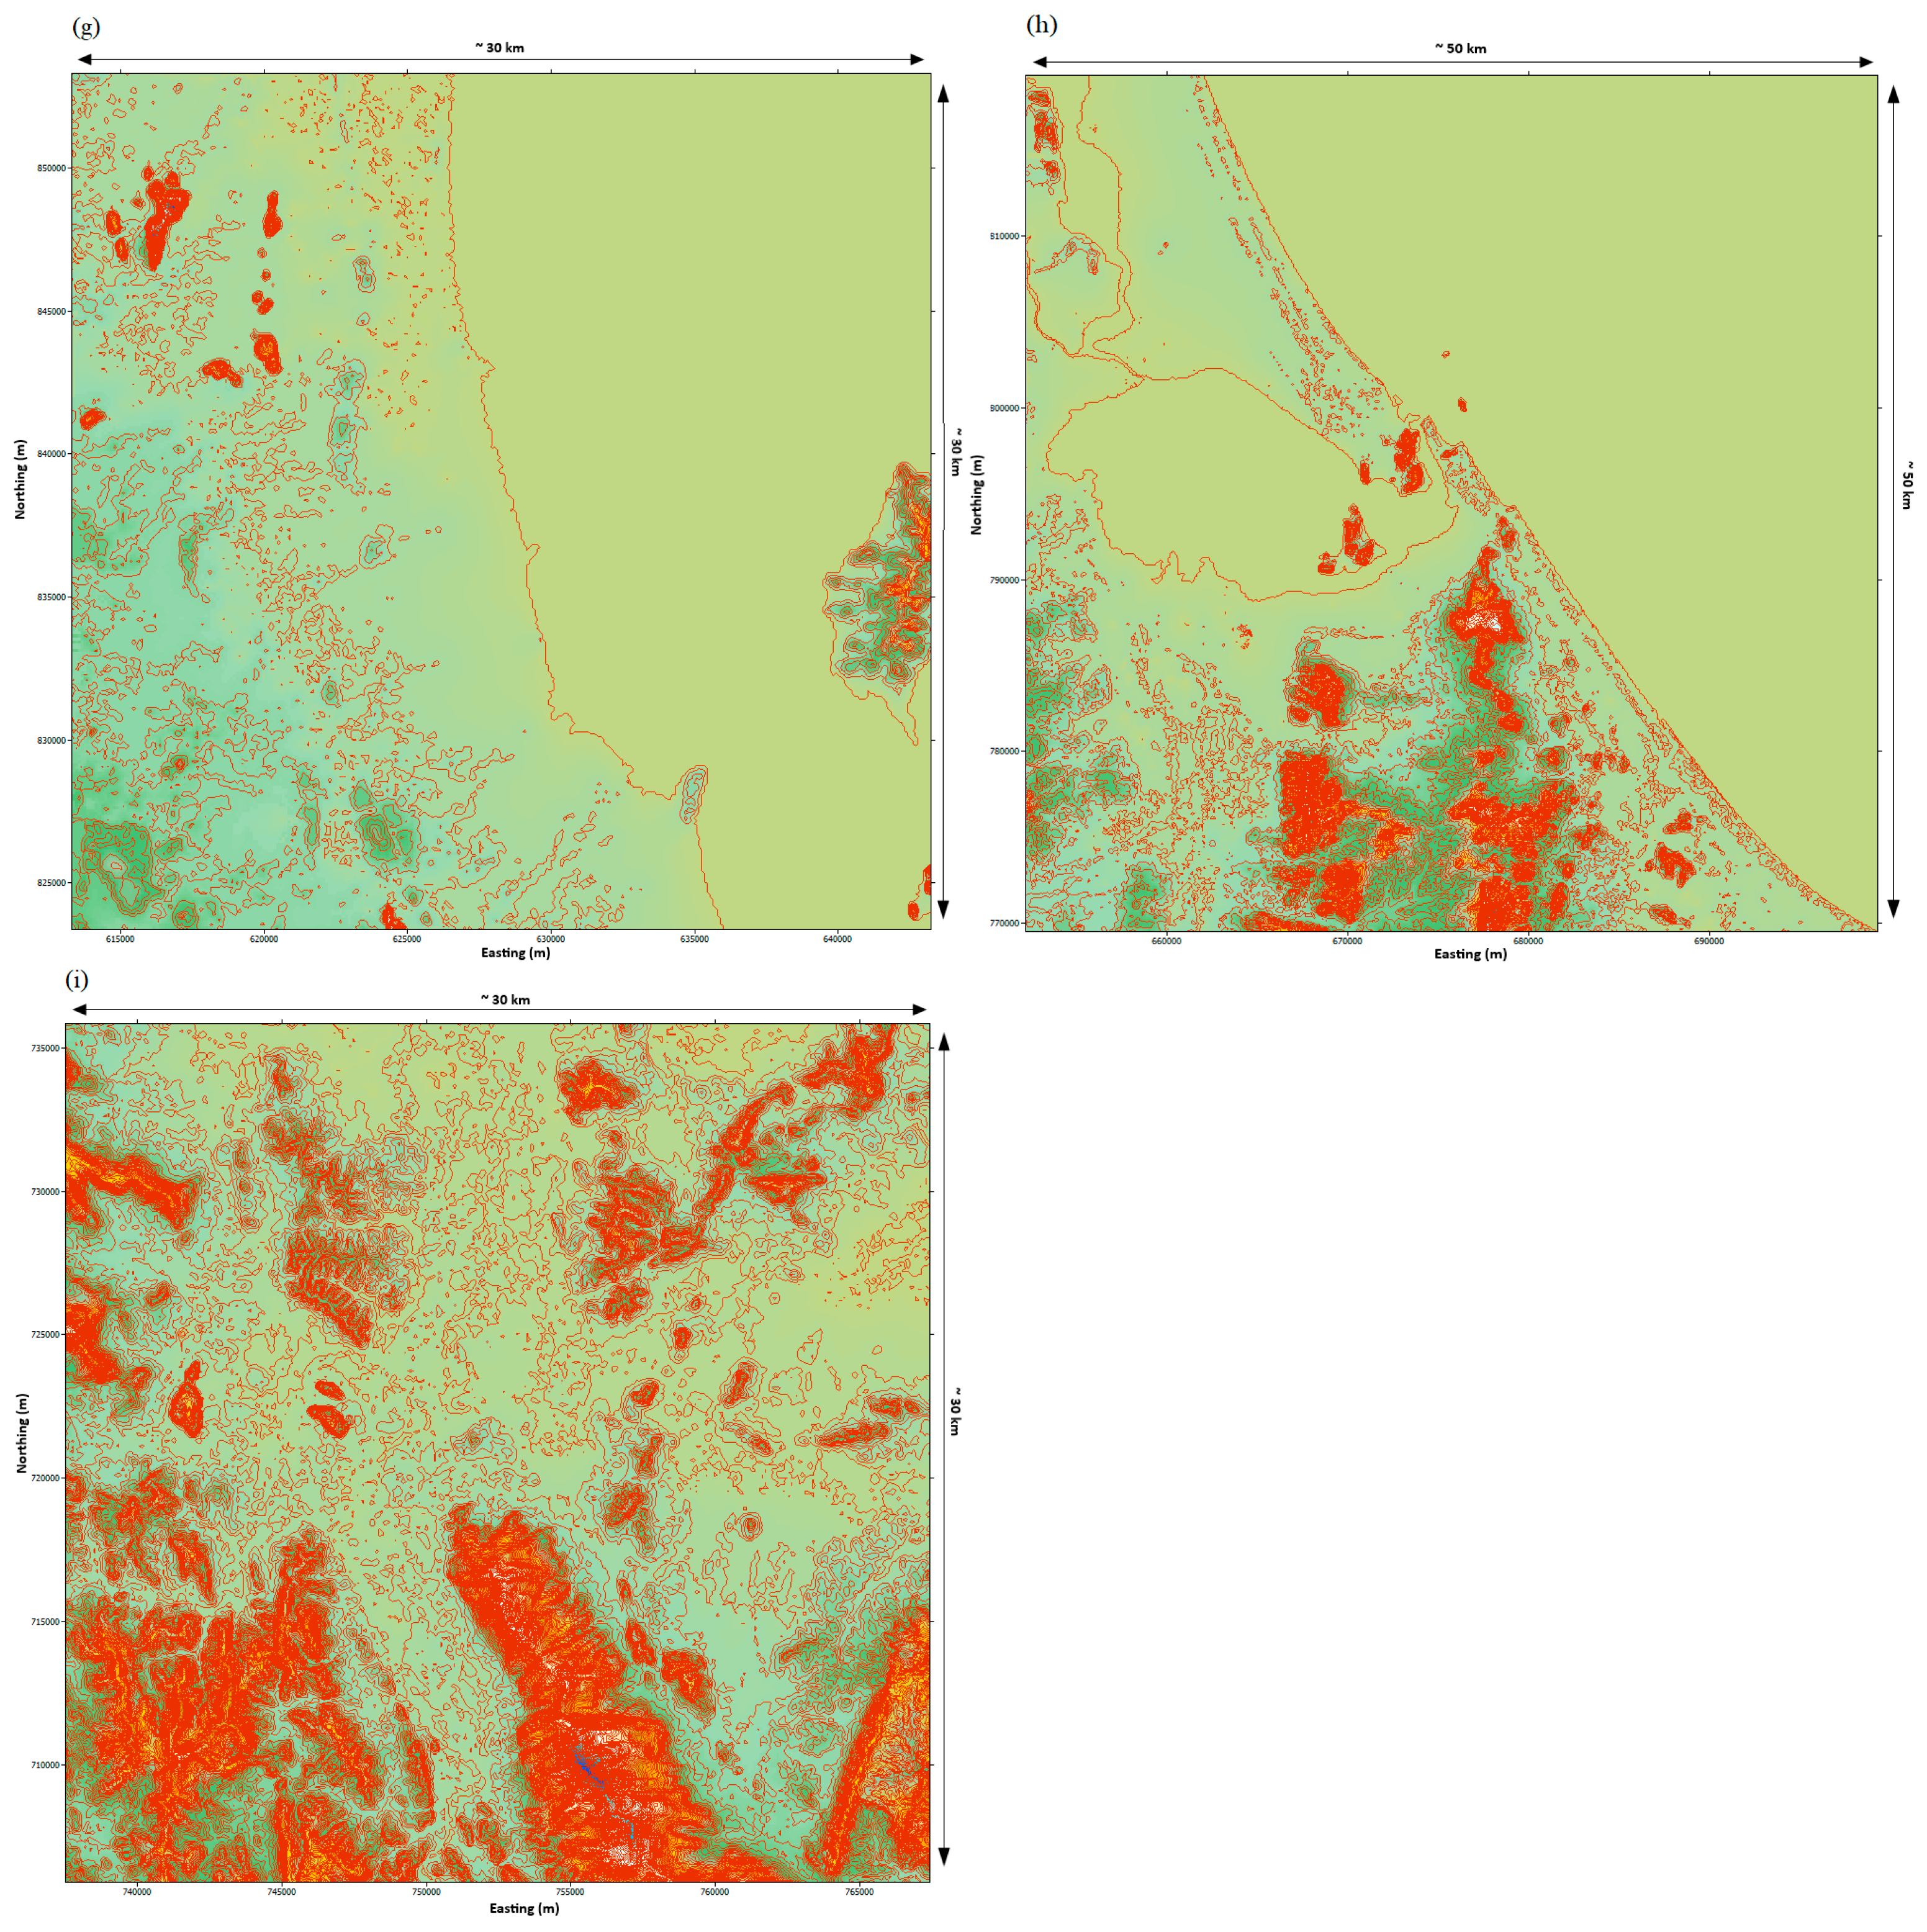
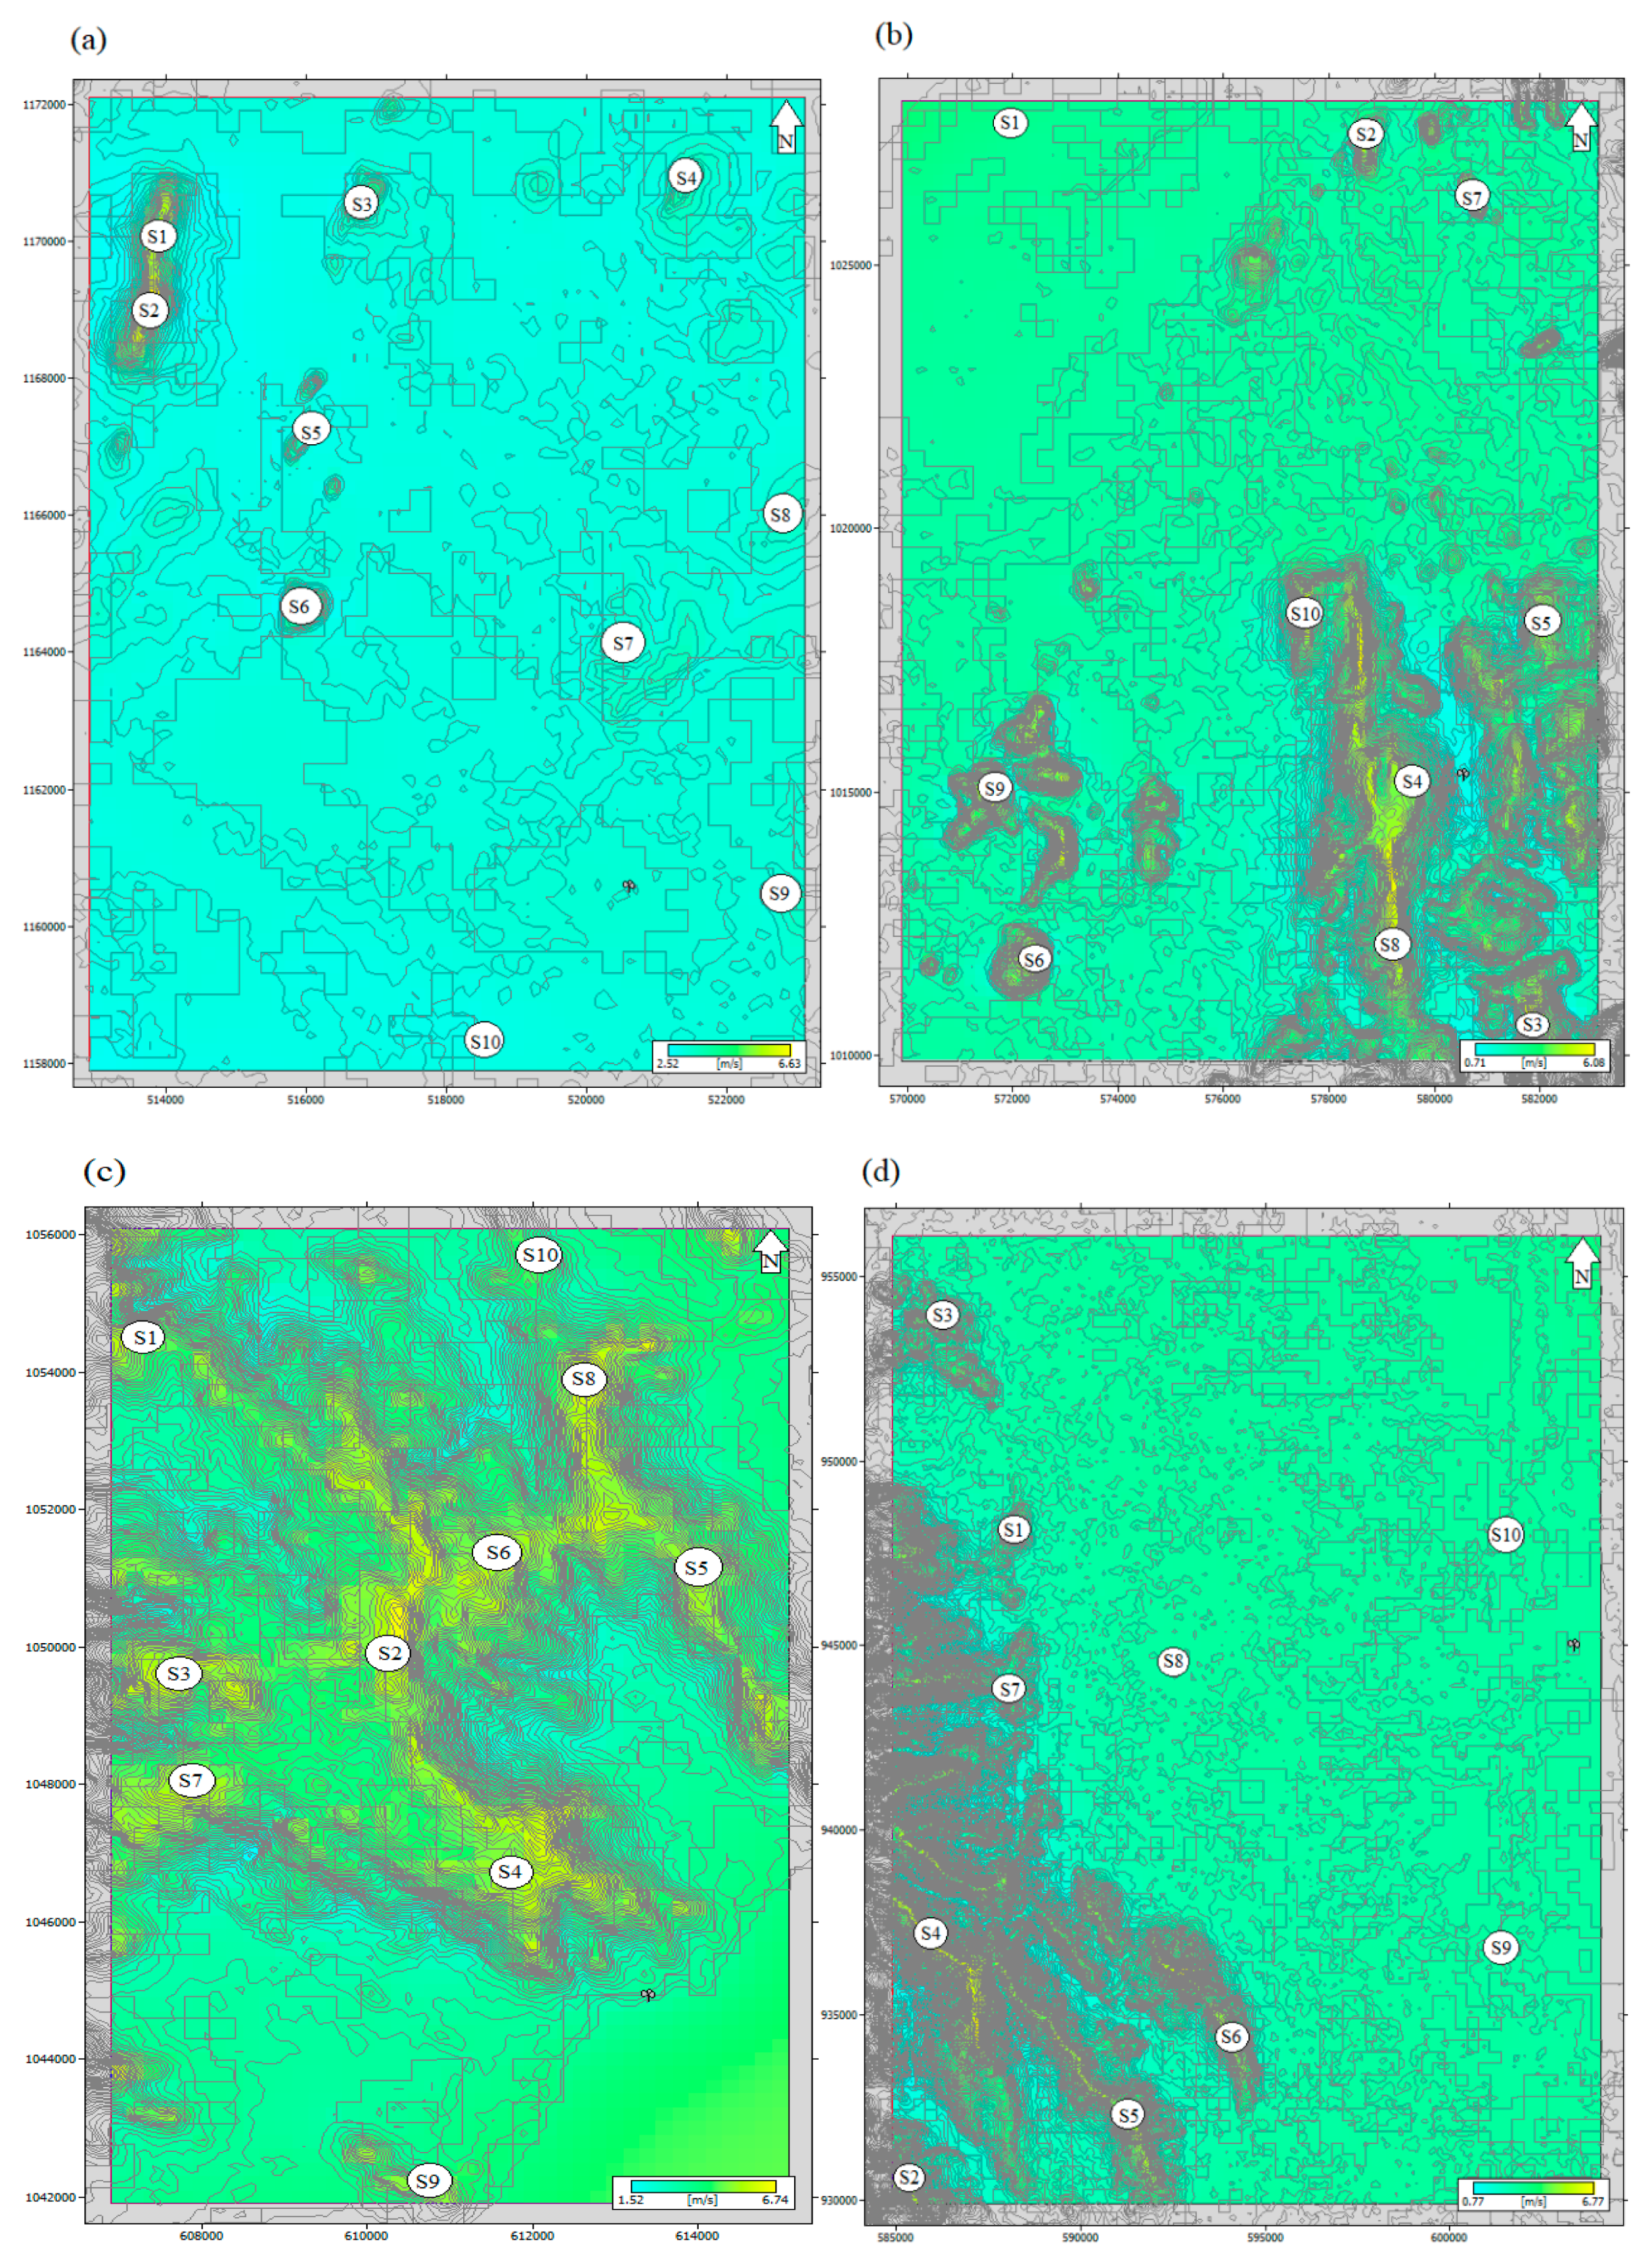
The elevation and roughness maps of south–eastern Thailand are important inputs in the WAsP tool. Therefore, the WAsP Map Editor tool in the WAsP program was used to prepare elevation and roughness maps. The Universal Transverse Mercator coordinate system, Zone 47, along with the datum WGS–1984, was used for the mapping. The maps are a Digital Elevation Model (DEM) developed under the Global Wind Atlas (GWA) Warehouse map server, which uses the Shuttle Radar Topography Mission (SRTM) data and the Viewfinder for regions outside SRTM coverage. The elevation maps of the study area are presented in Figure 4, which has a horizontal resolution of 3 arc–seconds (approximately 90 m).
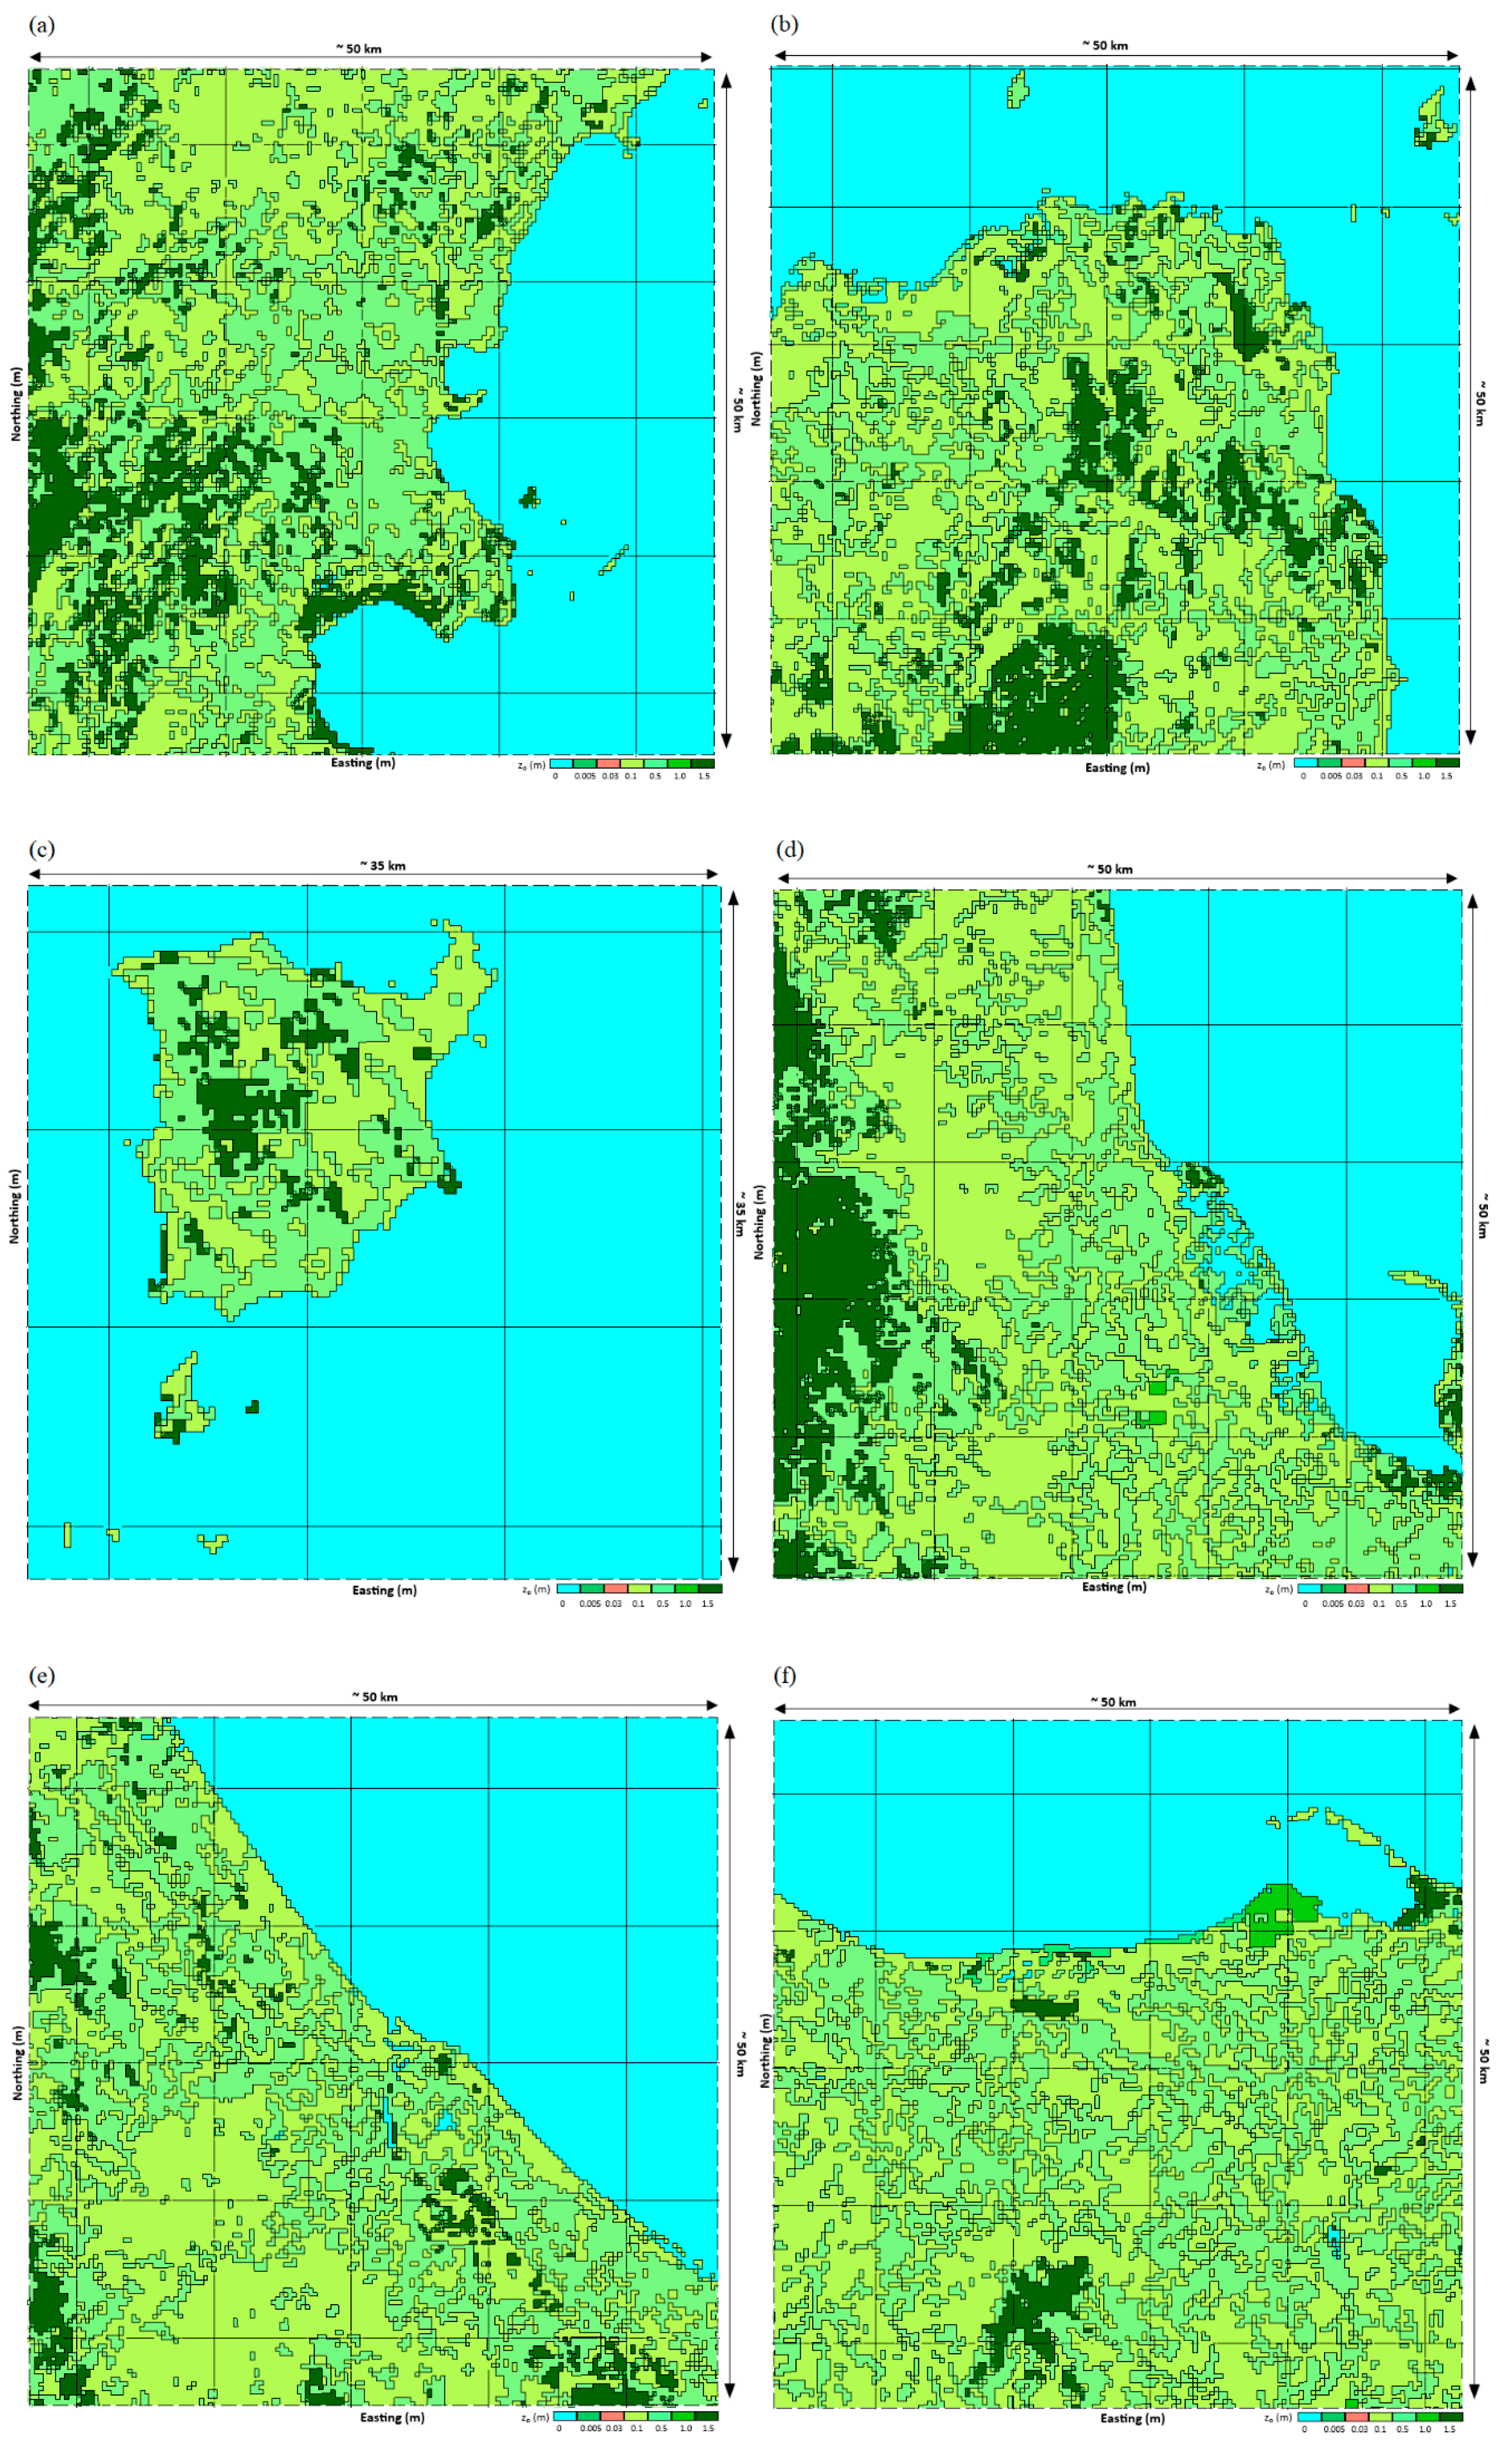
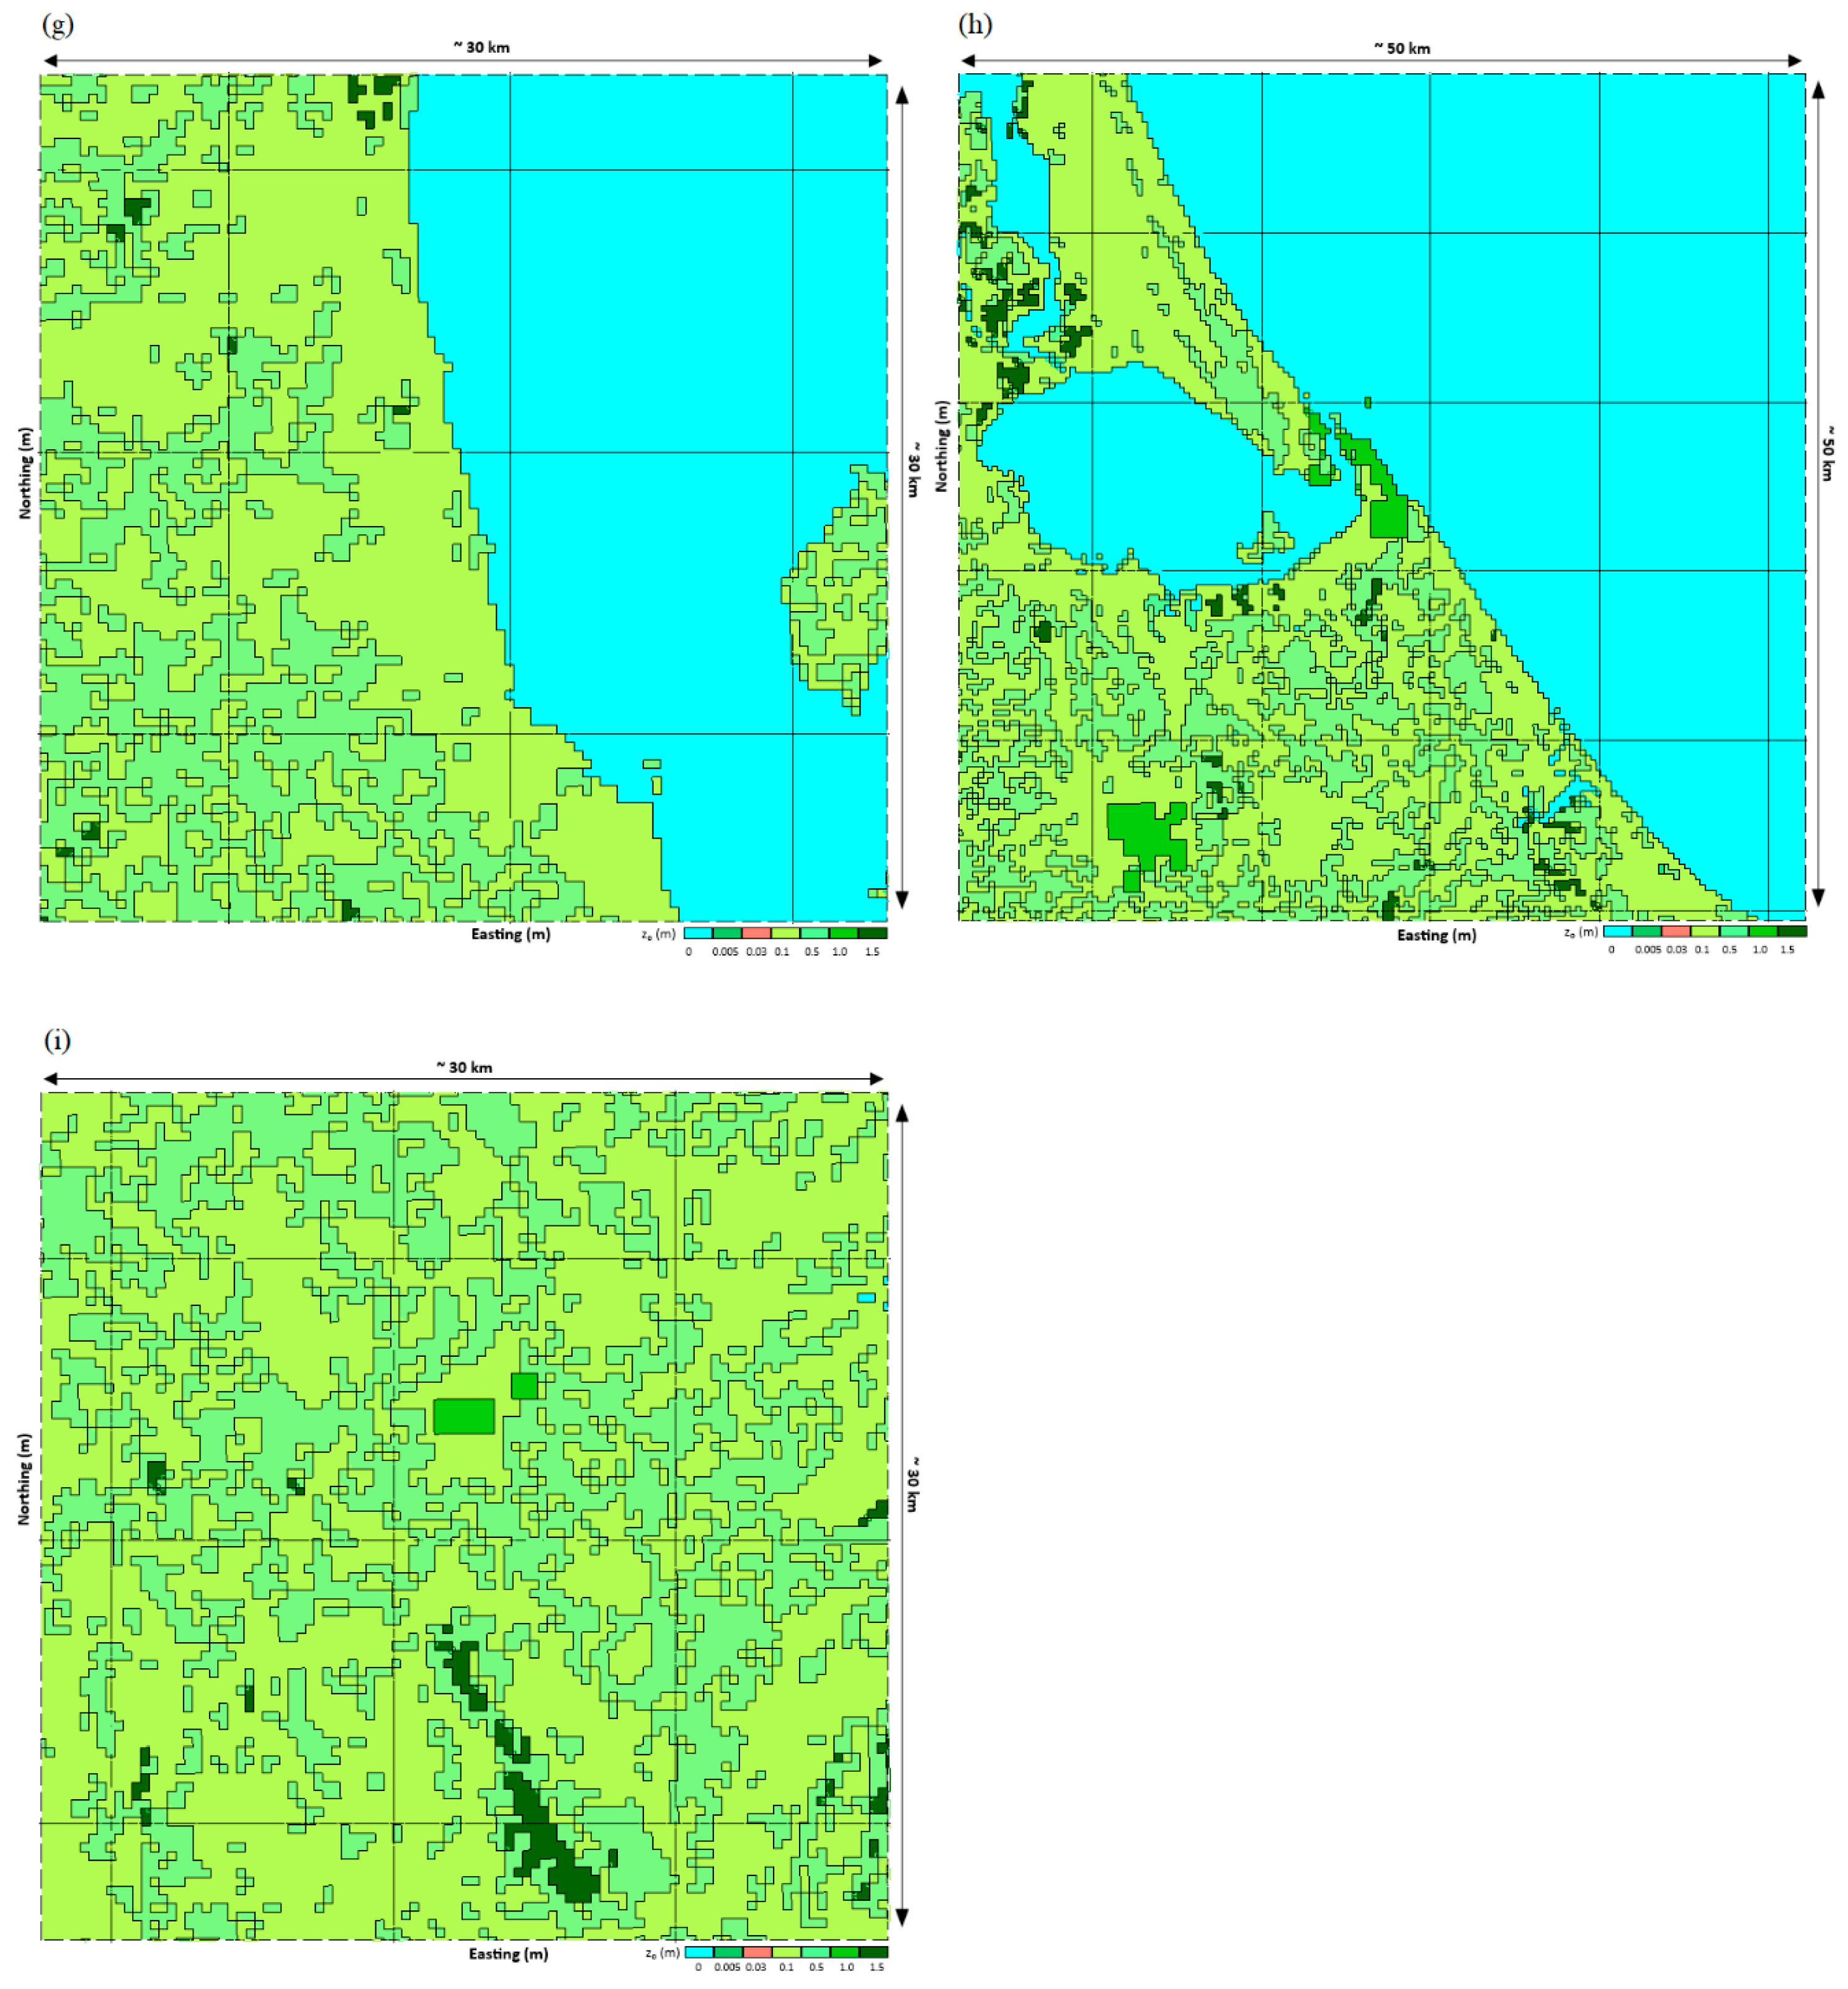
Roughness maps in Figure 5 are formed by using the available data from the GWA Roughness GlobCover database provided by the GWA Warehouse map server. The dataset has a 22-class land use classification system and has a 10 arc–seconds (approximately 300 m) resolution. Due to insufficient information related to the surface roughness with high resolution, the surface roughness in south–eastern Thailand can be characterized into seven types: Water bodies, bare areas, grassland, croplands, flooded forest, urban areas, and forests; while the surface roughness lengths in WAsP by default are 0, 0.005, 0.03, 0.1, 0.5, 1.0, and 1.5 m, respectively.
2.6. Economic Analysis
The LCOE is elaborated as a measure of the average net present value of the generated electricity for a particular system over its lifespan [8,28]. The LCOE is computed in $/kWh or $/MWh. The details of the input parameters to calculate LCOE are shown in Table 3. LCOE is a suitable method for assessing the viability of energy production for commercial service and specifies its effectiveness compared to other technologies [48]. The summarized form of LCOE is given in Equation (5):
or
where CAPEX represents the construction or capital cost while OPEX shows the operation and maintenance cost of the facility. The detailed mathematical form of Equations (5) and (6) is:
where is the construction or capital expenditure in terms of tth year in USD, represents the fixed operation while is the variable operation and maintenance expenditures in terms of tth year USD, denotes the discount rate, shows fixed cost, indicates human resource cost, symbolizes the energy produced in the tth year in MWh, and n is the plant operation period.
3. Results and Discussion
3.1. Analysis of Wind Speed, Wind Direction, and Wind Power Density
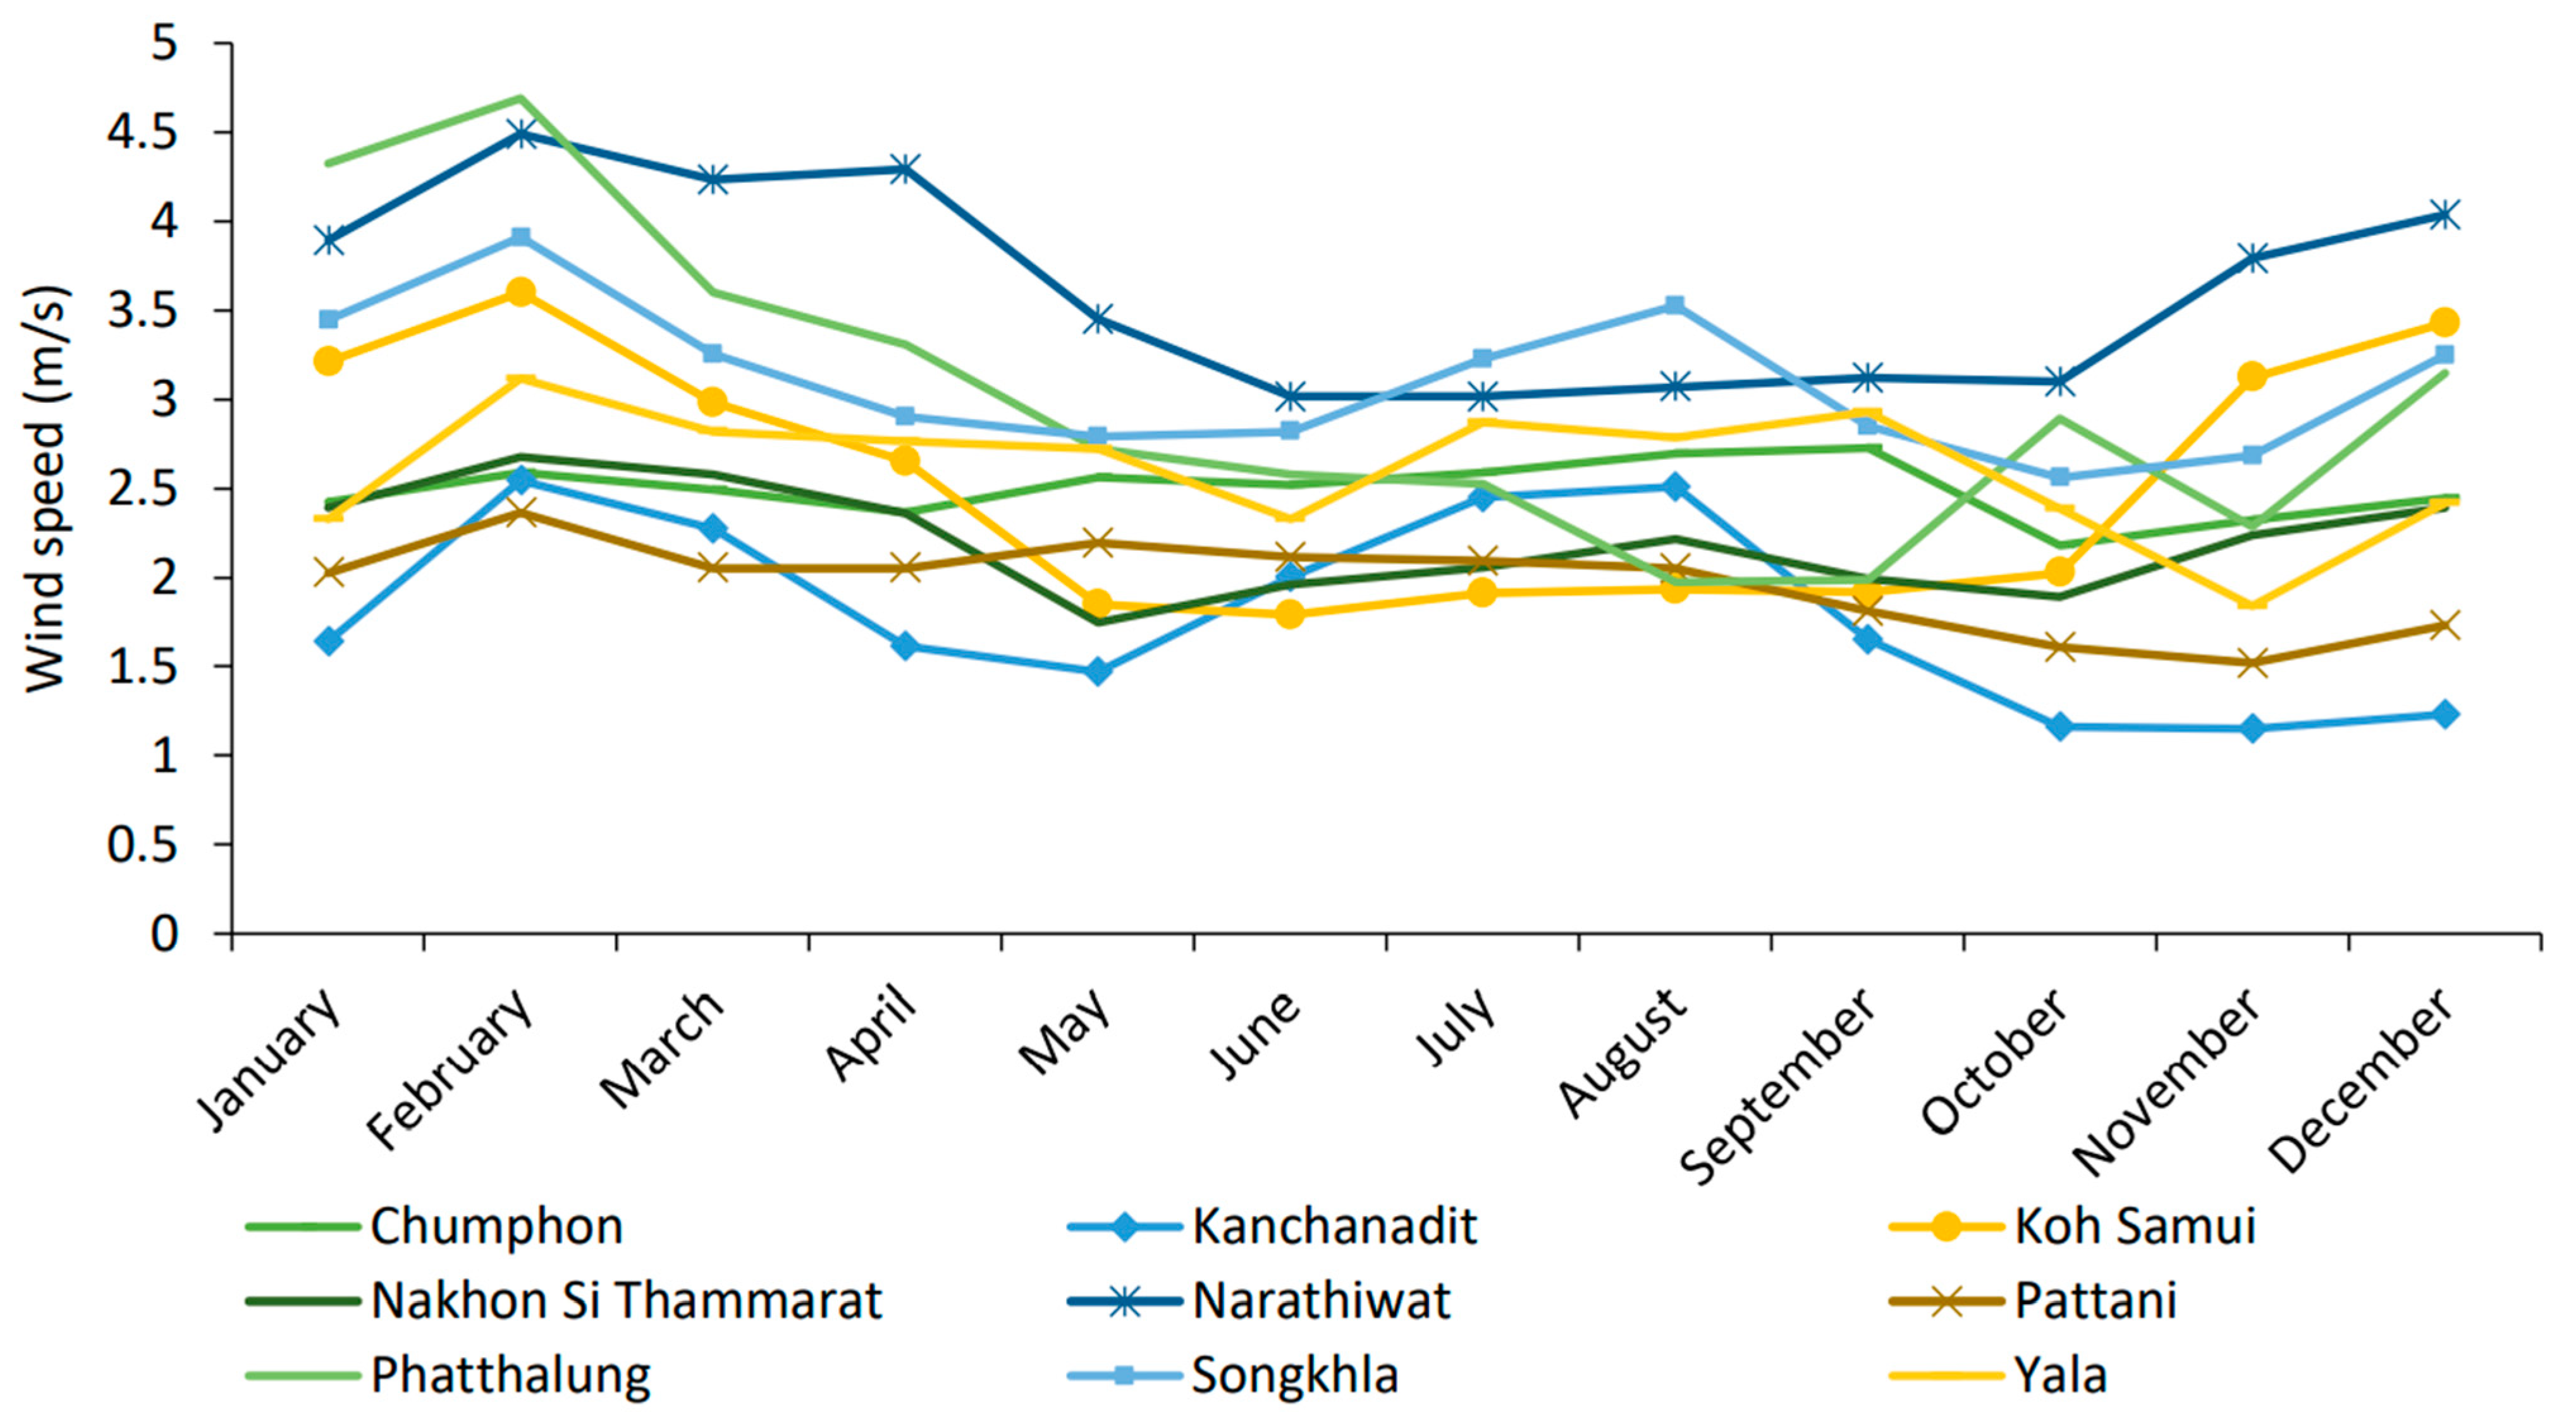
Wind speed is the basic parameter in wind resource assessment for energy production utilizing wind turbines. During proper planning, it is extremely important to consider different periods of variations such as daily, monthly, annual, and seasonal, and the total annual mean wind speed. At extremely high (above 25 m/s) or low (below 3 m/s) wind speeds, possible shutdown periods of the turbine should be identified (when it will be out of service). The capacity factor and predicted power production predominantly depend on the selected wind turbine type, size, and manufacturer [34]. Figure 6 illustrates the monthly average wind speed at 10 m (AGL) for the 3-year period. The average wind speed is lower in the months from May to October, while it is higher from November to April due to the northeast monsoon that brings cold and dry air from the South China Sea, causing strong winds in the Gulf of Thailand and coastal regions of south–eastern Thailand.
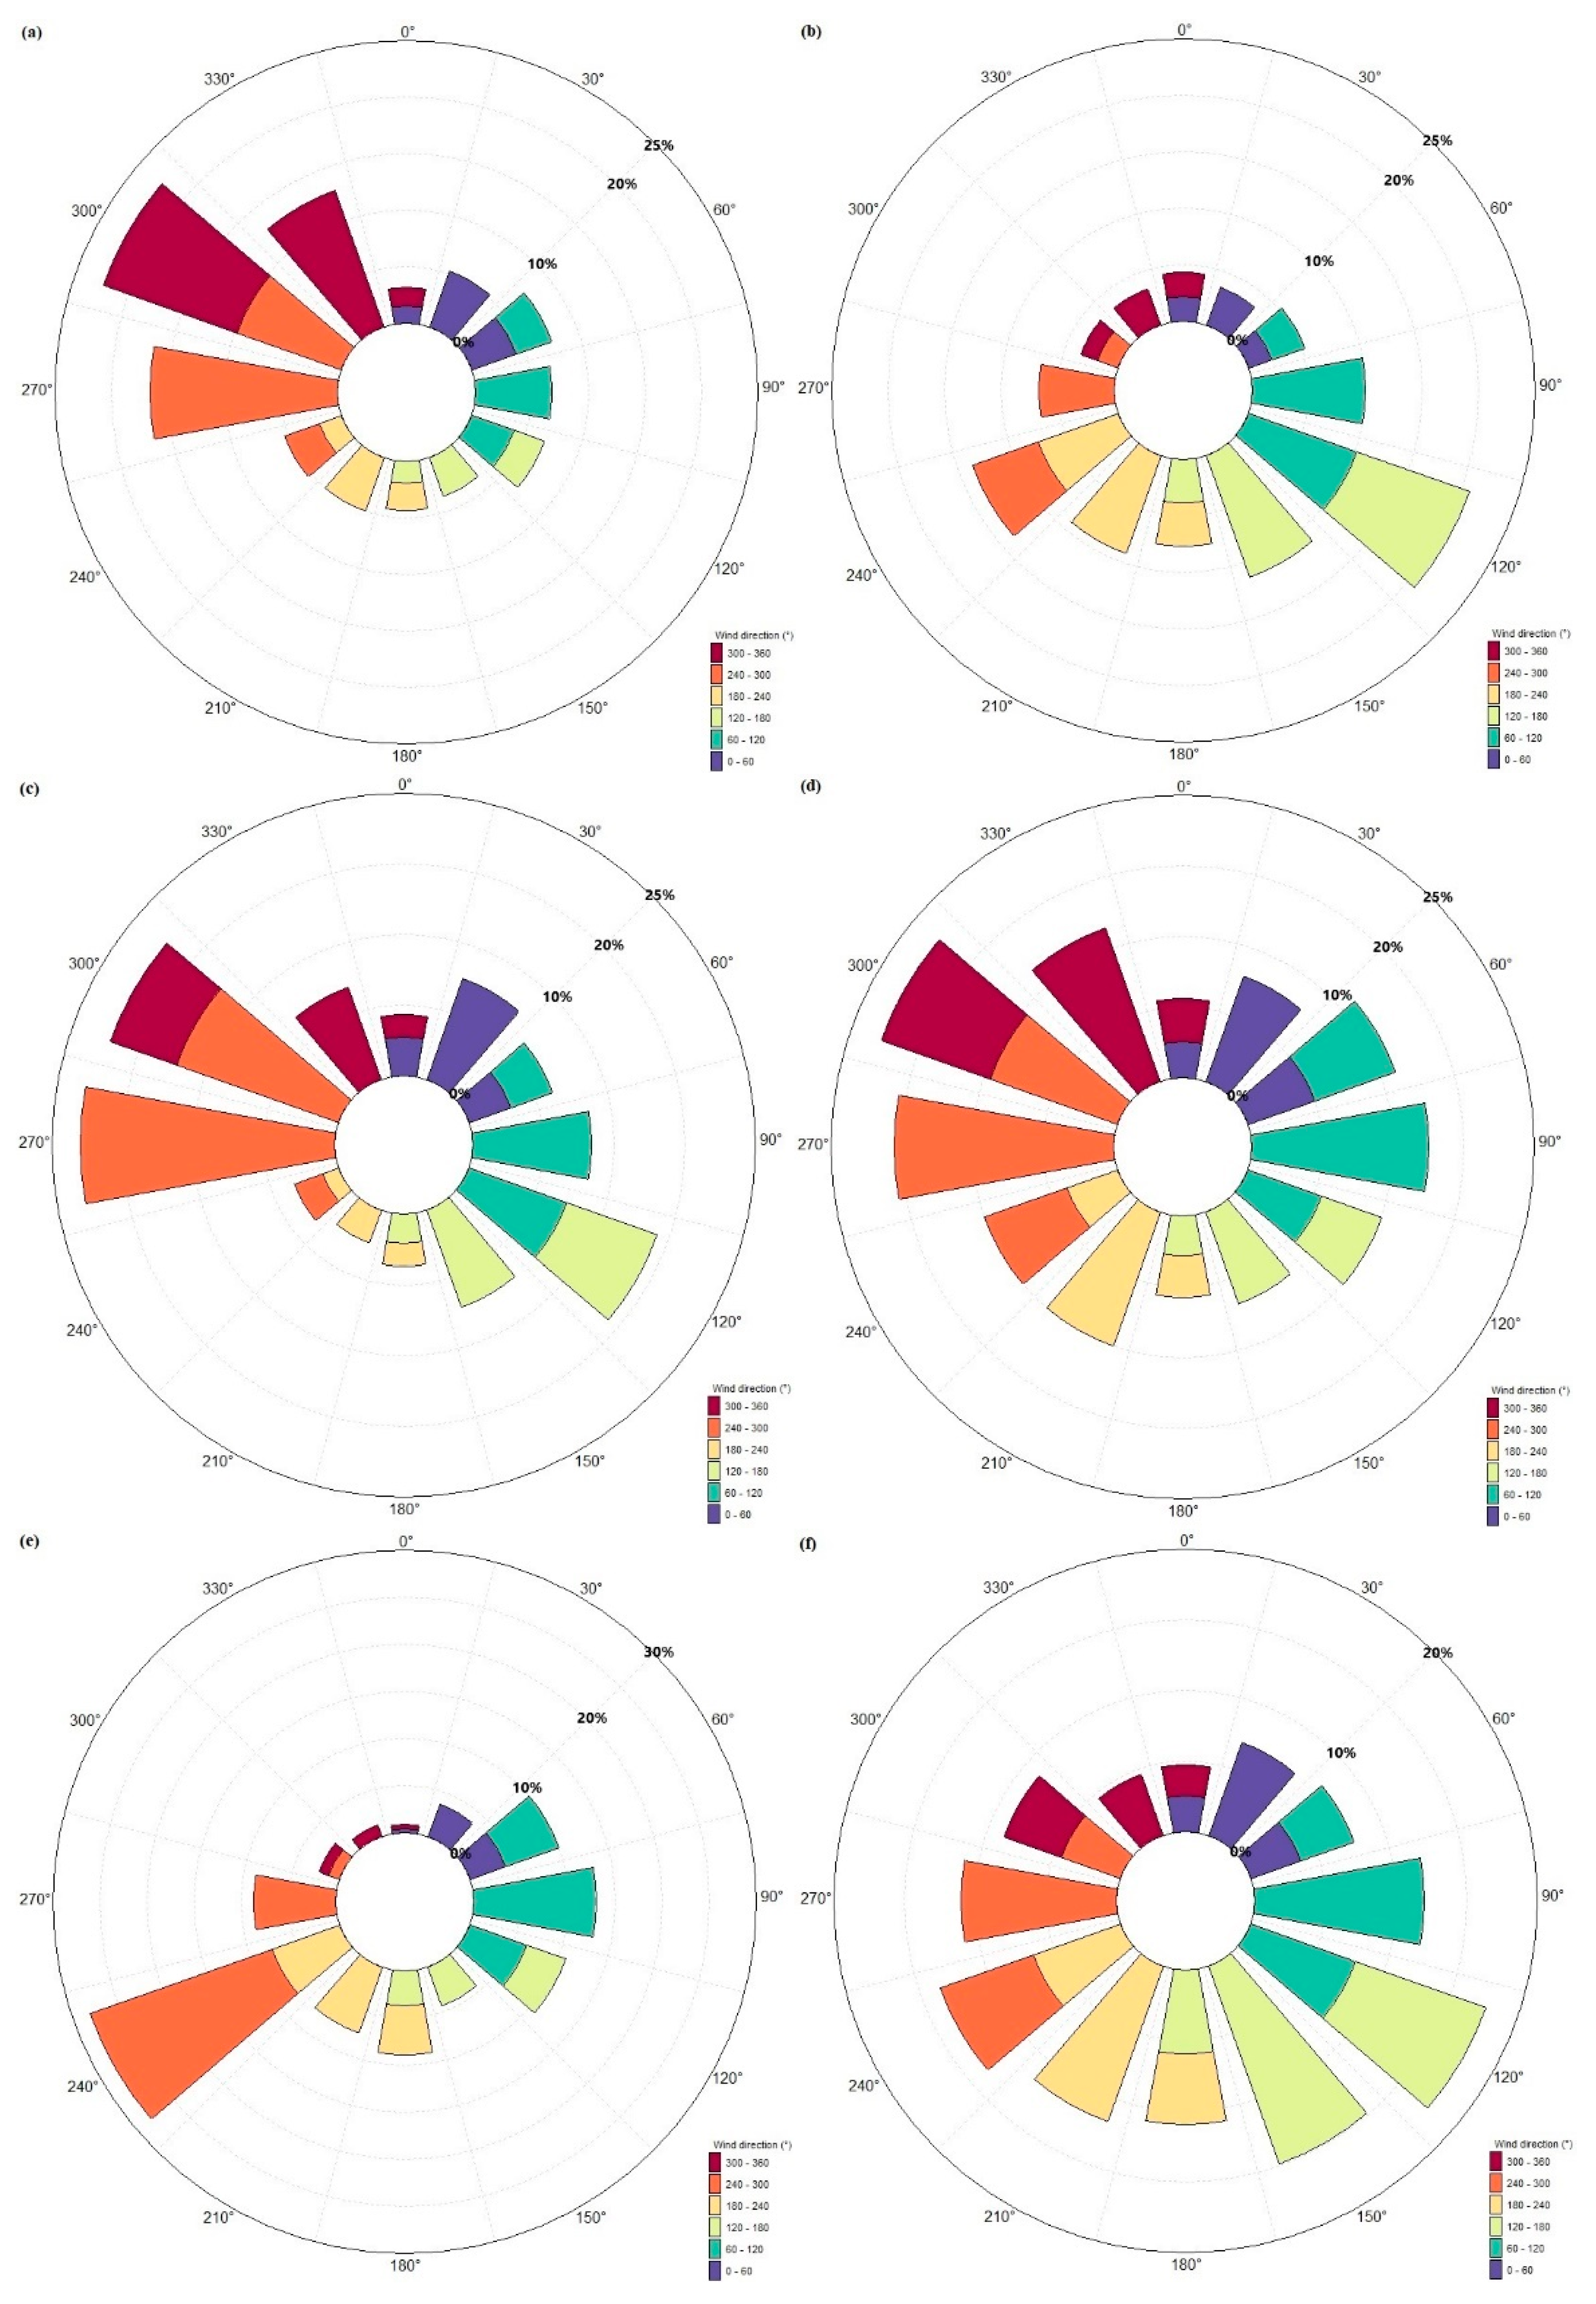
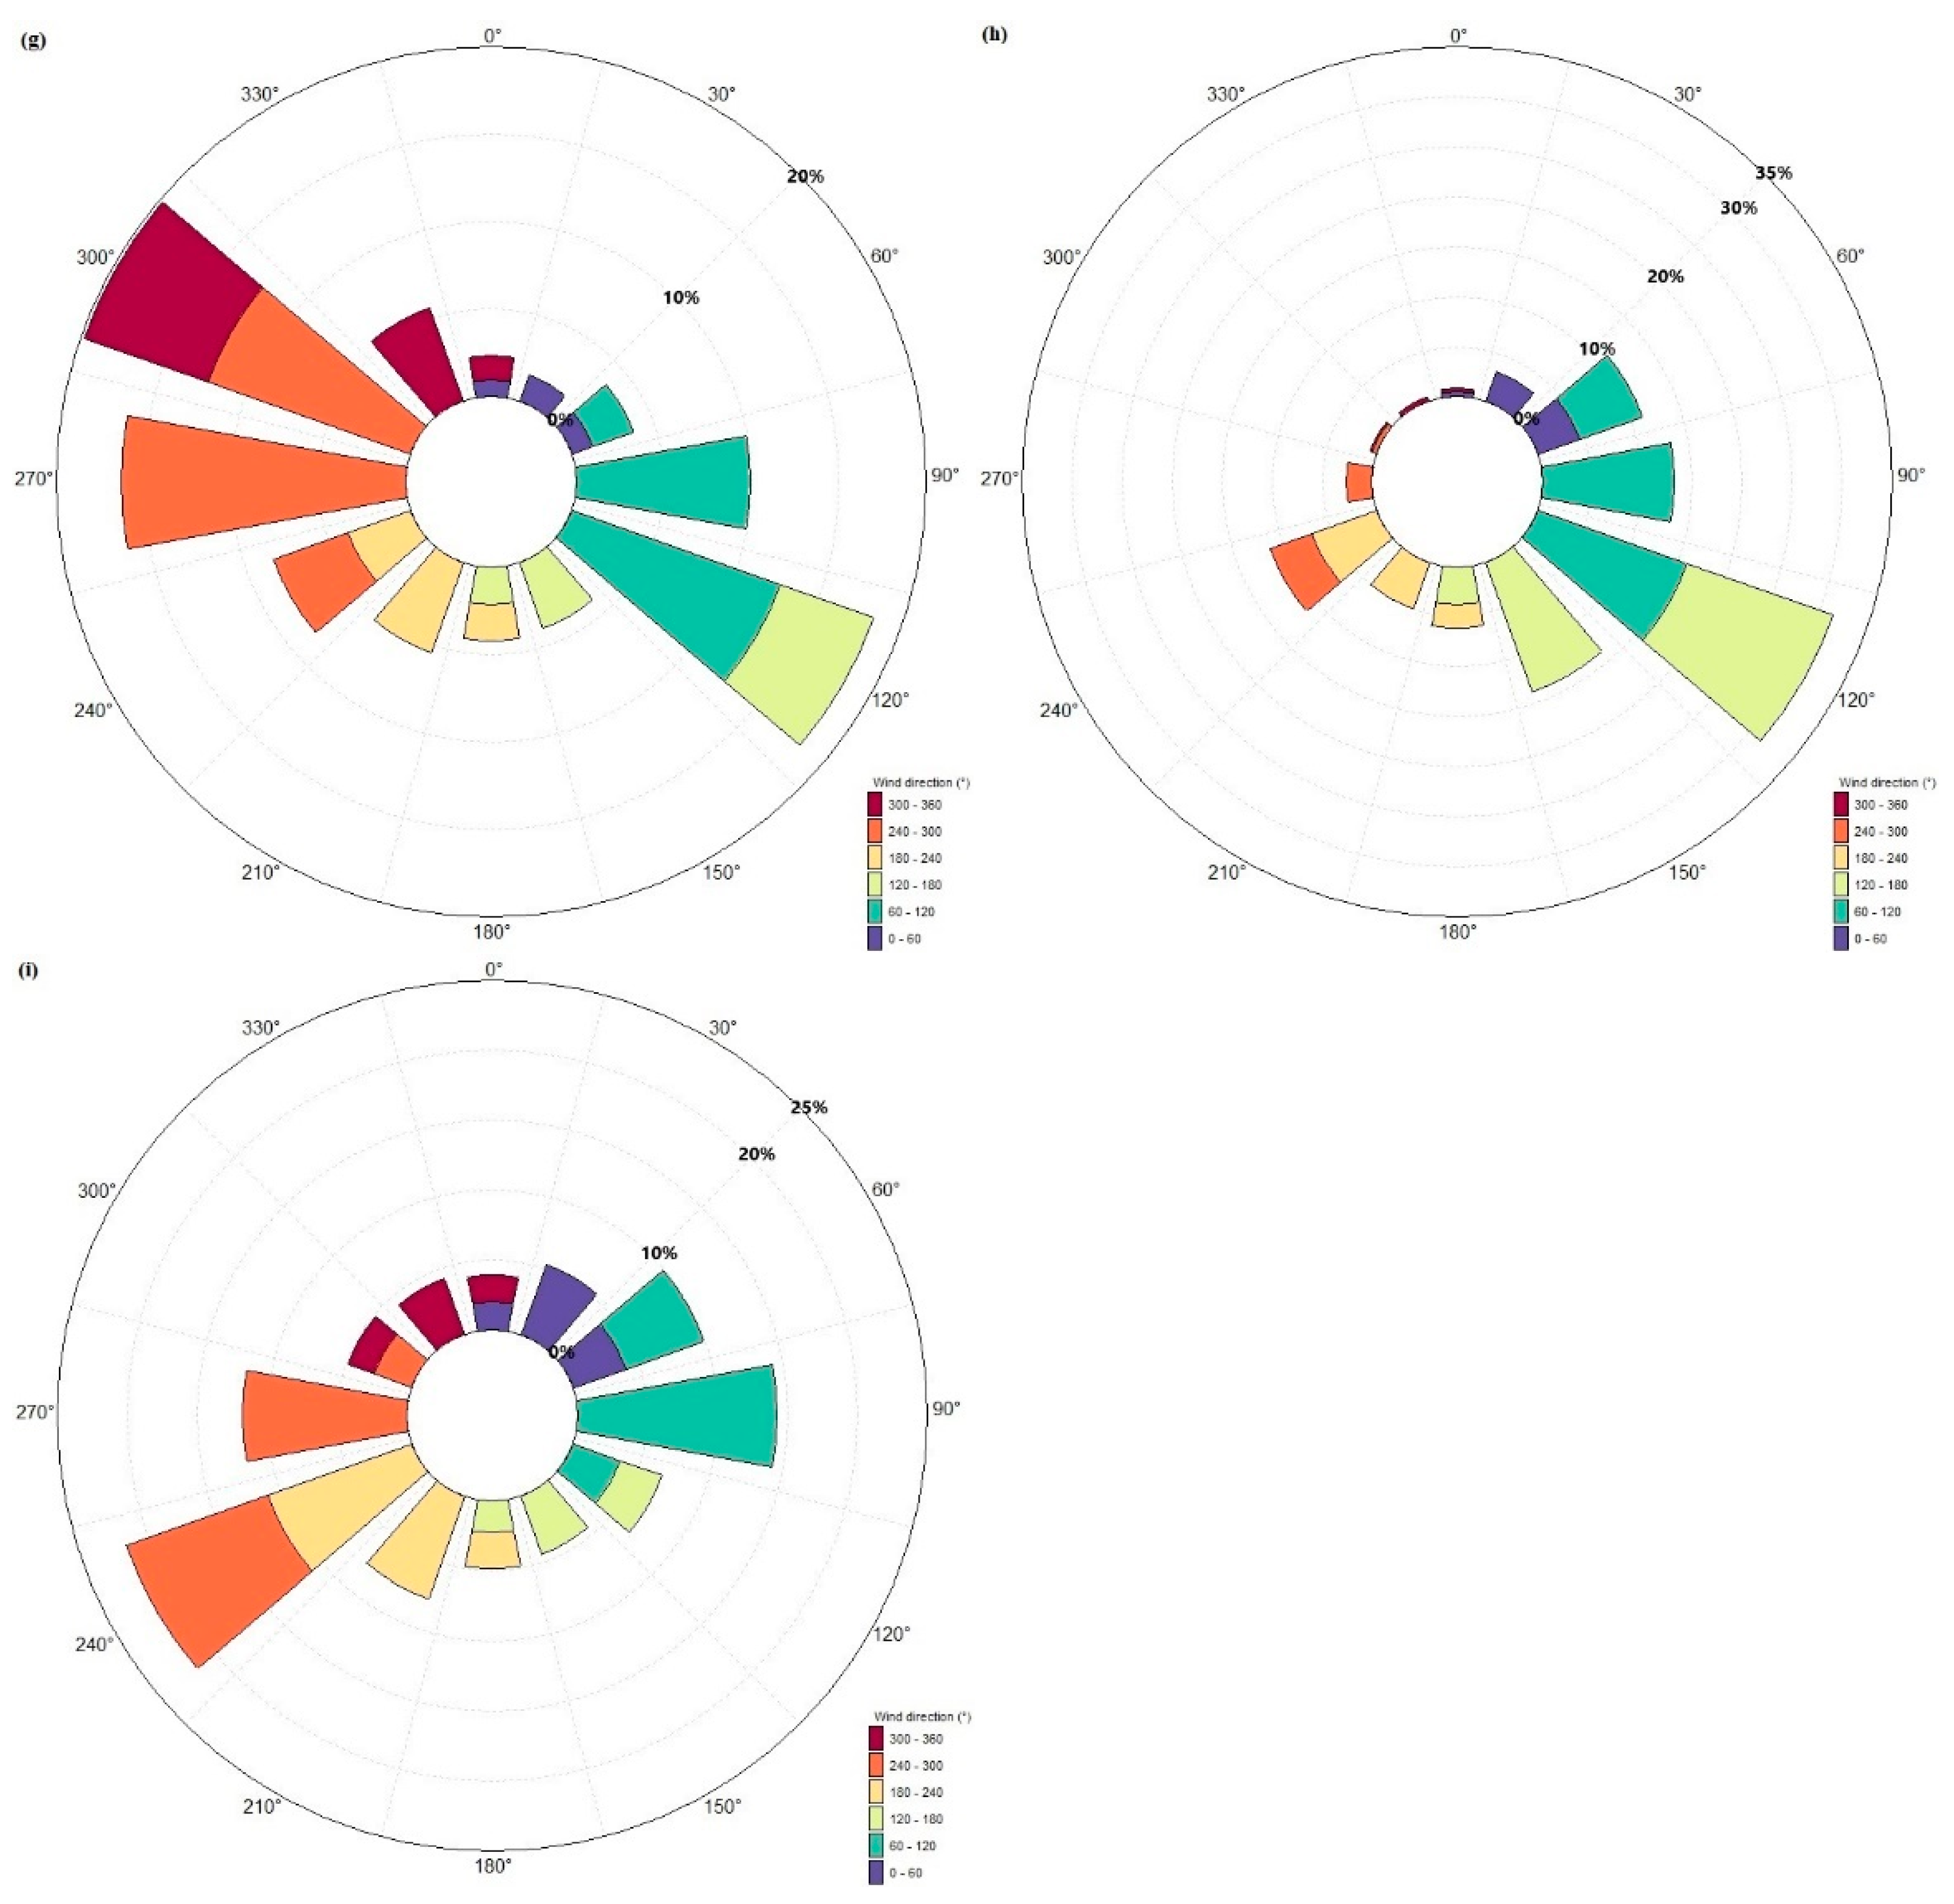
The dominant wind direction has great importance in the evaluation of a wind energy resource [35]. In order to harness the maximal wind energy, the orientation of the wind generator should be perpendicular to the wind direction [34]. Figure 7, clearly depicts the sector–wise distribution as wind roses for south–eastern Thailand in 12 parts, with discrete 30° intervals.
The wind rose diagrams in Figure 7 show that the dominant wind direction observed over the three years is northwest in Chumphon and Nakhon Si Thammarat, whereas it is southwest in Narathiwat and Yala. Similarly, the southeast direction is dominant in Kanchanadit, Pattani, and Songkhla. The bi–directional northwest–southeast wind rose is more pronounced in Phatthalung, while west is the dominant direction in Koh Samui. Moreover, the occurrence rate of northwest wind direction for Chumphon and Nakhon Si Thammarat is almost 23%, whereas the occurrence rate of southwest wind for Narathiwat and Yala is about 28% and 22%, respectively. Similarly, the occurrence rate of the southeast direction in Kanchanadit, Pattani, and Songkhla is prevailing with 21%, 18%, and 32%, respectively. The occurrence rate of bi–directional northwest–southeast wind in Phatthalung is almost 24% from the northwest and 23% from the southeast, while the occurrence rate of the west direction in Koh Samui is almost 23%.
Wind power density is the maximum available wind power per unit area and can be expressed as [25,49]:
Similarly, the mean wind power density can be measured by using the observed wind data, and is given by [36]:
where indicates the mean air density (kg/m3) of a specific time interval, is the th wind speed (m/s), and is the number of occurrences of th speed (frequency).
The wind power density can be divided into seven categories on the basis of wind speed and annual wind power density, as shown in Table 4 [25,50].
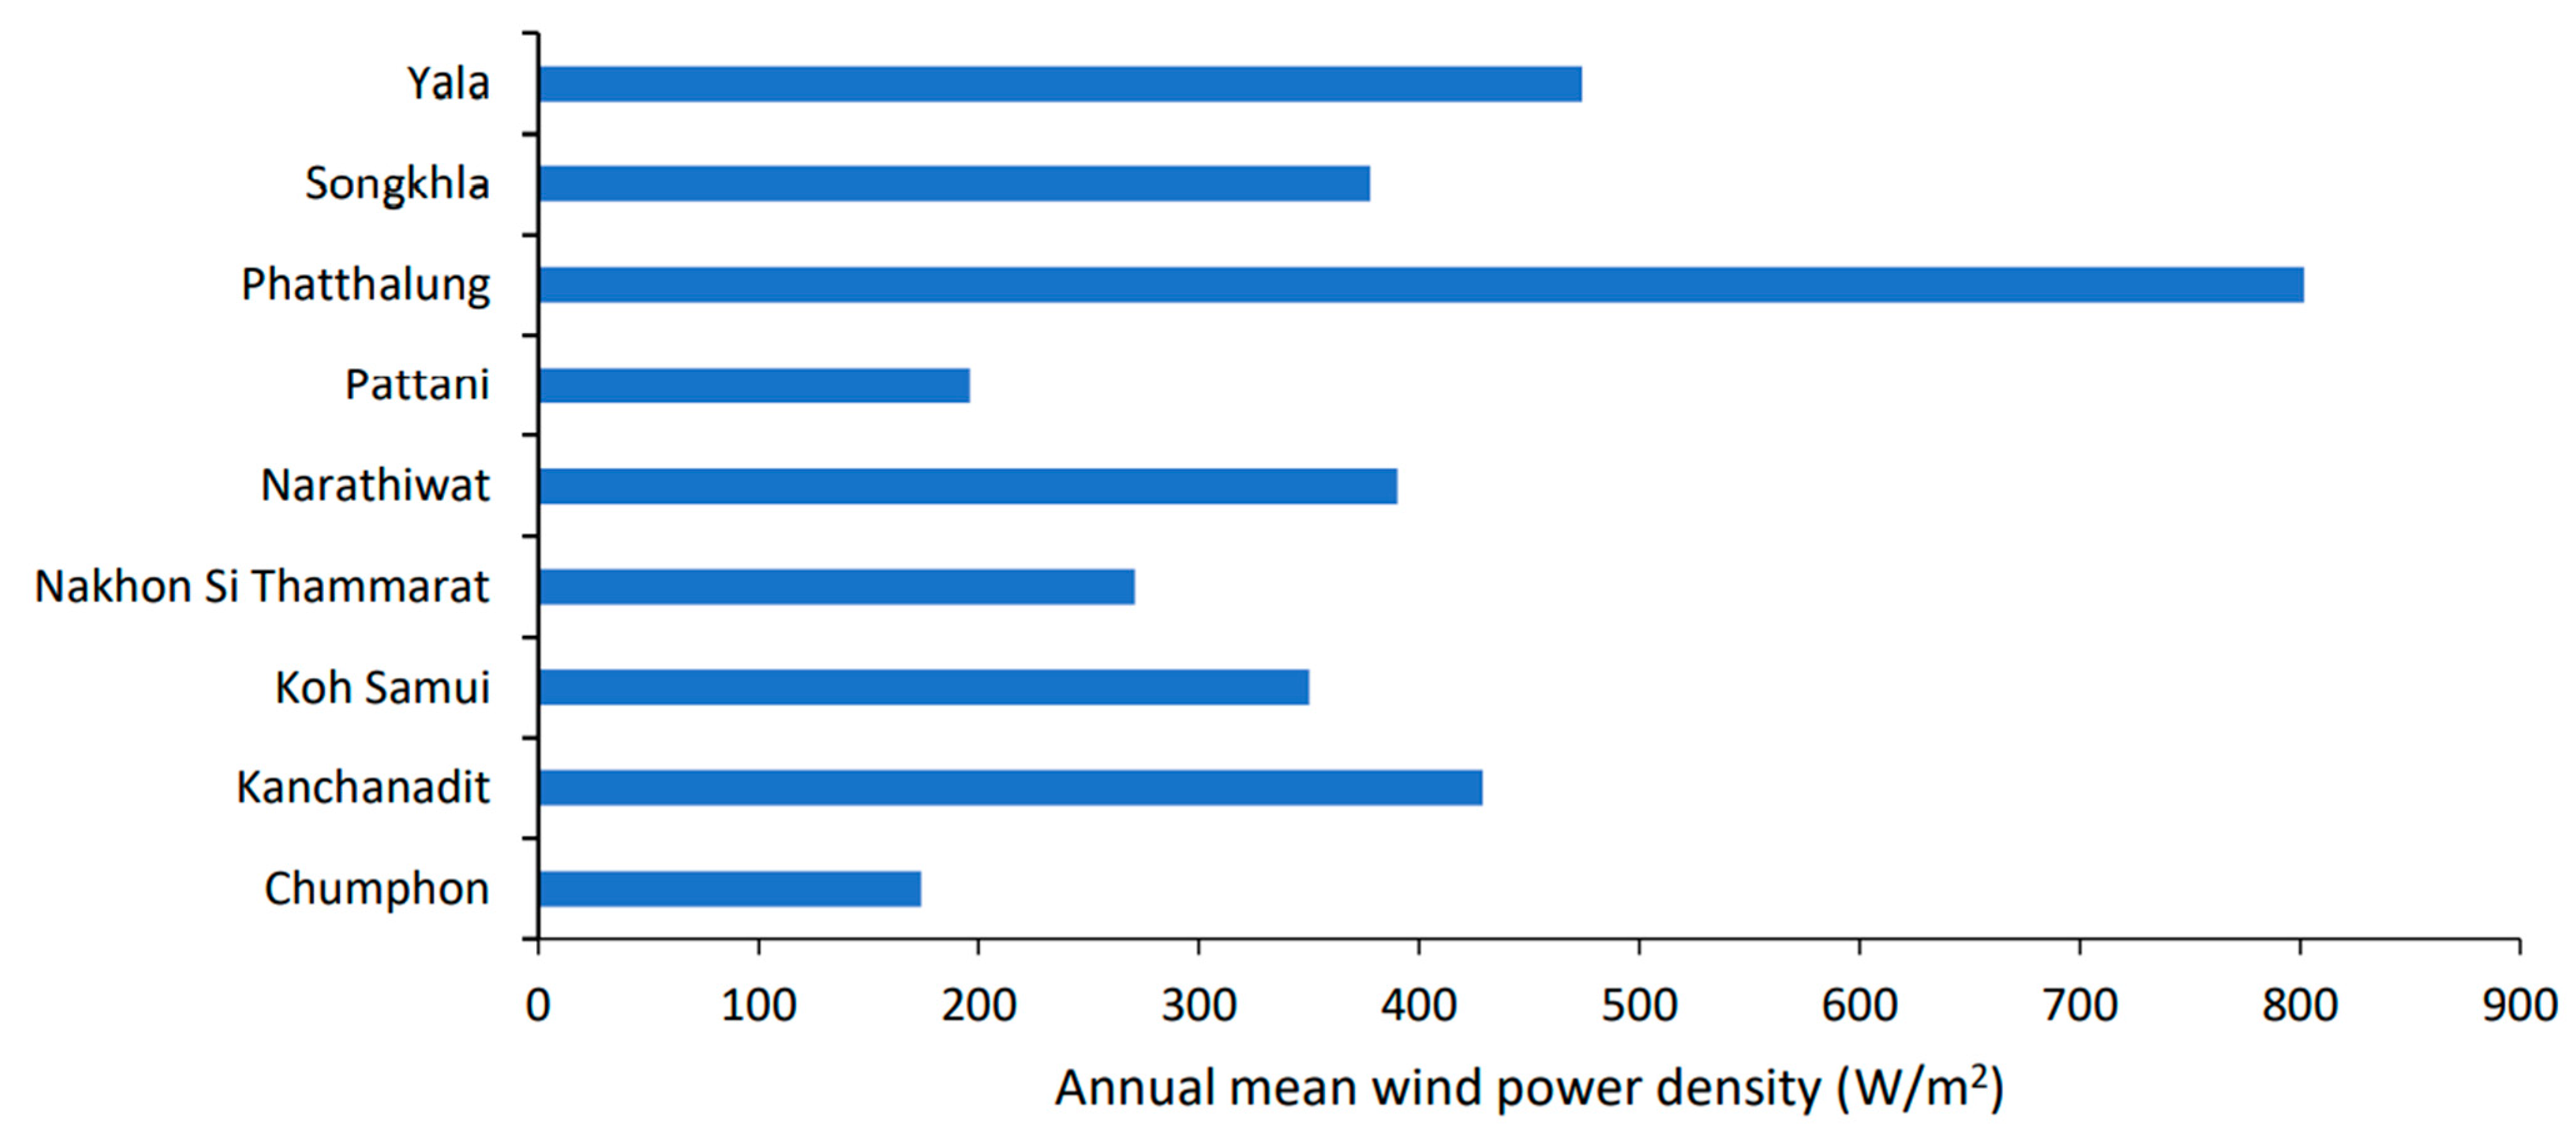
Figure 8 represents the annual mean wind power density in south–eastern Thailand at a 28.5 m hub height. The wind energy resource in south–eastern Thailand varies from station to station as shown in Table 3. For south–eastern Thailand, the annual mean wind power density with the highest value of 802 W/m2 was found in Phatthalung, which belongs to wind class 7, followed by Yala with 474 W/m2 and Kanchanadit with 429 W/m2, and both these stations fall in wind class 4. The minimum annual mean wind power density of 174 W/m2 was recorded in Chumphon, followed in increasing order by Pattani with 196 W/m2, and both stations belong to wind class 1; while Nakhon Si Thammarat with 271 W/m2 falls in wind class 2. Similarly, Narathiwat, Songkhla, and Koh Samui were at 390 W/m2, 378 W/m2, and 350 W/m2, respectively, belonging to wind class 3.
Yu and Qu [52] reported that good or excellent potential sites are suitable candidates for establishing a wind energy facility, with wind power density exceeding 400 W/m2 or even reaching 800 W/m2, and wind speed on average is above 7.0 m/s. Thus, the various sites in south–eastern Thailand inspected using WAsP possess very good potential for wind farm development.
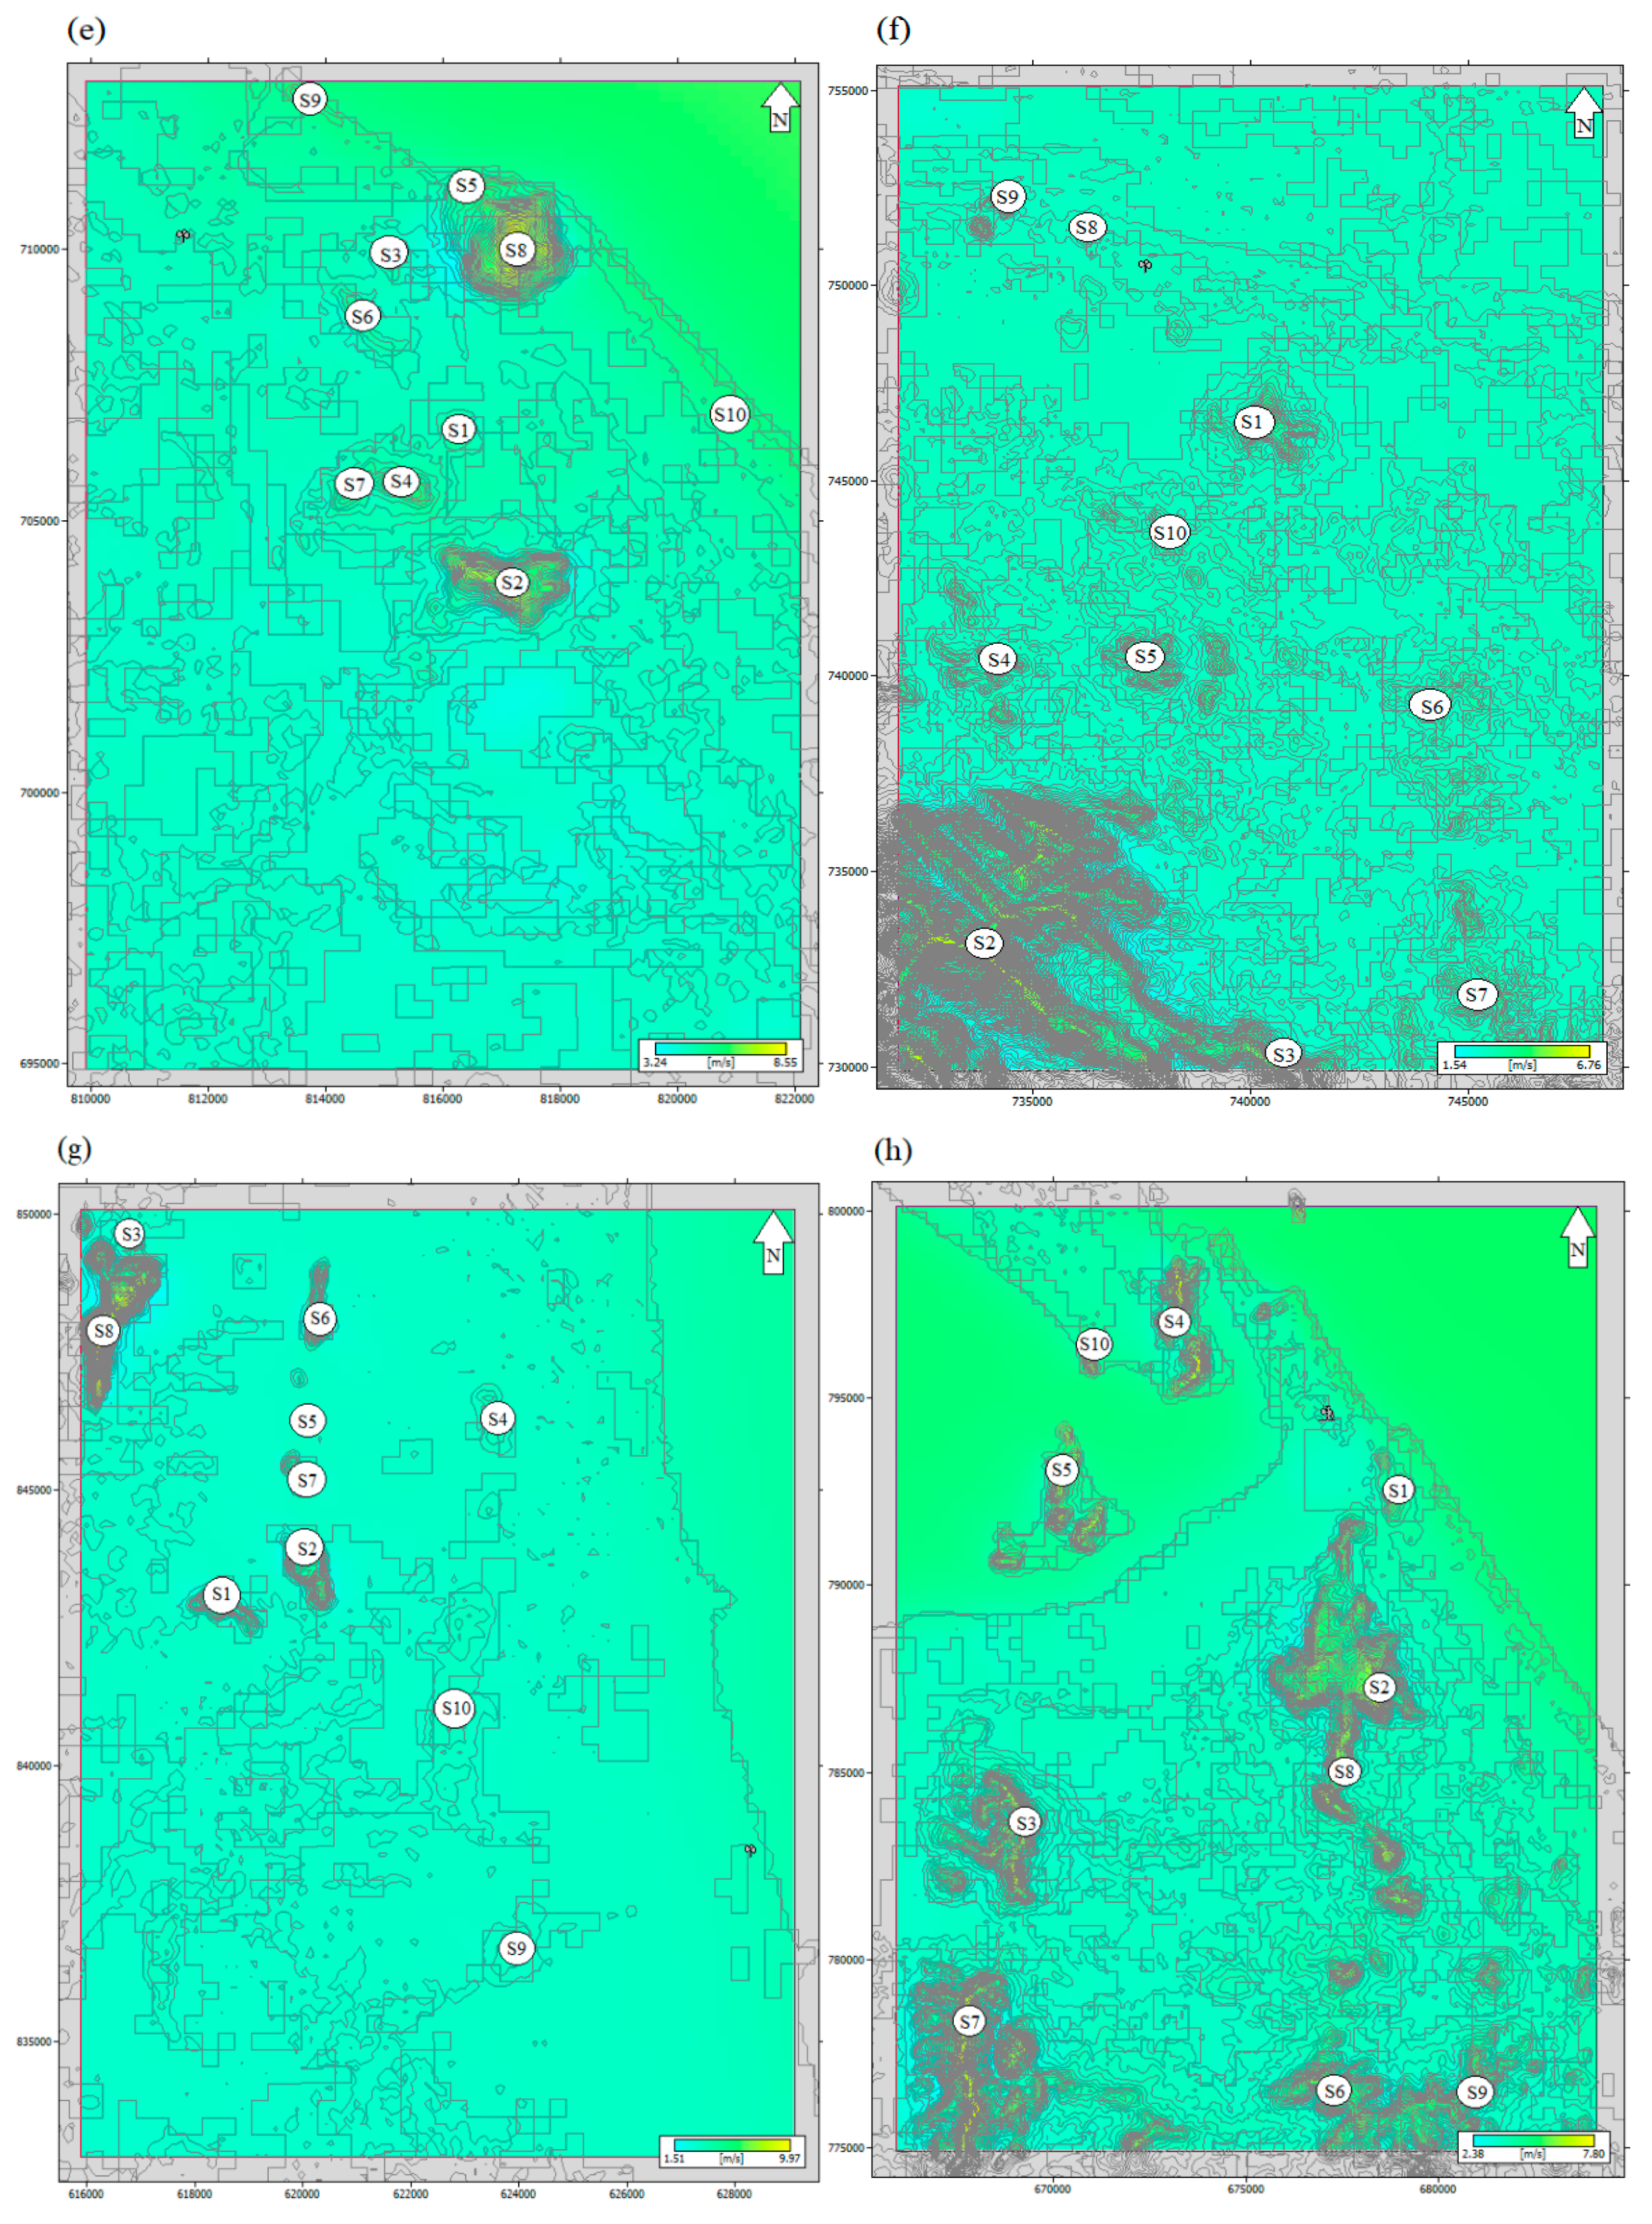
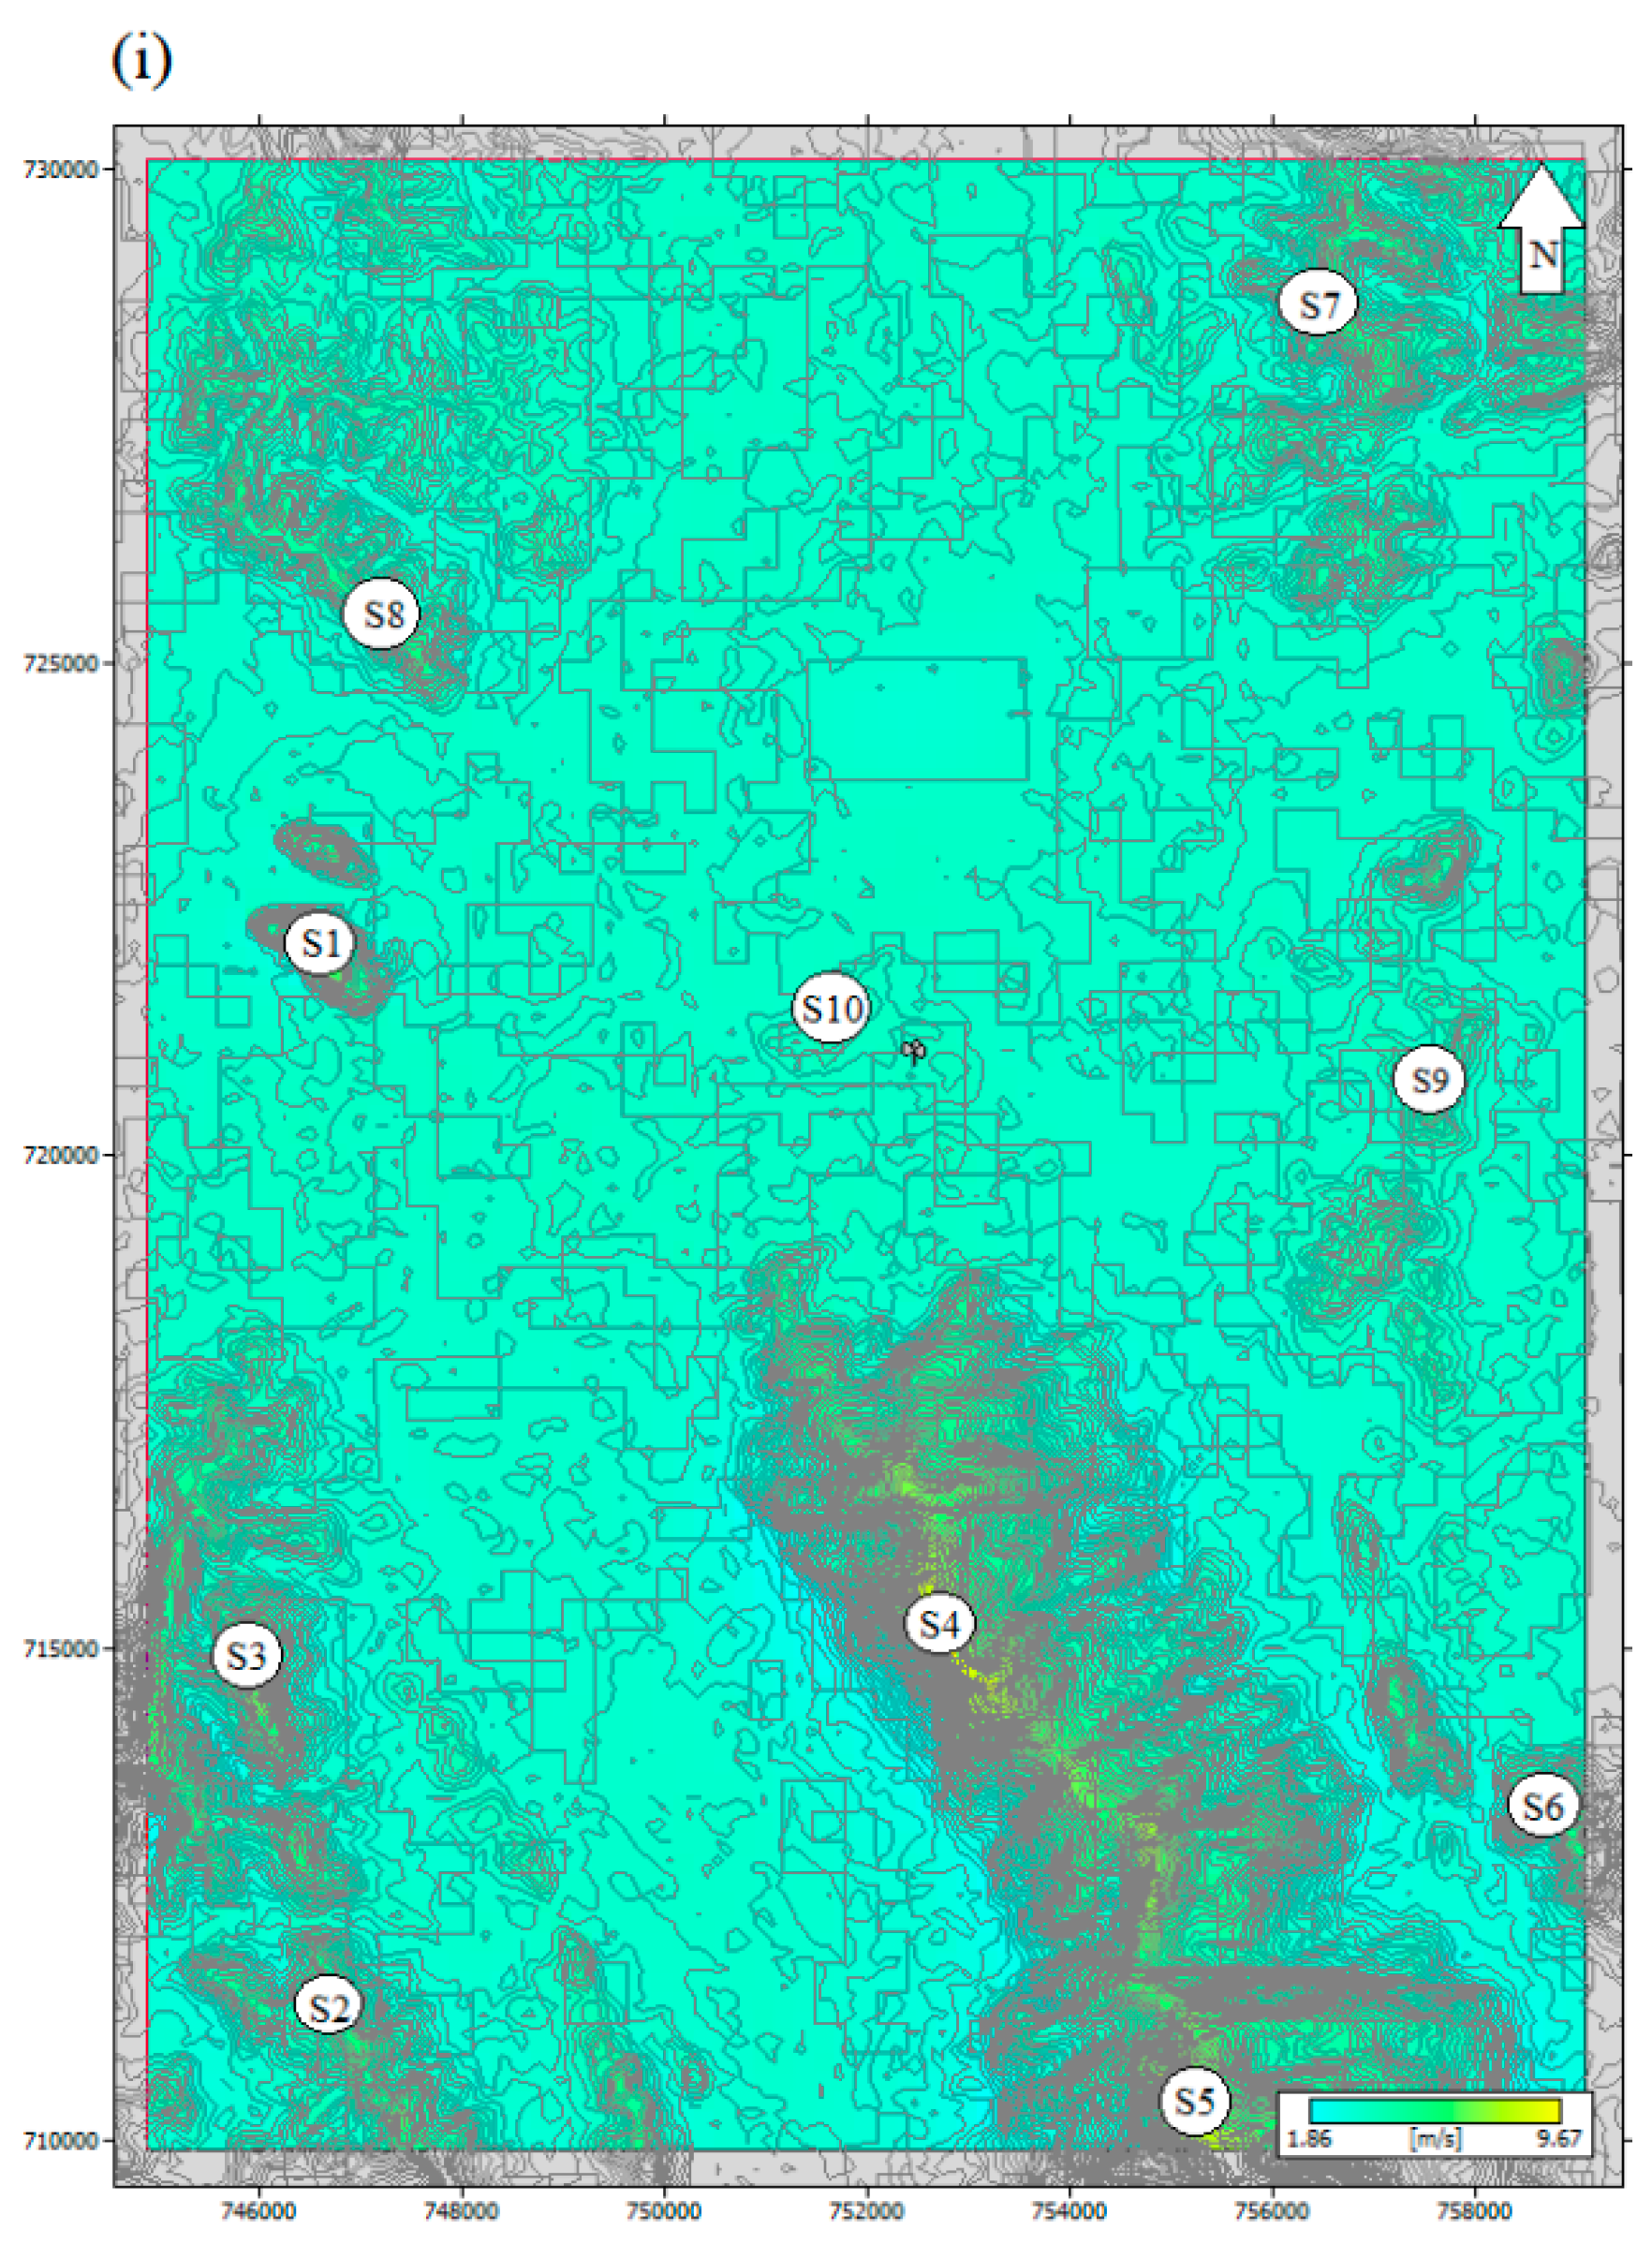
3.2. WAsP Analysis: South–Eastern Thailand
The wind resource maps show the mean wind speed extrapolated for a portion of south–eastern Thailand in Figure 9. This study identifies ideal sites in the eight provinces of south–eastern Thailand. WAsP analysis was carried out for the thickly populated, increasing infrastructure and remote areas. Nine stations were inspected by analyzing 3 years of wind data for a prospective wind farm facility. In the next stage, a power analysis was conducted for the selected locations in accordance with the mean wind speed, wind power density, accessibility by using roads, and electrical transmission lines [53].
Wind speed highly varies in direction with respect to different locations; thus, those areas encompassed by the resource grid fall within the WAsP’s limits of predictability. Various types of wind turbines can be proposed for the selected sites. However, the wind turbine model for this work is selected on the basis of the availability and reliability of information about the specifications of the power curve. Other types of wind turbine models available in the market may be more appropriate than the one used in this assessment. For instance, there is a wind turbine model that is specifically designed for a low–speed wind regime, but it lacks specifications in the literature. Eight to ten sites in each station of south–eastern Thailand were selected within the resource map plot for power analysis using the wind generator Enercon E–18 with a rated power of 80 kW. These sites were selected based on the mean wind speed, wind power density, accessibility by using roads, and electrical transmission lines.
The 10 m measurement towers installed by the TMD are mounted in relatively exposed areas in south–eastern Thailand. Sites along the ridges, mountain peaks, and coastal ridges show good wind speeds within the resource grid at a 28.5 m hub height.
In south–eastern Thailand, the northern stations such as sites along the northwestern ridges (S1 and S2) in Chumphon and the mountain peaks (S2, S3, and S8) in Kanchanadit, (S2, S3, S6–S9) Koh Samui, and (S2, S4–S6) Nakhon Si Thammarat show good potential for wind farm development with a mean wind speed of 6.0–6.9 m/s, 5.8–6.7 m/s, 6.0–6.7 m/s, and 6.3–6.7, respectively. However, the sites inspected near the coastal side in the south (S10) and east (S7–S9) of Chumphon, northwest (S10) of Kanchanadit, and the eastern part (S9 and S10) of Nakhon Si Thammarat possess less potential for wind farm facility implementation.
In central stations, all sites along the peaks of mountains (S1 to S10) of Songkhla and northwestern ridges (S1, S6, and S8) of Phatthalung in the resource map plot have very good mean wind speeds from 5.9 m/s to 7.1 m/s and from 5.9 m/s to 8.8 m/s, respectively. These sites have very good potential for wind farms in the future. However, in Phatthalung, sites on the leeward side (S5) and plain areas (S4, S9, and S10) towards the Songkhla lake show less potential for a wind park, because of a mean wind speed of about 3.4 m/s to 4.3 m/s.
The resource maps show great potential on the mountain peaks and ridges in the southernmost stations, in Narathiwat and Yala provinces in south–eastern Thailand. All the sites investigated in Narathiwat and Yala have mean wind speeds around 5.1–8.6 m/s and 5.1–9.4 m/s, except site (S10) close to the meteorological station in Yala, which has very little potential (4.2 m/s). Sites inspected along the ridges (S8 and S5) and towards the northern (S9) and eastern (S10) coast in Narathiwat possess good mean wind speeds of about 5.3 m/s to 8.6 m/s, because of their proximity to the shore. Further investigation regarding offshore wind speed is required around the coastal regions of Narathiwat, which can be expected to have great potential for offshore wind farm facilities in the future. On the other hand, regions (S1, S4–S10) examined on ridges in the Pattani province had less potential for a wind farm facility. However, from the resource, it is apparent that the sites on mountain peaks in the southwest (S2) and south (S3) show some potential for wind farm development as these sites have a mean wind speed of about 5.1 to 6.9 m/s.
The area of south–eastern Thailand is fairly smooth. Regions on the leeward side and plain areas in south–eastern Thailand have much less potential for a wind farm facility, as they are surrounded by many artificial obstacles, for instance high–rise buildings and urban infrastructure, which make airflow highly turbulent and may affect the wind flow. However, mountain peaks and ridges show great potential for a prospective wind farm facility, which are generally located far from the power grid. Hence, small–scale wind turbines can act as a useful power source in such locations [54].
The average power generated by a wind turbine can be computed by applying the following equation:
where shows the output power, which is defined by the turbine power curve.
Moreover, the energy yield from a wind turbine can be calculated as:
where is the wind speed, which is averaged over a time interval , and N is the number of recorded observations.
The Enercon E–18 wind turbine with a rated of 80 kW was used in the power analyses of the identified potential sites. Technical specifications of the turbine are shown in Table 5. The cut–in and cut–out speeds of the Enercon E–18 wind turbine rotor are 2.5 m/s and 25.0 m/s, respectively.
The wind turbine power curve and a site’s wind characteristics can be used to estimate the future energy generation over a specific period [35].
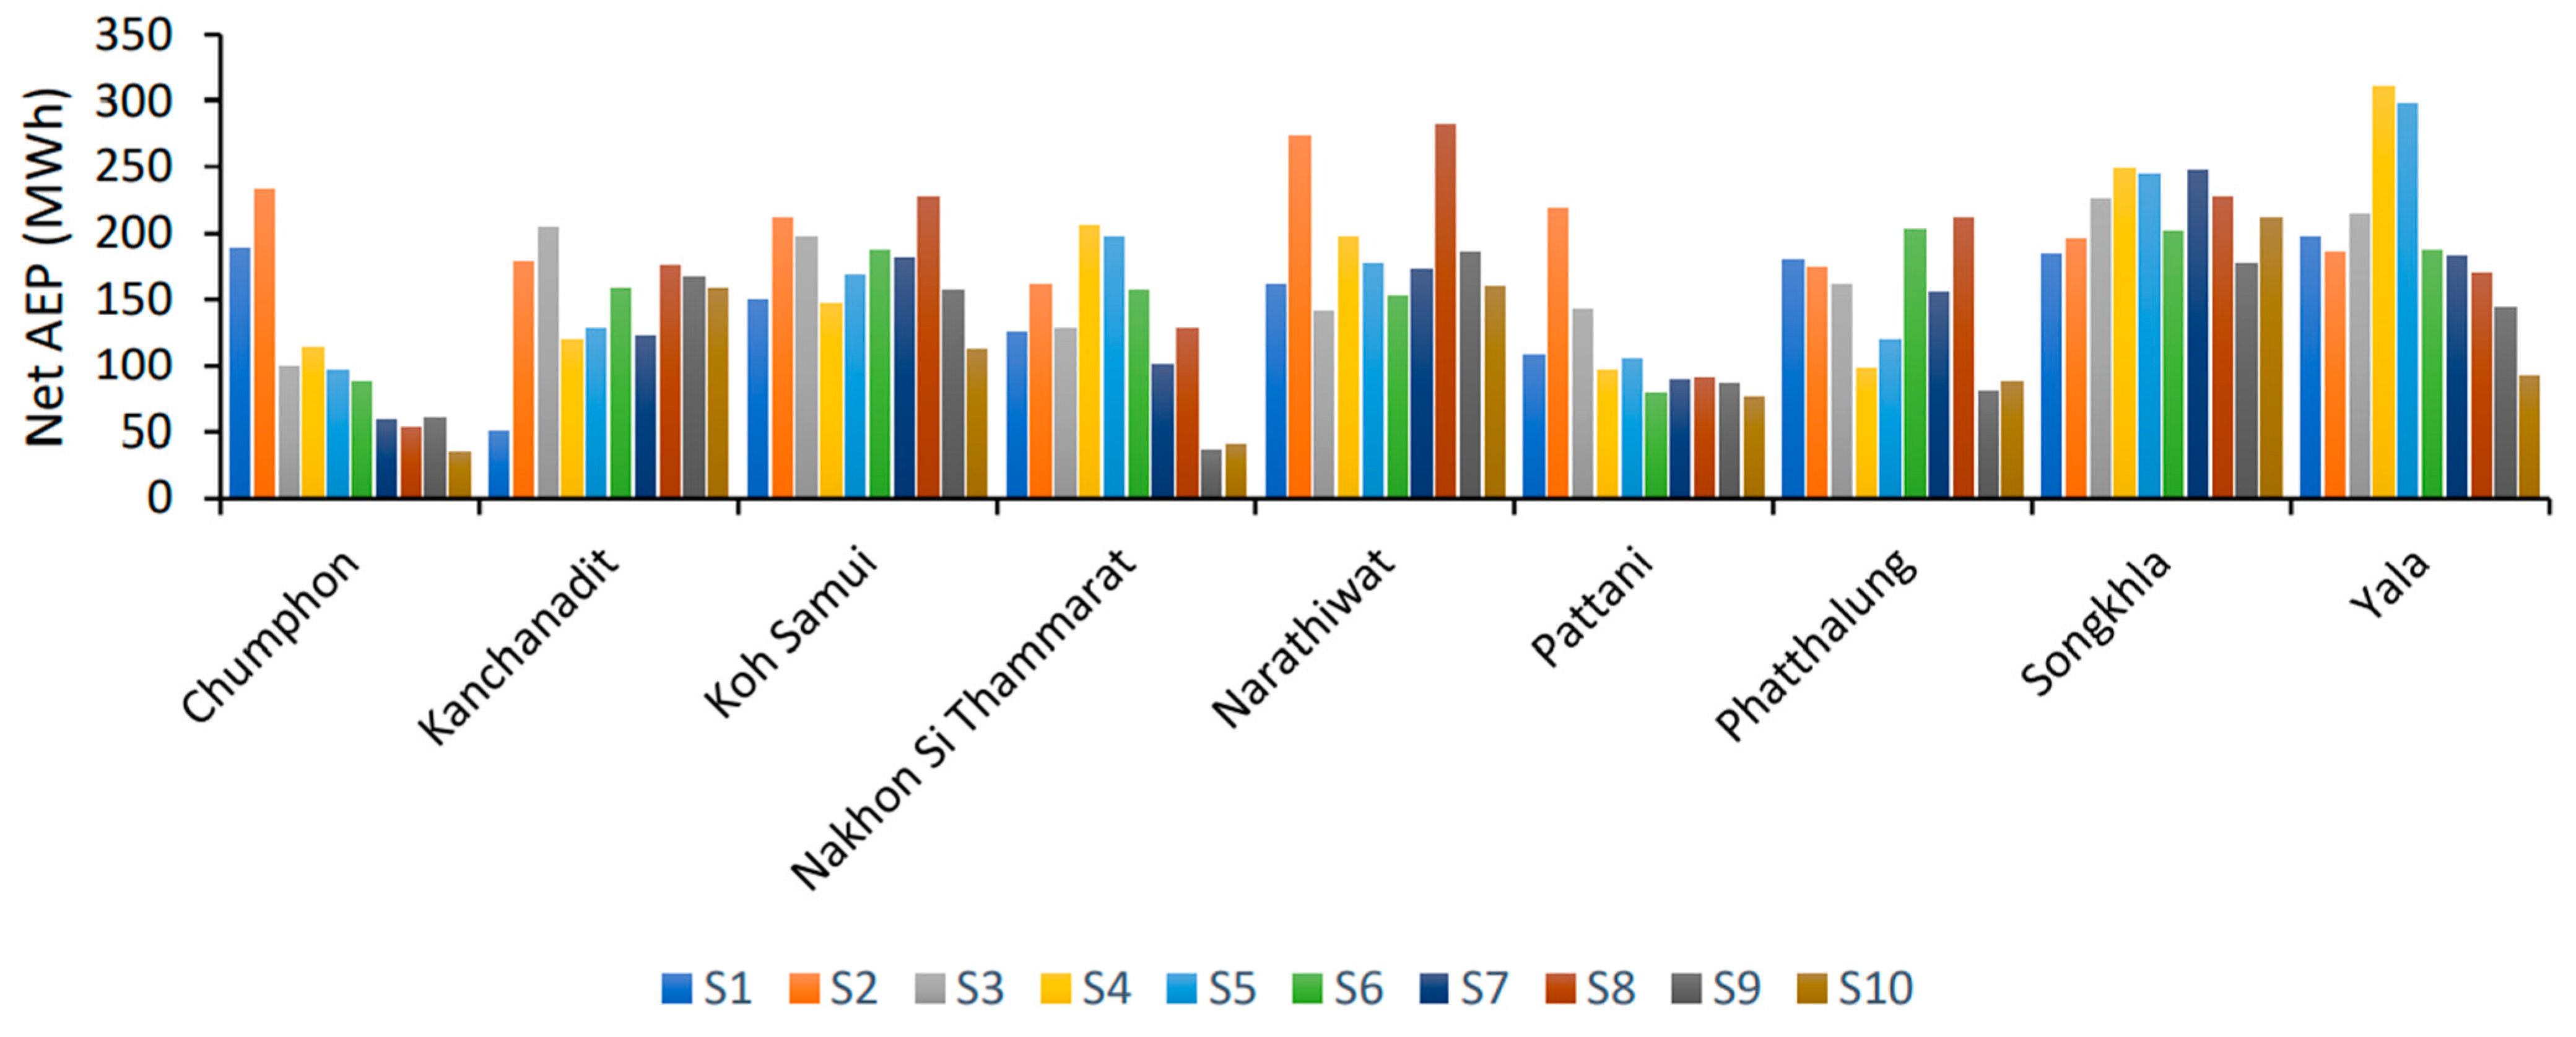
Figure 10 shows the net AEP at the selected sites in each station of south–eastern Thailand. Based on the average net AEP generated by WAsP, Songkhla has the highest potential for prospective wind energy development, followed by Yala and Narathiwat in south–eastern Thailand.
In northern stations, the average net AEP for Chumphon, Kanchanadit, Koh Samui, and Nakhon Si Thammarat is about 102 MWh, 146 MWh, 173 MWh, and 127 MWh, respectively. In Koh Samui, sites (S2, S3, S6–S8) inspected by WAsP have great potential for a wind farm facility with a net AEP of about 180 MWh to 226 MWh. As mentioned previously, Koh Samui is an island and a famous tourist point. Hence, it is linked by an underwater cable to the mainland power plant in Surat Thani. An array of 10 or more 80 kW small–scale wind turbines integrated with other renewables, such as solar, can be used for generating electricity for Koh Samui Island. Furthermore, certain sites in Kanchanadit (S2, S3, and S8), Nakhon Si Thammarat (S4 and S5), and Chumphon (S1 and S2) show a net AEP of about 175 to 204 MWh, 197 to 205 MWh, and 188 to 232 MWh, respectively. These sites have great potential for prospective wind farm facility development.
In central stations, Songkhla and Phatthalung show an average net AEP of about 216 MWh and 146 MWh, respectively. All the sites (S1 to S10) inspected by WAsP in Songkhla show great potential for a prospective wind farm facility with a net AEP of around 177 to 250 MWh, whereas certain sites (S1, S2, S6, and S8) in Phatthalung along the ridges in the northwest display a net AEP around 173 to 211 MWh, and also have very good potential for prospective wind farms.
In the southernmost stations, Yala, Narathiwat, and Pattani depict an average net AEP of about 198 MWh, 190 MWh, and 109 MWh, respectively. Sites along the ridges and mountainous areas in Yala (S1–S6) and Narathiwat (S2, S4, S8, and S9) possess a net AEP around 186 to 311 MWh and 197 to 282 MWh, respectively. These sites show the highest potential for prospective wind farm development. Furthermore, Pattani has only one site (S2) on a mountain peak with a net AEP around 218 MWh, and this site is expected to have good potential for wind farm development in the future.
South–eastern Thailand has a population of more than 7.1 million. It is one of the highest power–consuming regions in Thailand and receives many tourists throughout the year due to popular destinations such as Koh Samui, Koh Pha Ngan, and Koh Tao. As reported by the Electricity Generating Authority Thailand, power demand has been increasing by 5 to 6% in southern Thailand annually, due to the development of services and tourism. Hence, the prospective sites scrutinized by WAsP could reduce the burden on the local power distribution stations and would be sufficient to meet the rising power demand in south–eastern Thailand.
Meanwhile, the capacity factor of the wind turbine is defined as the dimensionless ratio of the average power output and the rated power output over a certain period of time (usually over one year) and can be expressed as [55,56]:
where , , and are the cut–in wind speed, cut–out wind speed, and rated wind speed, respectively. Similarly, signifies the Weibull scale parameter and is the dimensionless Weibull shape parameter. Then, the average power output can be expressed as:
Once the value of the average power output is known, the average gross energy production of a wind turbine can be estimated for a specific duration as:
Moreover, , where and represent the time span in hours and in days, respectively.
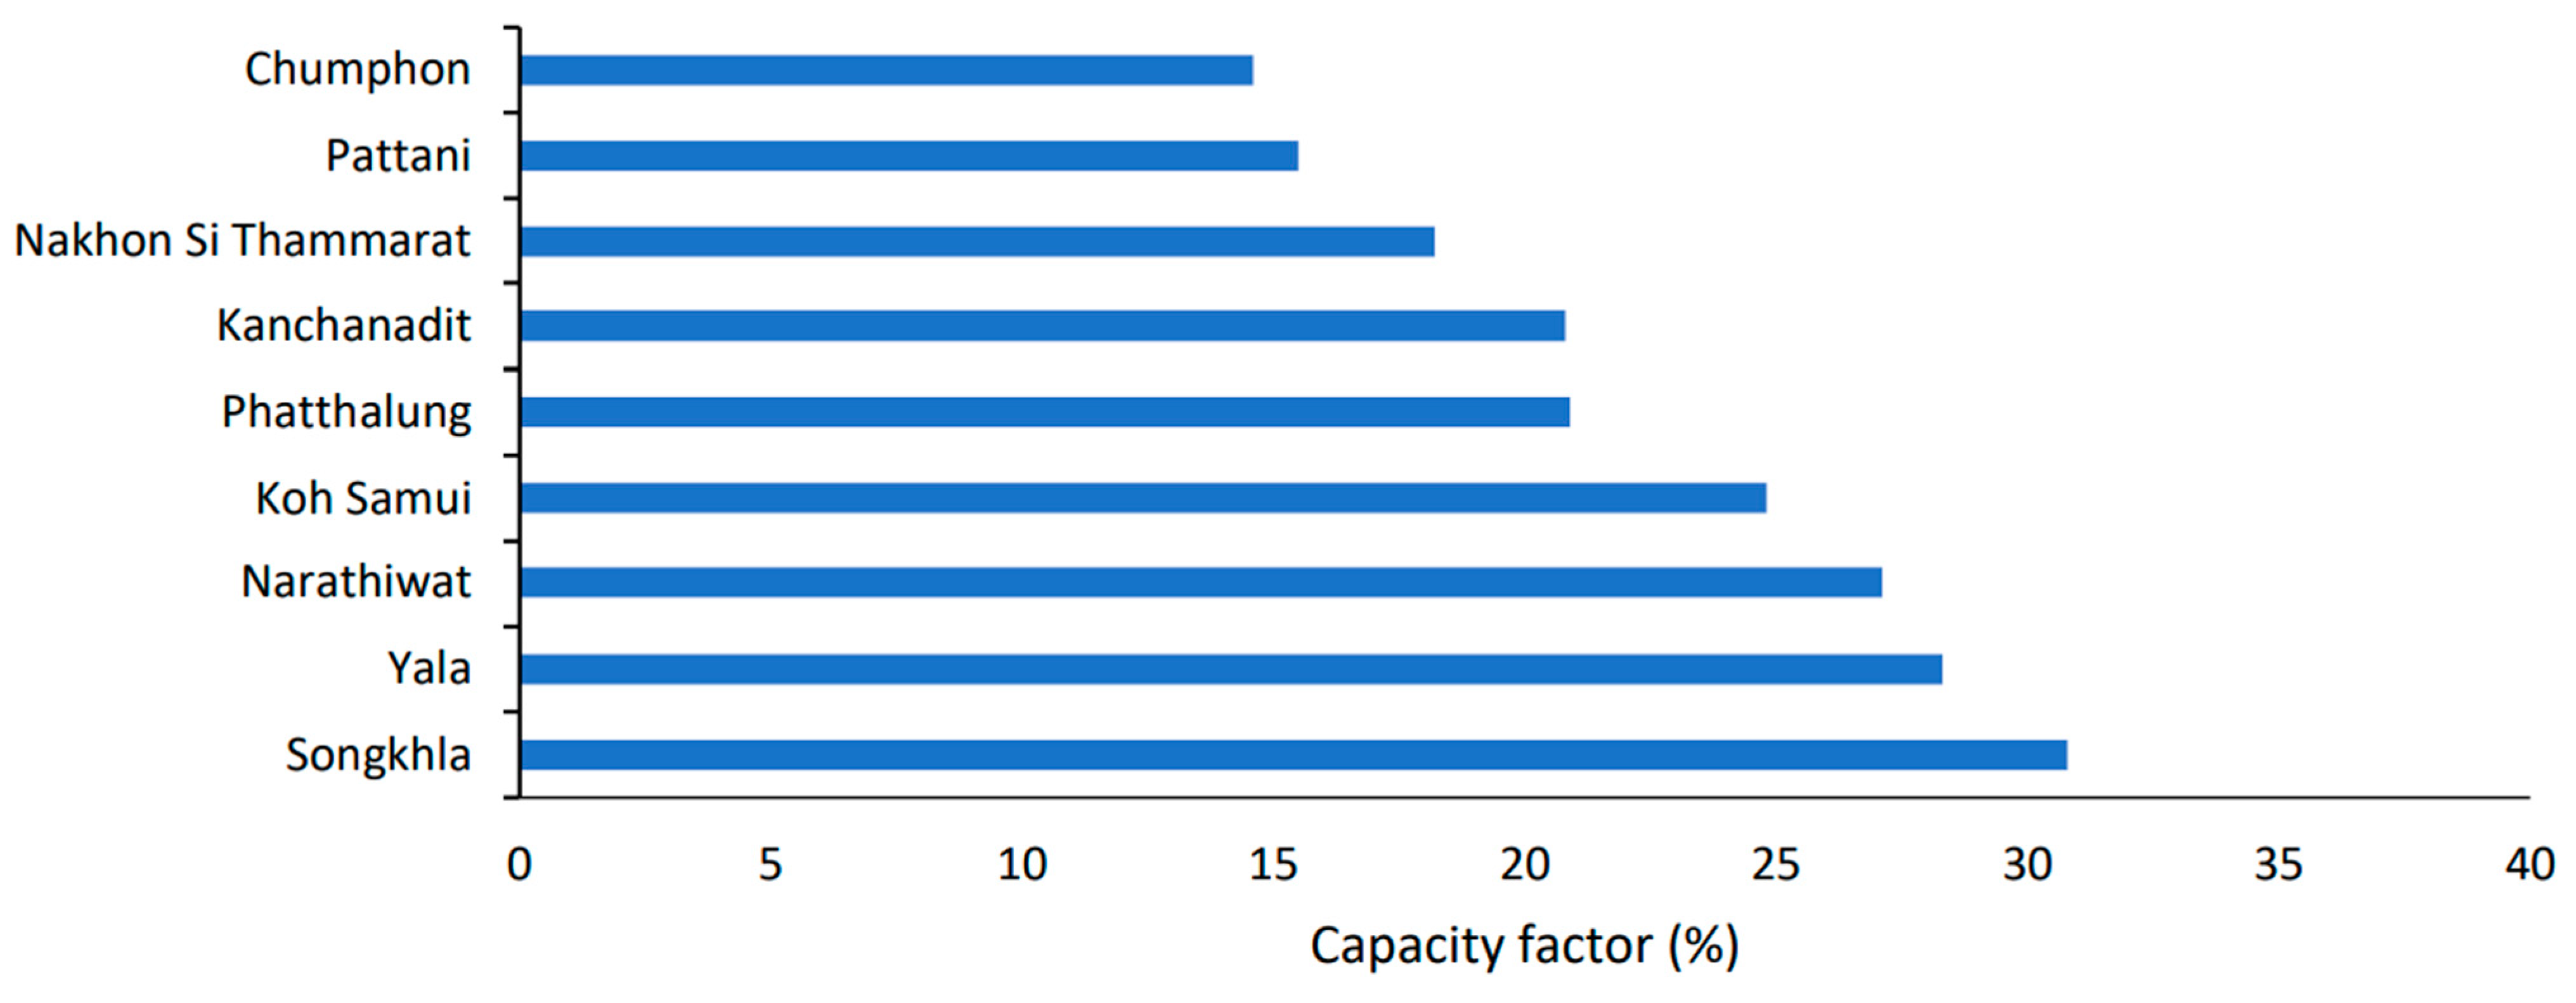
The capacity factor mainly depends on the wind resources and wind turbine technology. An annual capacity factor of 17% or greater is considered desirable for wind power [25]. This study computed the annual capacity factors of the nine stations in south–eastern Thailand at the 28.5 m hub height using the WAsP program. The results show that Songkhla, Yala, and Narathiwat have annual capacity factors of 27% or over. Koh Samui, Phatthalung, and Kanchanadit have annual capacity factors ranging between 20% and 25%, whereas Nakhon Si Thammarat, Pattani, and Chumphon have annual capacity factors of 18%, 16%, and 15%, respectively (Figure 11).
3.3. LCOE Analysis
In this section, an economic analysis is presented for the installations of the prospective small–scale wind turbines in south–eastern Thailand. LCOE has been calculated for the selected sites using Equation (6) and Table 3, as described in the methodology section, whereas the annual energy yield and capacity factor of the chosen sites were computed using the WAsP module. Using the Enercon E–18 wind turbine model, the lowest LCOE is 92.31 $/MWh to 128.89 $/MWh for Songkhla while the highest LCOE is 189.49 $/MWh to 246.52 $/MWh for Chumphon. Further details of LCOE calculation for the selected sites can be seen in Table 6.
The principal objective of this study was to analyze the prospects of wind power production at low heights. The geographical positioning of Thailand, like other tropical regions, lacks access to high wind speeds [10]. Therefore, in this study, the low wind profile of the study region was considered. As mentioned earlier, there was no evidence of low–speed wind power studies in southern Thailand. Most of the previous studies [9,10,19,20,21,22] were concentrated on making academic contributions rather than taking into consideration the practicality of research with a view to providing a cost–effective renewable wind energy solution.
In addition, the domestic and international investment in renewable wind energy has been a challenge in Thailand because of the associated multi–million–dollar investments in large–scale wind power infrastructures as well as the volatile wind speed at heights. However, the findings of this study suggest the prospect of shifting wind energy strategies to exploit the readily available low–speed wind. Additionally, it is pertinent to note that sites evolved during this research are in proximity to roads and the transmission infrastructure, as both are essential for the transportation of materials and power, whereas building new infrastructure will ultimately increase the overall cost of the project. Furthermore, unlike previous studies, in this study, the approximate cost of the project has also been calculated for the understanding of the energy practitioners, investors, and researchers.
4. Conclusions
In this paper, a wind resource assessment was performed using WAsP software for nine stations in south–eastern Thailand. This study indicates that the regions on the leeward side and plain areas in south–eastern Thailand have poor potential for the establishment of a wind farm facility due to various artificial obstacles such as high–rise buildings and other urban infrastructure that make airflow highly turbulent and may affect the wind flow. However, mountain peaks and ridges show very good potential for the development of small–scale wind power. The maximum average wind speed is found from November to April, with low winds from May to October. The prevailing wind direction observed in Chumphon and Nakhon Si Thammarat is northwest whereas it is southwest in Narathiwat and Yala. Similarly, the southeast direction is predominant in Kanchanadit, Pattani, and Songkhla. The northwest–southeast bi–directional wind rose is very pronounced for Yala, while the dominant direction in Koh Samui is west.
This work used WAsP software for the analyses, to create wind resource maps for south–eastern Thailand with ten sites earmarked around each weather station for wind farm facility implementations in future. The wind resource maps at a 28.5 m hub height indicate the highest annual mean wind power density with a value of 802 W/m2 was found in Phatthalung, which belongs to wind class 7, followed by Yala with a value of 474 W/m2 and Kanchanadit with a value of 429 W/m2 that fall in wind class 4. The minimum annual mean wind power density was recorded in Chumphon and Pattani and both stations belong to wind class 1, while Nakhon Si Thammarat with a value of 271 W/m2 falls in wind class 2. Similarly, Narathiwat, Songkhla, and Koh Samui had values of 390 W/m2, 378 W/m2, and 350 W/m2, respectively, and belong to wind class 3.
Furthermore, the annual capacity factor of the chosen sites using the Enercon E–18 wind turbine with a rated power of 80 kW was such that Songkhla, Yala, and Narathiwat have annual capacity factors of 27% or over. Koh Samui, Phatthalung, and Kanchanadit have annual capacity factors ranging between 20% and 25%, whereas Nakhon Si Thammarat, Pattani, and Chumphon have annual capacity factors of 18%, 16%, and 15%, respectively. The LCOE calculation shows Songkhla had the lowest cost of 92.31 to 128.89 $/MWh while Chumphon had the highest cost of 189.49 to 246.52 $/MWh. This methodology can be advanced further by using WAsP CFD simulations in complex terrain to maximize production and minimize uncertainty.
The findings of this research are likely to promote the idea that regions near the equator, such as Thailand, can exploit wind energy to decrease their reliance on natural gas, coal, and lignite in the future. The method used in this work is scientific in its approach and is an effective tool for government organizations and stakeholders in prospective small–scale wind farm implementations in south–eastern Thailand. The approach demonstrated could also be used in wind resource assessments for other parts of the world.
Author Contributions
Investigation, Methodology, Data curation and Data analysis, I.K.; Economic analysis, I.K. and S.A.; Resources and Supervision, J.T.; Proofreading, J.T. and H.M.A. All authors have read and agreed to the published version of the manuscript.
Funding
This research was part of Ph.D. study, supported by Interdisciplinary Graduate School (IGS), Prince of Songkla University. Research was partially funded by Faculty of Engineering, Prince of Songkla University and the Graduate School, Prince of Songkla University with Graduate School thesis research funding.
Data Availability Statement
The data presented in this study are available in this article.
Acknowledgments
The authors would like to acknowledge the Thai Meteorological Department (TMD) for providing wind data for this research. The authors would also like to thank DTU WAsP team for technical support.
Conflicts of Interest
The authors declare that they have no known competing financial interests or personal relationships that could have appeared to influence the work reported in this paper.
References
- Saeed, M.A.; Ahmed, Z.; Hussain, S.; Zhang, W. Wind resource assessment and economic analysis for wind energy development in Pakistan. Sustain. Energy Technol. Assess. 2021, 44, 101068. [Google Scholar] [CrossRef]
- Tang, X.-Y.; Zhao, S.; Fan, B.; Peinke, J.; Stoevesandt, B. Micro-scale wind resource assessment in complex terrain based on CFD coupled measurement from multiple masts. Appl. Energy 2019, 238, 806–815. [Google Scholar] [CrossRef]
- Murthy, K.; Rahi, O. A comprehensive review of wind resource assessment. Renew. Sustain. Energy Rev. 2017, 72, 1320–1342. [Google Scholar] [CrossRef]
- Jung, C.; Schindler, D. Introducing a new approach for wind energy potential assessment under climate change at the wind turbine scale. Energy Convers. Manag. 2020, 225, 113425. [Google Scholar] [CrossRef]
- Mekonnen, M.M.; Gerbens-Leenes, W.; Hoekstra, A. Future electricity: The challenge of reducing both carbon and water footprint. Sci. Total Environ. 2016, 569–570, 1282–1288. [Google Scholar] [CrossRef] [PubMed] [Green Version]
- Saeed, M.A.; Ahmed, Z.; Zhang, W. Optimal approach for wind resource assessment using Kolmogorov–Smirnov statistic: A case study for large-scale wind farm in Pakistan. Renew. Energy 2021, 168, 1229–1248. [Google Scholar] [CrossRef]
- Morales-Ruvalcaba, C.; Rodríguez-Hernández, O.; Martínez-Alvarado, O.; Drew, D.; Ramos, E. Estimating wind speed and capacity factors in Mexico using reanalysis data. Energy Sustain. Dev. 2020, 58, 158–166. [Google Scholar] [CrossRef]
- Waewsak, J.; Ali, S.; Natee, W.; Kongruang, C.; Chancham, C.; Gagnon, Y. Assessment of hybrid, firm renewable energy-based power plants: Application in the southernmost region of Thailand. Renew. Sustain. Energy Rev. 2020, 130, 109953. [Google Scholar] [CrossRef]
- Janjai, S.; Masiri, I.; Promsen, W.; Pattarapanitchai, S.; Pankaew, P.; Laksanaboonsong, J.; Bischoff-Gauss, I.; Kalthoff, N. Evaluation of wind energy potential over Thailand by using an atmospheric mesoscale model and a GIS approach. J. Wind. Eng. Ind. Aerodyn. 2014, 129, 1–10. [Google Scholar] [CrossRef]
- Ali, S.; Taweekun, J.; Techato, K.; Waewsak, J.; Gyawali, S. GIS based site suitability assessment for wind and solar farms in Songkhla, Thailand. Renew. Energy 2019, 132, 1360–1372. [Google Scholar] [CrossRef]
- EGAT. Power for Happiness; EGAT: Nonthaburi, Thailand, 2019. [Google Scholar]
- PDP. Thailand Power Development Plan 2018–2037 (PDP2018: Revision 1); PDP: Bangkok, Thailand, 2018. Available online: https://www.egat.co.th/images/businessop/PDP2018-Rev1-Oct2020.pdf (accessed on 13 March 2021).
- EPPO. Energy Policy and Planning Office. Ministry of Energy; 2021. Available online: http://www.eppo.go.th/index.php/en/ (accessed on 10 July 2021).
- AEDP. Alternative Energy Development Plan. Ministry of Energy 2012, 7, 1–10. Available online: http://www.eppo.go.th/index.php/en/policy-and-plan/en-tieb/tieb-aedp (accessed on 13 June 2021).
- DEDE. Department of Alternative Energy Development and Efficiency. Ministry of Energy; 2021; pp. 1–29. Available online: http://weben.dede.go.th/webmax/ (accessed on 17 May 2021).
- Chingulpitak, S.; Wongwises, S. Critical review of the current status of wind energy in Thailand. Renew. Sustain. Energy Rev. 2014, 31, 312–318. [Google Scholar] [CrossRef]
- TMD. Thai Meteorological Report; TMD: Bangkok, Thailand, 2018; pp. 1–11.
- EGAT. Why Does the South of Thailand Need Coal-Fired Power Plants? 2018. Available online: https://www.egat.co.th/en/news-announcement/egat-reasons-why/why-does-the-south-of-thailand-need-coal-fired-power-plants (accessed on 17 July 2020).
- Waewsak, J.; Kongruang, C.; Gagnon, Y. Assessment of wind power plants with limited wind resources in developing countries: Application to Ko Yai in southern Thailand. Sustain. Energy Technol. Assess. 2017, 19, 79–93. [Google Scholar] [CrossRef]
- Glassbrook, K.A.; Carr, A.H.; Drosnes, M.L.; Oakley, T.R.; Kamens, R.M.; Gheewala, S.H. Life cycle assessment and feasibility study of small wind power in Thailand. Energy Sustain. Dev. 2014, 22, 66–73. [Google Scholar] [CrossRef]
- Quan, P.; Leephakpreeda, T. Assessment of wind energy potential for selecting wind turbines: An application to Thailand. Sustain. Energy Technol. Assess. 2015, 11, 17–26. [Google Scholar] [CrossRef]
- Bennui, A.; Rattanamanee, P.; Puetpaiboon, U.; Phukpattaranont, P.; Chetpattananondh, K. Site selection for large wind turbine using GIS. In Proceedings of the PSU-UNS International Conference on Engineering and Environment, Songkhla, Thailand, 10–11 May 2007. [Google Scholar]
- Yang, L.; Rojas, J.I.; Montlaur, A. Advanced methodology for wind resource assessment near hydroelectric dams in complex mountainous areas. Energy 2020, 190, 116487. [Google Scholar] [CrossRef]
- Ashtine, M.; Bello, R.; Higuchi, K. Assessment of wind energy potential over Ontario and Great Lakes using the NARR data: 1980–2012. Renew. Sustain. Energy Rev. 2016, 56, 272–282. [Google Scholar] [CrossRef]
- Ko, D.H.; Jeong, S.T.; Kim, Y.C. Assessment of wind energy for small-scale wind power in Chuuk State, Micronesia. Renew. Sustain. Energy Rev. 2015, 52, 613–622. [Google Scholar] [CrossRef]
- Flay, R.G.; King, A.B.; Revell, M.; Carpenter, P.; Turner, R.; Cenek, P.; Pirooz, A.A.S. Wind speed measurements and predictions over Belmont Hill, Wellington, New Zealand. J. Wind. Eng. Ind. Aerodyn. 2019, 195, 104018. [Google Scholar] [CrossRef]
- Rogers, T.; Ashtine, M.; Koon, R.K.; Atherley-Ikechi, M. Onshore wind energy potential for Small Island Developing States: Findings and recommendations from Barbados. Energy Sustain. Dev. 2019, 52, 116–127. [Google Scholar] [CrossRef]
- Bruck, M.; Sandborn, P.; Goudarzi, N. A Levelized Cost of Energy (LCOE) model for wind farms that include Power Purchase Agreements (PPAs). Renew. Energy 2018, 122, 131–139. [Google Scholar] [CrossRef]
- Mortensen, N.G. Wind Resource Assessment Using the WAsP Software (DTU Wind Energy E-0135); Technical University of Denmark: Copenhagen, Denmark, 2018; p. 43. [Google Scholar]
- Liu, J.; Gao, C.Y.; Ren, J.; Gao, Z.; Liang, H.; Wang, L. Wind resource potential assessment using a long term tower measurement approach: A case study of Beijing in China. J. Clean. Prod. 2018, 174, 917–926. [Google Scholar] [CrossRef]
- Fang, H.-F. Wind energy potential assessment for the offshore areas of Taiwan west coast and Penghu Archipelago. Renew. Energy 2014, 67, 237–241. [Google Scholar] [CrossRef]
- Romanic, D.; Parvu, D.; Refan, M.; Hangan, H. Wind and tornado climatologies and wind resource modelling for a modern development situated in “Tornado Alley”. Renew. Energy 2018, 115, 97–112. [Google Scholar] [CrossRef]
- Galvez, G.H.; Flores, R.S.; Miranda, U.M.; Martínez, O.S.; Téllez, M.C.; López, D.A.; Gómez, A.K.T. Wind resource assessment and sensitivity analysis of the levelised cost of energy. A case study in Tabasco, Mexico. Renew. Energy Focus 2019, 29, 94–106. [Google Scholar] [CrossRef]
- Ramadan, H. Wind energy farm sizing and resource assessment for optimal energy yield in Sinai Peninsula, Egypt. J. Clean. Prod. 2017, 161, 1283–1293. [Google Scholar] [CrossRef]
- Sharma, K.; Ahmed, M.R. Wind energy resource assessment for the Fiji Islands: Kadavu Island and Suva Peninsula. Renew. Energy 2016, 89, 168–180. [Google Scholar] [CrossRef]
- Verma, M. Wind Farm Repowering Using WAsP Software—An Approach for Reducing CO2 Emissions in the Environment, in Encyclopedia of Renewable and Sustainable Materials; Hashmi, S., Choudhury, I.A., Eds.; Elsevier: Amsterdam, The Netherlands, 2020; pp. 844–859. [Google Scholar]
- Himri, Y.; Merzouk, M.; Merzouk, N.K.; Himri, S. Potential and economic feasibility of wind energy in south West region of Algeria. Sustain. Energy Technol. Assess. 2020, 38, 100643. [Google Scholar] [CrossRef]
- Kamdar, I.; Ali, S.; Bennui, A.; Techato, K.; Jutidamrongphan, W. Municipal solid waste landfill siting using an integrated GIS-AHP approach: A case study from Songkhla, Thailand. Resour. Conserv. Recycl. 2019, 149, 220–235. [Google Scholar] [CrossRef]
- Mahmood, F.H.; Resen, A.; Khamees, A.B. Wind characteristic analysis based on Weibull distribution of Al-Salman site, Iraq. Energy Rep. 2020, 6, 79–87. [Google Scholar] [CrossRef]
- TMD. Specifications of the Measuring Equipment; TMD: Bangkok, Thailand, 2018; pp. 1–20.
- TMD. Thai Meteorological Department Automatic Weather Station (TMD AWS). Available online: http://www.aws-observation.tmd.go.th/web/main/index.asp (accessed on 21 March 2021).
- Mathew, S. Wind Energy: Fundamentals, Resource Analysis and Economics, 1st ed.; Springer: Berlin/Heidelberg, Germany, 2006. [Google Scholar]
- Kapen, P.T.; Gouajio, M.J.; Yemélé, D. Analysis and efficient comparison of ten numerical methods in estimating Weibull parameters for wind energy potential: Application to the city of Bafoussam, Cameroon. Renew. Energy 2020, 159, 1188–1198. [Google Scholar] [CrossRef]
- Petersen, E.L.; Troen, I. European wind atlas. In Wind Energy-2nd Contractors’ Meeting; Harwood Academic Publishers: Harwood, ON, Canada, 1988. [Google Scholar]
- Sveinbjornsson, S.K. Analysis of WAsP (Wind Atlas Analysis and Application Program) in Complex Topographical Conditions Using Measured Production from a Large Scale Wind Farm. Master’s Thesis, University of Washington, Seattle, WA, USA, 2013. [Google Scholar]
- Jackson, P.S.; Hunt, J.C.R. Turbulent wind flow over a low hill. Q. J. R. Meteorol. Soc. 1975, 101, 929–955. [Google Scholar] [CrossRef]
- Mortensen, N.G. Wind Resource Assessment Using WAsP Software. (DTU Wind Energy E-0135); Technical University of Denmark: Copenhagen, Denmark, 2020. [Google Scholar]
- Tran, T.T.; Smith, A.D. Incorporating performance-based global sensitivity and uncertainty analysis into LCOE calculations for emerging renewable energy technologies. Appl. Energy 2018, 216, 157–171. [Google Scholar] [CrossRef]
- Katinas, V.; Gecevicius, G.; Marciukaitis, M. An investigation of wind power density distribution at location with low and high wind speeds using statistical model. Appl. Energy 2018, 218, 442–451. [Google Scholar] [CrossRef]
- Irwanto, M.; Gomesh, N.; Mamat, M.; Yusoff, Y. Assessment of wind power generation potential in Perlis, Malaysia. Renew. Sustain. Energy Rev. 2014, 38, 296–308. [Google Scholar] [CrossRef]
- Costoya, X.; Decastro, M.; Carvalho, D.; Gómez-Gesteira, M. On the suitability of offshore wind energy resource in the United States of America for the 21st century. Appl. Energy 2020, 262, 114537. [Google Scholar] [CrossRef]
- Yu, X.; Qu, H. Wind power in China—Opportunity goes with challenge. Renew. Sustain. Energy Rev. 2010, 14, 2232–2237. [Google Scholar] [CrossRef]
- Kamdar, I.; Taweekun, J. Assessment of wind energy potential of Hat Yai (Songkhla), Thailand. IOP Conf. Ser. Mater. Sci. Eng. 2021, 1163, 012001. [Google Scholar] [CrossRef]
- Tummala, A.; Velamati, R.K.; Sinha, D.K.; Indraja, V.; Krishna, V.H. A review on small scale wind turbines. Renew. Sustain. Energy Rev. 2016, 56, 1351–1371. [Google Scholar] [CrossRef]
- Lopez-Villalobos, C.; Rodriguez-Hernandez, O.; Martínez-Alvarado, O.; Hernandez-Yepes, J. Effects of wind power spectrum analysis over resource assessment. Renew. Energy 2021, 167, 761–773. [Google Scholar] [CrossRef]
- Boudia, S.M.; Benmansour, A.; Hellal, M.A.T. Wind resource assessment in Algeria. Sustain. Cities Soc. 2016, 22, 171–183. [Google Scholar] [CrossRef]
Figure 2.
Flow diagram of the proposed scheme.

Figure 4.
Elevation maps of the study area: (a) Chumphon, (b) Kanchanadit, (c) Koh Samui, (d) Nakhon Si Thammarat, (e) Narathiwat, (f) Pattani, (g) Phatthalung, (h) Songkhla, (i) Yala.
Figure 4.
Elevation maps of the study area: (a) Chumphon, (b) Kanchanadit, (c) Koh Samui, (d) Nakhon Si Thammarat, (e) Narathiwat, (f) Pattani, (g) Phatthalung, (h) Songkhla, (i) Yala.


Figure 5.
Surface roughness maps of the study area: (a) Chumphon, (b) Kanchanadit, (c) Koh Samui, (d) Nakhon Si Thammarat, (e) Narathiwat, (f) Pattani, (g) Phatthalung, (h) Songkhla, (i) Yala.
Figure 5.
Surface roughness maps of the study area: (a) Chumphon, (b) Kanchanadit, (c) Koh Samui, (d) Nakhon Si Thammarat, (e) Narathiwat, (f) Pattani, (g) Phatthalung, (h) Songkhla, (i) Yala.


Figure 6.
Monthly average wind speed at 10 m AGL.

Figure 7.
Wind rose diagrams of south–eastern Thailand: (a) Chumphon, (b) Kanchanadit, (c) Koh Samui, (d) Nakhon Si Thammarat, (e) Narathiwat, (f) Pattani, (g) Phatthalung, (h) Songkhla, and (i) Yala.
Figure 7.
Wind rose diagrams of south–eastern Thailand: (a) Chumphon, (b) Kanchanadit, (c) Koh Samui, (d) Nakhon Si Thammarat, (e) Narathiwat, (f) Pattani, (g) Phatthalung, (h) Songkhla, and (i) Yala.


Figure 8.
Annual mean wind power density of south–eastern Thailand at 28.5 m hub height.

Figure 9.
High–resolution wind speed maps of the study area at 28.5 m hub height: (a) Chumphon, (b) Kanchanadit, (c) Koh Samui, (d) Nakhon Si Thammarat, (e) Narathiwat, (f) Pattani, (g) Phatthalung, (h) Songkhla, and (i) Yala.
Figure 9.
High–resolution wind speed maps of the study area at 28.5 m hub height: (a) Chumphon, (b) Kanchanadit, (c) Koh Samui, (d) Nakhon Si Thammarat, (e) Narathiwat, (f) Pattani, (g) Phatthalung, (h) Songkhla, and (i) Yala.


Figure 10.
Net AEP of the selected sites in south–eastern Thailand at a hub height of 28 m.

Figure 11.
Capacity factors at south–eastern Thailand specific sites assuming Enercon E–18 wind turbine at a hub height of 28.5 m.
Figure 11.
Capacity factors at south–eastern Thailand specific sites assuming Enercon E–18 wind turbine at a hub height of 28.5 m.


Table 1.
Tool specifications obtained from Thai Meteorological Department [40].
Table 1.
Tool specifications obtained from Thai Meteorological Department [40].
| Equipment | Sensor Type | Instrument Range | Accuracy | Height (AGL) |
|---|---|---|---|---|
| Anemometer | Ultrasonic sensor | 0–75 m/s | ±2% | 10 m |
| Wind vane | Ultrasonic sensor | 0–360° | ±2% | |
| Thermometer | Platinum resistance element | −40 °C to 50 °C | ±0.3 °C | |
| Barometer | Digital | 800–1100 hPa | ±0.2 | |
| Relative humidity | Thin film | 0–100% RH | ±2% RH | |
| Rain gauge | Tumbling cup | 0–100 mm/h | 2% |
Table 2.
Geographical coordinates and description of measurement sites in south–eastern Thailand (obtained from Thai Meteorological Department [41]).
Table 2.
Geographical coordinates and description of measurement sites in south–eastern Thailand (obtained from Thai Meteorological Department [41]).
| Station Name | Latitude (ᵒ) | Longitude (ᵒ) | Altitude (m a.s.l.) | Measurement Period |
|---|---|---|---|---|
| Chumphon | 10.49 | 99.18 | 22 | 2017–2019 |
| Kanchanadit | 9.18 | 99.73 | 27 | 2017–2019 |
| Koh Samui | 9.45 | 100.03 | 6 | 2017–2019 |
| Nakhon Si Thammarat | 8.54 | 99.93 | 5 | 2017–2019 |
| Narathiwat | 6.41 | 101.81 | 5.13 | 2017–2019 |
| Pattani | 6.78 | 101.15 | 6 | 2017–2019 |
| Phatthalung | 7.58 | 100.16 | 4.15 | 2017–2019 |
| Songkhla | 7.18 | 100.60 | 6 | 2017–2019 |
| Yala | 6.51 | 101.28 | 36.04 | 2017–2019 |
Note: a.s.l.: Above sea level.
Table 3.
Variables for the estimation of the LCOE.
| Parameters | CAPEX | Fixed OPEX | Variable OPEX | Capacity Factor | Lifetime |
|---|---|---|---|---|---|
| Million $/MW | $/kW–yr | $/MWh | % | (t) yr | |
| Wind | 2.52 | 10.28–60.0 | 4.82–23.0 | 26.0–52.0 | 25 |
| Exchange rate | 31.24 (THB/$) | – | – | – | – |
| Discount rate | 7.5 (%) | – | – | – | – |
| FiTFix | 1.81 | – | – | – | – |
| FiTVar | 1.85 | – | – | – | – |
Adapted from Ref. [8]. Note: LCOE: Levelized Cost of Energy, CAPEX: Capital Expenditures, Fixed OPEX: Fixed Operating Expenses, Variable OPEX: Variable Operating Expenses, Year: yr, THB/$: Thai Baht/Dollar, FiTFix: Fixed Feed–in Tariff, FiTVar: Variable Feed–in Tariff, MW: Megawatt, kW: Kilowatt, MWh: Megawatt hour.
| Wind Power Class | Mean Wind Speed (m/s) | Wind Power Density (W/m2) | Resource Potential |
|---|---|---|---|
| 1 | 3.5–5.6 | 50–200 | Poor |
| 2 | 5.6–6.4 | 200–300 | Marginal |
| 3 | 6.4–7.0 | 300–400 | Fair |
| 4 | 7.0–7.5 | 400–500 | Good |
| 5 | 7.5–8.0 | 500–600 | Excellent |
| 6 | 8.0–8.8 | 600–800 | Outstanding |
| 7 | Above 8.8 | Above 800 | Superb |
Table 5.
Enercon E–18 wind turbine specifications.
| Rotor Diameter | Hub Height | Cut–In Speed | Cut–Out Speed | Survival Wind Speed | Rated Power | Rated Wind Speed |
|---|---|---|---|---|---|---|
| 18 m | 28.5 m | 2.5 m/s | 25.0 m/s | 67.0 m/s | 80 kW | 12.0 m/s |
Table 6.
Data for the calculation of LCOE.
| Sites | AEP (MWh) | CF (%) | LCOE ($/MWh) | |
|---|---|---|---|---|
| Fixed and Variable OPEX (Min.) | Fixed and Variable OPEX (Max.) | |||
| Chumphon | 102.32 | 14.61 | 189.49 | 246.52 |
| Kanchanadit | 146.03 | 20.83 | 134.35 | 179.78 |
| Koh Samui | 173.71 | 24.77 | 113.74 | 154.84 |
| Nakhon Si Thammarat | 127.91 | 18.25 | 152.66 | 201.94 |
| Narathiwat | 190.18 | 27.14 | 104.23 | 143.33 |
| Pattani | 109.05 | 15.54 | 178.44 | 233.14 |
| Phatthalung | 146.87 | 20.96 | 133.54 | 178.8 |
| Songkhla | 216.30 | 30.84 | 92.31 | 128.89 |
| Yala | 198.24 | 28.27 | 100.26 | 138.52 |
Publisher’s Note: MDPI stays neutral with regard to jurisdictional claims in published maps and institutional affiliations. |
© 2021 by the authors. Licensee MDPI, Basel, Switzerland. This article is an open access article distributed under the terms and conditions of the Creative Commons Attribution (CC BY) license (https://creativecommons.org/licenses/by/4.0/).
Share and Cite
MDPI and ACS Style
Kamdar, I.; Ali, S.; Taweekun, J.; Ali, H.M. Wind Farm Site Selection Using WAsP Tool for Application in the Tropical Region. Sustainability 2021, 13, 13718. https://doi.org/10.3390/su132413718
AMA Style
Kamdar I, Ali S, Taweekun J, Ali HM. Wind Farm Site Selection Using WAsP Tool for Application in the Tropical Region. Sustainability. 2021; 13(24):13718. https://doi.org/10.3390/su132413718
Chicago/Turabian StyleKamdar, Ismail, Shahid Ali, Juntakan Taweekun, and Hafiz Muhammad Ali. 2021. "Wind Farm Site Selection Using WAsP Tool for Application in the Tropical Region" Sustainability 13, no. 24: 13718. https://doi.org/10.3390/su132413718
Note that from the first issue of 2016, this journal uses article numbers instead of page numbers. See further details here.