
Ecosystem Service Modelling to Support Nature-Based Flood Water Management in the Vietnamese Mekong River Delta

 ,
,  , , and
Abstract
:1. Introduction
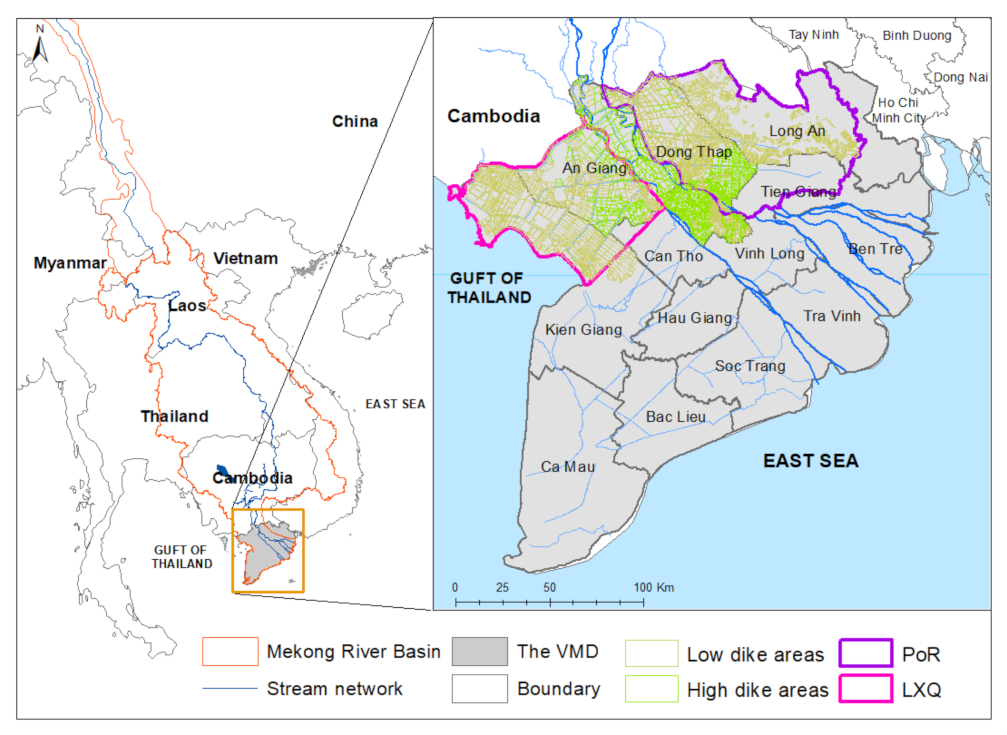
2. Study Area
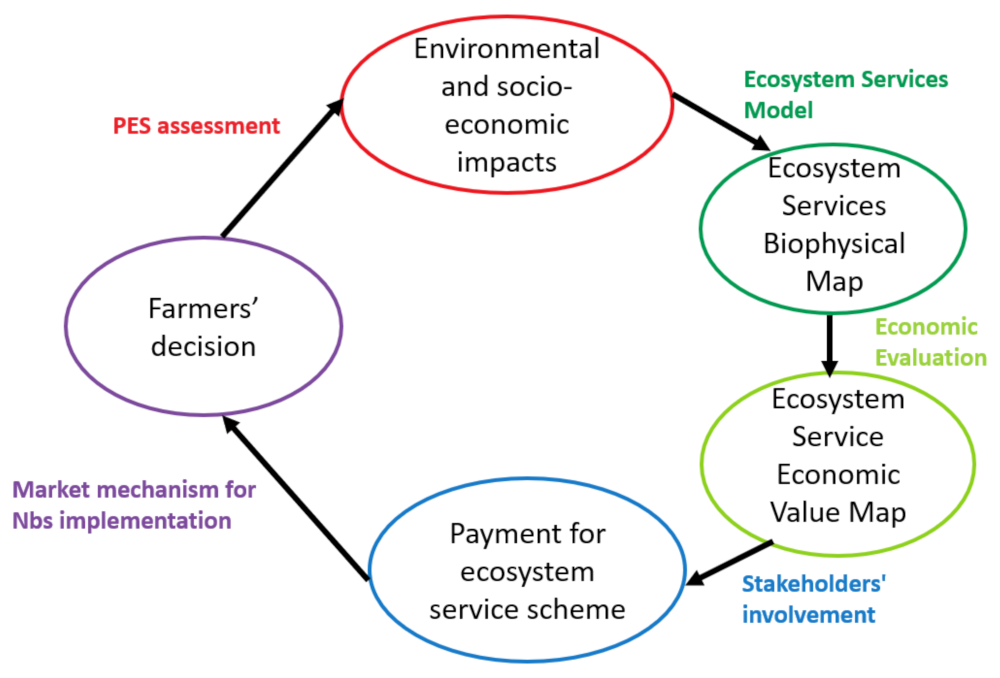
3. Methodology
3.1. Land Utilisation and Capacity Indicator—LUCI Model Overview
3.2. Data and Materials
3.3. Parameterising LUCI for Mapping Biophysical Value of ES in the VMD
3.3.1. Matching VMD Soil and LULC Datasets to Supported/Already Parameterised Datasets
3.3.2. User-Defined Parameterisation
3.4. Mapping Economic Values of Flood-Based Crops in Upper Streams of the VMD
4. Results and Discussion
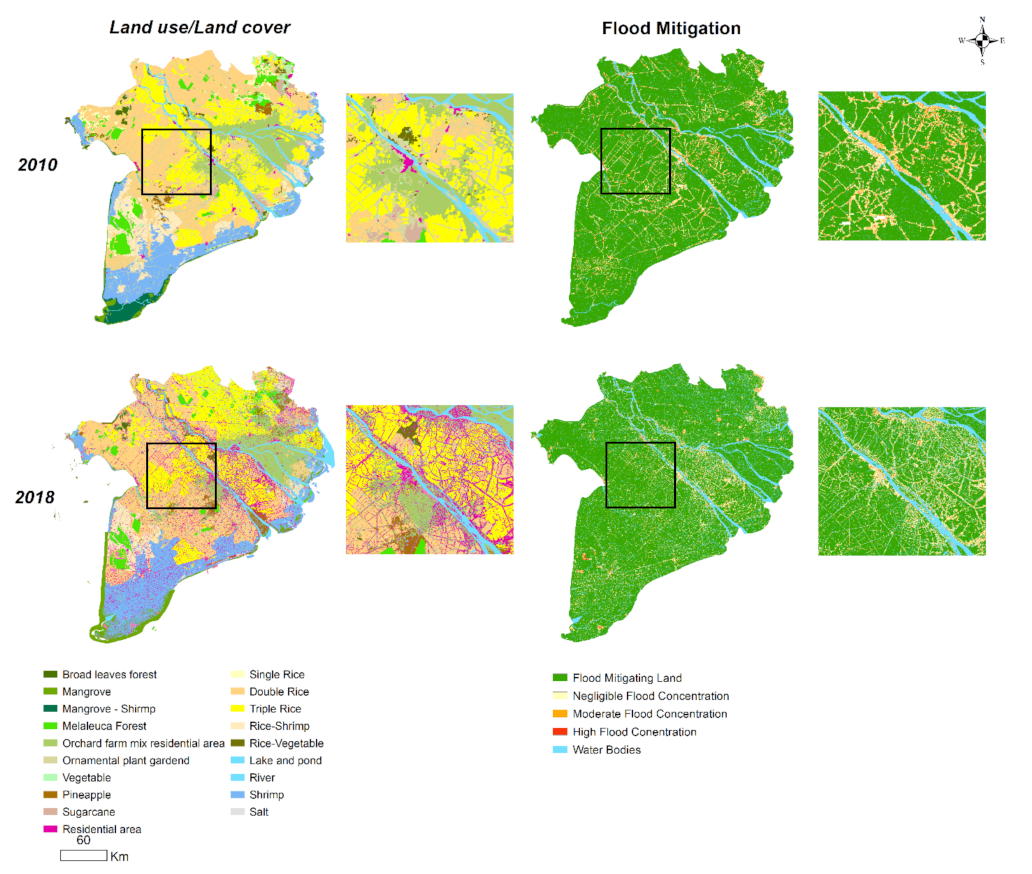
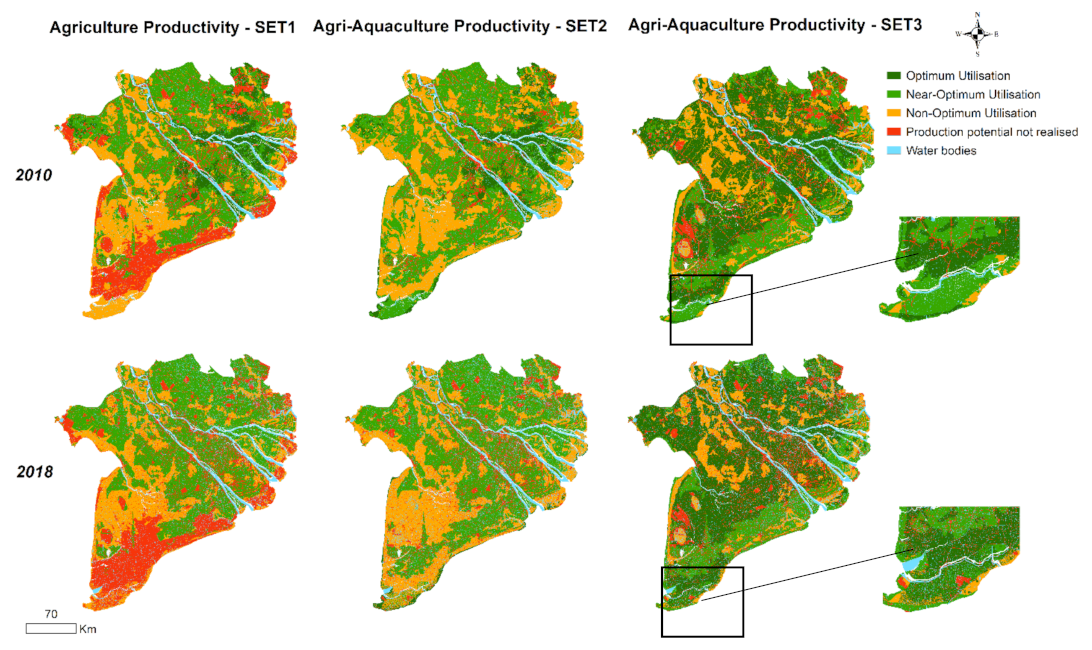
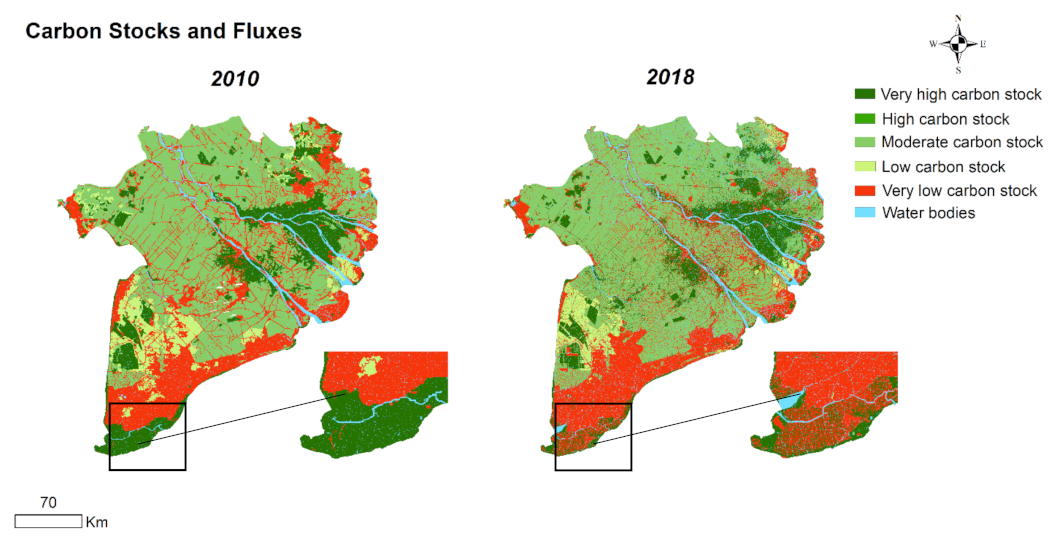
4.1. Ecosystem Service Biophysical Mapping
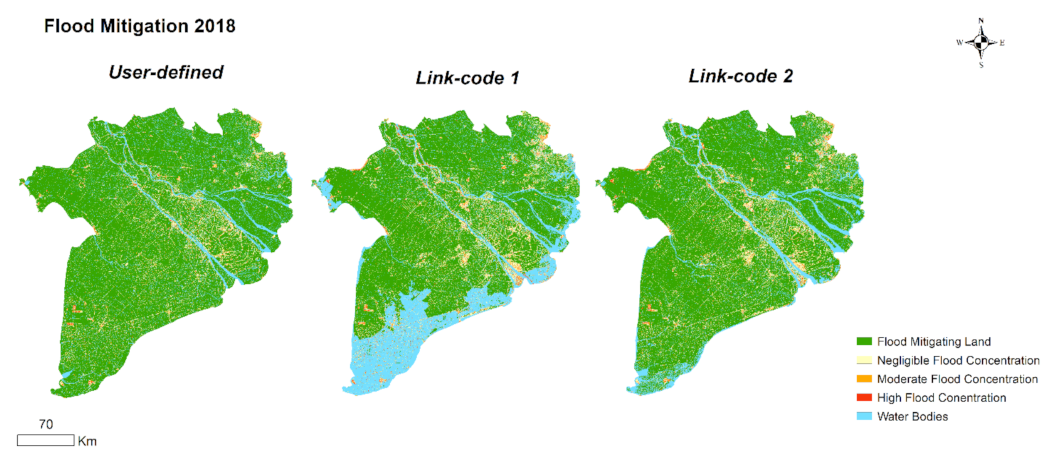
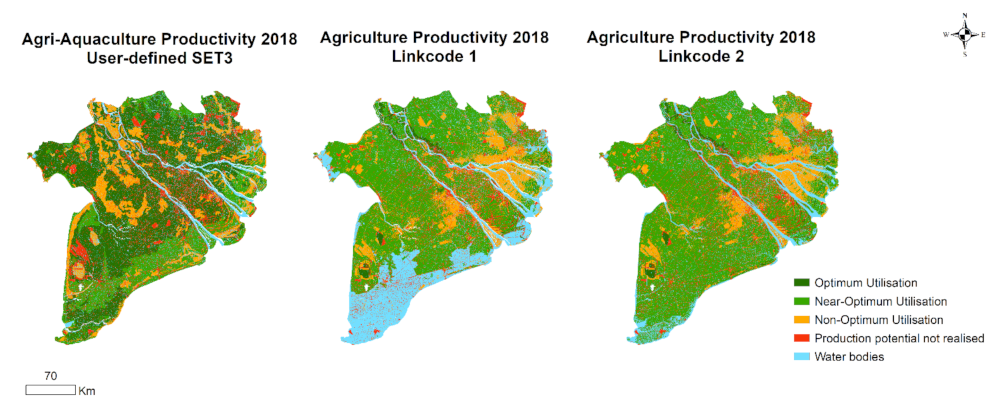
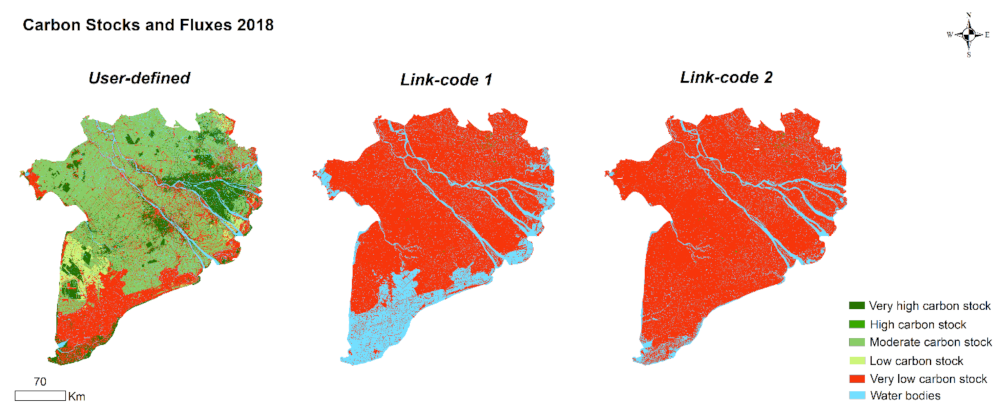
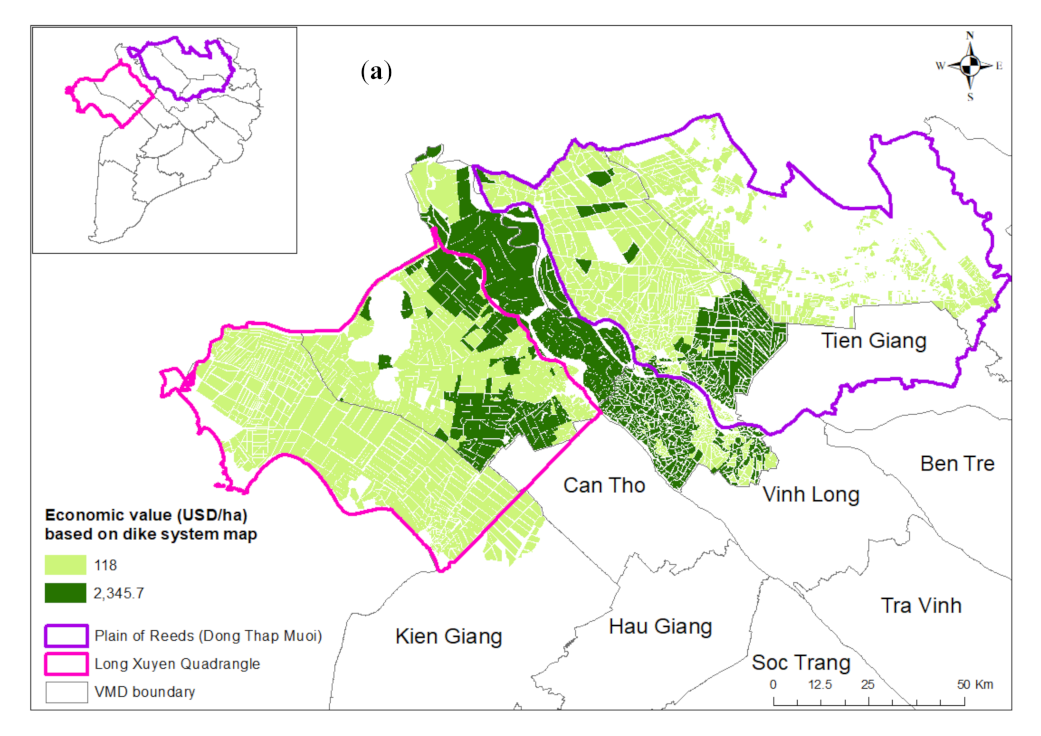
4.2. Mapping ES Values to Support PES Schemes in the Upper Part of the VMD
4.3. Recommendations to Improve LUCI to Better Adapt to the VMD and Delta and/or Tropical Geoclimatic Regions More Generally
5. Conclusions
Author Contributions
Funding
Institutional Review Board Statement
Informed Consent Statement
Data Availability Statement
Acknowledgments
Conflicts of Interest
References
- Edmonds, D.A.; Caldwell, R.L.; Brondizio, E.S.; Siani, S.M.O. Coastal flooding will disproportionately impact people on river deltas. Nat. Commun. 2020, 11, 4741. [Google Scholar] [CrossRef] [PubMed]
- Day, J.W.; Agboola, J.; Chen, Z.; D’Elia, C.; Forbes, D.L.; Giosan, L.; Kemp, P.; Kuenzer, C.; Lane, R.R.; Ramachandran, R.; et al. Approaches to defining deltaic sustainability in the 21st century. Estuarine Coast. Shelf Sci. 2016, 183, 275–291. [Google Scholar] [CrossRef]
- Ikeuchi, H.; Hirabayashi, Y.; Yamazaki, D.; Kiguchi, M.; Koirala, S.; Nagano, T.; Kotera, A.; Kanae, S. Modeling complex flow dynamics of fluvial floods exacerbated by sea level rise in the Ganges–Brahmaputra–Meghna Delta. Environ. Res. Lett. 2015, 10, 124011. [Google Scholar] [CrossRef]
- Trang, N.T.T.; Loc, H.H. Livelihood sustainability of rural households in adapting to environmental changes: An empirical analysis of ecological shrimp aquaculture model in the Vietnamese Mekong Delta. Environ. Dev. 2021, 39, 100653. [Google Scholar] [CrossRef]
- Van Staveren, M.F.; van Tatenhove, J.; Warner, J.F. The tenth dragon: Controlled seasonal flooding in long-term policy plans for the Vietnamese Mekong delta. J. Environ. Policy Plan. 2017, 20, 267–281. [Google Scholar] [CrossRef]
- Ekwueme, B.N.; Agunwamba, J.C. Modeling the influence of meteorological variables on runoff in a tropical watershed. Civ. Eng. J. 2020, 6, 2344–2351. [Google Scholar] [CrossRef]
- Wesselink, A.; Warner, J.F.; Syed, M.A.; Chan, F.; Tran, D.D.; Huq, H.; Huthoff, F.; Thuy, N.L.; Pinter, N.; Staveren, M.F.; et al. Trends in flood risk management in deltas around the world: Are we going soft? Int. J. Water Gov. 2015, 3, 25–46. [Google Scholar]
- Day, J.; Barras, J.; Clairain, E.; Johnston, J.; Justic, D.; Kemp, G.; Ko, J.-Y.; Lane, R.; Mitsch, W.; Steyer, G.; et al. Implications of Global Climatic Change and Energy Cost and Availability for the Restoration of the Mississippi Delta. Ecol Eng. 2005, 24, 253–265. [Google Scholar] [CrossRef]
- Van Staveren, M.F.; Warner, J.F.; Van Tatenhove, J.P.; Wester, P. Let’s bring in the floods: De-poldering in the Netherlands as a strategy for long-term delta survival? Water Int. 2014, 39, 686–700. [Google Scholar] [CrossRef]
- Brammer, H. After the Bangladesh Flood Action Plan: Looking to the future. Environ. Hazards 2010, 9, 118–130. [Google Scholar] [CrossRef]
- Rudra, K. Rivers of the Ganga-Brahmaputra-Meghna Delta A Fluvial Account of Bengal/by Kalyan Rudra; Springer International Publishing: Cham, Switzerland, 2018. [Google Scholar]
- Dang, K.B.; Burkhard, B.; Müller, F.; Dang, V.B. Modelling and mapping natural hazard regulating ecosystem services in Sapa, Lao Cai province, Vietnam. Paddy Water Environ. 2018, 16, 767–781. [Google Scholar] [CrossRef]
- Duro, A.; Piccione, V.; Ragusa, M.A.; Veneziano, V. New environmentally sensitive patch index-ESPI-for MEDALUS protocol. AIP Conf. Proc. 2014, 1637, 305–312. [Google Scholar]
- Gupta, H.; Dube, L.C. Benefits of Evaluating Ecosystem Services for Implementation of Nature-based Solutions Under the Paris Agreement. In Social-Ecological Systems (SES): From Risks and Insecurity to Viability and Resilience; Behnassi, M., Gupta, H., El Haiba, M., Ramachandran, G., Eds.; Springer International Publishing: Cham, Switzerland, 2021; pp. 39–56. [Google Scholar]
- Ronchi, S.; Arcidiacono, A. Adopting an Ecosystem Services-Based Approach for Flood Resilient Strategies: The Case of Rocinha Favela (Brazil). Sustainability 2018, 11, 4. [Google Scholar] [CrossRef] [Green Version]
- UNDRR. Ecosystem-Based Disaster Risk Reduction: Implementing Nature-Based Solutions for Resilience. 2020. Available online: https://www.undrr.org/publication/ecosystem-based-disaster-risk-reduction-implementing-nature-based-solutions-0 (accessed on 2 September 2021).
- Baustert, P.; Othoniel, B.; Rugani, B.; Leopold, U. Uncertainty analysis in integrated environmental models for ecosystem service assessments: Frameworks, challenges and gaps. Ecosyst. Serv. 2018, 33, 110–123. [Google Scholar] [CrossRef]
- IPBES. The Methodological Assessment Report on Scenarios and Models of Biodiversity And Ecosystem Services. 2016. Available online: https://www.ipbes.net (accessed on 2 September 2021).
- Shoyama, K.; Kamiyama, C.; Morimoto, J.; Ooba, M.; Okuro, T. A review of modeling approaches for ecosystem services assessment in the Asian region. Ecosyst. Serv. 2017, 26, 316–328. [Google Scholar] [CrossRef]
- Wood, S.L.; Jones, S.; Johnson, J.; Brauman, K.; Chaplin-Kramer, R.; Fremier, A.; Girvetz, E.; Gordon, L.; Kappel, C.; Mandle, L.; et al. Distilling the role of ecosystem services in the Sustainable Development Goals. Ecosyst. Serv. 2018, 29, 70–82. [Google Scholar] [CrossRef] [Green Version]
- Sharps, K.; Masante, D.; Thomas, A.; Jackson, B.; Redhead, J.; May, L.; Prosser, H.; Cosby, B.; Emmett, B.; Jones, L. Comparing strengths and weaknesses of three ecosystem services modelling tools in a diverse UK river catchment. Sci. Total. Environ. 2017, 584–585, 118–130. [Google Scholar] [CrossRef] [PubMed] [Green Version]
- Emmett, B.E.; The GMEP Team. Glastir Monitoring & Evaluation Programme Final Report; NERC/Centre for Ecology & Hydrology: Bailrigg, UK, 2017; Available online: http://nora.nerc.ac.uk/id/eprint/518194/ (accessed on 2 September 2021).
- La Notte, A.; Vallecillo, S.; Polce, C.; Zulian, G.; Maes, J. Implementing an EU System of Accounting for Ecosystems and Their Services. Initial Proposals for the Implementation of Ecosystem Services Accounts; Publications Office of the European Union: Luxembourg, 2017. [Google Scholar]
- Trodahl, M.I.; Jackson, B.M.; Deslippe, J.R.; Metherell, A.K. Investigating trade-offs between water quality and agricultural productivity using the Land Utilisation and Capability Indicator (LUCI)–A New Zealand application. Ecosyst. Serv. 2017, 26, 388–399. [Google Scholar] [CrossRef]
- Jackson, B.; Pagella, T.; Sinclair, F.; Orellana, B.; Henshaw, A.; Reynolds, B.; Mcintyre, N.; Wheater, H.; Eycott, A. Polyscape: A GIS mapping framework providing efficient and spatially explicit landscape-scale valuation of multiple ecosystem services. Landsc. Urban Plan. 2013, 112, 74–88. [Google Scholar] [CrossRef]
- Jackson, B.M.; Metherell, A.K.; Roberts, A.H.C.; Trodahl, M.I.; White, M. Adaption of the Luci Framework to Account for Detailed Farm Management: A Case Study Exploring Potential for Nutrient Mitigation Using Data from the Southland Demonstration Farm; Fertilizer and Lime Research Centre: Palmerston North, New Zealand, 2016. [Google Scholar]
- Tomscha, S.A.; Bentley, S.; Platzer, E.; Jackson, B.; De Roiste, M.; Hartley, S.; Norton, K.; Deslippe, J.R. Multiple methods confirm wetland restoration improves ecosystem services. Ecosyst. People 2021, 17, 25–40. [Google Scholar] [CrossRef]
- Delpy, F.; Pedersen Zari, M.; Jackson, B.; Benavidez, R.; Westend, T. Ecosystem Services Assessment Tools for Regenerative Urban Design in Oceania. Sustainability 2021, 13, 2825. [Google Scholar] [CrossRef]
- Nguyen, T.; Meurk, C.; Benavidez, R.; Jackson, B.; Pahlow, M. The Effect of Blue-Green Infrastructure on Habitat Connectivity and Biodiversity: A Case Study in the Ōtākaro/Avon River Catchment in Christchurch, New Zealand. Sustainability 2021, 13, 6732. [Google Scholar] [CrossRef]
- Tomscha, S.; Deslippe, J.; de Róiste, M.; Hartley, S.; Jackson, B. Uncovering the ecosystem service legacies of wetland loss using high-resolution models. Ecosphere 2019, 10, e02888. [Google Scholar] [CrossRef] [Green Version]
- Zari, M.P.; Blaschke, P.M.; Jackson, B.; Komugabe-Dixson, A.; Livesey, C.; Loubser, D.I.; Gual, C.M.-A.; Maxwell, D.; Rastandeh, A.; Renwick, J.; et al. Devising urban ecosystem-based adaptation (EbA) projects with developing nations: A case study of Port Vila, Vanuatu. Ocean Coast. Manag. 2019, 184, 105037. [Google Scholar] [CrossRef]
- Benavidez, R. Understanding the Effect of Changing Land Use on Floods and Soil Erosion in the Cagayan de Oro Catchment; Victoria University of Wellington: Wellington, New Zealand, 2018. [Google Scholar]
- Loc, H.H.; Irvine, K.N.; Diep, N.T.H.; Quyen, N.T.K.; Tue, N.N.; Shimizu, Y. The legal aspects of Ecosystem Services in agricultural land pricing, some implications from a case study in Vietnam’s Mekong Delta. Ecosyst. Serv. 2016, 29, 360–369. [Google Scholar] [CrossRef]
- Coleman, J.M.; Roberts, H.H. Deltaic coastal wetlands. In Coastal Lowlands: Geology and Geotechnology; van der Linden, W.J.M., Cloetingh, S.A.P.L., Kaasschieter, J.P.K., van de Graaff, W.J.E., Vandenberghe, J., van der Gun, J.A.M., Eds.; Springer: Dordrecht, The Netherlands, 1989; pp. 1–24. [Google Scholar]
- Pham, T.A.N.; Loc, H.H.; Tran, D.D.; Quan, N.H. The inefficiency of Vietnamese prawn-rice rotational crops: A slacks-based data envelopment analysis. J. Agribus. Dev. Emerg. Econ. 2020, 11, 60–71. [Google Scholar] [CrossRef]
- Yee, J.Y.; Loc, H.H.; Le Poh, Y.; Vo-Thanh, T.; Park, E. Socio-geographical evaluation of ecosystem services in an ecotourism destination: PGIS application in Tram Chim National Park, Vietnam. J. Environ. Manag. 2021, 291, 112656. [Google Scholar] [CrossRef] [PubMed]
- Hung, N.N.; Delgado, J.M.; Tri, V.K.; Hung, L.M.; Merz, B.; Bárdossy, A.; Apel, H. Floodplain hydrology of the Mekong Delta, Vietnam. Hydrol. Process. 2011, 26, 674–686. [Google Scholar] [CrossRef] [Green Version]
- Park, E.; Ho, H.L.; Tran, D.D.; Yang, X.; Alcantara, E.; Merino, E.; Son, V.H. Dramatic decrease of flood frequency in the Mekong Delta due to river-bed mining and dyke construction. Sci. Total Environ. 2020, 723, 138066. [Google Scholar] [CrossRef] [PubMed]
- Park, E.; Loc, H.H.; Van Binh, D.; Kantoush, S. The worst 2020 saline water intrusion disaster of the past century in the Mekong Delta: Impacts, causes, and management implications. Ambio 2021, 1–9. [Google Scholar] [CrossRef]
- Hoa, L.T.V.; Shigeko, H.; Nhan, N.H.; Cong, T.T. Infrastructure effects on floods in the Mekong River Delta in Vietnam. Hydrol. Process. 2008, 22, 1359–1372. [Google Scholar] [CrossRef]
- Hung, N.N.; Delgado, J.M.; Güntner, A.; Merz, B.; Bárdossy, A.; Apel, H. Sedimentation in the floodplains of the Mekong Delta, Vietnam. Part I: Suspended sediment dynamics. Hydrol. Process. 2013, 28, 3132–3144. [Google Scholar] [CrossRef]
- Manh, N.V.; Dung, N.V.; Hung, N.N.; Merz, B.; Apel, H. Large-scale suspended sediment transport and sediment deposition in the Mekong Delta. Hydrol. Earth Syst. Sci. 2014, 18, 3033–3053. [Google Scholar] [CrossRef] [Green Version]
- MDP. Mekong Delta Plan: Long-Term Vision and Strategy for a Prosperous and Sustainable Delta. 2013. Available online: www.mekongdeltaplan.com (accessed on 2 September 2021).
- Tran, D.D.; Huu, L.H.; Hoang, L.P.; Pham, T.D.; Nguyen, A.H. Sustainability of rice-based livelihoods in the upper floodplains of Vietnamese Mekong Delta: Prospects and challenges. Agric. Water Manag. 2020, 243, 106495. [Google Scholar] [CrossRef]
- Tran, D.D.; Weger, J. Barriers to Implementing Irrigation and Drainage Policies in An Giang Province, Mekong Delta, Vietnam. Irrig. Drain. 2017, 67, 81–95. [Google Scholar] [CrossRef] [Green Version]
- Loc, H.H.; Van Binh, D.; Park, E.; Shrestha, S.; Dung, T.D.; Son, V.H.; Truc, N.H.T.; Mai, N.P.; Seijger, C. Intensifying saline water intrusion and drought in the Mekong Delta: From physical evidence to policy outlooks. Sci. Total Environ. 2020, 757, 143919. [Google Scholar] [CrossRef] [PubMed]
- Chapman, A.; Darby, S. Evaluating sustainable adaptation strategies for vulnerable mega-deltas using system dynamics modelling: Rice agriculture in the Mekong Delta’s An Giang Province, Vietnam. Sci. Total Environ. 2016, 559, 326–338. [Google Scholar] [CrossRef] [Green Version]
- Pandeya, B.; Buytaert, W.; Zulkafli, Z.; Karpouzoglou, T.; Mao, F.; Hannah, D.M. A comparative analysis of ecosystem services valuation approaches for application at the local scale and in data scarce regions. Ecosyst. Serv. 2016, 22, 250–259. [Google Scholar] [CrossRef] [Green Version]
- Barnett, A.; Fargione, J.; Smith, M.P. Mapping Trade-Offs in Ecosystem Services from Reforestation in the Mississippi Alluvial Valley. BioScience 2016, 66, 223–237. [Google Scholar] [CrossRef] [Green Version]
- Felardo, J.; Lippitt, C.D. Spatial forest valuation: The role of location in determining attitudes toward payment for ecosystem services policies. For. Policy Econ. 2016, 62, 158–167. [Google Scholar] [CrossRef]
- MRC. Integrated Water Resources Management-Based Basin Development Strategy 2016–2020 for the Lower Mekong Basin. 2016. Available online: https://data.vietnam.opendevelopmentmekong.net/library_record/integrated-water-resources-management-based-basin-development-strategy-2016-2020-for-the-lower-meko (accessed on 2 September 2021).
- Le, T.V.H.; Nguyen, H.N.; Wolanski, E.; Tran, T.C.; Haruyama, S. The combined impact on the flooding in Vietnam’s Mekong River delta of local man-made structures, sea level rise, and dams upstream in the river catchment. Estuarine Coast. Shelf Sci. 2007, 71, 110–116. [Google Scholar] [CrossRef]
- Tri, V.K. Hydrology and Hydraulic Infrastructure Systems in the Mekong Delta, Vietnam. In The Mekong Delta System: Interdisciplinary Analyses of a River Delta; Renaud, F.G., Kuenzer, C., Eds.; Springer: Dordrecht, The Netherlands, 2012; pp. 49–81. [Google Scholar]
- Dang, V.H.; Tran, D.D.; Cham, D.D.; Hang, P.T.T.; Nguyen, H.T.; Van Truong, H.; Tran, P.H.; Duong, M.B.; Nguyen, N.T.; Van Le, K.; et al. Assessment of Rainfall Distributions and Characteristics in Coastal Provinces of the Vietnamese Mekong Delta under Climate Change and ENSO Processes. Water 2020, 12, 1555. [Google Scholar] [CrossRef]
- IUCN. Overview of Wetlands Status in Viet Nam Following 15 Years of Ramsar Convention Implementation. 2005. Available online: https://portals.iucn.org/library/sites/library/files/documents/2005-105.pdf (accessed on 2 September 2021).
- Berg, H.; Söderholm, A.E.; Söderström, A.-S.; Tam, N.T. Recognizing wetland ecosystem services for sustainable rice farming in the Mekong Delta, Vietnam. Sustain. Sci. 2016, 12, 137–154. [Google Scholar] [CrossRef] [Green Version]
- Burkhard, B.; Müller, A.; Müller, F.; Grescho, V.; Anh, Q.; Arida, G.; Bustamante, J.V.; Van Chien, H.; Heong, K.; Escalada, M.; et al. Land cover-based ecosystem service assessment of irrigated rice cropping systems in southeast Asia—An explorative study. Ecosyst. Serv. 2015, 14, 76–87. [Google Scholar] [CrossRef]
- Van Tan, L.; Tran, T.; Loc, H.H. Soil and Water Quality Indicators of Diversified Farming Systems in a Saline Region of the Mekong Delta, Vietnam. Agriculture 2020, 10, 38. [Google Scholar] [CrossRef] [Green Version]
- GSO. Statistical Yearbook of Vietnam 2015; Statistical Publishing House: Hanoi, Vietnam, 2015. [Google Scholar]
- Smajgl, A.; Toan, T.Q.; Nhan, D.K.; Ward, J.F.; Trung, N.H.; Tri, L.Q.; Tri, V.P.D.; Vu, P.T. Responding to rising sea levels in the Mekong Delta. Nat. Clim. Chang. 2015, 5, 167–174. [Google Scholar] [CrossRef]
- FAOstat. 2017. Rice Cultivation. Available online: http://www.fao.org/faostat/en/#data/GR (accessed on 4 September 2021).
- GSO. Rice Cultivation Area. 2017. Available online: https://www.gso.gov.vn/px-web-2/?pxid=V0613&theme=N%C3%B4ng%2C%20l%C3%A2m%20nghi%E1%BB%87p%20v%C3%A0%20th%E1%BB%A7y%20s%E1%BA%A3n (accessed on 4 September 2021).
- FAOstat. Land Use. 2017. Available online: http://www.fao.org/faostat/en/#data/RL (accessed on 4 September 2021).
- GSO. Crop Land Area. 2017. Available online: https://www.gso.gov.vn/px-web-2/?pxid=V0609&theme=N%C3%B4ng%2C%20l%C3%A2m%20nghi%E1%BB%87p%20v%C3%A0%20th%E1%BB%A7y%20s%E1%BA%A3n (accessed on 4 September 2021).
- Kondolf, G.M.; Schmitt, R.J.; Carling, P.; Darby, S.; Arias, M.E.; Bizzi, S.; Castelletti, A.; Cochrane, T.A.; Gibson, S.; Kummu, M.; et al. Changing sediment budget of the Mekong: Cumulative threats and management strategies for a large river basin. Sci. Total. Environ. 2018, 625, 114–134. [Google Scholar] [CrossRef] [Green Version]
- Le, T.; Hoanh, C.; Miller, F.; Tan Sinh, B. Flood and Salinity Management in the Mekong Delta, Vietnam; The Sustainable Mekong Research Network (Sumernet): Bangkok, Thailand, 2009. [Google Scholar]
- Dung, N.V.; Merz, B.; Bárdossy, A.; Thang, T.D.; Apel, H. Multi-objective automatic calibration of hydrodynamic models utilizing inundation maps and gauge data. Hydrol. Earth Syst. Sci. 2011, 15, 1339–1354. [Google Scholar] [CrossRef] [Green Version]
- Triet, N.V.K.; Dung, N.V.; Fujii, H.; Kummu, M.; Merz, B.; Apel, H. Has dyke development in the Vietnamese Mekong Delta shifted flood hazard downstream? Hydrol. Earth Syst. Sci. 2017, 21, 3991–4010. [Google Scholar] [CrossRef] [Green Version]
- Loc, H.H.; Diep, N.T.H.; Can, N.T.; Irvine, K.N.; Shimizu, Y. Integrated evaluation of Ecosystem Services in Prawn-Rice rotational crops, Vietnam. Ecosyst. Serv. 2017, 26, 377–387. [Google Scholar] [CrossRef]
- Triet, N.V.K.; Dung, N.V.; Hoang, L.P.; Le Duy, N.; Tran, D.D.; Anh, T.T.; Kummu, M.; Merz, B.; Apel, H. Future projections of flood dynamics in the Vietnamese Mekong Delta. Sci. Total Environ. 2020, 742, 140596. [Google Scholar] [CrossRef] [PubMed]
- Hecht, J.S.; Lacombe, G.; Arias, M.E.; Dang, T.D.; Piman, T. Hydropower dams of the Mekong River basin: A review of their hydrological impacts. J. Hydrol. 2018, 568, 285–300. [Google Scholar] [CrossRef]
- Loc, H.H.; Low, M.; Park, E.; Dung, T.D.; Shrestha, S.; Yoon, Y.-J. How the saline water intrusion has reshaped the agricultural landscape of the Vietnamese Mekong Delta, a review. Sci. Total. Environ. 2021, 794, 148651. [Google Scholar] [CrossRef]
- Laura, E.E.; Steven, M.G.; Howard, A.Z. Groundwater extraction, land subsidence, and sea-level rise in the Mekong Delta, Vietnam. Environ. Res. Lett. 2014, 9, 084010. [Google Scholar]
- Tran, D.D.; van Halsema, G.; Hellegers, P.J.; Ludwig, F.; Wyatt, A. Questioning triple rice intensification on the Vietnamese mekong delta floodplains: An environmental and economic analysis of current land-use trends and alternatives. J. Environ. Manag. 2018, 217, 429–441. [Google Scholar] [CrossRef]
- Tong, Y.D. Rice Intensive Cropping and Balanced Cropping in the Mekong Delta, Vietnam—Economic and Ecological Considerations. Ecol. Econ. 2017, 132, 205–212. [Google Scholar] [CrossRef]
- Marapara, T. Eco-Hydrology Interactions between Trees, Soil and Water in Terrestrial and Wetland Areas: The Effect of Tree Planting on Water Flow Dynamics in Wairarapa Wetlands, New Zealand: A Thesis Submitted to the Victoria University of Wellington in Fulfilment of the Requirements for the Degree of Doctor of Philosophy/by Tapuwa R. Marapara. Ph.D. Thesis, Victoria University of Wellington, Wellington, New Zealand, 2016. [Google Scholar]
- Dang, N.; Jackson, B.; Tomscha, S.; Lilburne, L.; Burkhard, K.; Tran, D.D.; Hoang, L.P.; Benavidez, R. Parameterising and Adapting Ecosystem Service Models in Data Sparse Regions: Gaps, Guidelines, and an Application in the Vietnamese Mekong Delta, Chapter 3. Ph.D. Thesis, Victoria University of Wellington, Wellington, New Zealand, 2021. [Google Scholar]
- MRC. Overview of the Hydrology of the Mekong Basin. 2005. Available online: http://www.mekonginfo.org/assets/midocs/0001968-inland-waters-overview-of-the-hydrology-of-the-mekong-basin.pdf (accessed on 2 September 2021).
- Ballinger, J.; Jackson, B.; Pechlivanidis, I.; Ries, W. Potential Flooding and Inundation on the Hutt River; Victoria University of Wellington: Wellington, New Zealand, 2011. [Google Scholar]
- Dang, A.N.; Jackson, B.M.; Benavidez, R.; Tomscha, S.A. Review of ecosystem service assessments: Pathways for policy integration in Southeast Asia. Ecosyst. Serv. 2021, 49, 101266. [Google Scholar] [CrossRef]
- Loc, H.H.; Irvine, K.N.; Suwanarit, A.; Vallikul, P.; Likitswat, F.; Sahavacharin, A.; Sovann, C. Mainstreaming ecosystem services as public policy in South East Asia, from theory to practice. In Sustainability and Law; Springer: Cham, Switzerland, 2020; pp. 631–665. [Google Scholar]
- Du, T.; Mi, N.T.H.; Minh, V.; le van, K.; Vu, P.; Tri, L.Q. Application of GIS in the Mapping of Soil Fertility Distribution in the Mekong Delta; Can Tho University Publishing House: Can Tho, Vietnam, 2018. [Google Scholar]
- Khoa, L.V.; Su, N.T.C.; Minh, V.Q.; Vu, P.T. Agro-ecological zoning according to hydrology, pedology and present land use for coastal districts in Ben Tre province. Can Tho Univ. J. Sci. 2013, 26, 227–236. [Google Scholar]
- Tri, L.Q.; Minh, V.; Tran, K.T.; Vo-Tong, X. Land Evaluation and Land Use Planning of the Area for Rice-Shrimp System, Gia Ria District, Bac Lieu Province. In Rice-Shrimp Farming in the Mekong Delta: Biophysical and Socioeconomic Issues; Preston, N., Clayton, H., Eds.; Australian Centre for International Agricultural Research Sun Photoset Pty Ltd.: Brisbane, Australia, 2003. [Google Scholar]
- Vu, P.; Minh, V.; Vu, N.; Va, T.; Thang, T. Soils of the Mekong Delta Classified by WRB-FAO (2006) Classification System. Can Tho Univ. J. Sci. 2011, 18b, 10–17. [Google Scholar]
- Vu, P.T.; Tri, L.Q.; Tri, V.P.D. Application of tool to decision support system in land use planning and land use resources sustainability. Can Tho Univ. J. Sci. 2009, 11, 71–79. [Google Scholar]
- Vu, P.T.; Tri, L.Q.; Trung, N.H.; Huy, V.T.; Dat, N.T.; Nuong, L.T. Using multi-criteria decision analysis in agricultural land uses in Bac Lieu province. Can Tho Univ. J. Sci. 2014, 31, 106–115. [Google Scholar]
- Vu, P.T.; Tri, L.Q.; Van, N.K.; Binh, N.T.S. Assessment of land use changes in the periods of 2000-2011 and future trend of land use change in the acid sulphate soils of the Tri Ton district, An Giang province. Can Tho Univ. J. Sci. 2013, 27, 72–79. [Google Scholar]
- Vu, P.T.; Trung, N.H.; Tri, L.Q.; Huy, V.T.; Vu, P.H.; Loc, T.T. Agricultural land use planning based on stakeholder interaction at village level. Can Tho Univ. J. Sci. 2017, 50, 1–12. [Google Scholar] [CrossRef]
- Vu, P.T.; Vo Quang, M.; Huy, V.T.; Nguyen, P.C. Effect of flooding and salinity as a result of climate change on land use suitability in the coastal zone of the Vietnamese Mekong Delta. Can Tho Univ. J. Sci. 2016, 4, 71–83. [Google Scholar]
- Le, T.N.; Bregt, A.K.; van Halsema, G.E.; Hellegers, P.J.; Nguyen, L.-D. Interplay between land-use dynamics and changes in hydrological regime in the Vietnamese Mekong Delta. Land Use Policy 2018, 73, 269–280. [Google Scholar] [CrossRef] [Green Version]
- Sys, C.; Van Ranst, E.; Debaveye, I.J. Land Evaluation, Part 1: Methods in Land Evaluation; Agricultural Publications: Brussels, Belgium, 1991. [Google Scholar]
- Sys, C.; Van Ranst, E.; Debaveye, I.J. Land Evaluation, Part 2: Principles in Land Evaluation and Crop Production Calculation; Agricultural Publications: Brussels, Belgium, 1991. [Google Scholar]
- Van Mensvoort, M.; Van Nhan, N.; Tran, K.T.; Tri, L.Q. Coarse Land Evaluation of the Acid Sulphate Soil Areas in the Mekong Delta Based on Farmers’ Experience; Wageningen University & Research: Wageningen, Netherlands, 1993. [Google Scholar]
- IPCC. Guidelines for National Greenhouse Gas Inventories. 2006. Available online: https://www.ipcc-nggip.iges.or.jp/public/2006gl/index.html (accessed on 2 September 2021).
- LUCI Team. LUCI Factors Help Documentation, Wellington. 2019; Manuscript in Preparation. [Google Scholar]
- IUCN. Economic Value of the Zambezi Basin Wetlands. 1999. Available online: https://portals.iucn.org/library/node/8114 (accessed on 2 September 2021).
- Tran, D.D.; van Halsema, G.; Hellegers, P.J.; Hoang, L.P.; Ludwig, F. Long-term sustainability of the Vietnamese Mekong Delta in question: An economic assessment of water management alternatives. Agricult. Water Manag. 2019, 223, 105703. [Google Scholar] [CrossRef]
- Daily, G.C.; Polasky, S.; Goldstein, J.; Kareiva, P.M.; Mooney, H.; Pejchar, L.; Ricketts, T.H.; Salzman, J.; Shallenberger, R. Ecosystem services in decision making: Time to deliver. Front. Ecol. Environ. 2009, 7, 21–28. [Google Scholar] [CrossRef] [Green Version]
- Marino, D.; Pellegrino, D. Can Payments for Ecosystem Services Improve the Management of Natura 2000 Sites? A Contribution to Explore Their Role in Italy. Sustainability 2018, 10, 665. [Google Scholar] [CrossRef] [Green Version]
- Nguyen, Q.H.; Tran, D.D.; Dang, K.K.; Korbee, D.; Pham, L.D.M.H.; Vu, L.T.; Luu, T.T.; Ho, L.H.; Nguyen, P.T.; Ngo, T.T.T.; et al. Land-use dynamics in the Mekong delta: From national policy to livelihood sustainability. Sustain. Dev. 2020, 28, 448–467. [Google Scholar] [CrossRef]
- Government of Vietnam. Quyet Finh Phe Duyet de an Tai co Cau Nganh Nong Nghiep Theo Huong Nang Cao Gia tri Gia Tang va Phat Trien ben Vung. Decision 899/QD-TTg Dated in 10th of September 2013. 2013. Available online: http://khcn.vnua.edu.vn/vi/laws/detail/quyet-dinh-phe-duyet-de-an-tai-co-cau-nganh-nong-nghiep-theo-huong-nang-cao-gia-tri-gia-tang-va-phat-trien-ben-vung/ (accessed on 2 September 2021).
- Arias, M.E.; Cochrane, T.A.; Lawrence, K.S.; Killeen, T.J.; Farrell, T.A. Paying the forest for electricity: A modelling framework to market forest conservation as payment for ecosystem services benefiting hydropower generation. Environ. Conserv. 2011, 38, 473–484. [Google Scholar] [CrossRef] [Green Version]


| Required Data | Data Type | Data Source | |
|---|---|---|---|
| DEM | 5 m DEM | Raster | The Ministry of Natural Resources and Environment, Vietnam |
| 30 m SRTM DEM | United States Geological Survey (USGS) | ||
| Land use/land cover | LULC map 2010 | Vector Polygon | Water Source University of Vietnam |
| LULC map 2018 | The National Institute of Agricultural Planning and Projection, Vietnam | ||
| Soil map | Vector Polygon | University of Can Tho (WISDOM project) | |
| Study area mask | Vector Polygon | Ministry of Natural Resources and Environment, Vietnam | |
| Stream network | Vector Polyline | Ministry of Natural Resources and Environment, Vietnam | |
| Gridded annual rainfall (mm/year) 1 km | Raster | Worldclim.org | |
| Gridded annual potential evapotranspiration (mm/year) 1 km | Raster | Worldclim.org | |
| Hourly rainfall data of Tan Chau station | Tabulate | An Giang Hydro-Meteorological Station | |
| Hourly rainfall data of Tan Chau station | Raster | ERA5 hourly data at single levels from 1979 to present | |
| Hourly potential evapotranspiration of Tan Chau station | Raster | ERA5 hourly data at single levels from 1979 to present | |
| Soil properties (sand, silt, clay, bulk density, organic carbon/organic matter, pH, CEC, ECE, etc.) | WISE—global soil property databases | ||
| Inundation maps 2000–2013 | Vector | Obtained from Le et al. [91] | |
| Agriculture and aquaculture production statistics 2000–2012 of the VMD’s 13 provinces | Tabulate | General Statistics Office of Vietnam | |
| Land Table | The VMD LULC Classes | LCDB2 |
|---|---|---|
| Link-code 1 | “triple rice” | “short-rotation cropland” |
| “double rice” and “single rice” | “herbaceous freshwater vegetation” | |
| Aquacultural LULC classes (rice-shrimp, shrimp, mangrove-shrimp) | “pond and lake” | |
| Link-code 1 | “triple rice” | “short-rotation cropland” |
| “double rice” and “single rice” | “herbaceous freshwater vegetation” | |
| Aquacultural LULC classes (rice-shrimp, shrimp, mangrove-shrimp) | “herbaceous freshwater vegetation” |
| Set | Description |
|---|---|
| Set 1 | Both soil and land tables were set following the instruction of “LUCI Factors Help Documentation” [96].
|
| Set 2 | Soil table was set following the instruction of “LUCI Factors Help Documentation” [96]. However, in the land table, productivity of aquacultural areas did not follow the instructions.
|
| Set 3 | Altering the general parameterisation guidance for some parameters of both soil and land tables to help LUCI recognise flood mitigation capacity and productivity of waterlogged crops.
|
| LULC Class | PFLOOD | PAGCLASS SET 1 | PAGCLASS SET 2 | PAGCLASS SET 3 | CARBONABIO | CARBONBBIO | CARBONDEAD | CARBONLIT | SOILOC |
|---|---|---|---|---|---|---|---|---|---|
| Single Rice | 2 | 2 | 2 | 2 | 4 | 1 | 0 | 0.6 | 20.05 |
| Double Rice | 2 | 1 | 1 | 1 | 6.67 | 1.1 | 0 | 0.6 | 20.05 |
| Triple Rice | 2 | 1 | 1 | 1 | 9.96 | 1.3 | 0 | 0.6 | 20.05 |
| Rice-Shrimp | 2 | 1 | 1 | 1 | 4 | 1 | 0 | 0.6 | 20.05 |
| River | 3 | 6 | 3 | 3 | 0 | 0 | 0 | 0 | 0 |
| Melaleuca Forest | 2 | 5 | 4 | 5 | 56.25 | 13.04 | 4 | 1.1 | 104.29 |
| Orchard Farm | 2 | 2 | 2 | 1 | 39.78 | 2.68 | 0 | 0.6 | 64.2 |
| Shrimp | 2 | 6 | 1 | 1 | 0 | 0 | 0 | 0 | 0 |
| Residential Area | 1 | 7 | 7 | 7 | 0 | 0 | 0 | 0 | 12.55 |
| Ornamental Plant Garden | 1 | 5 | 5 | 5 | 4 | 1 | 0 | 0.6 | 12.55 |
| Sugarcane | 2 | 2 | 2 | 2 | 4 | 1 | 0 | 0.6 | 12.55 |
| Pineapple | 2 | 2 | 2 | 2 | 4 | 1 | 0 | 0.6 | 12.55 |
| Vegetable | 2 | 2 | 2 | 2 | 4 | 1 | 0 | 0.6 | 12.55 |
| Mangrove | 2 | 5 | 3 | 3 | 125.8 | 32.92 | 3.4 | 0 | 691.35 |
| Mangrove-Shrimp | 2 | 5 | 2 | 2 | 125.8 | 32.92 | 3.4 | 0 | 691.35 |
| Broadleaf Forest | 2 | 5 | 5 | 5 | 107.7 | 15.1 | 4 | 1.1 | 75.54 |
| Salt | 2 | 5 | 4 | 5 | 0 | 0 | 0 | 0 | 0 |
| Rice-Vegetable | 2 | 1 | 1 | 1 | 6.67 | 1.1 | 0 | 0.6 | 20.05 |
| Lake and Pond | 3 | 6 | 3 | 3 | 0 | 0 | 0 | 0 | 0 |
| SOILTYPE | LUCI_WLOG SET 1 | LUCI_WLOG SET 2 | LUCI_WLOG SET 3 | LUCI_FERT | PAW |
|---|---|---|---|---|---|
| Alluvial Soils with Yellow-Red Mottles | 2 | 2 | 1 | 1 | 150.90 |
| Deposited Alluvial Soils | 2 | 2 | 1 | 1 | 144.85 |
| Eroded Soils | 2 | 2 | 2 | 4 | 11.85 |
| Gleyic Alluvial Soils | 2 | 2 | 1 | 2 | 119.34 |
| Grey Soils on Acid Magmatic Rocks and Sandy Stones | 1 | 1 | 1 | 4 | 163.17 |
| Grey Soils on Old Alluvium | 2 | 2 | 1 | 3 | 169.01 |
| Humic Grey Soils on Old Alluvium | 2 | 2 | 1 | 2 | 155.09 |
| Undeposited Alluvial Soils | 2 | 2 | 1 | 1 | 131.44 |
| Saline Mangrove Soils | 3 | 3 | 1 | 3 | 134.40 |
| Moderately Saline Soils | 2 | 2 | 1 | 3 | 151.04 |
| Peaty Acid Sulphate Soils | 2 | 2 | 3 | 1 | 39.28 |
| Saline–Acid Sulphate Soils–Sulfidic Horizon: 0–50 cm | 3 | 3 | 1 | 2 | 186.23 |
| Saline–Potential Acid Sulphate Soils–Sulfidic Material: 0–50 cm | 3 | 3 | 1 | 2 | 186.23 |
| Saline–Acid Sulphate Soils–Sulfidic Horizon: >50 cm | 3 | 3 | 1 | 2 | 186.23 |
| Saline–Potential Acid Sulphate Soils–Sulfidic Material: >50 cm | 3 | 3 | 1 | 2 | 186.23 |
| Raised Ridge Sandy Soils | 1 | 1 | 1 | 4 | 78.19 |
| Actual Acid Sulphate Soils–Sulfidic Horizon: 0–50 cm | 2 | 2 | 1 | 2 | 186.23 |
| Potential Acid Sulphate Mangrove Soils–Sulfidic Material: 0–50 cm | 3 | 3 | 1 | 2 | 186.23 |
| Potential Acid Sulphate Soils–Sulfidic Material: 0–50 cm | 2 | 2 | 1 | 2 | 186.23 |
| Strongly Saline Soils | 2 | 2 | 1 | 4 | 134.40 |
| Actual Acid Sulphate Soils–Sulfidic Horizon: >50 cm | 2 | 2 | 1 | 2 | 37.60 |
| Potential Acid Sulphate Mangrove Soils–Sulfidic Material: >50 cm | 3 | 3 | 1 | 2 | 186.23 |
| Potential Acid Sulphate Soils–Sulfidic Material: >50 cm | 2 | 2 | 1 | 2 | 186.23 |
| Slightly Saline Soils | 2 | 2 | 2 | 3 | 134.40 |
| Yellow-Red Soils on Acid Magmatic Rocks | 1 | 1 | 1 | 4 | 167.12 |
Publisher’s Note: MDPI stays neutral with regard to jurisdictional claims in published maps and institutional affiliations. |
© 2021 by the authors. Licensee MDPI, Basel, Switzerland. This article is an open access article distributed under the terms and conditions of the Creative Commons Attribution (CC BY) license (https://creativecommons.org/licenses/by/4.0/).
Share and Cite
Dang, N.A.; Benavidez, R.; Tomscha, S.A.; Nguyen, H.; Tran, D.D.; Nguyen, D.T.H.; Loc, H.H.; Jackson, B.M. Ecosystem Service Modelling to Support Nature-Based Flood Water Management in the Vietnamese Mekong River Delta. Sustainability 2021, 13, 13549. https://doi.org/10.3390/su132413549
Dang NA, Benavidez R, Tomscha SA, Nguyen H, Tran DD, Nguyen DTH, Loc HH, Jackson BM. Ecosystem Service Modelling to Support Nature-Based Flood Water Management in the Vietnamese Mekong River Delta. Sustainability. 2021; 13(24):13549. https://doi.org/10.3390/su132413549
Chicago/Turabian StyleDang, Nguyet Anh, Rubianca Benavidez, Stephanie Anne Tomscha, Ho Nguyen, Dung Duc Tran, Diep Thi Hong Nguyen, Ho Huu Loc, and Bethanna Marie Jackson. 2021. "Ecosystem Service Modelling to Support Nature-Based Flood Water Management in the Vietnamese Mekong River Delta" Sustainability 13, no. 24: 13549. https://doi.org/10.3390/su132413549