
The ‘Perfect’ Conversion: Dramatic Increase in CO2 Efflux from Shellfish Ponds and Mangrove Conversion in China


1
Simon F. S. Li Marine Science Laboratory, School of Life Sciences, The Chinese University of Hong Kong, Shatin, Hong Kong, China
2
Key Laboratory of the Ministry of Education for Coastal and Wetland Ecosystems, College of the Environment and Ecology, Xiamen University, Xiamen 361102, China
*
Author to whom correspondence should be addressed.
Sustainability 2021, 13(23), 13163; https://doi.org/10.3390/su132313163
Submission received: 17 October 2021
/
Revised: 22 November 2021
/
Accepted: 24 November 2021
/
Published: 27 November 2021
(This article belongs to the Special Issue Carbon Storage, Accumulation, Decomposition and Emission in Mangroves)
Abstract
:Aquaculture, particularly shellfish ponds, has expanded dramatically and become a major cause of mangrove deforestation and “blue carbon” loss in China. We present the first study to examine CO2 efflux from marine aquaculture/shellfish ponds and in relation to land-use change from mangrove forests in China. Light and dark sediment CO2 efflux from shellfish ponds averaged at 0.61 ± 0.07 and 0.90 ± 0.12 kg CO2 m−2 yr−1 (= 37.67 ± 4.89 and 56.0 ± 6.13 mmol m−2 d−1), respectively. The corresponding rates (−4.21 ± 4.54 and 41.01 ± 4.15 mmol m−2 d−1) from the adjacent mangrove forests that were devoid of aquaculture wastewater were lower, while those from the adjacent mangrove forests (3.48 ± 7.83 and 73.02 ± 5.76 mmol m−2 d−1)) receiving aquaculture wastewater markedly increased. These effluxes are significantly higher than those reported for mangrove forests to date, which is attributable to the high nutrient levels and the physical disturbance of the substrate associated with the aquaculture operation. A rise of 1 °C in the sediment temperature resulted in a 6.56% rise in CO2 released from the shellfish ponds. Combined with pond area data, the total CO2 released from shellfish ponds in 2019 was estimated to be ~12 times that in 1983. The total annual CO2 emission from shellfish ponds associated with mangrove conversion reached 2–5 Tg, offsetting the C storage by mangrove forests in China. These are significant environmental consequences rather than just a simple shift of land use. Around 30% higher CO2 emissions are expected from aquaculture ponds (including shellfish ponds) compared to shellfish ponds alone. Total annual CO2 emission from shellfish ponds will likely decrease to the level reported in early 1980 under the pond area-shrinking scenario, but it will be more than doubled under the business-as-usual scenario projected for 2050. This study highlights the necessity of curbing the expansion of aquaculture ponds in valuable coastal wetlands and increasing mangrove restoration to abandoned ponds.
1. Introduction
Mangroves are evergreen plants that grow on tropical and subtropical coastlines. The trees and shrubs growing in mangrove forests display different root systems (e.g., plank or buttress, stilts, knee roots and pneumatophores) that aerate the system, stabilize plants during waves, slow down water flow and facilitate sediment deposition [1]. Mangroves provide a wide variety of ecosystem services, including but not limited to carbon sequestration, nursery habitats for juvenile prawns and fishes, wastewater treatment, coastal water quality improvement by removing pollutants before reaching coral reefs and seagrasses, storm/cyclone protection, and nutrient provision for adjacent coral reefs and seagrasses [2,3,4]. In contrast to their high ecosystem value, sustained mangrove forest losses have occurred in the last few decades due to reclamation, aquaculture development, urban and coastal development and overexploitation, waste dumping, and dredging for navigational channels and marinas [5,6,7]. This situation is particularly alarming in Asia, where losses have averaged 1% or above in the past few decades [8], although loss rates appear to have decreased [9]. Aquaculture expansion into mangroves accounts for 51.9% of mangrove habitat loss in some South American and Asian countries [10]. In Asia, mangroves have also been confronted with degradation, resulting from conversion into aquaculture ponds [11]. China has the fastest expansion rate of coastal aquaculture globally. According to data from the State Fishery Administration of China, the area used in aquaculture rose from 3,269,135 ha in 1983 to 8,346,339 ha (~3× increase) in 2016 [12].
The expansion of marine aquaculture, especially shellfish farming, contributes significantly to the loss of mangrove forests and the rise in CO2 emissions from sediments. Coastal aquaculture in the highest-producing countries is dominated by seaweeds (plants), mollusks, crustaceans and finfish (fauna) [13,14], the expansion of which is undoubtedly disastrous to mangrove forests. Currently, recognition of the negative effects as a result of aquaculture is restricted to direct habitat loss, introductions and transfers of non-native species, bycatch and misuse of chemicals [7]. Little attention has been given to the indirect effects of mangrove conversion [15], such as CO2 emission from mangrove forest loss and operation of the aquaculture pond replacing the mangroves. When mangroves are cleared to establish aquaculture ponds, there is a release of stored C back into the atmosphere [16] but even more from the perturbation and oxidation of sediments during pond construction [17]. Based on a life-cycle analysis approach, Kauffman, et al. [18] estimated that each kg of shrimps produced from ponds that were converted from mangrove forests would result in >16 kg of CO2 emission.
Many methods have been developed to measure sediment CO2 flux, accompanied by the technical development of measuring CO2 flux from the water–air interface [19]. Among these methods, the dynamic chamber methods are well developed, and CO2 concentration in the chamber is usually measured by an infrared gas analyzer. In particular, the commercially available systems tend to follow the closed dynamic chamber method, which avoids the problems of open dynamic systems, e.g., pressure sensitivity and a process that is time-consuming to reach stability. However, the closed dynamic system has the risk of building up CO2 concentration in the chamber [20]. In this study, we utilized the closed dynamic system to measure CO2 efflux and improved its performance by including a vent to allow pressure to balance between the inside and outside of the chamber, thereby preventing CO2 partial pressure buildup.
In order to assess the effect of mangrove conversion on the dramatic increase in CO2 efflux, we conducted field sampling to investigate CO2 efflux from shellfish ponds constructed via mangrove conversion in Fujian Province, China. Efflux from mangrove forests in the same area was also measured for comparison. We performed the first analysis by scaling up the measured flux to CO2 efflux from marine aquaculture ponds (including shellfish ponds), incorporating mangrove loss in China over the past 30 years when mangroves have been cleared for aquaculture development. This was based on our data, historical data on the areal changes in aquaculture/shellfish ponds, and published data on CO2 efflux from other aquaculture ponds.
2. Materials and Methods
2.1. Sampling Site
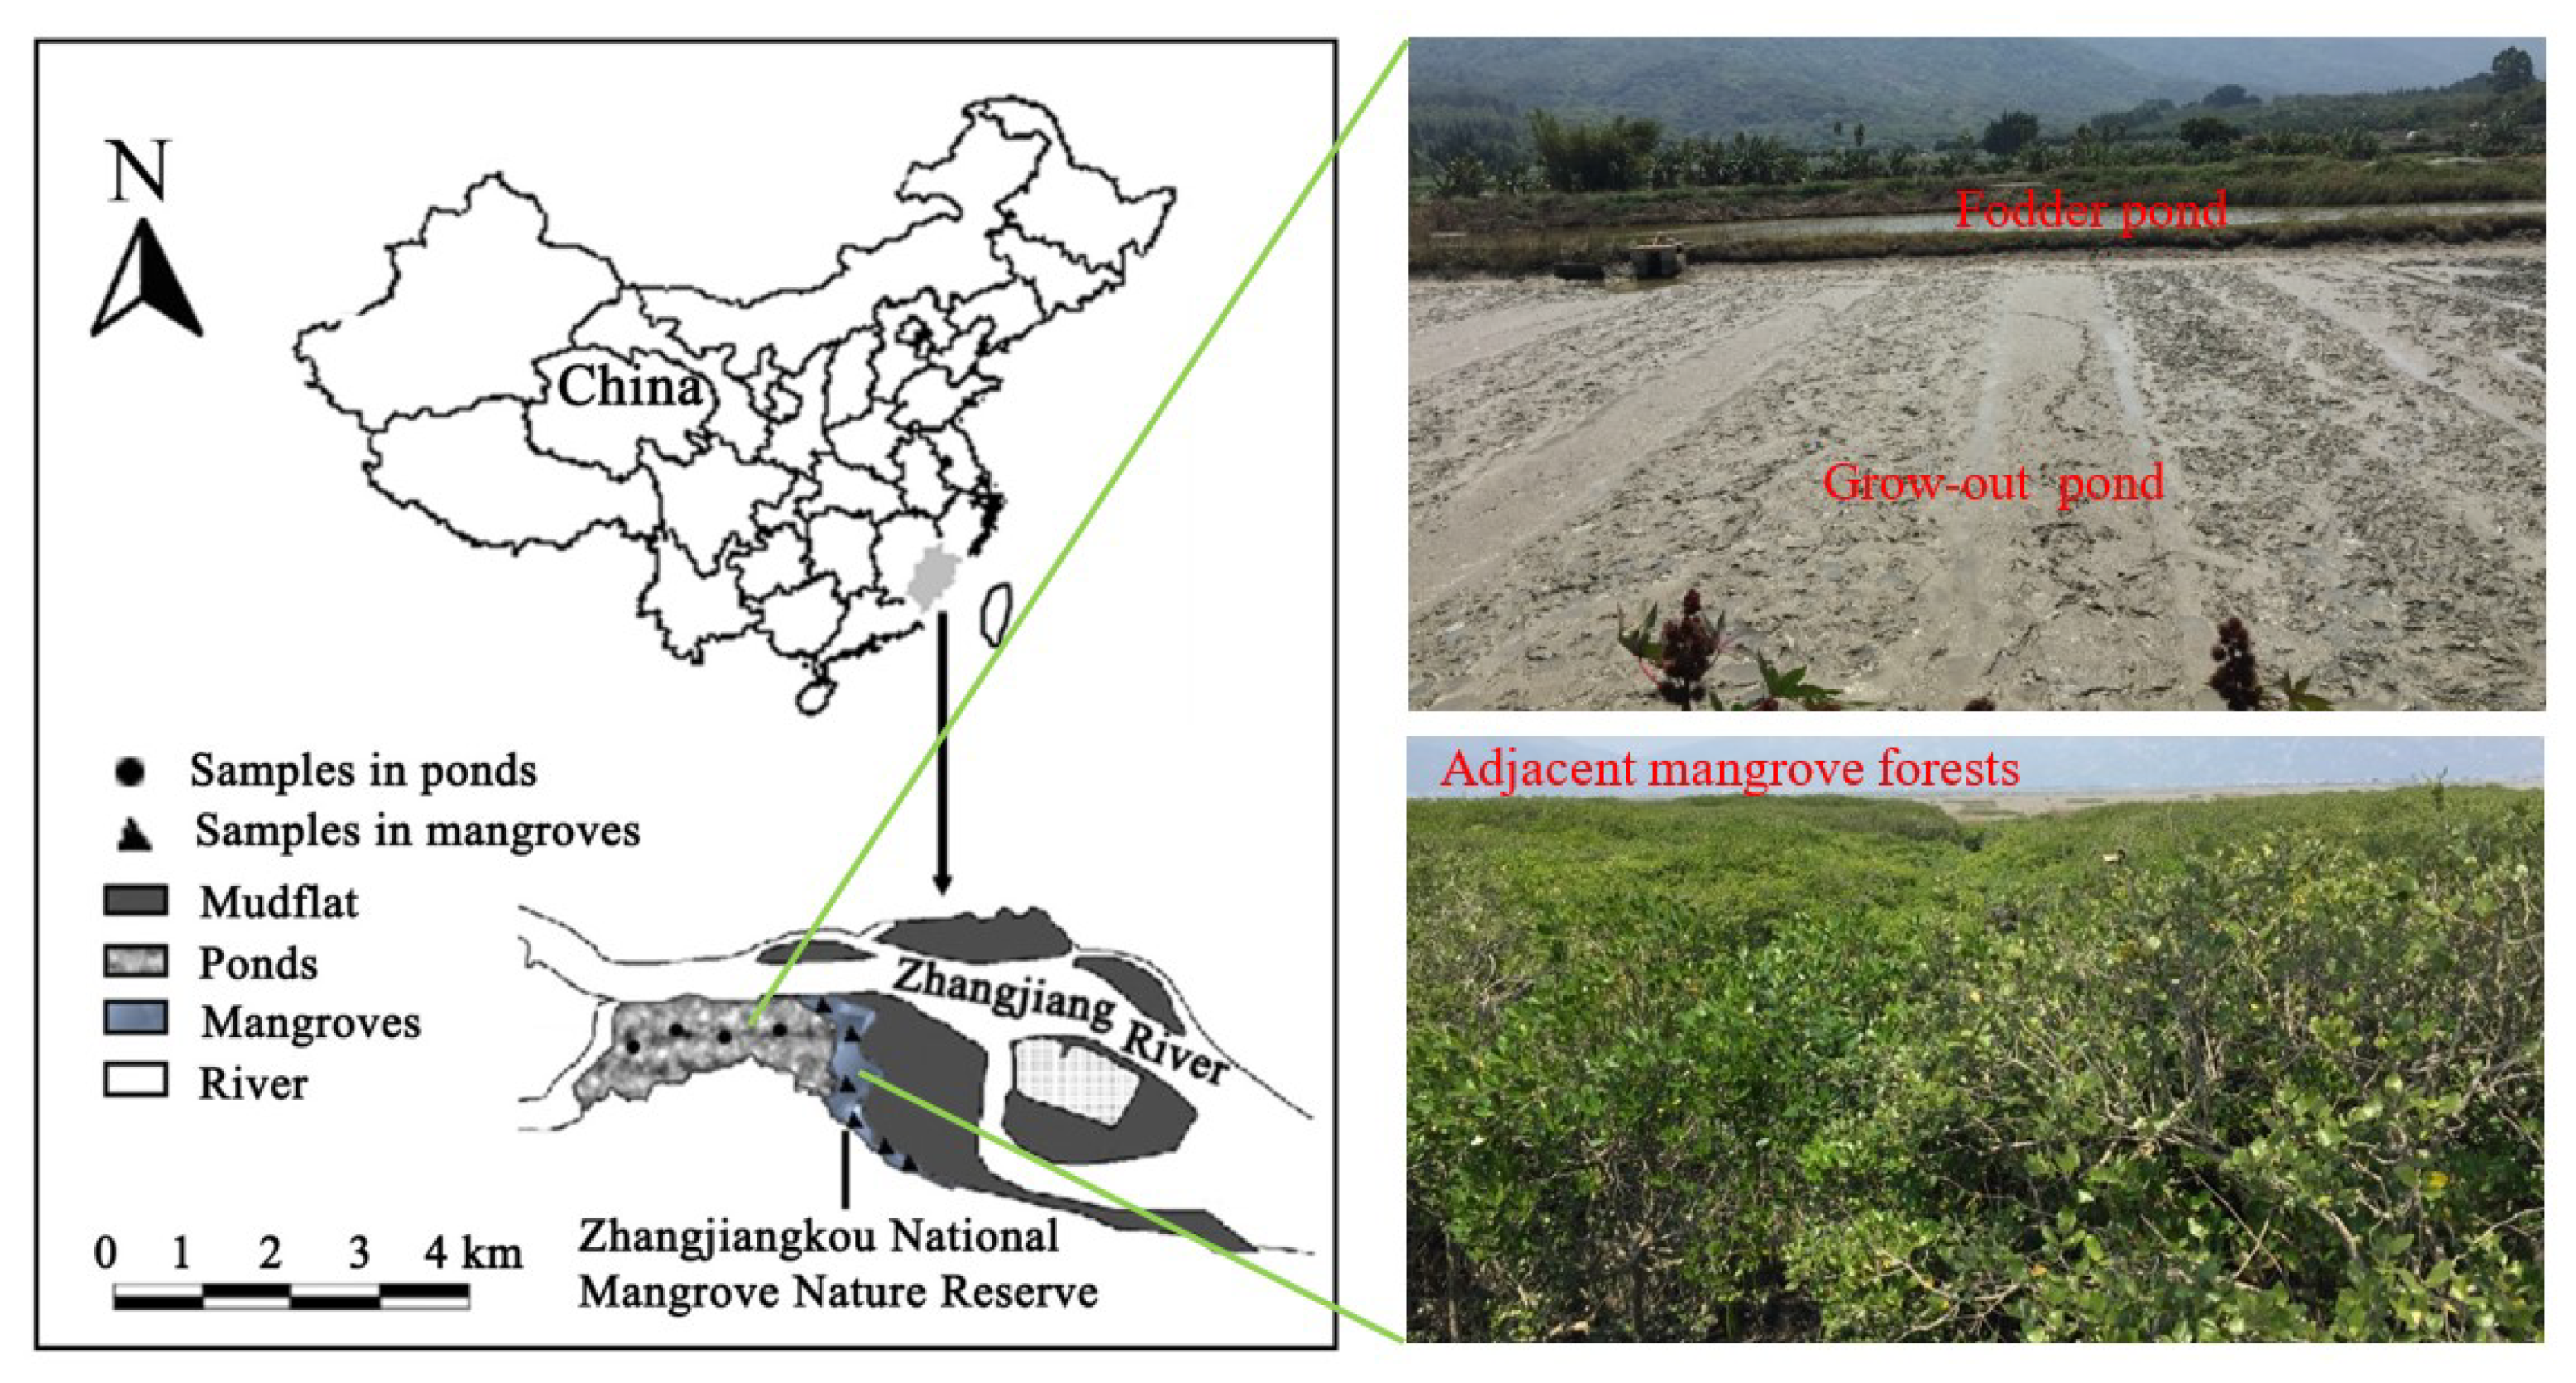
This study was conducted in shellfish ponds adjacent to the Zhangjiangkou National Mangrove Nature Reserve (23°53′45″−23°56′00″ N, 117°24′07″−117°24′30″ E) in Yunxiao, southern Fujian Province, China (Figure 1). To allow comparison, measurement was also conducted in adjacent forests dominated by the mangrove varieties Avicennia marina and Kandelia obovata. The sampling site is located in the mid- to upper tidal region of the Zhangjiang estuary, which is semi-enclosed and opens into the Taiwan Strait. The estuary occupies ~2360 ha and is fringed by 117.9 ha of mangrove forests. Mangrove forests in the estuary are dominated by Avicennia marina, Kandelia obovata and Aegiceras corniculatum. The invasion of cordgrass, Spartina alterniflora, has resulted in the rapid encroachment of the intertidal mudflat seaward to the mangroves, effectively suppressing mangrove expansion into the accreting coast. In 2020, the average annual rainfall was 2640.9 mm, and the average annual temperature was 22.6 °C. The average water salinity was 19%.
Mangrove forests of the Zhangjiang estuary were cleared for mariculture before the 1990s. The intertidal areas of the estuary are now almost totally occupied by semi-intensive ponds for shellfish and crustacean aquaculture. The recent invasion of S. alterniflora on the unvegetated mudflat has caused the collapse of the shellfish collection fishery (mainly of the razor clam, Sinonovacula constricta), thus accelerating the conversion of mangrove forests into ponds for culturing the clam [21]. This scenario is a typical situation of mangrove forests in China, if not also Southeast Asia, where aquaculture development remains a strong driver for mangrove loss. These ponds are connected to seawater via sluice gates, which are only opened during the water exchange necessitated by maintenance or harvesting. The frequency and volume of water exchange between ponds and channels varied in light of the species’ growth cycle and water salinity, fluctuating from 0% in the first month after stocking to 30% volume per week in the growth and harvesting stages [22].
According to the Marine Fishery Yearbook from the State Oceanic Administration of China (SOA), the major species raised in south China involved crabs, mollusks and shrimps. In the sampling site, the ponds culturing native razor clams, namely, Sinonovacula constricta, were selected for sampling sediment CO2 efflux. The clam ponds are composed of a grow-out pond and a fodder pond. The grow-out ponds receive fertilizers (inorganic phosphorus and nitrogen) and food (algae) from the fodder ponds, as well as suspended organic particles from the flooded water of adjoining mangroves during spring tides. The rearing period continues from October to July in general. From August to September, pond owners would clear the surface sediments of the ponds with hydraulic pumps, and expose the ponds to the sun to disinfect them in the following week [23]. Fodder ponds are fertilized with chicken manure or other fertilizers to boost phytoplankton abundance, which sustains the filter-feeding razor clams in the grow-out pond.
2.2. Sampling Methods
To standardize the measurements, CO2 efflux across the sediment–air interface was measured between 9:00 am and 1:00 pm in four clam grow-out ponds and six locations of mangrove forests on consecutive days from 30 March to 16 April 2015. Multiple replicates were measured at each pond and mangrove site. The locations were selected using a random sampling scheme. The sampling locations of mangrove forests were located near the discharge point of the aquaculture effluents. Both light and dark effluxes were measured using transparent polycarbonate chambers and chambers covered by aluminum foil, respectively. The chambers (diameter 35.5 cm, volume 5.7 L) were pushed down 0.5 cm into the sediment 30 min before CO2 measurement, to allow the set-up to equilibrate while preventing an undue difference (e.g., temperature) in conditions between the two chambers. Each chamber had an air pump, with two sampling ports on opposite sides of the chamber through which a stream of airflow was maintained by the air pump at a 200 mL min−1 flow rate, to minimize gas buildup in the chamber. The pressure equilibrium between the air in the chamber and the surrounding air was maintained by a relief vent according to the design by Xu, et al. [24]. CO2 efflux was measured by an SBA-5 infrared gas analyzer (PP System Inc., Amesbury, MA, USA) for up to 20 min, until a stable rate lasting for at least 2.5 min was obtained. The short incubation period was selected to avoid excessive environmental microclimatic changes (e.g., water content, sediment temperature and CO2 concentration gradients), which may influence gas diffusivity. Zero calibration was conducted using a column of soda lime after every measurement to ensure accuracy. During each gas flux measurement, the air temperature was recorded, and sediment temperature was also recorded after measurement with temperature sensors. Wind speed was auto-recorded with a hand-held anemometer during the measurement.
2.3. Estimate of CO2 Efflux from Aquaculture (Including Shellfish) Ponds in China
CO2 efflux from aquaculture ponds was extrapolated by a combination of our measured efflux with the recorded total aquaculture/shellfish pond area in China. Data of marine aquaculture/shellfish pond area in China over the past 30 years were collected and collated from the China Fisheries Yearbook (1984–2020) [25] (Figure 2). The loss of mangrove forests in some provinces such as Guangdong may be exclusively attributed to aquaculture development over the last 20 years [26]. The average CO2 efflux was estimated as the mean of dark and light efflux, based on an assumed average 12:12 light:dark period. These data were used to estimate the variation of CO2 efflux from aquaculture/shellfish ponds in China over time, concomitant with the expansion of mariculture into mangrove forests, as well as to predict CO2 efflux in 2050. CO2 efflux from aquaculture/shellfish ponds in 2050 was estimated according to two scenarios. The first scenario is based on the temporal increase of pond area since the 1980s and was named the business-as-usual scenario, while the second scenario is based on the recent decrease of pond area since the 2010s and was named the area-shrinking scenario. Mangroves have been lost at a rate of 44% since the 1970s, attributable to aquaculture development in China [10], but there is some sign of area increase (around 13%) due to mangrove restoration programs from 1980 to 2010 [27]. These rates were used to estimate CO2 efflux from the loss of mangrove forests due to aquaculture expansion, and to analyze the change in CO2 efflux due to mangrove restoration.
2.4. Data Analysis
Data were tested for normality using the Shapiro–Wilk test, and for homogeneity of variance with a Levene’s test (α = 0.05). When the above assumptions were violated, data were logarithmic or square-root transformed. A paired-sample t-test was conducted to compare dark and light CO2 efflux, recorded from the paired chambers. Linear regression was performed between CO2 efflux and sediment temperature, as well as between shellfish pond area and time. The Monte Carlo method was employed to propagate uncertainties in CO2 efflux. All statistics were run using the R programming language [28]. The R library “car” was employed to test the homogeneity of variance. Deviation of the data is expressed as the standard error (SE). The data were presented as mean ± SE.
3. Results and Discussion
3.1. CO2 Efflux Variation with Temperature and Light Conditions
Average CO2 dark efflux from the sediment–air interface was 2.46 ± 0.27 g CO2 m−2 d−1 (= 56.0 ± 6.13 mmol m−2 d−1), while the average light efflux was 1.66 ± 0.22 g CO2 m−2 d−1 (= 37.7 ± 4.89 mmol m−2 d−1) across all the shellfish ponds. Sediment CO2 dark efflux is significantly higher than light flux (paired-sample t-test, p = 0.011).
Average CO2 dark and light effluxes from the adjacent natural mangroves that were devoid of aquaculture wastewater were 1.80 ± 0.18 g CO2 m−2 d−1 (= 41.01 ± 4.15 mmol m−2 d−1) and −0.18 ± 0.20 g CO2 m−2 d−1 (= −4.21 ± 4.54 mmol m−2 d−1) over the same period. However, the dark and light efflux from the adjacent natural mangroves receiving aquaculture wastewater were 3.21 ± 0.25 g CO2 m−2 d−1 (= 73.02 ± 5.76 mmol m−2 d−1) and 0.15 ± 0.34 g CO2 m−2 d−1 (= −3.48 ± 7.83 mmol m−2 d−1).
Our study suggests that CO2 dark efflux was significantly higher in comparison with light efflux. Settled phytoplankton are abundant in the shellfish ponds since they are the primary food for Sinonovacula constricta. The abundance of microphytobenthos may also be high on the sediment surface, as a result of the nutrient enrichment typical of this culture system. The level of sediment chlorophyll in the adjacent mangrove forest was high (mean 78.3 ± 0.5 μg g−1, range 31–124 μg g−1 (Lee et al., unpubl. data)). The high microalgal abundance would have amplified the dark efflux and its difference from the light efflux. Under dark conditions, microalgae (settled phytoplankton plus the microphytobenthos) in the surface sediment contribute to sediment respiration, while their photosynthesis activity would assimilate CO2 and reduce efflux under light conditions [29], as has been demonstrated by our data. Our sampling was undertaken in 2015 but the local shellfish pond area has not decreased, according to recent data [25]. Therefore, the results of our study are valid for estimating CO2 efflux from local shellfish ponds since that time.
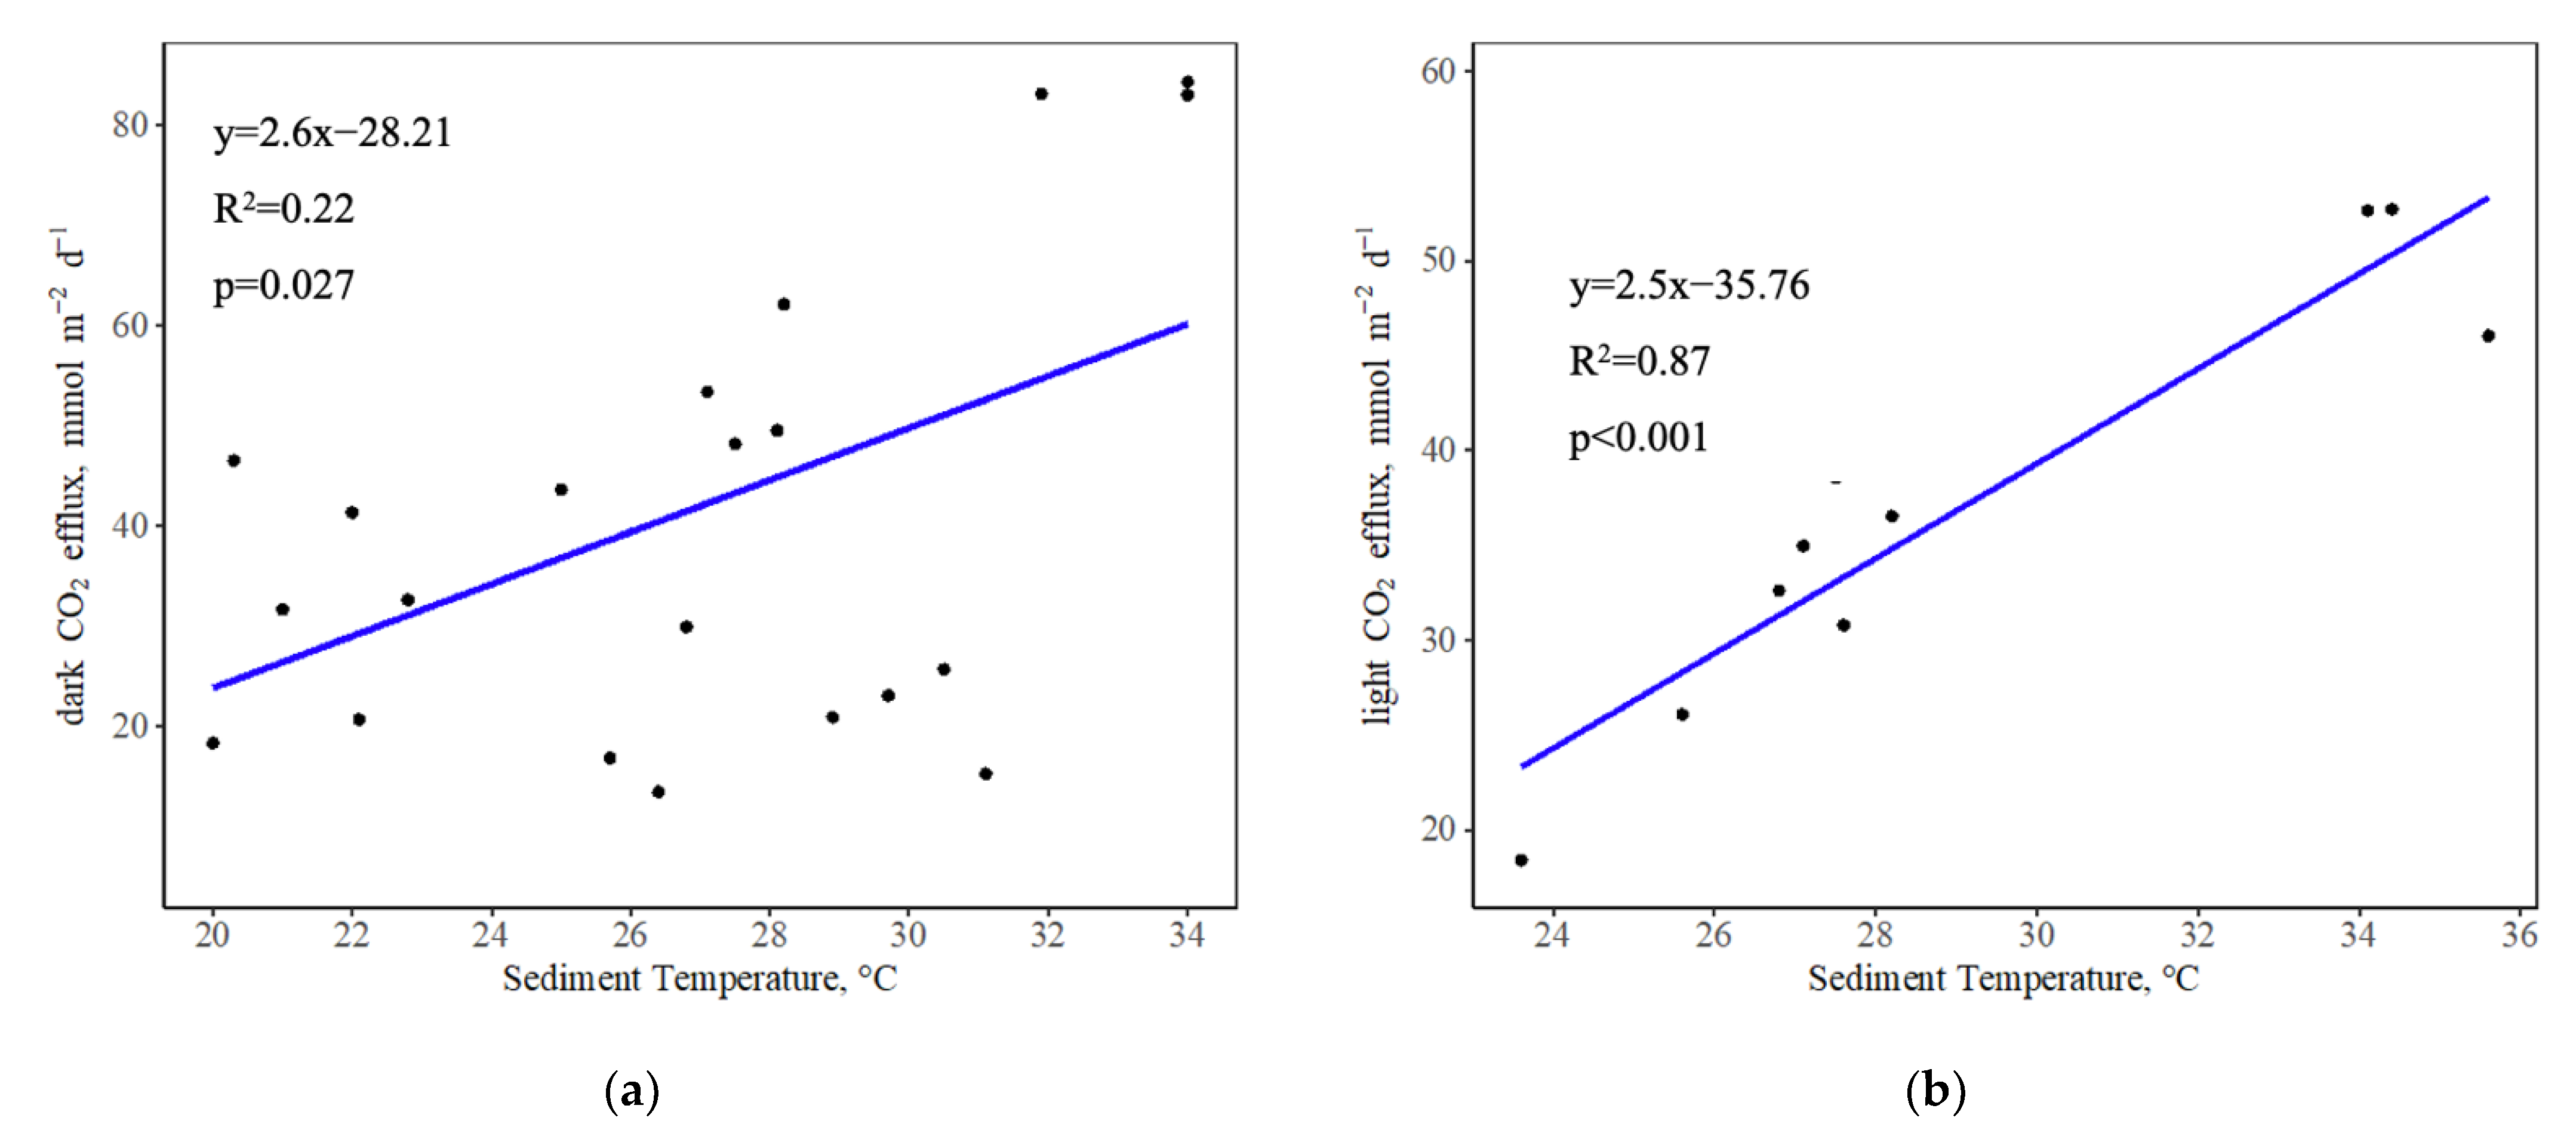
Sediment CO2 dark flux from shellfish ponds is significantly and positively correlated with sediment temperature (R2 = 0.22, p < 0.05, Figure 3a). The relationship is much stronger between light efflux and sediment temperature (R2 = 0.87, p < 0.001, Figure 3b). No statistically significant relationships were found between dark CO2 efflux and average wind speed (p = 0.892), as well as light CO2 efflux and average wind speed (p = 0.204).
Sediment CO2 efflux from the shellfish ponds showed a consistent positive correlation with temperature under both dark and light conditions in our study. In particular, the slopes of the linear relationships between dark or light CO2 efflux and temperature are 2.6 and 2.5, respectively, thereby reflecting the similar dependence of dark/light sediment respiration on temperature. Given a rise of 1 °C in sediment temperature, average dark and light CO2 efflux from the ponds will increase from 41.52 and 36.22 mmol m−2 d−1 to 44.12 and 38.72 mmol m−2 d−1, respectively, based on the relationships between CO2 efflux and temperature. This corresponds to the 6.56% increase in average daily CO2 efflux from the ponds. Temperature is a critical factor in determining coastal sediment respiration [30,31]. Increases in temperature may stimulate microbial activities, contributing to C mineralization, resulting in increased sediment decomposition rates and, thereby, CO2 efflux [32]. As our measurements were made in spring, which has intermediate temperatures with respect to the annual range, our data are expected to be close to the annual average efflux.
3.2. Sediment CO2 Efflux from Aquaculture/Shellfish Ponds in China
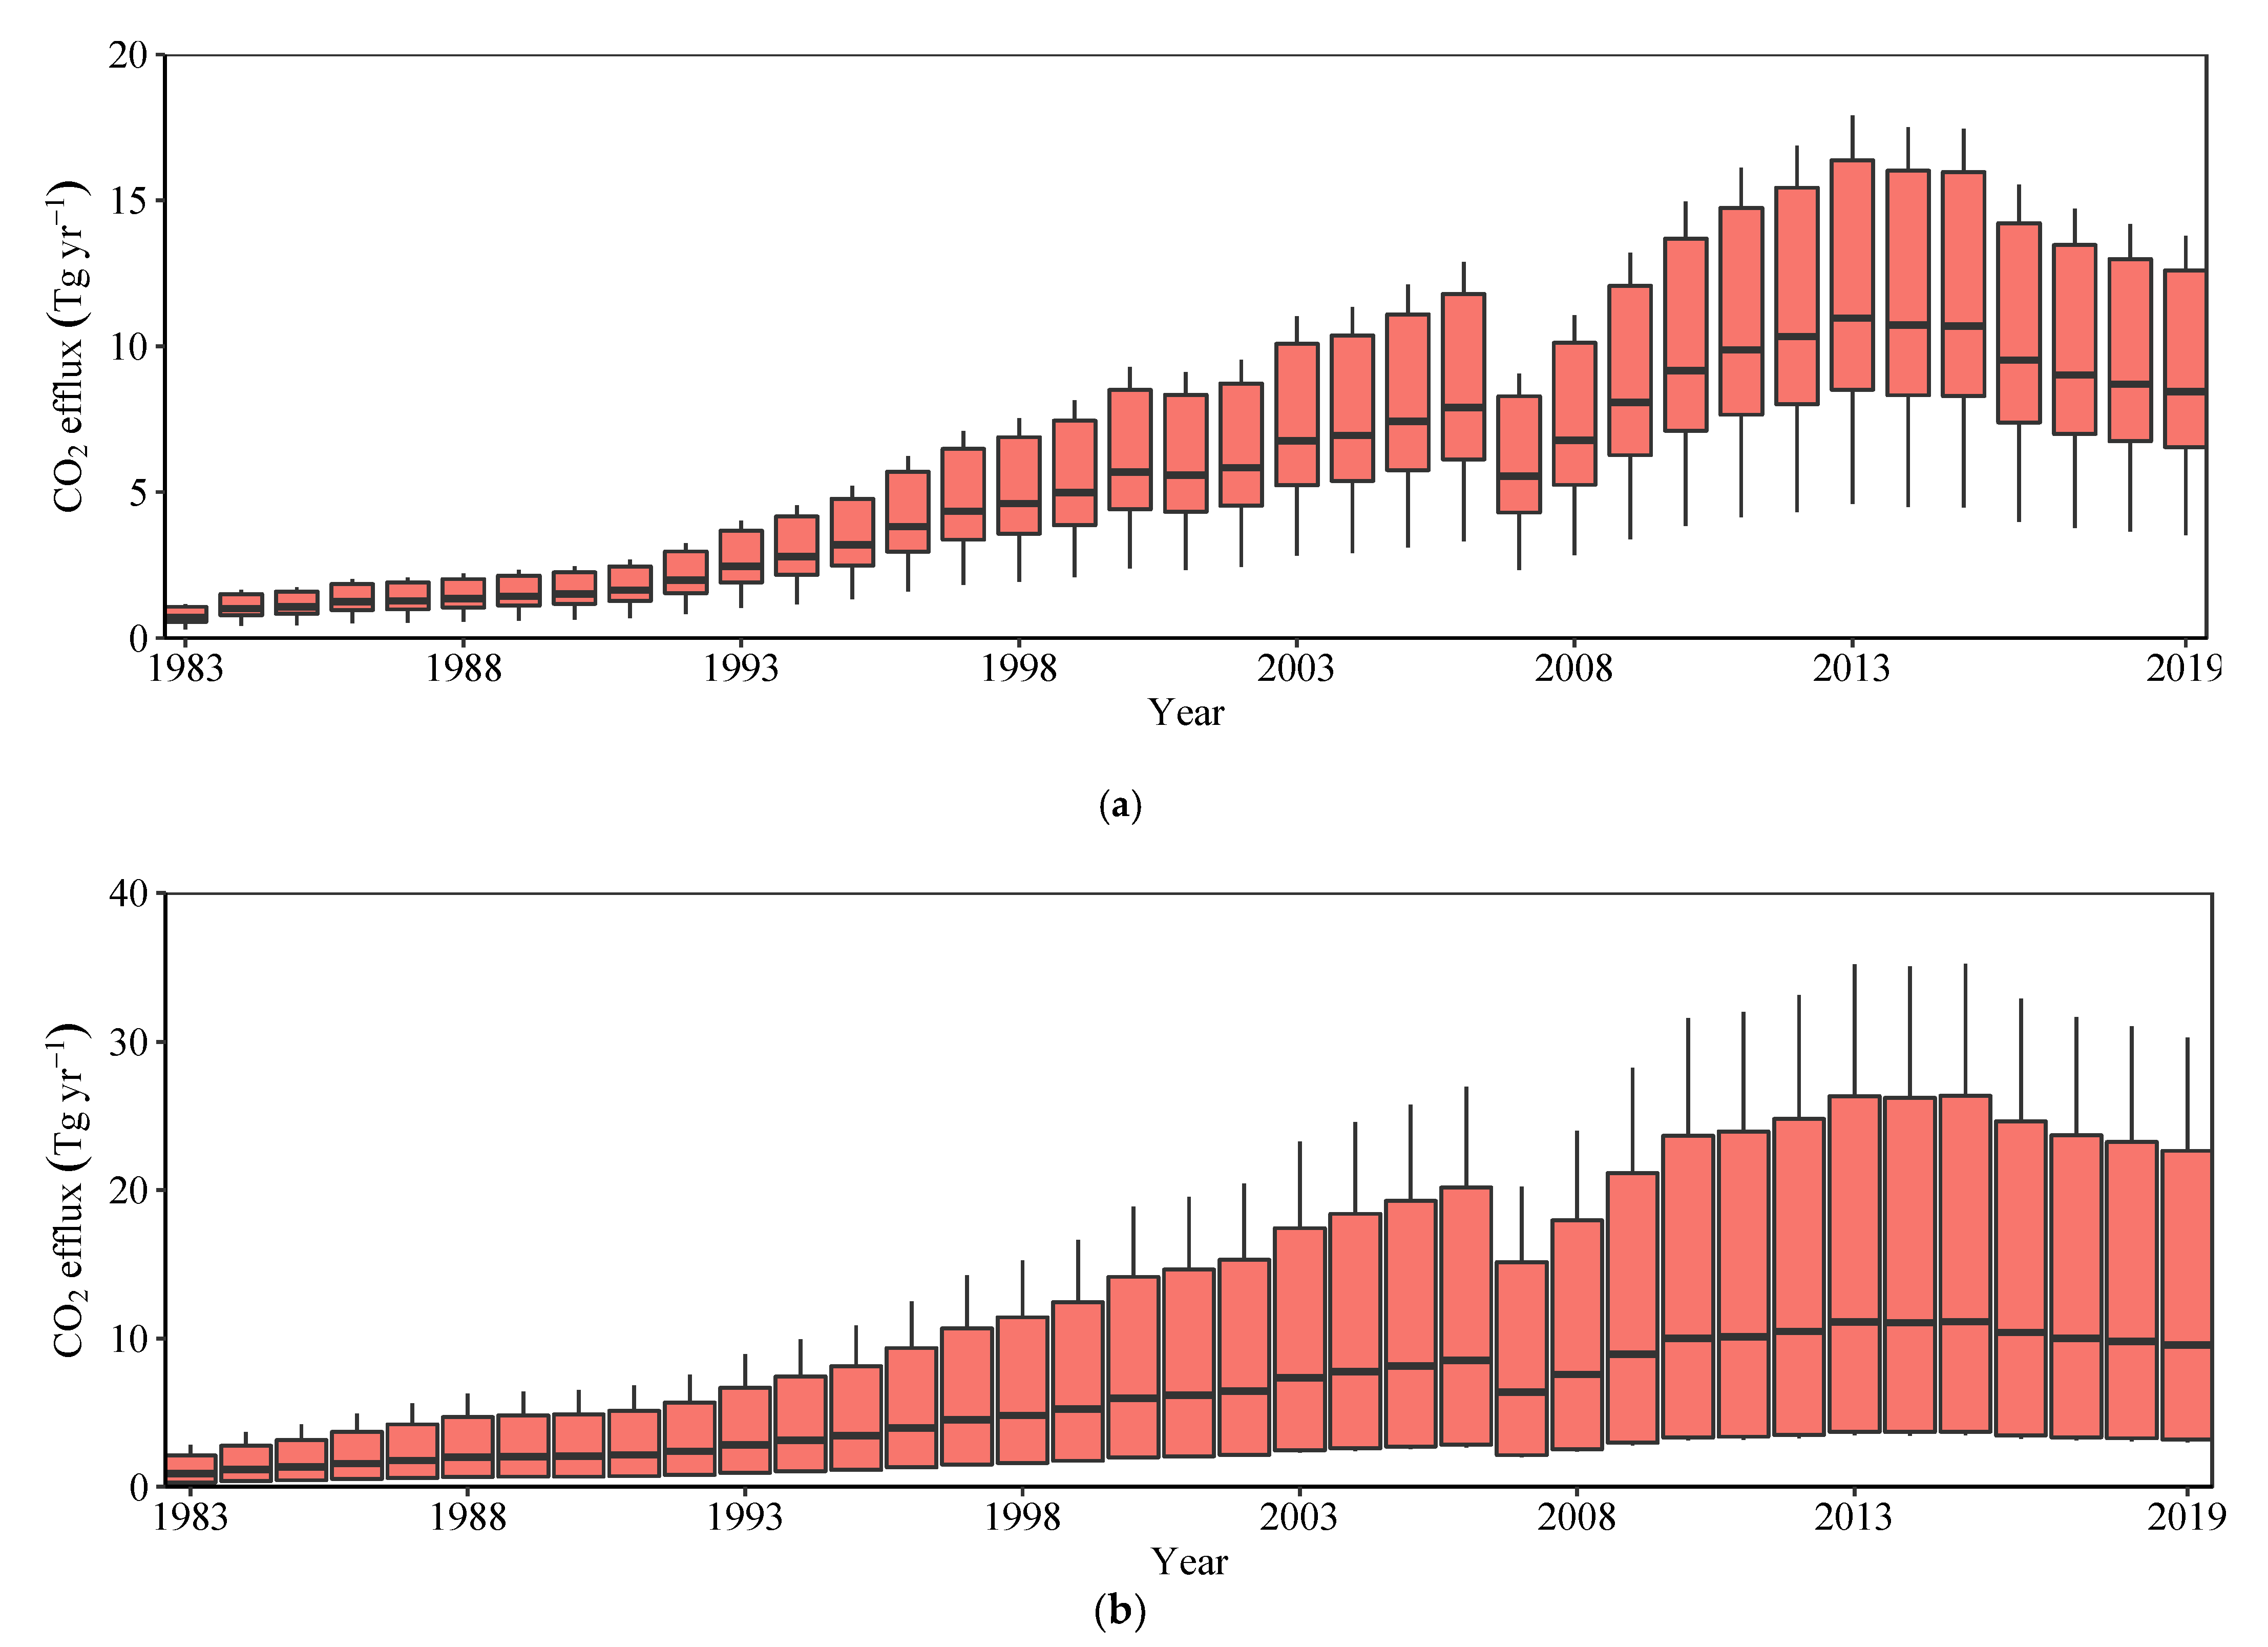
Our extrapolated result indicates that the lower end of total CO2 efflux from shellfish ponds ranged from 0.3 Tg yr−1 to 4 Tg yr−1, whereas the higher end varied between 1 Tg yr−1 and 12 Tg yr−1 during the period from 1983 to 2019. Likewise, total CO2 efflux from aquaculture ponds varied from 0.5–2 Tg yr−1 to 6–20 Tg yr−1 from 1983 to 2019 (Figure 4), based on average CO2 efflux (1.06 kg CO2 m−2 yr−1) from different aquaculture ponds in China (Table 1). Taking into account a conversion rate of 44%, CO2 efflux as a result of mangrove forest loss due to its replacement with shellfish ponds was 2–5 Tg, while replacement by aquaculture ponds was 3–9 Tg in 2019.
The area of shellfish ponds has been increasing almost continuously since the 1980s (R2 = 0.92, p < 0.001, Table 2). Similarly, the area of an aquaculture pond is positively correlated with time (R2 = 0.94, p < 0.001). However, the area of shellfish ponds has decreased and is negatively correlated with the passage of time since 2011 (2012) (R2 = 0.59, p < 0.05), as is the area of an aquaculture pond (R2 = 0.63, p < 0.05). We used the regression relationship between pond area and the passage of time since the 1980s to propagate CO2 efflux from shellfish (aquaculture) ponds as scenario 1, and the relationship since the 2010s as scenario 2. Average CO2 and all greenhouse gas efflux (including CO2, CH4 and N2O) from aquaculture ponds in China reached 1.06 kg CO2 m−2 yr−1 and 9.76 kg CO2-eq m−2 yr−1, respectively (Table 1). Following the above propagation approach, CO2 efflux from shellfish and aquaculture ponds converted from mangroves in China is expected to reach 8–29 and 18–64 Tg yr−1, respectively, in 2050 under scenario 1 but only 0.3–1 and 3–10 Tg yr−1, respectively, in 2050 under scenario 2. Similarly, all greenhouse gas efflux from aquaculture ponds are expected to reach 169–593 Tg yr−1 in 2050 under scenario 1 but 28–97 Tg yr−1 under scenario 2.
Our results suggest that the calculated CO2 efflux from aquaculture ponds in China has increased remarkably during the past 30 years. Both the lower and higher ends of flux in 2019 are an order of magnitude higher than those in 1980. Our estimated CO2 efflux from shellfish ponds in 2019 (4–12 Tg yr−1) is also comparable to CO2 efflux from shrimp ponds in Indonesia (6–14 Tg yr−1) [16]. CO2 efflux from aquaculture ponds is well within the above efflux range of mangrove deforestation. This is another example of how resource management policy in the world’s most populous country could influence the global environment. However, the overall area of mangroves in China has increased by 13% in the period from 1980 to 2010 [27] owing to mangrove restoration initiatives. Mangroves are known to be more efficient in carbon sequestration compared with terrestrial ecosystems [32] but the change in CO2 efflux due to mangrove restoration depends on the land use types before they are restored. Furthermore, it is necessary to develop a temporal trajectory of the sediment CO2 flux from mangrove seedlings to mature mangroves [39].
3.3. CO2 Efflux Compared with Other Land Uses Transformed from Tropical Wetlands
Sediment CO2 efflux in our study is comparable to reported efflux from land converted from mangroves and peatlands. In reported CO2 efflux from deforested mangroves, our estimated CO2 efflux (0.61–0.90 kg CO2 m−2 yr−1) is lower than the flux (1.60–10.60 kg CO2 m−2 yr−1) from mangrove forest converted to shrimp ponds or mangrove clearing [40]. Other studies have reported CO2 efflux from land converted from tropical peatlands (Table 3). The CO2 efflux in our study is close to the lower limit among flux from these converted land uses (0.75–9.4 kg CO2 m−2 yr−1), including paddy fields, cassava fields, rice–soybean rotation fields, sago and oil palm plantations, and pulpwood plantations. Other anthropogenic activities may also affect CO2 efflux from mangroves. From mangrove forests, local communities may obtain fish, gastropods and crustaceans that contribute to CO2 efflux from the sediment surface [29]. Other disturbances may destroy mangrove forests and affect CO2 efflux from mangroves, including the historical development of urban centers, reclamation, silviculture, salt extraction and charcoal production [21,41].
3.4. Pond CO2 Efflux Compared with Mangrove Forests
CO2 effluxes from converted and unconverted mangroves reported herein are close but higher than the average reported CO2 efflux in the literature. Both average CO2 dark and light efflux from shellfish ponds (2.46 and 1.66 g CO2 m−2 d−1) are higher than the adjacent natural mangroves without the influence of aquaculture wastewater (1.80 and −0.18 g CO2 m−2 d−1), while average dark efflux is lower but light efflux is higher from shellfish ponds than those from the adjacent natural mangroves with the influence of aquaculture wastewater (3.21 and −0.15 g CO2 m−2 d−1) (Lee et al. (unpubl. data)). Bouillon, et al. [49] reported that the dark fluxes from mangrove sediments averaged at 61 mmol m−2 d−1 (= 2.68 g CO2 m−2 d−1), while mean light fluxes reflected a net uptake of CO2 at −15 mmol m−2 d−1 (= −0.66 g CO2 m−2 d−1). Our measured dark fluxes from shellfish ponds are therefore 0.4 times higher than the measured fluxes from adjacent mangroves that are devoid of aquaculture wastewater but are 0.3 times lower than the measured fluxes from adjacent mangroves receiving aquaculture wastewater, comparable to these global averages. In contrast, under light conditions, there is a net CO2 emission from shellfish ponds but CO2 assimilation from the adjacent mangroves devoid of aquaculture wastewater, and from the global data. Combining dark and light fluxes, CO2 effluxes from shellfish ponds are 1.54, 0.23 and 1.03 times higher than both the adjacent mangroves devoid of and receiving aquaculture wastewater, and global averages. As far as shellfish ponds are concerned, the notably high CO2 efflux in this study may be primarily attributed to the high nutrient loading resulting from fertilizers added to stimulate phytoplankton bloom in the fodder ponds [23] and thereafter flushed into the shellfish ponds. As for the natural mangroves receiving aquaculture wastewater, CO2 efflux is also rather high due to the high organic material and nutrient input [22] from adjacent aquaculture pond effluent during the tidal exchange. The sediment (%N) recorded in a parallel study in the mangrove forest ranged between 0.109 and 0.273% dry weight (Lee et al. (unpubl. data)). This hypothesis is confirmed by a study on shrimp farming [50], where the authors suggested that mangrove sediment CO2 efflux, influenced by the wastewater of shrimp ponds, was almost five times higher than that from areas unaffected by wastewater. Microbial respiration is promoted by the addition of nutrients in pond effluents.
Another significant process enhancing sediment respiration is the frequent physical disturbance caused by fishing activities in the ponds. Razor clams are sessile deep burrowers and are usually collected by hand, by fishermen traversing the sediment during draw-down periods. This disturbance increases sediment respiration by increasing the effective area of the sediment–air interface, as well as causing the exposure of organic matter stored in the deep sediment layers to oxidizing conditions.
3.5. Uncertainties and Implications
In this study, we have assumed that emissions from shrimp and razor clam production ponds are typical of other aquaculture operations developed from mangrove forest conversion in China. This is of course a big assumption, as different target species will involve dissimilar management protocols as well as different degrees of disruption of natural mangrove C biogeochemistry. Finfish aquaculture, for example, involves less frequent aerial exposure of the bottom sediment but a higher environmental C loss rate due to low feed-use efficiency and higher waste generation. Shrimp ponds usually operate with less fertilization, a lower percentage of sediment aerial exposure, or physical disturbance of the substrate, but they often still demonstrate heavy feed input. Razor clams are filter-feeders that need lower levels of organic matter and nutrients in comparison with fish and crabs. The different feeding habits of animals may influence their respired CO2 flux [51]. Extreme weather events, e.g., typhoons, were found to lead to a significant increase in CO2 and other greenhouse gas flux from shrimp ponds and mangroves [36,52]. A full picture of the consequences of mangrove conversion would only be possible with operation-specific emission data being available and uncertainties clarified resulting from other factors, e.g., extreme weather events. Our study focuses on the changes in CO2 efflux arising from the conversion of mangrove forests to aquaculture ponds. The impact of other anthropogenic activities may also drive changes in CO2 efflux from mangroves but does not fall in the scope of our study.
Our estimation raises concerns on mangrove management in countries where competing services, such as food production and emission reduction, threaten mangrove ecosystems. Until 2019, CO2 efflux from shellfish ponds converted from mangroves in China was 2–5 Tg, not counting the fluxes from mangrove clearing and land disturbance during pond establishment. The current estimated C stocks of mangroves in China (6.9 Tg C) [53] are close to the higher end of the range of our estimated C efflux. Nevertheless, CO2 released from shellfish ponds is far beyond our estimate if indirect CO2 emissions are considered; the conversion of mangroves to shellfish ponds also indirectly promotes CO2 emission from adjacent natural mangroves, as mirrored by the high CO2 efflux from mangroves receiving aquaculture effluent in our study. Mangroves are known to fulfill a regulating function by tuning the local microclimate. The conversion of mangroves to shellfish ponds not only increases CO2 efflux but may also counteract the microclimate-regulating effect of mangroves for the local communities. The expansion of shellfish ponds into mangrove areas must be managed as part of a comprehensive strategy to conserve the tropical shorelines of China since any effort to protect mangroves will be easily offset by uncontrolled aquaculture pond development, particularly when carbon-rich, mature landward forests are considered for conversion into high-emission aquaculture ponds.
4. Conclusions
The tested CO2 efflux from shellfish ponds converted from mangroves in China revealed high levels of dark and light CO2 efflux from these ponds (0.61 and 0.90 kg CO2 m−2 yr−1, respectively; equivalent to 37.67 and 56.0 mmol m−2 d−1) compared with reported fluxes from land converted from tropical wetlands. These effluxes are comparable to effluxes from adjacent natural mangroves that are receiving aquaculture wastewater. Both fluxes were positively correlated with sediment temperature, and the rise of 1 °C in sediment temperature corresponds to the 6.56% rise in CO2 efflux from the ponds. CO2 efflux from shellfish ponds soared from 0.3–1 Tg yr−1 in 1983 to 4–12 Tg yr−1 in 2019, and given the historical trend, is expected to hit 8–29 Tg yr−1 under the business-as-usual scenario but around 30 times lower (0.3–1 Tg yr−1) under an area-shrinking scenario by 2050. In 2019, the flux resulting from mangrove conversion was 2–5 Tg, the C content of which approaches that of the total mangrove C stocks in China. When propagated to marine aquaculture ponds in China, the estimated CO2 efflux is ~30% higher than that of shellfish ponds.
For the first time, in this study, we estimated the impact of mangrove conversion to aquaculture ponds on CO2 efflux in China. The restoration of mangroves from aquaculture ponds in China was highlighted as a way to increase carbon storage without accounting for reduced CO2 efflux [54], as demonstrated by our study. This study underscores the importance of mangrove conservation from the perspective of the “blue C” budget policy in China. As the lifespan of aquaculture ponds is limited, we echo calls for climate mitigation strategies (e.g., REDD+) to include mangrove restoration from abandoned mariculture ponds [55] where possible, in subtropical regions such as southern China. Ecologically sustainable aquaculture [56], without the need to invade mangroves, should be a priority consideration.
Author Contributions
X.O. contributed to conceptualization, field survey, data analysis and writing the original draft. S.L. contributed to conceptualization and editing the original draft. W.W. contributed to edit the original draft. All authors have read and agreed to the published version of the manuscript.
Funding
This research received no external funding.
Institutional Review Board Statement
Not applicable.
Informed Consent Statement
Not applicable.
Data Availability Statement
The data will be available upon request to the corresponding author.
Acknowledgments
We cordially thank the pond owners for permission of sampling in their ponds. Kaizhu Wu is appreciated for his assistance in the field. Qiucheng Wu helped to coordinate the field work.
Conflicts of Interest
The authors declare no conflict of interest.
References
- Ouyang, X.; Guo, F. Patterns of Mangrove Productivity and Support for Marine Fauna. In Handbook of Halophytes; Grigore, M.-N., Ed.; Springer: Cham, Switzerland, 2020. [Google Scholar] [CrossRef]
- Lee, S.Y.; Primavera, J.H.; Dahdouh-Guebas, F.; McKee, K.; Bosire, J.O.; Cannicci, S.; Diele, K.; Fromard, F.; Koedam, N.; Marchand, C.; et al. Ecological role and services of tropical mangrove ecosystems: A reassessment. Glob. Ecol. Biogeogr. 2014, 23, 726–743. [Google Scholar] [CrossRef]
- Ouyang, X.; Guo, F. Paradigms of mangroves in treatment of anthropogenic wastewater pollution. Sci. Total Environ. 2016, 544, 971–979. [Google Scholar] [CrossRef] [PubMed]
- Ouyang, X.; Lee, S.Y.; Connolly, R.M.; Kainz, M.J. Spatially-explicit valuation of coastal wetlands for cyclone mitigation in Australia and China. Sci. Rep. 2018, 8, 3035. [Google Scholar] [CrossRef]
- Jones, T.G.; Ratsimba, H.R.; Ravaoarinorotsihoarana, L.; Cripps, G.; Bey, A. Ecological Variability and Carbon Stock Estimates of Mangrove Ecosystems in Northwestern Madagascar. Forests 2014, 5, 177–205. [Google Scholar] [CrossRef] [Green Version]
- Polidoro, B.A.; Carpenter, K.E.; Collins, L.; Duke, N.C.; Ellison, A.M.; Ellison, J.C.; Farnsworth, E.J.; Fernando, E.S.; Kathiresan, K.; Koedam, N.E. The loss of species: Mangrove extinction risk and geographic areas of global concern. PLoS ONE 2010, 5, e10095. [Google Scholar] [CrossRef]
- Primavera, J.H. Overcoming the impacts of aquaculture on the coastal zone. Ocean Coast. Manag. 2006, 49, 531–545. [Google Scholar] [CrossRef]
- FAO. The World’s Mangroves 1980–2005: A Thematic Study Prepared in the Framework of the Global Forest Resources Assessment. 2007. Available online: https://www.fao.org/publications/card/en/c/880053ed-9752-5939-b242-35fd7603a2ba/ (accessed on 7 October 2021).
- Richards, D.R.; Friess, D.A. Rates and drivers of mangrove deforestation in Southeast Asia, 2000–2012. Proc. Natl. Acad. Sci. USA 2016, 113, 344–349. [Google Scholar] [CrossRef] [Green Version]
- Hamilton, S. Assessing the role of commercial aquaculture in displacing mangrove forest. Bull. Mar. Sci. 2013, 89, 585–601. [Google Scholar] [CrossRef]
- Peng, Y.; Li, X.; Wu, K.; Peng, Y.; Chen, G. Effect of an integrated mangrove-aquaculture system on aquacultural health. Front. Biol. China 2009, 4, 579–584. [Google Scholar] [CrossRef]
- MOA. China Fisheries Statistic Yearbook 1984–2017; China Agriculture Press: Beijing, China, 2017. [Google Scholar]
- Csavas, I. Aquaculture development and environmental issues in the developing countries of Asia. In Environment and Aquaculture in Developing Countries; Pullin, R.S.V., Maclean, H.R.J.L., Eds.; International Center for Living Aquatic Resources Management: Manila, Philippines, 1993; pp. 74–101. [Google Scholar]
- FAO. The State of World Fisheries and Aquaculture, 2016; Food and Agriculture Organization of the United Nations, Fisheries Department: Rome, Italy, 2016; Volume 3. [Google Scholar]
- Ouyang, X.; Lee, S.Y. Improved estimates on global carbon stock and carbon pools in tidal wetlands. Nat. Commun. 2020, 11, 317. [Google Scholar] [CrossRef] [Green Version]
- Sidik, F.; Lovelock, C.E. CO2 efflux from shrimp ponds in Indonesia. PLoS ONE 2013, 8, e66329. [Google Scholar] [CrossRef] [Green Version]
- Ong, J.E. Mangroves—A carbon source and sink. Chemosphere 1993, 27, 1097–1107. [Google Scholar] [CrossRef]
- Kauffman, J.B.; Arifanti, V.B.; Trejo, H.H.; García, M.C.J.; Norfolk, J.; Cifuentes, M.; Hadriyanto, D.; Murdiyarso, D. The jumbo carbon footprint of a shrimp: Carbon losses from mangrove deforestation. Front. Ecol. Environ. 2017, 15, 183–188. [Google Scholar] [CrossRef]
- Maher, D.T.; Santos, I.R.; Leuven, J.R.; Oakes, J.M.; Erler, D.V.; Carvalho, M.C.; Eyre, B.D. Novel Use of Cavity Ring-down Spectroscopy to Investigate Aquatic Carbon Cycling from Microbial to Ecosystem Scales. Environ. Sci. Technol. 2013, 47, 12938–12945. [Google Scholar] [CrossRef]
- Luo, Y.; Zhou, X. Soil Respiration and the Environment; Academic Press: London, UK, 2010. [Google Scholar]
- Lee, S.Y.; Khim, J.S. Hard science is essential to restoring soft-sediment intertidal habitats in burgeoning East Asia. Chemosphere 2017, 168, 765–776. [Google Scholar] [CrossRef]
- Wang, M.; Zhang, J.; Tu, Z.; Gao, X.; Wang, W. Maintenance of estuarine water quality by mangroves occurs during flood periods: A case study of a subtropical mangrove wetland. Mar. Pollut. Bull. 2010, 60, 2154–2160. [Google Scholar] [CrossRef]
- Wu, H.; Peng, R.; Yang, Y.; He, L.; Wang, W.; Zheng, T.; Lin, G. Mariculture pond influence on mangrove areas in south China: Significantly larger nitrogen and phosphorus loadings from sediment wash-out than from tidal water exchange. Aquaculture 2014, 426–427, 204–212. [Google Scholar] [CrossRef]
- Xu, L.; Furtaw, M.D.; Madsen, R.A.; Garcia, R.L.; Anderson, D.J.; McDermitt, D.K. On maintaining pressure equilibrium between a soil CO2 flux chamber and the ambient air. J. Geophys. Res. 2006, 111, D08S10. [Google Scholar]
- NBS. China Fisheries Year Book (1984–2020); National Bureau of Statistics of China: Beijing, China, 2020.
- Wang, W.; Wang, M. The Mangroves of China; Science Press: Beijing, China, 2007. [Google Scholar]
- Liao, B.; Zhang, Q. Area, Distribution and Species Composition of Mangroves in China. Wetl. Sci. 2014, 12, 435–440. (In Chinese) [Google Scholar]
- R Core Team. A Language and Environment for Statistical Computing; R Foundation for Statistical Computing: Vienna, Austria, 2014. [Google Scholar]
- Ouyang, X.; Lee, S.Y.; Connolly, R.M. Structural equation modelling reveals factors regulating surface sediment organic carbon content and CO2 efflux in a subtropical mangrove. Sci. Total Environ. 2017, 578, 513–522. [Google Scholar] [CrossRef] [Green Version]
- Livesley, S.J.; Andrusiak, S.M. Temperate mangrove and salt marsh sediments are a small methane and nitrous oxide source but important carbon store. Estuar. Coast. Shelf Sci. 2012, 97, 19–27. [Google Scholar] [CrossRef]
- Magenheimer, J.F.; Moore, T.R.; Chmura, G.L.; Daoust, R.J. Methane and carbon dioxide flux from a macrotidal salt marsh, Bay of Fundy, New Brunswick. Estuaries 1996, 19, 139–145. [Google Scholar] [CrossRef]
- Ouyang, X.; Lee, S.Y. Updated estimates of carbon accumulation rates in coastal marsh sediments. Biogeosciences 2014, 11, 5057–5071. [Google Scholar] [CrossRef] [Green Version]
- Chen, Y.; Dong, S.; Wang, F.; Gao, Q.; Tian, X. Carbon dioxide and methane fluxes from feeding and no-feeding mariculture ponds. Environ. Pollut. 2016, 212, 489–497. [Google Scholar] [CrossRef]
- Tong, C.; Bastviken, D.; Tang, K.W.; Yang, P.; Yang, H.; Zhang, Y.; Guo, Q.; Lai, D.Y. Annual CO2 and CH4 fluxes in coastal earthen ponds with Litopenaeus vannamei in southeastern China. Aquaculture 2021, 545, 737229. [Google Scholar] [CrossRef]
- Yang, P.; Lai, D.F.; Yang, H.; Tong, C. Carbon dioxide dynamics from sediment, sediment-water interface and overlying water in the aquaculture shrimp ponds in subtropical estuaries, southeast China. J. Environ. Manag. 2019, 236, 224–235. [Google Scholar] [CrossRef]
- Yang, P.; Zhang, Y.; Bastviken, D.; Lai, D.Y.; Yang, H.; Zhang, Y.F.; Guo, Q.Q.; Tan, L.; Tong, C. Large increase in diffusive greenhouse gas fluxes from subtropical shallow aquaculture ponds during the passage of typhoons. J. Hydrol. 2020, 583, 124643. [Google Scholar] [CrossRef]
- Yang, P.; Zhang, Y.; Lai, D.Y.; Tan, L.; Jin, B.; Tong, C. Fluxes of carbon dioxide and methane across the water–atmosphere interface of aquaculture shrimp ponds in two subtropical estuaries: The effect of temperature, substrate, salinity and nitrate. Sci. Total Environ. 2018, 635, 1025–1035. [Google Scholar] [CrossRef]
- Yang, P.; Lai, D.Y.; Huang, J.F.; Tong, C. Effect of drainage on CO2, CH4, and N2O fluxes from aquaculture ponds during winter in a subtropical estuary of China. J. Environ. Sci. 2018, 65, 72–82. [Google Scholar] [CrossRef]
- Ouyang, X.; Lee, S.Y.; Connolly, R.M. Using isotope labeling to partition sources of CO2 efflux in newly established mangrove seedlings. Limnol. Oceanogr. 2018, 63, 731–740. [Google Scholar] [CrossRef] [Green Version]
- Lovelock, C.E.; Ruess, R.W.; Feller, I.C. CO2 efflux from cleared mangrove peat. PLoS ONE 2011, 6, e21279. [Google Scholar] [CrossRef] [PubMed] [Green Version]
- Magris, R.A.; Barreto, R. Mapping and assessment of protection of mangrove habitats in Brazil. Pan-Am. J. Aquat. Sci. 2010, 5, 546–556. [Google Scholar]
- Watanabe, A.; Purwanto, B.H.; Ando, H.; Kakuda, K.-i.; Jong, F.-S. Methane and CO2 fluxes from an Indonesian peatland used for sago palm (Metroxylon sagu Rottb.) cultivation: Effects of fertilizer and groundwater level management. Agric. Ecosyst. Environ. 2009, 134, 14–18. [Google Scholar] [CrossRef]
- Melling, L.; Hatano, R.; Goh, K.J. Soil CO2 flux from three ecosystems in tropical peatland of Sarawak, Malaysia. Tellus B 2005, 57, 1–11. [Google Scholar] [CrossRef]
- Jauhiainen, J.; Silvennoinen, H.; Hämäläinen, R.; Kusin, K.; Limin, S.; Raison, R.J.; Vasander, H. Nitrous oxide fluxes from tropical peat with different disturbance history and management. Biogeosciences 2012, 9, 1337–1350. [Google Scholar] [CrossRef] [Green Version]
- Furukawa, Y.; Inubushi, K.; Ali, M.; Itang, A.; Tsuruta, H. Effect of changing groundwater levels caused by land-use changes on greenhouse gas fluxes from tropical peat lands. Nutr. Cycl. Agroecosyst. 2005, 71, 81–91. [Google Scholar] [CrossRef]
- Hadi, A.; Inubushi, K.; Furukawa, Y.; Purnomo, E.; Rasmadi, M.; Tsuruta, H. Greenhouse gas emissions from tropical peatlands of Kalimantan, Indonesia. Nutr. Cycl. Agroecosyst. 2005, 71, 73–80. [Google Scholar] [CrossRef]
- Inubushi, K.; Furukawa, Y.; Hadi, A.; Purnomo, E.; Tsuruta, H. Seasonal changes of CO2, CH4 and N2O fluxes in relation to land-use change in tropical peatlands located in coastal area of South Kalimantan. Chemosphere 2003, 52, 603–608. [Google Scholar] [CrossRef]
- Reijnders, L.; Huijbregts, M. Palm oil and the emission of carbon-based greenhouse gases. J. Clean. Prod. 2008, 16, 477–482. [Google Scholar] [CrossRef]
- Bouillon, S.; Borges, A.V.; Castañeda-Moya, E.; Diele, K.; Dittmar, T.; Duke, N.C.; Kristensen, E.; Lee, S.Y.; Marchand, C.; Middelburg, J.J.; et al. Mangrove production and carbon sinks: A revision of global budget estimates. Glob. Biogeochem. Cycles 2008, 22, GB2013. [Google Scholar] [CrossRef] [Green Version]
- Suárez-Abelenda, M.; Ferreira, T.O.; Camps-Arbestain, M.; Rivera-Monroy, V.H.; Macías, F. The effect of nutrient-rich effluents from shrimp farming on mangrove soil carbon storage and geochemistry under semi-arid climate conditions in northern Brazil. Geoderma 2014, 213, 551–559. [Google Scholar] [CrossRef]
- Ouyang, X.; Lee, C.Y.; Lee, S.Y. Effects of food and feeding regime on CO2 fluxes from mangrove consumers–Do marine benthos breathe what they eat? Mar. Environ. Res. 2021, 169, 105352. [Google Scholar] [CrossRef] [PubMed]
- Ouyang, X.; Guo, F.; Lee, S.Y. The impact of super-typhoon Mangkhut on sediment nutrient density and fluxes in a mangrove forest in Hong Kong. Sci. Total Environ. 2021, 766, 142637. [Google Scholar] [CrossRef]
- Liu, H.; Ren, H.; Hui, D.; Wang, W.; Liao, B.; Cao, Q. Carbon stocks and potential carbon storage in the mangrove forests of China. J. Environ. Manag. 2014, 133, 86–93. [Google Scholar] [CrossRef] [PubMed]
- Chen, L.; Fan, H.; Su, Z.; Lin, Q.; Tao, Y. Enhancing carbon storage in mangrove ecosystems of China through sustainable restoration and aquaculture actions. Wetl. Carbon Environ. Manag. 2021, 127–141. [Google Scholar]
- Lewis III, R.R. Ecological engineering for successful management and restoration of mangrove forests. Ecol. Eng. 2005, 24, 403–418. [Google Scholar] [CrossRef]
- Costa-Pierce, B.A. Ecology as the paradigm for the future of aquaculture. In Ecological Aquaculture: The Evolution of the Blue Revolution; Costa-Pierce, B.A., Ed.; Blackwell Science Ltd.: Oxford, UK, 2002; pp. 339–372. [Google Scholar]
Figure 1.
Sampling locations in mangroves and shellfish ponds adjoining the Zhangjiangkou National Mangrove Nature Reserve, Fujian, China.
Figure 1.
Sampling locations in mangroves and shellfish ponds adjoining the Zhangjiangkou National Mangrove Nature Reserve, Fujian, China.

Figure 2.
Growth of aquaculture/shellfish pond area in China, 1983–2019. The pond area generally increases at an alarming rate, except for a steep and short decrease between 2006 and 2007 and between 2015 and 2019.
Figure 2.
Growth of aquaculture/shellfish pond area in China, 1983–2019. The pond area generally increases at an alarming rate, except for a steep and short decrease between 2006 and 2007 and between 2015 and 2019.

Figure 3.
The linear relationship between CO2 dark (a) and light (b) efflux and surface sediment temperature. Dark flux shows a weak but significant correlation with sediment temperature (R2 = 0.22, p = 0.027) while light flux is very strongly correlated with sediment temperature (R2 = 0.87, p < 0.001).

Figure 4.
Estimated CO2 release from shellfish (a) and aquaculture (b) ponds in China, 1983–2019. The propagation method indicates a CO2 emission range from shellfish (aquaculture) at 4–12 Tg yr−1 (6–20 Tg yr−1) in 2019, much higher than that of 0.3–1 Tg yr−1 (0.5–2 Tg yr−1) in 1983. The lower and upper hinges correspond to the first and third quartiles, i.e., 25th and 75th percentiles, respectively. The lower and upper whiskers correspond to the lowest and highest values within 1.5 times of the interquartile ranges from the first and third quartiles, respectively.


Table 1.
Greenhouse gas fluxes from marine aquaculture ponds in China. Global warming potentials of 45 and 270 for CH4 and N2O were used to transform CH4 and N2O efflux, and to estimate greenhouse gas flux, at kg CO2-eq m−2 yr−1.
Table 1.
Greenhouse gas fluxes from marine aquaculture ponds in China. Global warming potentials of 45 and 270 for CH4 and N2O were used to transform CH4 and N2O efflux, and to estimate greenhouse gas flux, at kg CO2-eq m−2 yr−1.
| Type of Ponds | Location | CO2 Efflux (kg CO2 m−2 yr−1) | CH4 Efflux (kg CH4 m−2 yr−1) | N2O Efflux (kg N2O m−2 yr−1) | References | Remarks |
|---|---|---|---|---|---|---|
| Shrimp | Mariculture base at Qingdao, China | −5.69 × 10⁻³ | 5.70 × 10⁻⁴ | NA | [33] | Pond with feed supply |
| Shrimp—sea cucumber | 1.12 × 10⁻² | 6.80 × 10⁻⁵ | NA | Pond without feed supply | ||
| Shrimp | Shanyutan Wetland, China | −0.16 | 0.2 | NA | [34] | |
| Shrimp | Min River Estuary, China | 0.56 | NA | NA | [35] | |
| Shrimp | Jiulong River Estuary, China | 0.48 | NA | NA | ||
| Shrimp | Shanyutan Wetland, China | 0.12 | 5.70 × 10⁻⁴ | 0 | [36] | Measured during pre- and post- typhoon periods |
| Shrimp | Shanyutan Wetland, China | 13.11 | 3.7 | 1.23 × 10⁻⁴ | Measured during typhoon | |
| Shrimp | Min River Estuary, China | 0.15 | 0.75 | NA | [37] | |
| Shrimp | Jiulong River Estuary, China | 0.13 | 0.08 | NA | ||
| Shrimp | Shanyutan Nature Reserve, China | 2.89 | 0.92 | 7.52 × 10⁻³ | [38] | Drained ponds |
| Shrimp | Shanyutan Nature Reserve, China | 0.19 | 0.1 | 3.85 × 10⁻⁶ | Undrained ponds | |
| Clam | Yunxiao, China | 0.76 | NA | NA | This study | |
| All | China | 1.06 (mean) 0.19 (median) | 0.49 (mean) 0.15 (median) | 2.52 × 10⁻³ (mean) 6.15 × 10⁻⁵ (median) | Greenhouse gas flux: 9.76 kg CO2-eq m−2 yr−1 (mean); 2.66 kg CO2-eq m−2 yr−1 (median) |
Table 2.
Relationships between shellfish/aquaculture pond area and the passage of time under different scenarios.
Table 2.
Relationships between shellfish/aquaculture pond area and the passage of time under different scenarios.
| Pond Type | Scenario | Regression Relationship | Statistical Parameters |
|---|---|---|---|
| Shellfish | Business-as-usual | Pond area = 42.8 × Year − 84,776.2 | F value = 398.9, R2 = 0.92, p << 0.001 |
| Area shrinking | Pond area = 76,907.7 − 37.5 × Year | F value = 9.9, R2 = 0.59, p = 0.016 | |
| Aquaculture | Business-as-usual | Pond area = 65.3 × Year − 129,300 | F value = 600.1, R2 = 0.94, p << 0.001 |
| Area shrinking | Pond area = 86,133.6 − 41.7 × Year | F value = 10.1, R2 = 0.63, p = 0.019 |
Table 3.
CO2 from land uses in relation to (sub) tropical wetland loss.
| Type of Conversion | Location | CO2 Efflux (kg CO2 m−2 yr−1) | Reference |
|---|---|---|---|
| Clam ponds | Fujian, China | 0.61 (light) 0.90 (dark) | This study |
| Shrimp ponds | Bali, Indonesia | 1.60–4.37 | [16] |
| Mangrove clearing | Belize | 2.90–10.60 | [40] |
| Sago palm plantation | Riau, Indonesia Sarawak Malaysia | 0.77–4.82 1.1 | [42] [43] |
| Pulpwood plantation | Sumatra, Indonesia | 9.4 | [44] |
| Paddy field | Jambi, Indonesia Kalimantan, Indonesia South Kalimantan, Indonesia | 0.96 1.4 1.2–1.5 | [45] [46] [47] |
| Cassava field | Jambi, Indonesia | 6.42 | [45] |
| Oil palm plantation | South Asia | 0.75–1.10 | [48] |
| Sarawak Malaysia | 1.1 | [43] | |
| Rice–soybean rotation field | Kalimantan, Indonesia | 2 | [46] |
Publisher’s Note: MDPI stays neutral with regard to jurisdictional claims in published maps and institutional affiliations. |
© 2021 by the authors. Licensee MDPI, Basel, Switzerland. This article is an open access article distributed under the terms and conditions of the Creative Commons Attribution (CC BY) license (https://creativecommons.org/licenses/by/4.0/).
Share and Cite
MDPI and ACS Style
Ouyang, X.; Lee, S.; Wang, W. The ‘Perfect’ Conversion: Dramatic Increase in CO2 Efflux from Shellfish Ponds and Mangrove Conversion in China. Sustainability 2021, 13, 13163. https://doi.org/10.3390/su132313163
AMA Style
Ouyang X, Lee S, Wang W. The ‘Perfect’ Conversion: Dramatic Increase in CO2 Efflux from Shellfish Ponds and Mangrove Conversion in China. Sustainability. 2021; 13(23):13163. https://doi.org/10.3390/su132313163
Chicago/Turabian StyleOuyang, Xiaoguang, Shingyip Lee, and Wenqing Wang. 2021. "The ‘Perfect’ Conversion: Dramatic Increase in CO2 Efflux from Shellfish Ponds and Mangrove Conversion in China" Sustainability 13, no. 23: 13163. https://doi.org/10.3390/su132313163
Note that from the first issue of 2016, this journal uses article numbers instead of page numbers. See further details here.