Article

Integrated Surface-Groundwater Modelling of Nitrate Concentration in Mediterranean Rivers, the Júcar River Basin District, Spain

by
Diana Yaritza Dorado-Guerra
1,*,
Javier Paredes-Arquiola
1,
Miguel Ángel Pérez-Martín
1 and
Harold Tafur Hermann
2
1
Research Institute of Water and Environmental Engineering (IIAMA), Universitat Politècnica de València, 46022 Valencia, Spain
2
Facultad de Ciencias Agropecuarias, Universidad Nacional de Colombia, Palmira 111321, Colombia
*
Author to whom correspondence should be addressed.
Sustainability 2021, 13(22), 12835; https://doi.org/10.3390/su132212835
Submission received: 29 September 2021 / Revised: 11 November 2021 / Accepted: 16 November 2021 / Published: 19 November 2021
(This article belongs to the Topic Water Management in the Era of Climatic Change)

Abstract

:
High nutrient discharge from groundwater (GW) into surface water (SW) have multiple undesirable effects on river water quality. With the aim to estimate the impact of anthropic pressures and river–aquifer interactions on nitrate status in SW, this study integrates two hydrological simulation and water quality models. PATRICAL models SW–GW interactions and RREA models streamflow changes due to human activity. The models were applied to the Júcar River Basin District (RBD), where 33% of the aquifers have a concentration above 50 mg NO3/L. As a result, there is a direct linear correlation between the nitrate concentration in rivers and aquifers (Júcar r2 = 0.9, and Turia r2 = 0.8), since in these Mediterranean basins, the main amount of river flows comes from groundwater discharge. The concentration of nitrates in rivers and GW tends to increase downstream of the district, where artificial surfaces and agriculture are concentrated. The total NO3 load to Júcar RBD rivers was estimated at 10,202 tN/year (239 kg/km2/year), from which 99% is generated by diffuse pollution, and 3378 tN/year (79 kg/km2/year) is discharged into the Mediterranean Sea. Changes in nitrate concentration in the RBD rivers are strongly related to the source of irrigation water, river–aquifer interactions, and flow regulation. The models used in this paper allow the identification of pollution sources, the forecasting of nitrate concentration in surface and groundwater, and the evaluation of the efficiency of measures to prevent water degradation, among other applications.

1. Introduction

Water crises are not only caused by droughts and shortages of the resource, but also by pollution and water quality deterioration, which reduce the quantity of safe water in many regions of the world [1]. As a result, a challenge faced by all countries is a reduction in the concentrations of pollutants in surface water (SW) and groundwater (GW) [2,3,4]. Several measures have been implemented to decrease the concentration of nitrates in water bodies around the world. The European Union has implemented some legislative instruments designed to protect water quality [5], such as the Nitrate Directive (1991), Urban Waste Water Treatment Directive (1991), and Water Framework Directive (WFD) in 2000. Despite the measures that were taken, in many areas, the water quality did not reach a good status [6,7].
The most important source of nitrate is the agriculture, which generates diffuse pollution followed by point pollution with urban and industrial discharge [8,9,10]. The nitrogen accumulated in soil leaches to water bodies through runoff or percolation, and then, hydrology is the means of transport until it is seen as a pollutant [11]. Nitrate transport in water is influenced by the interaction between SW and GW, as this interaction forms the link between land activities and aquatic ecosystems [12,13,14].
Monitoring pollution sources and nitrate loading with a high spatial and temporal resolution is challenging, and as a result, integration of large-scale hydrological models of rainfall runoff and water quality have been widely used. Among these are SWAT [15], MODFLOW [16], SHETRAN [17], QUAL2E & QUAL2K [18], STICS-MODCOU [19], and PRZM-GW [20]. A complete review of models used in pollution estimation in Europe was conducted by the Ref. [5]. Many of the hydrological models only consider the base flow component of the aquifers, or river–aquifer interactions are not represented. This introduces further uncertainty in the runoff calculation. However, the discharge of GW into the rivers is considered important in arid and semi-arid areas, as it is part of the non-stationarity of the rain–runoff relationship, and it influences the quality of SW and the well-being of aquatic ecosystems [11,21,22].
Several studies have evaluated the SW–GW interactions in watershed management and their impact on water quantity and quality. As a result, GW discharges with high nutrient levels are considered as a source of SW pollution and ecosystem damage [23,24]. Understanding the effects of SW–GW interactions is a key factor in the management of water resources in GW-dependent areas to supply the demands; however, it is not always considered in decision-making [25,26]. For this reason, it is a challenge to determine how GW discharges can impact the nitrate concentration in SW bodies.
Hydrological variability and water scarcity in the Júcar River Basin District (RBD) in Spain have made necessary the joint use of GW and SW to satisfy water demands, in some cases leading to the overexploitation of water resources [27]. In general, the total contribution of the Júcar RBD fluvial network comes mostly from GW runoff. Although nitrate concentration in GW bodies is stabilized without upward trends except for some deep aquifers [28], 33% of the aquifers have a nitrate concentration above the threshold of good status (NO3 < 50 mg/L) [29]. As a consequence, Júcar RBD has water quantity and quality problems.
Accordingly, the main objective of this study was to estimate the influence of the SW–GW interactions on nitrate concentration and to determine the sources of nitrate pollution in the Júcar RBD SW bodies. The following research questions were covered: (1) How nitrate transfer from the aquifer affects spatial–temporal variation of the concentration of nitrates in the rivers, and (2) what the sources of pollution in the Júcar RBD are. To answer the above research questions, two models that integrate the SW–GW interactions and water quality were linked together. With the combination of the models, it is expected that the contrast of results will provide less uncertainty. First, the PATRICAL model (Spanish acronym for “Precipitation Input in Network Sections Integrated with Water Quality; [28,30]) integrates river–aquifer interaction for a medium-large watershed. The PATRICAL output is the starting point for the second large-scale surface water quality model, RREA (Spanish acronym for “Rapid Response to the Ambient State”; [31]). The RBD authorities in Spain have extensively employed PATRICAL and RREA in the construction of the hydrological plans and in the implementation of the WFD. Additionally, it has been used to evaluate climate change impacts on water resources [32], to improve the drought’s indicators in the Júcar RBD [33], and to observe changes in the hydrology in the Mediterranean side of Spain [27]. In previous works, RREA was used to quantify the effects of the main existing pressures on the receiving waters in the Middle Tagus Basin in Spain [34]. Among the multiple benefits of these models, they can be used to identify pollution sources, simulate nitrate concentration in surface and groundwater, and assess the efficiency of management measures to prevent water degradation.
In the calibration of the models, the database of nitrate concentration and the evaluation of the status of the water bodies carried out by the Júcar RBD were used. To evaluate the simulated capacity of the nitrate status, an analysis was made from the perspective of detection of the water bodies that do not comply with a good status, using a 2 × 2 contingency table for dichotomous events [35]. The median variation of nitrate concentration in the main fluvial course of the Júcar and Turia rivers is presented, and the pollution sources are identified. This study provides a comprehensive analysis considering most of the elements that affect the contribution of nitrates to SW bodies in the Júcar RBD. Understanding how the SW–GW interactions influence the nitrates concentration is critical to manage the conjunctive water use of SW and GW. In addition, the results will allow the identification of key points to focus on mitigation measures and will be used in hydrological planning for the 2022–2027 cycle.

2. Materials and Methods
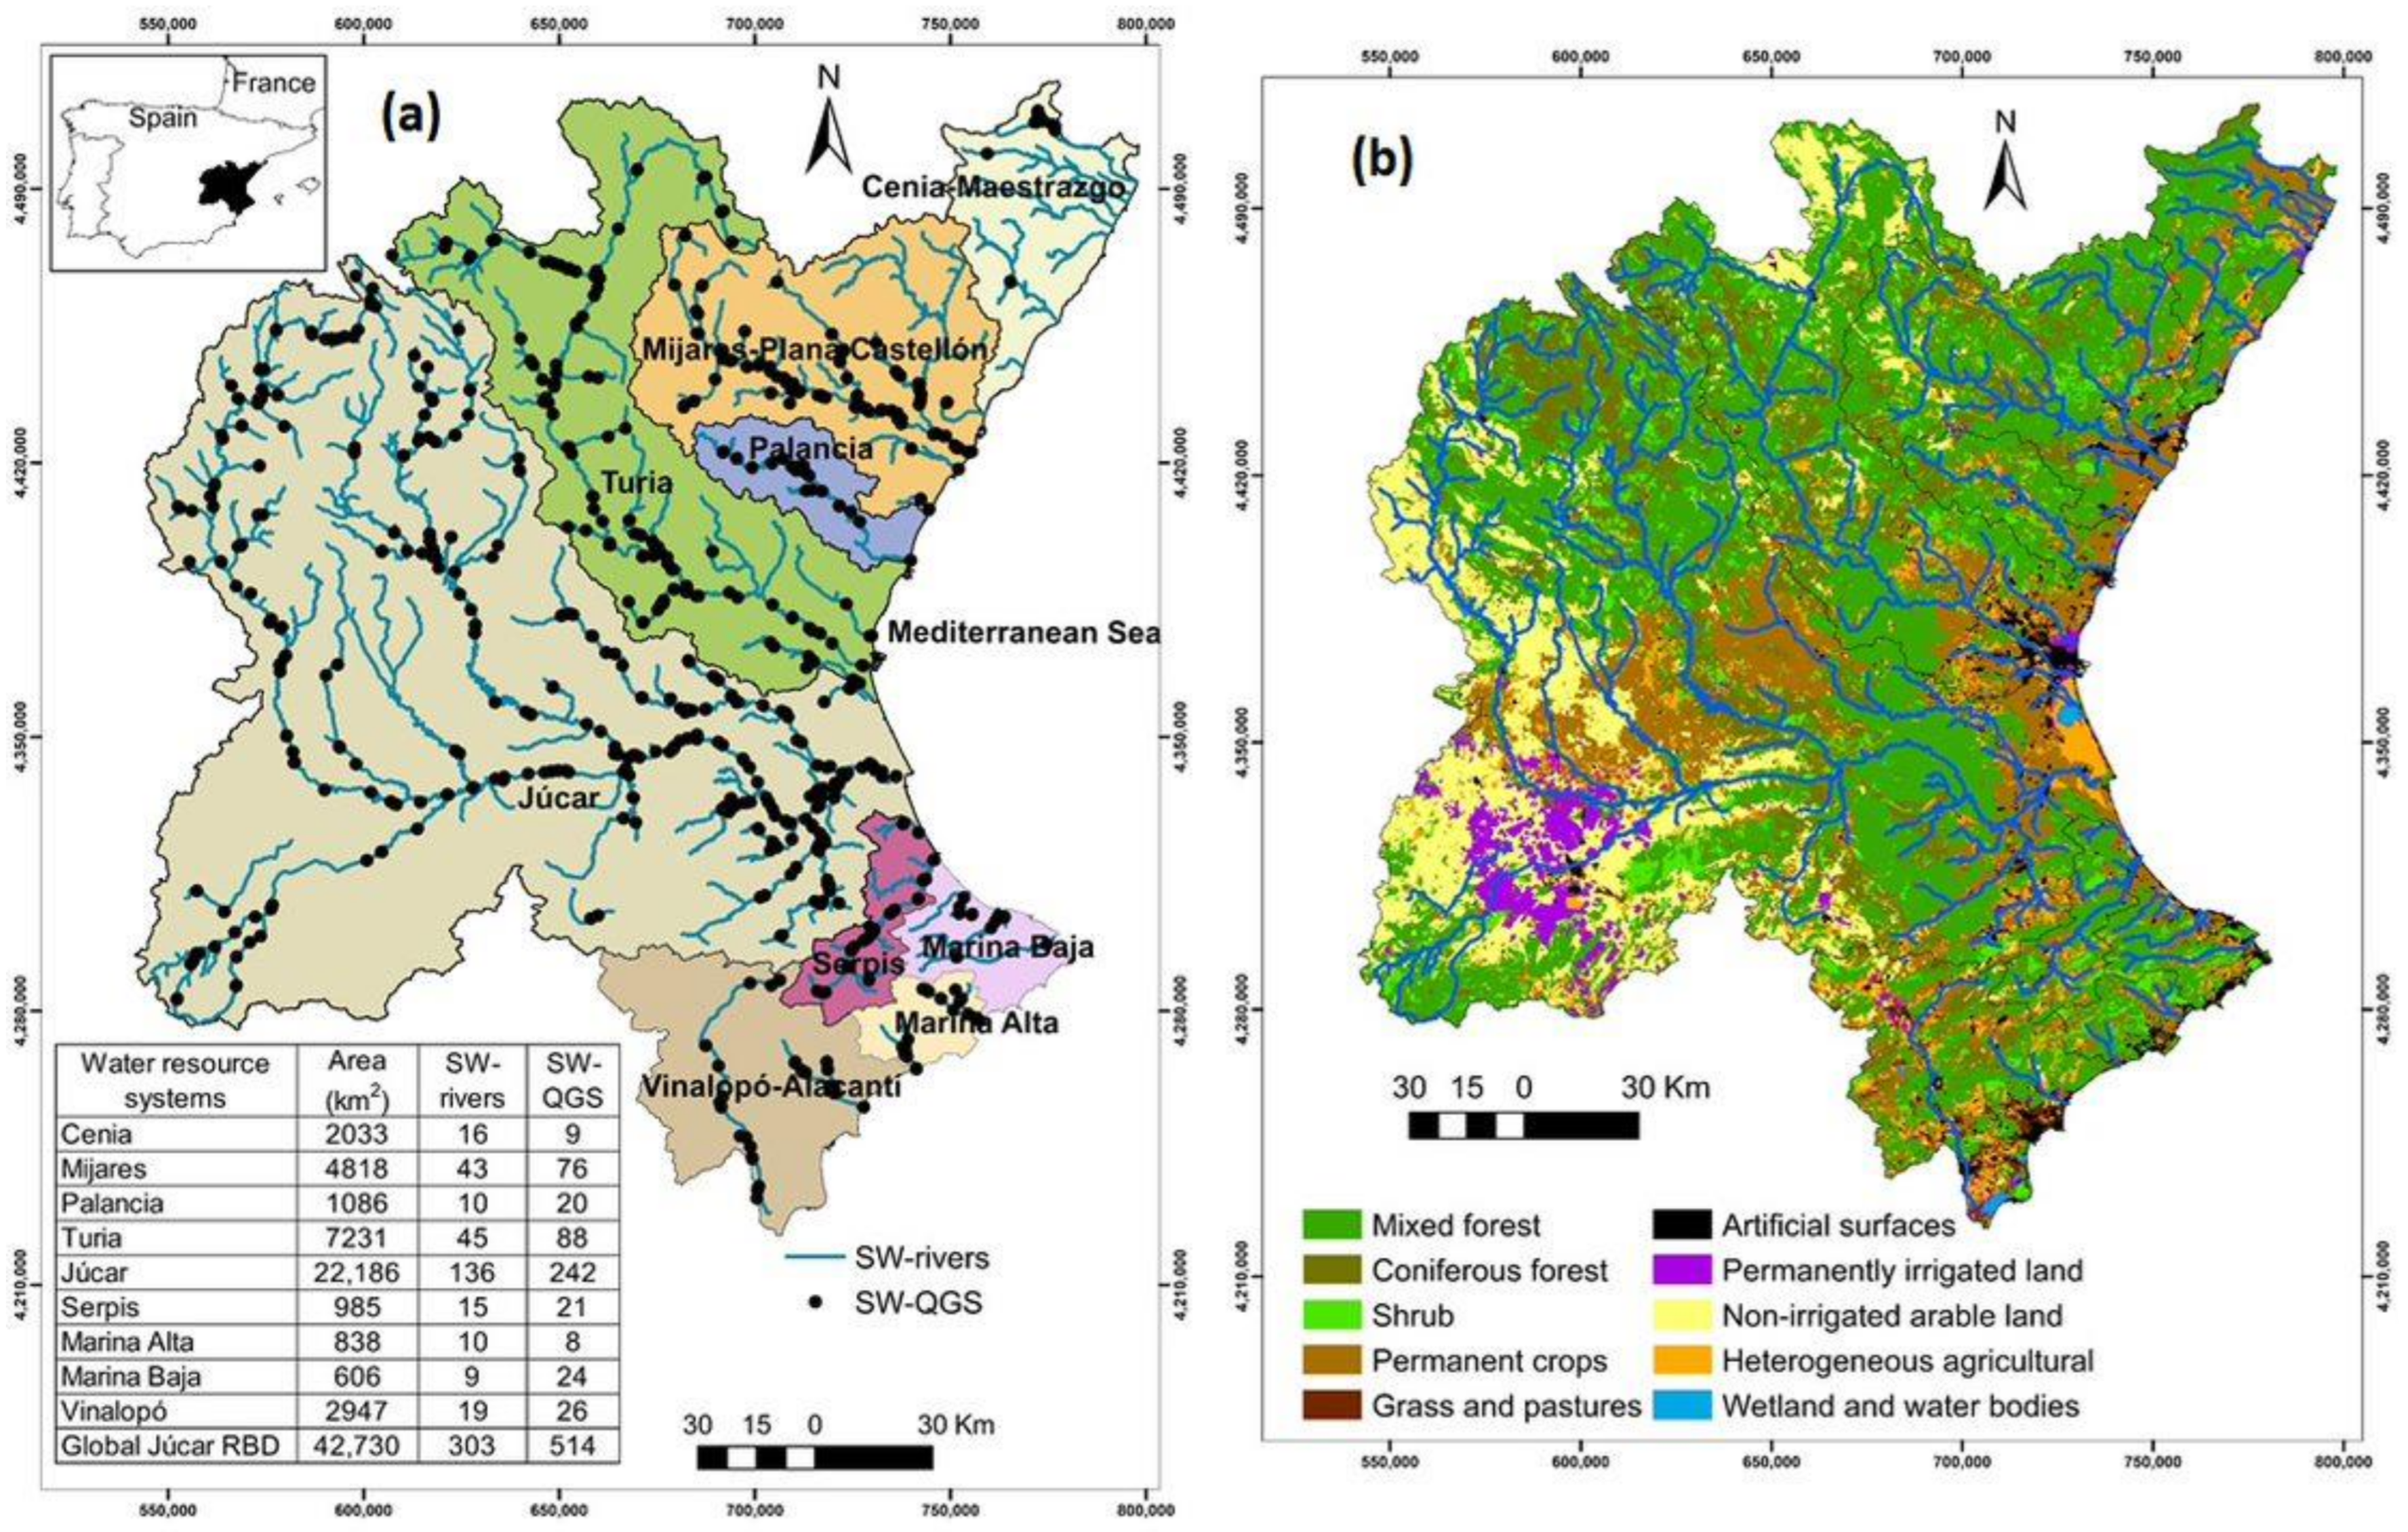
2.1. Study Location

The Júcar RBD is located in the east of the Iberian Peninsula (Spain) on the Mediterranean side, with an area of 42,735 km2. The hydrographic network is made up of nine water resource systems (WRS or system) that drain into the Mediterranean Sea, and are divided into 303 river water bodies (SW-river) (Figure 1a). The WRS of the Júcar and Turia rivers cover nearly 69% of the total area of the district. The climate varies from humid to semi-arid, with the presence of droughts and a concentration of approximately half of the annual rainfall in autumn on the coastal strip [33]. The average annual pluvial precipitation is 485 mm/year, with a spatial range of 339 mm/year in the Vinalopó-Alacantí (hereafter Vinalopó), and 743 mm/year in Marina Alta.
The total contribution (4070 hm3/year) of the Júcar RBD fluvial network comes mostly from GW runoff (2983 hm3/year), hence the importance of GW in this district [27]. This can be explained due to the surface area covered by GW bodies (40,822 km2), 72% of which are permeable. The predominant material in 90% of the district geological formations is carbonated, with substantial subterranean drainage. However, quaternary detrital formations predominate in the coastal plains of the area, which contributes to pollution problems due to the lower rate of transportation [36]. SW–GW interaction in the SW rivers is classified as follows: 78% receives discharges from the aquifer, considered as gaining stream; 18% are SW rivers where the river infiltrates resources into the aquifer, considered as losing; the remaining are considered as variable, where one situation or another occurs depending on the time of the year. A detailed description of the SW–GW interaction in the Jícar RBD can be found in the Ref. [37].
The land in the Júcar RBD is occupied by 49% of forest areas and open spaces, and agriculture represents 36% of land use, where 3% are artificial surfaces and 12% are wetland and water bodies (Figure 1b) [38]. Agriculture is the activity with the highest water resource requirement (80% of total demand) and the third most important economic activity in the district [39].
The Pressure Inventory of the Júcar Hydrological Plan (HP) [40] reports that 63% of the SW rivers are under significant pressure from organic, urban, and landfill discharges. The pressure of diffuse pollution by land use in which large areas are found in irrigation crops, urban areas, and also livestock, affect 60% of SW bodies. On the other hand, aquifers with good nitrate status (NO3 < 50 mg/L) represent 77% of all GW bodies, while 33% are impacted GW bodies. Pollution problems in the rivers and aquifers are located along the coastline and of the adjacent inland strip [29].
Characteristics of the Júcar RBD were collected from the following sources: land use (CORINE Land Cover System 2018); geology map (Spanish Geological Survey lithographic map); 100 × 100 m2 digital elevation model (Spanish Army Geographic Centre); water hydrographic network and water demands (Water Information System for the Júcar RBD, “SIA Júcar” in Spanish, Available online: aps.chj.es/siajucar/, accessed on 26 March 2021); and identification of losing and gaining rivers in the Júcar RBD (Geological and Mining Institute of Spain; [37,41]).

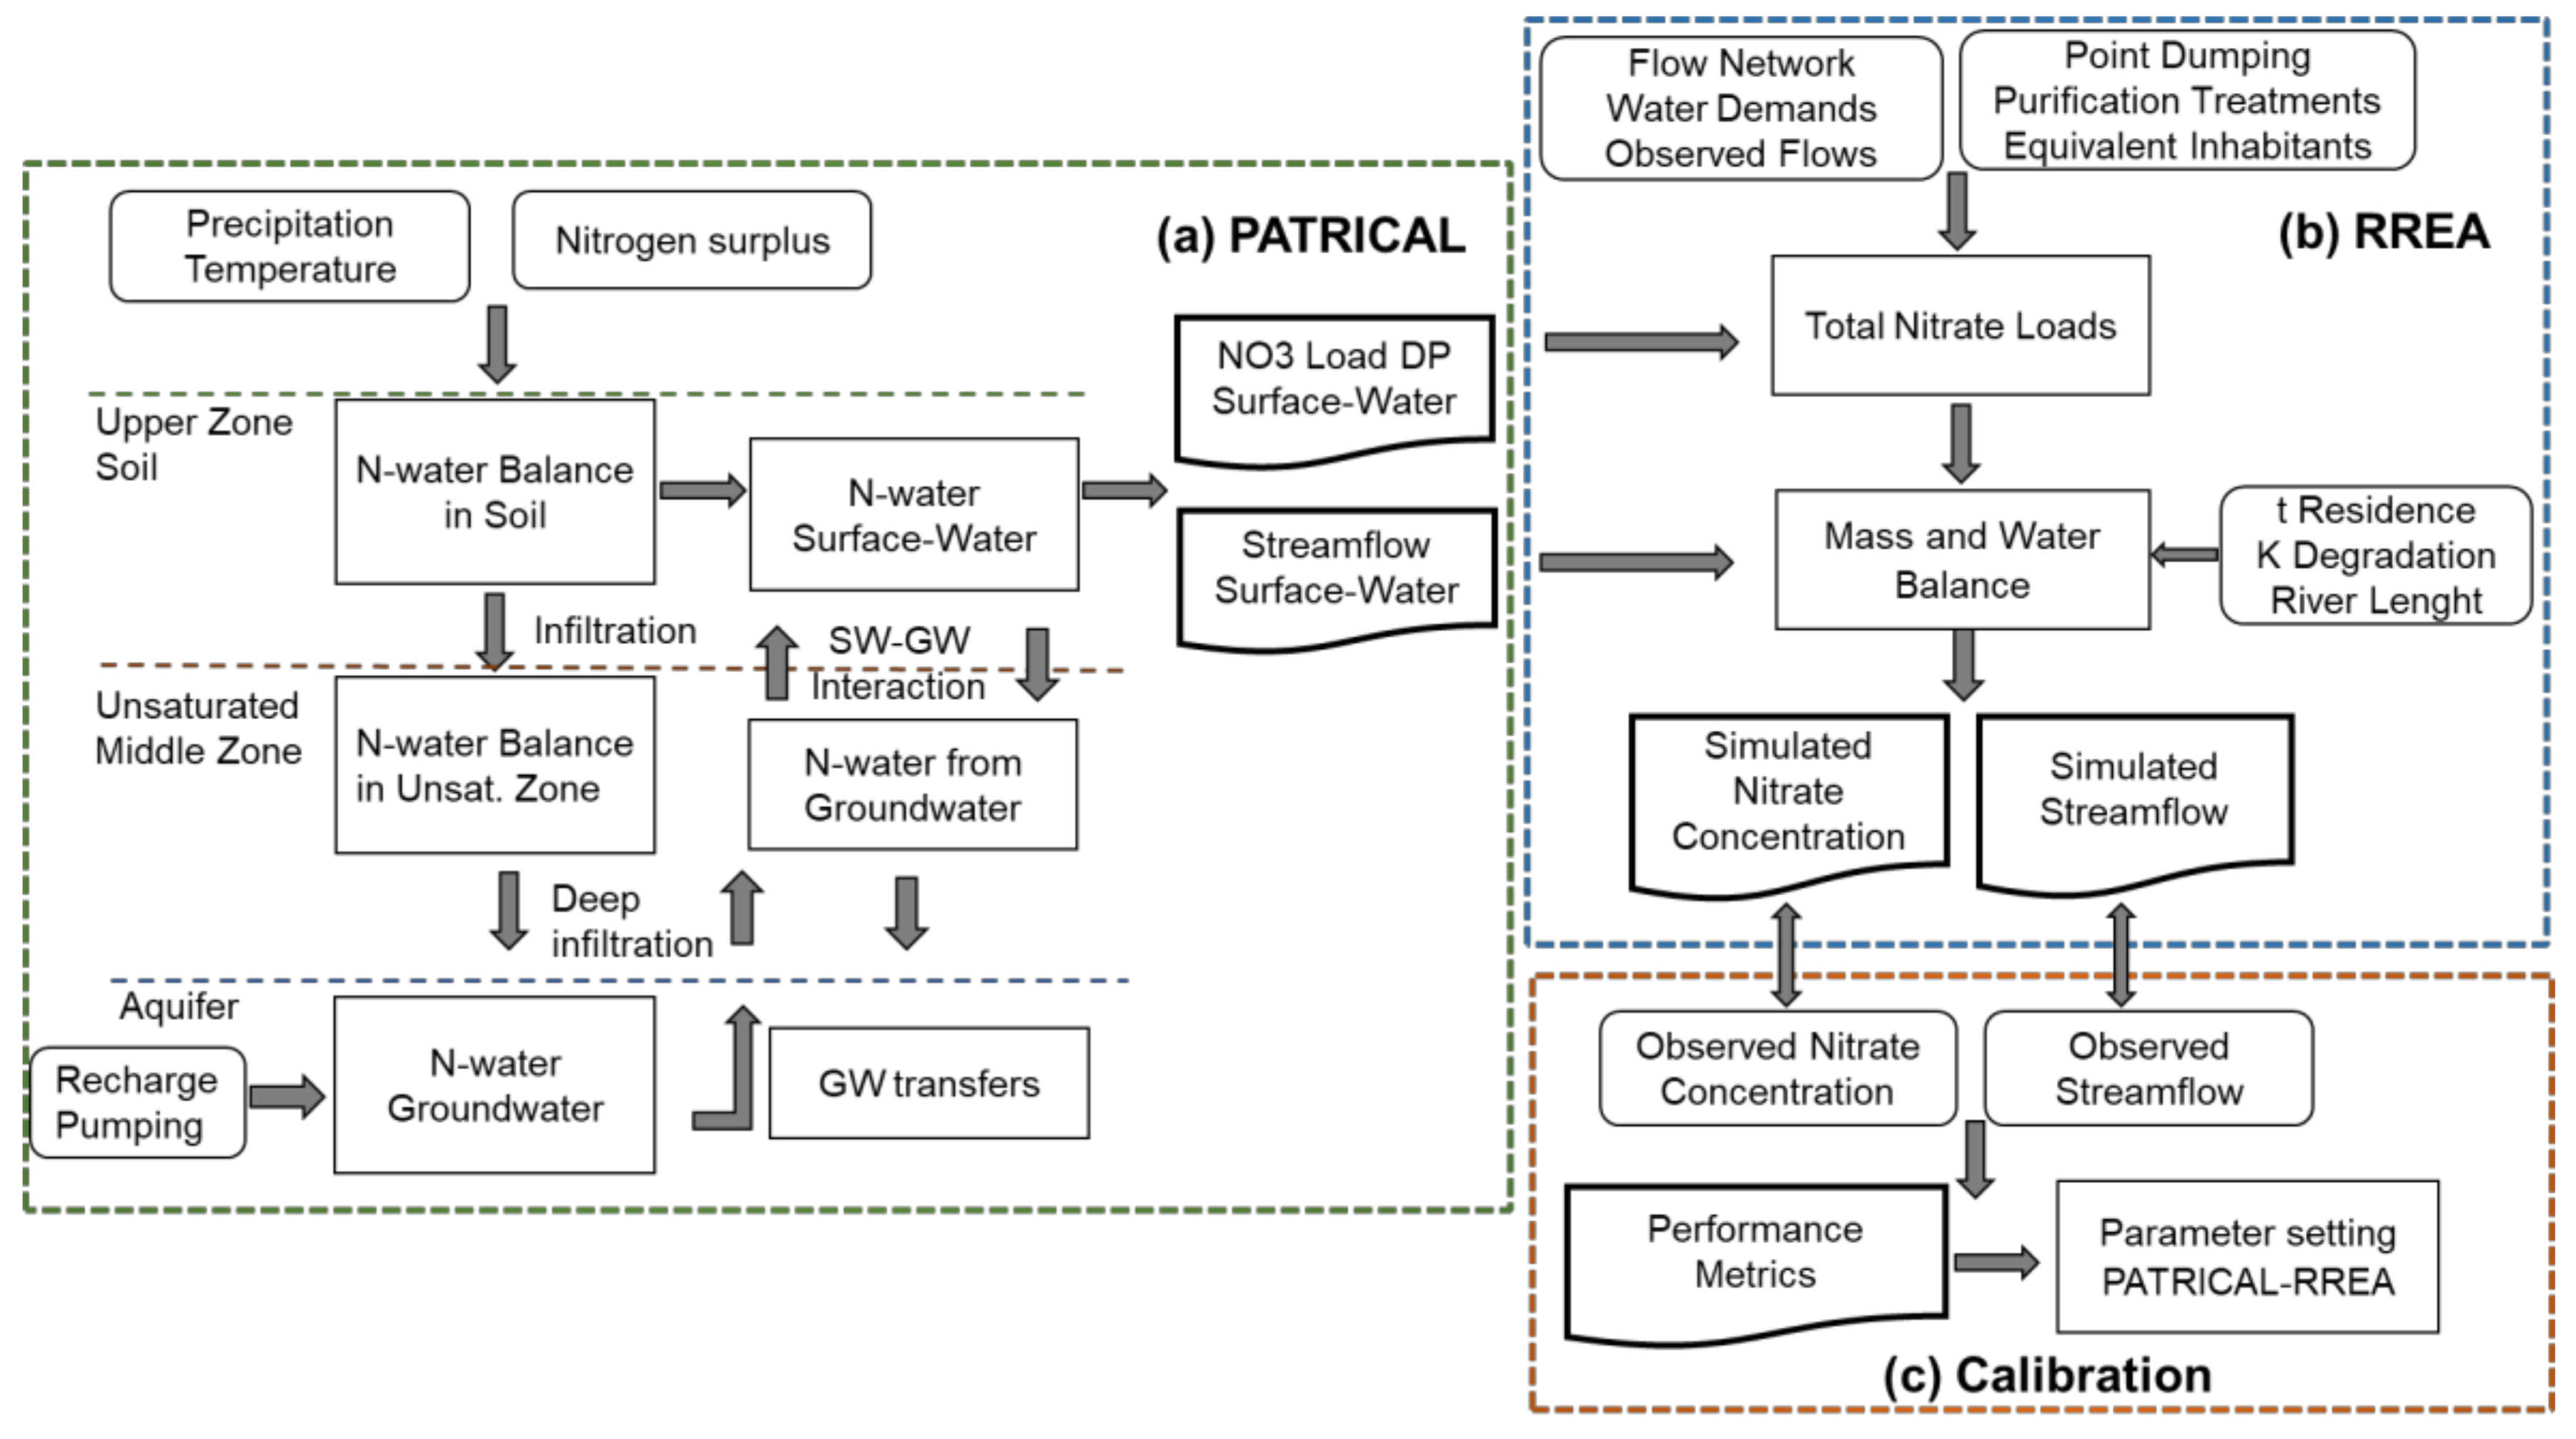
2.2. Water Quality Models
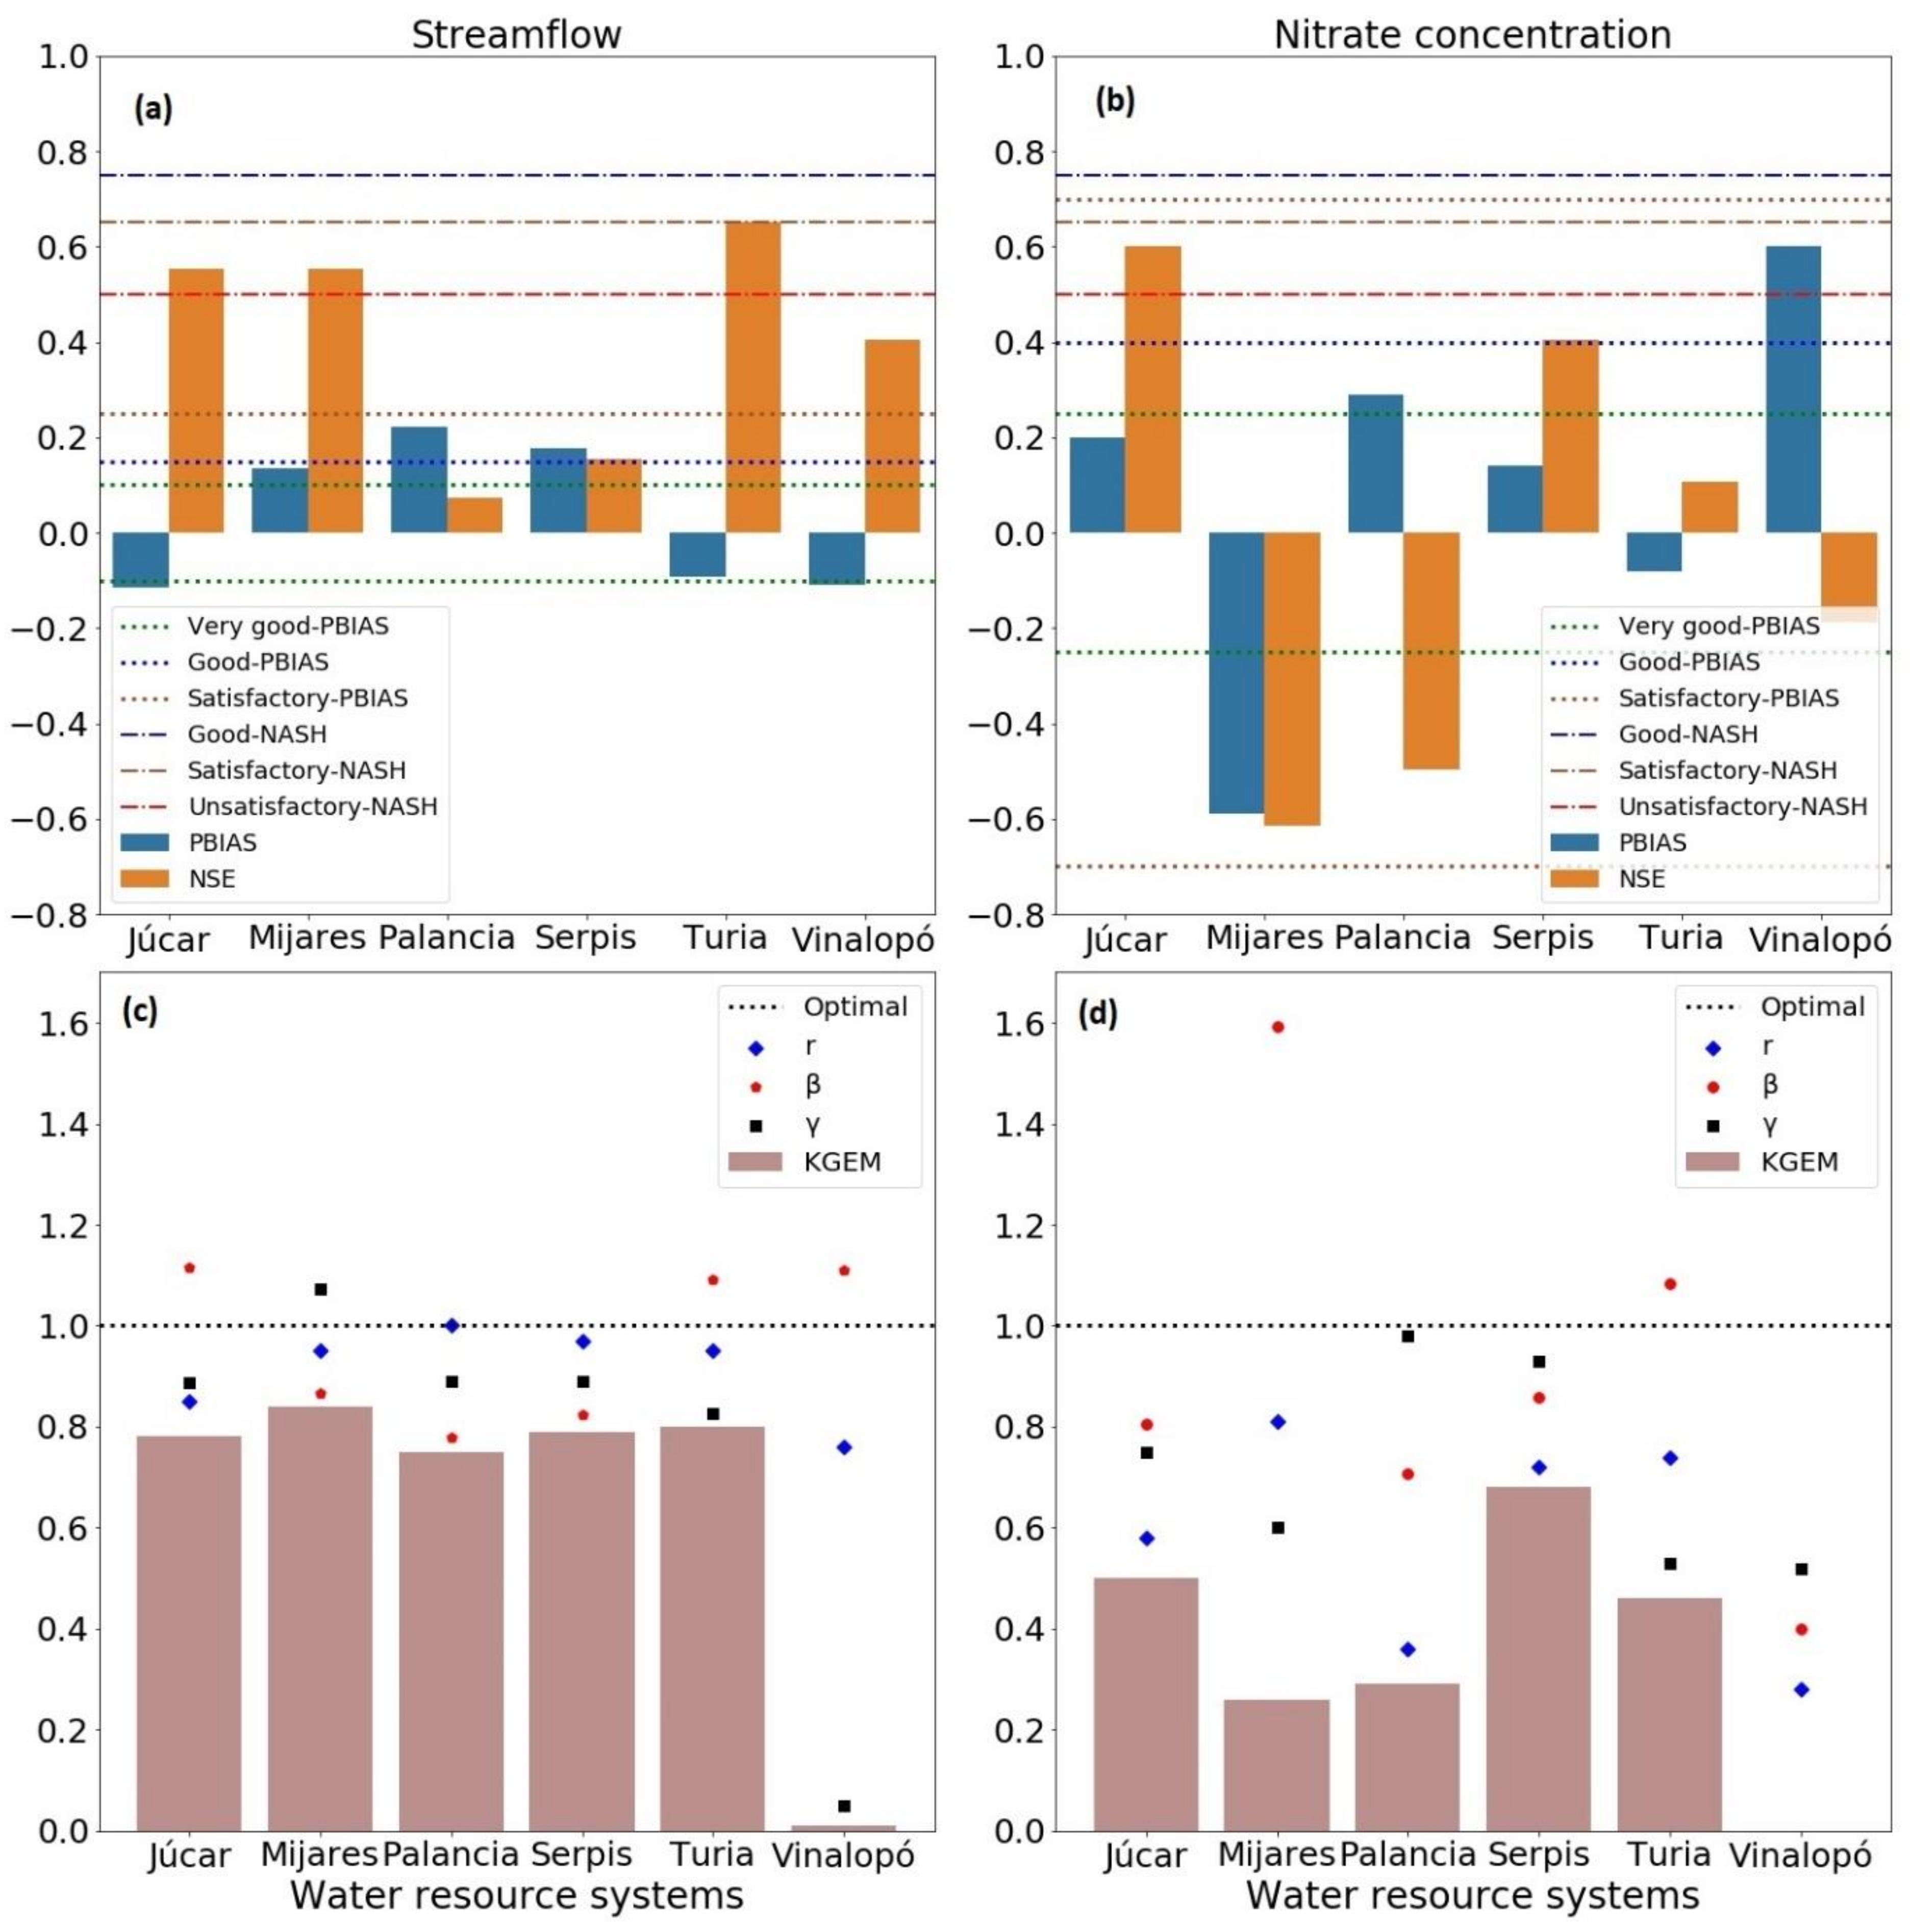
PATRICAL [28,30] is a large-scale, conceptual model, with a monthly time step, that discretizes the territory with a resolution of 1 km × 1 km. The water quality component simulates nitrate transport through the hydrological cycle in the entire basin. This model includes the SW–GW interaction as it takes into account irrigation returns that recharge aquifers, lateral transfers among aquifers, and water movement through the river network. However, PATRICAL only reproduces part of the altered hydrological cycle, as it does not include the management of infrastructure or the modifications produced in the flow regime. Inputs to PATRICAL are monthly pluvial precipitation; air temperature; urban and industrial discharges to the GW bodies; nitrogen surplus in the soil; and GW withdrawals [39]. The data set employed in the PATRICAL model are shown in Table 1. Outputs of PATRICAL are streamflow-accumulated time series, GW levels, and total nitrate loads from diffuse pollution in rivers and aquifers. The schematic with the steps carried out by the model is shown in Figure 2a and detailed in the Appendix A. A more extensive description of PATRICAL model and the parameters used is provided by the Refs. [28,30].
The information obtained from PATRICAL is the starting point for the second large-scale surface-water-quality model, RREA. The two models complement each other, as RREA allows to include reservoir management and measurement regulation, agricultural and urban demands, and changes in the streamflow regime effects. A series of algorithms were developed using Python software [43] to automate decumulation loads and streamflow processes (PATRICAL output).
RREA estimates concentrations of pollutants in surface water bodies considering the load contributed to each SW rivers, the pollution coming from upstream and the possible degradation occurring in the water body itself. Input variables to RREA are: physical characteristics of the hydrographic network; water demands [39]; streamflow records of rivers and reservoirs; diffuse nitrate load (output PATRICAL); streamflow time series (output PATRICAL); point discharge; and degradation constant by pollutant. The data set employed in the RREA model is shown in Table 1. Point sources of nitrate were entered into the model by linking the authorized discharge location of wastewater treatment plants (WWTP) and the SW rivers into which they discharge. Output variables are the time series of streamflow and nitrate concentration circulating through the SW rivers under conditions altered by human activities. The general scheme of RREA is shown in Figure 2b and detailed in the Appendix A.

2.3. Calibration

The parameters were calibrated by an iterative process taking into account the following: (1). To assess the skill of the models to simulate the nitrate status of the water bodies; (2). to estimate the statistical error in order to obtain a greater number of SW rivers with satisfactory performance in the simulation of streamflow and nitrate concentration; and (3). to represent nitrate load generated by point and diffuse pollution.
In previous works, the hydrological component of PATRICAL was calibrated and validated by Pérez-Martín et al. [30], who reported satisfactory behaviour of the model for all evaluated water bodies. In addition, improvements have been made to the groundwater component and the SW–GW interactions, finding better fits between the simulated and observed flows with respect to the previous calibration [28].
The results of the model under an altered regime were compared with the observed streamflow and nitrate concentration (SIA Júcár, Available online: ps.chj.es/siajucar/, accessed on 26 March 2021) in the calibration process. The Python software [43] was used to calculate the main descriptive statistics (25%, 50%, and 75% quantiles, mean and standard deviation). The evaluations used the median of observed and simulated data in the SW rivers for greater robustness and to avoid outliers. To check the consistency of the data, automatic graphs were generated with the time series of the nitrate concentrations and streamflow in each SW river.
The statistical error was calculated using three indicators. First, the relative bias (PBIAS) shows the simulation deviation expressed as a percentage. In addition, it differs from other indicators because it has a specific classification for streamflow and water quality components. The second is the Nash-Sutcliffe efficiency (NSE), which determines the relationship between the error variance of the simulated data and the variance of the observed data [44]. The NSE ranges from −∞ to 1 and the optimal value is 1. Finally, the indicator Modified Kling-Gupta Efficiency (KGEM) (Equation (1)) decomposes the bias into three different terms, r represents the correlation coefficient between the simulated and observed time series, β is the ratio between the simulated and observed means (µ) (Equation (2)), and γ is the ratio of the coefficients of variation of both time series (Equation (3)). The optimal value for each of the three components of the KGEM is 1 [45,46].
K G E M = 1 r 1 2 + β 1 2 + γ 1 2
β = µ s i m µ o b s
γ = C V s i m C V o b s

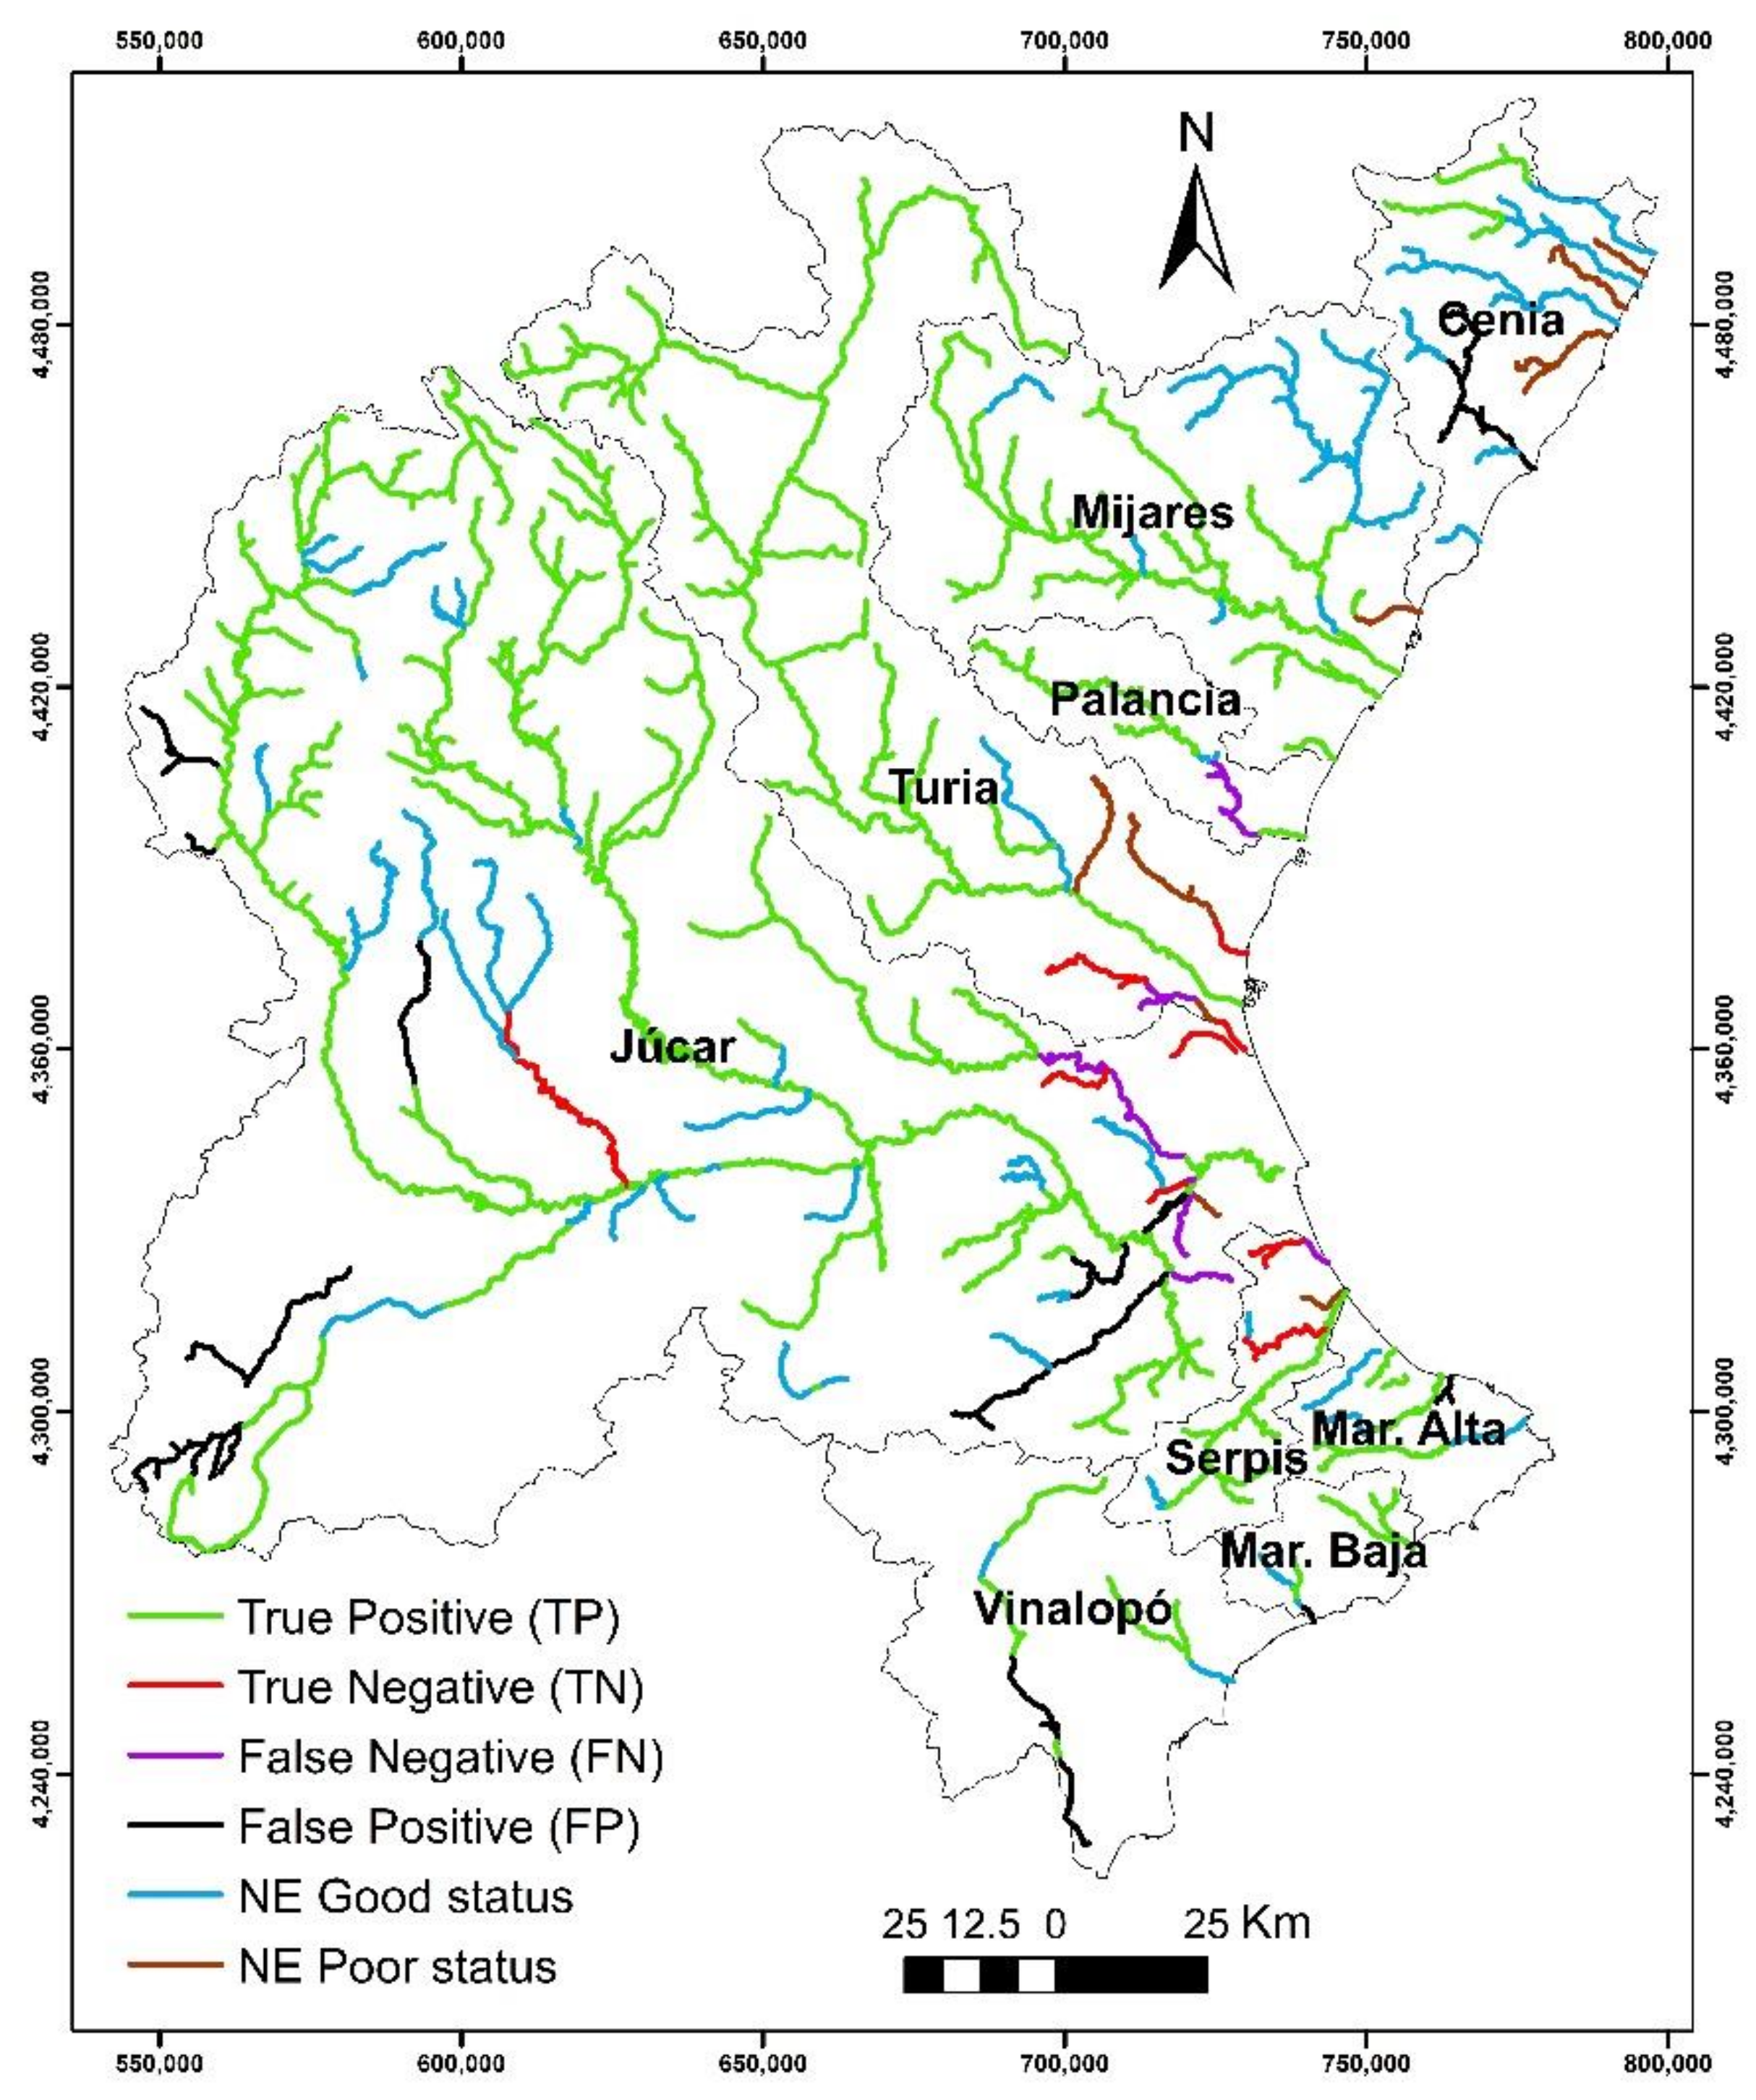
2.4. Nitrate Status Classification Performance

To assess the skill of the models to simulate the nitrate status, a 2 × 2 contingency table for dichotomous events was used [35]. This table allows assessing the performance of the models to evaluate the status of water bodies based on the nitrate concentration values. For this purpose, nitrate status was classified in the complete time series of simulated and observed data for each SW river, considering the threshold value of 25 mg NO3/L [47], and using the same length of data in both series. In this way, a matrix of discrete non-probabilistic values was obtained as shown in Table 2.
Four different measures were used to assess the skill of the models to simulate nitrate status: the Accuracy (ACC) assesses the model performance to reproduce an event correctly and was calculated using Equation (4), ACC ranges from 0 to 1, and 1 is the best value; the bias measured is the ratio of the simulated mean and observed mean Equation (5). Bias ranges from 0 to infinite, and 1 is the best value; the Success Ratio (SR) provides information on the proportion of TP in the whole time series (Equation (6)) [35,48]; and in contrast, specificity (SP) which is the proportion of TN correctly classified in the simulation (Equation (7) [49]. For the indicators SR and SP, the best value is 1 and the worst is 0.
A C C = T P + T N T P + F N + F P + T N
I A S T C = T P + F P T P + F N
S R = T P T P + F P
S P = T N T N + F P

3. Results and Discussion
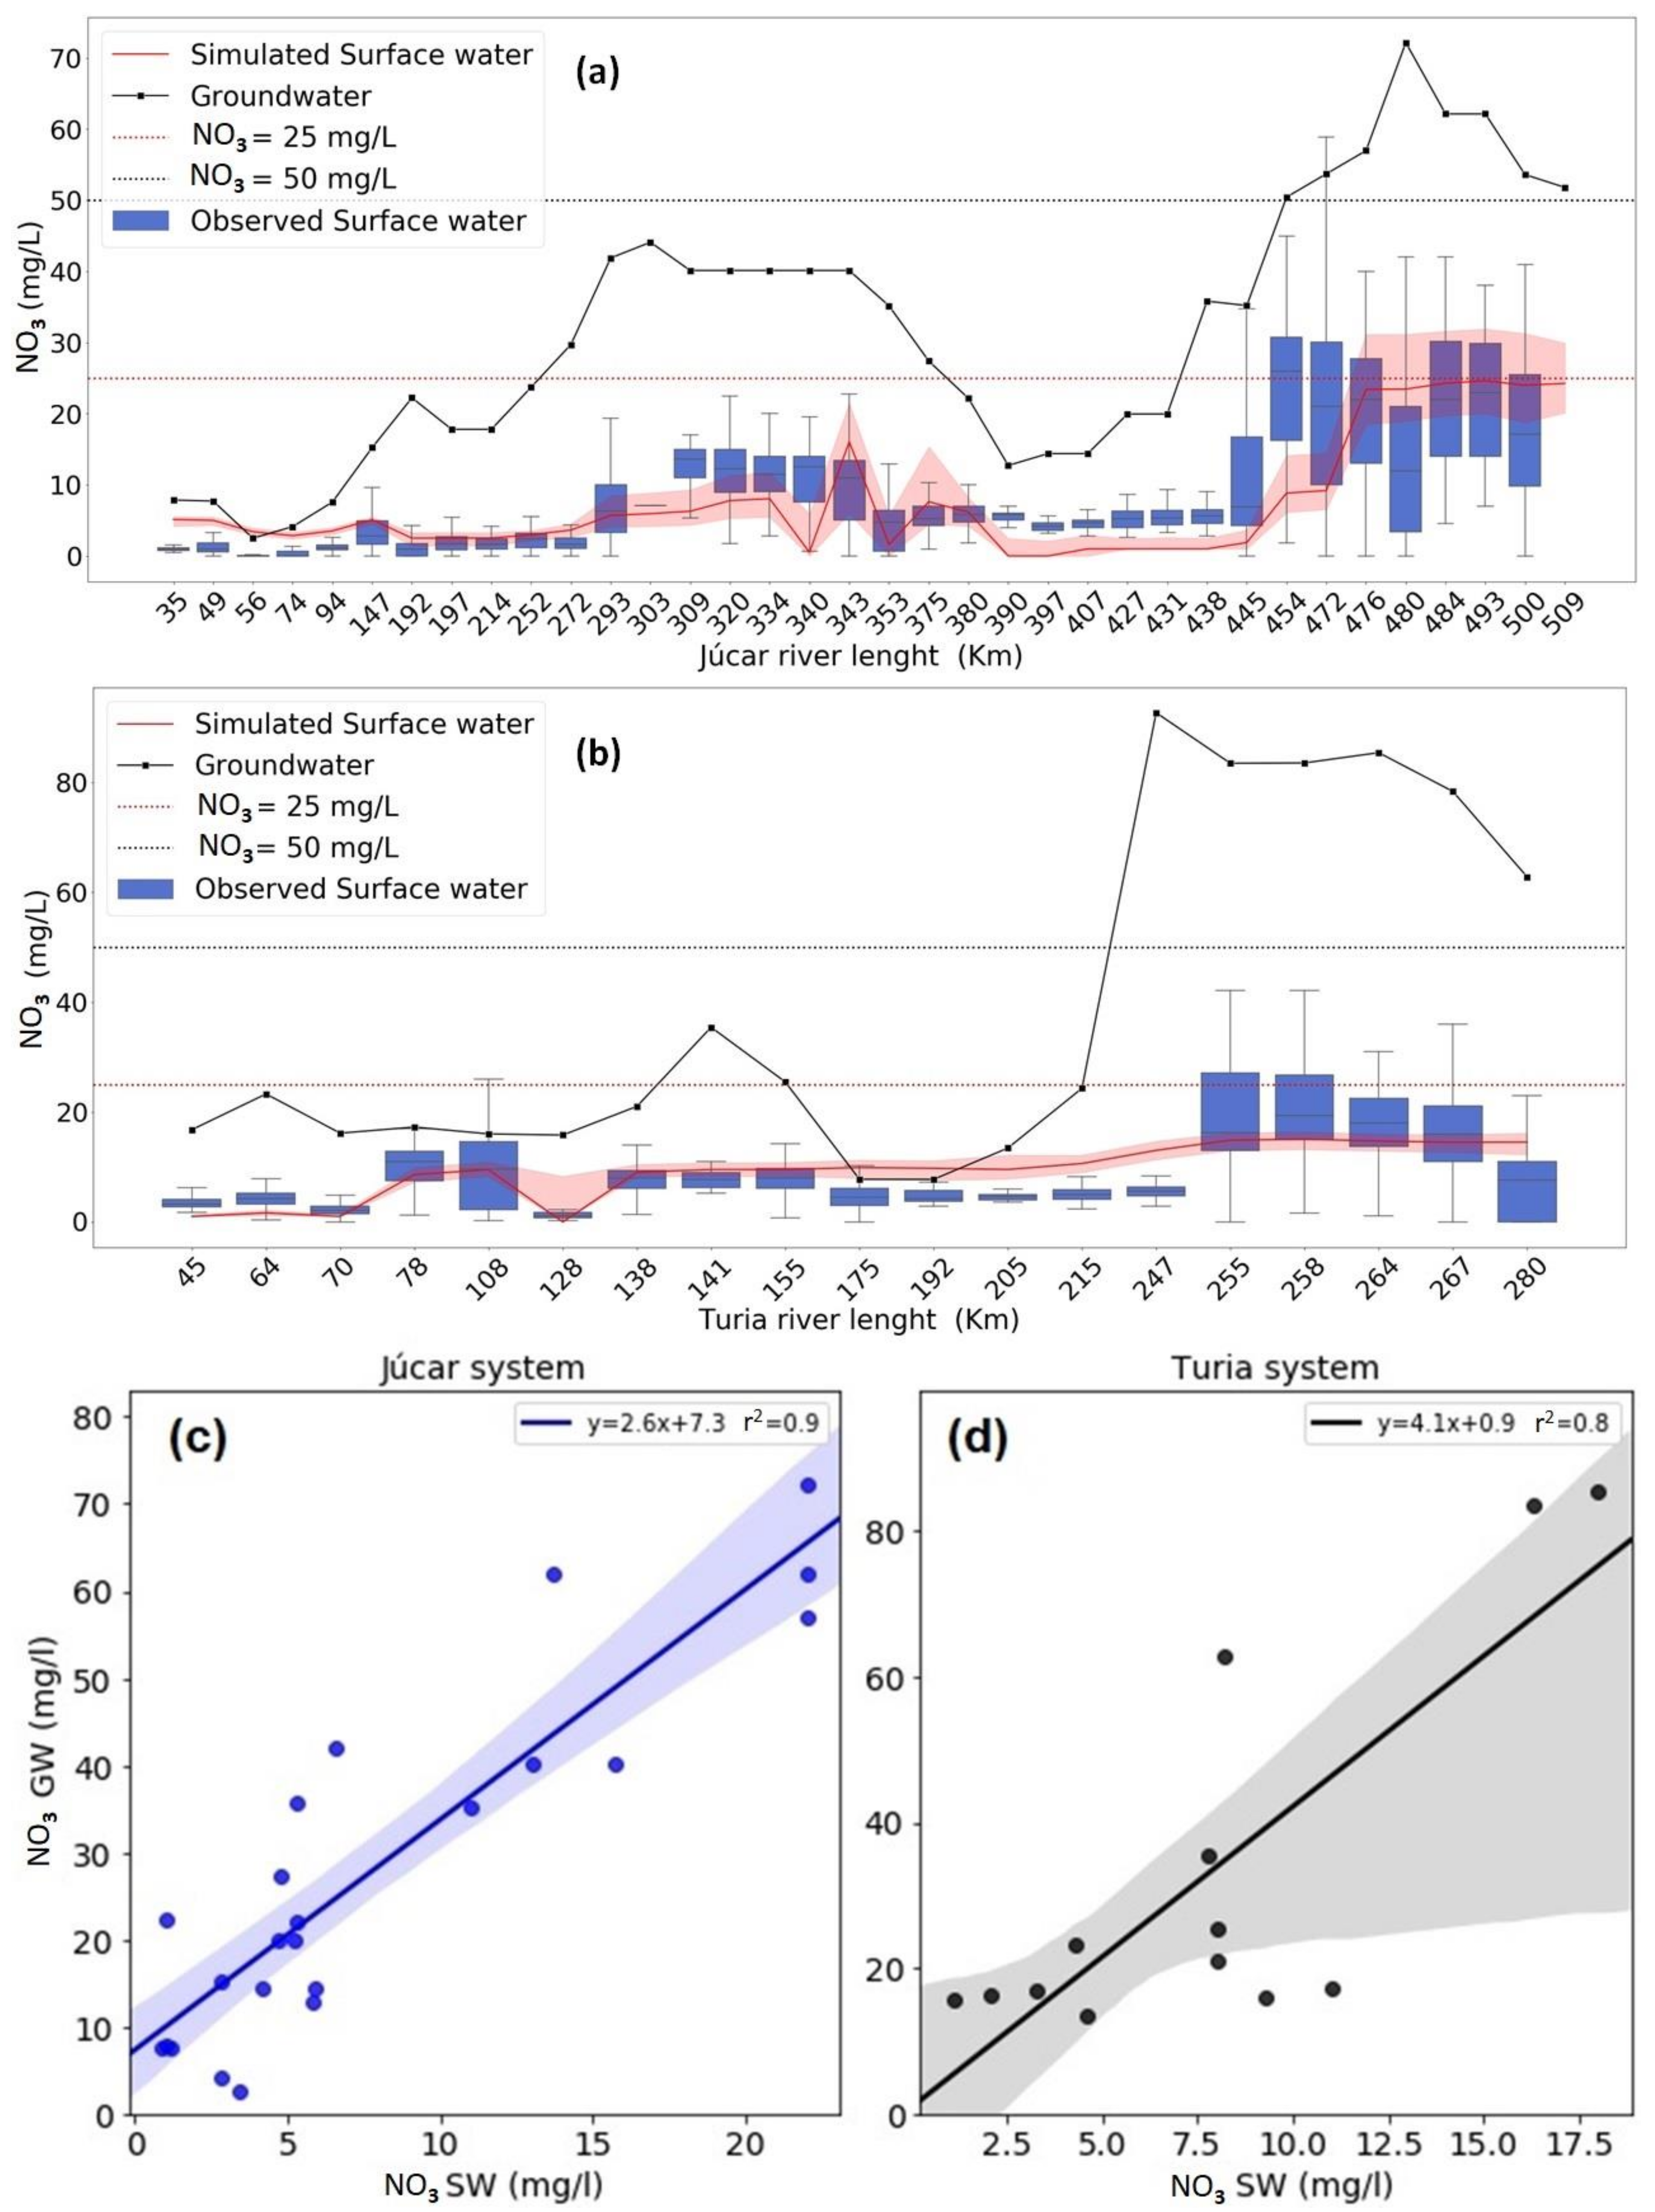
3.1. Calibration

Streamflows and nitrate concentrations were jointly calibrated in the six main water resource systems of the Júcar RBD. The values obtained for the three statistical indicators are shown in Figure 3. According to the PBIAS indicator, the streamflow calibration provided a good fit between simulated and observed values in the Mijares, Turia, Júcar, and Vinalopó; and satisfactory fit in Palancia and Serpis. For nitrate concentration, a very good fit was obtained in Turia, Júcar, Serpis; a good fit in Palancia, and a satisfactory fit in Mijares and Vinalopó.
Based on the NSE values for the monthly streamflow, the fit was satisfactory in Mijares, Turia, and Júcar, whereas in Palancia, Serpis, and Vinalopó the performance was unsatisfactory. NSE values for the nitrate concentration in Mijares, Palancia, and Vinalopó were below zero; whereas in Júcar, Turia, and Serpis, positive values were obtained, which indicates better behaviour of the model in the simulation of nitrate concentration.
The KGEM indicator and the three components in the streamflow performance was close to the optimum in most of the systems evaluated, except in Vinalopó (Figure 3c), which also presented a ratio between coefficients of variation (γ) close to zero.
KGEM values for nitrate concentration were between 0.3 and 0.7 in the Júcar, Mijares, Palancia, Turia, and Serpis (Figure 3d); whereas in Vinalopó, a value close to zero was obtained, with similar behaviour to that found in the streamflow. Analysing KGEM components (Figure 3d), the correlation coefficient (r) was 0.81 for Mijares and 0.28 for Vinalopó, meaning that simulated and observed data series are more correlated in Mijares than in Vinalopó. The bias ratio (β) was 1.59 in Mijares and 0.40 in Vinalopó, so nitrate concentrations are overestimated in Mijares, while it is underestimated in Vinalopó. Júcar, Palancia, Turia, and Serpis have a bias relation close to the optimum. The ratio between the coefficients of variation (γ) are close to optimal in Júcar, Palancia, and Serpis, and presented values between 0.6 and 0.52 in Mijares and Vinalopó, respectively. The NSE index for Mijares was not satisfactory but there was a high correlation between simulated and observed data as a satisfactory KGEM value was obtained.
The models performed well in the simulation of water resources in basins with large surface areas (such as Júcar and the Turia), but in small basins, with less surface area and less flow (such as the Vinalopó), the fit was less satisfactory. This is influenced by the greater number of gauging stations and measurements in the basins with a larger area.

3.2. Nitrate Status Classification Performance

According to the contingency table shown in Section 2.4 (Table 2), 85% of the assessed SW rivers are classified as True Positive (TP), indicating that simulated and observed values match in a good nitrate status; whereas 4% are classified as True Negative (TN), which indicate river sections with poor status in observations and simulations. The remaining SW rivers do not coincide in the classification of nitrate status in the simulated and observed data series (Figure 4).
The indices obtained using the contingency table are summarized in Table 3. The Accuracy (ACC) ranged from 0.70 to 0.99 and was close to the optimal, indicating that the model can reliably represent the nitrate status. The BIAS indicator showed that the nitrate status in 78% of the systems is unbiased or slightly biased. The greatest BIAS was obtained in Vinalopó. The Success Ratio (SR) shows the proportion of TP and ranged from 0.90 to 1.0 for all systems, except for Vinalopó. According to the calibration in this system, the models tend to underestimate nitrate concentration, therefore, the FP rate is high and there is a low TP rate. In contrast, the highest TP rates were obtained in Mijares and Palancia. This indicates that SW rivers in these systems are properly classified in good status in the simulation.
The SP indicator shows the rate of SW rivers correctly simulated as poor status (TN). Values of SP between 0.22 and 0.46 were obtained in Mijares, Turia, Júcar, and Serpis; whereas this indicator was zero (the worst value) in the Palancia and Vinalopó. In the case of Palancia, this is attributable to the fact that there are no SW rivers in poor status, whereas in Vinalopó 15% of the SW rivers are impacted in the observed data series, which were not properly represented in the simulation.
Integration of the PATRICAL and RREA models accurately simulated the SW rivers with good and poor nitrate status in Mijares, Palancia, Turia, Júcar, and Serpis. In Vinalopó, the simulation did not represent the SW rivers in poor status, meaning that the simulated skill of the models must be improved to increase the TN rate. The difference between simulated and observed data may correspond to unassigned discharges to water bodies, since the simulations are influenced by the number of associated water bodies and the availability of data in small basins.
These results highlight that the contingency table is a useful method to evaluate the behaviour of the models in the classification of the pollutant status in a catchment, since an appropriate classification is more important than an accurate simulation of the pollutant concentration. If the indicators obtained from the contingency table are far from the optimal values, the simulation is not representing the real status of the water bodies.

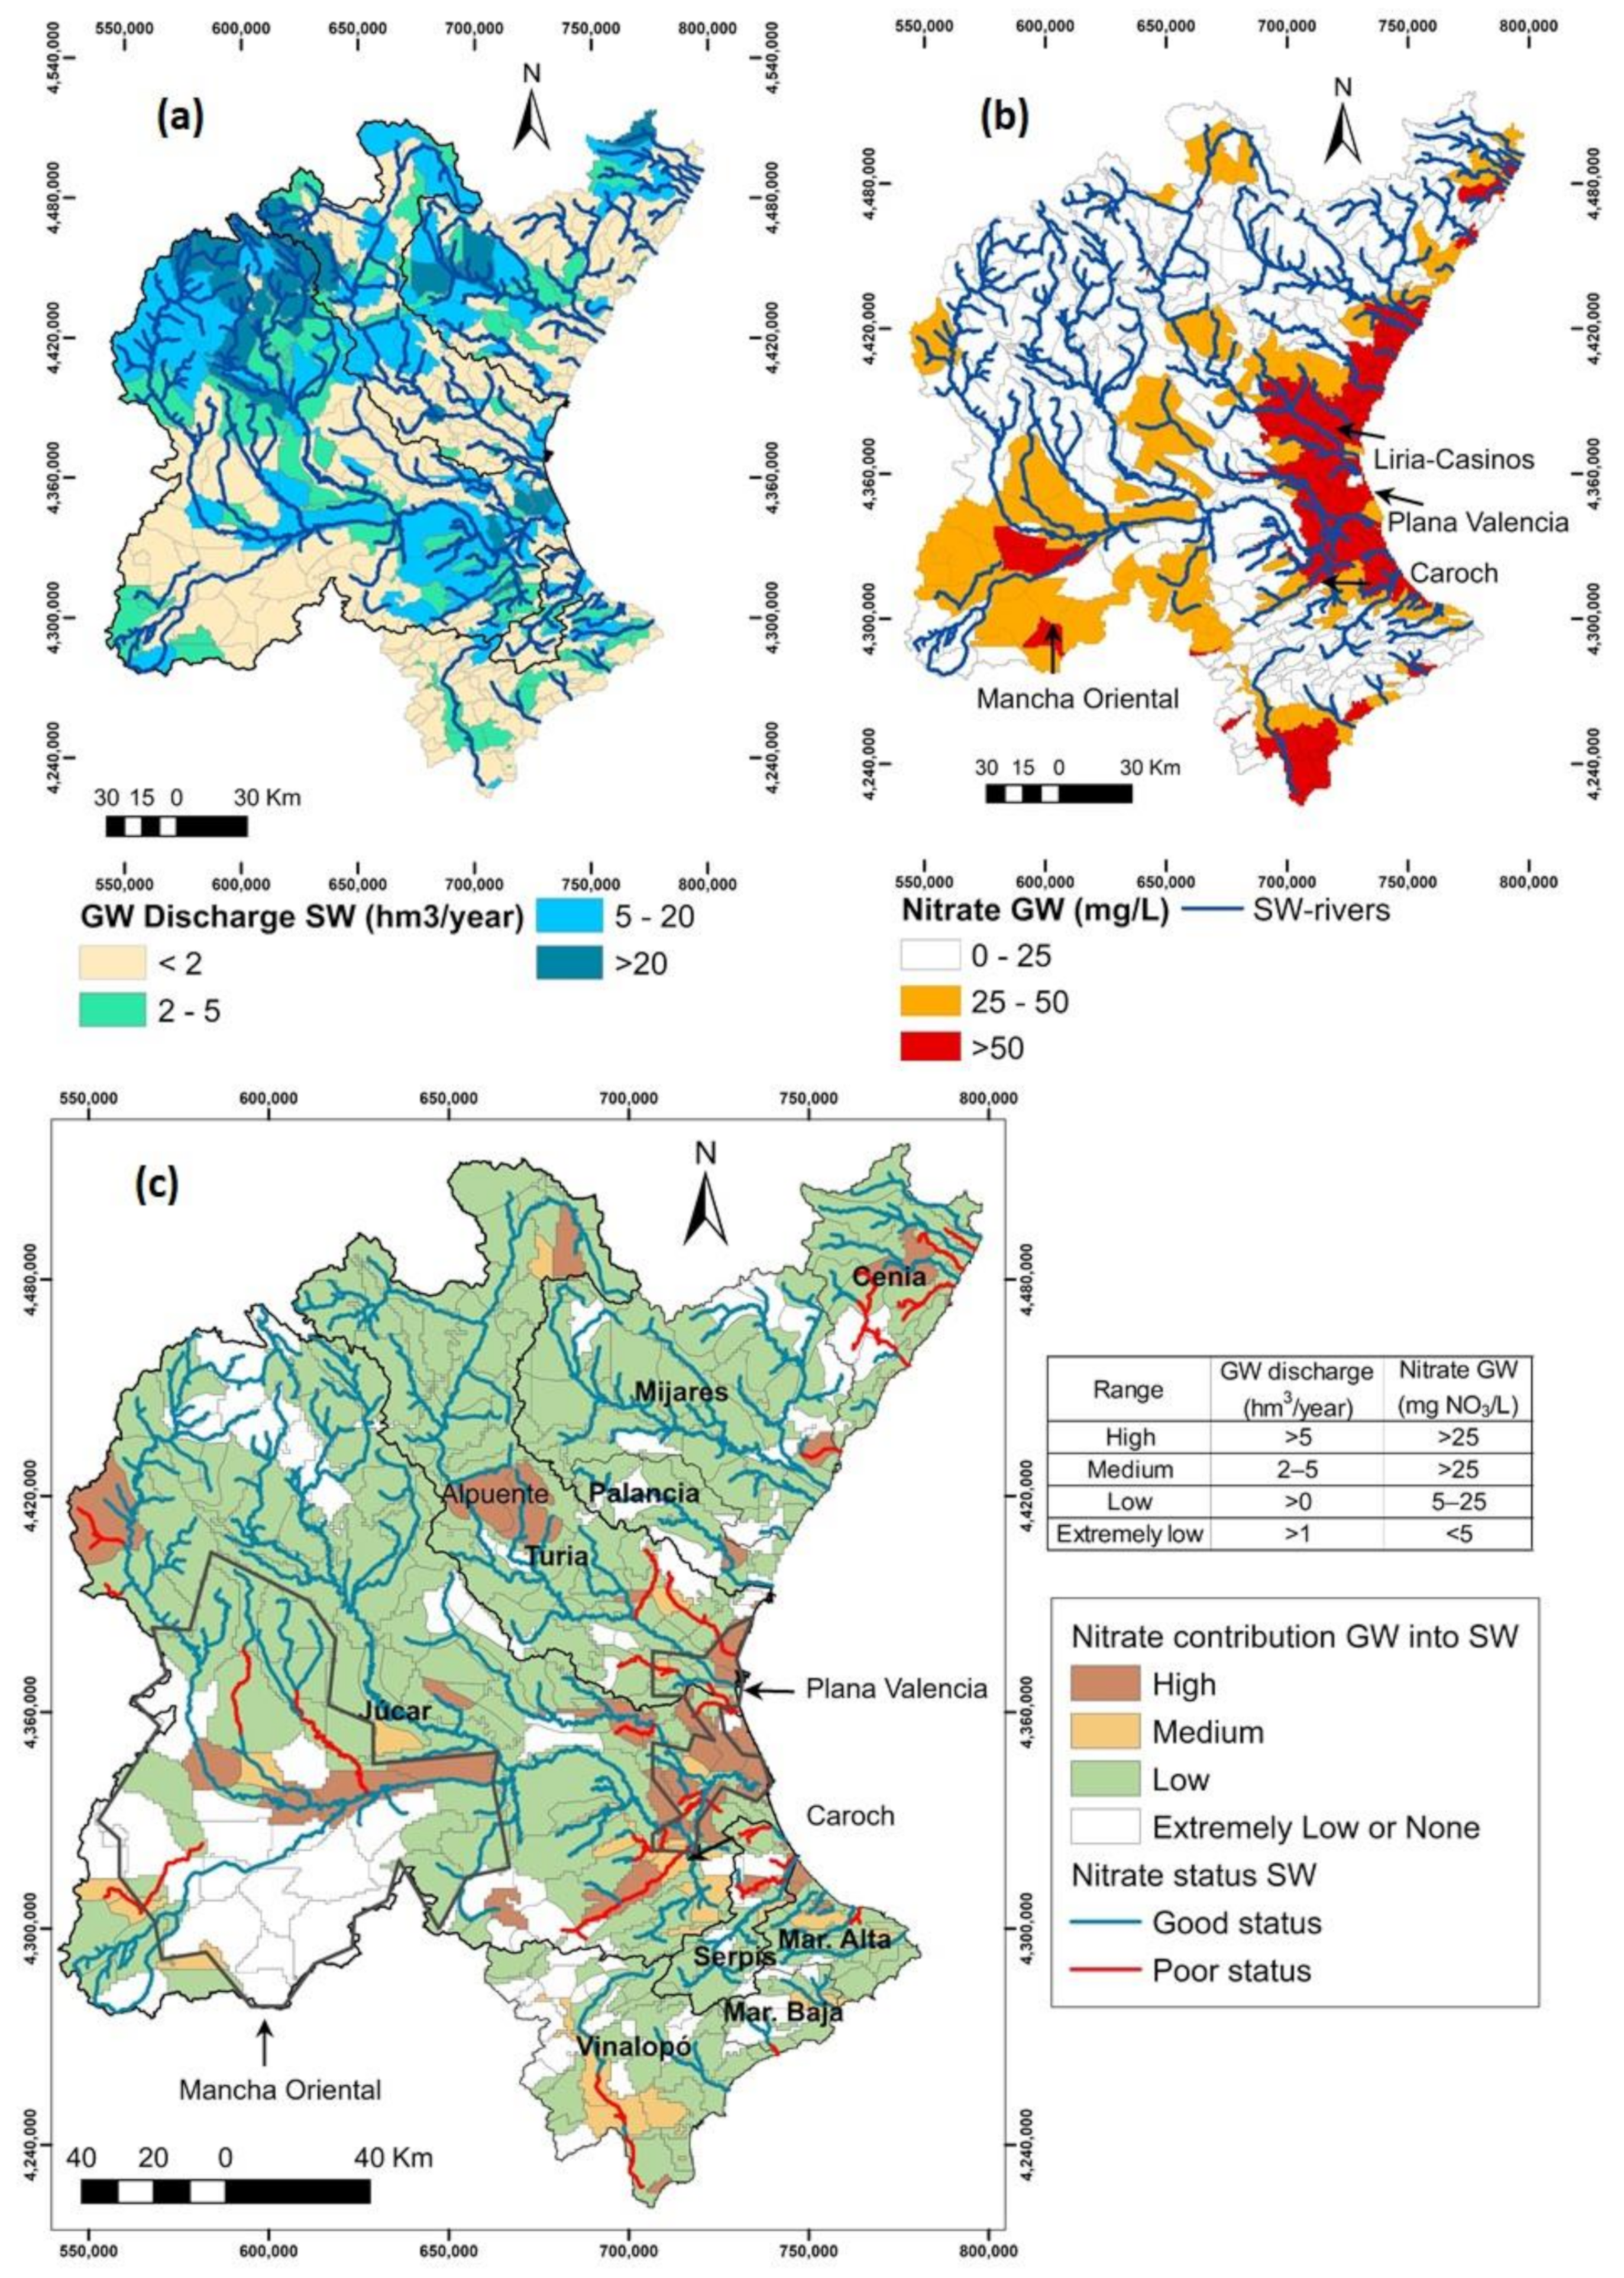
3.3. Nitrate Transfer from GW into Rivers

The contribution of nitrate transfer from GW into the rivers network (Figure 5c) was characterized by the GW discharge into the river (Figure 5a) and the nitrate concentration in GW (Figure 5b). Modelling the interception behaviour of streams, aquifers, lakes, wetlands, and springs allowed identifying aquifers that discharged or not to the surface. As a result, it was found that 9% of the district aquifers provided a high nitrate transfer to the rivers. The Júcar and Turia are affected by the presence of aquifers with concentrations above 25 mg NO3/L and discharges to rivers from aquifers over 5 hm3/year. The areas with the highest nitrate transfer in the district are in the middle zone of Júcar (Mancha oriental aquifer); lower zone of Júcar (Caroch Sur and Plana Valencia aquifers); and upper and middle zones of Turia (Alpuente aquifers). The coastal strip of the Júcar RBD is one of the most affected, due to high volume (20 hm3/year) and heavily polluted (NO3 > 50 mg/L) discharges from aquifers.
Nitrate transfer to rivers was classified as medium in 7% of the aquifers. The middle and downstream part of the Vinalopó River presented discharges lower than 5 hm3/year with a concentration in the aquifer above 25 mg NO3/L. Discharge from GW can be up to 25% of the total flow per year due to low streamflow in the river. More than half of the aquifers (63%) provided a low nitrate transfer to rivers, although the discharge volume to the river is high, the concentration is below 25 mg NO3/L. The remaining 21% of the aquifers provide extremely low or no nitrate transfer to rivers. The influence of GW on nitrate concentration varies from low to none in Marina Baja and Marina Alta because many SW rivers are considered losers.
The monthly mean nitrate concentration in the SW rivers and GW along the main axes in the Júcar and Turia rivers are shown in Figure 6a,b, respectively. The Júcar River has the largest catchment area and the greatest flow contribution of the whole district, with a total length of 509 km for the main axis (Figure 6a). In the upstream and midstream (headwaters—438 km), the nitrate concentrations in aquifers and rivers (observed and simulated data) are below the threshold for good status. In the downstream (454 km—mouth in the Mediterranean Sea), the median nitrate concentration in the river increases near the threshold and is exceeded in some SW rivers. Simulated and observed concentrations in the third and fourth quartiles are above the threshold in the SW rivers. Simultaneously, there is a sharp increase in the median nitrate concentrations in the aquifer (Plana Valencia), reaching a poor nitrate status.
The Turia River is the second with the largest area and flow contributions of the Júcar RBD. In the upstream and midstream, the nitrate concentration is below the threshold of good status in the SW rivers and aquifers. In the downstream, the mean nitrate concentration in SW rivers rises abruptly without exceeding the threshold of good status. However, the concentrations obtained in the third and fourth quartiles do exceed them in some sections. Concurrently, a sharp increase in the median nitrate concentration in the aquifers Plana of Valencia and Liria-Casinos reached a poor status (Figure 5b). This behaviour is similar to the Júcar River. In Júcar and Turia, a simple linear regression between nitrate concentration in SW and GW was performed (Figure 6c,d), considering that the two variables are measured independently. For this purpose, the median of these variables was obtained for each SW-river with a gaining relationship between river and aquifer in the main river axis. This regression was useful to adjust parameters and improve the suitability between observed and simulated indicators.
A direct correlation was found between nitrate concentration in the river and aquifers in Júcar (r2 = 0.9; Figure 6c) and Turia (r2 = 0.8; Figure 6d). This finding supported the classification of the contribution of GW nitrate to SW presented in Figure 5c. The median nitrate concentration in the main course of the Júcar and Turia rivers is considerably higher in the aquifer (29.7 mg NO3/L and 23.3 mg NO3/L, respectively) than in the river (5.8 mg NO3/L, and 7.8 mg NO3/L, respectively).
Most of the SW−rivers in poor status (NO3 > 25 mg/L) have a high to medium nitrate transfer from aquifers. Therefore, in these areas of the Júcar RBD, there is a direct correlation between nitrate transfer from GW and poor nitrate status in rivers. However, the proportion of this correlation depends on the GW discharge into the river, the nitrate concentration in GW, and the relationship between SW-GW. The effects of the nitrate transfer from the aquifer to the rivers have been previously analysed in Mediterranean areas [50] and other parts of the world [24,51], where an increase of nitrates was found in rivers located in areas with high discharge from polluted aquifers. This demonstrates the need to use simulation models that include SW−GW interactions, what is particularly important in arid and semi−arid areas, such as the Júcar RBD.
Simulation suitability adequately represented changes in the median nitrate concentration along the river length in both simulated and observed datasets. However, the first and third quartiles did not always fit, suggesting a change in the model parameters to adjust the minimum and maximum for the representation of extreme events. Finally, nitrate concentrations in the rivers and aquifers displayed a tendency to increase from the upstream to the downstream, except with the Júcar system midstream (also polluted), as presented by the authors in the Refs. [36,52,53].

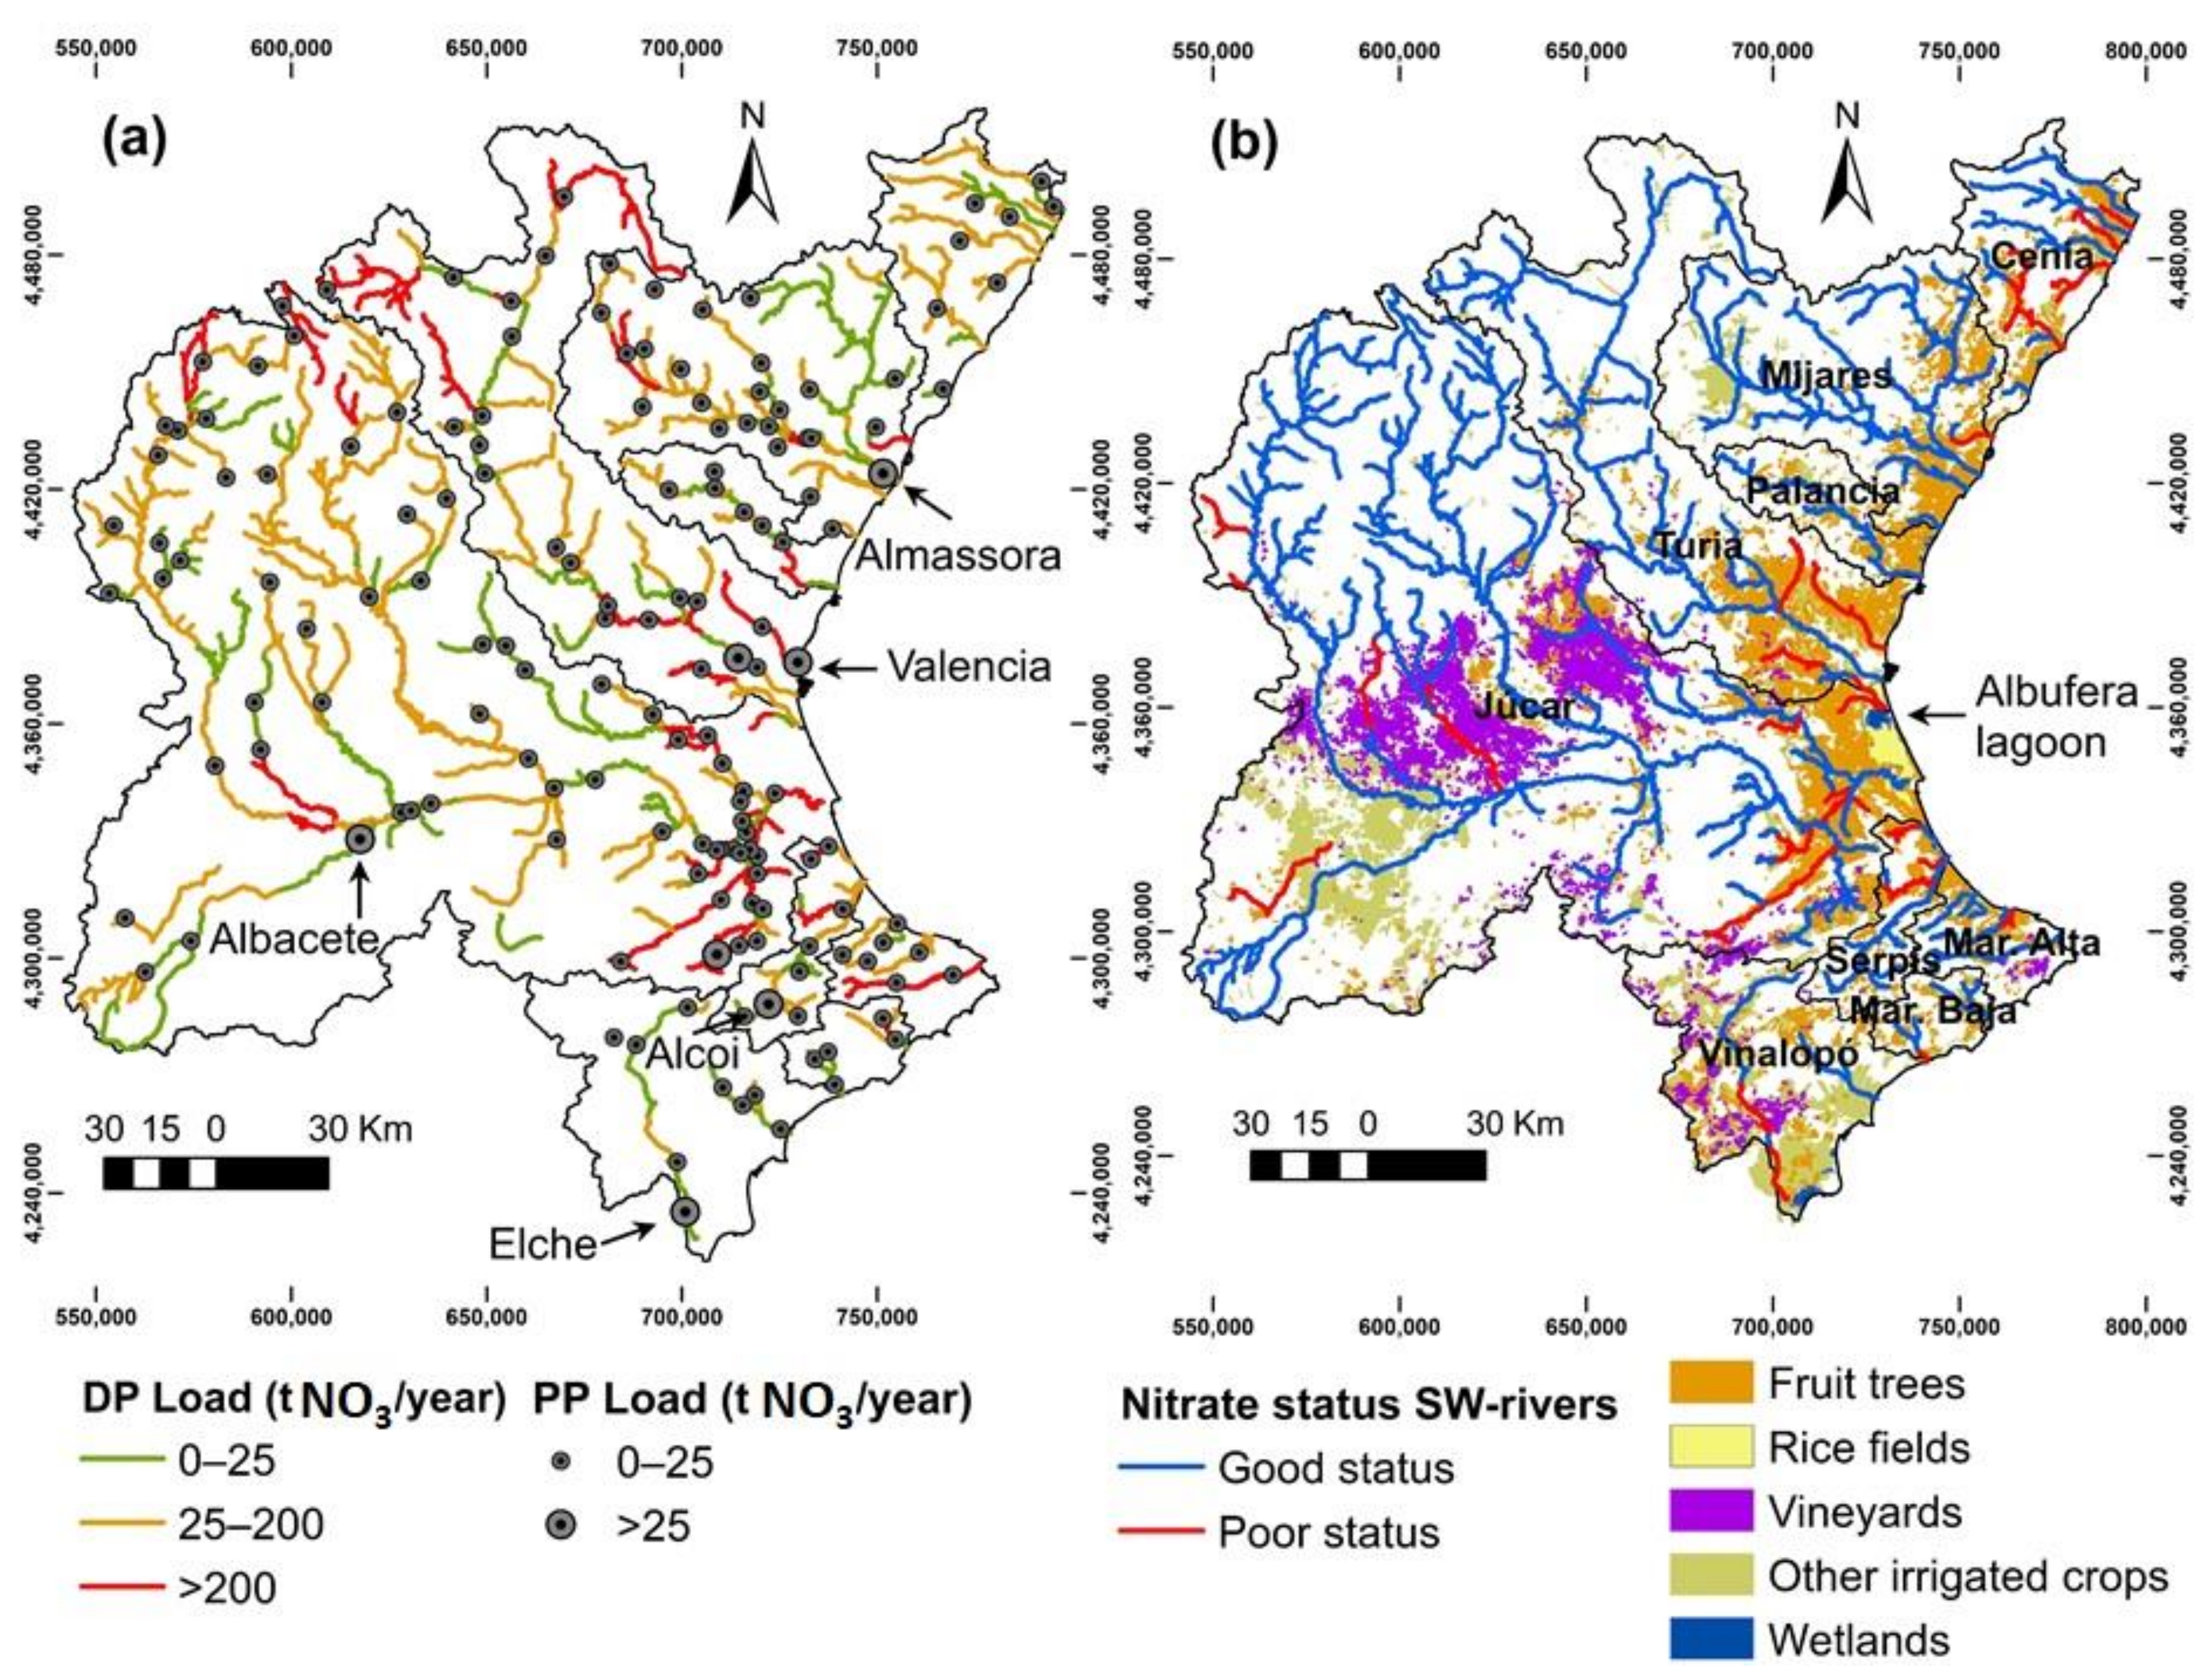
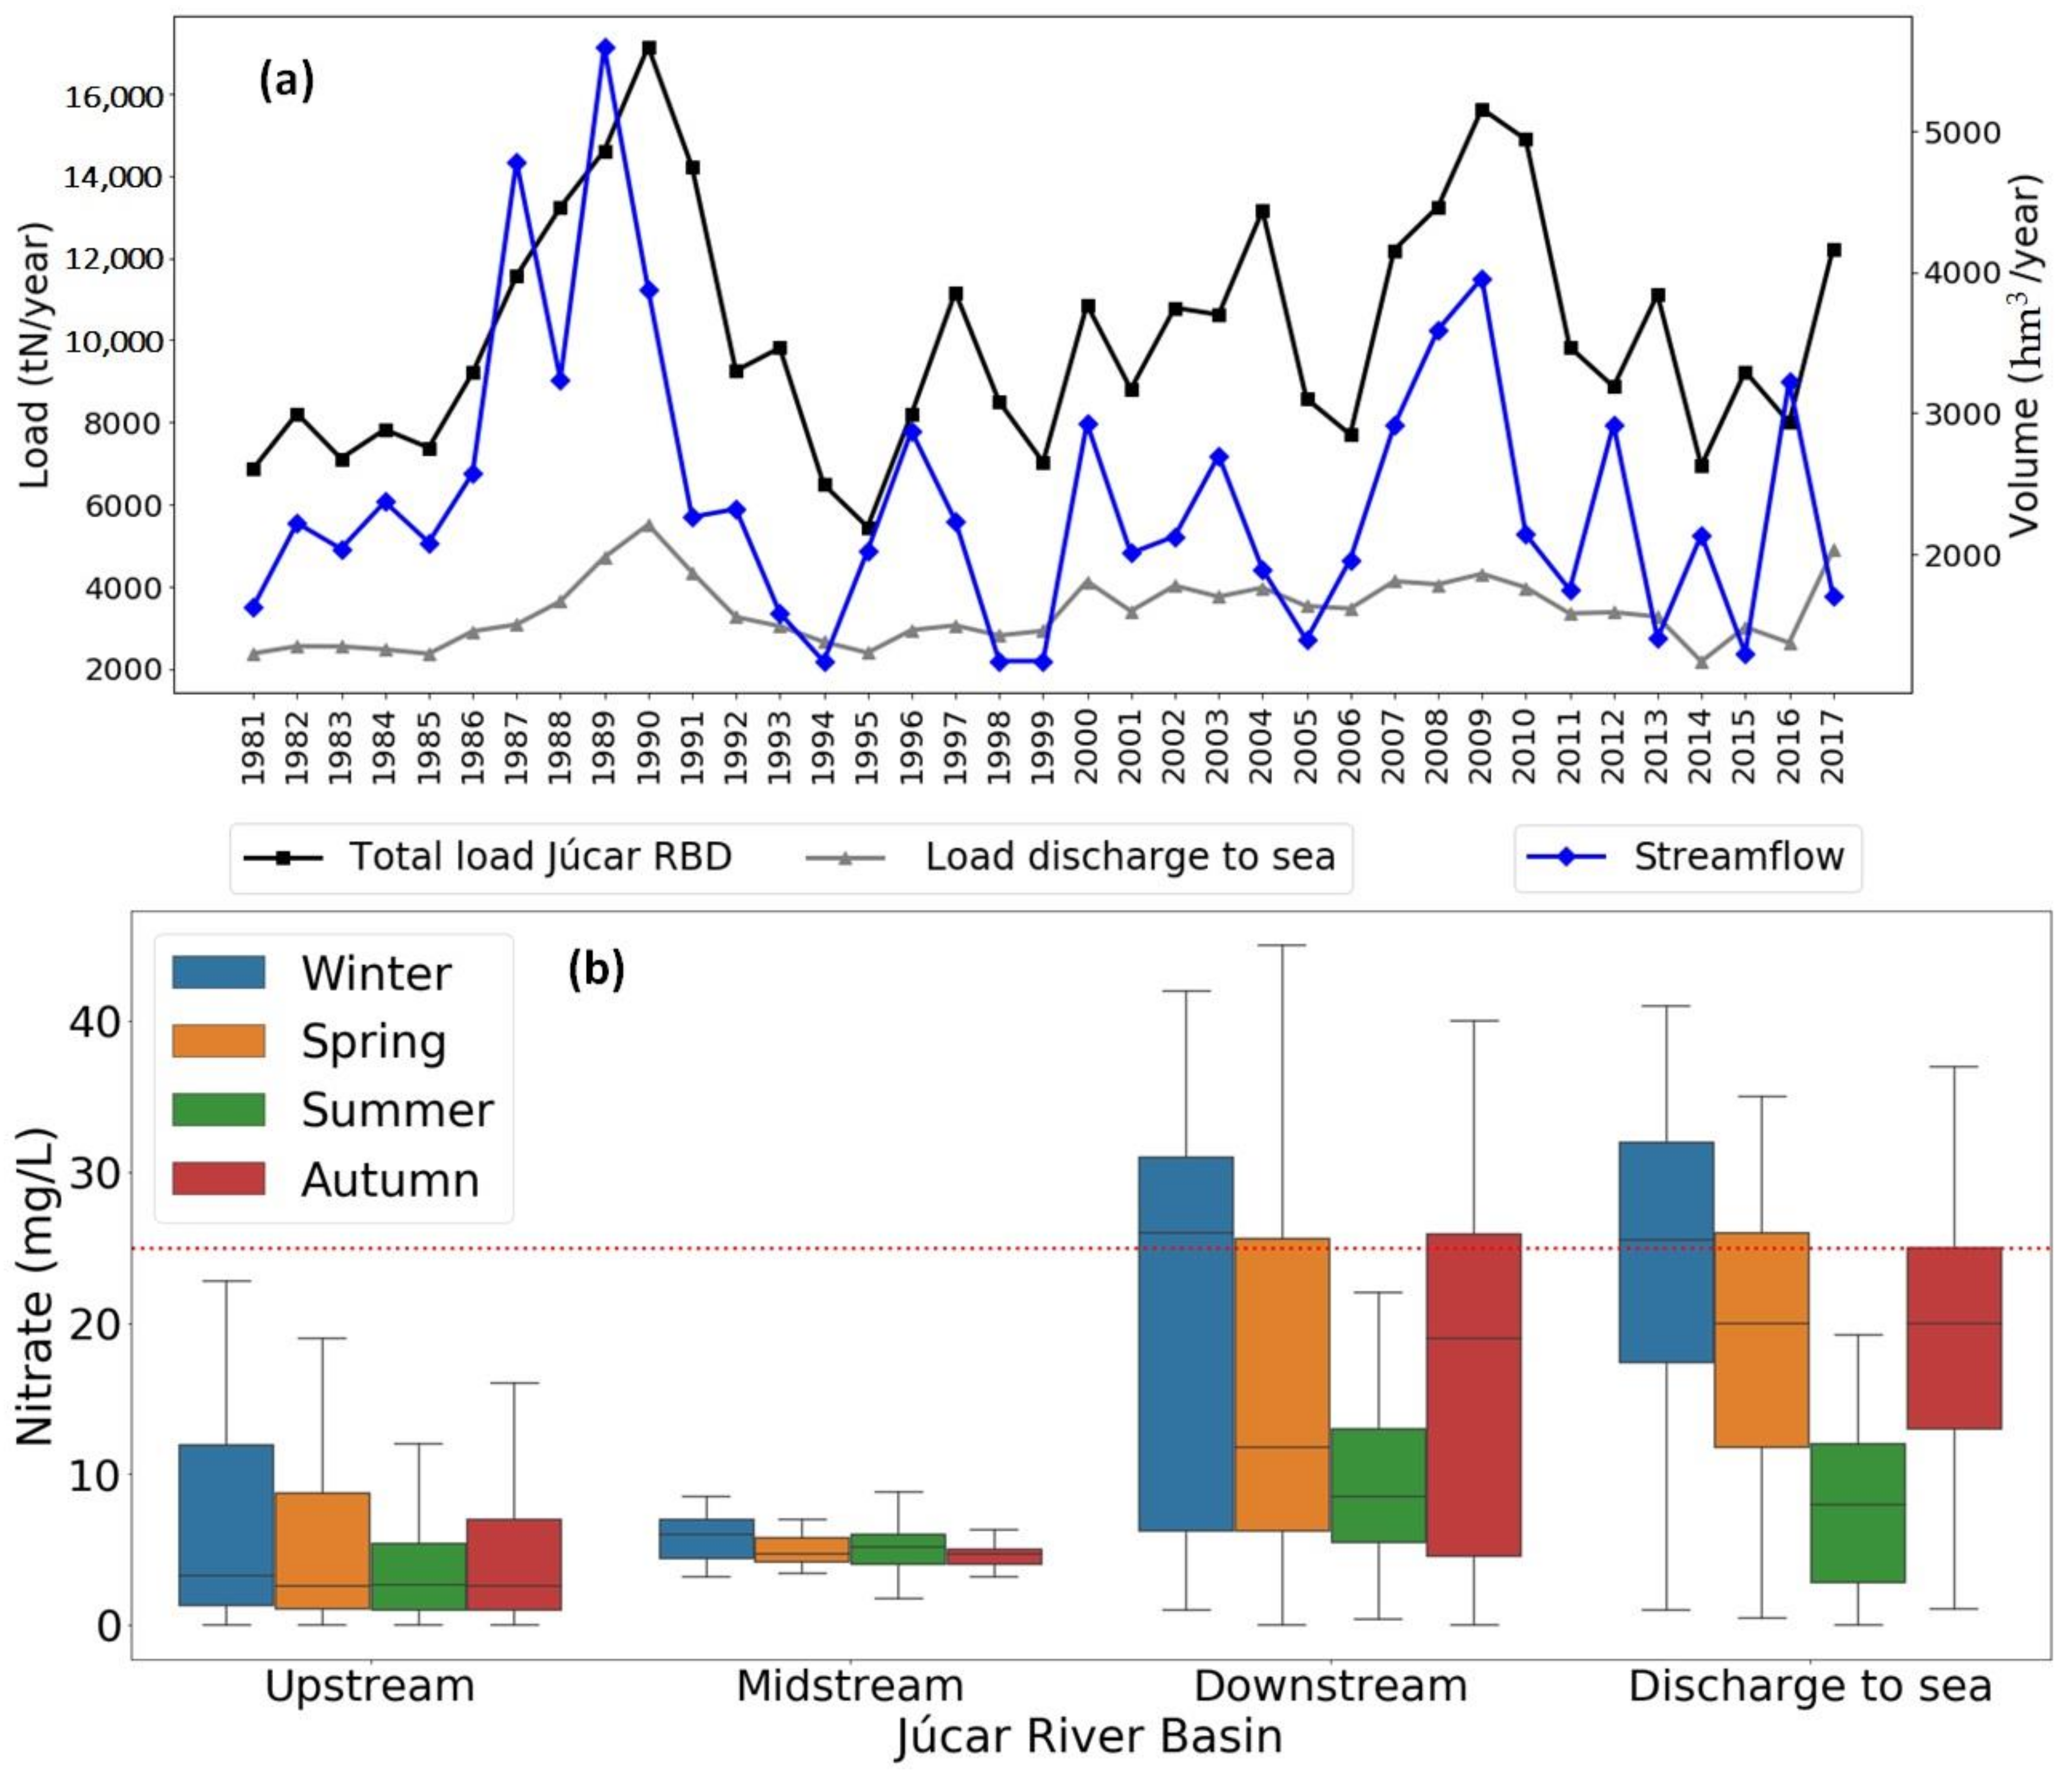
3.4. Point and Diffuse Pollution Sources

The spatial analysis of pollution sources showed that intensive agriculture downstream of the district generates a high diffuse load and pollution in rivers and aquifers (Figure 7b). In general, citrus orchards and rice crops with irrigation are the main sources of diffuse pollution, as irrigated agriculture generates the most leaching compared to non-irrigated crops [36,50]. Nitrate surplus in soil for citrus orchards remains constant at an average of 217 KgN/ha/year from the years 2007–2015 [42]; however, nitrate pollution has been intensifying. The highest point loads are generated in the WWTP of urban areas of Almassora (10,000–50,000 inhabitants), Albacete, Valencia, Alcoi, and Elche (50,000–100,000 inhabitants) (Figure 7a), most of them located downstream of the district, where it is most overexploited. Nevertheless, the average load generated by the diffuse source is about 100 times greater than the point source, so the impact of the point sources on the district is comparatively low.
Agricultural returns represent an important recharge in the water balance in the Júcar RBD [30]. The use of polluted aquifers to supply the main demands of the agricultural sector and the large amount of load discharged into rivers from irrigated crops explain the fact that locations with the highest nitrate pollution in the SW and GW are in irrigated agricultural areas. This is in agreement with previous studies in arid regions [54].
Different research papers in the Júcar RBD indicate that even if the rate of nitrogen fertilizers is reduced, leachate production remains high in areas irrigated with high nutrient concentration water [55,56,57]. However, the combined effect of the reduction in irrigation and nitrogen fertilization decreases nitrate leaching [58]. The source, quantity, and method of irrigation in conjunction with the fertilization plan have a major influence on the accumulation of nitrogen in the soil and the leachate generated [59,60,61].
SW rivers total loads are estimated at 2.39 KgN/ha/year (Table 4). Although the agricultural area covers 31% of the land use in the district, the pollution caused by diffuse load corresponds to 99% of the total load to rivers. Nevertheless, the total load obtained is lower compared to other basins in Europe with a similar percentage of agricultural land. For instance, in Portuguese basins with 44% of agricultural land, the estimated annual nitrate load average is 7.0 kgN/ha/year [10]; in the Sabor river basin (a tributary of the Duero River Basin, in the Iberian Peninsula), with 35% of the area occupied by agriculture, the nitrate load in the most critical areas is 4.26 kgN/ha/year [62]; and in the Danube River Basin, with 42% of agricultural land, the estimated average annual nitrate load is 6.14 kgN/ha/year [63].
A nitrate load of 79 kgN/km2/year reaches the Mediterranean Sea. This load is lower than those obtained by Ludwig et al. [64] and Romero et al. [65] (233 kgN/km2/year between 1975 and 2000, and 100–200 kgN/km2/year between 2000 and 2010, respectively). Other studies around the world have assessed the discharge of nitrate into the sea. As representative examples: (i) Mitsch et al. [66] reported that in the Mississippi RB a load of 21.000 tN/year is generated, and about 1.600 tN/year (8%) reaches the Gulf (1990–2000 period); (ii) the delivery from Danube RB to Black Sea was around 540–570 kg NO3/km2/year in the period 1995–2009 [63]; and (iii) nitrate loads delivered by the Po River to the Adriatic Sea in the period 2003–2007 were estimated at 86,295 tN/year [67].
Although several regulations have been implemented to reduce water resources nitrate pollution, the annual variation of the nitrate load in the SW rivers and nitrate discharges into the Mediterranean Sea in the Júcar RBD has remained constant from 1992 to 2017 (Figure 8a), which is in agreement with previous results obtained in other Mediterranean basins [64]. Nitrate loads have a similar behaviour to the streamflow in the basin (Figure 8a). This is because the most significant nitrate leaching events occur after periods of high rainfall, decreasing the mineral N in the soil, which is leached out [56,68].
Regarding seasonal variability in the SW rivers (Figure 8b), mean nitrate concentrations are low in the upstream and midstream without major differences between seasons. In contrast, a strong change in nitrate concentration was detected downstream. For instance, in winter, spring, and autumn 75% and 95% percentiles are in poor status. Compared to summer, the nitrate concentration increases 35%, 17%, and 16% in winter, spring, and autumn, respectively. As nitrate inputs are mainly from diffuse sources, rise of pollution takes place mainly in winter and spring, when water flows are high. This finding is consistent with the relationship between nitrate concentration and the rainfall reported by the Refs. [69,70], who studied the coastal region of the Júcar River, and also with other results previously reported in different basins [54,71,72,73]. The lower concentration in summer is influenced by the large number of dams that significantly modify river flows. Consequently, the main water sources in summer are dams and small channel discharges [74].
The integration of the SW–GW interactions in the hydrological planning of the river basins is of vital importance, since it allows for the identification of the main pressures, focuses actions to improve the status of water resources, and identifies sensitive areas to prioritize, in order to reach the environmental objectives of the WFD. Critical points were identified where further research is needed. For example, to support decision-making in the coastal zones of the basins where the most pollution is found, it is possible to measure the amount of groundwater used for irrigation and include in the fertilization plan the contribution of nutrients from the irrigation water, optimize soil management, and convert agricultural land to protection zones around the most critical rivers seeking to increase the buffer capacity of vegetation. On the other hand, in the smaller basins with a high contribution of pollution to Júcar RBD, it is possible to strengthen the monitoring network for nitrate concentrations, as well as to increase the nutrient gauging stations.

4. Conclusions

This paper integrated two numerical models (PATRICAL and RREA) to assess nitrate concentration in surface and groundwater of the Júcar River Basin District (RBD) and to determine the main drivers of pollution and the effects of nitrate transfers from the aquifer on the nitrate status of the rivers.
It was found that there is a direct linear correlation between the nitrate concentration in the river and aquifer along the main course of the Júcar and Turia rivers. Changes of nitrate concentration in rivers of the Júcar RBD are strongly related to the source of irrigation water, river–aquifer interaction, and the regulation of water flow produced by the dams. The models properly represent the effects of the SW–GW interaction in the nitrate status on the rivers in 87% of the Júcar RBD.
Therefore, this paper proves that PATRICAL and RREA models, after a proper calibration and validation process, allow for assessment of the concentration of nitrates in surface- and ground-water. This is particularly relevant in in arid and semi-arid areas, such as the Mediterranean basins.
The models may also be used to identify pollution sources, evaluate the efficiency of management strategies to prevent water degradation, and analyze the effects of natural or human-induced changes on the nitrate concentration in the water bodies, among a wide range of applications. Thus, future research could be focused on analysing how climate and land use variations affect nitrate concentration in rivers and aquifers.

Author Contributions

Conceptualization, D.Y.D.-G., J.P.-A. and M.Á.P.-M.; methodology, D.Y.D.-G., J.P.-A. and M.Á.P.-M.; software, D.Y.D.-G., J.P.-A. and M.Á.P.-M.; validation, D.Y.D.-G., J.P.-A. and M.Á.P.-M.; formal analysis, D.Y.D.-G., J.P.-A., M.Á.P.-M. and H.T.H.; investigation, D.Y.D.-G., J.P.-A., M.Á.P.-M. and H.T.H.; resources, J.P.-A. and M.Á.P.-M.; data curation, D.Y.D.-G.; writing—original draft preparation, D.Y.D.-G.; writing—review and editing, D.Y.D.-G., J.P.-A., M.Á.P.-M. and H.T.H.; visualization, D.Y.D.-G.; supervision, J.P.-A. and M.Á.P.-M.; project administration, J.P.-A. and M.Á.P.-M.; funding acquisition, J.P.-A. and M.Á.P.-M. All authors have read and agreed to the published version of the manuscript.

Funding

The first author’s research is partially funded by a PhD scholarship from the food research stream of the program “Colombia Científica—Pasaporte a la Ciencia”, granted by the Colombian Institute for Educational Technical Studies Abroad (Instituto Colombiano de Crédito Educativo y Estudios Técnicos en el Exterior, ICETEX). The authors thank the Spanish Research Agency (AEI) for the financial support to RESPHIRA project (PID2019-106322RB-100)/AEI/10.13039/501100011033.

Institutional Review Board Statement

Not applicable.

Informed Consent Statement

Not applicable.

Data Availability Statement

Water hydrographic network, water demands, nitrate concentration in surface and groundwater, streamflow, groundwater withdrawals and piezometric levels data set area available in Water Information System for the Júcar RBD (SIA Júcar, Available online: aps.chj.es/siajucar/, accessed on 26 March 2021). Precipitation and temperature data set can be found in www.saih.chj.es and www.aemet.es (accessed on 26 March 2021), respectively. Point discharge in surface and groundwater and equivalent population in urban areas can be consulted in the Spanih National census of discharges (MITECO, Available online: www.miteco.gob.es, accessed on 26 March 2021).

Acknowledgments

We appreciate the help provided by the Júcar River Basin District Authority (CHJ), who gathered field data.

Conflicts of Interest

The authors declare no conflict of interest.

Appendix A

  • PATRICAL
PATRICAL in the hydrological component includes, in addition to the variables mentioned above, GW extractions (agricultural and urban) and the evolution of the average piezometry of the aquifers. Considering the previous human activities that affect the hydrological cycle, the model compares circulating flows and piezometric levels. In this way, it obtains the modifications that take place in the GW bodies and how they affect the surface flows (Figure 2a).
The temporal variability of water resources and the historical evolution of water use and pollution sources are determining factors for the physical-chemical situation of water bodies. PATRICAL is operated in the following steps (Figure 2a):
(1)
Share of liquid water and snow on the land;
(2)
Water and nitrogen balance in the soil and excesses (water and nitrates);
(3)
Excesses are decomposed into surface runoff and infiltration into aquifers.
(4)
GW module;
(5)
Groundwater runoff is added to surface runoff forming total runoff, allowing to know the water volume and nitrate load in each section of the drainage network.
The modelled basin is divided into three zones: (1) the surface soil zone; (2) the unsaturated medium, between the aquifer and the root zone, it varies according to the piezometric level in the aquifer; and (3) the aquifer (Figure 2a).
  • RREA
The total loads of nitrogen from point sources (kg/month) were calculated according to the concentration and volume of the discharge associated with a SW rivers. When the SW-river did not have a census of discharges, it was calculated with the number of population equivalent and the treatment of wastewater purification associated with the treatment plant of the area. The procedure to obtain the number of population equivalent is similar to that already used in other RB, it was calculated based on the annual volume of discharge and the supply of drinking water per population of each municipality [75]. Reused water was considered since it decreases the amount of load brought to the water bodies.
The program performs a mass and flow balance for each river-type water body on a monthly scale. The mass balance is defined by the following variables: amount of mass that enters (Me,i) to the water body i, pollutant mass (Mgen,i) that is generated in the basin of the mass i, and the mass of pollutant that leaves the water body j and discharges to the mass i (Ms,j(j→i)). The mass balance is defined by the following equation (Paredes-Arquiola 2015):
M e , i = M g e n , i + j = 1 n M s , j j i
The flow extracted is taken into account in the two balances to extract the mass of pollutant that carries the flow extracted.
M s , i = M e , i × e K L

References

  1. Food and Agriculture Organization of the United Nations. More People, More Food, Worse Water? A Global Review of Water Pollution from Agriculture; Food and Agriculture Organization of the United Nations: Rome, Italy, 2018; ISBN 978-92-5-130729-8. [Google Scholar]
  2. Huang, H.; Ouyang, W.; Guo, B.; Shi, Y.; Hao, F. Vertical and horizontal distribution of soil parameters in intensive agricultural zone and effect on diffuse nitrogen pollution. Soil Tillage Res. 2014, 144, 32–40. [Google Scholar] [CrossRef]
  3. Graversgaard, M.; Hedelin, B.; Smith, L.; Gertz, F.; Højberg, A.L.; Langford, J.; Martinez, G.; Mostert, E.; Ptak, E.; Peterson, H.; et al. Opportunities and barriers for water co-governance—A critical analysis of seven cases of diffuse water pollution from agriculture in Europe, Australia and North America. Sustainability 2018, 10, 1634. [Google Scholar] [CrossRef] [Green Version]
  4. Singh, S.; Anil, A.G.; Kumar, V.; Kapoor, D.; Subramanian, S.; Singh, J.; Ramamurthy, P.C. Nitrates in the environment: A critical review of their distribution, sensing techniques, ecological effects and remediation. Chemosphere 2022, 287, 131996. [Google Scholar] [CrossRef] [PubMed]
  5. Bouraoui, F.; Grizzetti, B. Modelling mitigation options to reduce diffuse nitrogen water pollution from agriculture. Sci. Total Environ. 2014, 468–469, 1267–1277. [Google Scholar] [CrossRef]
  6. Harrison, S.; McAree, C.; Mulville, W.; Sullivan, T. The problem of agricultural ‘diffuse’ pollution: Getting to the point. Sci. Total Environ. 2019, 677, 700–717. [Google Scholar] [CrossRef] [PubMed]
  7. Wuijts, S.; Claessens, J.; Farrow, L.; Doody, D.G.; Klages, S.; Christophoridis, C.; Cvejić, R.; Glavan, M.; Nesheim, I.; Platjouw, F.; et al. Protection of drinking water resources from agricultural pressures: Effectiveness of EU regulations in the context of local realities. J. Environ. Manag. 2021, 287. [Google Scholar] [CrossRef]
  8. Evans, A.E.; Mateo-Sagasta, J.; Qadir, M.; Boelee, E.; Ippolito, A. Agricultural water pollution: Key knowledge gaps and research needs. Curr. Opin. Environ. Sustain. 2019, 36, 20–27. [Google Scholar] [CrossRef]
  9. Liu, J.; Peng, Y.; Li, C.; Gao, Z.; Chen, S. Characterization of the hydrochemistry of water resources of the Weibei Plain, Northern China, as well as an assessment of the risk of high groundwater nitrate levels to human health. Environ. Pollut. 2021, 268, 115947. [Google Scholar] [CrossRef]
  10. Cruz, S.; Cordovil, C.M.d.S.; Pinto, R.; Brito, A.G.; Cameira, M.R.; Gonçalves, G.; Poulsen, J.R.; Thodsen, H.; Kronvang, B.; May, L. Nitrogen in water-Portugal and Denmark: Two contrasting realities. Water 2019, 11, 1114. [Google Scholar] [CrossRef] [Green Version]
  11. Cresswell, H. Agriculture, Hydrology and Water Quality; CABI: Egham, UK, 2004; Volume 3, ISBN 0851995454. [Google Scholar]
  12. Harvey, J.W.; Gooseff, M. River corridor science: Hydrologic exchange and ecological consequences from bedforms to basins. Water Resour. Res. 2015, 51, 6893–6922. [Google Scholar] [CrossRef] [Green Version]
  13. McLachlan, P.J.; Chambers, J.E.; Uhlemann, S.S.; Binley, A. Geophysical characterisation of the groundwater–surface water interface. Adv. Water Resour. 2017, 109, 302–319. [Google Scholar] [CrossRef] [Green Version]
  14. Conant, B.; Robinson, C.E.; Hinton, M.J.; Russell, H.A.J. A framework for conceptualizing groundwater-surface water interactions and identifying potential impacts on water quality, water quantity, and ecosystems. J. Hydrol. 2019, 574, 609–627. [Google Scholar] [CrossRef]
  15. Arnold, J.G.; Srinivasan, R.; Muttiah, S.; Williams, J. Large area hydrologic modeling and assessment Part 1: Model development. J. Am. Water Resour. Assoc. 1998, 34, 70. [Google Scholar] [CrossRef]
  16. Niswonger, R.G.; Panday, S.; Ibaraki, M. MODFLOW-NWT, A Newton Formulation for MODFLOW-2005. US Geol. Surv. Tech. Methods 2005, 6, 44. [Google Scholar]
  17. Ewen, J.; Geoff, P.; O’Connell, E. SHETRAN: Distributed river basin flow and transport modeling system. J. Hydrol. Eng. 2000, 5, 250–258. [Google Scholar] [CrossRef] [Green Version]
  18. Park, S.S.; Lee, Y.S. A water quality modeling study of the Nakdong River, Korea. Ecol. Modell. 2002, 152, 65–75. [Google Scholar] [CrossRef]
  19. Ledoux, E.; Gomez, E.; Monget, J.M.; Viavattene, C.; Viennot, P.; Ducharne, A.; Benoit, M.; Mignolet, C.; Schott, C.; Mary, B. Agriculture and groundwater nitrate contamination in the Seine basin. The STICS-MODCOU modelling chain. Sci. Total Environ. 2007, 375, 33–47. [Google Scholar] [CrossRef]
  20. Environmental Protection Agency (EPA). EPA Guidance for Using PRZM-GW in Drinking Water Exposure Assessments; Environmental Protection Agency: Washington, DC, USA, 2012.
  21. Krause, S.; Boano, F.; Cuthbert, M.; Fleckenstein, J.H.; Lewandowski, J. Understanding process dynamics at aquifer-surface water interfaces: An introduction to the special section on new modeling approaches and novel experimental technologies. Eos Trans. Am. Geophys. Union 2014, 66, 17. [Google Scholar] [CrossRef]
  22. Madlala, T.; Kanyerere, T.; Oberholster, P.; Xu, Y. Application of multi-method approach to assess groundwater–surface water interactions, for catchment management. Int. J. Environ. Sci. Technol. 2019, 16, 2215–2230. [Google Scholar] [CrossRef] [Green Version]
  23. Guggenmos, M.R.; Daughney, C.J.; Jackson, B.M.; Morgenstern, U. Regional-scale identification of groundwater-surface water interaction using hydrochemistry and multivariate statistical methods, Wairarapa Valley, New Zealand. Hydrol. Earth Syst. Sci. 2011, 15, 3383–3398. [Google Scholar] [CrossRef] [Green Version]
  24. Lee, C.M.; Hamm, S.Y.; Cheong, J.Y.; Kim, K.; Yoon, H.; Kim, M.S.; Kim, J. Contribution of nitrate-nitrogen concentration in groundwater to stream water in an agricultural head watershed. Environ. Res. 2020, 184, 109313. [Google Scholar] [CrossRef]
  25. Xiao, J.; Jin, Z.; Wang, J. Assessment of the hydrogeochemistry and groundwater quality of the tarim river basin in an extreme arid region, NW China. Environ. Manag. 2014, 53, 135–146. [Google Scholar] [CrossRef]
  26. Teng, Y.; Hu, B.; Zheng, J.; Wang, J.; Zhai, Y.; Zhu, C. Water quality responses to the interaction between surface water and groundwater along the Songhua River, NE China. Hydrogeol. J. 2018, 26, 1591–1607. [Google Scholar] [CrossRef]
  27. Gómez-Martínez, G.; Pérez-Martín, M.A.; Estrela-Monreal, T.; del-Amo, P. North Atlantic Oscillation as a Cause of the Hydrological Changes in the Mediterranean (Júcar River, Spain). Water Resour. Manag. 2018, 32, 2717–2734. [Google Scholar] [CrossRef]
  28. Pérez-Martín, M.A.; Estrela, T.; del-Amo, P. Measures required to reach the nitrate objectives in groundwater based on a long-term nitrate model for large river basins (Júcar, Spain). Sci. Total Environ. 2016, 566–567, 122–133. [Google Scholar] [CrossRef] [Green Version]
  29. Confederación Hidrográfica del Júcar. Anejo 2 Inventario de Recursos hídricos. In Plan Hidrológico de La Demarcación Hidrográfica del Júcar Memoria; Confederación Hidrográfica del Júcar: Valencia, Spain, 2015; p. 896. Available online: https://www.chj.es/Descargas/ProyectosOPH/Consulta%20publica/PHC-2015-2021/PHJ1521_Anejo02_RRHH_151126.pdf (accessed on 13 June 2020).
  30. Pérez-Martín, M.A.; Estrela, T.; Andreu, J.; Ferrer, J. Modeling water resources and river-aquifer interaction in the Júcar River Basin, Spain. Water Resour. Manag. 2014, 28, 4337–4358. [Google Scholar] [CrossRef]
  31. Paredes-Arquiola, J. Manual Técnico del Modelo Respuesta Rápida del Estado Ambiental (R2EA) de Masas de Agua Superficiales Continentales; Technical University of Valencia: Valencia, Spain, 2021; Available online: https://aquatool.webs.upv.es/files/manuales/rrea/ManualT%C3%A9cnicoModeloRREA_V3.pdf (accessed on 13 January 2021).
  32. Estrela, T.; Pérez-Martin, M.A.; Vargas, E. Impacts of climate change on water resources in Spain. Hydrol. Sci. J. 2012, 57, 1154–1167. [Google Scholar] [CrossRef]
  33. Ortega-Gómez, T.; Pérez-Martín, M.A.; Estrela, T. Improvement of the drought indicators system in the Júcar River. Sci. Total. Environ. 2018, 611, 276–290. [Google Scholar] [CrossRef]
  34. Bolinches, A.; De Stefano, L.; Paredes-Arquiola, J. Designing river water quality policy interventions with scarce data: The case of the Middle Tagus Basin, Spain. Hydrol. Sci. J. 2020, 65, 749–762. [Google Scholar] [CrossRef]
  35. Wilks, D. Statistical Methods in the Atmospheric Sciences; Academic Press: Cambridge, MA, USA, 2007; Volume 14, ISBN 9780127519661. [Google Scholar]
  36. Ferreira, D.; De Almeida, J.A.; Simões, M.; Pérez-Martín, M. Agricultural practices and geostatistical evaluation of nitrate pollution of groundwater in the Júcar River Basin District, Spain. Emirates J. Food Agric. 2016, 28, 415–424. [Google Scholar] [CrossRef] [Green Version]
  37. General Directory of Water; Geological and Mining Institute of Spain (IGME DGA). Trabajos de la Actividad 4 Identificación y Caracterización de la Interrelación que se Presenta entre Aguas Subterráneas, Cursos Fluviales, Descargas por Manantiales, Zonas Húmedas y Otros Ecosistemas Naturales de Especial Interés Hídrico; Geological and Mining Institute of Spain: Madrid, Spain, 2012; Available online: https://www.chj.es/Descargas/ProyectosOPH/Consulta%20publica/PHC-2015-2021/ReferenciasBibliograficas/AguasSubterraneas/IGME-DGA,2009.Act04_RelacSuperf_SubtMEMORIA%20RESUMEN.pdf (accessed on 20 May 2020).
  38. Ministerio de Fomento Gobierno de España. Corine Land Cover (CLC). Available online: https://www.idee.es/csw-codsi-idee/srv/api/records/spaignCLC2018 (accessed on 7 January 2020).
  39. Confederación Hidrográfica del Júcar. Memoria. In Plan Hidrológico de la Demarcación Hidrográfica del Júcar 2015–2021; Confederación Hidrográfica del Júcar: Valencia, Spain, 2015; p. 852. Available online: https://www.chj.es/es-es/medioambiente/planificacionhidrologica/Paginas/PHC-2015-2021-Plan-Hidrologico-cuenca.aspx (accessed on 20 January 2020).
  40. Confederación Hidrográfica del Júcar. Anejo 7 Inventario de Presiones. In Plan Hidrológico de la Demarcación Hidrográfica del Júcar Memoria. 2015–2021; Confederación Hidrográfica del Júcar: Valencia, Spain, 2015; Available online: https://www.chj.es/Descargas/ProyectosOPH/Consulta%20publica/PHC-2015-2021/PHJ1521_Anejo07_Presiones_151126.pdf (accessed on 20 January 2020).
  41. Confederación Hidrográfica del Júcar. Anejo 12. Evaluación del estado de las masas de agua superficial y subterránea. Ciclo de planificación hidrológica 2015–2021. In Plan Hidrológico de la Demarcación Hidrográfica del Júcar. 2015–2021; Confederación Hidrográfica del Júcar: Valencia, Spain, 2015; Available online: https://www.chj.es/Descargas/ProyectosOPH/Consulta%20publica/PHC-2015-2021/PHJ1521_Anejo12_Estado_151126.pdf (accessed on 20 January 2020).
  42. Ministry of Agriculture (Spain). Balance del Nitrogeno en la Agricultura Española. Año 2016; Ministry of Agriculture: Madrid, Spain, 2018; p. 110. Available online: https://www.mapa.gob.es/es/agricultura/temas/medios-de-produccion/bn2016_metodologia-resultados_tcm30-507806.pdf (accessed on 7 January 2020).
  43. Van Rossum, G. Python/C API Reference Manual; Python Software Foundation: Wilmington, DE, USA, 1999; Available online: https://docs.python.org/3/c-api/index.html (accessed on 20 December 2019).
  44. Moriasi, D.; Arnold, J.; Van Liew, M.; Bingner, R.; Harmel, R.; Veith, T. Model evaluation. Am. Soc. Agric. Biol. Eng. 2007, 39, 227–234. [Google Scholar] [CrossRef]
  45. Gupta, H.V.; Kling, H.; Yilmaz, K.K.; Martinez, G.F. Decomposition of the mean squared error and NSE performance criteria: Implications for improving hydrological modelling. J. Hydrol. 2009, 377, 80–91. [Google Scholar] [CrossRef] [Green Version]
  46. Kling, H.; Fuchs, M.; Paulin, M. Runoff conditions in the upper Danube basin under an ensemble of climate change scenarios. J. Hydrol. 2012, 424–425, 264–277. [Google Scholar] [CrossRef]
  47. MMA Instrucción de Planificación Hidrológica (ARM/2656/2008). 2008; 75–85.
  48. Madrigal, J.; Solera, A.; Suárez-Almiñana, S.; Paredes-Arquiola, J.; Andreu, J.; Sánchez-Quispe, S.T. Skill assessment of a seasonal forecast model to predict drought events for water resource systems. J. Hydrol. 2018, 564, 574–587. [Google Scholar] [CrossRef]
  49. Sokolova, M.; Lapalme, G. A systematic analysis of performance measures for classification tasks. Inf. Process. Manag. 2009, 45, 427–437. [Google Scholar] [CrossRef]
  50. Zufiaurre, R.; Martín-Ramos, P.; Cuchí, J.A. Nitrates in groundwater of small shallow aquifers in the western side of Hoya de Huesca (NE Spain). Agronomy 2019, 10, 22. [Google Scholar] [CrossRef] [Green Version]
  51. Lasagna, M.; De Luca, D.A.; Franchino, E. Nitrate contamination of groundwater in the western Po Plain (Italy): The effects of groundwater and surface water interactions. Environ. Earth Sci. 2016, 75, 1–16. [Google Scholar] [CrossRef]
  52. Córdoba, E.B.; Martínez, A.C.; Ferrer, E.V. Water quality indicators: Comparison of a probabilistic index and a general quality index. The case of the Confederación Hidrográfica del Júcar (Spain). Ecol. Indic. 2010, 10, 1049–1054. [Google Scholar] [CrossRef]
  53. Ferrer, J.; Pérez-Martín, M.A.; Jiménez, S.; Estrela, T.; Andreu, J. GIS-based models for water quantity and quality assessment in the Júcar River Basin, Spain, including climate change effects. Sci. Total Environ. 2012, 440, 42–59. [Google Scholar] [CrossRef]
  54. Li, Z.; Xiao, J.; Evaristo, J.; Li, Z. Spatiotemporal variations in the hydrochemical characteristics and controlling factors of streamflow and groundwater in the Wei River of China. Environ. Pollut. 2019, 254, 113006. [Google Scholar] [CrossRef]
  55. Ramos, C.; Agut, A.; Lidón, A.L. Nitrate leaching in important crops of the Valencian Community region (Spain). Environ. Pollut. 2002, 118, 215–223. [Google Scholar] [CrossRef]
  56. De Paz, J.M.; Ramos, C. Simulation of nitrate leaching for different nitrogen fertilization rates in a region of Valencia (Spain) using a GIS-GLEAMS system. Agric. Ecosyst. Environ. 2004, 103, 59–73. [Google Scholar] [CrossRef]
  57. Paz, J.M.D.; Delgado, J.A.; Ramos, C.; Shaffer, M.J.; Barbarick, K.K. Use of a new GIS nitrogen index assessment tool for evaluation of nitrate leaching across a Mediterranean region. J. Hydrol. 2009, 365, 183–194. [Google Scholar] [CrossRef]
  58. Lidón, A.; Ramos, C.; Ginestar, D.; Contreras, W. Assessment of LEACHN and a simple compartmental model to simulate nitrogen dynamics in citrus orchards. Agric. Water Manag. 2013, 121, 42–53. [Google Scholar] [CrossRef]
  59. Contreras, W.A.; Lidón, A.L.; Ginestar, D.; Bru, R. Compartmental model for nitrogen dynamics in citrus orchards. Math. Comput. Model. 2009, 50, 794–805. [Google Scholar] [CrossRef]
  60. Baram, S.; Couvreur, V.; Harter, T.; Read, M.; Brown, P.H.; Hopmans, J.W.; Smart, D.R. Assessment of orchard N losses to groundwater with a vadose zone monitoring network. Agric. Water Manag. 2016, 172, 83–95. [Google Scholar] [CrossRef]
  61. Cui, M.; Zeng, L.; Qin, W.; Feng, J. Measures for reducing nitrate leaching in orchards: A review. Environ. Pollut. 2020, 263, 114553. [Google Scholar] [CrossRef]
  62. Fernandes, A.C.P.; Fernandes, L.F.S.; Terêncio, D.P.S.; Cortes, R.M.V.; Pacheco, F.A.L. Seasonal and scale effects of anthropogenic pressures on water quality and ecological integrity: A study in the Sabor River basin (NE Portugal) using partial least squares-path modeling. Water 2019, 11, 1941. [Google Scholar] [CrossRef] [Green Version]
  63. Malagó, A.; Bouraoui, F.; Vigiak, O.; Grizzetti, B.; Pastori, M. Modelling water and nutrient fluxes in the Danube River Basin with SWAT. Sci. Total Environ. 2017, 603–604, 196–218. [Google Scholar] [CrossRef]
  64. Ludwig, W.; Dumont, E.; Meybeck, M.; Heussner, S. River discharges of water and nutrients to the Mediterranean and Black Sea: Major drivers for ecosystem changes during past and future decades? Prog. Oceanogr. 2009, 80, 199–217. [Google Scholar] [CrossRef]
  65. Romero, E.; Garnier, J.; Billen, G.; Peters, F.; Lassaletta, L. Water management practices exacerbate nitrogen retention in Mediterranean catchments. Sci. Total Environ. 2016, 573, 420–432. [Google Scholar] [CrossRef] [Green Version]
  66. Mitsch, W.J.; Day, J.W.; Gilliam, J.W.; Groffman, P.M.; Hey, D.L.; Randall, G.W.; Wang, N. Reducing nitrogen loading to the gulf of Mexico from the Mississippi River Basin: Strategies to counter a persistent ecological problem. Bioscience 2001, 51, 373–388. [Google Scholar] [CrossRef]
  67. Malagó, A.; Bouraoui, F.; Grizzetti, B.; De Roo, A. Modelling nutrient fluxes into the Mediterranean Sea. J. Hydrol. Reg. Stud. 2019, 22, 100592. [Google Scholar] [CrossRef] [PubMed]
  68. Grande, E.; Visser, A.; Beitz, P.; Moran, J. Examination of nutrient sources and transport in a catchment with an audubon certified golf course. Water 2019, 11, 1923. [Google Scholar] [CrossRef] [Green Version]
  69. Romero, I.; Moragues, M.; González del Río, J.; Hermosilla, Z.; Sánchez-Arcilla, A.; Sierra, J.P.; Mösso, C. Nutrient Behavior in the Júcar Estuary and Plume. J. Coast. Res. 2007, 10047, 48–55. [Google Scholar] [CrossRef]
  70. Temino-Boes, R.; García-Bartual, R.; Romero, I.; Romero-Lopez, R. Future trends of dissolved inorganic nitrogen concentrations in Northwestern Mediterranean coastal waters under climate change. J. Environ. Manag. 2021, 282, 111739. [Google Scholar] [CrossRef]
  71. Tavakoly, A.A.; Habets, F.; Saleh, F.; Yang, Z.L.; Bourgeois, C.; Maidment, D.R. An integrated framework to model nitrate contaminants with interactions of agriculture, groundwater, and surface water at regional scales: The STICS—EauDyssée coupled models applied over the Seine River Basin. J. Hydrol. 2019, 568, 943–958. [Google Scholar] [CrossRef]
  72. Paredes, I.; Otero, N.; Soler, A.; Green, A.J.; Soto, D.X. Agricultural and urban delivered nitrate pollution input to Mediterranean temporary freshwaters. Agric. Ecosyst. Environ. 2020, 294, 106859. [Google Scholar] [CrossRef]
  73. Meyer, A.M.; Fuenfrocken, E.; Kautenburger, R.; Cairault, A.; Beck, H.P. Detecting pollutant sources and pathways: High-frequency automated online monitoring in a small rural French/German transborder catchment. J. Environ. Manag. 2021, 290, 112619. [Google Scholar] [CrossRef] [PubMed]
  74. Romero, E.; Garnier, J.; Lassaletta, L.; Billen, G.; Le Gendre, R.; Riou, P.; Cugier, P. Large-scale patterns of river inputs in southwestern Europe: Seasonal and interannual variations and potential eutrophication effects at the coastal zone. Biogeochemistry 2013, 113, 481–505. [Google Scholar] [CrossRef] [Green Version]
  75. Uclés, J. Evaluación de la Calidad del Agua en la Cuenca del Río Ebro Mediante Técnicas de Modelación a Gran Escala y Propuesta de Medidas de Corrección. Master’s Thesis, Technical University of Valencia, Valencia, Spain, 2016. Available online: https://riunet.upv.es/handle/10251/74500 (accessed on 15 May 2020).
Figure 1. Water resource systems in the Júcar RBD, surface water bodies and water quality gauging stations (a) and land use map (b). SW rivers: surface water bodies with river category; SW-QGS: surface water quality gauging stations.
Sustainability 13 12835 g001
Figure 2. PATRICAL (a) and RREA (b) models’ structure and variables. Evaluation of simulation performance metrics (c). Rectangles with smoothed edges are the input variables to the model, the rectangles represent storages, and the document flowchart symbol represents the outputs of the process. DP: diffuse pollution; GW: groundwater; K: pollutant degradation constant N-water: nitrogen in the water resources; SW: surface water; t: time of residence of nitrate.
Sustainability 13 12835 g002
Figure 3. Evaluation parameters of the calibration process of the streamflow (altered regime) (a) and nitrate concentration (b). The KGEM components for streamflow (c) and nitrate concentration (d) in the main systems of the Júcar RBD. r = correlation coefficient; β = bias ratio; γ = ratio of the coefficients of variation; KGEM = Modified Kling-Gupta Efficiency.
Sustainability 13 12835 g003
Figure 4. Classification of the median nitrate concentration in surface water bodies in the Júcar RBD using the contingency table.
Sustainability 13 12835 g004
Figure 5. Groundwater discharge into surface water (SW) (a), nitrate concentration in groundwater (b), classification of the contribution of groundwater (GW) nitrate to surface water flows, and nitrate concentration status in surface water (c).
Sustainability 13 12835 g005
Figure 6. Monthly nitrate mean concentration observed in Júcar and Turia rivers (box squares without including outliers), simulated in rivers (continuous line, first and third lower and upper shaded quartiles, respectively), and observed in aquifers (continuous line with dot markers) in the main river course of the Júcar (a), and Turia (b) rivers. Linear regression for variables NO3_SW and NO3_GW in the gaining SW rivers in the Júcar (c) and Turia systems (d).
Sustainability 13 12835 g006
Figure 7. Diffuse (DP) and point (PP) pollution load (a). Nitrate status in the river-type surface water bodies (SW rivers) and spatial distribution of land uses (b).
Sustainability 13 12835 g007
Figure 8. Annual load (tN/year), and discharge into the Mediterranean Sea in the Júcar RBD, and streamflow (hm3/year) (a). Seasonal nitrate concentration in the Júcar river Basin (b).
Sustainability 13 12835 g008
Table 1. Data set employed in the PATRICAL and RREA models. NO3-SW: nitrate concentration in surface water (mg/L); NO3-GW: nitrate concentration in groundwater; Q: streamflow (m3/s); P: pluvial precipitation (mm); T: temperature (°C); N-soil: nitrogen surplus in soil (KgN/ha); V discharge: point discharge volume (m3/year); PE: population equivalent.
Data ProviderData TypeTime StepMonitoring PointsPeriod Extent
Water Information System for the Júcar RBD (“SIA Júcar” in Spanish, Available online: aps.chj.es/siajucar/, accessed on 23 March 2021) NO3-SW
NO3-GW
Q
Monthly
Monthly
Monthly
514
1874
121
2000–2018
2000–2018
2000–2018
SAIH Precipitation stations (saih.chj.es, accessed on March 26 2021) and Temperature stations from and National Meteorological Agency (Aemet, Available online: www.aemet.es, accessed on 26 March 2021) PTMonthly
Monthly
976
456
1980–2018
1980–2018
Spanish Ministry for Agriculture, Fisheries and Food (“MAPA” in Spanish; (MAPA, 2018 [42])N-soilAnnually-2000–2015
National census of discharges (MITECO, Available online: www.miteco.gob.es, accessed on 26 March 2021) V discharge
PE
Annually
Annually
8842016–2018
2016–2018
Table 2. Contingency table to assess nitrate status classification performance of PATRICAL/RREA models.
Simulated Data Observed Data
Good Status
(NO3 ≤ 25 mg/L)
Poor Status
(NO3 > 25 mg/L)
PATRICAL/RREAGood statusTrue Positive (TP) False Positive (FP)
Poor statusFalse Negative (FN)True Negative (TN)
Table 3. Indexes obtained from the 2 × 2 contingency table for the water resource systems (ACC: Accuracy; SR: Success Ratio; SP: Specificity).
Water Resource SystemsACCBIASSRSP
Mijares-Plana Castellón0.971.001.000.22
Palancia-Los Valles0.971.011.000.00
Turia0.941.030.980.23
Júcar0.811.040.900.32
Serpis0.840.900.910.46
Vinalopó-Alacantí0.781.280.780.00
Global Júcar RBD0.861.060.900.26
Optimal Value1.001.001.001.00
Table 4. Nitrate balance in surface water bodies with river category in the Júcar RBD.
ComponentsDescriptionVolumeLoadConcentration
(hm3/year)tN/yearkgN/km2/yearmgNO3/L
InputsNatural flow 2247.310101.7236.419.9
Urban discharges171.6100.02.32.6
Total Inputs2418.910201.7238.718.7
OutputsUrban and industrial 278.51124.9
Irrigation 1410.95698.8
Total Gross Demand1689.46823.7 17.9
Net outputsNet plant uptake: Gross demands—agricultural returns672.5
Discharge to the sea1746.53378.079.18.6
Total Outputs2418.910201.7 18.7
Publisher’s Note: MDPI stays neutral with regard to jurisdictional claims in published maps and institutional affiliations.

