
Corporate Social Responsibility Development and Climate Change: Regional Evidence of China


1
School of Public Policy and Management, Tsinghua University, Beijing 100084, China
2
Stuart School of Business, Illinois Institute of Technology, Chicago, IL 60616, USA
3
College of Public Management, Guizhou University of Finance and Economics, Guiyang 550025, China
*
Author to whom correspondence should be addressed.
Sustainability 2021, 13(21), 11859; https://doi.org/10.3390/su132111859
Submission received: 11 September 2021
/
Revised: 20 October 2021
/
Accepted: 25 October 2021
/
Published: 27 October 2021
(This article belongs to the Special Issue Harnessing Sustainability to Corporate Finance and Financial Institutions)
Abstract
:This study analyzed Chinese companies’ behavior regarding corporate social responsibility (CSR) disclosure, and its impact on national and regional climate change measured by carbon emissions. CSR disclosure, supported by existing theories, is considered a powerful tool to curb climate change issues. We combined data of companies’ publicly traded annual financial reports and CSR reports from the China Stock Market and Accounting Research (CSMAR) database and provincial macroeconomic statistics from the Chinese National Bureau of Statistics to run panel regressions. The results verify the following: (a) China is in a relatively early stage of CSR development, and Chinese firms’ internal incentives to adopt CSR projects are low since none of the internal factors researched contribute to CSR disclosure. (b) External factors work slightly better for CSR practices, but at the same time, the CSR regulations still need further improvement. (c) The current CSR disclosure practices do not have a clear impact on carbon emission reduction, contrary to some predictions that CSR could help reduce carbon emissions.
1. Introduction and Literature Review
According to the United Nations, the impact of global climate change is unprecedented in scale. Without appropriate and immediate action, we will face increasingly severe issues including shortages in food, rising sea levels, floods, droughts and extreme weather (The Global Issues of Climate Change, United Nations. Available at https://www.un.org/en/global-issues/climate-change (accessed on 11 September 2021)). Climate change is mainly caused by greenhouse gases, two thirds of which are carbon dioxide generated from burning fossil fuels. To fight climate change, effective climate actions require serious engagement and commitment of governments and businesses [1]. Companies’ CSR practices can play a key role in promoting sustainable development by reducing carbon emissions [2,3]. Nowadays, increasingly more stakeholders consider CSR a necessity rather than a voluntary luxury [4].
The most classic and adopted CSR concept is John Elkington’s “triple bottom lines”, including economic, social and environmental perspectives [5]. CSR practices are currently well adopted by companies in developed countries, but not in developing countries [6]. However, in the developing countries which have adopted CSR, it is formulated more as mandatory regulations than voluntary actions [7]. Furthermore, for the last several decades, CSR disclosure has also been supported by legitimacy theory, which is based on the concept of social contract. In this theory, businesses operate in society via a social contract, expressed or implied, whereby their survival and growth are based on: (1) the delivery of some socially desirable ends to the society in general, and (2) the distribution of economic, social or political benefits to groups from which they derive their power [8,9]. This theory is still viable nowadays and has the great potential to be improved by adding more CSR disclosure vehicles [10]. To address the issue of whether businesses take environmental protection as their core concern of CSR, scholars from both developed and developing economies have conducted a great deal of research. The internal roles of firms such as attitude to legislation, audit, economic rationality, community expectations, threats and available investments are crucial for CSR disclosure [11,12]. UK firms’ disclosure shows that firms’ sector determines the different degree of the implementation of environmental projects [13]. Research on Canadian and French firms shows that media visibility, firm size and regulation play important roles in firms’ environmental disclosure [14,15]. Research on Spanish firms highly proposes regulations [16], while research on Irish firms argues that NGOs could largely facilitate the quality of sustainable disclosure [17]. Firms with improved environmental governance could have better risk management, corresponding to legitimacy theory [18,19], and especially for larger enterprises, NGOs push them to carry out environmental practices and, in turn, obtain benefits in financing, corresponding to visibility theory [20]. The results of research on Malaysian businesses emphasize the importance of regulation, thus advocating legitimacy theory rather than principal–agent theory [21,22]. Moreover, consumers’ social values have also pushed firms to take environmental responsibility, supporting legitimacy theory in a different way [23]. Macroscopically, there is a positive correlation between the Human Development Index (HDI) of countries and the reduction in carbon emissions. Countries with a higher HDI such as the UK, Australia and Germany have stricter regulations, while those with a lower HDI do not [24]. However, though regulations and pressures from society positively ameliorate the problems of environmental protection, this achievement may be arguably at the expense of firm values [25].
As for the problem of environmental issues related to greenhouse gas (GHG) or carbon emissions, the current research interests are mainly in developed economies [26,27,28,29]. However, developing countries are catching up quickly [25,30,31,32]. Meanwhile, quantitative research is relatively rare in the field of CSR towards carbon emission reduction [33]. Theoretically, CSR positively influences recycling rates, and more CSR could induce a greater reduction in carbon emissions per unit product [3]. However, in a nutshell, empirical findings are mostly negative. The results of research on Italian firms show that environmental committees, institutional holders and board independence are the important factors to facilitate carbon efficiency, especially for firms belonging to high-pollution industries. However, other studies claim that carbon reduction practices basically do not work, and firms generally tend to “watch and see” how regulations change [33,34,35]. Though government pressure and firms’ visibility make a difference, which supports legitimacy theory [36,37], firms’ reports are still suspicious and misleading [36,38,39]. In South Korea, the situation is even worse since firms with high CSR ratings are emitting more GHGs, and this relationship tends to be more significant if the firm size becomes larger, thus questioning the mechanism of reporting CSR [30]. Meanwhile, some scholars report that firms have no internal pressure on increasing carbon efficiency [32].
In the Chinese context, the research on CSR as well as environmental protection is gradually flourishing, as China has long become the largest carbon emitter, with the level of per capita emission at the same range as Japan and the EU, according to the Emissions Gap Report of 2019 by the UN [40]. China will play the most important role in shaping global affairs. Thus, the effort to curb climate change would be useless without China’s inclusion [31,41,42]. CSR concepts were introduced to China by multinational corporations in 1996 [43]. From 1996 to 2005, while CSR was still under development, China published or modified a series of laws to protect labor rights and the environment [44,45]. In 2006, CSR was officially regulated by the Shanghai Stock Exchange (SSE) and Shenzhen Stock Exchange (SZSE), both supervised by the Chinese Securities Regulatory Commission (CSRC). Ecological modernization concerning environmental issues is forming in China, supporting legitimacy theory as well [46]. However, despite the regulation of CSR, there is still a long way for China to go in progressing in protecting the environment and reducing carbon emissions [47,48]. Many researchers maintain that company state ownership increases CSR disclosure [49,50,51,52]. Other than the ownership status, some researchers argue that companies with better performance are more likely to publish CSR reports [53]. Others expand the factors to size, profitability, industry [54], financial structure [55] and competition with peers [56]. The regional imbalance is another area in which scholars are interested. There is a big disparity in resource allocation among provinces [57]. Wealthier provinces measured by GDP per capita emit more carbon dioxide than less wealthy ones, though they have similar per capita emissions [58,59]. How provincial governments and firms can work together is not clear in China. The existing literature shows that regulations and green market competitions will lead to carbon emission reduction [60,61]. CSR regulations and climate policies should be highly related to each other and push companies to use environmental strategies [62,63].
For our study, we focused on the extent to which Chinese firms’ CSR disclosure practices have developed since 2006 and their impact on carbon emissions, by using quantitative methods with panel data analysis at both the firm and province levels. We would like to address two research questions. First, what factors affect CSR activities at the firm level? Second, do these activities affect climate change, measured by carbon emissions at the regional level? We used regression analysis and panel data analysis to study these two research questions. The rest of this paper is structured as follows. Section 2 introduces the data; Section 3 presents the analysis and results, and Section 4 concludes with a discussion.
2. Data and Methods
2.1. Firm-Level Data
Our first research objects are the companies listed in the Shenzhen Stock Exchange and Shanghai Stock Exchange which published CSR reports from 2006 to 2019, and we label them as CSR companies. We assumed that companies which did not publish CSR reports did not engage in CSR activity. Though it is possible that some companies have conducted CSR projects but have not disclosed them, we do not think this possibility will cause a big problem. Since CSR is good for reputation, firms must want to let the public know. Therefore, such a possibility should be in a transitioning state and should not relate to too many companies. Basically, the total number of CSR activities represents a company’s effort in following CSR regulations, while the number of environmental protection measures represents a company’s effort in reducing its carbon emissions and pollution. We collected companies’ annual financial report and CSR report data from the China Stock Market & Accounting Research (CSMAR) database from 2006 to 2019. Table 1 shows the variable definitions.
Following the regulation documents, Shenzhen Stock Exchange Social Responsibility Instructions to Listed Companies and Notice of Doing a Better Job for Disclosing 2008 Annual Reports, the CSR report data included: (1) protection of the interests of shareholders and creditors, (2) protection of employee interests, (3) protection of the interests of suppliers, customers and consumers, (4) environmental protection and sustainable development, (5) public relations and social welfare services and (6) safe production. We found that projects of safe production are similar to projects of employee protection and combined these two categories into staff protection by adding their numbers of CSR projects together. Therefore, the dependent variables consisted of these 5 variables of CSR disclosure. Then, we established two groups of independent variables: (1) internal characteristics including (a) years since the firm was established which reflects company experience since being established (Age), years since the firm became publicly listed (List Exp) and years since the firm started disclosing its CSR activity (CSR Exp), (b) the education level of employees (High Edu and Mid Edu) and (c) state ownership (SOE); (2) external characteristics including GRI, CSR certification and CSR mandatory disclosure requirements, which measure firms’ disclosure effort. Moreover, we established the variables of firm size, revenue, tax, cash and profit to control firms’ characteristics. Table 2 presents the descriptive statistics. There are 6295 firm-years under research, but due to missing data, only 4518 firm-years have information of their employee education level, and their numbers of CSR projects vary a lot, with the mean slightly above five, the minimum as one and the maximum as 39. Basically, the staff and environment are the two main concerns of companies. Though it could be seen that the mean age of these firms is not young, the education level of their employees is not that high. This also indicates a low level of state ownership, GRI rate and audit rate. Later, we present a thorough figure analysis of this information in Section 3.
2.2. Provincial-Level Data
Secondly, we focused on how CSR is associated with provincial carbon reduction, and thus we collected provincial macroeconomic data from the National Bureau of Statistics of China from 2006 to 2019 with fossil fuel data from 2006 to 2017 due to the lag of data disclosure. Table 3 shows the variable definition.
Basically, we calculated provincial carbon emissions based on provincial fossil fuel consumption according to the following formula: carbon emissions (metric tons) = 1.647 *coal (metric tons) + 2.848 *hard coke (metric tons) + 3.045 *gasoline (metric tons) + 3.174 *kerosene (metric tons) + 3.15 *diesel (metric tons) + 3.064 *heating oil (metric tons) + 21.67 *natural gas (10,000 cubic meters) [64]. Then, we used CO2 emissions per million RMB GDP to represent the provincial sustainable economic development level. For independent variables, the percentage of CSR companies in a province, the average number of CSR projects and the percentage of CSR environment protection projects reflect the provincial CSR adoption rate, CSR companies’ CSR effort and CSR companies’ environmental protection effort, respectively. We also used the ratio of CSR companies’ total assets to the provincial GDP to indicate the economic influence of CSR companies. For the control variables, the GDP per capita reflects the socioeconomic situation of provinces, population measures the pressure of development, and the ratio of total imports and exports to the GDP indicates provinces’ involvement in international businesses. Table 4 presents the provincial descriptive statistics.
2.3. Methods
Compared with similar studies about Chinese CSR, the data in this paper are the most current and cover a larger time period. The role of company age and state ownership has been researched [65,66], and we want to further explore what roles list experience and CSR experience play in affecting the CSR disclosure scale. Further, to our knowledge, no research has touched the effect of employee education, GRI, audit and mandate disclosure requirements for Chinese companies. Additionally, we chose controlling variables that are similar to those used in existing studies [30,50,53,65,66]. The hypotheses are summarized as follows:
Hypotheses 1a (H1a).
The CSR project scale increases while the values of the internal factors (company age, list experience, CSR disclosure experience, employee education, state ownership) increase.
Hypotheses 1b (H1b).
The CSR project scale increases while the values of the external factors (GRI, audit, mandate) increase.
Hypotheses 2 (H2).
Carbon emissions decrease while the CSR project scale increases.
To test the above hypotheses, we ran three panel regressions, which are presented in Section 3. Since the independent variables to test hypothesis H1a have a multicollinearity issue, we first used principal component analysis to extract the principal components accounting for 90% of the variation. For the other two hypotheses, we ran panel regression directly.
3. Analysis and Results
3.1. CSR Development in China
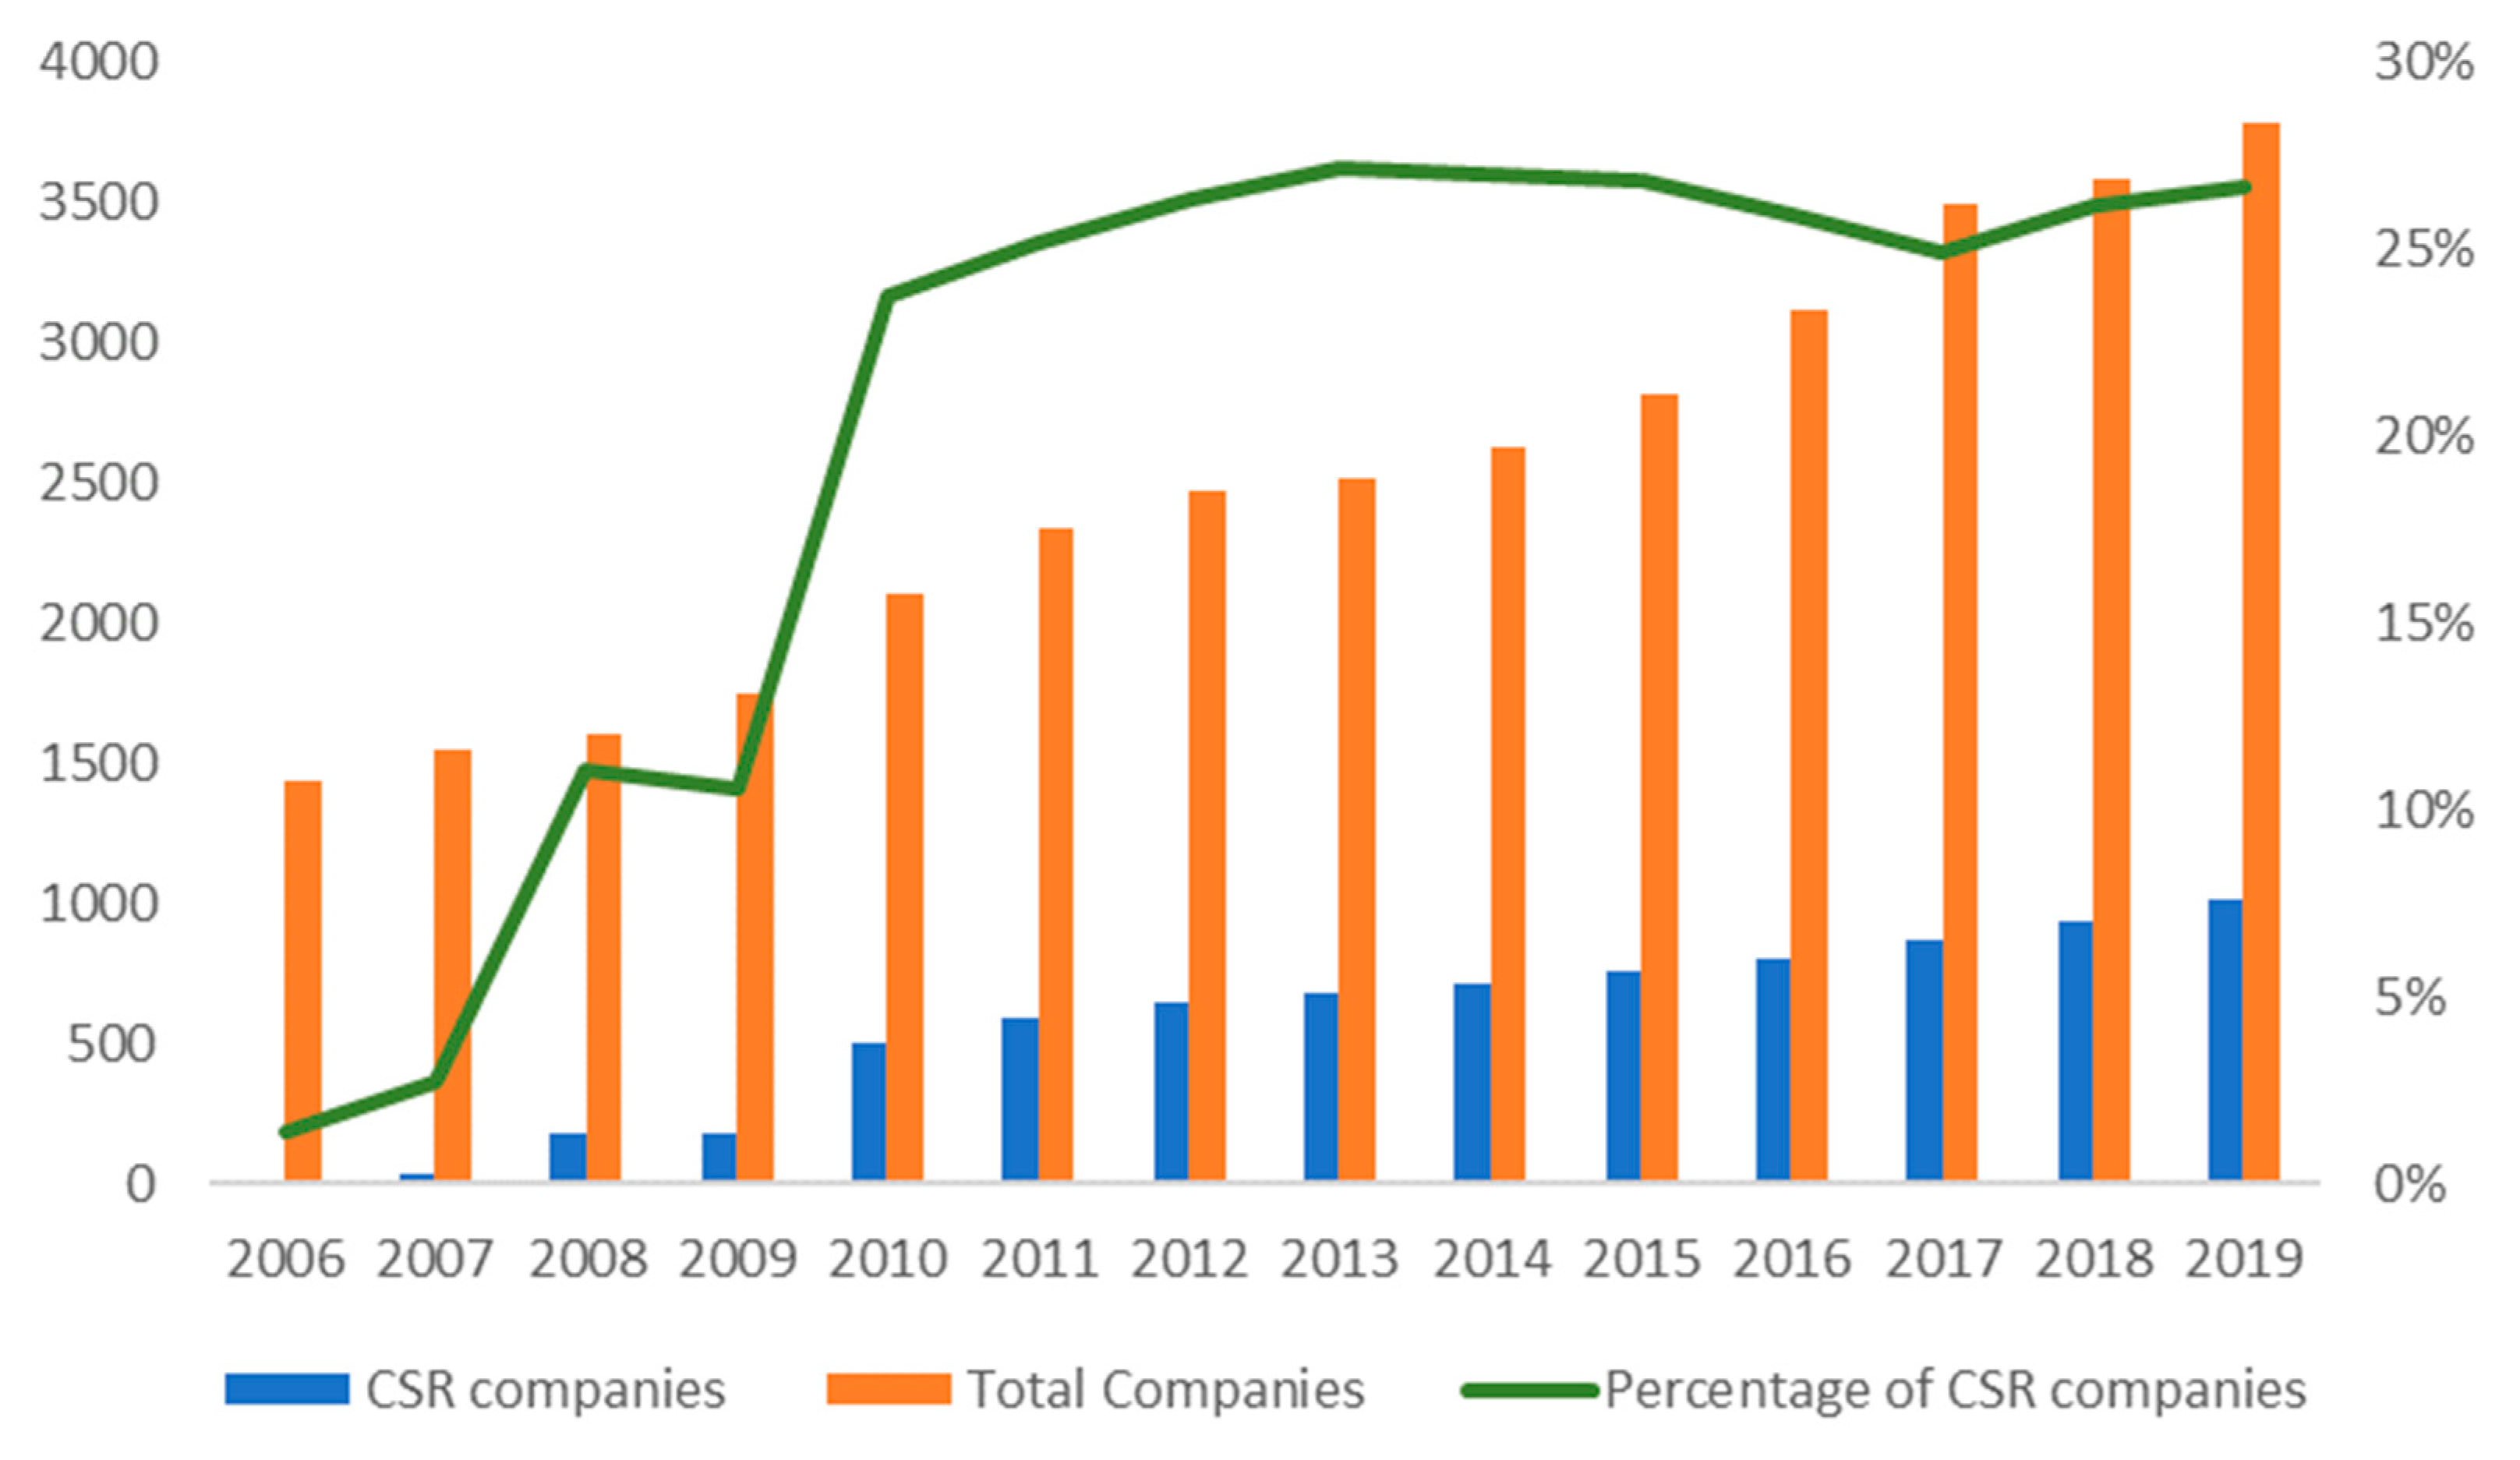
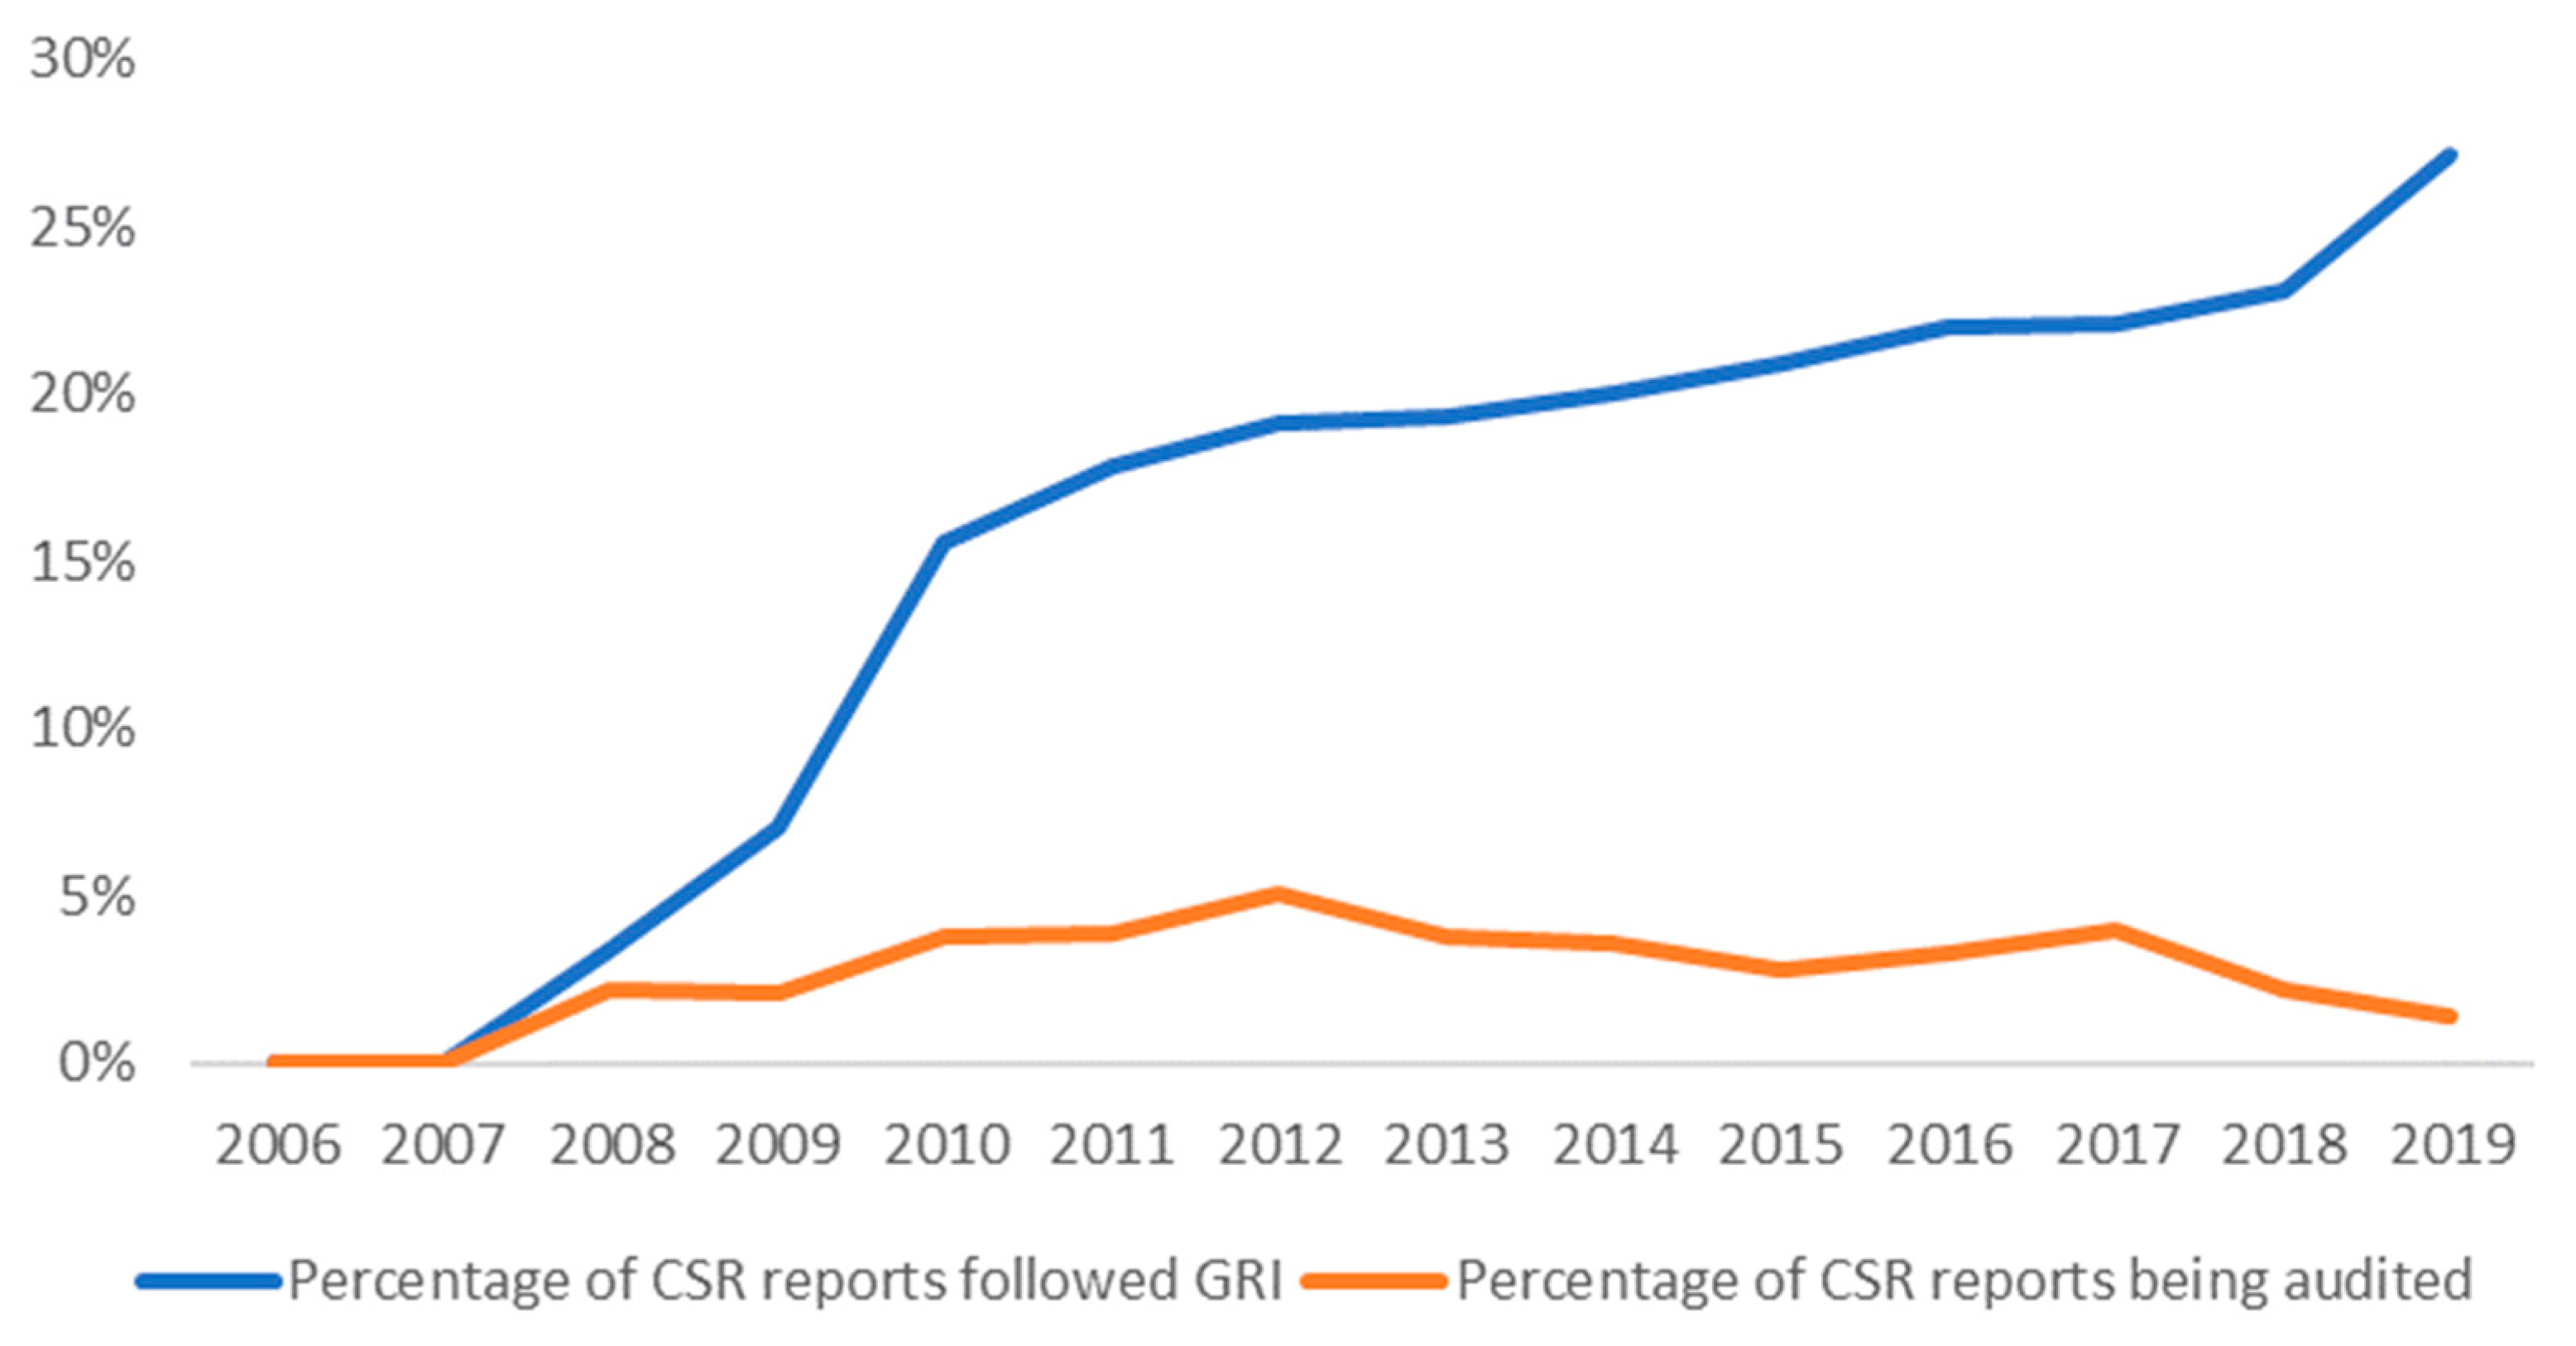
First, we show the development of CSR disclosure in China. Figure 1 demonstrates how CSR grew from 2006 to 2019. We found a fast CSR disclosure growth from 2006 to 2010, and then it stayed at around 25% of the total companies listed. The fast early growth is associated with CSR regulation and mandatory CSR disclosure. The slow growth from 2010 may indicate that companies lacked incentives to launch CSR projects or adopt CSR disclosure systems. Figure 2 shows the quality of CSR disclosure in China. We found that the percentage of CSR reports following the Global Reporting Initiative Standard (GRI) increased over the years but was still below 30% in 2019. Furthermore, the percentage of CSR reports being audited by a third party was under 5% during most of the studied time period.
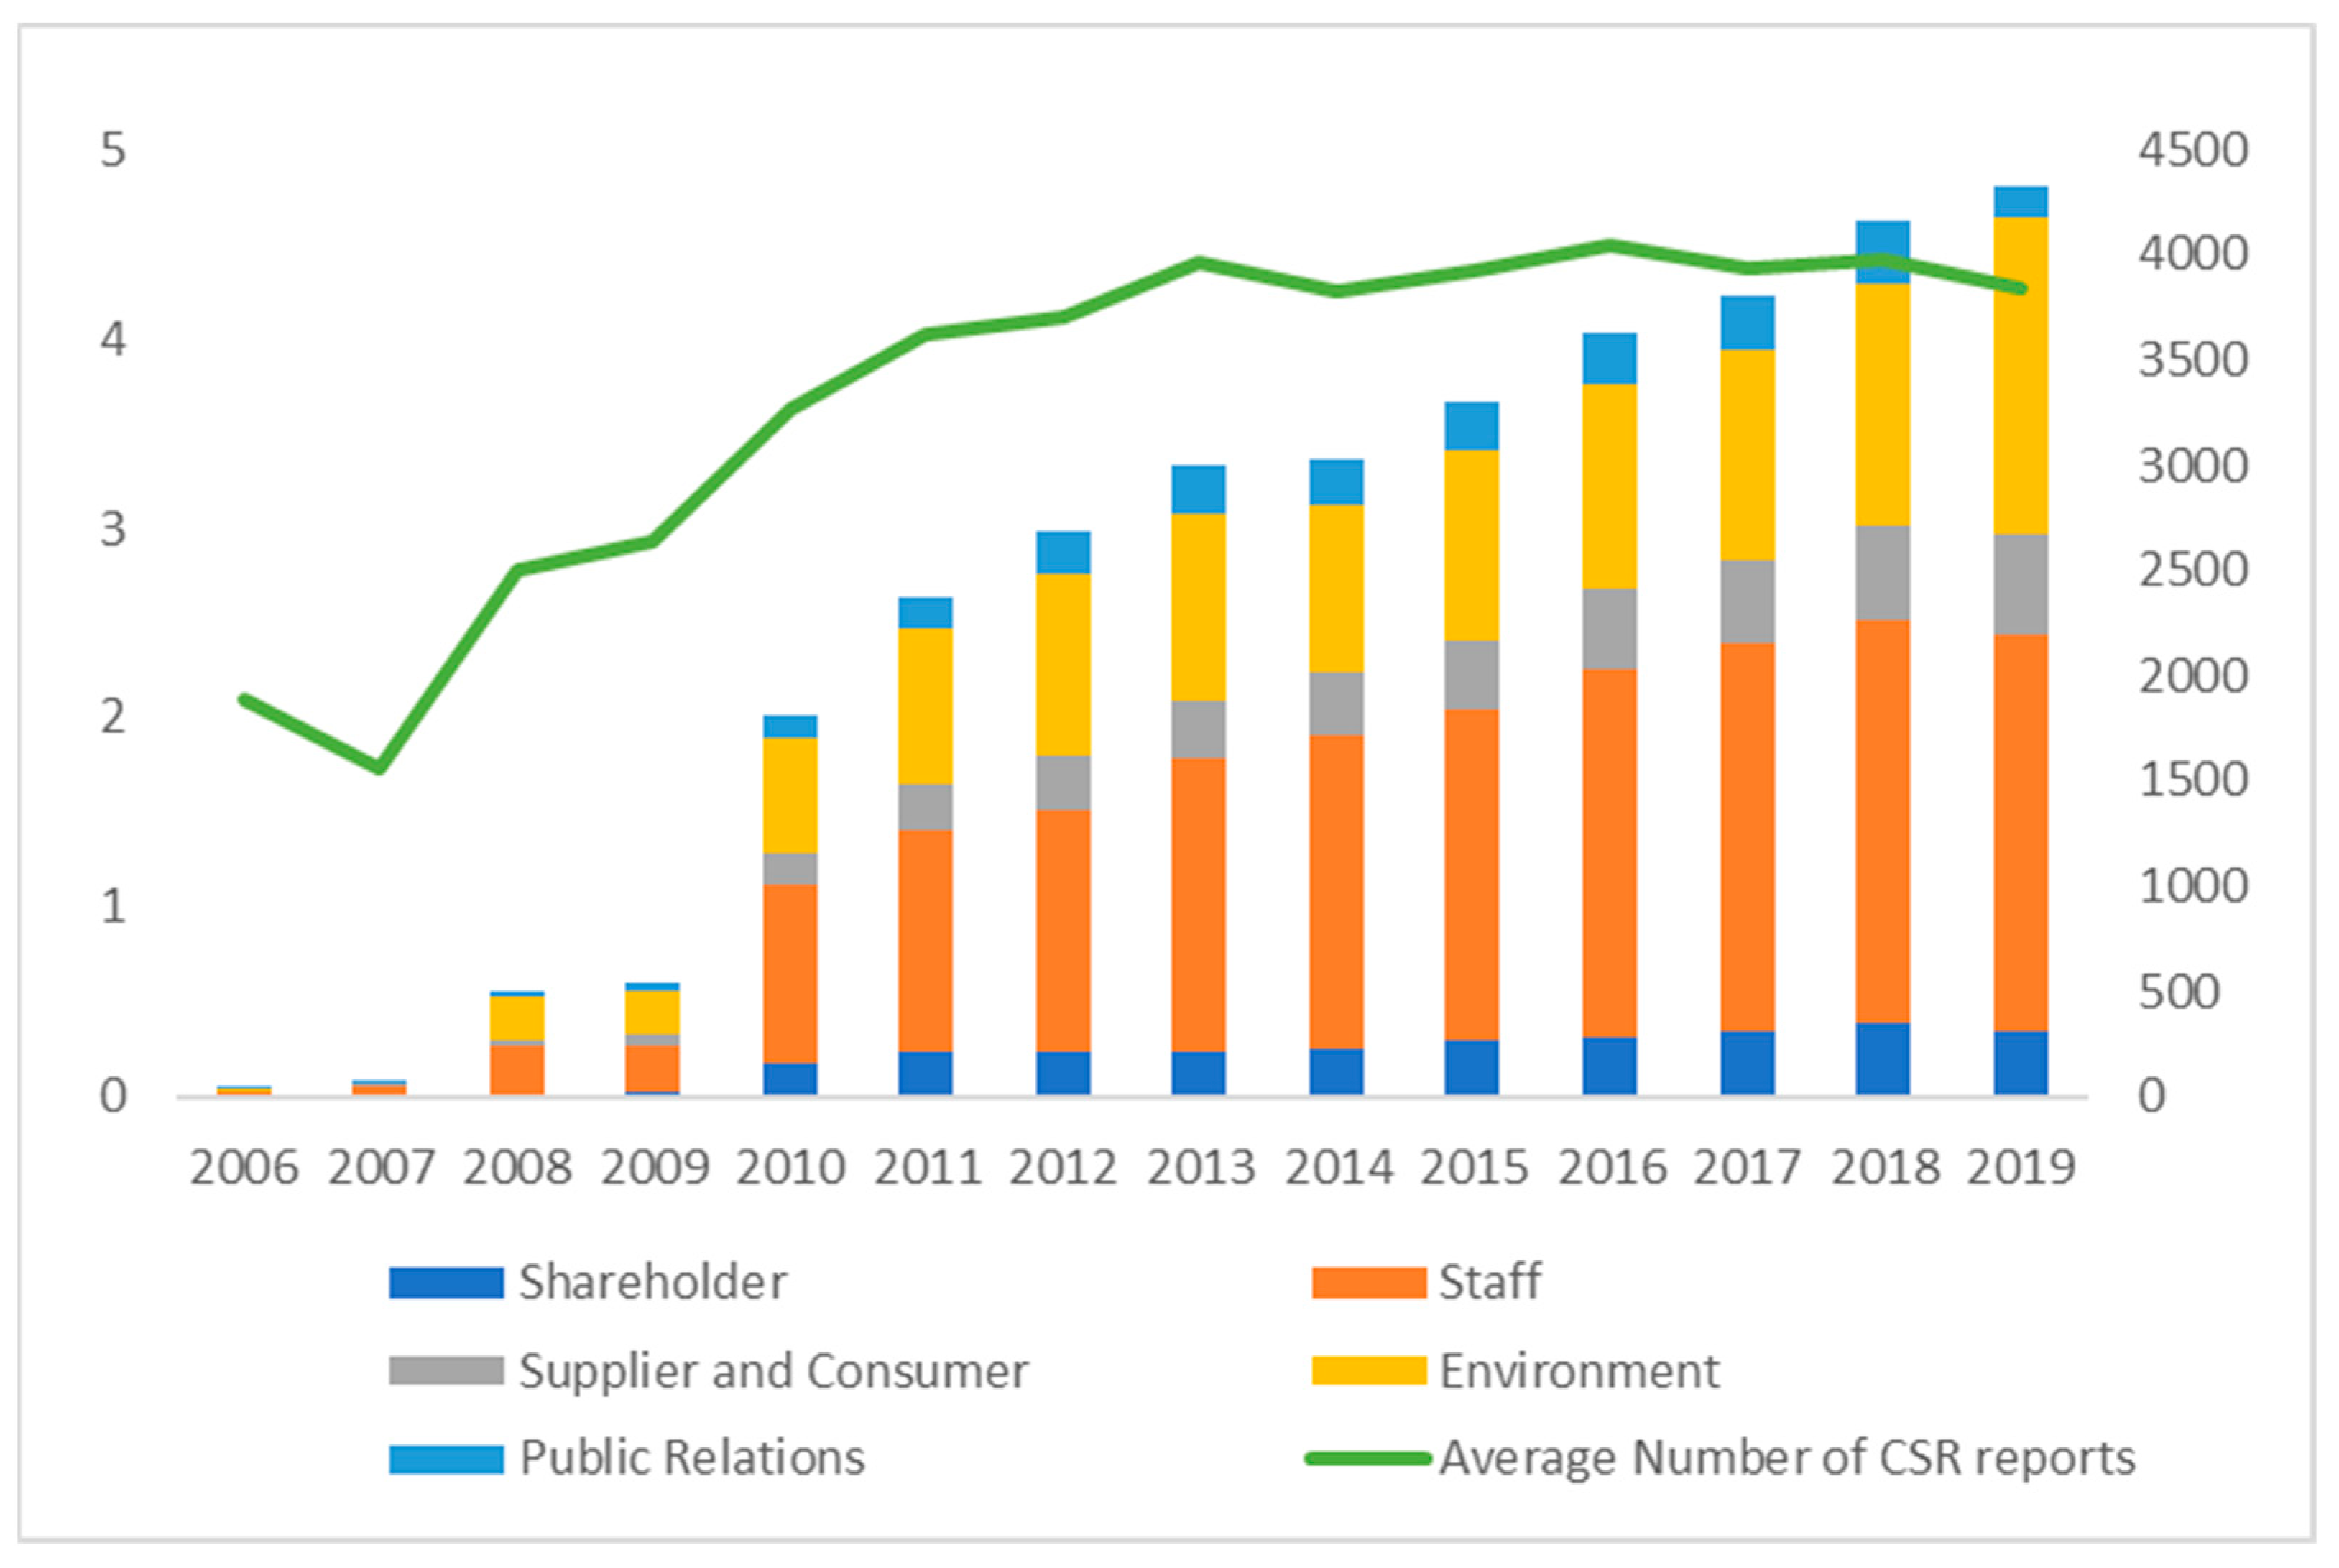
Second, we present the types of CSR projects of CSR disclosure activities from 2006 to 2019. Figure 3 shows a clear growth trend in the total number of CSR projects disclosed, with staff protection and environment protection projects being the most reported types. However, the average number of CSR projects disclosed per report stayed at around 4.5 from 2013 to 2019. This indicates that the growing number of total CSR projects is due to the growing number of CSR companies.
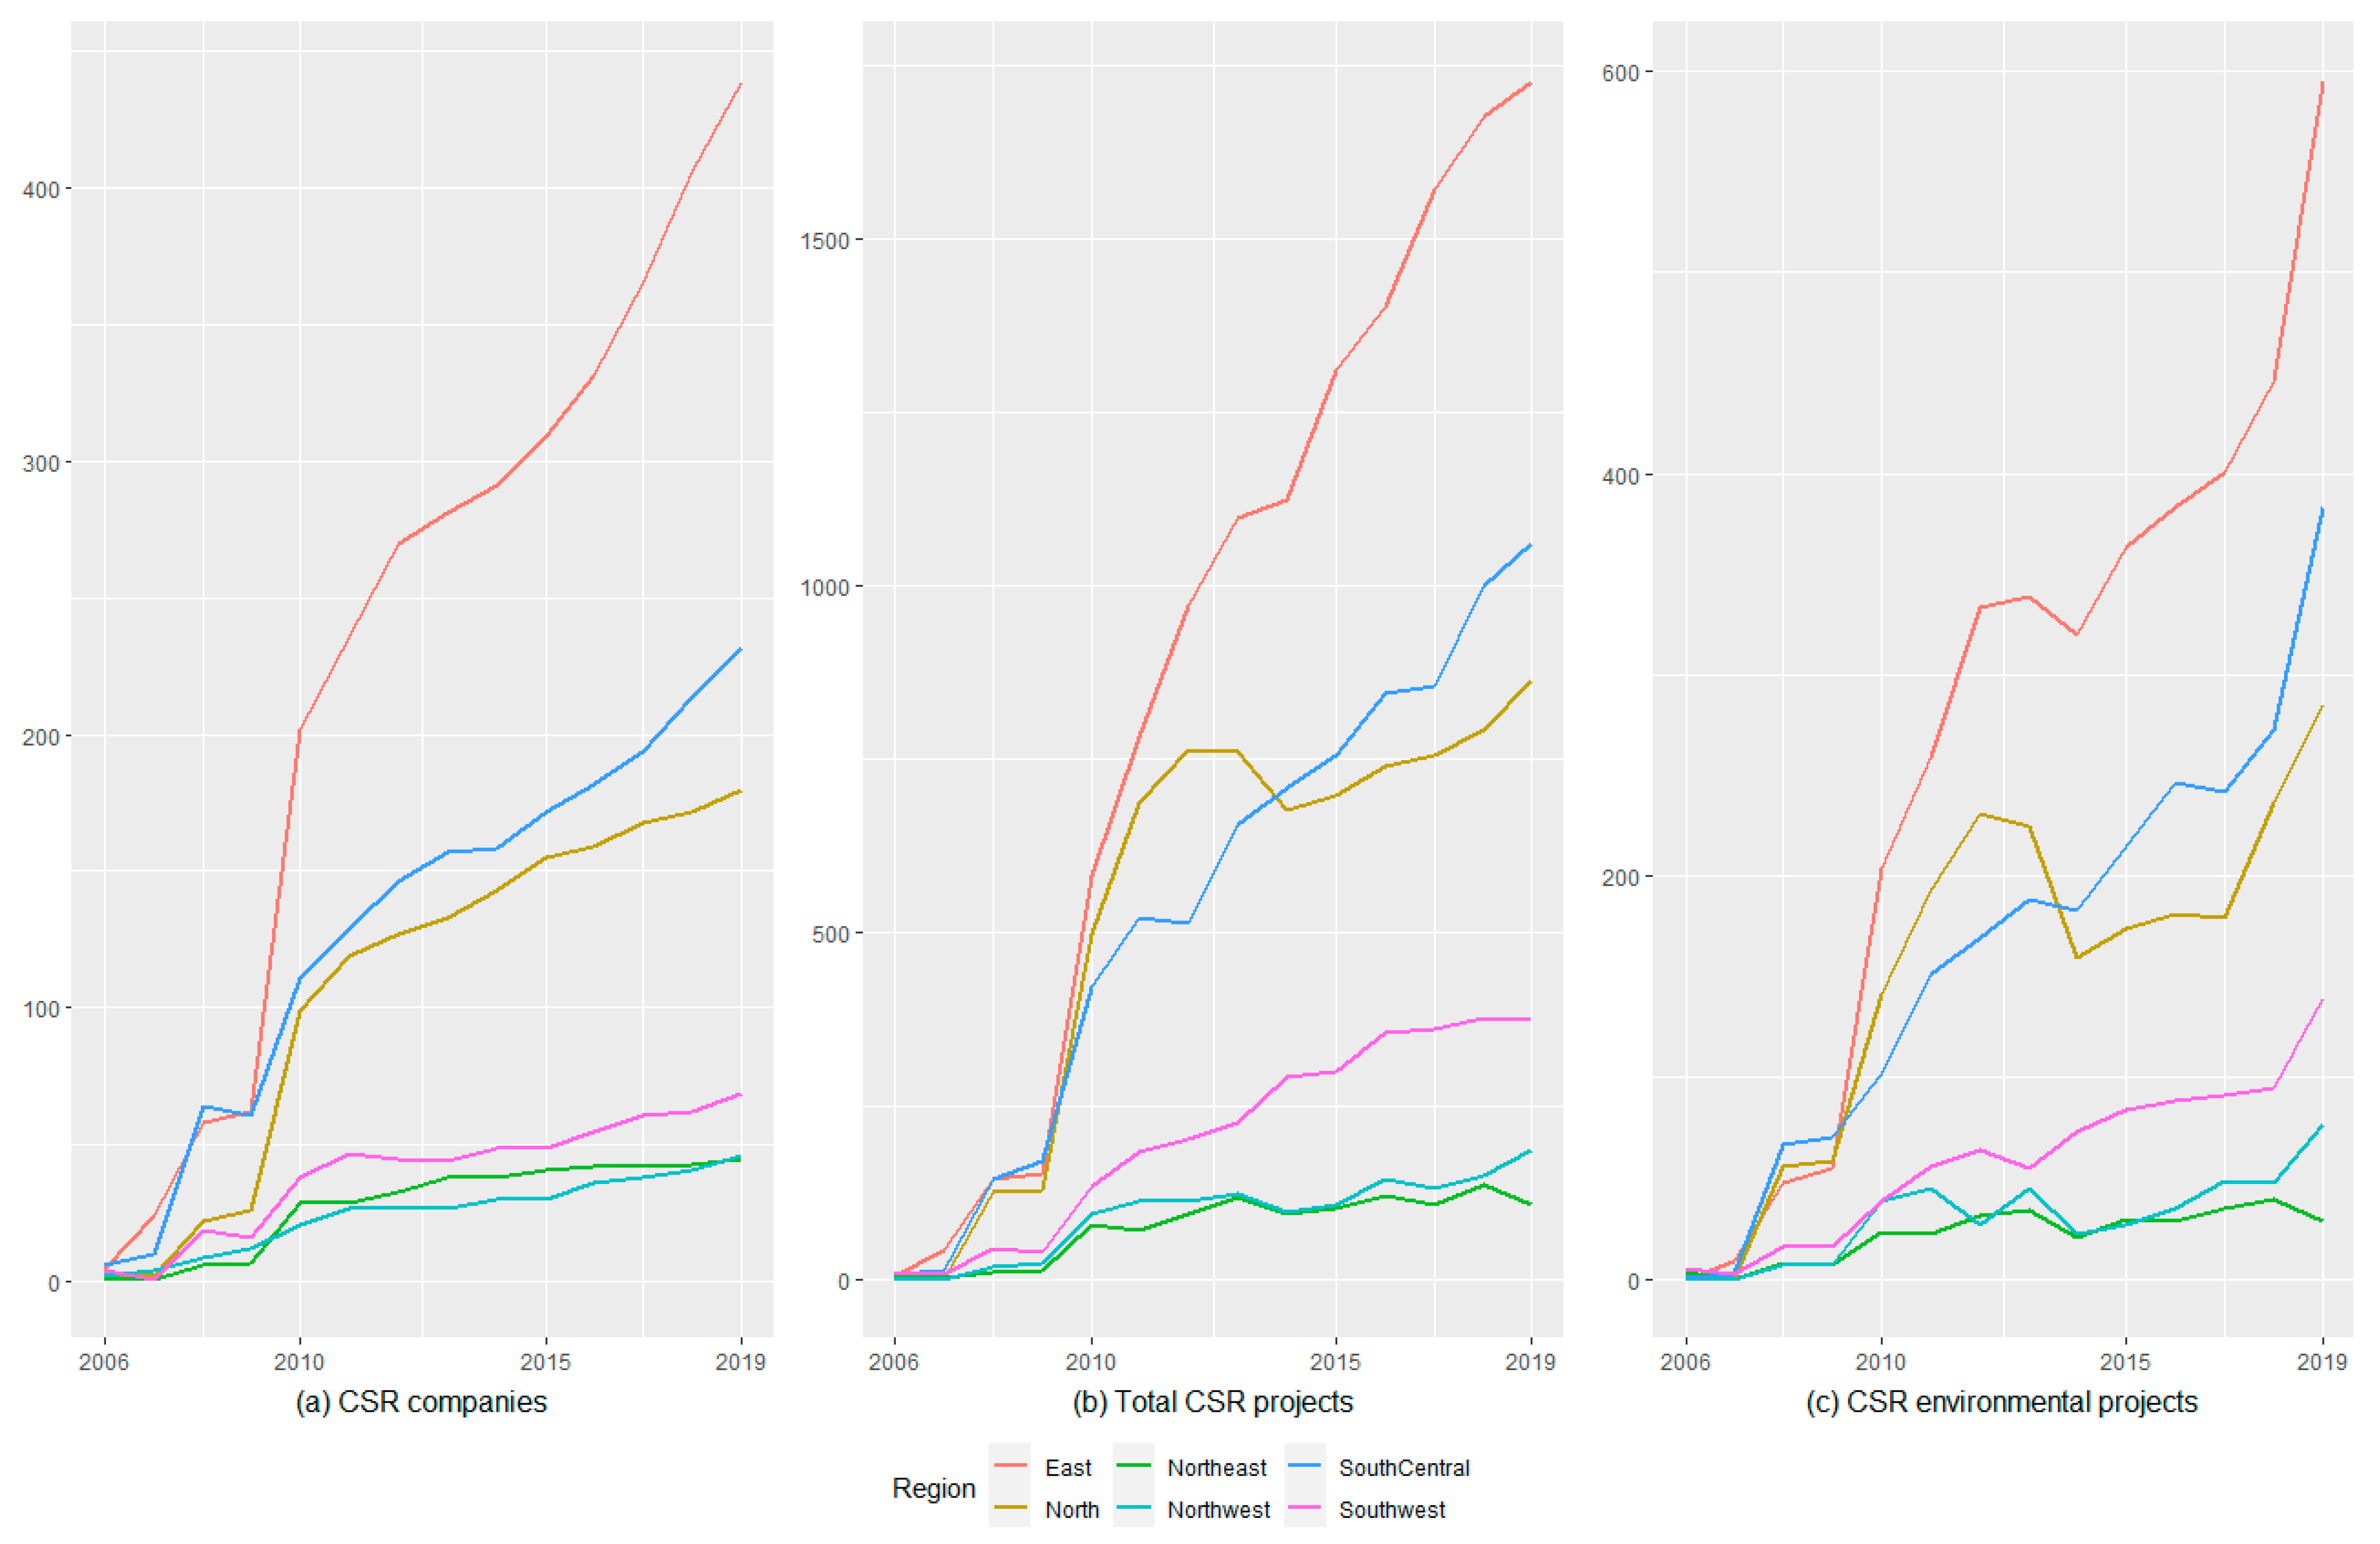
Third, we explore the socioeconomic environment under which the companies were operating. Table A1 (in Appendix A) summarizes the GDP per capita, number of CSR companies and number of CSR projects disclosed in 30 provinces, excluding Tibet, in 6 regions. We found that in provinces with a higher GDP per capita, there were more CSR companies in operation and more CSR projects disclosed. The gap in CSR development between more developed areas, such as the north, east and south-central regions, and less developed areas, such as the northeast, southwest and northwest regions, is large. Figure 4 shows the regional CSR development from 2006 to 2019. The east region led in the growth of the number of CSR companies, total number of CSR projects disclosed and CSR environment protection projects, followed by the north and south-central regions, while CSR development in the other three regions was much slower.
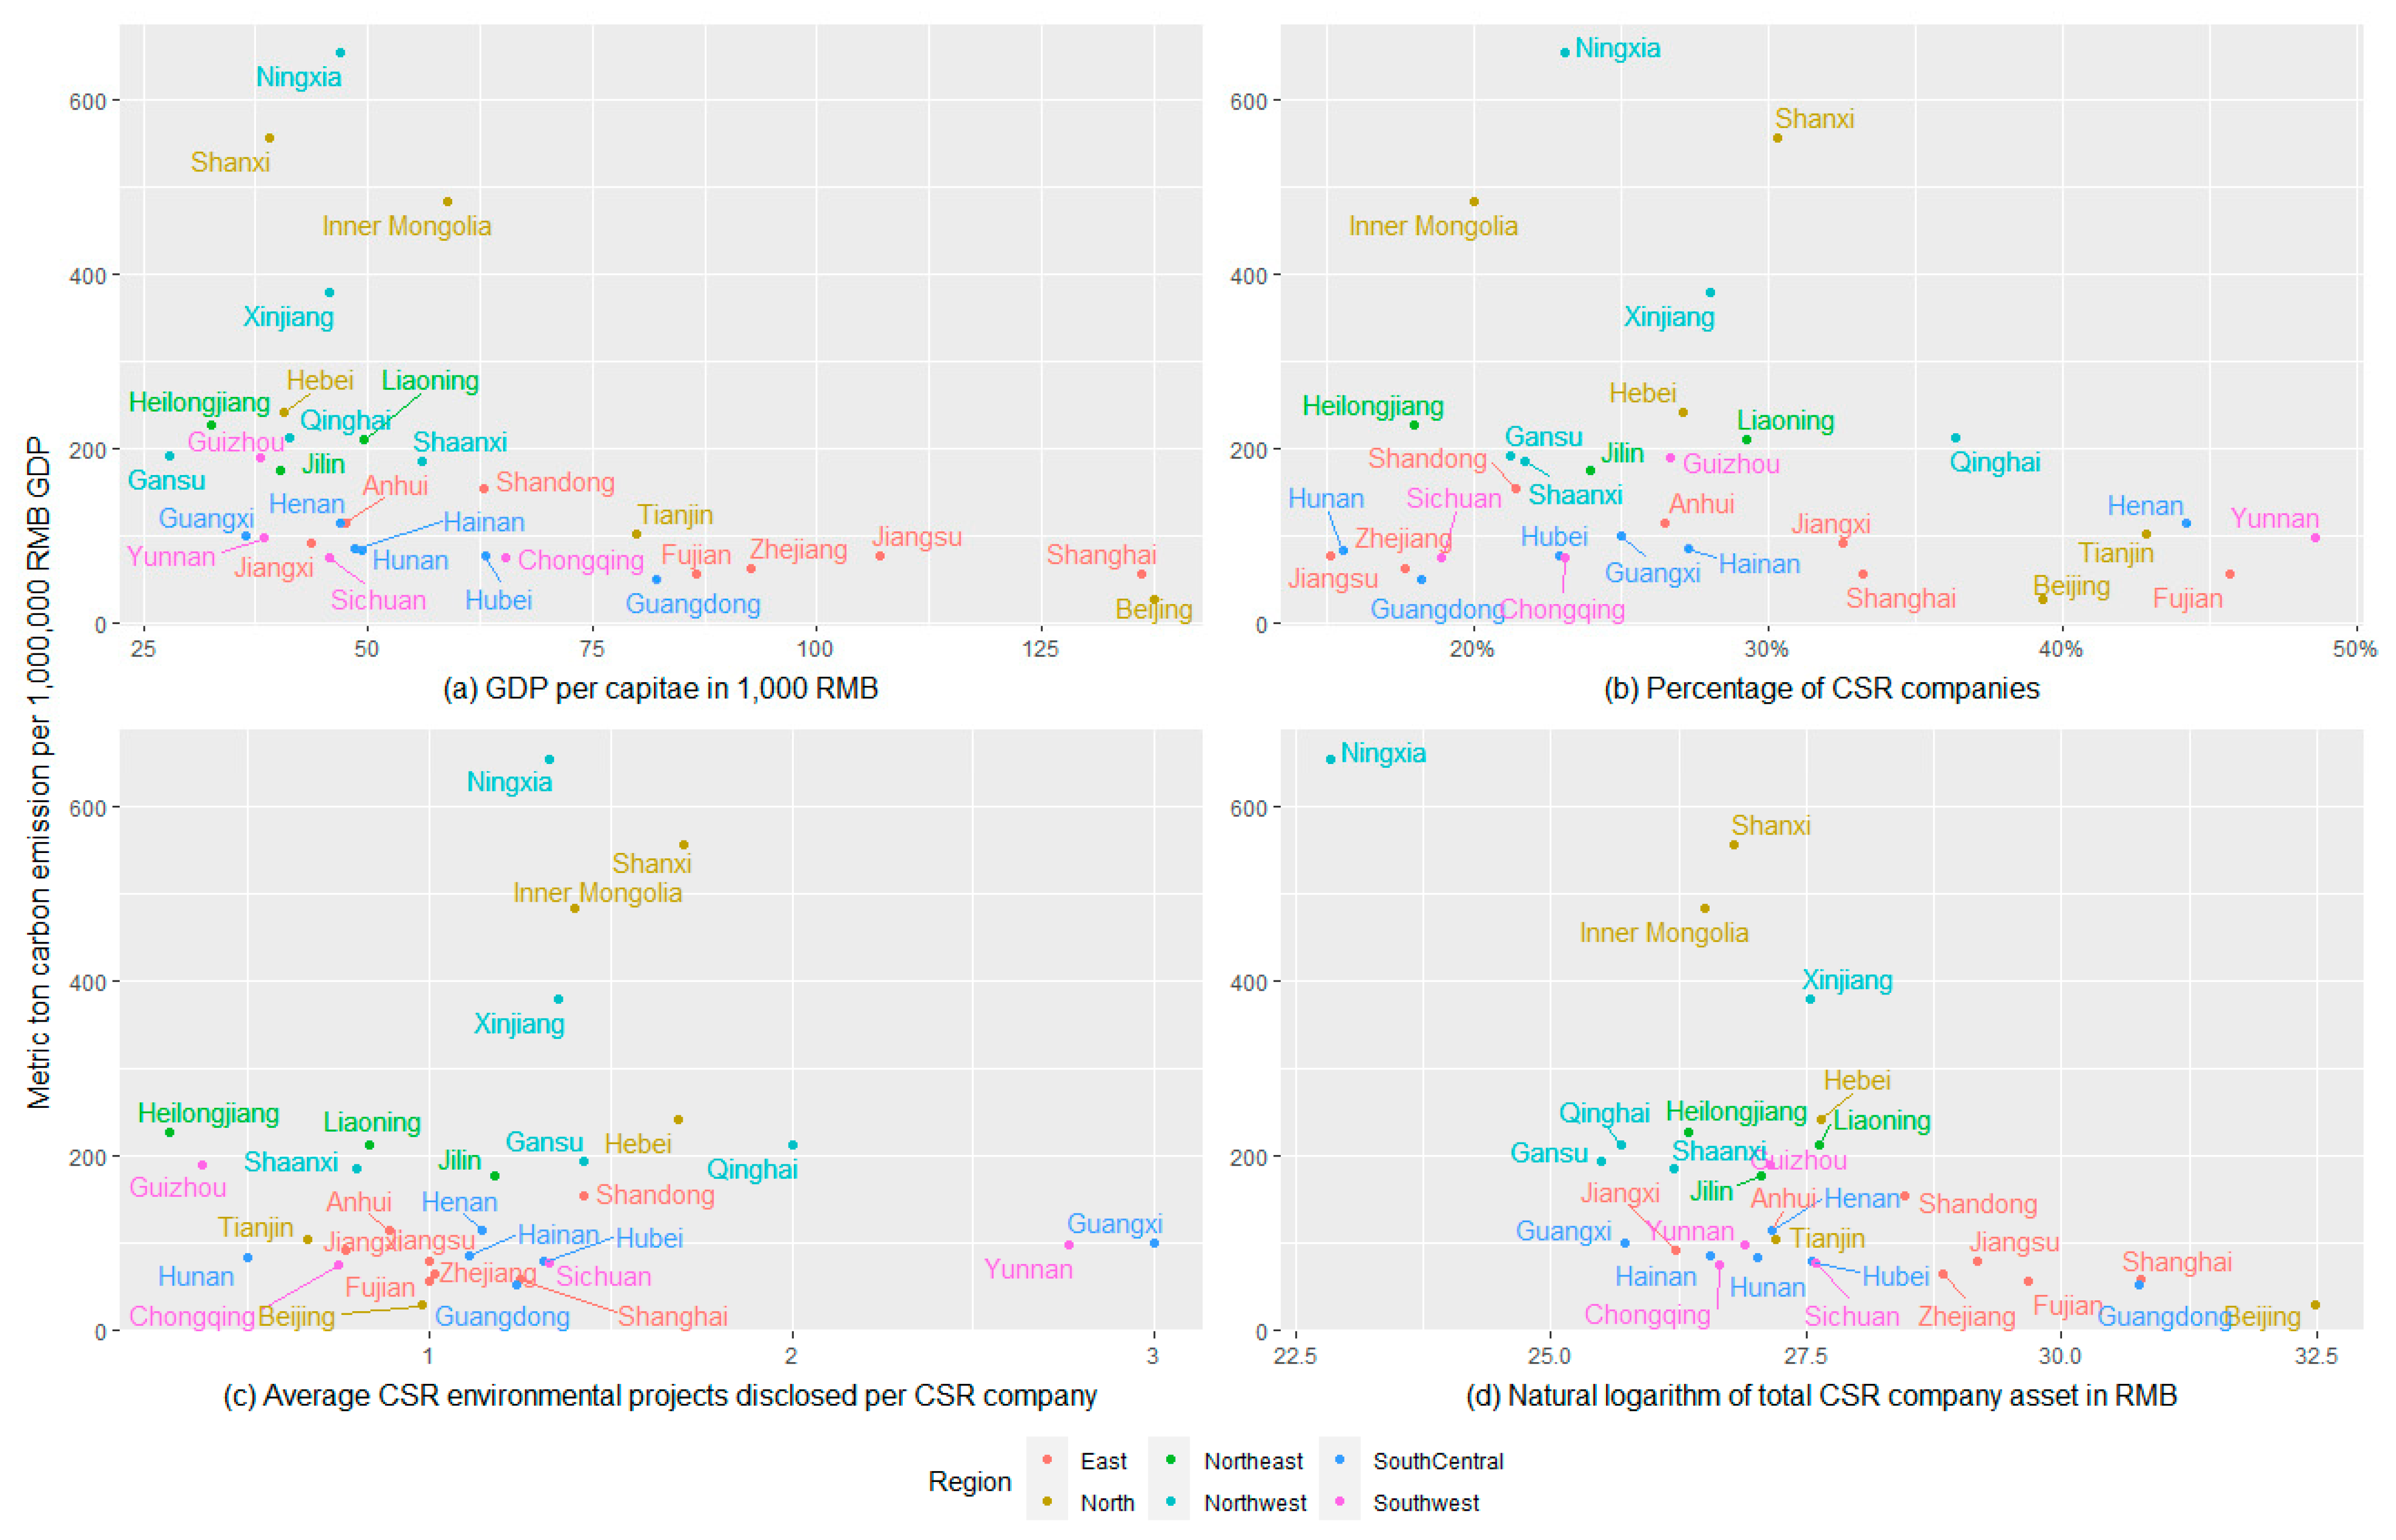
Finally, we explain the connections between company CSR behavior and regional carbon emission trends. According to some theoretical studies, more CSR will result in less carbon emissions [3], which is the relation we want to explore. Figure 5 shows how the provinces are posited according to their carbon emission efficiency (metric tons per million RMB GDP) with regard to four indicators: (a) GDP per capita, (b) percentage of CSR companies, (c) average CSR environmental projects disclosed per CSR company and (d) natural logarithm of total CSR company assets (RMB) in 2017. We found that most provinces are more likely to cluster in their regions. Richer provinces with a higher GDP per capita are more likely to have lower carbon emissions per unit. Some provinces might have higher percentages of CSR companies and more CSR environmental disclosure, but their carbon emission efficiency is not necessarily higher. Furthermore, Beijing, Shanghai and Guangdong, which represent the economic centers of the north, east and south-central regions, respectively, have the highest numbers of total CSR company assets. The fact that the best carbon emission efficiency was found in these three provinces is probably because their CSR companies are much larger than those in other provinces.
3.2. CSR Disclosure Behavior
In the above sections, we observed some interesting phenomena and performed statistical analysis. Further, in this section, we run regressions with panel data to test how companies’ characteristics impact their CSR disclosure behavior. The variables are shown in Section 2. In advance, we expected the following: companies will disclose more CSR projects when their (1) experience increases, (2) employees are better educated, (3) state ownership increases and (4) disclosure effort increases. Firm experience, state ownership and all control variables are supported by the previous literature [65]. To our knowledge, firms’ disclosure effort and employees’ educational level have not been tested in the literature yet. Specifically, we explore how these two factors impact firms’ disclosure behavior.
Firstly, we explored how firms’ internal characteristics influence their CSR reporting by regressions with firm age, list experience, CSR disclosure experience, employee education and state ownership. Since multicollinearity exists in these variables, we ran principal component analysis (PCA) to extract the first four components (F1–F4) which account for nearly 90% of the variation. As shown in Equation (1), F1 has the largest loading on age and exp_list, and thus we could say that F1 basically represents the information of these two variables. With the same logic, F2 represents grad_pect and under_pect, F3 represents stateown and F4 represents exp_csr. In this way, we solved the multicollinearity problem and assigned all the variables corresponding components, which means the PCA carried out a good analysis.
Then, we ran panel regression based on the principal components obtained, as in Equation (5). Table 5 shows the results. However, seldom do the components show significance except for total CSR and employee protection. For total CSR, F1 has a negative coefficient, meaning that company age and list experience negatively influence total CSR. Meanwhile, F2 has a positive coefficient, meaning that education could significantly help the development of total CSR. For employee protection, F1 still has a negative coefficient, and thus company age and list experience are not beneficial for employee protection. The findings of age correspond to existing studies [65], and the findings of list experience and CSR experience further verify the ineffective roles of company experience. Judging from the coefficient of F3, we know that state ownership does not benefit employee protection. The ineffective role of state ownership opposes the findings of some existing studies [65] but supports those of others [50] that studied more recent and longer time periods, and more industries. To summarize, companies’ age, list experience, CSR experience and state ownership do not show an important influence on the development of CSR disclosure, though we found some significant results. Actually, most of the significant results are unbeneficial, except for employee education which slightly benefits total CSR disclosure.
For the control variables, the company size and tax paid to the government both have a significant and positive impact on most CSR disclosure activities, while other control variables do not. The tax paid to the government has a particularly large impact, indicating that companies paying more tax might be more socially responsible. These findings could reflect visibility theory mentioned in the Introduction section [14,15,36].
Secondly, we address hypothesis H1b concerning how firms’ external characteristics impact their CSR disclosure by incorporating only the first three independent variables of Table 1. Equation (6) is the form of regression where not only the total number of CSR projects but also the other five single CSR types are tested.
Table 6 shows the results. We used shareholder, employee, consumer, environment and public to match the descriptions of “interested parties” in both Shenzhen Stock Exchange Social Responsibility Instructions to Listed Companies and Notice of Doing a Better Job for Disclosing 2008 Annual Reports. First, across all regressions, we found that companies following GRI published more CSR reports in total, and in each CSR category, except for consumer and supplier protection. Second, companies that had their reports audited published more CSR reports in general, but this effect comes solely from staff protection, as shown by the third regression. Third, the mandate indicator does not have a significant impact on total CSR projects, nor on each category. To sum up, it seems that firms’ external characteristics have a slightly better impact on CSR practices than their internal characteristics, but the CSR regulation still needs further improvement since the audit and mandate indicators do not have a robust impact. This point embraces the viewpoint of a previous study [10]. For the control variables, tax still has a significant and positive impact, and size has such an effect on environment protection, again a reflection of the studies mentioned in the Introduction section [14,15,36].
3.3. Firms’ CSR Activities’ Impact on Sustainable Economic Development
In this section, we test the impact of firms’ CSR disclosure on sustainable economic development, i.e., carbon emissions in hypothesis H2. The pertinent variables were introduced in Section 2. The framework is shown in Equation (7). We followed the regional classification system established by the National Bureau of Statistics of China, according to the geographic locations of the provinces.
Table 7 shows the results of the regression analysis. It can be seen that only the CSR adoption rate has an impact on reducing carbon emissions, and this effect is concentrated in the southwest and northwest regions, which is beyond our anticipation since these two regions are the least developed in China. Moreover, other CSR indicators make no difference. CSR projects in the south-central region are even positively related to carbon emissions. The results indicate that the current CSR projects’ impact on carbon governance is very questionable. Therefore, there is no clear evidence that companies’ CSR activities could reduce carbon emissions, which is insufficient to support that more CSR would induce less carbon emissions, as suggested by a previous study [3]. For the control variables, GDP per capita significantly reduces carbon emissions, in accordance with a previous study [24], and a higher HDI also helps to reduce carbon emissions. Meanwhile, population has a mixed effect for different regions, which raises a potential research direction to assess how the difference in the economic development stages of regions impacts their carbon emissions. For trade, it is only positively related to carbon emissions in east China, which is reasonable since this region is the region most involved in foreign trade and thus has a greater level of international carbon transfer.
4. Conclusions and Discussion
In this study, we explored the stage that China’s CSR practices are at, as well as their impact on carbon governance. Through a comprehensive panel analysis on how CSR disclosure has developed and impacted regional carbon emissions in China, we add both theoretical and practical contributions to the literature which evaluate the effectiveness of firms’ CSR activities in regional economic, social and environmental development. The main takeaway of this study is threefold. Firstly, China is in a relatively early stage of CSR development. Chinese firms’ CSR disclosure behaviors show that their internal incentive to adopt CSR projects is low, since none of the internal factors researched make a difference in promoting CSR disclosure; CSR has not yet been a strong focus. Secondly, external factors have a slightly better impact on CSR practices since GRI helps to advocate more CSR projects. However, at the same time, the CSR regulation still needs further development since the audit and mandate indicators do not have a robust impact. Thirdly, the current CSR disclosure practices do not have a clear impact on carbon emission reduction, which contradicts some predictions that CSR practices have a positive effect on carbon reduction [3]. To summarize, it is urgent for the Chinese regulatory administration and businesses to realize the importance of CSR, develop more CSR practices and design an efficient regulation framework. Meanwhile, the government, society and companies should also pay attention to exploring how to make CSR practices workable for carbon governance. Additionally, since there are huge developmental differences among Chinese regions and provinces, CSR development might need more planning considering local realities besides central standards.
Along with the above conclusions, there is also some information brought about by the controlling variables we used. Mainly, companies with a larger size and that pay more tax are more likely to promote CSR, which embraces visibility theory [14,15,20,36]. For carbon governance, our analysis verifies that regions are in different stages of economic development with various characteristics [66]. Thus, exploring how to promote CSR practices and regulation with consideration of regional differences could be a fruitful future research topic.
This paper is also limited by the data available to the authors. For example, we can only observe CSR activities through companies’ CSR reports, meaning that our sample only contains companies’ reports that are publicly traded. Additionally, many CSR reports missed key elements such as financial expenditures and the amounts of emission reductions. Another example is the regional carbon emissions, measured by energy consumption data. We were only able to collect data at the provincial level, while city-level data are missing. In addition, the energy consumption data in 2018 and 2019 have not been published yet. Adding more data will introduce better group classifications, extend the years of samples and provide more CSR project details.
Author Contributions
Conceptualization, W.C. and S.L.; methodology, S.L. and W.C.; software, W.C., S.L. and J.L.; validation, S.L.; formal analysis, W.C.; investigation, J.L. and H.S.; resources, S.L.; data curation, J.L. and H.S.; writing—original draft preparation, W.C.; writing—review and editing, S.L.; funding acquisition, S.L. All authors have read and agreed to the published version of the manuscript.
Funding
This research was funded by Tsinghua University, grant number 20192001391 and 20202000464. The APC was funded by Tsinghua University.
Institutional Review Board Statement
Not applicable.
Informed Consent Statement
Not applicable.
Data Availability Statement
The firm data is available from CSMAR database, and the provincial statistical data is available from China Statistical Yearbook published by National Bureau of Statistics of China.
Acknowledgments
The authors would like to thank the editor and reviewers for their valuable advice.
Conflicts of Interest
The authors declare no conflict of interest. The funders had no role in the design of the study; in the collection, analyses, or interpretation of data; in the writing of the manuscript, or in the decision to publish the results.
Appendix A

Table A1.
Socioeconomic conditions and CSR disclosure.
| Region | Province | GDP per Capita (2019, RMB) | CSR Companies (2019) | CSR Projects (2019) |
|---|---|---|---|---|
| North | Beijing * | 164,555 | 129 | 626 |
| Tianjin * | 89,984 | 20 | 111 | |
| Hebei | 46,073 | 15 | 40 | |
| Shanxi | 45,486 | 10 | 53 | |
| Inner Mongolia | 67,766 | 6 | 33 | |
| Northeast | Liaoning | 57,112 | 27 | 81 |
| Jilin | 43,578 | 11 | 20 | |
| Heilongjiang | 36,109 | 7 | 7 | |
| East | Shanghai * | 156,456 | 110 | 601 |
| Jiangsu | 122,251 | 71 | 244 | |
| Zhejiang | 106,773 | 93 | 310 | |
| Anhui | 57,879 | 33 | 131 | |
| Fujian | 106,536 | 69 | 185 | |
| Jiangxi | 52,866 | 17 | 68 | |
| Shandong | 70,050 | 46 | 189 | |
| South-Central | Henan | 55,724 | 35 | 149 |
| Hubei | 76,648 | 28 | 95 | |
| Hunan | 57,667 | 19 | 52 | |
| Guangdong | 93,730 | 133 | 671 | |
| Guangxi | 42,817 | 9 | 70 | |
| Hainan | 56,411 | 8 | 24 | |
| Southwest | Chongqing * | 75,563 | 15 | 75 |
| Sichuan | 55,360 | 28 | 149 | |
| Guizhou | 46,286 | 9 | 41 | |
| Yunnan | 47,805 | 17 | 110 | |
| Northwest | Shaanxi | 66,546 | 15 | 71 |
| Gansu | 32,937 | 7 | 21 | |
| Qinghai | 48,373 | 5 | 11 | |
| Ningxia | 53,935 | 5 | 37 | |
| Xinjiang | 53,893 | 14 | 47 |
* Provincial level municipalities.
References
- Okereke, C.; Wittneben, B.; Bowen, F. Climate Change: Challenging Business, Transforming Politics. Bus. Soc. 2011, 51, 7–30. [Google Scholar] [CrossRef]
- Stanghellini, P.L.; Marchello, M.P.; Michetti, M. Climate Change, Sustainability and Corporate Social Responsibility: The Role of Financial Institutions. In Proceedings of the Sixth International Conference on Ethics and Environmental Policies, Padova, Italy, 23–25 October 2008. [Google Scholar]
- SShu, T.; Liu, Q.; Chen, S.; Wang, S.; Lai, K.K. Pricing Decisions of CSR Closed-Loop Supply Chains with Carbon Emission Constraints. Sustainability 2018, 10, 4430. [Google Scholar] [CrossRef] [Green Version]
- Allen, M.W.; Craig, C.A. Rethinking Corporate Social Responsibility in the Age of Climate Change: A Communication Perspective. Int. J. Corp. Soc. Responsib. 2016, 1, 1–11. [Google Scholar] [CrossRef] [Green Version]
- Elkington, J. Partnerships from Cannibals with Forks: The Triple Bottom Line of 21st-Century Business. Environ. Qual. Manag. 1998, 8, 37–51. [Google Scholar] [CrossRef]
- Hopkins, M. Corporate Social Responsibility and International Development: Is Business the Solution? Routledge: Abingdon-on-Thames, Oxfordshire, UK, 2012. [Google Scholar]
- Berger-Walliser, G.; Scott, I. Redefining Corporate Social Responsibility in an Era of Globalization and Regulatory Hardening. Am. Bus. Law J. 2018, 55, 167–218. [Google Scholar] [CrossRef]
- Patten, D.M. Intra-Industry Environmental Disclosures in Response to the Alaskan Oil Spill: A Note on Legitimacy Theory. Account. Organ. Soc. 1992, 17, 471–475. [Google Scholar] [CrossRef]
- Breton, G. A Postmodern Accounting Theory: An Institutional Approach; Emerald Group Publishing: Bingley, UK, 2018; ISBN 978-1-78769-795-9. [Google Scholar]
- Deegan, C.M. Legitimacy Theory: Despite Its Enduring Popularity and Contribution, Time Is Right for a Necessary Makeover. AAAJ 2019, 32. [Google Scholar] [CrossRef]
- Deegan, C. Introduction: The Legitimising Effect of Social and Environmental Disclosures—A Theoretical Foundation. Acc. Audit. Account. J. 2002, 15, 282–311. [Google Scholar] [CrossRef]
- Adams, C.A. Internal Organisational Factors Influencing Corporate Social and Ethical Reporting: Beyond Current Theorising. Acc. Audit. Account. J. 2002, 15, 223–250. [Google Scholar] [CrossRef]
- Renukappa, S.; Akintoye, A.; Egbu, C.; Goulding, J. Carbon Emission Reduction Strategies in the UK Industrial Sectors: An Empirical Study. Int. J. Clim. Chang. Strat. Manag. 2013, 5, 304–323. [Google Scholar] [CrossRef]
- Cormier, D.; Magnan, M. Corporate Environmental Disclosure Strategies: Determinants, Costs and Benefits. J. Account. Audit. Financ. 1999, 14, 429–451. [Google Scholar] [CrossRef]
- Cormier, D.; Magnan, M. Environmental Reporting Management: A Continental European Perspective. J. Account. Public Policy 2003, 22, 43–62. [Google Scholar] [CrossRef]
- Larrinaga, C.; Carrasco, F.; Correa, C.; Llena, F.; Moneva, J. Accountability and Accounting Regulation: The Case of the Spanish Environmental Disclosure Standard. Eur. Account. Rev. 2002, 11, 723–740. [Google Scholar] [CrossRef]
- O’Dwyer, B.; Unerman, J.; Hession, E. User Needs in Sustainability Reporting: Perspectives of Stakeholders in Ireland. Eur. Account. Rev. 2005, 14, 759–787. [Google Scholar] [CrossRef]
- Sharfman, M.P.; Fernando, C.S. Environmental Risk Management and the Cost of Capital. Strat. Manag. J. 2008, 29, 569–592. [Google Scholar] [CrossRef]
- Jo, H.; Na, H. Does CSR Reduce Firm Risk? Evidence from Controversial Industry Sectors. J. Bus. Ethics 2012, 110, 441–456. [Google Scholar] [CrossRef]
- Cordeiro, J.J.; Tewari, M. Firm Characteristics, Industry Context, and Investor Reactions to Environmental CSR: A Stakeholder Theory Approach. J. Bus. Ethics 2015, 130, 833–849. [Google Scholar] [CrossRef]
- Othman, S.; Darus, F.; Arshad, R. The Influence of Coercive Isomorphism on Corporate Social Responsibility Reporting and Reputation. Soc. Responsib. J. 2011, 7, 119–135. [Google Scholar] [CrossRef]
- Sadou, A.; Alom, F.; Laluddin, H. Corporate Social Responsibility Disclosures in Malaysia: Evidence from Large Companies. SRJ 2017, 13, 177–202. [Google Scholar] [CrossRef]
- Sana, S.S. Price Competition between Green and Non Green Products under Corporate Social Responsible Firm. J. Retail. Consum. Serv. 2020, 55, 102118. [Google Scholar] [CrossRef]
- Ye, M.; Lu, W.; Flanagan, R.; Chau, K.W. Corporate Social Responsibility “Glocalisation”: Evidence from the International Construction Business. Corp. Soc. Responsib. Environ. Manag. 2020, 27, 655–669. [Google Scholar] [CrossRef]
- Chen, Y.-C.; Hung, M.; Wang, Y. The Effect of Mandatory CSR Disclosure on Firm Profitability and Social Externalities: Evidence from China. J. Account. Econ. 2018, 65, 169–190. [Google Scholar] [CrossRef]
- Kolk, A. Environmental Reporting by Multinationals from the Triad: Convergence or Divergence? MIR Manag. Int. Rev. 2005, 45, 145–166. [Google Scholar]
- Haque, S.; Deegan, C. Corporate Climate Change-Related Governance Practices and Related Disclosures: Evidence from Australia: Corporate Climate Change-Related Governance Practices and Related Disclosures. Aust. Account. Rev. 2010, 20, 317–333. [Google Scholar] [CrossRef] [Green Version]
- Freedman, M.; Jaggi, B. Global Warming Disclosures: Impact of Kyoto Protocol Across Countries: Global Warming Disclosures. J. Int. Financ. Manag. Account. 2011, 22, 46–90. [Google Scholar] [CrossRef]
- Jaggi, B.; Allini, A.; Macchioni, R.; Zagaria, C. The Factors Motivating Voluntary Disclosure of Carbon Information: Evidence Based on Italian Listed Companies. Organ. Environ. 2018, 31, 178–202. [Google Scholar] [CrossRef]
- Yu, J.; Lee, S. The Impact of Greenhouse Gas Emissions on Corporate Social Responsibility in Korea. Sustainability 2017, 9, 1135. [Google Scholar] [CrossRef] [Green Version]
- Huang, Y. Policy Experimentation and the Emergence of Domestic Voluntary Carbon Trading in China. East Asia 2013, 30, 67–89. [Google Scholar] [CrossRef]
- Zeng, H.; Zhou, Z.; Xiao, Y.; Ziqi, D.; Liu, L.; Chen, X. Determinants of Corporate Carbon Efficiency: Evidence from CDP 2011–2014 Questionnaire for Standard & Poor’s 500 Index Companies. Environ. Eng. Manag. J. 2017, 16, 1595–1608. [Google Scholar]
- Doda, B.; Gennaioli, C.; Gouldson, A.; Grover, D.; Sullivan, R. Are Corporate Carbon Management Practices Reducing Corporate Carbon Emissions? Corp. Soc. Responsib. Environ. Manag. 2016, 23, 257–270. [Google Scholar] [CrossRef] [Green Version]
- Sullivan, R. The Management of Greenhouse Gas Emissions in Large European Companies. Corp. Soc. Responsib. Environ. Manag. 2009, 16, 301–309. [Google Scholar] [CrossRef]
- Prado-Lorenzo, J.-M.; Garcia-Sanchez, I.-M. The Role of the Board of Directors in Disseminating Relevant Information on Greenhouse Gases. J. Bus. Ethics 2010, 97, 391–424. [Google Scholar] [CrossRef]
- Luo, L.; Lan, Y.-C.; Tang, Q. Corporate Incentives to Disclose Carbon Information: Evidence from the CDP Global 500 Report. J. Int. Financ. Manag. Account. 2012, 23, 93–120. [Google Scholar] [CrossRef]
- Bae Choi, B.; Lee, D.; Psaros, J. An Analysis of Australian Company Carbon Emission Disclosures. Pac. Account. Rev. 2013, 25, 58–79. [Google Scholar] [CrossRef]
- Depoers, F.; Jeanjean, T.; Jérôme, T. Voluntary Disclosure of Greenhouse Gas Emissions: Contrasting the Carbon Disclosure Project and Corporate Reports. J. Bus. Ethics 2016, 134, 445–461. [Google Scholar] [CrossRef]
- Wegener, M.; Labelle, R.; Jerman, L. Unpacking Carbon Accounting Numbers: A Study of the Commensurability and Comparability of Corporate Greenhouse Gas Emission Disclosures. J. Clean. Prod. 2019, 211, 652–664. [Google Scholar] [CrossRef]
- Olhoff, A.; Christensen, J.M.; Kuramochi, T.; Elzen, M.G.J.D.; Peters, G.; Höhne, N.; Fransen, T.; Hans, F.; Rogelj, J.; Kejun, J.; et al. Emissions Gap Report; United Nations Environment Programme: Nairobi, Kenya, 2019. [Google Scholar] [CrossRef]
- Liu, J.; Diamond, J. China’s Environment in a Globalizing World. Nature 2005, 435, 1179–1186. [Google Scholar] [CrossRef]
- Bagnai, A. The Role of China in Global External Imbalances: Some Further Evidence. China Econ. Rev. 2009, 20, 508–526. [Google Scholar] [CrossRef]
- Zhou, W. Will CSR Work in China? Leading Perspectives, CSR in the People’s Republic of China. Bus. Soc. Responsib. 2006. Available online: https://www.eldis.org/document/A22623 (accessed on 11 September 2019).
- Hou, S.; Fu, W.; Li, X. Achieving Sustainability with A Stakeholder-Based CSR Assessment Model For Fines In China. J. Int. Bus. Ethics 2010, 3, 41. [Google Scholar]
- Hanson, K.O.; Rothlin, S. Taking your codes to China. In Dimensions of Teaching Business Ethics in Asia; Springer: Berlin/Heidelberg, Germany, 2013; pp. 77–89. [Google Scholar]
- Wang, H.; Bernell, D. Environmental Disclosure in China: An Examination of the Green Securities Policy. J. Environ. Dev. 2013, 22, 339–369. [Google Scholar] [CrossRef] [Green Version]
- Mol, A.P.J.; He, G.; Zhang, L. Information Disclosure in Environmental Risk Management: Developments in China. J. Curr. Chin. Aff. 2011, 40, 163–192. [Google Scholar] [CrossRef] [Green Version]
- Tian, Y.; Zhu, Q.; Geng, Y. An Analysis of Energy-Related Greenhouse Gas Emissions in the Chinese Iron and Steel Industry. Energy Policy 2013, 56, 352–361. [Google Scholar] [CrossRef]
- Li, K.; Khalili, N.R.; Cheng, W. Corporate Social Responsibility Practices in China: Trends, Context, and Impact on Company Performance. Sustainability 2019, 11, 354. [Google Scholar] [CrossRef] [Green Version]
- Li, W.; Zhang, R. Corporate Social Responsibility, Ownership Structure, and Political Interference: Evidence from China. J. Bus. Ethics 2010, 96, 631–645. [Google Scholar] [CrossRef]
- Wang, F.; Sun, J.; Liu, Y.S. Institutional Pressure, Ultimate Ownership, and Corporate Carbon Reduction Engagement: Evidence from China. J. Bus. Res. 2019, 104, 14–26. [Google Scholar] [CrossRef]
- Zhou, Z.; Nie, L.; Ji, H.; Zeng, H.; Chen, X. Does a Firm’s Low-Carbon Awareness Promote Low-Carbon Behaviors? Empirical Evidence from China. J. Clean. Prod. 2020, 244, 118903. [Google Scholar] [CrossRef]
- Li, Q.; Luo, W.; Wang, Y.; Wu, L. Firm Performance, Corporate Ownership, and Corporate Social Responsibility Disclosure in China. Bus. Ethics Eur. Rev. 2013, 22, 159–173. [Google Scholar] [CrossRef]
- Lu, Y.; Abeysekera, I. Stakeholders’ Power, Corporate Characteristics, and Social and Environmental Disclosure: Evidence from China. J. Clean. Prod. 2014, 64, 426–436. [Google Scholar] [CrossRef] [Green Version]
- Li, W.; Hu, M. An Overview of the Environmental Finance Policies in China: Retrofitting an Integrated Mechanism for Environmental Management. Front. Environ. Sci. Eng. 2014, 8, 316–328. [Google Scholar] [CrossRef]
- Peng, J.; Sun, J.; Luo, R. Corporate Voluntary Carbon Information Disclosure: Evidence from China’s Listed Companies. World Econ. 2015, 38, 91–109. [Google Scholar] [CrossRef]
- Guan, X.; Zhang, J.; Wu, X.; Cheng, L. The Shadow Prices of Carbon Emissions in China’s Planting Industry. Sustainability 2018, 10, 753. [Google Scholar] [CrossRef] [Green Version]
- He, C.; Wang, J. Energy Intensity in Light of China’s Economic Transition. Eurasian Geogr. Econ. 2007, 48, 439–468. [Google Scholar] [CrossRef]
- Clarke-Sather, A.; Qu, J.; Wang, Q.; Zeng, J.; Li, Y. Carbon Inequality at the Sub-National Scale: A Case Study of Provincial-Level Inequality in CO2 Emissions in China 1997–2007. Energy Policy 2011, 39, 5420–5428. [Google Scholar] [CrossRef]
- Cadez, S.; Czerny, A. Climate Change Mitigation Strategies in Carbon-Intensive Firms. J. Clean. Prod. 2016, 112, 4132–4143. [Google Scholar] [CrossRef]
- Cadez, S.; Czerny, A.; Letmathe, P. Stakeholder Pressures and Corporate Climate Change Mitigation Strategies. Bus. Strategy Environ. 2019, 28, 1–14. [Google Scholar] [CrossRef]
- Galant, A.; Cadez, S. Corporate Social Responsibility and Financial Performance Relationship: A Review of Measurement Approaches. Econ. Res. Ekon. Istraz. 2017, 30, 676–693. [Google Scholar] [CrossRef]
- Cadez, S.; Guilding, C. Examining Distinct Carbon Cost Structures and Climate Change Abatement Strategies in CO2 Polluting Firms. Account. Audit. Account. J. 2017, 30, 1041–1064. [Google Scholar] [CrossRef]
- Du, L. Impact Factors of China’s Carbon Dioxide Emissions: Provincial Panel Data Analysis. South. Econ. 2010, 11, 20–33. [Google Scholar]
- Wang, J.; Song, L.; Yao, S. The Determinants of Corporate Social Responsibility Disclosure: Evidence from China. J. Appl. Bus. Res. JABR 2013, 29, 1833. [Google Scholar] [CrossRef]
- Yu, H.-C.; Kuo, L.; Ma, B. The Drivers of Carbon Disclosure: Evidence from China’s Sustainability Plans. Carbon Manag. 2020, 11, 399–414. [Google Scholar] [CrossRef]
Figure 1.
CSR disclosure overview in Chinese listed companies.

Figure 2.
CSR report quality.

Figure 3.
Number of CSR projects disclosed.

Figure 4.
Regional CSR development: (a) number of CSR companies; (b) total number of CSR projects disclosed; (c) number of CSR environmental projects disclosed.
Figure 4.
Regional CSR development: (a) number of CSR companies; (b) total number of CSR projects disclosed; (c) number of CSR environmental projects disclosed.

Figure 5.
Regional carbon emission (metric tons per million RMB GDP) related to (a) GDP per capita in RMB 1000, (b) percentage of CSR companies, (c) average CSR environmental projects disclosed per CSR company and (d) natural logarithm of total CSR company assets (RMB). All graphs relate to 2017.
Figure 5.
Regional carbon emission (metric tons per million RMB GDP) related to (a) GDP per capita in RMB 1000, (b) percentage of CSR companies, (c) average CSR environmental projects disclosed per CSR company and (d) natural logarithm of total CSR company assets (RMB). All graphs relate to 2017.

Table 1.
Variables in CSR disclosure behavior analysis.
| Variable | Symbol | Measurement |
|---|---|---|
| Dependent variables | ||
| Total CSR disclosure | CSR Total | Total number of CSR projects disclosed by a firm |
| Types of CSR projects disclosed | Shareholder | Number of CSR shareholder protection projects |
| Staff | Number of CSR staff protection projects | |
| Consumer | Number of CSR consumer and supplier protection projects | |
| Environment | Number of CSR environment protection projects | |
| Public | Number of CSR public relations projects | |
| Independent variables | ||
| Global Reporting Initiative | GRI | GRI = 1 if the CSR report followed GRI standard, GRI = 0 otherwise |
| CSR certification | Audit | Audit = 1 if the CSR report was audited, Audit = 0 otherwise |
| CSR mandatory disclosure | Mandate | Mandate = 1 if the firm was required to disclose CSR reports, Mandate = 0 otherwise |
| Firm age | Age | Years since the firm established |
| Firm experience in list | List Exp | Years since the firm became publicly listed |
| Firm experience in CSR disclosure | CSR Exp | Years since the firm started disclosing CSR |
| Firm high education | High Edu | Percentage of firm employees holding graduate level degrees (master’s and PhD’s) |
| Firm mid and high education | Mid Edu | Percentage of firm employees holding undergraduate level degrees and above (bachelor’s, master’s and PhD’s) |
| State ownership | SOE | Percentage of firm’s state-owned shares, divided by total shares |
| Control variables | ||
| Firm size | Size | The natural logarithm of firm’s total asset |
| Firm revenue | Revenue | The firm’s total revenue to total asset ratio |
| Tax paid to the government | Tax | The firm’s total tax paid to total asset ratio |
| Cash paid to employees | Cash | The firm’s total cash paid to employees to total asset ratio |
| Firm net profit margin | Profit | The firm’s total net profit to total revenue ratio |
Table 2.
Descriptive statistics of firms.
| Variable | N of Firms | Mean | Std. Dev. | Min | Max |
|---|---|---|---|---|---|
| CSR Total | 6295 | 5.2353 | 4.9489 | 1 | 39 |
| Shareholder | 6295 | 0.41 | 0.645 | 0 | 7 |
| Staff | 6295 | 2.4221 | 2.933 | 0 | 26 |
| Consumer | 6295 | 0.5252 | 1.2262 | 0 | 16 |
| Environment | 6295 | 1.533 | 2.1629 | 0 | 23 |
| Public | 6295 | 0.345 | 0.7093 | 0 | 9 |
| Age | 6295 | 17.2386 | 5.8892 | 0 | 40 |
| List Exp | 6295 | 12.1617 | 6.7801 | 0 | 29 |
| CSR Exp | 6295 | 3.783 | 3.0468 | 0 | 13 |
| High Edu | 4518 | 0.0603 | 0.1037 | 0.0003 | 4.5194 |
| Mid Edu | 4518 | 0.3906 | 0.282 | 0.0034 | 5.5374 |
| SOE | 6294 | 0.0692 | 0.1611 | 0 | 0.9 |
| GRI | 6295 | 0.2372 | 0.4254 | 0 | 1 |
| Audit | 6295 | 0.0373 | 0.1896 | 0 | 1 |
| Mandate | 6295 | 0.5508 | 0.4975 | 0 | 1 |
| Size | 6295 | 23.426 | 1.8193 | 18.7602 | 31.0359 |
| Revenue | 6295 | 0.6205 | 0.5336 | 0.0044 | 8.601 |
| Tax | 6295 | 0.0384 | 0.0364 | −0.0184 | 0.6196 |
| Cash | 6295 | 0.0591 | 0.0529 | 0 | 1.4208 |
| Profit | 6295 | 0.1065 | 0.2803 | −2.9663 | 12.0805 |
Table 3.
Variables in the analysis of the impact of CSR disclosure behavior on carbon emissions.
| Variable | Symbol | Measurement |
|---|---|---|
| Dependent variable | ||
| Carbon Emission | CO2 | Natural logarithm of carbon emission in metric ton per 1,000,000 RMB GDP |
| Independent variables | ||
| CSR adoption rate | CSR Adoption | Percentage of CSR companies over all listed firms |
| CSR total effort | CSR Project | Average number of CSR projects disclosed per CSR company |
| CSR environment effort | CSR Environment | Percentage of CSR environment protection over all CSR projects |
| CSR firm size | CSR Size | CSR companies’ total asset to provincial GDP ratio |
| Control variables | ||
| GDP per capita | GDP per capita | The natural logarithm of GDP per capita of provinces |
| Population | Population | The natural logarithm of population of provinces |
| Trade activities | Trade | The total import and export to GDP ratio of provinces |
Table 4.
Descriptive statistics of provinces.
| Province | Statistics | CO2 | CSR Adoption | CSR Project | CSR Environment | CSR Size | GDP per Capita | Population | Trade |
|---|---|---|---|---|---|---|---|---|---|
| Anhui | Mean | 5.18 | 0.19 | 3.50 | 0.36 | 15.80 | 10.14 | 8.71 | 0.13 |
| N | 12 | 12 | 12 | 12 | 12 | 12 | 12 | 12 | |
| Beijing | Mean | 3.91 | 0.33 | 4.44 | 0.29 | 21.47 | 11.42 | 7.60 | 1.15 |
| N | 11 | 11 | 11 | 11 | 11 | 11 | 11 | 11 | |
| Chongqing | Mean | 4.83 | 0.17 | 3.49 | 0.21 | 16.53 | 10.57 | 7.99 | 0.23 |
| N | 10 | 10 | 10 | 10 | 10 | 10 | 10 | 10 | |
| Fujian | Mean | 4.61 | 0.49 | 2.35 | 0.26 | 17.57 | 10.75 | 8.23 | 0.46 |
| N | 12 | 12 | 12 | 12 | 12 | 12 | 12 | 12 | |
| Gansu | Mean | 5.44 | 0.17 | 2.60 | 0.26 | 15.97 | 10.06 | 7.86 | 0.08 |
| N | 6 | 6 | 6 | 6 | 6 | 6 | 6 | 6 | |
| Guangdong | Mean | 4.31 | 0.19 | 3.83 | 0.25 | 18.39 | 10.87 | 9.26 | 1.04 |
| N | 11 | 11 | 11 | 11 | 11 | 11 | 11 | 11 | |
| Guangxi | Mean | 4.97 | 0.17 | 5.38 | 0.39 | 15.17 | 9.99 | 8.47 | 0.16 |
| N | 11 | 11 | 11 | 11 | 11 | 11 | 11 | 11 | |
| Guizhou | Mean | 5.69 | 0.28 | 3.70 | 0.13 | 16.44 | 10.06 | 8.16 | 0.06 |
| N | 8 | 8 | 8 | 8 | 8 | 8 | 8 | 8 | |
| Hainan | Mean | 4.79 | 0.17 | 3.36 | 0.28 | 16.35 | 10.25 | 6.79 | 0.25 |
| N | 11 | 11 | 11 | 11 | 11 | 11 | 11 | 11 | |
| Hebei | Mean | 5.85 | 0.18 | 4.61 | 0.36 | 16.38 | 10.25 | 8.89 | 0.14 |
| N | 11 | 11 | 11 | 11 | 11 | 11 | 11 | 11 | |
| Heilongjiang | Mean | 5.49 | 0.19 | 1.43 | 0.33 | 15.65 | 10.27 | 8.25 | 0.18 |
| N | 8 | 8 | 8 | 8 | 8 | 8 | 8 | 8 | |
| Henan | Mean | 5.19 | 0.39 | 3.22 | 0.37 | 15.80 | 10.33 | 9.15 | 0.10 |
| N | 10 | 10 | 10 | 10 | 10 | 10 | 10 | 10 | |
| Hubei | Mean | 4.93 | 0.16 | 3.95 | 0.32 | 15.89 | 10.48 | 8.66 | 0.10 |
| N | 11 | 11 | 11 | 11 | 11 | 11 | 11 | 11 | |
| Hunan | Mean | 4.86 | 0.14 | 2.81 | 0.27 | 15.91 | 10.29 | 8.80 | 0.07 |
| N | 11 | 11 | 11 | 11 | 11 | 11 | 11 | 11 | |
| Inner Mongolia | Mean | 6.38 | 0.16 | 3.58 | 0.49 | 15.57 | 10.68 | 7.82 | 0.07 |
| N | 9 | 9 | 9 | 9 | 9 | 9 | 9 | 9 | |
| Jiangsu | Mean | 4.69 | 0.14 | 3.33 | 0.27 | 16.35 | 11.13 | 8.98 | 0.61 |
| N | 10 | 10 | 10 | 10 | 10 | 10 | 10 | 10 | |
| Jiangxi | Mean | 4.76 | 0.25 | 3.51 | 0.24 | 16.24 | 10.37 | 8.42 | 0.16 |
| N | 8 | 8 | 8 | 8 | 8 | 8 | 8 | 8 | |
| Jilin | Mean | 5.59 | 0.20 | 3.12 | 0.37 | 16.57 | 10.18 | 7.92 | 0.16 |
| N | 11 | 11 | 11 | 11 | 11 | 11 | 11 | 11 | |
| Liaoning | Mean | 5.56 | 0.21 | 2.94 | 0.31 | 17.02 | 10.58 | 8.38 | 0.35 |
| N | 10 | 10 | 10 | 10 | 10 | 10 | 10 | 10 | |
| Ningxia | Mean | 6.56 | 0.25 | 4.29 | 0.30 | 15.38 | 10.28 | 6.47 | 0.09 |
| N | 11 | 11 | 11 | 11 | 11 | 11 | 11 | 11 | |
| Qinghai | Mean | 5.64 | 0.36 | 3.88 | 0.38 | 17.57 | 10.24 | 6.36 | 0.05 |
| N | 9 | 9 | 9 | 9 | 9 | 9 | 9 | 9 | |
| Shaanxi | Mean | 5.48 | 0.15 | 3.58 | 0.20 | 15.12 | 10.33 | 8.23 | 0.09 |
| N | 12 | 12 | 12 | 12 | 12 | 12 | 12 | 12 | |
| Shandong | Mean | 5.31 | 0.20 | 3.82 | 0.44 | 16.45 | 10.70 | 9.18 | 0.34 |
| N | 10 | 10 | 10 | 10 | 10 | 10 | 10 | 10 | |
| Shanghai | Mean | 4.40 | 0.28 | 5.47 | 0.24 | 20.05 | 11.49 | 7.77 | 1.18 |
| N | 9 | 9 | 9 | 9 | 9 | 9 | 9 | 9 | |
| Shanxi | Mean | 6.44 | 0.32 | 9.00 | 0.35 | 17.05 | 10.29 | 8.19 | 0.09 |
| N | 10 | 10 | 10 | 10 | 10 | 10 | 10 | 10 | |
| Sichuan | Mean | 4.94 | 0.16 | 4.14 | 0.32 | 16.17 | 10.17 | 9.01 | 0.13 |
| N | 11 | 11 | 11 | 11 | 11 | 11 | 11 | 11 | |
| Tianjin | Mean | 5.01 | 0.34 | 4.25 | 0.21 | 17.06 | 11.03 | 7.25 | 0.77 |
| N | 10 | 10 | 10 | 10 | 10 | 10 | 10 | 10 | |
| Xinjiang | Mean | 5.92 | 0.23 | 3.76 | 0.31 | 17.10 | 10.36 | 7.73 | 0.20 |
| N | 10 | 10 | 10 | 10 | 10 | 10 | 10 | 10 | |
| Yunnan | Mean | 5.35 | 0.35 | 6.30 | 0.34 | 16.35 | 9.93 | 8.44 | 0.11 |
| N | 12 | 12 | 12 | 12 | 12 | 12 | 12 | 12 | |
| Zhejiang | Mean | 4.56 | 0.17 | 2.67 | 0.37 | 16.54 | 11.00 | 8.60 | 0.57 |
| N | 11 | 11 | 11 | 11 | 11 | 11 | 11 | 11 | |
| National | Mean | 5.21 | 0.23 | 3.91 | 0.31 | 16.67 | 10.49 | 8.20 | 0.31 |
| N | 306 | 306 | 306 | 306 | 306 | 306 | 306 | 306 |
Table 5.
Impact of experience, education and SOE on disclosure behavior.
| (1) | (2) | (3) | (4) | (5) | (6) | |
|---|---|---|---|---|---|---|
| Dependent Variable | CSR Total | Shareholder | Employee | Consumer | Environment | Public |
| F1 | −22.171 * | −0.431 | −16.237 ** | −1.675 | −2.673 | −1.155 |
| (−1.723) | (−0.263) | (−2.332) | (−0.659) | (−0.485) | (−0.577) | |
| F2 | 0.753 * | 0.023 | 0.363 | 0.061 | 0.233 | 0.072 |
| (1.911) | (0.400) | (1.617) | (0.471) | (1.606) | (0.791) | |
| F3 | −4.264 | 0.065 | −3.245 * | −0.628 | −0.314 | −0.142 |
| (−1.303) | (0.143) | (−1.726) | (−0.941) | (−0.201) | (−0.349) | |
| F4 | −7.579 | −0.677 | −4.755 | 0.388 | −1.919 | −0.617 |
| (−1.166) | (−0.734) | (−1.158) | (0.219) | (−0.695) | (−0.410) | |
| Size | 0.192 | 0.000 | −0.033 | −0.042 | 0.269 ** | −0.003 |
| (0.773) | (0.007) | (−0.214) | (−0.675) | (2.182) | (−0.079) | |
| Revenue | −0.544 | −0.038 | −0.317 | −0.004 | −0.138 | −0.048 |
| (−1.417) | (−0.567) | (−1.160) | (−0.057) | (−0.896) | (−0.953) | |
| Tax | 22.277 *** | 0.463 | 9.655 *** | 1.333 | 9.629 *** | 1.198 |
| (4.424) | (0.750) | (2.866) | (1.284) | (4.243) | (1.422) | |
| Cash | 0.512 | −0.012 | −1.057 | −0.156 | 1.125 | 0.613 |
| (0.160) | (−0.025) | (−0.404) | (−0.162) | (1.081) | (0.955) | |
| Profit | −0.100 | −0.003 | −0.026 | −0.021 | −0.030 | −0.020 |
| (−0.986) | (−0.214) | (−0.395) | (−0.665) | (−0.808) | (−0.769) | |
| Constant | −86.544 * | −2.518 | −57.126 ** | −3.823 | −18.248 | −4.830 |
| (−1.838) | (−0.425) | (−2.231) | (−0.397) | (−0.934) | (−0.592) | |
| Firm fixed effect | yes | yes | yes | yes | yes | yes |
| Year fixed effect | yes | yes | yes | yes | yes | yes |
| N | 4517 | 4517 | 4517 | 4517 | 4517 | 4517 |
| Within Model R2 | 0.035 | 0.015 | 0.026 | 0.014 | 0.031 | 0.027 |
Significance * 0.1, ** 0.05 and *** 0.01, t-statistics in parenthesis, Hausman test rejected, robust standard error used.
Table 6.
Impact of disclosure effort on disclosure behavior.
| (1) | (2) | (3) | (4) | (5) | (6) | |
|---|---|---|---|---|---|---|
| Dependent Variable | CSR Total | Shareholder | Employee | Consumer | Environment | Public |
| GRI | 1.888 *** | 0.121 *** | 0.930 *** | 0.132 | 0.576 *** | 0.130 *** |
| (5.663) | (3.050) | (4.272) | (1.554) | (4.630) | (3.239) | |
| Audit | 1.301 * | 0.085 | 0.797 ** | 0.070 | 0.423 | −0.075 |
| (1.669) | (1.022) | (2.094) | (0.280) | (1.600) | (−0.542) | |
| Mandate | 0.295 | −0.011 | 0.162 | 0.049 | 0.095 | 0.000 |
| (1.279) | (−0.300) | (1.098) | (0.994) | (0.876) | (0.008) | |
| Size | 0.292 | 0.012 | −0.011 | −0.022 | 0.273 ** | 0.041 |
| (1.226) | (0.357) | (−0.079) | (−0.454) | (2.436) | (1.432) | |
| Revenue | −0.379 | −0.015 | −0.195 | 0.050 | −0.223 | 0.003 |
| (−1.151) | (−0.307) | (−0.977) | (0.899) | (−1.380) | (0.092) | |
| Tax | 16.724 *** | −0.022 | 6.268 ** | 1.518 * | 8.063 *** | 0.897 |
| (3.869) | (−0.044) | (2.123) | (1.669) | (4.579) | (1.416) | |
| Cash | 1.540 | 0.094 | 0.232 | −0.761 | 1.019 | 0.956 |
| (0.600) | (0.243) | (0.127) | (−0.905) | (0.926) | (1.223) | |
| Profit | 0.012 | −0.010 | 0.022 | 0.007 | 0.001 | −0.007 |
| (0.118) | (−0.501) | (0.274) | (0.242) | (0.015) | (−0.326) | |
| Constant | −4.502 | −0.131 | 1.921 | 0.735 | −6.171 ** | −0.856 |
| (−0.841) | (−0.185) | (0.627) | (0.666) | (−2.412) | (−1.295) | |
| Firm fixed effect | yes | yes | yes | yes | yes | yes |
| Year fixed effect | yes | yes | yes | yes | yes | yes |
| N | 6295 | 6295 | 6295 | 6295 | 6295 | 6295 |
| Within Model R2 | 0.056 | 0.021 | 0.036 | 0.010 | 0.037 | 0.026 |
Significance * 0.1, ** 0.05 and *** 0.01, t-statistics in parenthesis, Hausman test rejected, robust standard error used.
Table 7.
Impact of CSR disclosure on carbon emissions.
| (1) | (2) | (3) | (4) | (5) | (6) | (7) | |
|---|---|---|---|---|---|---|---|
| Region | All | North | Northeast | East | South-Central | Southwest | Northwest |
| CSR Adoption | −0.526 *** | −0.245 | 0.421 | 0.152 | −0.047 | −0.927 ** | −0.704 ** |
| (−4.308) | (−0.696) | (1.021) | (1.198) | (−0.228) | (−2.397) | (−2.066) | |
| CSR Project | −0.002 | 0.005 | −0.006 | −0.006 | 0.021 *** | −0.010 | 0.005 |
| (−0.494) | (0.383) | (−0.473) | (−0.696) | (3.035) | (−0.615) | (0.473) | |
| CSR Environment | 0.067 | 0.006 | −0.037 | 0.019 | −0.001 | −0.122 | 0.006 |
| (1.417) | (0.035) | (−0.442) | (0.237) | (−0.007) | (−0.804) | (0.051) | |
| CSR Size | 0.007 | 0.009 | −0.009 | 0.001 | 0.018 | 0.045 | 0.036 |
| (0.647) | (0.308) | (−0.403) | (0.067) | (0.608) | (0.974) | (1.158) | |
| GDP per capita | −0.674 *** | −0.965 * | −1.268 ** | −0.780 *** | −0.468 * | −0.057 | −0.095 |
| (−6.860) | (−1.949) | (−3.220) | (−4.097) | (−1.960) | (−0.177) | (−0.191) | |
| Population | −0.465 | −1.524 ** | −4.501 | −3.079 *** | 0.655 | 2.823 | 3.503 ** |
| (−1.528) | (−2.617) | (−0.713) | (−3.694) | (0.895) | (1.242) | (2.477) | |
| Trade | 0.137 | 0.185 | −1.102 | 0.285 ** | 0.096 | −0.567 | −0.547 |
| (1.552) | (1.267) | (−1.274) | (2.378) | (0.622) | (−1.449) | (−0.946) | |
| Constant | 15.862 *** | 27.474 *** | 55.317 | 39.159 *** | 3.774 | −17.805 | −18.889 |
| (5.287) | (3.180) | (1.012) | (4.573) | (0.521) | (−0.934) | (−1.416) | |
| Province fixed effect | yes | yes | yes | yes | yes | yes | yes |
| Year fixed effect | yes | yes | yes | yes | yes | yes | yes |
| N | 306 | 51 | 29 | 72 | 65 | 41 | 48 |
| Within Model R2 | 0.868 | 0.944 | 0.995 | 0.978 | 0.966 | 0.990 | 0.832 |
Significance * 0.1, ** 0.05 and *** 0.01, t-statistics in parenthesis, Hausman test rejected, robust standard error used.
Publisher’s Note: MDPI stays neutral with regard to jurisdictional claims in published maps and institutional affiliations. |
© 2021 by the authors. Licensee MDPI, Basel, Switzerland. This article is an open access article distributed under the terms and conditions of the Creative Commons Attribution (CC BY) license (https://creativecommons.org/licenses/by/4.0/).
Share and Cite
MDPI and ACS Style
Li, S.; Cheng, W.; Li, J.; Shen, H. Corporate Social Responsibility Development and Climate Change: Regional Evidence of China. Sustainability 2021, 13, 11859. https://doi.org/10.3390/su132111859
AMA Style
Li S, Cheng W, Li J, Shen H. Corporate Social Responsibility Development and Climate Change: Regional Evidence of China. Sustainability. 2021; 13(21):11859. https://doi.org/10.3390/su132111859
Chicago/Turabian StyleLi, Shouhao, Weiquan Cheng, Jingjing Li, and Hao Shen. 2021. "Corporate Social Responsibility Development and Climate Change: Regional Evidence of China" Sustainability 13, no. 21: 11859. https://doi.org/10.3390/su132111859
Note that from the first issue of 2016, this journal uses article numbers instead of page numbers. See further details here.