
A Cross-Destination Analysis of Country Image: A Key Factor of Tourism Marketing


1
Department of Administration, Faculty of Administration and Economics, Universidad de Santiago de Chile, Santiago 9160000, Chile
2
Faculty of Economics and Business, Universidad Anáhuac México, Naucalpan de Juárez 52786, Mexico
*
Author to whom correspondence should be addressed.
Sustainability 2021, 13(17), 9529; https://doi.org/10.3390/su13179529
Submission received: 26 June 2021
/
Revised: 30 July 2021
/
Accepted: 18 August 2021
/
Published: 24 August 2021
(This article belongs to the Collection Advances in Marketing and Managing Tourism Destinations)
Abstract
:The purpose of this study is to check whether the image of a country can be configured by the interaction of cognitive and emotional experiences with the functional, hedonic, and symbolic benefits perceived by the visitor. It is intended to verify whether this multidimensional image facilitates the connection between people’s familiarity with the country, its reputation, and their satisfaction. A non-probabilistic convenience sample has been used. An online questionnaire has been applied. In total, 1812 valid answers have been obtained. Through a structural equations model (SEM), the quantitative analysis has been developed. This study revealed that the country’s image has a multidimensional configuration that positively connects people’s familiarity with a country with its reputation and with visitor satisfaction. This proposed new approach to configure the image of a country based on its visitors can be a key tool for implementing destination marketing strategies.
1. Introduction
The tourist industry is of global importance, creating approximately 120 million jobs annually [1] and contributing more than USD 2.7 billion to the world GDP. Despite the health crisis generated by COVID-19, this figure is projected to increase by more than USD 1 billion by the year 2029 [2]. In 2018 alone, 1.4 million people visited various countries around the world, generating a total of USD 1562 billion in inbound tourism revenue. Of these tourist trips, 15% were to Latin America and North America, contributing USD 338 billion to inbound revenue in these regions. According to the receptive tourism rankings for 2018, 5.7 million foreign tourists visited Chile, which generated approximately USD 3 billion in revenue. In the same period, 41.3 million foreign tourists traveled to Mexico, generating revenue of approximately USD 22.5 billion [1].
Tourism marketing is the systematic, consistent, and constant effort of destination marketing organizations (DOMs) to develop, formulate, and implement their strategies in order to make tourism an unforgettable experience for their visitors [3]. A destination country can be defined as a geographical region that is perceived by tourists as a single entity and that has a political and legislative framework that allows for the commercialization and planning of tourism [4] to be competitive [5] in the national and international tourism industry [6]. To be competitive, a country must be sufficiently desirable for tourists to select it as a destination, and, consequently, many factors influence this selection process [7]. Individuals respond not only to changes in a country’s image [8] but also to more structural changes that affect their perceptions [9]. Image is one of the principal factors that most affect tourists’ choice to visit a country [10]; since it affects an individual’s subjective perception and subsequent behavior [11], a country’s image can be a decisive factor for a foreign tourist when deciding to visit [12].
The magnitude of the role that a country’s image plays has been extensively reflected in the previous literature [13]; however, despite this in-depth discussion and analysis, image formation remains a critical analytical factor, which may be derived from impressions obtained from non-commercial sources (organic image) and marketing strategies (induced image) [14], or those obtained autonomously [15]. Evidence has indicated that a country’s image can be formed through cognitive, affective [16], and conative dimensions [17]; through its holistic attributes [18]; through the image attributes that can be viewed online [19]; and by factors such as accessibility, the environment, local support, opportunities for conferences, facilities, and other intangible factors [20].
As an increasing number of countries depend on tourism to generate jobs and income [21], and despite the lack of agreement regarding its composition, the international communication of a country’s image is a key factor for success. For example, Ireland’s image might positively or negatively influence French tourists’ decision-making process when evaluating whether to visit the country. The same pattern has been observed among foreign tourists who wish to enjoy the Canary Islands [22] and those who long to visit Thailand [23] or India [24].
A country’s image may be a consequence of its cognitive and affective image [25], [26], of the credibility of the source of information about it [27], the country’s physical and intangible attributes [28], of its brand awareness [29,30], of the joy and positive surprises the country offers [31], any perceived risks [32], or of attitudes towards ecological behaviors [33]. However, in another sense, this image may be an antecedent of an attachment to the country [34], a memorable tourist experience [35], support for tourism and the intention to recommended [36], loyalty to the country [37], and visit intention [38].
Given the effect of the Internet, social networks, and big data in the tourism industries [39], the divergence of views on the formation of country image has been widened and enriched, although a final agreement has not yet been reached. While the image from a neuropsychological perspective could be seen as the result of interdependence between emotion, cognition, and perception of the individual [40], there is, to date, little evidence that the interaction between cognitive and affective experiences and the benefits perceived by an individual has been considered as components of a country’s image. We try to fill this gap. In addition, this study explores the ability of a country’s image to connect familiarity with reputation and visitor satisfaction and aims to test whether a country’s reputation affects visitor satisfaction. Although there are many common factors between places, this alone is not enough for visitors to perceive their causes and effects in the same way [41]. Likewise, given visitors’ differing characteristics, it is impossible to ensure a consistent perception of a country [42]. Emerging economies such as Chile and Mexico, where economic growth depends on tourism [43], seem to be two suitable cases to verify the role of a country’s image.
2. Literature Review
2.1. Components of a Multidimensional Country Image
A country’s image plays a key role in the process of destination selection [42] and in visitors’ predicted behaviors [44]. An image can be defined as a perception or as the sum of the favorable or unfavorable beliefs, ideas, and impressions that a tourist has of a particular country [45]. This country image is a multidimensional concept [46], formed through cognitive and affective experiences in the place [47]. Cognitive experience is understood as the beliefs or knowledge that a person gains regarding the characteristics or attributes of a country’s image [48], while affective experience represents a tourist’s feelings toward a country [49]. The affective experience will be the result of the feelings that the attributes of the country generate in the visitor [50].
As abovementioned, image can be formed through cognitive, affective, and conative dimensions [51], and even combinations of structured and unstructured techniques have been used to capture the general attributes of a country’s image [52], which can be further defined as the perception of the benefits that it is expected a country can provide [53]. The marketing literature has classified these benefits into three different but complementary types—functional benefits, hedonic benefits, and symbolic benefits [54]—that translate into the benefits a visitor perceives they may obtain through their functional, hedonic, and symbolic experiences with the country’s image [55]. The perceived functional benefits can be defined as what a country offers through its characteristics and attributes according to the rational requirements of the visitor [56]. The perceived Hedonic benefits (visual attraction, distraction, escape), meanwhile, can be defined as the pleasant experiences a tourist obtains through multisensory stimuli and the fulfillment of their wishes in the country [57]. Finally, the perceived symbolic benefits can be understood as the visitor’s perception of the country’s social identity and self-concept [58]. With this in mind, this study hypothesized the following:
Hypothesis 1 (H1).
The image of the country is formed by the interaction of cognitive and emotional experiences with functional, hedonic, and symbolic benefits perceived by the visitor.
2.2. Image of the Country as a Consequence of the Visitor’s Familiarity with the Country
Country familiarity is one of the main elements of connection with the visitor [59], and previous findings from the specialized literature have shown that familiarity with an international country has positive effects on tourists’ beliefs and evaluations [60]. Familiarity with a country can positively impact tourists’ level of interest and the likelihood of revisiting the same country in the future [61]. Thus, familiarity could be considered as a dimension capable of influencing tourists’ choice of which country to visit [62].
Country familiarity can be a valuable element of segmentation [63] and aid the retention of visitors to the country [64]. Further, this attribute draws attention to a place due to the knowledge acquired by visitors from their previous experiences [65] and/or through different sources of information [66]. In sum, familiarity affects image [67]; therefore, this study suggested the following hypothesis:
Hypothesis 2 (H2).
The greater a visitor’s familiarity with a country, the better the image they perceive.
Chile and Mexico are emerging economies that depend on tourism. Therefore, for both countries it is not only important to know the effect of familiarity on the image, but it is also necessary to observe the intensity of this effect. From this perspective, the following hypothesis is proposed:
Hypothesis 2a (H2a).
The effect of country familiarity on country image will be constant in both Chile and Mexico.
2.3. Country Image as an Antecedent of Its Reputation and Visitor Satisfaction
The image of a country has been considered as a perceptual construct. The reputation of a country has been considered as a construct of representation The image and reputation of a country emerge in international environments [68]. The image on a subjective level and reputation as an emerging public evaluation here is a strong and positive link between image as a precedent for an organization’s reputation [69], and a destination`s image positively impacts its reputation [70]. The reputation can be defined as an objective and subjective evaluation carried out by the internal, peripheral, and external stakeholders of the tourist destination [71]. Image also has a positive effect on hotels’ corporate reputation [72], and the positive effect of image on reputation can be observed in the financial market [73], business management [74], organizational standpoints [75], and competitive network perspectives in various industrial sectors [76]. Accordingly, this study suggested the following:
Hypothesis 3 (H3).
The better a country’s image is, the better its reputation is.
Although, it is necessary to know if the image of Chile and Mexico affects their reputation, it is inevitable for both countries to know the intensity of this effect in order to seek alternatives for improvement if necessary. Given this context, the following hypothesis is proposed:
Hypothesis 3a (H3a).
The effect of country image on reputation will be constant in both Chile and Mexico.
The image of a destination has a positive influence on visitor satisfaction. This influence makes it possible to shape the expectations that visitors form before visiting the destination [77]. Satisfaction is the result of the evaluation of the different experiences of a tourist in the destination [78]. In a country, as a destination, the focus of services and relationships should be their effects on visitors’ long-term satisfaction [79], and a country’s image is considered to be a key antecedent of visitor satisfaction. The synergy of this relationship is clearly expressed when individuals visit international tourist destinations [80]; waterparks [77]; different provinces [81]; historical places [82,83]; cities [84]; tourist centers [80]; locations with sun, sea, and sand [85]; or islands [86]. In the same way, a company’s image has a positive impact on its consumers’ satisfaction [87]. For example, it has been shown that ecological brand image impacts green consumers’ satisfaction [88], while the image of a restaurant has been observed to also positively affect customer satisfaction [89]. Consequently, it is possible to hypothesize the following:
Hypothesis 4 (H4).
The better a country’s image is, the greater the visitor satisfaction is.
Visitor satisfaction is the core of a country that wants to be visited. In this sense, it is not only necessary to know if the image of Chile and Mexico affect this satisfaction, but it is also essential to observe the value of this effect in a specific way for both countries. From this point of view, the following hypothesis is proposed:
Hypothesis 4a (H4a).
The effect of country image on visitor satisfaction will be constant in both Chile and Mexico.
2.4. Country Reputation as an Antecedent of Visitor Satisfaction
The reputation of a destination reduces the level of risk in tourist decision-making by positively affecting their expectations before a visit. In this way, the reputation of a destination influences visitor satisfaction [90]. Country reputation has a direct and positive effect on visitor satisfaction [91]. In the same way, a hotel’s reputation [92] has a positive influence on its guests’ satisfaction, while a restaurant’s reputation positively affects consumers’ satisfaction [93]. Likewise, in the e-tail [94] and e-commerce [95] markets, the positive effect that a seller’s reputation has on consumers in different cultures has become increasingly important. Brand reputation is a key antecedent of consumer satisfaction [96], and employees’ perceptions of the external reputation of a company have a positive effect on their job satisfaction [97]. Given these antecedents, the following hypothesis was proposed:
Hypothesis 5 (H5).
The better a country’s reputation is, the greater the visitor satisfaction is.
Reputation is a sensitive element in selecting and visiting a country. Therefore, it is very important to verify the effect of the reputation of Chile and Mexico on the satisfaction of visitors and not only that, but it is also necessary to observe the value of this effect in both countries.
Hypothesis 5a (H5a).
The effect of country reputation on visitor satisfaction will be constant in both Chile and Mexico.
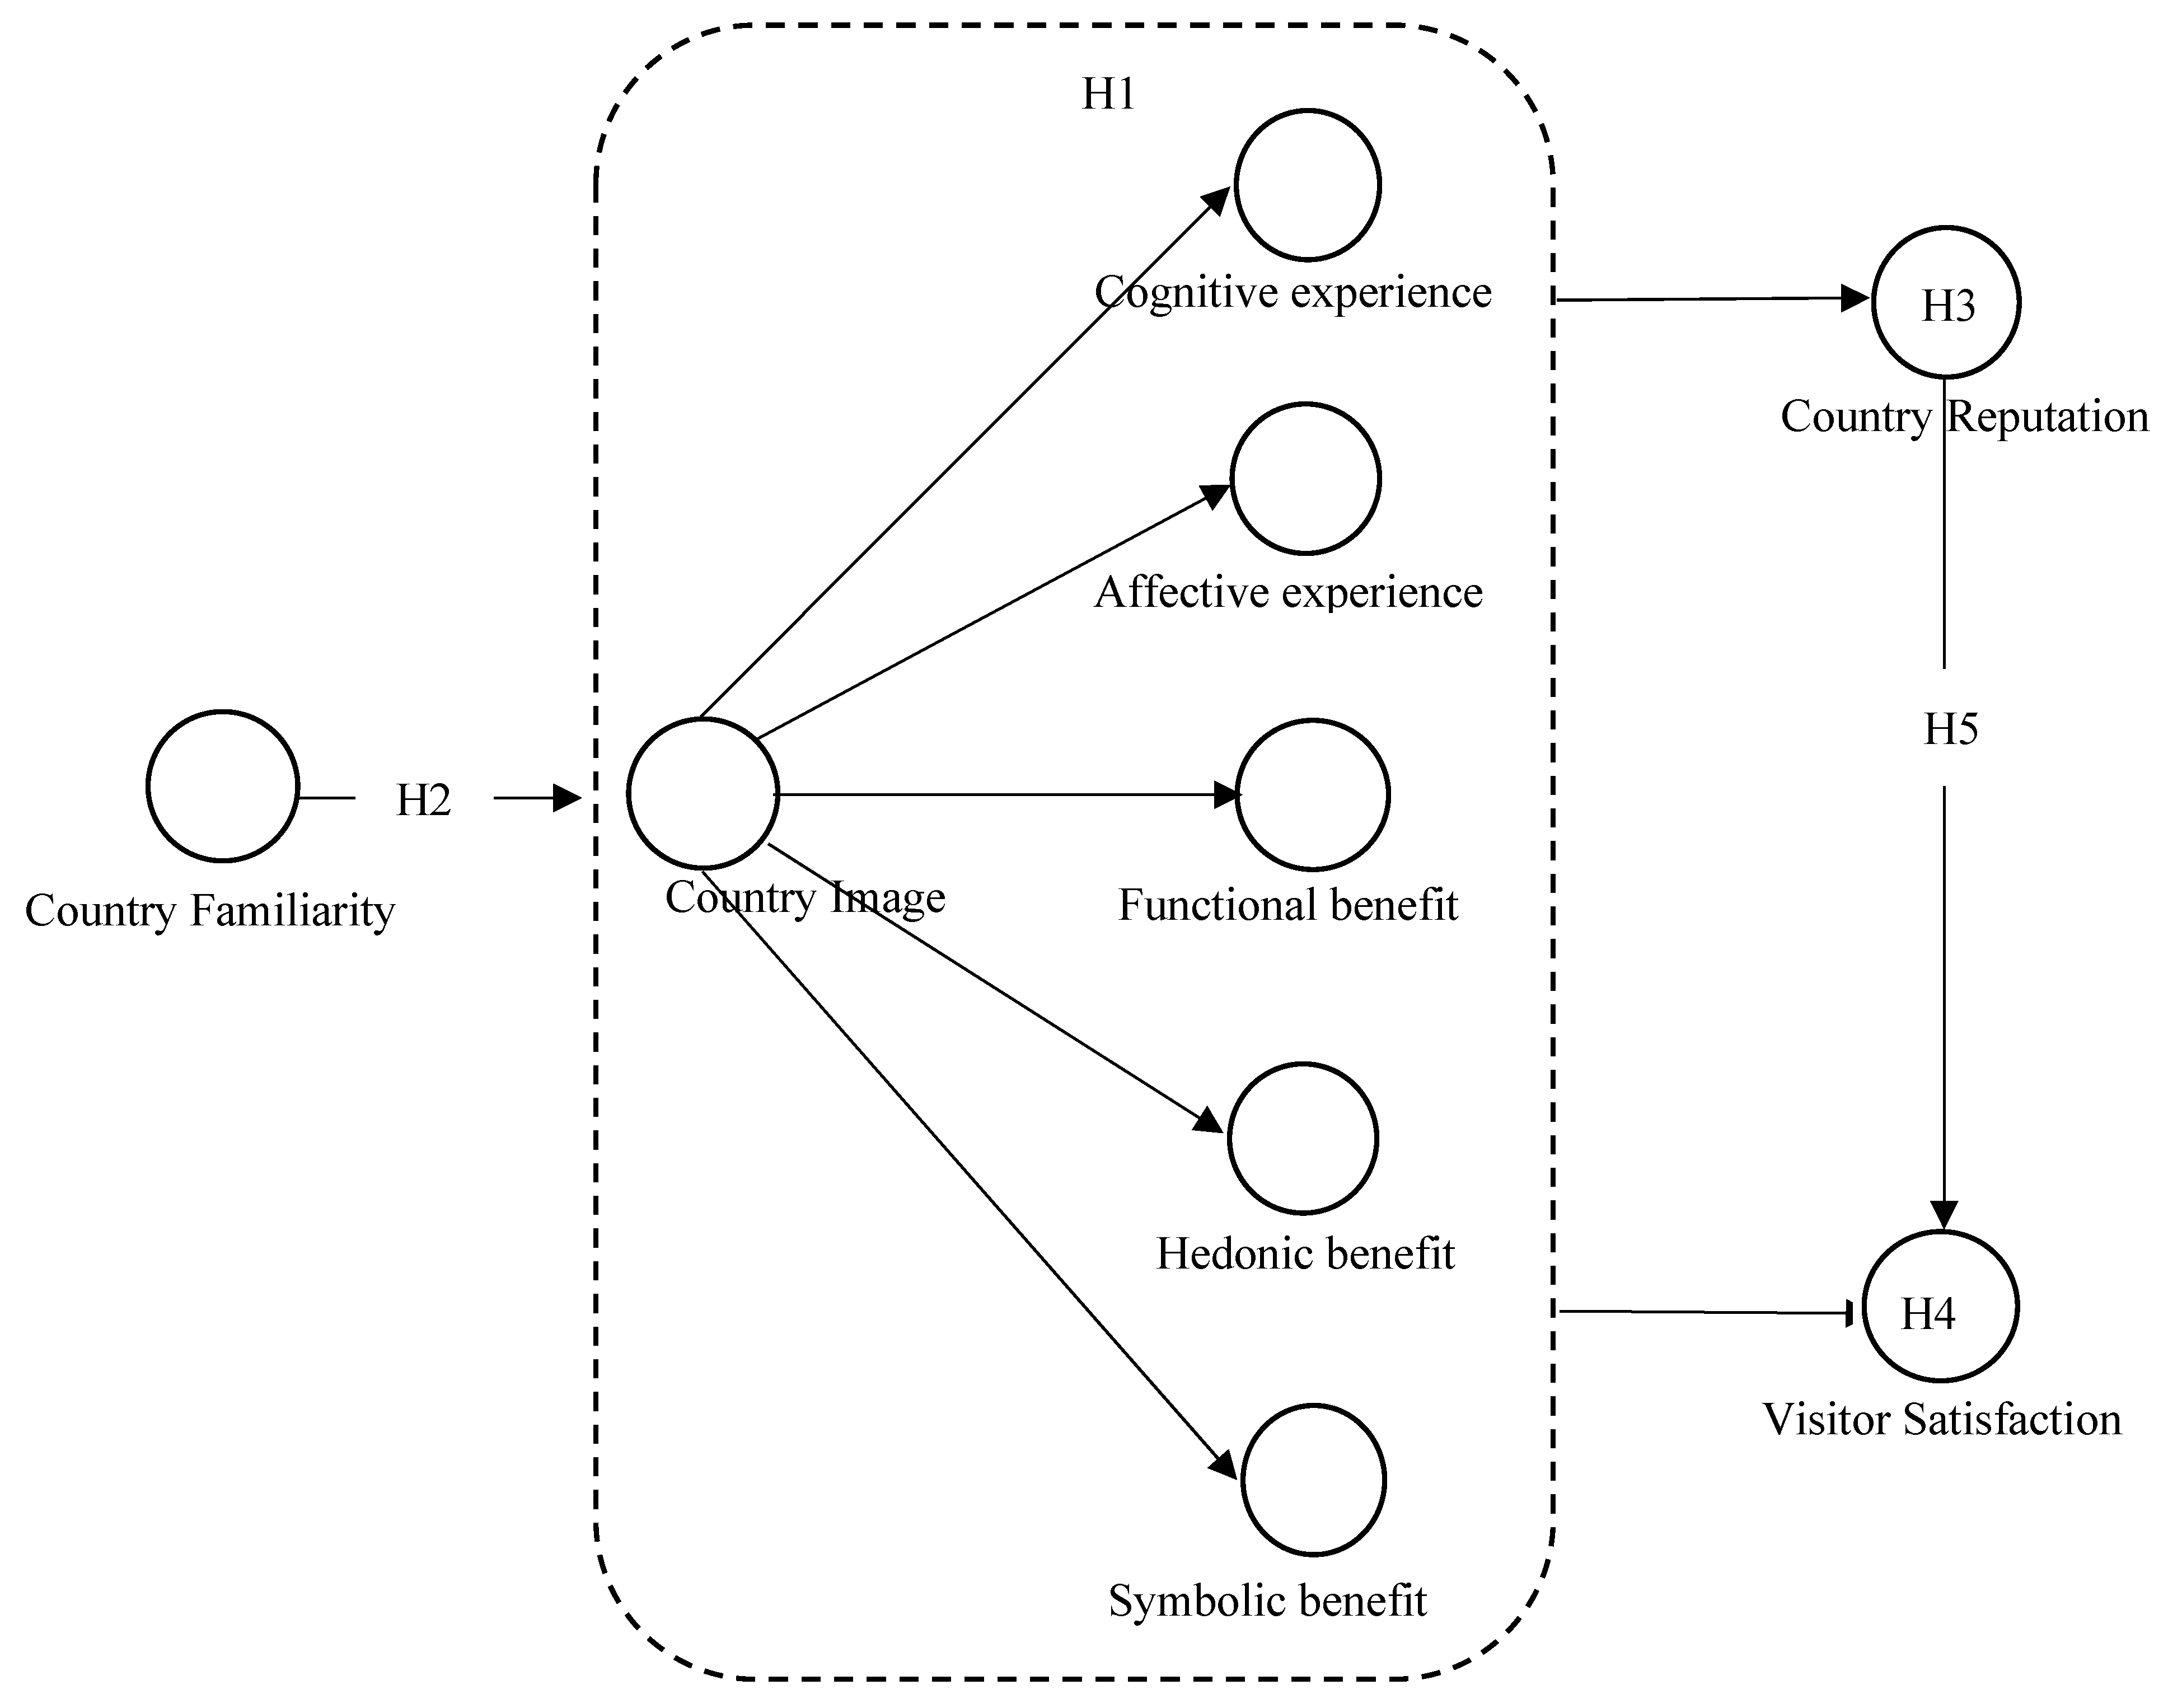
As shown in Figure 1 having broken down the theoretical framework and the underlying hypotheses, the following theoretical model of this study is proposed:
Schematically:
3. Materials and Methods
3.1. Data Collection
A non-probabilistic sample was used for this study [98], which surveyed foreign visitors over 18 years of age who had visited Chile and Mexico at least once in 2018 (see Table 1). Verification was made via open statements. The final survey was completed by a total of 1812 foreign visitors (899 to Chile and 913 to Mexico). The country of origin of the respondents being 89% from America and the Caribbean, 8% from Europe, 0.07% from Africa, 0.39% from the Middle East, 1.12% from Oceania, 1.24% from Asia, and 0.18% from other countries in the world. To avoid seasonal bias, data collection was conducted during the entire 12 months of 2018, according to the statistical proportions provided by the Tourism Services of Chile [99] and Mexico [100].
3.2. Instrument
Given the study’s international context, a questionnaire was prepared in Spanish and English. To refine the questionnaire to accurately reflect Spanish language idioms, the survey was initially applied to 100 final-year business school students in Chile and Mexico. Likewise, exchange students from different English-speaking countries were interviewed to inform the completion of the English language questionnaire. Both questionnaires were reviewed by bilingual university professors of English Pedagogy in Chile and Mexico, facilitating the standardization of each question. Final questionnaire and informed consent were validated by the Institutional Ethics Committee.
Scales from previous studies were used as a reference to construct the present study’s measurement scales, including those that measure country image [101,102], country reputation [103], country familiarity [104], and visitor satisfaction [105]. These scales were adapted through rigorous analysis, according to De Wulf and Odekerken-Schröder’s [106] recommendation.
A series of interviews were then conducted with both foreign visitors from different countries to Chile and Mexico and commercial executives from tourism agencies and tour operators from both countries. A modified version of the method by Zaichkowsky [107] was used for this analysis. Each participant was asked to rate each of the items with respect to their dimension, considering the following three alternatives: clearly representative, somewhat representative, or not representative. Those items in which there was a high level of consensus were retained [108]. The final scales and definitive questionnaire were then constructed. The items were written as affirmations, and participants were asked to respond via a 7-point Likert scale. Each question was written to ensure that it could be understood and answered by respondents who had visited either Chile or Mexico (see Table 2).
Finally, with this initial questionnaire, a quantitative pretest was carried out for both countries with a random sample of 50 people. Subsequently, exploratory factor analysis was performed on the data obtained through this pretest that calculated the Cronbach’s alpha for each of the resulting dimensions. Through this analysis, it was possible to ratify the presence of each of the dimensions that formed the questionnaire scales.
3.3. Data Analysis
Data analysis was performed using the statistical package IBM SPSS version 25. Structural equation modeling (SEM) was used to test the study’s theoretical hypotheses and complex variables.
4. Results
4.1. Evaluation of the Measurement Model
A psychometric analysis was performed to obtain scales with a good degree of dimensionality, reliability, and validity for the data. Confirmatory factor analysis (CFA) and several reliability analyses were conducted to determine Cronbach’s alpha, construct reliability, and extracted variance (AVE). An analysis of the principal components with varimax rotation was also performed to check if any components did not subscribe to their size [109]. All the indicators presented a quantity of one-dimensionality, with factor loads larger than 0.4 [9]; therefore, it was not necessary to eliminate any indicators from the scales evaluated (see Table 3).
Indicators with a weak convergence condition should be eliminated alongside the latent variables that they correspond to. In this case, a student t larger than 2.28 (p < 0.01) was necessary. Secondly, the variables with loads that translated into standardized coefficients smaller than 0.5 should be isolated. Finally, any indicator with a linear R2 ratio smaller than 0.3 should be eliminated. In this analysis, the first and second criteria of elimination and isolation were not applied because a strong convergence with the corresponding latent variables was noted (greater than a student t of 2.28). Likewise, in all the other cases, the standardized coefficients were greater than 0.5.
To check that cognitive experience and hedonic benefits were second-order variables, a rival model strategy was used [110], contrasting a first-order model with another second-order model. In these two cases, the second-order model showed a better match than the first (Table 4), corroborating the multidimensionality of the second order of both constructs. Thus, it was shown that cognitive experience and hedonic benefits were multidimensional factors. The interrelationship between the five dimensions (cognitive and affective experiences associated with the functional, hedonic, and symbolic benefits perceived by the visitor), comprising country image was then tested by analyzing the Pearson correlations, which were all positive with p values < 0.001.
Next, CFA was applied to the construction of cognitive evaluation and hedonic benefits, which included all their dimensions. Subsequently, the same process was conducted using the variables from the proposed theoretical model, including country image, country familiarity, country reputation, and visitor satisfaction. It was not necessary to eliminate any indicators in either case. Satisfactory adjustments were obtained for the country image model and the proposed final model. For the country image model: IFI 0.9; CFI 0.9; RMSEA 0.06; Normed χ2 8.9; p < 0.001, while for the proposed final model: IFI 0.9; CFI 0.9; RMSEA 0.05; Normed χ2 7.1; p < 0.001.
When the best model was found, every scale was evaluated for reliability using Cronbach’s alpha (limit 0.7), composite construct reliability (limit 0.7) [111] and AVE (limit 0.5) [112]. The data’s normality was evaluated via the observation of the univariate normality using asymmetry and kurtosis tests. The findings demonstrated that the absolute values of bias and kurtosis were smaller than two [7]. In sum, the findings demonstrated that the minimum values required by these reliability parameters were reached in all cases (Table 5).
To conclude these analyses, validity was confirmed including content and construct validity. All the scales had an optimal degree of content validity, resulting from the qualitative and quantitative process carried out [106].
This study included an analysis of critical incidents experienced by visitors to Chile and Mexico. The scales were refined via focus groups with these individuals, along with comprehensive interviews with tour operators and travel agency executives. To ensure the validity of the construct, a test was conducted to discover whether the suggested scale agreed with the convergent and discriminant validity. Convergent validity was confirmed through the standardized coefficients of the CFA, which were statistically significant at 0.01 and larger than 0.5 [113]. To confirm the discriminant validity, a confidence interval test was performed [114]. The confidence intervals resulting from the correlations between the different latent variables that comprised the country image CFA model were observed. In such a procedure, discriminant validity is confirmed when the value one is not contained in the confidence interval [115]. All the correlations observed in the present study met this criterion. The variation obtained between the χ2 statistic of the proposed CFA model was compared with the value of this statistic in identical alternative models. These models considered pairs of latent variables in order to determine their discriminant validity coefficient at one. As shown in Table 6, this procedure revealed that country image and the full model had discriminant validity, since the statistic χ2 of the obtained model was significantly less than for the other models [116].
4.2. Evaluation of Structural Model
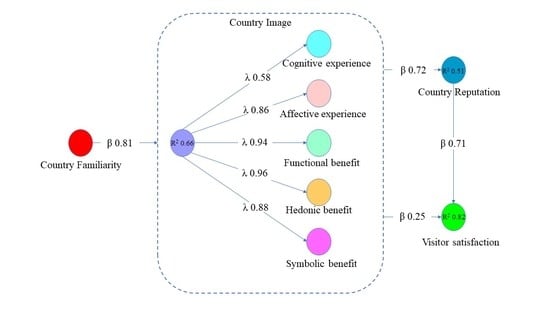
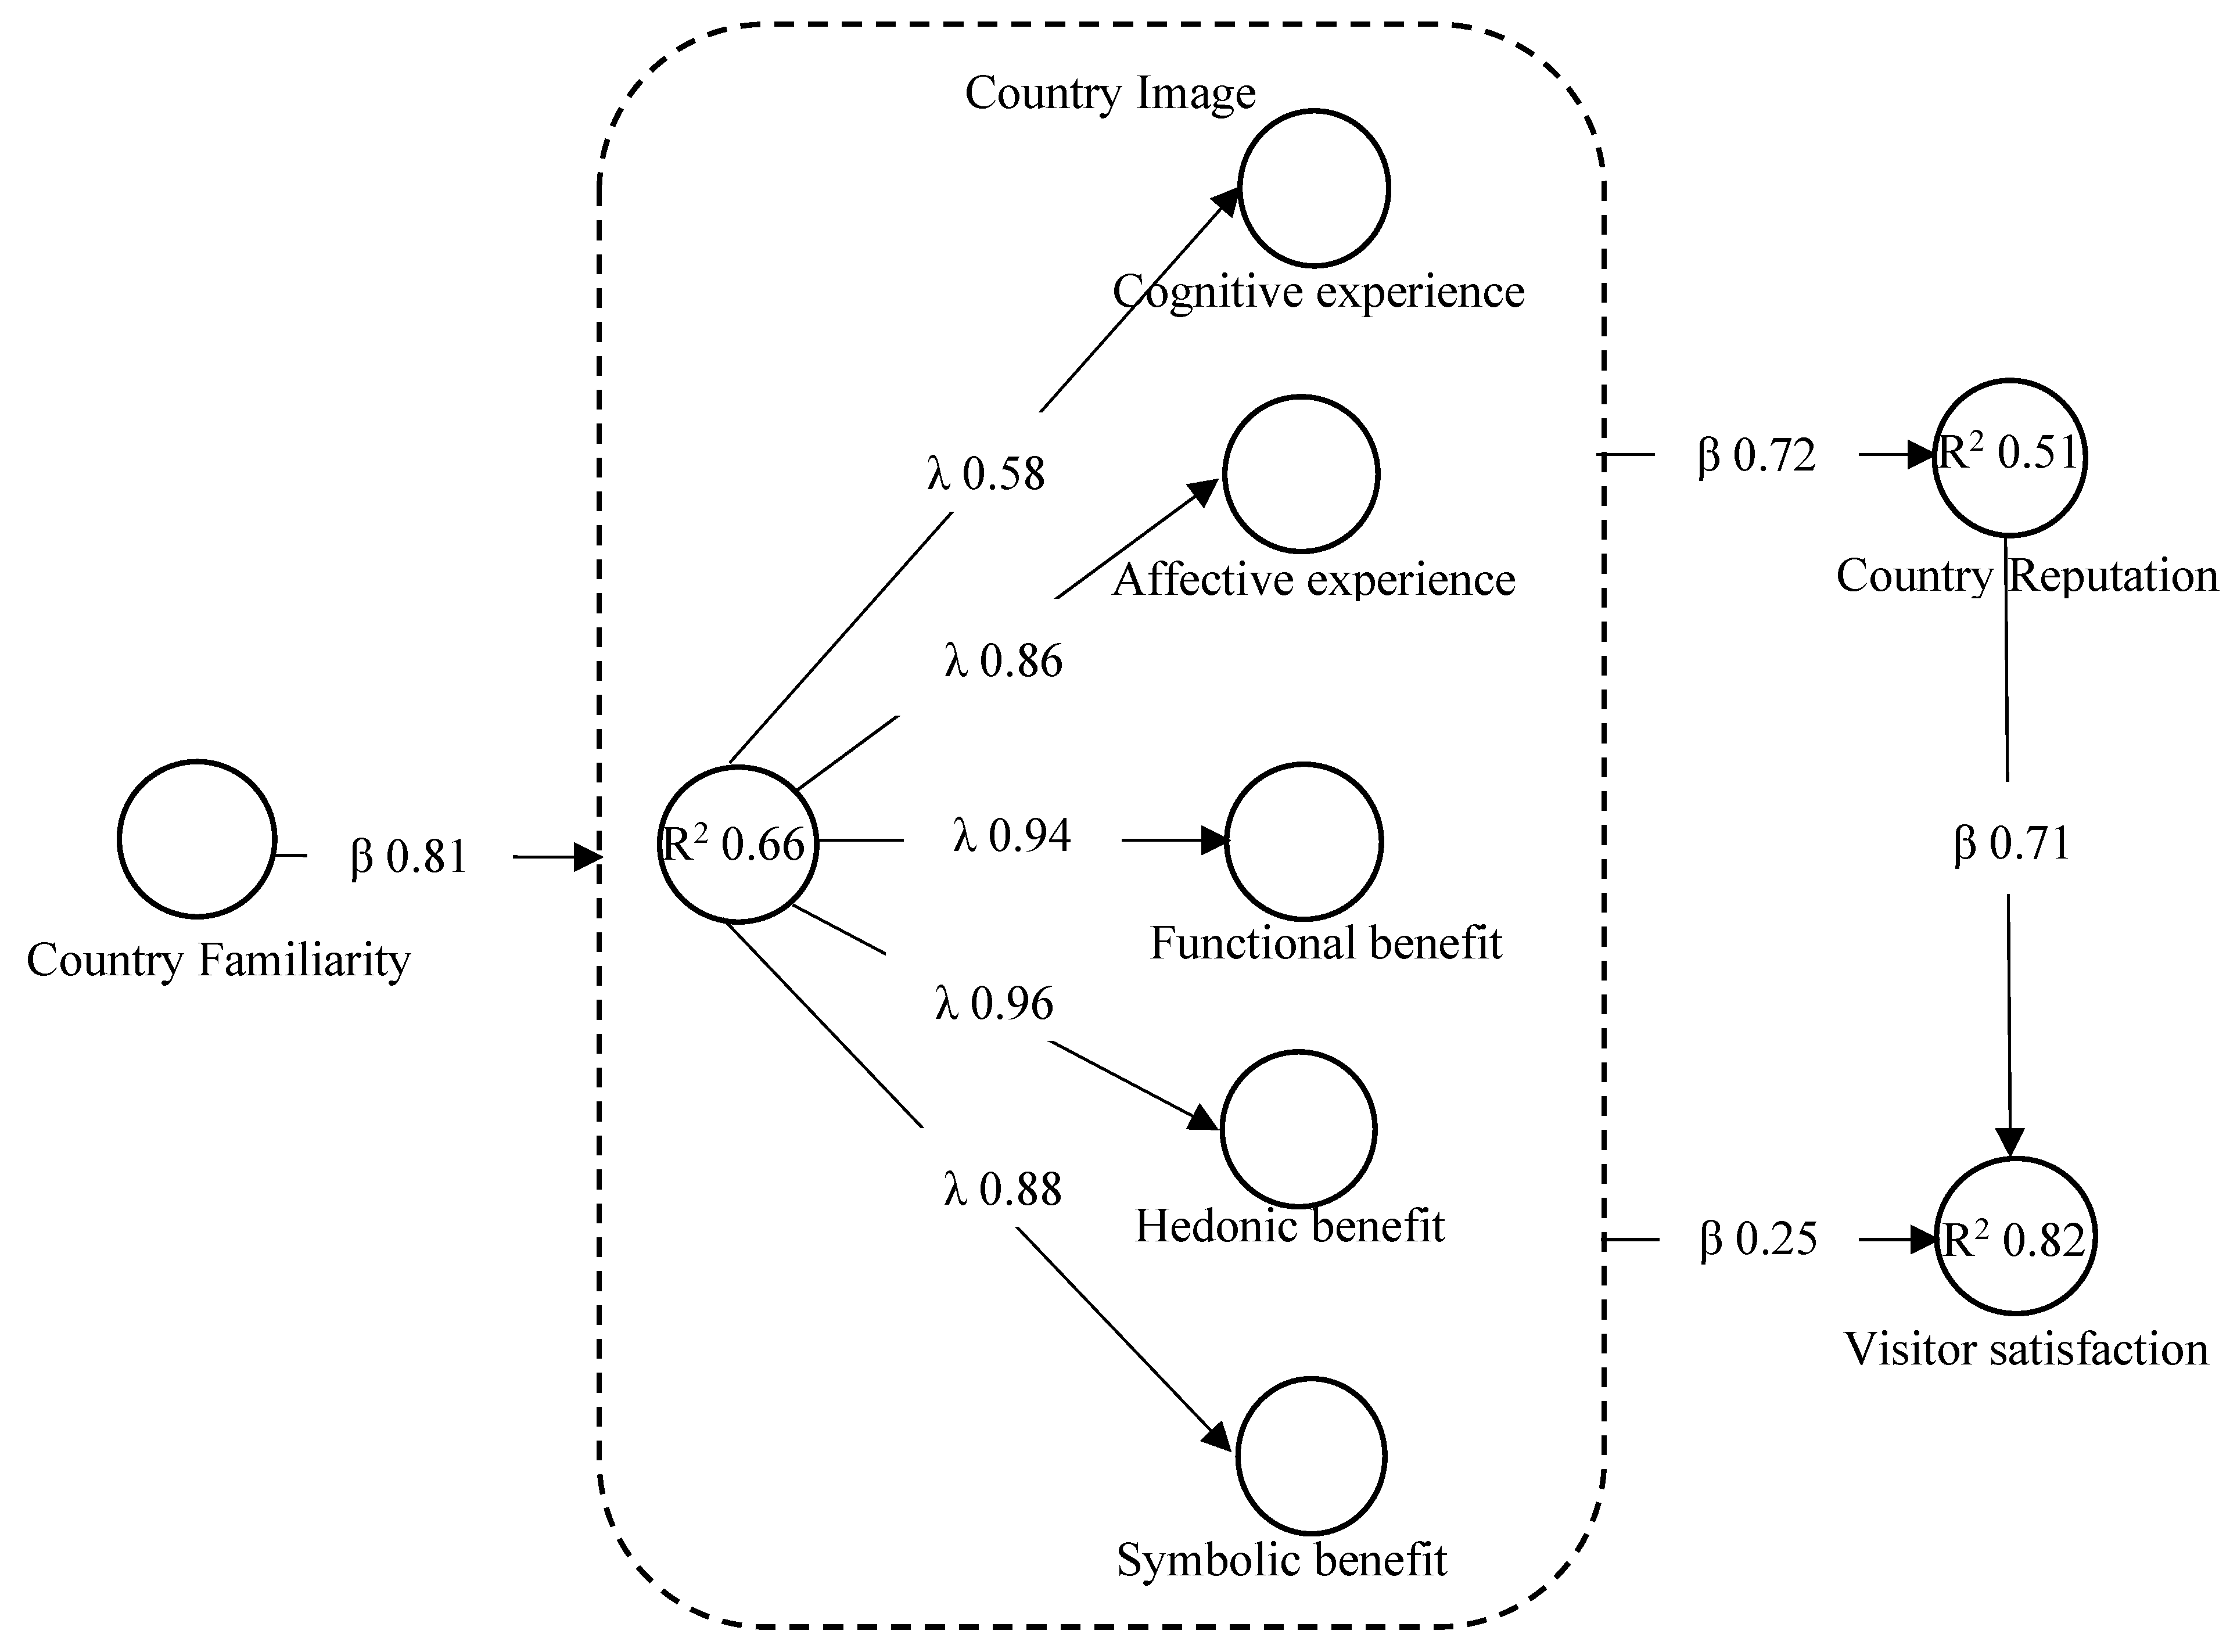
The adjustment of the structural model remained within the acceptable ranges [115]: IFI 0.91; CFI 0.91; RMSEA 0.065; Normed χ2 8.6; p < 0.001. As seen in Figure 2, the standardized β obtained showed that familiarity with a country had a direct and positive effect on the country’s image (β 0.81; R2 0.66; p < 0.001). Further, country image had a direct and positive effect on country reputation (β 0.72; R2 0.51; p < 0.001) and visitor satisfaction (β 0.25; R2 0.82; p < 0.001;). Country reputation also had a direct and positive effect on visitor satisfaction (β 0.71; R2 0.82; p < 0.001). Similarly, the standardized values of λ revealed that country image is composed of the cognitive evaluation (λ 0.58, p < 0.001), affective evaluation (λ 0.86, p < 0.001), functional benefits (λ 0.94, p < 0.001), symbolic benefits (λ 0.88, p < 0.001), and hedonic benefits perceived by the visitor (λ 0.96, p < 0.001).
As shown in Table 7, all five proposed hypotheses were validated.
4.3. Multigroup Analysis
Once the psychometric scales and subscales were verified, we commenced the equivalence analysis of measures between groups. From the optimal results observed, it was possible to make comparisons between the groups via the AMOS SPSS version 25 statistical package, which allowed the observation of the chi-square difference and the comparative adjustment index [117] between an unrestricted model (configurable invariance) (χ2 = 83.331; df = 4; CFI = 0.91; p < 0.001) and a restricted model (metric invariance) (χ2 = 562.0; df = 6; CFI = 0.91; p < 0.001) [118]. The observed indicators showed a good fit with the restricted model (metric invariance model), and the variation of the indices between the two models (Δχ2 = 478.7; Δdf = 2; p < 0.001) was statistically significant.
Given the observed values, it was possible to verify if differences existed at the level of each individual relationship proposed in the study’s four hypotheses [119]. A multigroup analysis between both groups was developed (Table 8). The first group comprised respondents who had visited Chile, while the second group comprised those who had visited Mexico. Subsequently, the value of χ2 was calculated for every relationship tested between both groups (scalar invariance). Next, to test the difference of χ2 [118], the calculated indicators were checked against the optimal reference value of χ2 = 89.97 (5) at a 99% confidence level (CL). Values over this threshold of χ2 were considered to be tangible evidence that there were important variations between the groups.
To observe the bias of Δχ2, given its sensitivity to sample size [117], a calculation of the critical proportion for both groups was conducted. If a critical relationship greater than ±1.96 was confirmed, it would be considered evidence that there were significant differences between both groups [119]. In the two tests, significant variations were observed in three of the four proposed relationships between the groups of respondents that had visited Chile and Mexico. For the relationship between the country familiarity and country image, the criteria of χ2 83.9 (5) were lower than the optimal threshold of χ2 89.97 (5), meeting the 99% confidence level. For the group that had visited Chile: β 0.71; p < 0.001, while for the group that had visited Mexico: β 0.73; p < 0.001 (H2a), meaning there was insufficient evidence in this relationship to declare significant differences between the groups [115]. The relationship between country image and country reputation, the criteria of χ2 101.1 (5) (higher than the optimal threshold of χ2 89.97 (5)) with a 99% confidence level were met. In this case, for the group of tourists that visited Chile: β 0.57; p < 0.001, and for the group that visited México: β 0.71; p < 0.001 (H3a); therefore, there was sufficient evidence to declare significant differences between the groups. For the relationship between country image and visitor satisfaction, the criteria of χ2 322.5 (5) (higher than the optimal threshold of χ2 89.97 (5)) with a 99% confidence level were met. In this case, for the group that visited Chile: β 0.57; p < 0.001, and for the group that visited México: β 0.12; p < 0.001 (H4a); thus, there was sufficient evidence to confirm significant differences between the groups. For the relationship between country reputation and visitor satisfaction, the criteria of χ2 542.6 (5) (higher than the optimal threshold of χ2 89.97 (5)) with a 99% confidence level were met. In this case, for the group that visited Chile: β 0.12; p < 0.001, and for the group that visited Mexico: β 0.80; p < 0.001 (H5a), providing sufficient evidence to declare significant differences between them. The multigroup data verification indicated that there were significant differences between the groups of visitors to Chile and Mexico in three out of the four hypotheses proposed by this study.
5. Discussion
This study demonstrated that country image is a mix of cognitive and affective experiences associated with the functional, hedonic, and symbolic benefits perceived by a visitor. Thus, we have validated hypothesis one.
This way, the characteristics of the facilities and the traditions of the place are key components in the creation of visitors’ cognitive experiences with a country. As such, a country must offer basic facilities such as airports, hotels, restaurants, hospitals, clinics, and shopping centers that are safe, varied, and comfortable. Moreover, a country’s individual traditions could provide staging for interesting cultural attractions (e.g., guided tours of Chichén Itza in Mexico), folklore experiences (e.g., visits to the Fiesta de La Tirana in Chile), or historical experiences (e.g., guided visits to San Juan de Ulúa in Mexico).
As has been shown, the affective evaluation of a country comprises people’s expressed feelings toward it. In the same way, achieving a positive affective experience, expressed, for example, through visitor happiness, is imperative for a country. It is no use establishing only a rational connection; rather, a strong emotional bond is required. It is here that a country’s inhabitants play a key role in creating this special feeling toward it. In this sense, every moment of interaction with the tourist should be guided toward the achievement of an emotional bond. The friendliness of the staff of hotels and restaurants could allow the circle of the emotional experience of the visitor to positively close.
The present study’s results showed that when selecting a destination, foreign visitors expect the country to provide what they are looking for. This characteristic of a place is a functional response to visitors’ requirements and is consistent with the findings of Byun and Jang [56]. For example, Chile is a functional country for visitors seeking adventure tourism. Mexico is a functional country for visitors seeking sun and beach tourism.
A country’s social identity and self-concept are further components of its image [58]. For instance, those belonging to Generation Z, considered to be the “intelligent age”, give more importance to the provision of information technologies, self-service, and personal reservation tools when choosing a country to visit. This is in contrast with Generation X, who generally only assess whether the country has an Internet connection to allow them to communicate through social networks [19]. As such, the symbolic benefit offered by the country affects the generational affinity of its visitors
Finally, the fifth component of a country’s image is its hedonic benefits. Here, the visual attractions of the place and its activity programming and provision, which provide individuals with distraction and an escape from their routine, play a key role in creating pleasant experiences. For example, visiting the Xcaret Entertainment Park in Mexico or visiting the Mamalluca Observatory in Chile will leave an unforgettable mark on the hedonic benefit perceived by visitors.
This new approach proposed for the configuration of the image of a country based on its visitors can be a key tool for implementing destination marketing strategies.
In addition, this multidimensional configuration of a country’s image makes it possible to positively connect familiarity with a country to its reputation and visitor satisfaction.
However, the image of the countries, thus formed, has succumbed to the dramatic effects of COVID-19 on the global tourism industry. In this new scenario, if Chile and Mexico do not consider a strict health protocol that prevents the spread of this lethal virus, the articulation and interaction of cognitive, affective experiences with the perceived functional, hedonic, and symbolic benefits are of no use.
It has been shown that the greater the familiarity of visitors with a country, the better the image they perceive. This is consistent with the profile of the sample used in our study. Of those surveyed in Chile and Mexico, 89% come from America and the Caribbean and have visited the country at least once in the last year. In addition to the geographic proximity, familiarity with both countries is based on the knowledge acquired by visitors from their previous experiences and/or through different sources of information [66]. According to these antecedents, hypothesis two has been validated.
The greater intensity of the effect of familiarity on the image of Mexico compared to Chile does not allow us to validate Hypothesis 2a. In other words, the effect of familiarity with the country on the country’s image is not constant, both in Chile and in Mexico.
It has been verified that the better the image of a country is, the better its reputation is. This finding is consistent with the arguments expressed by Minghetti and Celotto, 2015 [70]. Specifically, the image of Chile and Mexico formed by the interaction between cognitive and affective experiences and perceived functional, hedonic, and symbolic benefits, positively influence their reputation. In this way, hypothesis three was validated.
Given that a greater intensity of the effect of Mexico’s image on its reputation is observed compared to Chile, it is not possible to validate Hypothesis 3a. Thus, the effect of the country’s image on reputation will not be constant, both in Chile and in Mexico.
It has been found that the better the image of a country is, the greater the visitor’s satisfaction is. This finding is consistent with a study by Tang, 2014 [81]. In this sense, the image of Chile and Mexico formed by the interaction of cognitive and affective experiences with perceived functional, hedonic, and symbolic benefits positively impacts visitor satisfaction. Based on these antecedents, hypothesis four has been validated.
Due to the high intensity of the effect of Chile’s image on the satisfaction of its visitors in contrast to Mexico, it is not feasible to validate Hypothesis 4a. Therefore, the effect of the country’s image on visitor satisfaction will not be constant in either Chile or Mexico.
It has been proven that the better the reputation of a country is, the greater the visitor satisfaction is. This obtained result is consistent with the findings declared by Jin et al., 2008 [77]. In this regard, the reputation of Chile and Mexico have a direct and positive effect on the satisfaction of their visitors. Consequently, hypothesis five has been validated.
Due to the greater intensity of the effect of Mexico’s reputation on the satisfaction of its visitors compared to Chile, it is not possible to validate Hypothesis 5a. Therefore, the effect of the country’s reputation on visitor satisfaction will not be constant in either Chile or Mexico.
5.1. Practical Implications
This study has direct implications for decision-makers working in country image management in both public and private sector interest groups. The image of a country is a sensitive factor of choice for visitors. Even more so in this sanitary period. In this sense, it is necessary that the public and private stakeholders linked to the tourism industry in Chile and Mexico deploy a tourism marketing plan. Plan, whose sole purpose is to develop, formulate, and implement tourism strategies that allow creating unforgettable experiences for its visitors [3].
5.2. Limitations and Future Directions
Given the imminent consequences of COVID-19 in the image of countries, it is suggested that studies be carried out that allow us to observe the multidimensional image to choose a country through social networks.
Bear in mind that the image connects familiarity with the country with its reputation and with the satisfaction of visitors.
It is suggested that whether visitors share their experiences with destinations through social networks be investigated. This would allow us to know how social networks help people to become familiar with countries without the need to visit them.
Author Contributions
Conceptualization, E.M.-A. and K.B.-P.; methodology, E.M.-A.; formal analysis, E.M.-A.; data curation, E.M.-A. and K.B.-P.; writing—original draft preparation, E.M.-A. and K.B.-P.; writing—review and editing, E.M.-A.; supervision, E.M.-A. Both authors have read and agreed to the published version of the manuscript.
Funding
The authors disclosed receipt of the following financial support for the research, authorship, and/or publication of this article: This work was supported by The University of Santiago, Chile (USACH) (DICYT Project Code No. 031861MA).
Institutional Review Board Statement
The study was conducted according to the guidelines of the Declaration of Helsinki, and approved by the Institutional Review Board (or Ethics Committee) of Universidad de Santiago de Chile (protocol code N° 727; 17 November 2017).
Informed Consent Statement
Informed consent was obtained from all subjects involved in the study.
Data Availability Statement
The database used in this study is available at the request of the researchers. Please request by email: [email protected].
Acknowledgments
The University of Santiago, Chile (USACH). DICYT Project Code No. 031861MA.
Conflicts of Interest
The authors declare no potential conflicts of interest with respect to the research, authorship, and/or publication of this article.
References
- World Tourism Organization. Available online: https://www.unwto.org/global-and-regional-tourism-performance (accessed on 30 March 2019).
- STATISTA. Available online: https://es.statista.com/temas/3612/el-turismo-en-el-mundo/ (accessed on 30 April 2019).
- Soteriades, M. Tourism destination marketing: Approaches improving effectiveness and efficiency. J. Hosp. Tour. Technol. 2012, 3, 107–120. [Google Scholar] [CrossRef]
- Buhalis, D.; Spada, A. Destination management systems: Criteria for success–an exploratory research. Inf. Technol. Tour. 2000, 3, 41–58. [Google Scholar]
- Novais, M.A.; Ruhanen, L.; Arcodia, C. Destination competitiveness: A phenomenographic study. Tour. Manag. 2018, 64, 324–334. [Google Scholar] [CrossRef]
- Pike, S.; Page, S.J. Destination Marketing Organizations and destination marketing: A narrative analysis of the literature. Tour. Manag. 2014, 41, 202–227. [Google Scholar] [CrossRef] [Green Version]
- Hsu, C.L.; Lin, J.C.C. What drives purchase intention for paid mobile apps? An expectation confirmation model with perceived value. Electron. Commer. Res. Appl. 2015, 14, 46–57. [Google Scholar] [CrossRef]
- Pang, J.; Ding, Y. Blending package shape with the gender dimension of brand image: How and why? Int. J. Res. Mark. 2020, 38, 216–231. [Google Scholar] [CrossRef]
- Larwood, L.; Falbe, C.M.; Kriger, M.P.; Miesing, P. Structure and meaning of organizational vision. Acad. Manag. J. 1995, 38, 740–769. [Google Scholar]
- Phau, I.; Shanka, T.; Dhayan, N. Destination image and choice intention of university student travelers to Mauritius. Int. J. Contemp. Hosp. Manag. 2010, 22, 758–764. [Google Scholar] [CrossRef]
- Hui, T.K.; Wan, T.W.D. Singapore’s image as a tourist destination. Int. J. Tour. Res. 2003, 5, 305–313. [Google Scholar] [CrossRef]
- Choi, J.G.; Tkachenko, T.; Sil, S. On the destination image of Korea by Russian tourists. Tour. Manag. 2011, 32, 193–194. [Google Scholar] [CrossRef]
- Glückstad, F.K.; Schmidt, M.N.; Mørup, M. Testing a model of destination image formation: Application of Bayesian relational modelling and fs QCA. J. Bus. Res. 2020, 120, 351–363. [Google Scholar] [CrossRef]
- Almeida-García, F.; Domígunez-Azcue, J.; Mercadé-Melé, P.; Pérez-Tapia, G. Can a destination really change its image? The roles of information sources, motivations, and visits. Tour. Manag. Perspect. 2020, 34, 100662. [Google Scholar] [CrossRef]
- Llodrà-Riera, I.; Martínez-Ruiz, M.P.; Jiménez-Zarco, A.I.; Izquierdo-Yusta, A. A multidimensional analysis of the information sources constructs and its relevance for destination image formation. Tour. Manag. 2015, 48, 319–328. [Google Scholar] [CrossRef]
- Mano, A.; da Costa, R.A. A conceptual model of the antecedents and consequences of tourist destination image. Procedia Econ. Financ. 2015, 23, e22. [Google Scholar] [CrossRef] [Green Version]
- Loureiro, S.M.C.; Jesus, S. How perceived risk and animosity towards a destination may influence destination image and intention to revisit: Case Rio Janeiro. Anatolia 2019, 30, 497–512. [Google Scholar] [CrossRef]
- Jeng, C.R.; Snyder, A.T.; Chen, C.F. Importance–performance analysis as a strategic tool for tourism marketers: The case of Taiwan’s Destination Image. Tour. Hosp. Res. 2019, 19, 112–125. [Google Scholar] [CrossRef]
- Wang, X.; Li, X.R.; Zhen, F.; Zhang, J. How smart is your tourist attraction? Measuring tourist preferences of smart tourism attractions via a FCEM-AHP and IPA approach. Tour. Manag. 2016, 54, 309–320. [Google Scholar] [CrossRef]
- Jo, D.; Park, H.Y.; Choe, Y.; Kim, D.K. Destination-selection attributes for international association meetings: A mixed-methods study. J. Destin. Mark. Manag. 2019, 13, 61–72. [Google Scholar] [CrossRef]
- World Travel and Torurism Council. Available online: https://sp.wttc.org/ (accessed on 15 May 2019).
- Beerli, A.; Martin, J.D. Factors influencing destination image. Ann. Tour. Res. 2004, 31, 657–681. [Google Scholar] [CrossRef]
- Henkel, R.; Henkel, P.; Agrusa, W.; Agrusa, J.; Tanner, J. Thailand as a tourist destination: Perceptions of international visitors and Thai residents. Asia Pac. J. Tour. Res. 2006, 11, 269–287. [Google Scholar] [CrossRef]
- Chaudhary, M. India’s image as a tourist destination—A perspective of foreign tourists. Tour. Manag. 2000, 21, 293–297. [Google Scholar] [CrossRef]
- Kislali, H.; Kavaratzis, M.; Saren, M. Destination image formation: Towards a holistic approach. Int. J. Tour. Res. 2020, 22, 266–276. [Google Scholar] [CrossRef]
- Baloglu, S.; McCleary, K.W. A model of destination image formation. Ann. Tour. Res. 1999, 26, 868–897. [Google Scholar] [CrossRef]
- Veasna, S.; Wu, W.Y.; Huang, C.H. The impact of destination source credibility on destination satisfaction: The mediating effects of destination attachment and destination image. Tour. Manag. 2013, 36, 511–526. [Google Scholar] [CrossRef]
- Eid, R.; El-Kassrawy, Y.A.; Agag, G. Integrating destination attributes, political (in) stability, destination image, tourist satisfaction, and intention to recommend: A study of UAE. J. Hosp. Tour. Res. 2019, 43, 839–866. [Google Scholar] [CrossRef]
- Kaushal, V.; Sharma, S.; Reddy, G.M. A structural analysis of destination brand equity in mountainous tourism destination in northern India. Tour. Hosp. Res. 2019, 19, 452–464. [Google Scholar] [CrossRef]
- Stepchenkova, S.; Xiang, R.L. Destination image: Do top-of-mind associations say it all? Ann. Tour. Res. 2014, 45, 46–62. [Google Scholar] [CrossRef]
- Prayag, G.; Hosany, S.; Muskat, B.; Del Chiappa, G. Understanding the relationships between tourists’ emotional experiences, perceived overall image, satisfaction, and intention to recommend. J. Travel Res. 2017, 56, 41–54. [Google Scholar] [CrossRef] [Green Version]
- Khasawneh, M.S.; Alfandi, A.M. Determining behaviour intentions from the overall destination image and risk perception. Tour. Hosp. Manag. 2019, 25, 355–375. [Google Scholar] [CrossRef]
- Han, H.; Hsu, L.T.J.; Lee, J.S. Empirical investigation of the roles of attitudes toward green behaviors, overall image, gender, and age in hotel customers’ eco-friendly decision-making process. Int. J. Hosp. Manag. 2009, 28, 519–528. [Google Scholar] [CrossRef]
- Kani, Y.; Aziz, Y.A.; Sambasivan, M.; Bojei, J. Antecedents and outcomes of destination image of Malaysia. J. Hosp. Tour. Manag. 2017, 32, 89–98. [Google Scholar] [CrossRef]
- Ernawadi, Y.; Putra, H.T. Antecedents and consequences of memorable tourism experience. Dinasti Int. J. Manag. Sci. 2020, 1, 676–684. [Google Scholar] [CrossRef]
- Stylidis, D. Using Destination Image and Place Attachment to Explore Support for Tourism Development: The Case of Tourism Versus Non-Tourism Employees in EILAT. J. Hosp. Tour. Res. 2020, 44, 951–973. [Google Scholar] [CrossRef]
- Ragb, H.; Mahrous, A.A.; Ghoneim, A. A proposed measurement scale for mixed-images destinations and its interrelationships with destination loyalty and travel experience. Tour. Manag. Perspect. 2020, 35, 100677. [Google Scholar] [CrossRef]
- Camprubí, R.; Guia, J.; Comas, J. The new role of tourists in destination image formation. Curr. Issues Tour. 2013, 16, 203–209. [Google Scholar] [CrossRef]
- Smith, E.E.; Kosslyn, S.M. Cognitive processes. In Neural Models and Bases, 1st ed.; Pearson Prentice Hall: Madrid, Spain, 2018. [Google Scholar]
- Lian, T.; Yu, C. Impacts of online images of a tourist destination on tourist travel decision. Tour. Geogr. 2019, 21, 635–664. [Google Scholar] [CrossRef]
- Lu, C.Y.; Dean, D.; Suhartanto, D.; Hussein, A.S.; Suwatno, K.L.; Gunawan, A.I. Predicting Tourist Loyalty toward Cultural Creative Attractions the Moderating Role of Demographic Factors. J. Qual. Assur. Hosp. Tour. 2020, 22, 293–311. [Google Scholar] [CrossRef]
- Rittichainuwat, B.N.; Qu, H.; Brown, T.J. Thailand’s international travel image: Mostly favorable. Cornell Hotel. Restaur. Adm. Q. 2001, 42, 82–95. [Google Scholar] [CrossRef]
- Sokhanvar, A.; Çiftçioğlu, S.; Javid, E. Another look at tourism-economic development nexus. Tour. Manag. Perspectives 2018, 26, 97–106. [Google Scholar] [CrossRef]
- Tasci, A.D.A.; Gartner, W.C. Destination image and its functional relationships. J. Travel Res. 2007, 45, 413–425. [Google Scholar] [CrossRef]
- Gallarza, M.G.; Saura, I.G.; García, H.C. Destination image: Towards a conceptual framework. Ann. Tour. Res. 2002, 29, 56–78. [Google Scholar] [CrossRef]
- Marcussen, C. Multidimensional scaling in tourism literature. Tour. Manag. Perspect. 2014, 12, 31–40. [Google Scholar] [CrossRef]
- Greaves, N.; Skinner, H. The importance of destination image analysis to UK rural tourism. Mark. Intell. Plan. 2010, 28, 486–507. [Google Scholar] [CrossRef]
- Afshardoost, M.; Eshaghi, M.S. Destination image and tourist behavioral intentions: A meta-analysis. Tour. Manag. 2020, 81, 104154. [Google Scholar] [CrossRef]
- Akgün, A.E.; Senturk, H.A.; Keskin, H.; Onal, I. The relationships among nostalgic emotion, destination images and tourist behaviors: An empirical study of Istanbul. J. Destin. Mark. Manag. 2020, 16, 100355. [Google Scholar] [CrossRef]
- Gao, J.; Kerstetter, D.L. From sad to happy to happier: Emotion regulation strategies used during a vacation. Ann. Tour. Res. 2018, 69, 1–14. [Google Scholar] [CrossRef]
- Pike, S.; Ryan, C. Destination positioning analysis through a comparison of cognitive, affective, and conative perceptions. J. Travel Res. 2004, 42, 333–342. [Google Scholar] [CrossRef] [Green Version]
- Chi, C.G.Q.; Qu, H. Examining the structural relationships of destination image, tourist satisfaction and destination loyalty: An integrated approach. Tour. Manag. 2008, 29, 624–636. [Google Scholar] [CrossRef]
- Tapachai, N.; Waryszak, R. An examination of the role of beneficial image in tourist destination selection. J. Travel Res. 2000, 39, 37–44. [Google Scholar] [CrossRef]
- Keller, K.L. Conceptualizing, measuring, and managing customer-based brand equity. J. Mark. 1993, 57, 1–22. [Google Scholar] [CrossRef]
- Hanna, S.; Rowley, J. Towards a strategic place brand-management model. J. Mark. Manag. 2011, 27, 458–476. [Google Scholar] [CrossRef]
- Byun, J.; Jang, S.S. Effective destination advertising: Matching effect between advertising language and destination type. Tour. Manag. 2015, 50, 31–40. [Google Scholar] [CrossRef]
- Strzelecka, M.; Nisbett, G.S.; Woosnam, K.M. The hedonic nature of conservation volunteer travel. Tour. Manag. 2017, 63, 417–425. [Google Scholar] [CrossRef]
- Ekinci, Y.; Sirakaya-Turk, E.; Preciado, S. Symbolic consumption of tourism destination brands. J. Bus. Res. 2013, 66, 711–718. [Google Scholar] [CrossRef]
- Hammitt, W.E.; Kyle, G.T.; Oh, C.O. Comparison of place bonding models in recreation resource management. J. Leis. Res. 2009, 41, 57–72. [Google Scholar] [CrossRef]
- Chen, C.C.; Chung, J.Y.; Gao, J.; Lin, Y.H. Destination familiarity and favourability in a country-image context: Examining Taiwanese travelers’ perceptions of China. J. Travel Tour. Mark. 2017, 34, 1211–1223. [Google Scholar] [CrossRef]
- Ko, D.-W.; Park, S.-H. Five Aspects of Tourism Image: A Review. Int. J. Tour. Sci. 2000, 1, 79–92. [Google Scholar] [CrossRef]
- Lee, G.; Tussyadiah, I.P. Exploring Familiarity and Destination Choice in International Tourism. Asia Pac. J. Tour. Res. 2012, 17, 133–145. [Google Scholar] [CrossRef]
- Chen, C.C.; Lin, Y.H. Segmenting mainland Chinese tourists to Taiwan by destination familiarity: A factor-cluster approach. Int. J. Tour. Res. 2012, 14, 339–352. [Google Scholar] [CrossRef]
- Prentice, R. Tourist familiarity and imagery. Ann. Tour. Res. 2004, 31, 923–945. [Google Scholar] [CrossRef]
- Gursoy, D.; Del, C.G.; Zhang, Y. Impact of destination familiarity on external information source selection process. J. Destin. Mark. Manag. 2018, 8, 137–146. [Google Scholar] [CrossRef]
- Kerstetter, D.; Cho, M.H. Prior knowledge, credibility, and information search. Ann. Tour. Res. 2004, 31, 961–985. [Google Scholar] [CrossRef]
- Elliot, S.; Papadopoulos, N.; Kim, S.S. An integrative model of place image: Exploring relationships between destination, product, and country images. J. Travel Res. 2011, 50, 520–534. [Google Scholar] [CrossRef]
- Buhmann, A.; Ingenhoff, D.; White, C.; Kiousis, S. Charting the Landscape in Research on Country Image, Reputation, Brand, and Identity: A Transdisciplinary Overview. In Bridging Disciplinary Perspectives of Country Image, Reputation, Brand, and Identity, 1st ed.; Routledge: London, UK, 2018; pp. 1–10. [Google Scholar]
- Lewellyn, P.G. Corporate reputation: Focusing the zeitgeist. Bus. Soc. 2002, 41, 446–455. [Google Scholar] [CrossRef]
- Minghetti, V.; Celotto, E. Destination Web reputation: Combining explicit and implicit popularity to build an integrated monitoring system. E-Rev. Tour. Res. 2015, 6, 1–5. [Google Scholar]
- Darwish, A.; Burns, P. Tourist destination reputation: An empirical definition. Tour. Recreat. Res. 2019, 44, 153–162. [Google Scholar] [CrossRef]
- Christou, E. Guest loyalty likelihood in relation to hotels’ corporate image and reputation: A study of three countries in Europe. J. Hosp. Leis. Mark. 2003, 10, 85–99. [Google Scholar] [CrossRef] [Green Version]
- Foroudi, P.; Melewar, T.C.; Gupta, S. Linking corporate logo, corporate image, and reputation: An examination of consumer perceptions in the financial setting. J. Bus. Res. 2014, 67, 2269–2281. [Google Scholar] [CrossRef]
- Barnett, M.L.; Jermier, J.M.; Lafferty, B.A. Corporate reputation: The definitional landscape. Corp. Reput. Rev. 2006, 9, 26–38. [Google Scholar] [CrossRef]
- Fillis, I. Image, reputation and identity issues in the arts and crafts organization. Corp. Reput. Rev. 2003, 6, 239–251. [Google Scholar] [CrossRef]
- Christopher, M.; Gaudenzi, B. Exploiting knowledge across networks through reputation management. Ind. Mark. Manag. 2009, 38, 191–197. [Google Scholar] [CrossRef] [Green Version]
- Jin, N.; Lee, S.; Lee, H. The effect of experience quality on perceived value, satisfaction, image and behavioral intention of water park patrons: New versus repeat visitors. Int. J. Tour. Res. 2015, 17, 82–95. [Google Scholar] [CrossRef]
- Prayag, G. Image, satisfaction and loyalty—The case of Cape Town. Anatolia 2008, 19, 205–224. [Google Scholar] [CrossRef]
- Rust, R.T. The future of marketing. Int. J. Res. Mark. 2020, 37, 15–26. [Google Scholar] [CrossRef]
- Bigne, J.E.; Sanchez, M.I.; Sanchez, J. Tourism image, evaluation variables and after purchase behaviour: Inter-relationship. Tour. Manag. 2001, 22, 607–616. [Google Scholar] [CrossRef]
- Tang, Y. Travel motivation, destination image and visitor satisfaction of international tourists after the 2008 Wenchuan earthquake: A structural modelling approach. Asia Pac. J. Tour. Res. 2014, 19, 1260–1277. [Google Scholar] [CrossRef]
- Chi, C.G.Q. Destination loyalty formation and travelers’ demographic characteristics: A multiple group analysis approach. J. Hosp. Tour. Res. 2011, 35, 191–212. [Google Scholar] [CrossRef]
- Raimkulov, M.; Juraturgunov, H.; Ahn, Y.J. Destination attractiveness and memorable travel experiences in silk road tourism in Uzbekistan. Sustainability 2021, 13, 2252. [Google Scholar] [CrossRef]
- Bhat, S.A.; Darzi, M.A. Antecedents of tourist loyalty to tourist destinations: A mediated-moderation study. Int. J. Tour. Cities 2018, 4, 261–278. [Google Scholar] [CrossRef]
- Assaker, G.; Vinzi, V.E.; O’Connor, P. Examining the effect of novelty seeking, satisfaction, and destination image on tourists’ return pattern: A two factor, non-linear latent growth model. Tour. Manag. 2011, 32, 890–901. [Google Scholar] [CrossRef]
- Song, Z.; Su, X.; Li, L. The indirect effects of destination image on destination loyalty intention through tourist satisfaction and perceived value: The bootstrap approach. J. Travel Tour. Mark. 2013, 30, 386–409. [Google Scholar] [CrossRef]
- Lai, F.; Griffin, M.; Babin, B.J. How quality, value, image, and satisfaction create loyalty at a Chinese telecom. J. Bus. Res. 2009, 62, 980–986. [Google Scholar] [CrossRef]
- Chen, Y.S. The drivers of green brand equity: Green brand image, green satisfaction, and green trust. J. Bus. Ethics 2010, 93, 307–319. [Google Scholar] [CrossRef]
- Ryu, K.; Han, H.; Kim, T.H. The relationships among overall quick-casual restaurant image, perceived value, customer satisfaction, and behavioral intentions. Int. J. Hosp. Manag. 2008, 27, 459–469. [Google Scholar] [CrossRef]
- Su, L.; Swanson, S.R.; Chen, X. Reputation, subjective well-being, and environmental responsibility: The role of satisfaction and identification. J. Sustain. Tour. 2018, 26, 1344–1361. [Google Scholar] [CrossRef]
- Wu, H.-C.; Cheng, C.-C.; Ai, C.-H. A study of experiential quality, experiential value, trust, corporate reputation, experiential satisfaction and behavioral intentions for cruise tourists: The case of Hong Kong. Tour. Manag. 2018, 66, 200–220. [Google Scholar] [CrossRef]
- Su, L.; Swanson, S.R.; Chinchanachokchai, S.; Hsu, M.K.; Chen, X. Reputation and intentions: The role of satisfaction, identification, and commitment. J. Bus. Res. 2016, 69, 3261–3269. [Google Scholar] [CrossRef]
- Chang, K.C. How reputation creates loyalty in the restaurant sector. Int. J. Contemp. Hosp. Manag. 2013, 25, 536–557. [Google Scholar] [CrossRef]
- Jin, B.; Yong Park, J.; Kim, J. Cross-cultural examination of the relationships among firm reputation, e-satisfaction, e-trust, and e-loyalty. Int. Mark. Rev. 2008, 25, 324–337. [Google Scholar] [CrossRef]
- Shiau, W.L.; Luo, M.M. Factors affecting online group buying intention and satisfaction: A social exchange theory perspective. Comput. Hum. Behav. 2012, 28, 2431–2444. [Google Scholar] [CrossRef]
- Sengupta, A.S.; Balaji, M.S.; Krishnan, B.C. How customers cope with service failure? A study of brand reputation and customer satisfaction. J. Bus. Res. 2015, 68, 665–674. [Google Scholar] [CrossRef]
- Helm, S. A matter of reputation and pride: Associations between perceived external reputation, pride in membership, job satisfaction and turnover intentions. Br. J. Manag. 2013, 24, 542–556. [Google Scholar] [CrossRef]
- Soroa-Koury, S.; Yang, K.C. Factors affecting consumers’ responses to mobile advertising from a social norm theoretical perspective. Telemat. Inform. 2010, 27, 103–113. [Google Scholar] [CrossRef]
- Servicio Nacional de Turismo (SERNATUR). 2017. Available online: https://www.sernatur.cl/ (accessed on 28 April 2018).
- Instituto Nacional de Estadística, Geografía e Informática (INEGI). 2017. Available online: https://www.inegi.org.mx/temas/turismo/ (accessed on 15 April 2018).
- Mathwick, C.H.; Malhotra, N.; Rigdon, E. Experiential value: Conceptualization, measurement and application in the catalogue and Internet shopping environment. J. Retail. 2001, 77, 39–56. [Google Scholar] [CrossRef]
- Sirgy, M.J.; Grewal, D.; Mangleburg, T.F.; Park, J.; Chon, K.S.; Claiborne, C.B.; Johar, J.S.; Berkman, H. Assessing the Predictive Validity of Two Methods of Measuring Self-Image Congruence. Acad. Mark. Sci. J. 1997, 25, 229–241. [Google Scholar] [CrossRef]
- Kim, H.W.; Xu, Y.; Koh, J. A Comparison of Online Trust Building Factors between Potential Customers and Repeat Customers. J. Assoc. Inf. Syst. 2004, 5, 392–420. [Google Scholar] [CrossRef]
- Ha, H.Y.; Perks, H. Effects of consumer perception of brand experience on the web: Brand familiarity, satisfaction, and brand trust. J. Consum. Behav. 2005, 4, 438–452. [Google Scholar] [CrossRef]
- Brockman, B. The influence of affective state on satisfaction ratings. J. Consum. Satisf. Dissatisfaction Complain. Behav. 1998, 11, 40–50. [Google Scholar]
- De Wulf, K.; Odekerken-Schröder, G. Assessing the impact of a retailer’s relationship efforts on consumers` attitudes and behavior. J. Retail. Consum. Serv. 2003, 10, 95–108. [Google Scholar] [CrossRef]
- Zaichkowsky, J.L. Measuring the Involvement Construct. J. Consum. Res. 1985, 12, 341–352. [Google Scholar] [CrossRef]
- Lichtenstein, D.R.; Netemeyer, R.G.; Burton, S. Distinguishing coupon proneness from value consciousness: An acquisition -transaction utility theory perspective. J. Mark. 1990, 54, 54–67. [Google Scholar] [CrossRef]
- Hair, J.F.J.; Anderson, R.E.; Tatham, R.L.; Black, W.C. Multivariate Data Analysis, 5th ed.; Prentice Hall: Hoboken, NJ, USA, 1998. [Google Scholar]
- Steenkamp, J.B.E.; Van Trijp, H.C. The use of LISREL in validating marketing constructs. Int. J. Res. Mark. 1991, 8, 283–299. [Google Scholar] [CrossRef]
- Henseler, J.; Ringle, C.M.; Sarstedt, M. A new criterion for assessing discriminant validity in variance-based structural equation modeling. J. Acad. Mark. Sci. 2015, 43, 115–135. [Google Scholar] [CrossRef] [Green Version]
- Fornell, C.; Larcker, D.F. Evaluating structural equation models with unobservable variables and measurement error. J. Mark. Res. 1981, 18, 39–50. [Google Scholar] [CrossRef]
- Bagozzi, R.P.; Yi, Y. On the evaluation of structural equation models. J. Acad. Mark. Sci. 1988, 16, 74–94. [Google Scholar] [CrossRef]
- Anderson, J.C.; Gerbing, D.W. Structural equation modeling in practice: A review and recommended two-step approach. Psychol. Bull. 1988, 103, 411. [Google Scholar] [CrossRef]
- Bagozzi, R.P. Attitudes, intentions, and behavior: A test of some key hypotheses. J. Personal. Soc. Psychol. 1981, 41, 607. [Google Scholar] [CrossRef]
- Bagozzi, R.P.; Phillips, L.W. Representing and testing organizational theories: A holistic construal. Adm. Sci. Q. 1982, 27, 459–489. [Google Scholar] [CrossRef]
- Cheung, G.W.; Rensvold, R.B. Evaluating goodness-of-fit indexes for testing measurement invariance. Struct. Equ. Model. 2002, 9, 233–255. [Google Scholar] [CrossRef]
- Yu, L.; Shek, D.T. Testing factorial invariance across groups: An illustration using AMOS. Int. J. Disabil. Hum. Dev. 2014, 13, 205–216. [Google Scholar] [CrossRef]
- Byrne, B.M. Testing for multigroup invariance using AMOS graphics: A road less traveled. Sructural Equ. Model. 2004, 11, 272–300. [Google Scholar] [CrossRef]
Figure 1.
Theoretical model.

Figure 2.
Structural model.


Table 1.
Sample profile.
| Gender % | Civil Status % | ||||
|---|---|---|---|---|---|
| Chile | Mexico | Chile | Mexico | ||
| Male | 43 | 30 | Single | 62 | 77 |
| Female | 57 | 70 | Married | 26 | 23 |
| Total | 100 | 100 | Other marital status | 12 | 0 |
| Total | 100 | 100 | |||
| Age % | Education Level % | ||||
| Chile | Mexico | Chile | Mexico | ||
| 18 to 24 | 63 | 16 | University graduate | 0 | 2 |
| 25 to 34 | 33 | 10 | Postgraduate | 0 | 0 |
| Over 35 | 4 | 74 | Incomplete university studies | 100 | 98 |
| Total | 100 | 100 | Total | 100 | 100 |
| Employment % | Income (US Dollars) % | ||||
| Chile | Mexico | Chile * | Mexico ** | ||
| Employed | 100 | 96 | Under 549 | 21 | |
| Looking for Work | 0 | 4 | Under 630 | 38 | |
| Student | 0 | 0 | Over 631 | 62 | |
| Total | 100 | 100 | Between 550 and 2144 | 69 | |
| Over 2150 | 10 | ||||
| Total | 100 | 100 | |||
Note: * 1 USD = 746.6 Chilean pesos as of 29 December 2019. ** 1 USD = 18.86 Mexican pesos as of 29 December 2019.
Table 2.
Measurement scales.
| Cognitive experience (Coge) | ||
| Facilities | Cogf1 | The facilities in this country are safe. |
| Cogf2 | The facilities in this country are highly varied. | |
| Cogf3 | The facilities in this country are comfortable. | |
| Own traditions | Cgot1 | This country has interesting cultural attractions. |
| Cgot2 | This country has interesting folklore attractions. | |
| Cgot3 | This country has interesting historical attractions. | |
| Affective experience (Afee) | ||
| Afee1 | I was happy in this country. | |
| Afee2 | I was content in this country. | |
| Afee3 | I was cheerful in this country. | |
| Afee4 | This country is fun. | |
| Afee5 | I felt lively in this country. | |
| Functional benefits (Funb) | ||
| Funb1 | In this country, I found what I needed. | |
| Funb2 | In this country, I found what I was looking for. | |
| Funb3 | It was convenient to come to this country. | |
| Funb4 | Compared to other similar places, this country is the best place to visit. | |
| Funb5 | In this country, I found the ideal stay for me. | |
| Hedonic benefits (Hedb) | ||
| Visual attractions | Visa1 | I like this country because of its landscape. |
| Visa2 | I like this country because of its aesthetics. | |
| Visa3 | This country is a pleasure for my senses. | |
| Visa4 | I like to go sightseeing in this country. | |
| Distraction | Dis1 | This country is good for being distracted. |
| Dis2 | This country is very lively. | |
| Dis3 | This country is ideal to observe how others have fun. | |
| Escape | Esc1 | This country helps me enjoy life. |
| Esc2 | This country helps me escape from my daily routine. | |
| Esc3 | This country helps me feel like I am in another world. | |
| Symbolic benefits (Symb) | ||
| Symb1 | This country reflects what I am. | |
| Symb2 | This country is consistent with how I see myself. | |
| Symb3 | This country fits my lifestyle. | |
| Symb4 | This country is ideal for my friends. | |
| Symb5 | This country reflects my way of being. | |
| Reputation (Rep) | ||
| Rep1 | This country has a good reputation. | |
| Rep2 | This country has a better reputation than other similar places. | |
| Rep3 | People highly respect this country. | |
| Rep4 | People speak very well of this country. | |
| Rep5 | This country’s good reputation is backed up by its history. | |
| Familiarity (Fam) | ||
| Fam1 | This country is familiar to me. | |
| Fam2 | This country is very well known to me. | |
| Fam3 | I am always well informed about this country. | |
| Fam4 | I am always aware of this country. | |
| Fam5 | My friends and family say that I know this country very well. | |
| Satisfaction (Sat) | ||
| Sat1 | I had satisfying experiences in this country. | |
| Sat2 | I felt satisfied in this country. | |
| Sat3 | I felt satisfied in this country because the attention I received was ideal. | |
| Sat4 | I achieved important things in this country. | |
| Sat5 | I am satisfied with my decision to visit this country. | |
Table 3.
Factorial confirmatory analysis.
| Scales | Variable | Factor Load | Variance Explained (%) | Own Value | ||
|---|---|---|---|---|---|---|
| Country Image | Cognitive experience | Facilities | Cogf1 | 0.9 | 80.4 | 2.4 |
| Cogf2 | 0.9 | |||||
| Cogf3 | 0.9 | |||||
| Country traditions | Cgot1 | 0.9 | 82.2 | 2.5 | ||
| Cgot2 | 0.9 | |||||
| Cgot3 | 0.9 | |||||
| Affective experience | Afee1 | 0.9 | 84.6 | 4.2 | ||
| Afee2 | 0.9 | |||||
| Afee3 | 0.9 | |||||
| Afee4 | 0.9 | |||||
| Afee5 | 0.9 | |||||
| Functional benefit | Funb1 | 0.9 | 74.9 | 3.7 | ||
| Funb2 | 0.9 | |||||
| Funb3 | 0.9 | |||||
| Funb4 | 0.8 | |||||
| Funb5 | 0.8 | |||||
| Symbolic benefit | Symb1 | 0.9 | 78.8 | 3.9 | ||
| Symb2 | 0.9 | |||||
| Symb3 | 0.9 | |||||
| Symb4 | 0.8 | |||||
| Symb5 | 0.9 | |||||
| Hedonic benefit | Visual attractiveness | Visa1 | 0.8 | 73.4 | 2.9 | |
| Visa2 | 0.9 | |||||
| Visa3 | 0.9 | |||||
| Visa4 | 0.9 | |||||
| Distraction | Dis1 | 0.8 | 82.4 | 2.4 | ||
| Dis2 | 0.9 | |||||
| Dis3 | 0.9 | |||||
| Escape | Esc1 | 0.9 | 78.7 | 2.4 | ||
| Esc2 | 0.8 | |||||
| Esc3 | 0.8 | |||||
| Reputation | Rep1 | 0.9 | 79.4 | 4.0 | ||
| Rep2 | 0.9 | |||||
| Rep3 | 0.9 | |||||
| Rep4 | 0.9 | |||||
| Rep5 | 0.8 | |||||
| Familiarity | Fam1 | 0.9 | 74.8 | 3.7 | ||
| Fam2 | 0.9 | |||||
| Fam3 | 0.9 | |||||
| Fam4 | 0.9 | |||||
| Fam5 | 0.8 | |||||
| Satisfaction | Sat1 | 0.9 | 85.0 | 4.2 | ||
| Sat2 | 0.9 | |||||
| Sat3 | 0.9 | |||||
| Sat4 | 0.9 | |||||
| Sat5 | 0.9 | |||||
Table 4.
Multidimensional country image components.
| Indicators | Recommended Value | First-Order | Second-Order | |
|---|---|---|---|---|
| Cognitive experience | ||||
| Absolute | NCP | Minimum | 974.11 | 8.91 |
| ECVI | Minimum | 0.56 | 0.03 | |
| RMSEA | <0.08 | 0.24 | 0.03 | |
| Incremental | NFI | High (close to 1) | 0.87 | 0.99 |
| IFI | High (close to 1) | 0.87 | 0.99 | |
| CFI | High (close to 1) | 0.87 | 0.99 | |
| Parsimony | AIC | Minimum | 1019.109 | 56.91 |
| Normed χ2 | [1; 5] | 109,234 | 2.48 | |
| Hedonic benefit | ||||
| Absolute | NCP | Minimum | 2028.657 | 68.585 |
| ECVI | Minimum | 1.181 | 0.112 | |
| RMSEA | <0.08 | 0.16 | 0.04 | |
| Incremental | NFI | High (near to 1) | 0.88 | 0.99 |
| IFI | High (near to 1) | 0.88 | 0.99 | |
| CFI | High (near to 1) | 0.88 | 0.99 | |
| Parsimony | AIC | Minimum | 2138.657 | 202.585 |
| Normed χ2 | [1; 5] | 47.10 | 4.43 | |
Table 5.
Construct validity and reliability.
| Scales | Variable | Cronbach’s Alpha | Composite Reliability | Average Variance Extracted | Skew | Kurtosis | ||
|---|---|---|---|---|---|---|---|---|
| Country Image | Cognitive experience | Facilities | Cogf1 | 0.9 | 0.8 | 0.6 | −1.2 | 1.5 |
| Cogf2 | −1.1 | 0.8 | ||||||
| Cofg3 | −1.1 | 0.9 | ||||||
| Own traditions | Cgot1 | 0.9 | 0.8 | 0.6 | −1.0 | 0.4 | ||
| Cgot2 | −0.6 | −0.4 | ||||||
| Cgot3 | −0.9 | −0.1 | ||||||
| Affective experience | Afee1 | 0.9 | 0.9 | 0.8 | −1.1 | 0.4 | ||
| Afee2 | −0.1 | −0.1 | ||||||
| Afee3 | −0.1 | 0.2 | ||||||
| Afee4 | −0.8 | −0.2 | ||||||
| Afee5 | −0.1 | −0.1 | ||||||
| Functional benefit | Funb1 | 0.9 | 0.9 | 0.7 | −0.8 | 0.0 | ||
| Funb2 | −0.8 | −0.1 | ||||||
| Funb3 | −0.5 | −0.5 | ||||||
| Funb4 | −0.6 | −0.3 | ||||||
| Funb5 | −0.8 | 0.2 | ||||||
| Symbolic benefit | Symb1 | 0.9 | 0.9 | 0.8 | −0.4 | −0.5 | ||
| Symb2 | −0.4 | −0.7 | ||||||
| Symb3 | −0.5 | −0.6 | ||||||
| Symb4 | −0.6 | −0.4 | ||||||
| Symb5 | −0.5 | −0.5 | ||||||
| Hedonic benefit | Visual attractiveness | Visa1 | 0.9 | 0.9 | 0.9 | −1.0 | 0.7 | |
| Visa2 | −0.8 | −0.1 | ||||||
| Visa3 | −0.8 | 0.1 | ||||||
| Visa4 | −0.9 | −0.1 | ||||||
| Distraction | Dis1 | 0.9 | 0.9 | 0.9 | −0.9 | 0.0 | ||
| Dis2 | −0.7 | −0.2 | ||||||
| Dis3 | −0.7 | −0.1 | ||||||
| Escape | Esc1 | 0.9 | 0.9 | 0.9 | −0.8 | 0.0 | ||
| Esc2 | −1.1 | 0.5 | ||||||
| Esc3 | −0.7 | −0.3 | ||||||
| Reputation | Rep1 | 0.9 | 0.9 | 0.9 | −0.7 | −0.6 | ||
| Rep2 | −0.5 | −0.6 | ||||||
| Rep3 | −0.7 | −0.5 | ||||||
| Rep4 | −0.6 | −0.6 | ||||||
| Rep5 | −0.6 | −0.5 | ||||||
| Familiarity | Fam1 | 0.9 | 0.9 | 0.9 | −0.8 | 0.0 | ||
| Fam2 | −0.9 | 0.3 | ||||||
| Fam3 | −0.9 | 0.4 | ||||||
| Fam4 | −0.9 | 0.4 | ||||||
| Fam5 | −0.9 | 0.2 | ||||||
| Satisfaction | Sat1 | 0.9 | 0.9 | 0.9 | −0.8 | −0.4 | ||
| Sat2 | −0.8 | −0.4 | ||||||
| Sat3 | −0.6 | −0.7 | ||||||
| Sat4 | −0.7 | −0.5 | ||||||
| Sat5 | −0.6 | −0.7 | ||||||
Table 6.
Discriminant validity.
| Confidence Interval Test | |||
|---|---|---|---|
| Bivariate Relationship | Confidence Intervals | Difference χ2 (df) | |
| Full Model | |||
| Country familiarity—country image | 0.805–0.813 | 7970.4 (1) | 7835.6 (973) |
| Country image—country reputation | 0.717–0.725 | 7939.1 (1) | |
| Country image—visitor satisfaction | 0.757–0.765 | 7927.9 (1) | |
| Country reputation—visitor satisfaction | 0.868–0.904 | 8351.0 (1) | |
| Country image model | |||
| Cognitive experience—hedonic benefit | 0.351–0.355 | 4984.2 (1) | 4830.5 (419) |
| Cognitive experience—symbolic benefit | 0.233–0.257 | 4947.8 (1) | |
| Cognitive experience—functional benefit | 0.318–0.326 | 4974.9 (1) | |
| Cognitive experience—affective experience | 0.369–0.385 | 4866.8 (1) | |
| Affective experience—hedonic benefit | 0.848–0.864 | 4899.5 (1) | |
| Affective experience—symbolic benefit | 0.719–0.723 | 4980.2 (1) | |
| Affective experience—functional benefit | 0.783–0.799 | 4902.2 (1) | |
| Functional benefit—hedonic benefit | 0.903–0.915 | 4835.4 (1) | |
| Functional benefit—symbolic benefit | 0.883–0.887 | 4925.5 (1) | |
| Hedonic benefit—symbolic benefit | 0.827–0.839 | 4866.3 (1) | |
| Cognitive experience model | |||
| Country facilities—Country traditions | 0.697–0.709 | 207.0 (1) | 121.4 (8) |
| Hedonic benefit model | |||
| Visual attractiveness of the country—escape from routine | 0.874–0.894 | 416.0 (1) | 412.1 (32) |
| Visual attractiveness of the country—distraction | 0.841–0.861 | 414.7 (1) | |
| Distraction—escape from routine | 0.939–0.971 | 454.2 (1) | |
Note: All coefficients significant at a level of 0.001.
Table 7.
Hypotheses verification.
| Hypothesis | Value | Path | Result | ||
|---|---|---|---|---|---|
| H1 | Country image is a mix of five dimensions | Supported | |||
| H2 | (+) | Country familiarity | → | Country image | Supported |
| H2a | The effect of country familiarity on country image will be constant in both Chile and Mexico. | Not Supported | |||
| H3 | (+) | Country image | → | Country reputation | Supported |
| H3a | The effect of country image on country reputation will be constant in both Chile and Mexico. | Not Supported | |||
| H4 | (+) | Country image | → | Visitor satisfaction | Supported |
| H4a | The effect country image on visitor satisfaction will be constant in both Chile and Mexico. | Not Supported | |||
| H5 | (+) | Country reputation | → | Visitor satisfaction | Supported |
| H5a | The effect of country reputation on visitor satisfaction will be constant in both Chile and Mexico. | Not Supported | |||
Table 8.
Multi-group analysis.
| Relationships | Difference χ2 (df) | Critical Ratios for Differences between Parameters | |||||
|---|---|---|---|---|---|---|---|
| (99% Confidence) | Chile | Mexico | Critical Ratios (>±1.96) | ||||
| Estimate | |||||||
| Country familiarity | → | Country image | 83.9 (5) | 89.97 (5) | 0.71 *** | 0.73 *** | 0.76 * |
| Country image | → | Country reputation | 101.1 (5) | 0.57 *** | 0.71 *** | 4.23 *** | |
| Country image | → | Visitor satisfaction | 322.5 (5) | 0.57 *** | 0.12 *** | 23 *** | |
| Country reputation | → | Visitor satisfaction | 542.6 (5) | 0.12 *** | 0.80 *** | −16.0 *** | |
Note: *** p-value < 0.01; * Not significant.
Publisher’s Note: MDPI stays neutral with regard to jurisdictional claims in published maps and institutional affiliations. |
© 2021 by the authors. Licensee MDPI, Basel, Switzerland. This article is an open access article distributed under the terms and conditions of the Creative Commons Attribution (CC BY) license (https://creativecommons.org/licenses/by/4.0/).
Share and Cite
MDPI and ACS Style
Marinao-Artigas, E.; Barajas-Portas, K. A Cross-Destination Analysis of Country Image: A Key Factor of Tourism Marketing. Sustainability 2021, 13, 9529. https://doi.org/10.3390/su13179529
AMA Style
Marinao-Artigas E, Barajas-Portas K. A Cross-Destination Analysis of Country Image: A Key Factor of Tourism Marketing. Sustainability. 2021; 13(17):9529. https://doi.org/10.3390/su13179529
Chicago/Turabian StyleMarinao-Artigas, Enrique, and Karla Barajas-Portas. 2021. "A Cross-Destination Analysis of Country Image: A Key Factor of Tourism Marketing" Sustainability 13, no. 17: 9529. https://doi.org/10.3390/su13179529
Note that from the first issue of 2016, this journal uses article numbers instead of page numbers. See further details here.