
Demand Stratification and Prediction of Evacuees after Earthquakes


Department of Logistics Management and Engineering, School of Economics and Management, Beijing Jiaotong University, Beijing 100044, China
*
Author to whom correspondence should be addressed.
Sustainability 2021, 13(16), 8837; https://doi.org/10.3390/su13168837
Submission received: 10 July 2021
/
Revised: 30 July 2021
/
Accepted: 3 August 2021
/
Published: 7 August 2021
Abstract
:In recent years, frequent natural disasters have brought huge losses to human lives and property, directly affecting social stability and economic development. Since the driving factor of disaster management operations is speed, it will face severe challenges and tremendous pressure when matching the supply of emergency resources with the demand. However, it is difficult to figure out the demands of the affected area until the initial post-disaster assessment is completed and demand is constantly changing. The focus of this paper is to stratify the evacuation needs and predict the number of evacuees and supplies demanded after an earthquake. This research takes a large-scale earthquake as an example to analyze the characteristics of evacuation demand stratification and the factors that affect the demands of evacuees. The forecast model for the number of evacuees is selected and improved. Moreover, combining the influencing factors of materials demand and the number of evacuees, a forecast model of materials demand for evacuees is constructed. The proposed model is used in the case of the Ya’an earthquake in China to estimate the number of evacuees and the daily need for emergency supplies.
1. Introduction and Literature Review
From 1998 to 2017, the economic losses caused by all disasters totaled USD 2.9 trillion, with 1.3 million deaths, including 4.4 billion victims who were injured, displaced, or in need of emergency rescue [1]. In the face of such frequent occurrences of various natural disasters and emergencies, how to deal with them scientifically and provide timely and effective rescue is a difficult problem. The rapid transfer of evacuees to emergency shelters is of great significance in alleviating the suffering of the victims and improving the vulnerability of the affected population after earthquakes. The role of shelters is fundamental to two types of victims; namely, those who cannot be taken to other safe places, and those with special needs such as medical treatment [2]. They need a physical space that can satisfy their basic living needs and obtain emergency medical assistance [3].
Life after evacuation is a life with a relatively high degree of “poverty” in a disaster situation. Especially in the early stage, supplies are scarce and the demand in the affected area is high. In addition, the evacuees can tolerate a simple living environment, but their needs will gradually increase over time. The main problems in evacuation life are to do with meals (about 40%), bedtime and sleep (about 36%), and medical service (about 23%) [4]. The current extensive allocation method ignores the demands of the evacuees after an earthquake in both horizontal and vertical dimensions. In addition to basic living demands, evacuees also have medical and psychological needs, and evacuees will put forward higher requirements for their quality of life and medical treatment as the disaster situation gradually stabilizes. Hence, the demands of evacuees are stratified to improve the effective matching of the supply and demand of emergency resources and the effectiveness of and satisfaction with evacuation. Based on the characteristics of the stratification of demands, the evacuation demand forecast is proposed to provide corresponding emergency resources quickly and accurately.
The affected population should be quickly evacuated and allocated resources following the principle of matching resource supply and demand to ensure the safety of evacuees. Some scholars focus on the optimization of emergency facilities at different levels from the perspective of resource supply. Because single-level emergency centers have insufficient capabilities, it is necessary to consider the construction of double-level emergency centers, which change the traditional one-to-one emergency rescue mode [5]. Ozkapici et al. [6] further distinguish the functions of emergency facilities, which is conducive to the rapid distribution of supplies from different countries/regions after a disaster. However, these studies ignore the impact of changes in the demands of victims in humanitarian rescue. Other researchers have studied the issue of allocation to evacuees from the perspective of demand. For example, Perez et al. [3] propose that the diverse demands of victims should not be ignored after the disaster. In addition to basic living demands, the victims also need medical and psychological aid. Emergency shelters and emergency medical centers should be arranged according to different needs. Some scholars note temporary demands, short-term demands, and long-term demands to distinguish the escalation of the demands of evacuees over time [7]. However, the diverse demands of people at different times after a disaster fails to attract attention. Therefore, this paper deal with the demands of the victims in vertical and horizontal stratification to comprehensively and systematically solve the issue of evacuation of victims. The vertical demands are categorized through different goals in multiple stages to improve the quality of evacuation life after a disaster, and the horizontal demands of victims are mainly divided into basic living service demands and medical or psychological aid demands.
In the study of the demands of evacuees after an earthquake, it is a common method to analyze the evacuation demands according to the degree of damage to the buildings and ground motion variability [8,9,10]. The number of victims is counted by the number of the affected population due to the vulnerability of structures [11,12,13]. In practical applications, empirical values are directly used as the calculation basis. The scale of the population that needs long-term shelter is calculated according to 30% of the permanent population [14]. These methods ignore the law that the number of evacuees changes with evacuation demand. The demand for shelter is not only affected by the seismic performance of buildings, the integrity of living facilities, and the time of earthquake occurrence and geology [15], but also victims’ perceptions [16,17]. The model proposed by the Japanese Central Disaster Prevention Council includes the evacuation demand caused by the destruction of houses and water supply facilities, as well as factors such as the selection of evacuees. Specifically, the selection data of evacuees are summarized based on past seismic data [8]. For the forecast of the dynamic demand for supplies, Sheu [18] uses the number of the affected population to indirectly forecast the demand for materials. The method of multi-source data fusion is adopted to improve the accuracy of prediction. Taskin and Lodree [19] analyze the relationship between the intensity of hurricanes and the demand for supplies and adopt the Bayesian network to determine the demand. For the affected areas with sufficient case bases, case-based reasoning technology can find disaster cases with high similarity for intelligent matching and perform accurate and rapid rescue based on historical data of similar cases [20,21]. Some researchers propose multiple regression to predict the demand for emergency supplies. Key factors are quantitatively analyzed to improve the scientificity of model predictions [22,23]. As evacuation demand is constantly changing, this paper proposes an estimation model considering engineering and human factors. Based on the number of evacuees, a dynamic supplies demand prediction model is further proposed.
The remainder of this paper is organized as follows: Section 2 explains the connotations and characteristics of the stratification of demands of evacuees. Section 3 proposes the evacuation demand forecast model. Section 4 introduces the case study used to evaluate the performance of the model and analyzes the computational results. Section 5 summarizes the research conclusions, and possible future research areas are pointed out.
2. Connotations and Characteristics of the Stratification of Demands
2.1. Connotations of the Stratification of Demands
Maslow’s hierarchy of needs theory divides human needs into five levels, namely physiological needs, safety needs, social needs, respect needs, and self-fulfillment needs (as shown in Figure 1) [24]. Only after the requirements of the first level are met will the requirements of the next level be considered. The proposed theory adopts the idea of demand level division and has been applied in many fields [25,26].
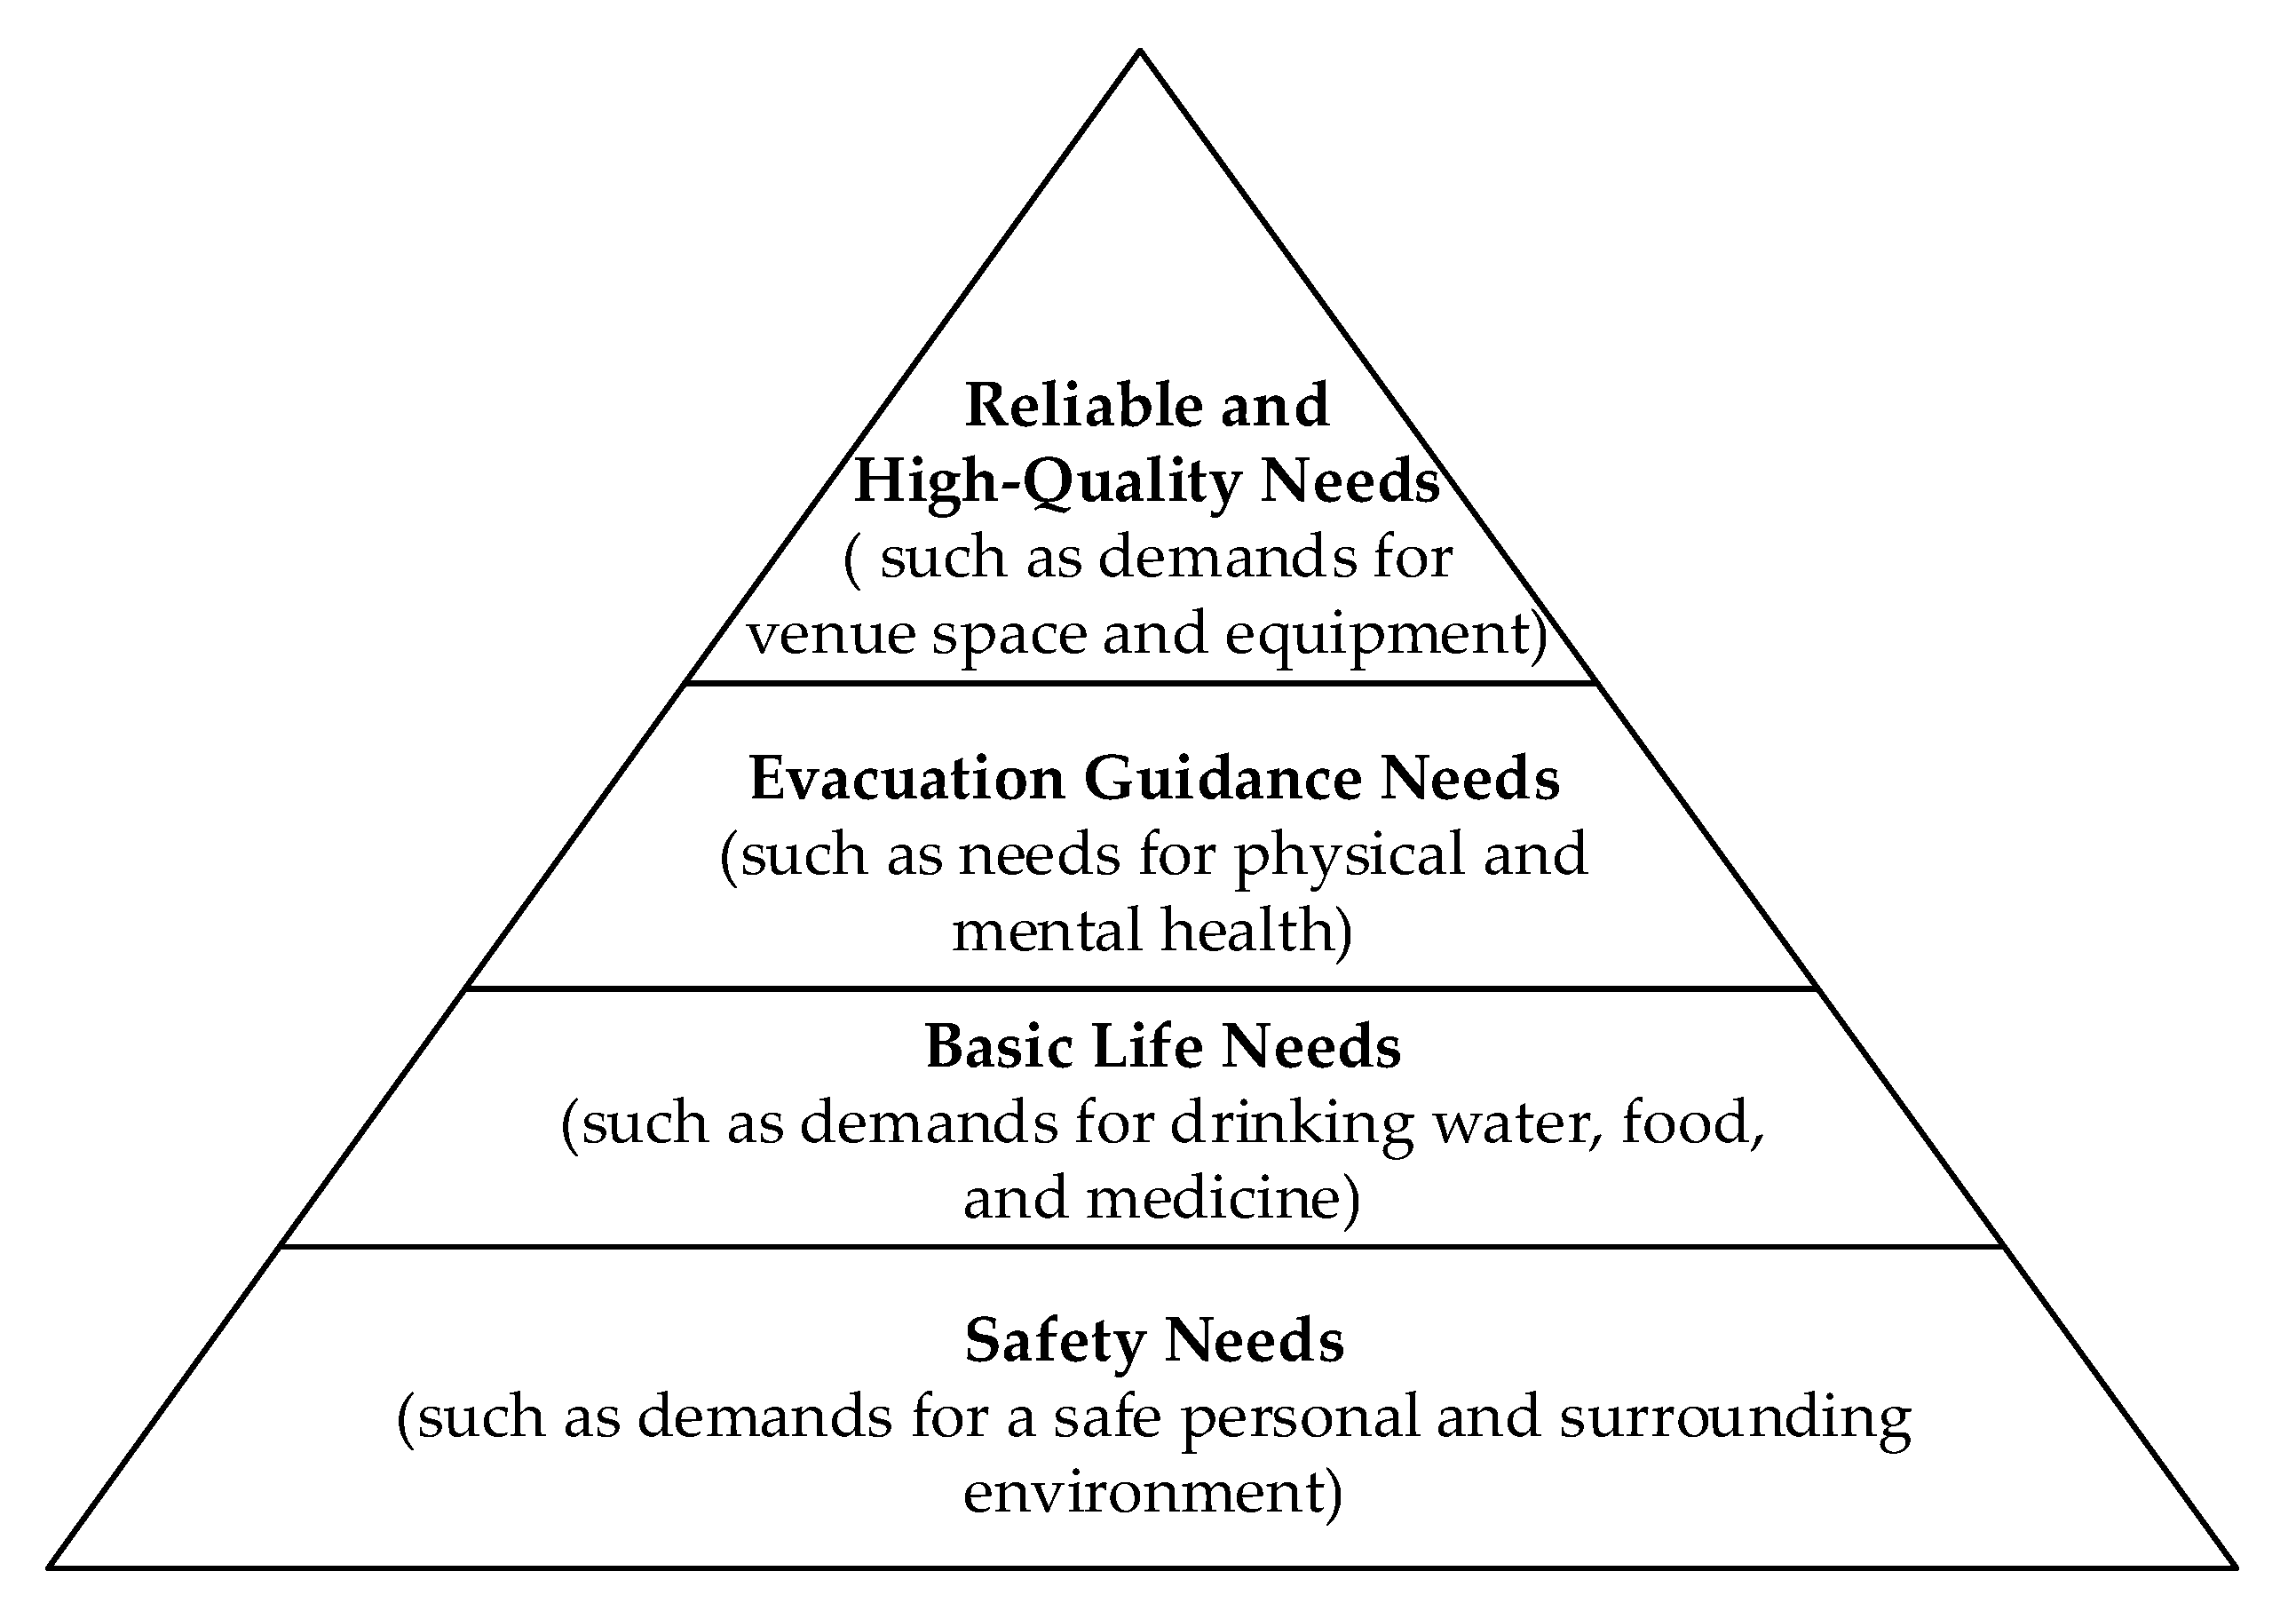
The evacuation period will last for a long time after the earthquake. The evacuees will continue to raise new demands during the evacuation process. Based on Maslow’s theory of dividing the needs from basic to advanced levels in order, their evacuation needs are divided into different levels (as shown in Figure 2).
The connotation of each demand level is as follows:
- Safety needs
Whether in residential life or after a disaster, safety needs are the most important needs of people. People tend to go to more secure places. Within a short period after an earthquake, the behavior of most victims is to find shelter nearby and avoid danger. Fifty-five percent of the affected population feels anxious when an earthquake occurs, and 19% feel very anxious [27]. The response to evacuation methods and places is mainly instinctive.
- 2.
- Basic life needs
Earthquakes often happen when people are unprepared; living conditions deteriorate and resources are scarce. The needs of victims will shift to a lower level. Moreover, evacuees can carry only limited supplies. After the victims arrive at a nearby emergency shelter, their biggest concern is whether the supplies of drinking water, food, and basic medical supplies are sufficient.
- 3.
- Evacuation guidance needs
After a period of disaster, the basic living needs of evacuees are met and their emotions gradually stabilize. However, the health conditions of some victims will have deteriorated, and evacuees with impaired physical and mental health put forward higher demands; that is, timely and professional diagnosis, treatment, and care. In the meanwhile, the sanitation environment of the shelter will be deteriorating, and the victims pay more attention to food and living environment hygiene.
- 4.
- Reliable and high-quality needs
People living together in shelters are prone to problems of mutual interference and conflict after the basic living conditions of evacuation are gradually stabilized. Due to the long period of evacuation, evacuees need to protect personal privacy and communicate with others [14,27] and need to increase their effective living area per capita. At the same time, higher requirements are put forward for the living functions of the shelter, including medical treatment, food hygiene, temperature environment, and bathing.
The abovementioned classification of evacuation demand levels is not absolute, and there is no strict division boundary. From the perspective of the overall development trend of evacuation life, there are differences in the requirements for emergency shelters at different stages in the vertical direction. Horizontally, that is, at the same stage of asylum, the evacuees may put forward several demands, but one kind of demand occupies a dominant position in each stage. This paper summarizes the needs that arise at different stages of evacuation.
- Temporary evacuation phase (first 3 days)
Within 3 days after the start of evacuation, some victims’ families are hurt or they have lost contact with their relatives, and they are emotionally restless. At this stage, behavior is mainly based on the instinctual response, and the demand for safety makes the victims choose the nearest shelter. Some evacuees suffer physical injuries and need emergency treatment and help, and there is a shortage of drinking water, food, daily necessities, and medical supplies. Therefore, safety needs and basic life guarantees are the main needs of the temporary evacuation stage, and some evacuees also have medical needs.
- 2.
- Short-term evacuation phase (from the 3rd day to the 10th day)
Three days after an earthquake, the golden rescue period is over, and the search for and rescue of buried people are completed. The people in shelters are highly mobile. Basic living needs at this stage are still the main demands due to the shortage of supplies in the temporary stage. However, the dynamic changes of demand information and transportation delays affect the dynamic changes of upstream material supply. Additionally, there is a large gap between asylum life and residential life, and the initial environment deteriorates. Hence, within 3 to 10 days after the earthquake, basic living needs and medical assistance needs dominate.
- 3.
- Long-term evacuation phase (from the 10th day to the 30th day)
In the long-term phase, there are still needs for basic living and medical rescue conditions such as medical care, materials, and accommodation, as well as safety requirements. The difference is that the psychological process has changed, which is reflected in the sense of belonging to the place of refuge, communicating with others, and maintaining personal privacy. The psychological needs are stronger, especially for evacuees who are frightened during the temporary phase.
2.2. Characteristics of the Stratification of Demands
The evacuation period is long. Demands are diverse, time-varying, and hard-to-meet.
- Diversity
Because a large number of victims need to evacuate after an earthquake, their physical condition and degree of injury will be different, resulting in different evacuation needs. In the horizontal demand dimension, general evacuees need to solve dietary problems, while weak ones need psychological comfort and special care, and injured evacuees need medical treatment and care. Additionally, each evacuee has different behavioral characteristics after an earthquake and follows different codes of conduct. For example, some residents take refuge blindly, and the refuge decisions made by neighbours or others affect their behaviors and needs to a large extent.
- 2.
- Time-varying
In the early stage of evacuation, evacuees need a place to live and a small amount of water, food, and clothing in a relatively short period. Victims with unstable mental states, weak evacuees, and the injured also need psychological and medical treatment services. In the short term, the difference between asylum life and residential life will have for some people reduced their physical resistance, and increased the psychological pressure on others. The demand for psychological medical services will have become stronger. After basic living conditions become stable, the evacuees will have a stronger need for life functions.
- 3.
- Hard-to-meet
At the beginning of the evacuation period, the number of victims in emergency shelters is in a state of flow, from a small number to a peak, and then gradually decreases until it stabilizes. In addition, evacuees include special people such as children, the elderly, and the disabled, all of whom pose challenges for emergency agencies. Meanwhile, in a short period after the earthquake, the local emergency rescue agency may be in a semi-paralyzed or unsound state. The roads and supplies will have been damaged, resulting in limited quantities and types of basic daily necessities such as drinking water, food, and medicine.
3. Forecast of the Needs of Evacuees
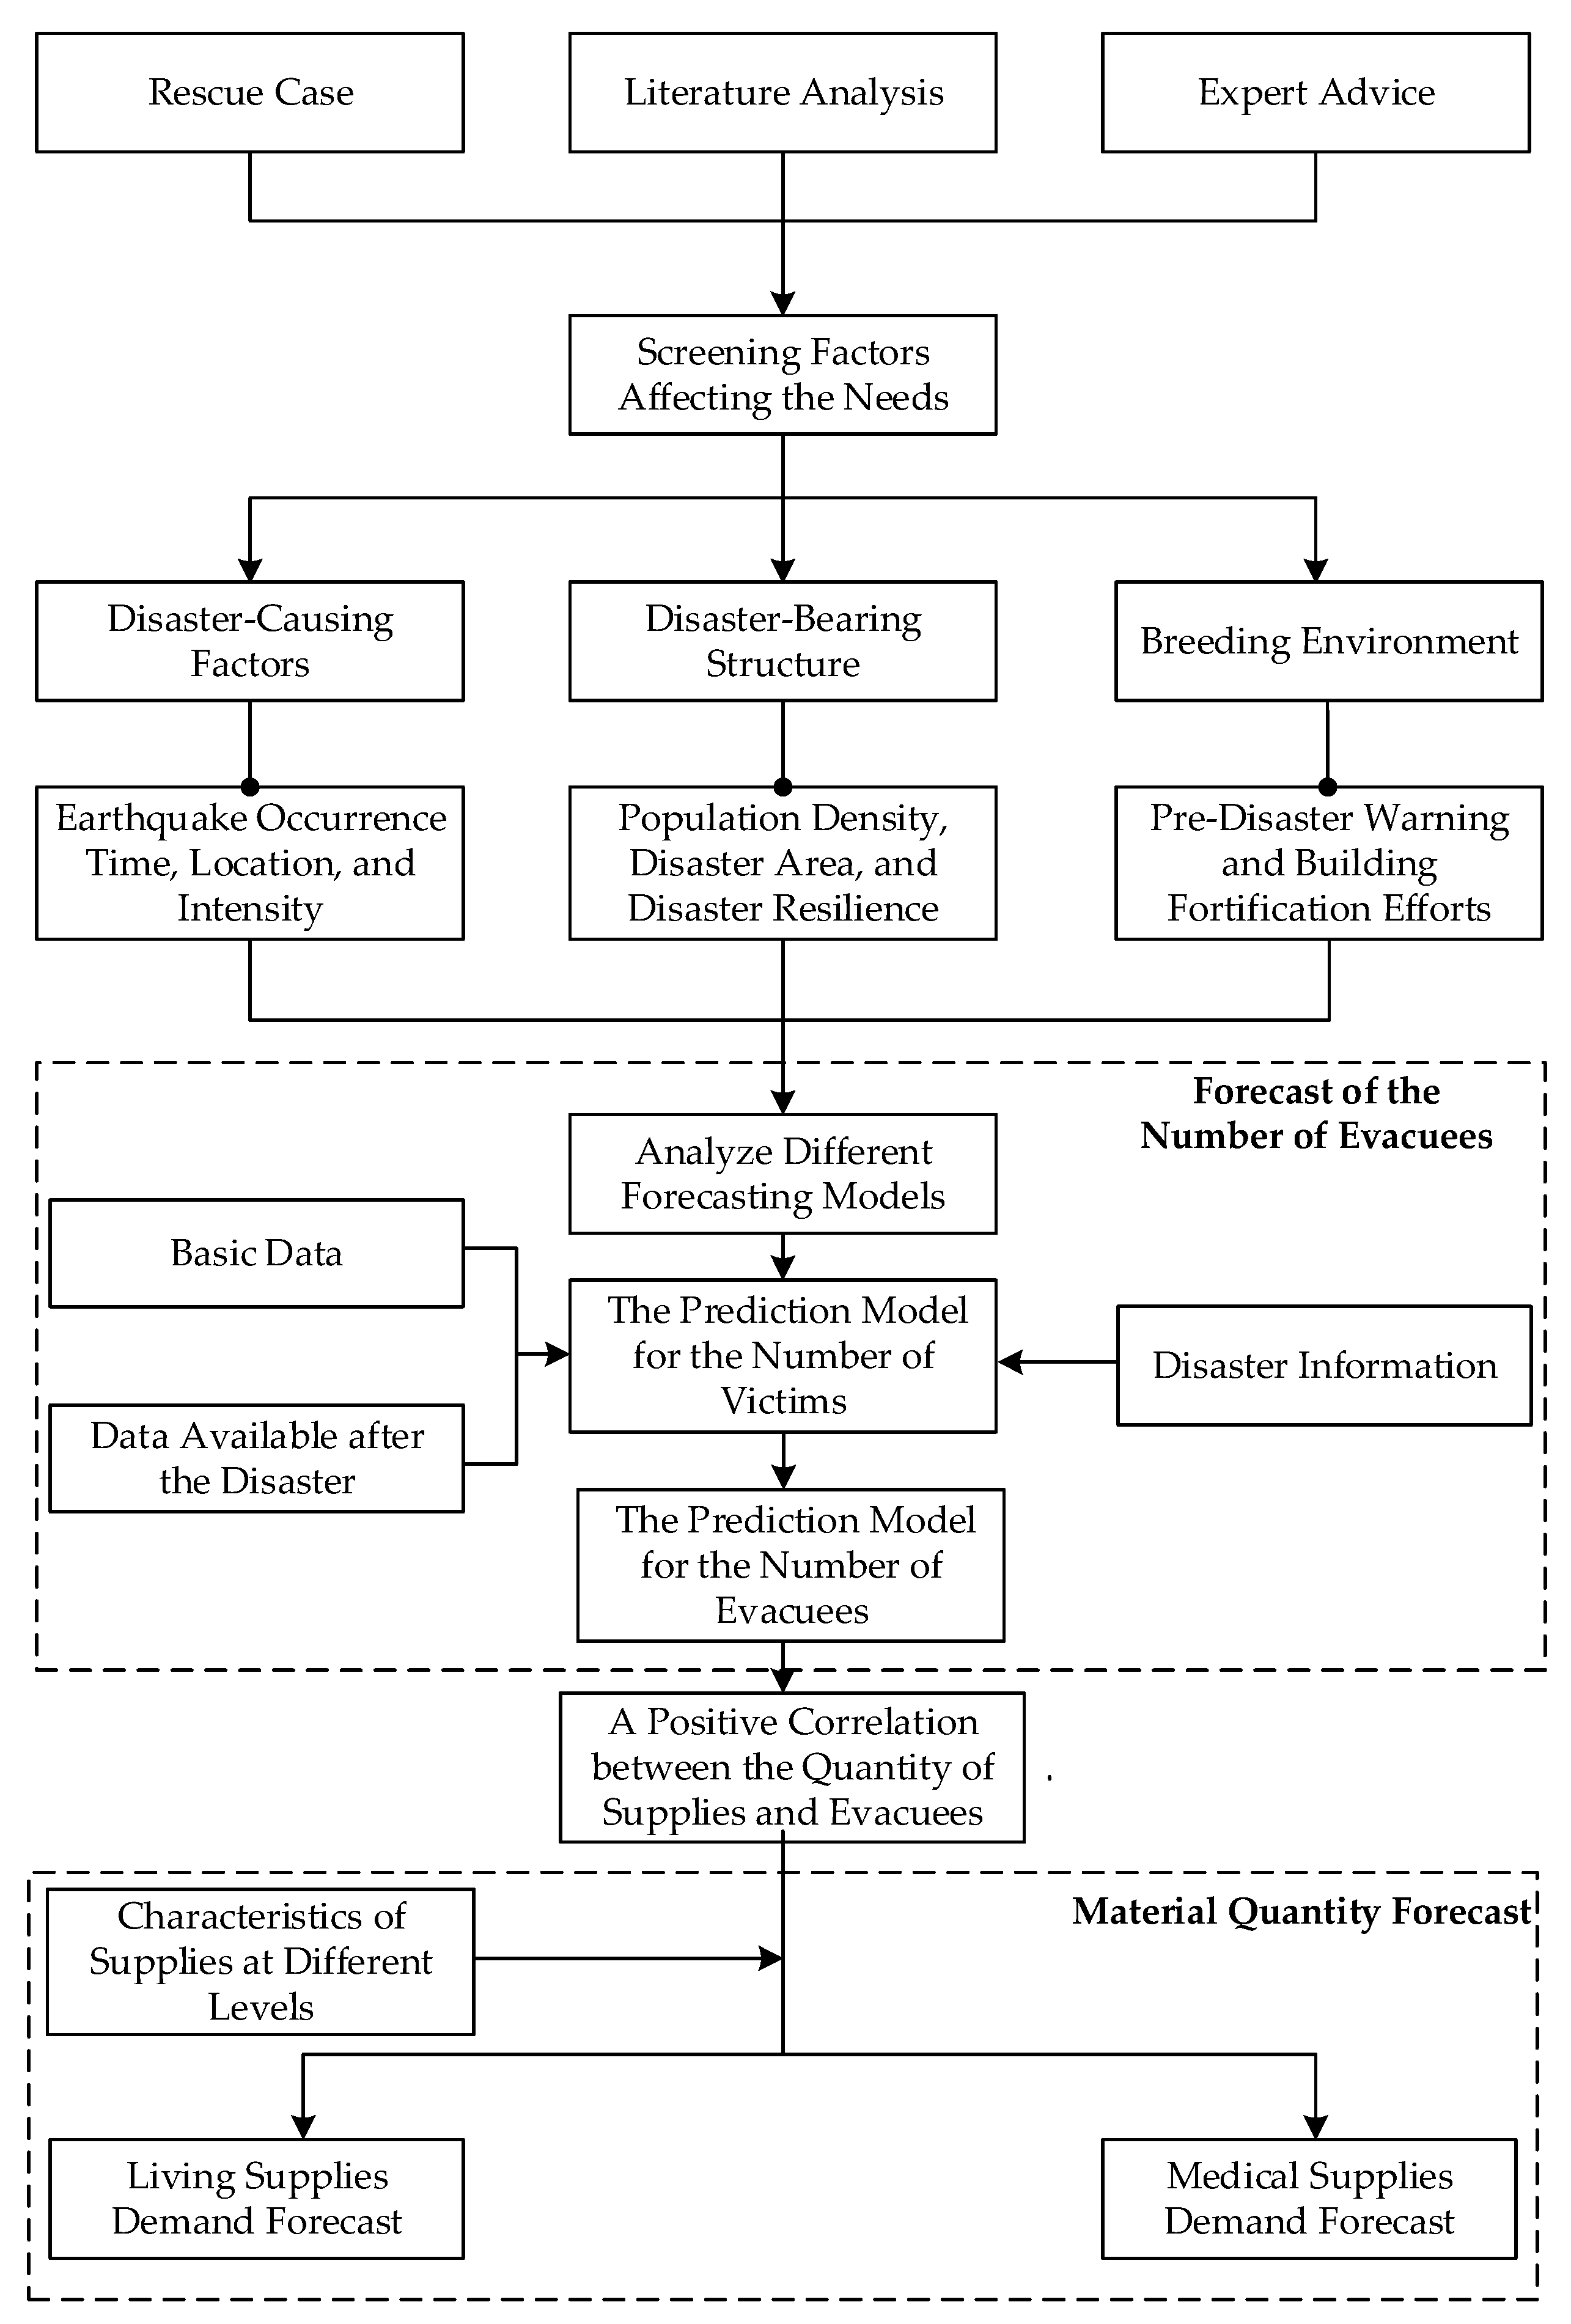
Because transportation and communications in the affected areas are damaged after an earthquake, they are in the state of “information islands”. It is difficult to quickly and accurately obtain information in the affected areas. Moreover, in past rescue cases, most of the statistics on casualties were provided, but it is difficult to obtain figures on the materials demanded directly. Hence, indirect measures are used to predict the demand for supplies. Because the number of casualties is highly correlated with the material needs of victims, our prediction model has been improved to obtain the number of different types of evacuees and emergency material needs. The process of predicting the needs of evacuees is shown in Figure 3.
3.1. Factors Influencing the Demands of Evacuees
A forecast of the number of evacuees is produced for the quick launch of rescue work. Based on disaster analysis, the factors that affect the demands of evacuees from earthquakes are summarized from three aspects: disaster-causing factors, disaster-bearing structures, and breeding environment [28]. We clarify, however, that these factors may change substantially if we take advantage of natural time analysis [29], which is a new method of analyzing the earthquake catalogues identifying temporal correlations between earthquake magnitudes [30], as well as estimating the epicentral area of an impending major earthquake. Such estimation is achieved by studying the spatiotemporal variations [31] of the minimum observed in the variability [32] of the order parameter of seismicity appearing a few months before a major earthquake occurrence [33].
3.1.1. Disaster-Causing Factors
In emergencies, disaster-causing factors are the risk resources that cause loss of life and property, which are mainly characterized by disaster types, disaster occurrence time, scale, and intensity. This paper takes earthquakes as the research background and determines the type of disaster. Hence, the magnitude of earthquake damage is determined by three factors; namely, time of occurrence, magnitude, and intensity.
- Time of occurrence
The time of an earthquake refers to the specific time of the day when an earthquake occurs. People are awake during the day. However, most people are at rest at night, with reduced responsiveness to external stimuli and temporary interruption of consciousness [34]. It is difficult to escape within a short period after an earthquake. Additionally, the dim light at night is not conducive to victims judging the direction of escape and surrounding conditions, and they cannot quickly move to a safe site. the losses caused by earthquakes during the day are lower than those during the night, it is necessary to distinguish the impact of an earthquake on the needs of evacuees during the day and night.
- 2.
- Magnitude
The magnitude measures the energy released by an earthquake [35]. The magnitude of the earthquake is divided into nine levels; the higher the magnitude, the more serious the damage caused. People cannot detect earthquakes of less than 2.5 in magnitude. When the magnitude of an earthquake reaches above 5, it has an impact on residential life.
- 3.
- Intensity
The intensity of an earthquake can indicate the extent to which buildings and houses have been affected by the earthquake [36]. This paper refers to the Chinese seismic intensity scale [37,38]. The seismic intensity is divided into 12 levels. When the seismic intensity is 1–5 degrees, people gradually become aware of the earthquake, and slight damage will occur at 6 degrees. When it reaches 7 degrees or more, houses without seismic fortification are damaged or even collapse, and the surface environment is damaged; 11–12 degrees is the intensity of a devastating earthquake.
3.1.2. Disaster-Bearing Structure
A disaster-bearing body is the main body that is directly affected by earthquakes and is damaged, including various facilities such as construction, transportation, and communication. The extent of the damage caused by an earthquake to disaster-bearing bodies is also affected by their vulnerability, including the population density, risk reduction strategies, and building defence capabilities.
- Population density
Population density is an important indicator to measure the population distribution of a country/region. This indicator assumes that the population is evenly distributed in a certain area involved, and is usually calculated based on the number of permanent residents per square kilometer or hectare. The population density is positively correlated with the number of victims in the affected areas. The greater the population density in the disaster area, the greater the number of victims.
- 2.
- Risk reduction strategies
Disaster risk reduction strategies are also an important factor that affects the demand for evacuation. Because of the intricacies of earthquake generating factors and crucial movement, and because the speed of wave propagation is fast, the difficulty of earthquake prediction is increased. The development of early warning levels and forecasting technology can provide local people and emergency rescue agencies with more preparation time, which reduces the need for evacuation.
- 3.
- Seismic precautionary intensity
The seismic precautionary intensity of buildings is negatively correlated with the number of people evacuated [39,40,41]. The seismic fortification intensity is determined according to the size of the city where the building is located, the type and height of the building, and the planning of the local seismic fortification community. The seismic precautionary intensity in this paper adopts the basic seismic intensity of China’s seismic parameter zoning map [41]. Buildings with strong resistance to disasters in the same affected area can play a role in protecting the lives of residents. This reduces the number of evacuees displaced by residential collapse, serious damage, and burning.
3.1.3. Breeding Environment
The breeding environment is formed through the interaction of many factors in nature and society, including soil, vegetation, transportation systems, and public places [42]. Specifically, the environment of different affected areas includes the natural environment and social environment [43].
- Natural environment
The natural environment varies with climate, topography, and vegetation [44,45,46]. The earthquake-prone area is the place where the crustal tectonic plates meet, such as the Pacific Rim Volcanic Seismic Belt. Vegetation coverage, climate, and landform also have an impact, resulting in huge losses caused by earthquakes [47].
- 2.
- Social environment
The social environment is affected by local economic, technological, transportation, and human factors. Rapid economic and social development has made the transportation network more complex, the pipeline diverse, and buildings abound. Once a lifeline project is destroyed by an earthquake, a large number of houses face water cuts or outages of elevators. Moreover, not all victims choose to move to emergency shelters, and some may select other places and flee the affected area. With the restoration of infrastructure functions and lifeline projects, evacuees whose houses are not damaged will return to their houses. Finally, groups in the affected area such as the disabled, children under 9 and the elderly over 70 should be regarded as vulnerable groups in need of medical and psychological aid.
Combining the availability of data and the operability of the model, the time of occurrence, magnitude, intensity, population density, risk reduction strategies, building defence capabilities, evacuation ratio, and group structure is chosen as the basic indicators that affect the demands.
3.2. Forecast Model for the Number of Evacuees
Commonly used population forecasting methods include regression analysis, time series forecasting, back propagation (BP) neural network, Markov forecasting method, case-based reasoning, and gray system models [48,49]. The regression analysis prediction method is a statistical analysis method to determine whether there is a quantitative relationship between two or more variables. It is suitable for forecasting within 3 days after the disaster and the calculating speed is fast. The dependent variable is predicted based on the change in the quantity of the independent variable during the forecast period. However, accurate prediction information is required after the disaster is stabilized. To overcome the challenges of uncertainty and lack of information in the post-disaster environment, the gray system forecasting method is adopted to predict the number of victims in the short and long term.
3.2.1. Forecast of the Number of Victims in the Temporary Phase
According to the analysis in Section 3.1, the number of victims is related to the time, magnitude, intensity, population density, early warning capabilities, and seismic precautionary intensity. The evacuation ratio and group structure will be considered in the evacuees’ forecast model in Section 3.2.3. First, the correlation analysis of the above factors is made to determine the main influencing factors of the model. Then, a prediction model for the number of victims is proposed. This model can use the data available after the earthquake to evaluate quickly and has practical value.
- Select influencing factors
Correlation analysis is carried out on the data of six dimensions that affect the number of victims after the earthquake. Due to the inconsistent measurement unit of data, all variable data are standardized and converted based on Equation (1).
represents the data value of the jth influencing factor in the ith sample after standardization. indicates the average value of the jth influencing factor in all sample data.
The sample data is taken from the relatively complete seismic data of Yunnan Province, China [50,51]. Yunnan Province is located on the east side of the collision zone between the Indian Ocean plate and the Eurasian plate, with complex geological structures. It is one of the provinces in China where destructive earthquakes are frequent and serious. The influencing factor related to the number of victims is sorted out. Considering the completeness of the data acquisition, this paper sorts out the relevant data of the destructive earthquakes (the magnitude of the earthquake reaches above 5) in Yunnan Province, China from 2000 to 2015, including time, magnitude, intensity, population density, and building defence capabilities. Because earthquake early warning technology has not been widely used, the analysis in the table is omitted. For the convenience of data standardization, the earthquake time is converted to 1 during the day (i.e., 8:00–20:00) and 2 at night (20:00–8:00+1). When the correlation coefficient is less than 0.3, the correlation between variables is low. Therefore, in the correlation analysis results (Table 1), the number of victims is affected by the magnitude, intensity, population density, and building defence capabilities.
- 2.
- Data processing
Considering that the population and density of the affected areas are dynamically changing, a fixed population density will affect the accuracy of the prediction results. For ease of use, real-time population density is introduced to improve the accuracy of the prediction of the number of victims. Hence, a certain transformation is made to the population density and the number of the affected population to avoid the influence of population changes on the accuracy of the model during use [51]. As shown in Equation (2), represents the number of people affected by the earthquake, is the total population of the affected area, represents the population density, and is the area of the disaster area.
The dependent variable in the model represents the proportion of the affected population in the disaster area. This variable does not fluctuate with time and is practical and accurate. Most people are not killed by buildings collapsing during earthquakes but are temporarily buried, waiting for rescue after the earthquake. To predict the number of victims in real time within 4 days, the stronger the emergency response capability after a disaster, the more it can reduce the number of casualties waiting to be rescued. Hence, this paper revises the number of victims in the first 4 days after the earthquake every 12 h, decreasing at a rate of 0.1. The post-disaster emergency response capacity correlation coefficient is shown in Table 2. The revised prediction model is Equation (3).
- 3.
- Construct a regression model
Suppose the form of the initial regression model is as follows:
In the equation, represents the proportion of victims in the affected area, is the magnitude of the earthquake, represents the intensity, and is the seismic precautionary intensity. Fitting the regression model, the results are shown in Table 3.
Therefore, the prediction model of the affected population is as follows:
3.2.2. Forecast of the Number of Victims in the Short-Term Phase
The disaster situation is stable 3 to 0 days after the seismic event. Data on the number of the affected population in the temporary shelter stage can be collected. Due to factors such as information delays and delays in the supply of materials, the number of victims is still dynamically increasing [52]. On the 10th day after the earthquake, the infrastructure is gradually restored, and the information flow is smooth so that the number of victims changes little. Therefore, this paper only forecasts the number of victims in the temporary and short-term evacuation phases.
The principle of the gray system prediction model is to accumulate the original discrete random data with a relatively small number to generate a new sequence. The newly generated sequence is remodelled, and the data obtained from the generated model are used to be processed to obtain the restored model. Finally, the reduction model is used to obtain the prediction model. The GM (1,1) model is adopted to predict the number of victims in the short term. This model is suitable for post-disaster prediction with less information except for time information, and the prediction accuracy is high [53], but it cannot solve the problem of raw data volatility. The premise of the Markov chain forecasting model for prediction is the need for scattered and large amounts of original data. In this method, the value of the nth sequence is only related to the (n−1)-th and is not related to all the previous ones [54].
- GM (1,1) gray prediction model
To judge the feasibility of GM (1,1) modelling, it is necessary to perform a smoothness inspection on the original data to determine whether the data are suitable for the gray model. As shown in Equations (6) and (7), suppose is a time series with n observations, and is a new series obtained by accumulating the original series once. The calculation formula for the smooth ratio of the original data is Equation (8).
If all the grade ratios are less than 1 , and all fall within the interval , then the sequence can establish a GM (1,1) model and make gray predictions. is the immediate mean value generation sequence of .
The gray differential equation model that defines GM (1,1) is as follows:
In Equation (11), is the gray development coefficient and is the gray control parameter. Let the equation coefficient ; Equation (12) is obtained by the least square method.
The whitening equation of the gray differential equation is shown in Equation (14). The solution of the whitening equation is also called the time response function, as shown in Equation (15).
Finally, the prediction equation is:
The GM model accuracy test generally refers to the test of the residual size, the correlation test, and the post-residual test. The residual size test is performed by calculating the difference between the original value and the predicted value. The correlation test is the difference between the original value and the predicted value. The posterior test is the test of the ratio between the residual error and the actual data variance. The posterior test is adopted in this paper to test the credibility of the gray prediction model. Generally, two index tests, and , are selected. The smaller the , the smaller the deviation between the predicted value and the actual value. The higher the , the higher the accuracy of the prediction. Table 4 shows the accuracy grading standards corresponding to the and values.
The variance of the initial data is:
The residual can be calculated by Equation (18).
The variance of the residual is:
The posterior difference ratio is:
The probability of A small error is:
- 2.
- Markov chain model
Markov predicts the possible future states based on the existing state and the law of state transition. To improve the accuracy of the prediction results, the initial value obtained from the gray prediction is input into the Markov chain model for calculation.
(1) State division Space is approximately divided into n intervals according to the ratio of the original data divided by the gray predicted data. Each interval represents a state . and indicate the minimum and maximum values of the interval respectively.
(2) Generate state transition probability matrix The probability of changing from a certain state to another state is called the state transition probability. The station transition probability can be expressed as Equation (22). In the formula, is the number of transitions from state to state . represents the number of occurrences of . Then the K-step state transition probability matrix is denoted as P:
(3) Markov chain model to optimize predicted value Through gray prediction, the state transition probability vector in the current state of the event is obtained, and the is used to obtain the high probability transition direction of the next stage of the event and its fluctuation range. In the state transition matrix, if the state transition probability of a certain step is the same, the weighted average of each state interval value is used. The possible predicted value of the system at a future time is obtained by Equation (23), where and are the lower and upper limits of the state interval in the next step, and is the original data value.
3.2.3. Forecast of the Number of Evacuees
According to Section 3.1, evacuees will choose to go out for shelter because they cannot tolerate the shortage of basic services caused by the earthquake. With the gradual improvement of medical aid services after the earthquake, some injured evacuees have returned to normal. The behavior of such evacuees will cause changes in the number of evacuees in emergency shelters. Hence, this paper introduces a function of the degree of shortage of medical services and the degree of medical services required [16,18].
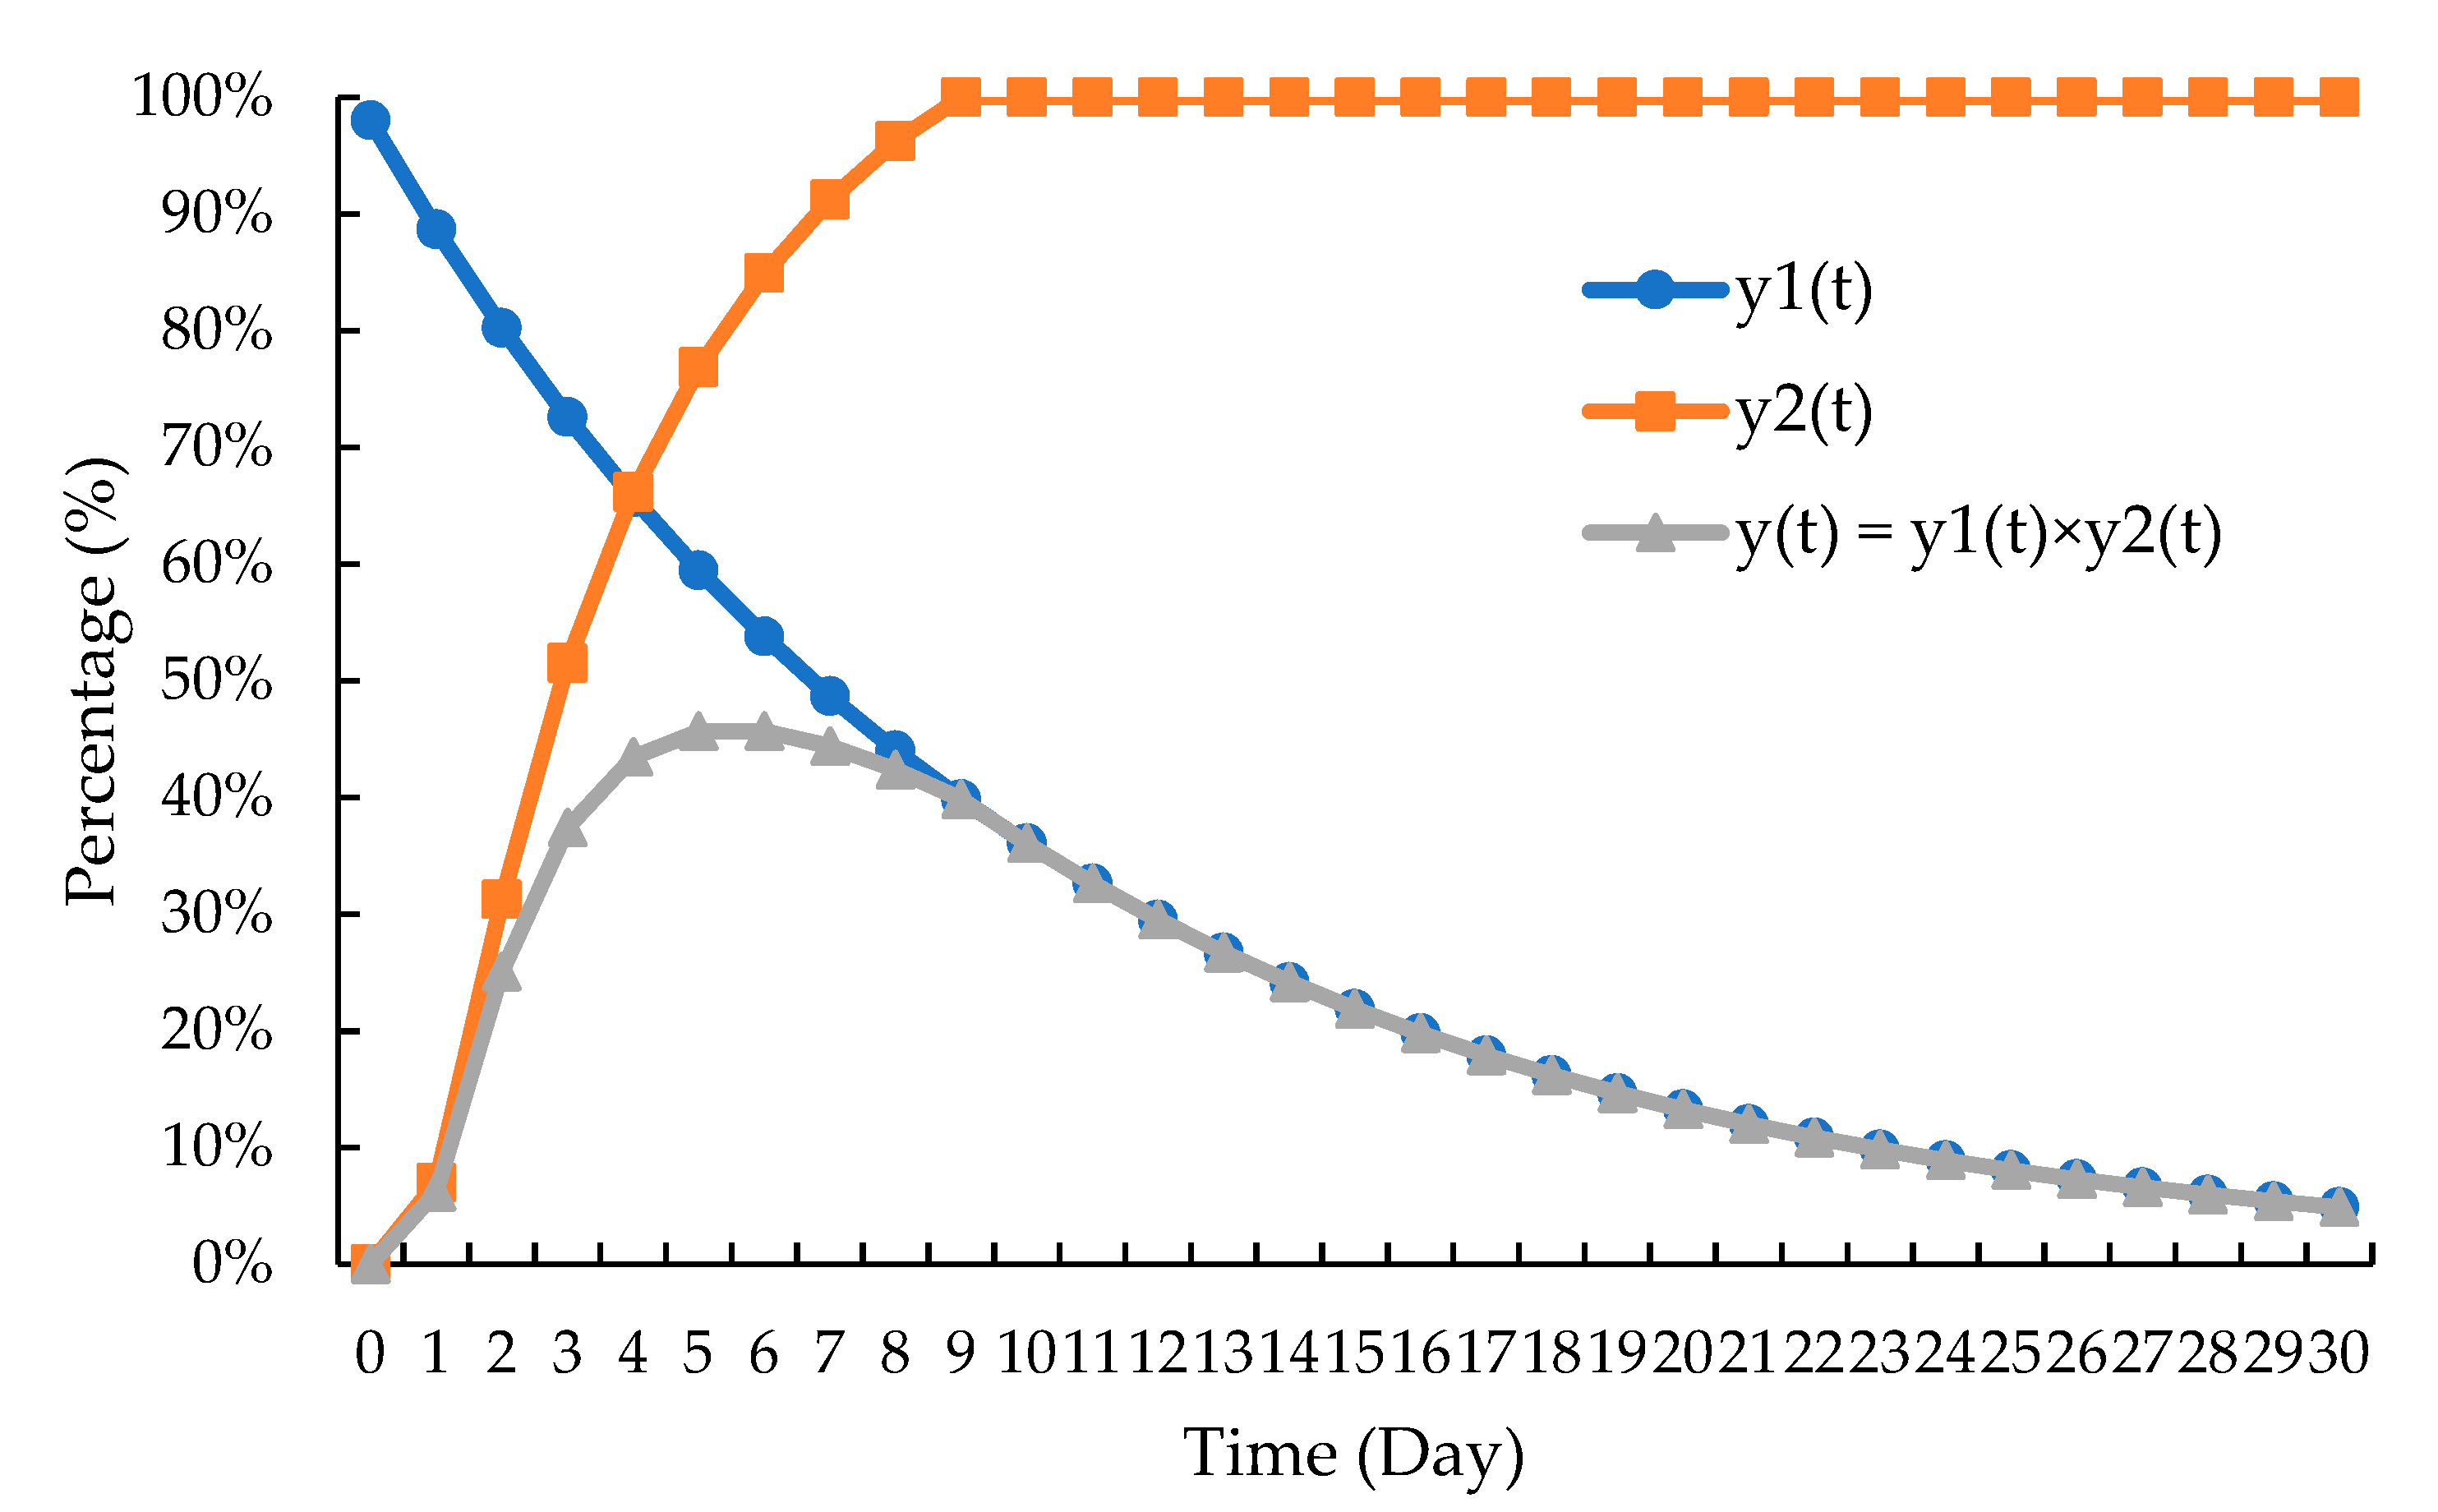
We assume that basic medical services will gradually resume within 30 days, and the evacuees’ demand for medical services will increase in the short term. Exponential estimation methods are often used to estimate changes in the number of evacuees after a disaster [55]. Therefore, the exponential simulation method is used to correct the number of evacuees in need of medical treatment. Suppose that the basic medical service shortage function on the t-th day is , and the proportion of demand for medical services on the t-th day is [8].
In Equations (24) and (25), can be determined respectively according to the actual geographical environment, geological conditions, earthquake damage degree, and historical data of the study area. Figure 4 shows an example of the proposed function over time.
Based on the analysis of factors affecting the needs of disaster victims, a formula for estimating the continuous change of evacuees who need different services during the evacuation period is proposed. Equations (26) and (27) are used to estimate the daily change in the number of evacuees who need medical services and living services within one month after the earthquake. In the equations, represents the number of evacuees on t-th day. is the proportion of the people taking refuge in local shelters after the earthquake. indicates the proportion of evacuees in need of medical services.
3.3. Forecast Model for Material Demand
In this section, according to the changing evacuation needs, we analyze the needs of the materials in different stages of rescue work. Through the number of evacuees, the daily quantity of supplies required by evacuees, and the tolerance of the evacuees to the shortage of supplies, the demand for different types of emergency supplies is obtained. Due to the existence of secondary disasters after the earthquake and the impact of delays in dynamic information and transportation delays, it is necessary to set a certain lead time to reserve some buffer stocks for emergency demands to prevent the shortage of supplies. The time-varying relief demand forecast model is formulated as:
where is the unit demand for i-type materials by evacuees who need j-type services; represents the number of evacuees who need j service on the t-th day; represents the upper bound preset, which is used to adjust the temporal headway between two consecutive material distributions to any given affected area without exceeding the corresponding maximum value; represents the service level coefficient chosen given that the tolerable possibility of time-varying material demand shortage is set to be . is the standard deviation of the daily relief demand associated with relief i; seasonal coefficient is considered for living materials; and represent the relief groups in terms of living supplies and medical relief, respectively.
where represents the time-varying mean value of the time-varying demand , and is given by Equation (30).
4. Case Study: Ya’an Earthquake
This section describes the case study used to evaluate the performance of the proposed method. It is based on the earthquake that struck Sichuan Province in China in April 2013.
4.1. The Earthquake of April 2013 in Ya’an
Being situated on one of the most active seismic belts, Sichuan Province is a place that has experienced many earthquakes in the past few years [56]. Ya’an is located in the central part of Sichuan Province, straddling the two major terrain areas of the Sichuan Basin and the Qinghai–Tibet Plateau, with a population of approximately 1.43 million (statistics data for 2021). The Ya’an earthquake was a magnitude 7 earthquake, and the mainshock was accompanied by 4045 aftershocks. It affected 1.52 million people, and the affected area reached 12,500 square kilometers. This paper studies Ya’an City under the earthquake scenario. The location of Ya’an City is shown in Figure 5.
Next, Section 4.2 discusses detailed information of the studied area, explaining how to collect information about the demand points, the characteristics of the affected areas, and information on the demands of evacuees.
4.2. Data
The magnitude of the Ya’an earthquake was 7, and the epicenter in Lushan County, Ya’an City, had an intensity of 6.4 degrees. Some optical cables and base stations in Ya’an were damaged and communications were interrupted. After an all-out emergency repair, the power grid was restored after a month, and the residents gradually returned to normal life. According to the statistics of the emergency center, the seismic precautionary intensity in Ya’an was 7 [41]. The population density of Ya’an was 93 people per square kilometer. According to the geographical environment, geological conditions, and refuge selection behavior of the affected population in Ya’an City, Sichuan Province, this paper assumes that the corresponding parameters of and are [8]. The proportion of evacuees who chose local shelters was 0.3 [57,58].
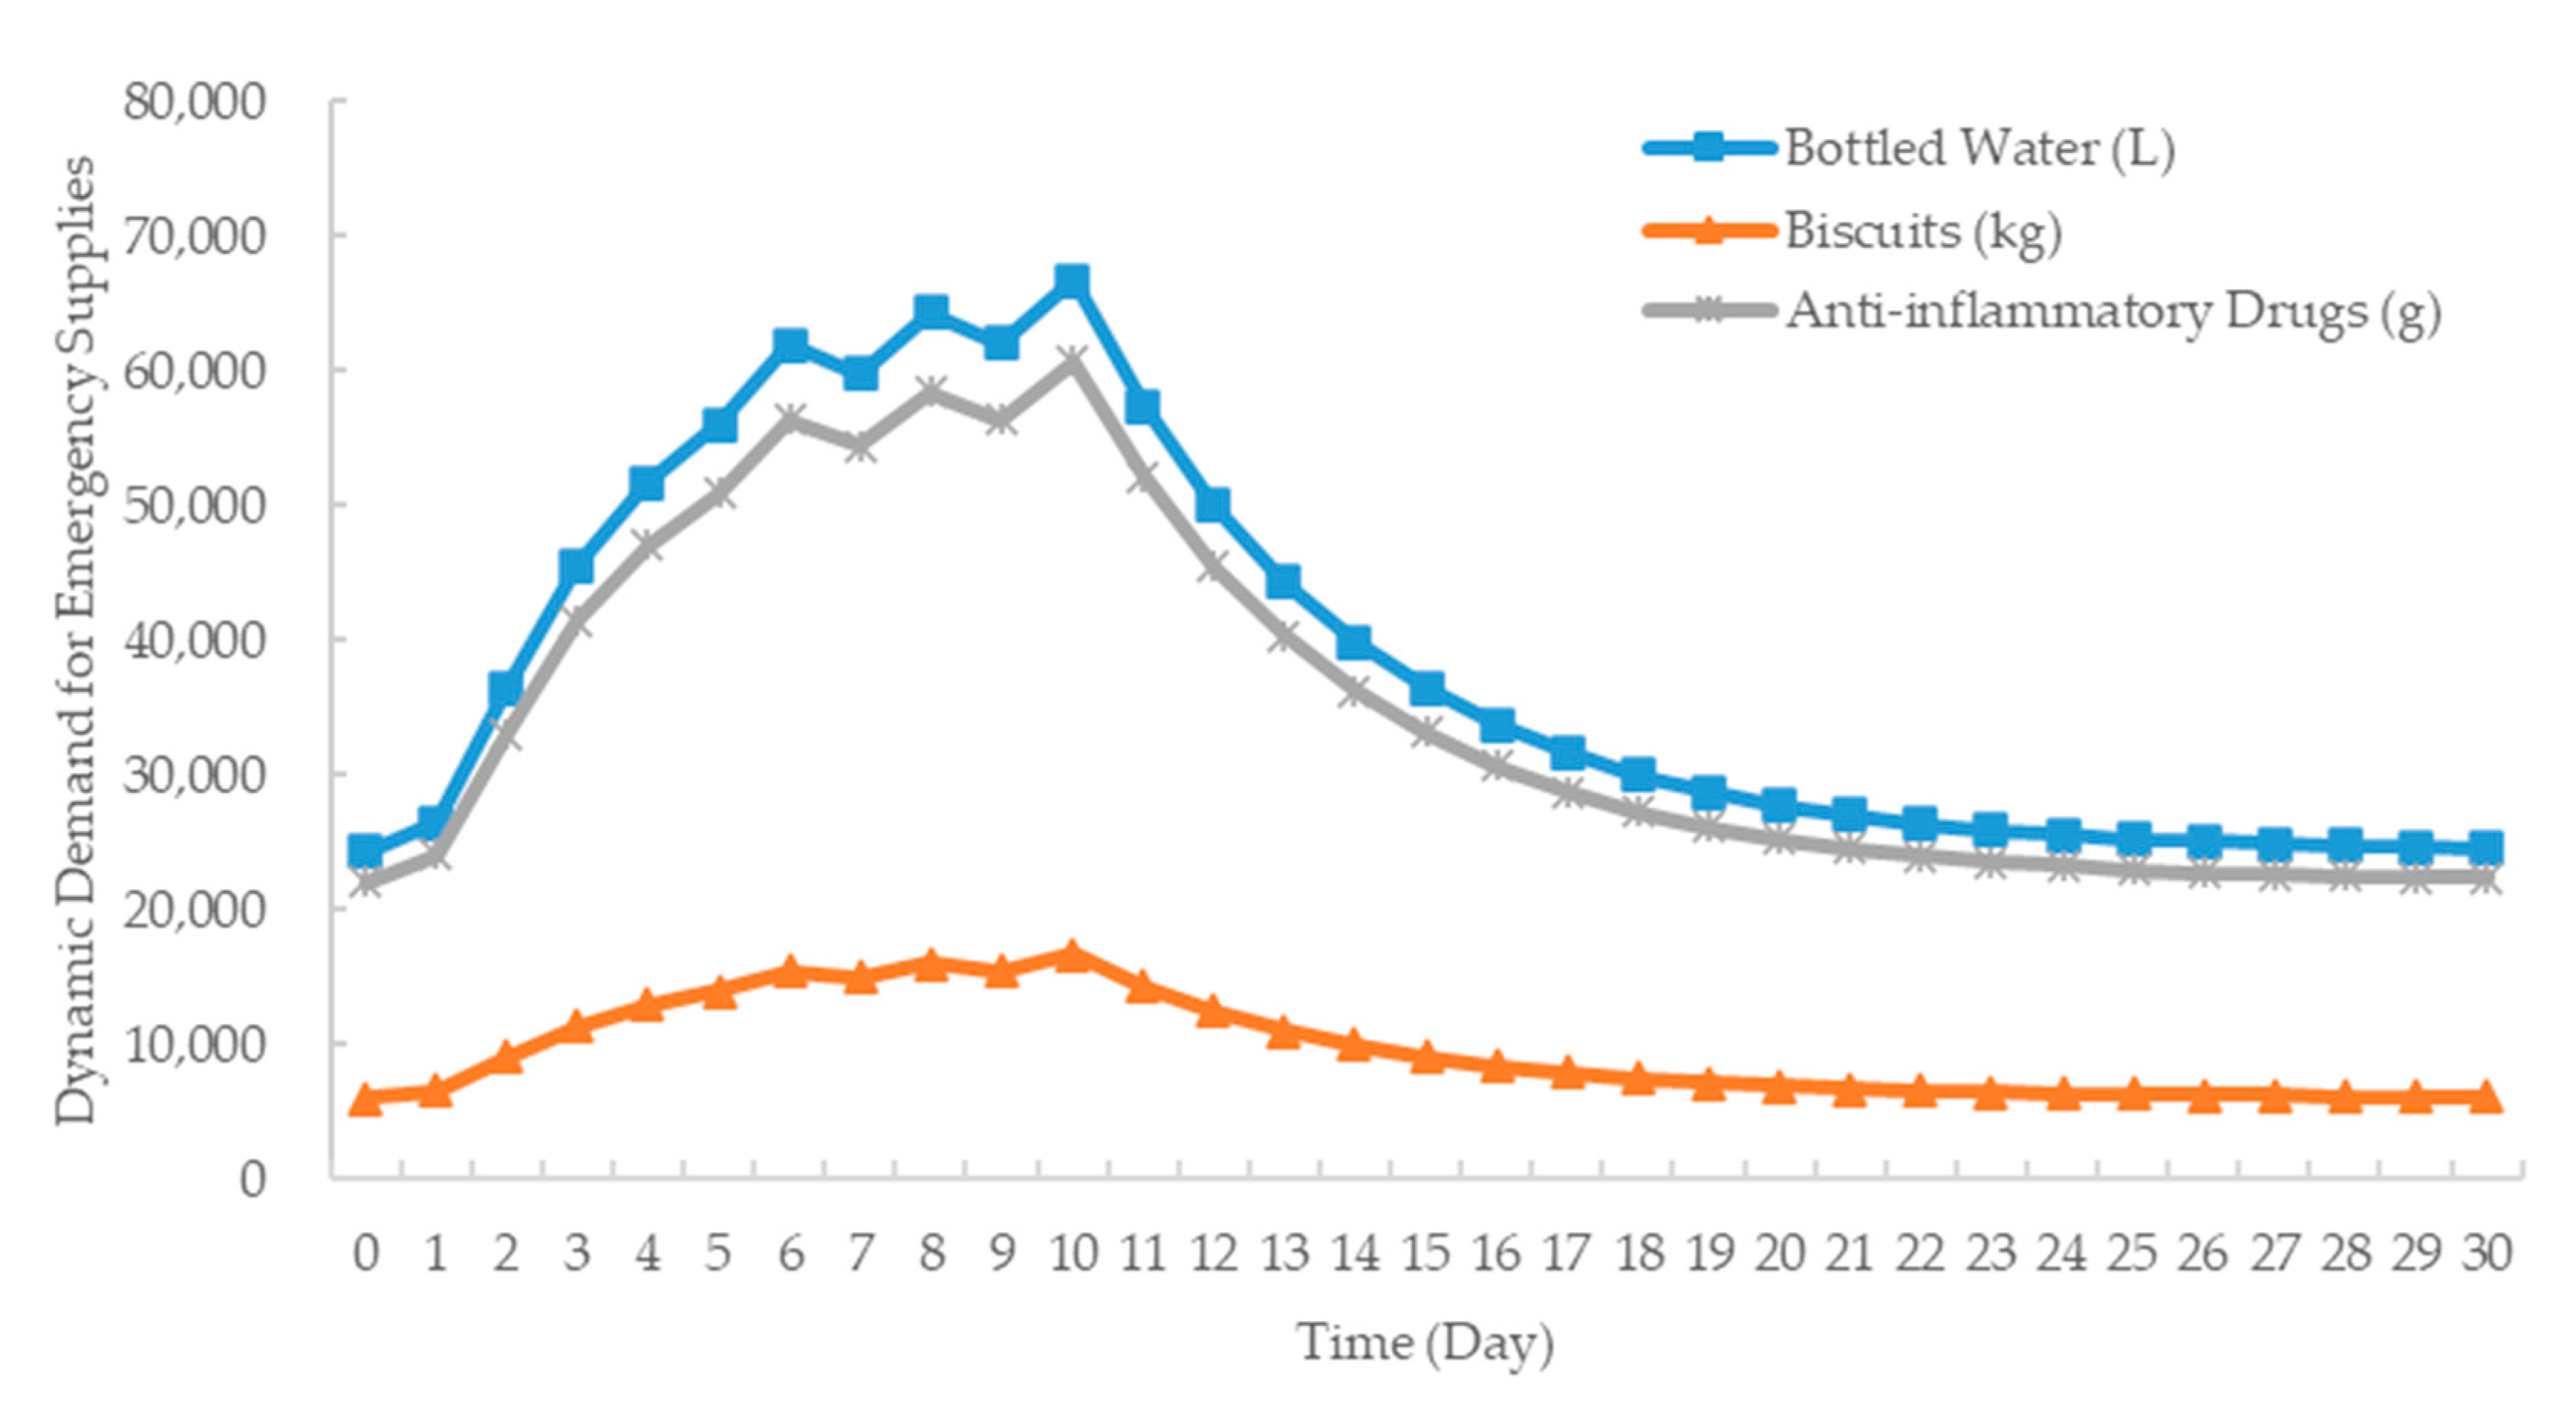
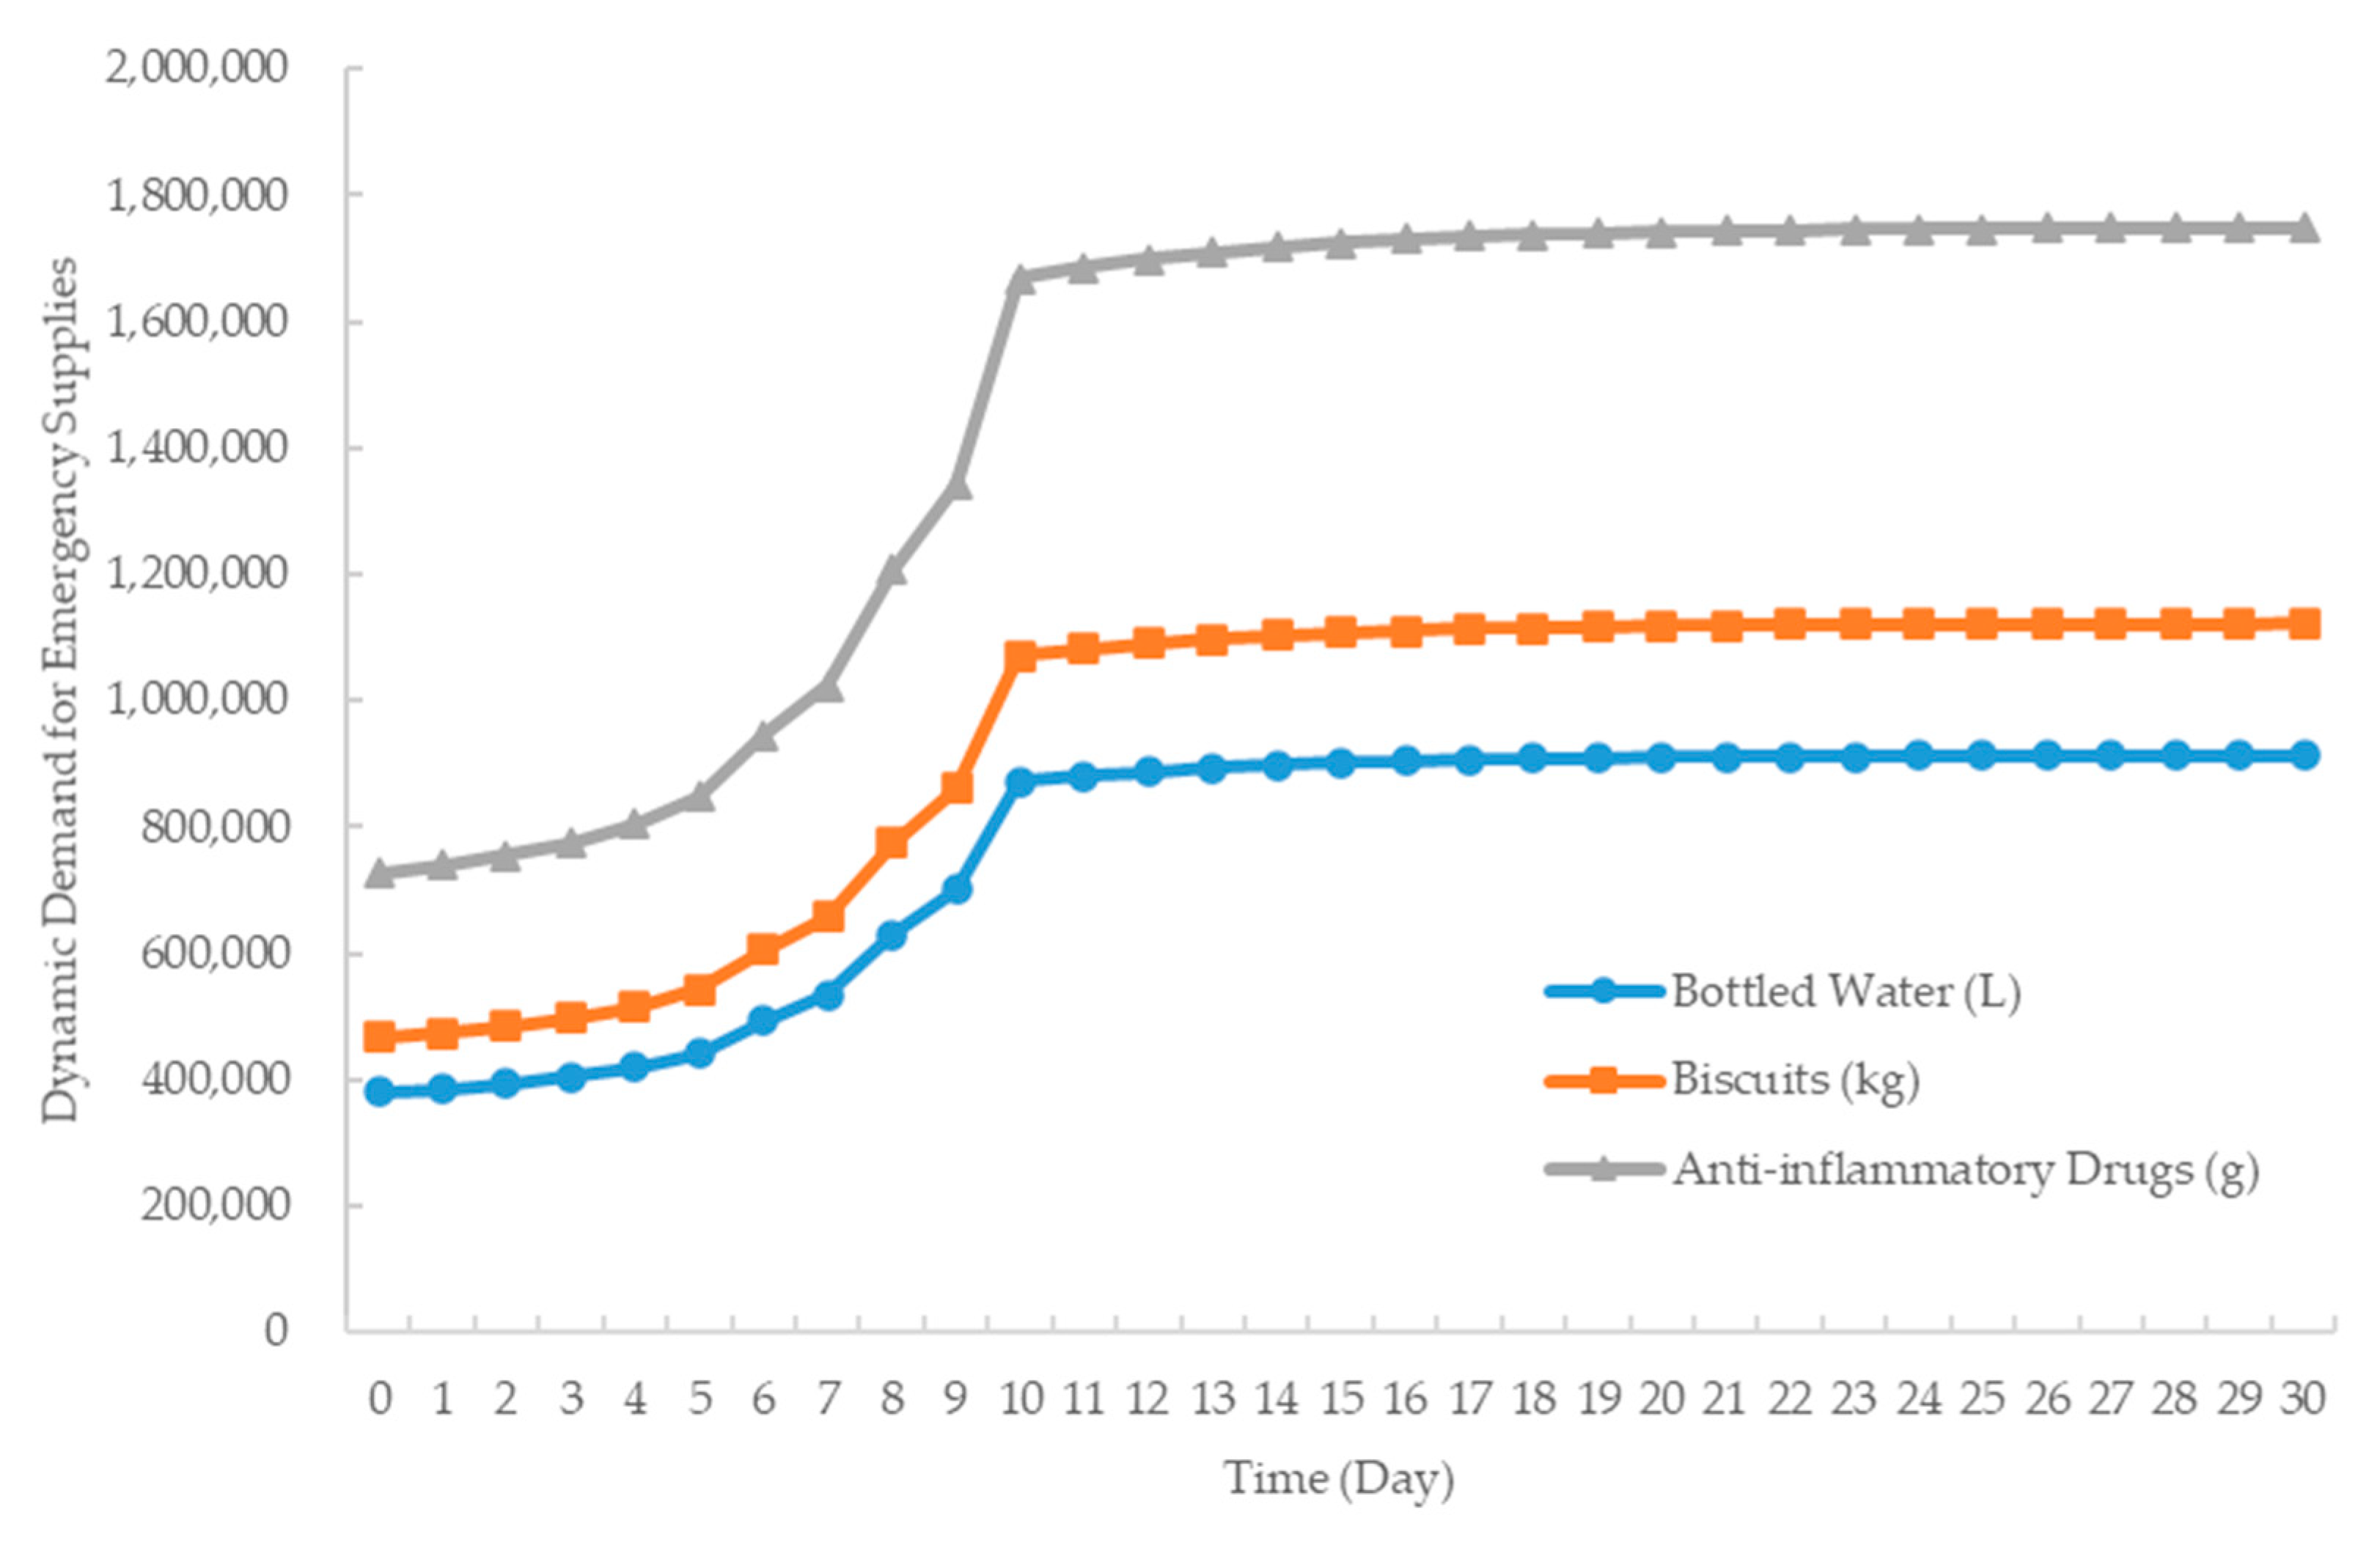
The emergency supplies were divided into two categories: basic living supplies and medical supplies for evacuees. In this case, drinking water and biscuits were adopted as the representative of emergency supplies for living, and anti-inflammatory drugs were used as the representative of supplies for medical treatment. This paper assumes that each evacuee needed 2 L of bottled water and 0.5 kg of biscuits every day. The daily demand for anti-inflammatory drugs for evacuees who needed daily services and medical aid was 1.5 g and 2 g, respectively. The out-of-stock rate of supplies was set to 5%, the service level was 1.65, and the lead time was 1 day. As the time of the Ya’an earthquake was in April, the evacuees’ demand for drinking water increased. Therefore, the seasonal coefficient increased to 1.1, and the seasonal coefficient of biscuits is 1. The parameter settings are shown in Table 5.
Due to the limited data resources and processing time after the earthquake, the supplies distribution lead time is set to 1 day in the short termEmergency rescue can be provided accurately and quickly to evacuees by calculating the daily requirements of different types of supplies to reduce casualties after the earthquake.
4.3. Results
4.3.1. Number of Evacuees
The linear regression model was adopted to calculate the number of people affected by the earthquake in the first 4 days. Then the data of the first 4 days were input into the gray–Markov chain disaster-affected model to solve the number of victims on the 4th to 10th days, assuming that the number of injured people in the first 4 days was . It is worth noting that the first number represents the number of victims after the earthquake, and the second number represents the number of victims on the first day. The cumulatively generated sequence is . The original data were tested for smoothness. , and . Therefore, the data satisfied the smoothness test, and the data can be used to predict the number of victims from the 4th to 10th days after the earthquake.
The matrix B and the data vector Y can be constructed through the original data sequence and the accumulation sequence.
Then calculate , are obtained. The model is proposed. The prediction model is . The optimization problems were solved by MATLAB R2019b on an Intel (R) Core (TM) i5-855−0U CPU 1.80 GH, 8G RAM running Windows 10. The gray prediction results of the number of victims from the 4th to 10th days are shown in Table 6.
The accuracy of the GM (1,1) model was tested by the variance ratio and the probability of small error. , indicating the accuracy level is level 1. Hence, the credibility and prediction accuracy of the gray prediction model was qualified and it could be used to predict the trend of related quantities.
To improve the prediction accuracy of the number of victims, the Markov chain model was adopted to revise the prediction data from the 4th to 10th days. The numbers in Table 6 was adopted to devise the state. Three states were obtained:
After calculation, the status of the number of victims within 3 days of the earthquake is shown in Table 7.
According to Equation (22), the state transition matrix of the number of victims within 3 days of the earthquake can be obtained:
According to the status of the number of victims within 3 days of the earthquake shown in Table 6, the Markov-optimized prediction results of the number of victims in 1 to 3 days was obtained, as shown in Table 8.
Because the number of victims on the 4th day is in the state , the initial state transition probability vector is . Through , it can be concluded the state on the 5th day may be . The number of victims on the 5th day is 58,372. Based on the gray–Markov chain model, the prediction results of the number of victims from the 5th to the 10th days after the earthquake are shown in Table 9.
It can be seen from Table 8 that the average relative residual error of GM (1,1) prediction results was 3.67%. After the optimization of the Markov chain model, the average relative error was reduced to 1.59%. The accuracy of the prediction results increased from 96.33% to 98.41%. Hence, the prediction results obtained by the gray–Markov prediction model are reliable.
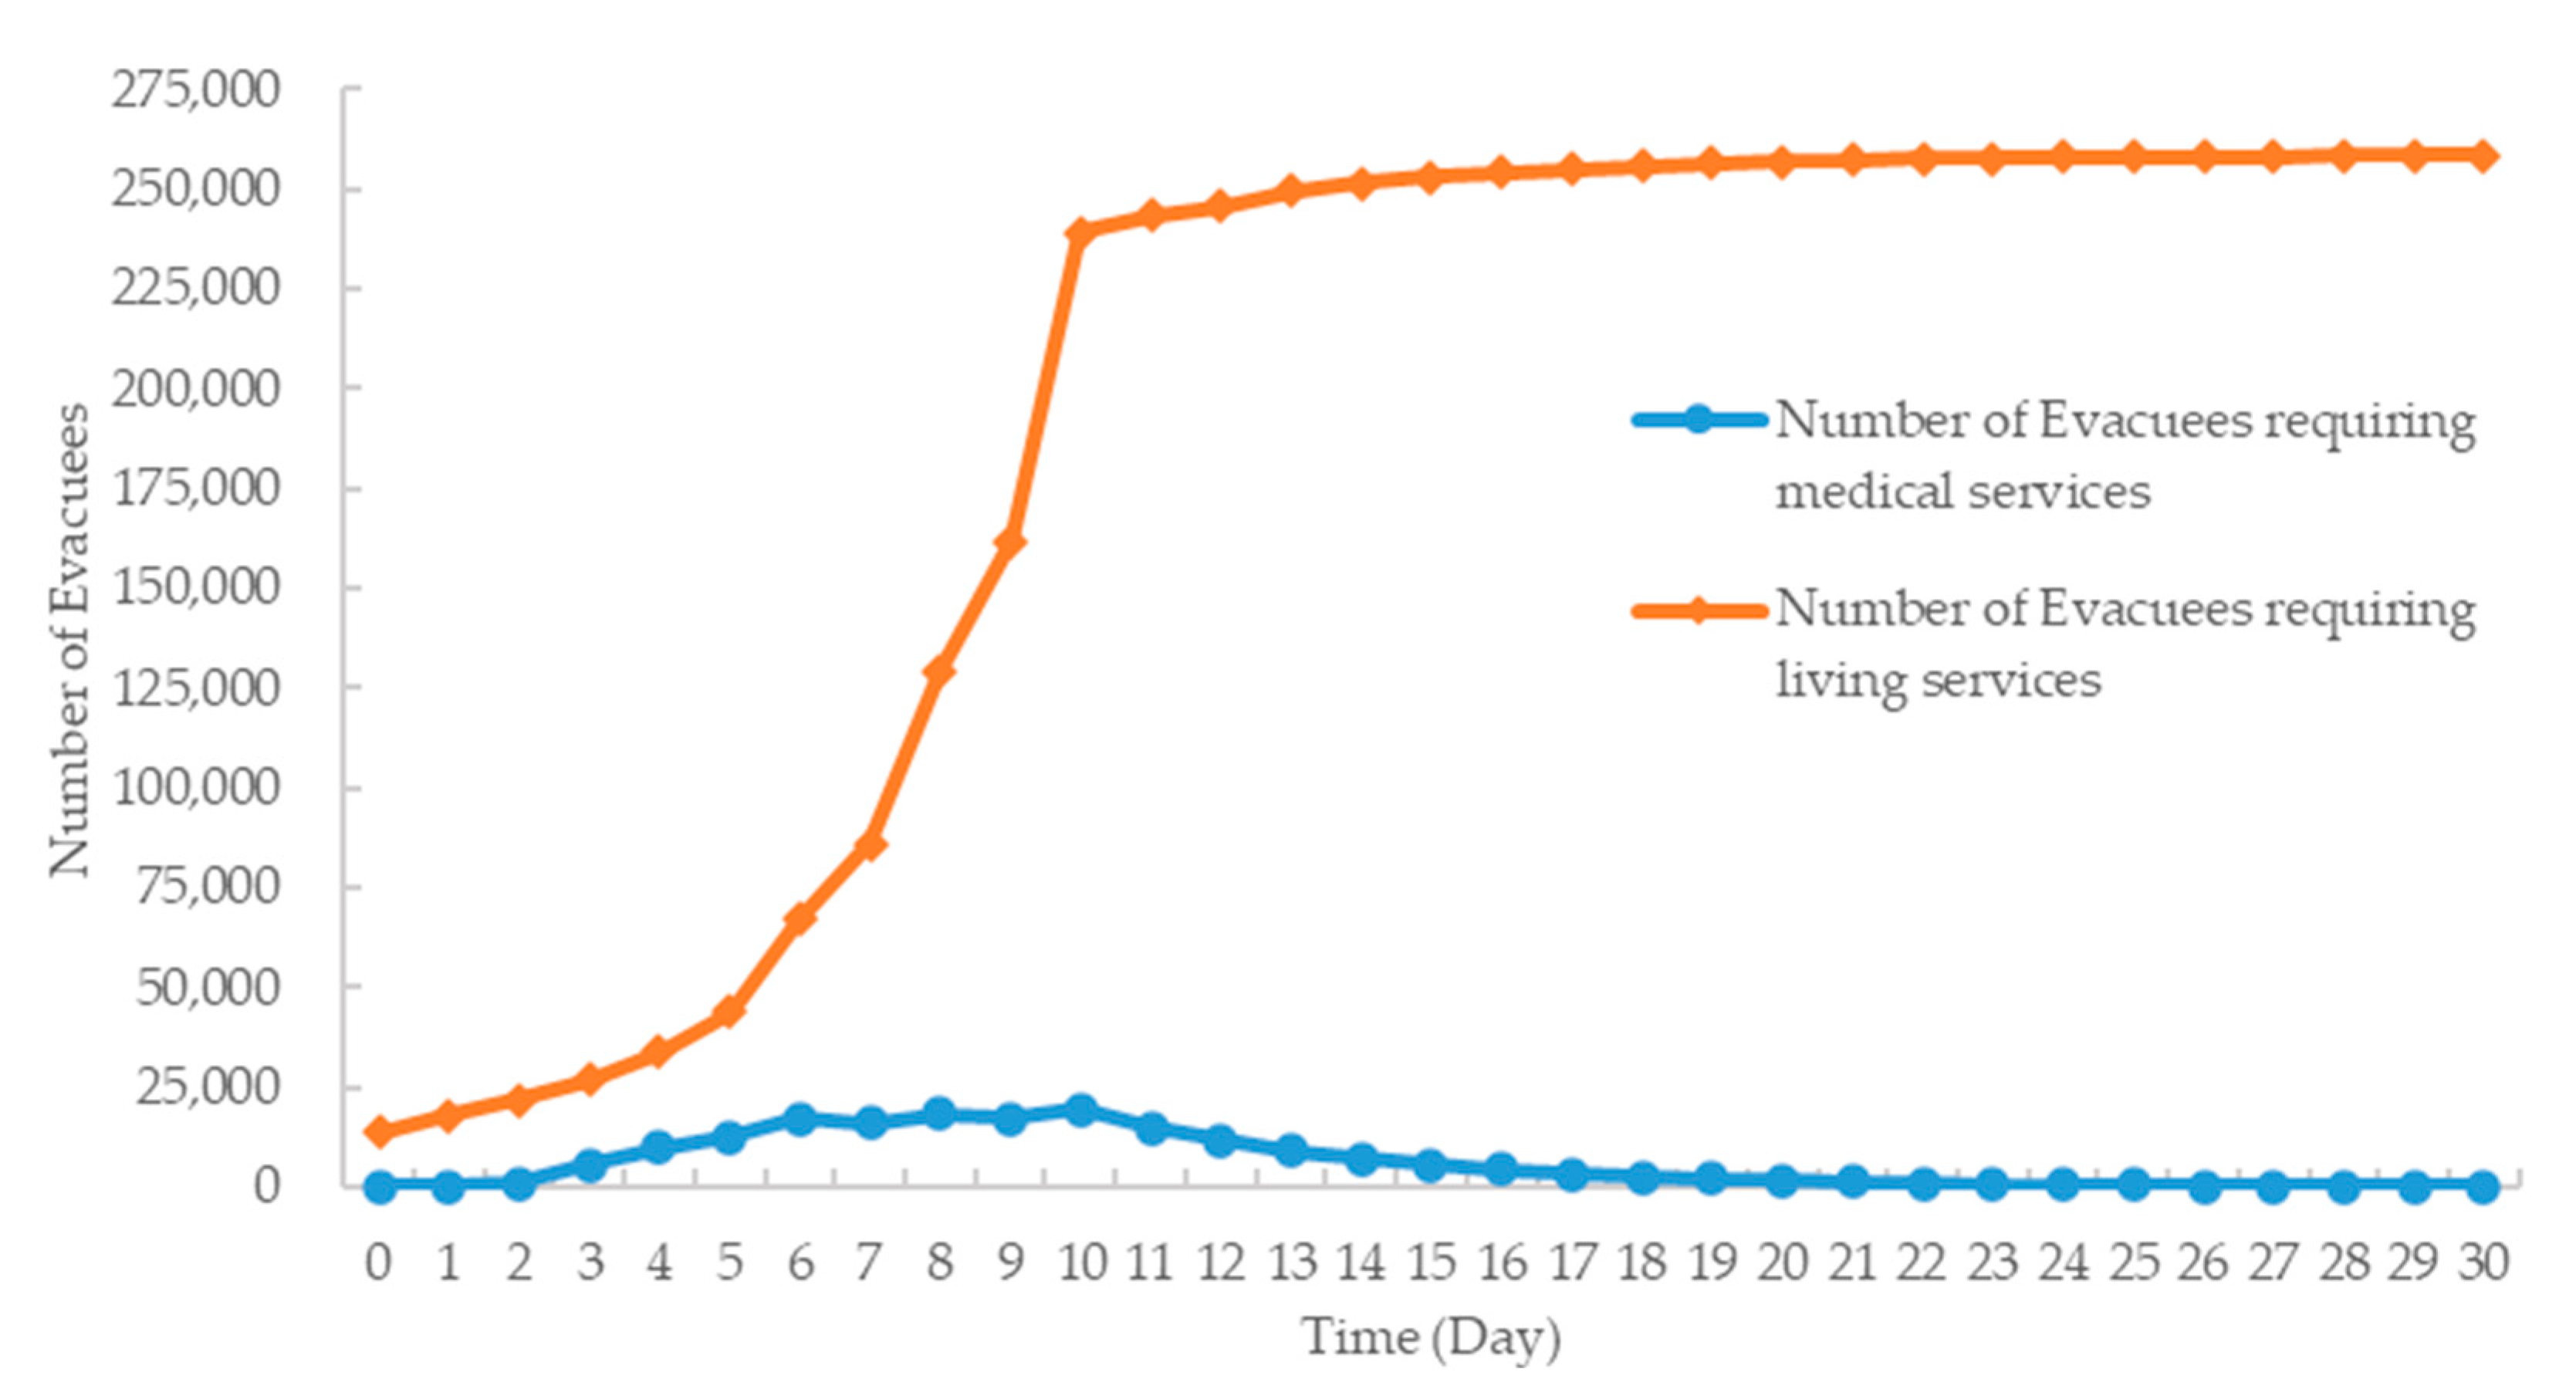
Using Equations (24)–(27) to calculate the change in the number of evacuees, the results are shown in Figure 6.
4.3.2. Estimation of Emergency Supplies Demand
According to the predicted value of the number of evacuees who need basic living services and medical services obtained in Section 4.3.1, the demand for different emergency supplies within 30 days of the earthquake was obtained through the relationship between the number of evacuees and the unit material demand. Figure 7 and Figure 8 show the calculation results of the total daily requirements of different types of supplies for evacuees after the earthquake.
As the evacuation period gradually stabilized after the earthquake, the number of evacuees in need of medical services increased to the maximum and then gradually decreased, and the number of evacuees in need of basic living services increased and stabilized. Hence, the former’s demand for supplies increased sharply and then decreased, while the latter increased sharply and stabilized.
5. Conclusions
Aiming to calculate the number of evacuees and material demands after an earthquake, this paper proposes a method for estimating the changes in evacuation demands that comprehensively considers geological, engineering, and human factors, because the demand for refuge is related to the number of victims. Firstly, a linear regression model was constructed to quickly predict the number of victims through limited information. Then a gray–Markov prediction model was proposed to predict the trend of the number of victims in the short term after the earthquake. A method for estimating the number of evacuees and the continuous changes in demand for supplies during the asylum period is presented. The validity of the method was verified by the Ya’an earthquake. Due to changes in the degree of demand for different evacuation services and variations in evacuation behavior, the number of evacuees will increase sharply for some time after the earthquake. It provides a basis for the construction scale and layout planning of an emergency shelter system. Based on the demand forecast data, the emergency material distribution center can prepare a certain amount of emergency supplies for evacuees in advance.
The method of evacuation demand prediction proposed in this paper needs to set specific parameters according to the behavior characteristics of evacuees after the earthquake and the actual situation of the affected area. There is a need to conduct more in-depth research on the characteristics of evacuee behavior and the stratification of asylum needs. The basic information and data are an important reference and basis for predicting emergency evacuation demands and emergency shelter planning. It is also necessary to further integrate the impact of victims’ psychological panic when calculating the demand for refuge.
Author Contributions
S.G. designed and revised this paper; H.H. provided valuable research insights into the analysis and investigation. All authors have read and agreed to the published version of the manuscript.
Funding
This research was funded by the National Key Research and Development Program in China, grant number 2016YFC0803207; the Longitudinal Research Project of Science and Technology Division in China, grant numbers B21M200010.
Institutional Review Board Statement
Not applicable.
Informed Consent Statement
Not applicable.
Data Availability Statement
Not applicable.
Conflicts of Interest
The authors declare no conflict of interest.
References
- UNDRR. Economic Losses, Poverty and Disasters 1998–2017. Available online: https://www.researchgate.net/publication/331642958_Economic_Losses_Poverty_and_Disasters_1998-2017 (accessed on 12 June 2021).
- Li, A.; Nozick, L.; Xu, N.; Davidson, R. Shelter location and transportation planning under hurricane conditions. Transp. Res. Pt. e-Logist. Transp. Rev. 2012, 48, 715–729. [Google Scholar] [CrossRef]
- Pérez-Galarce, F.; Ca Nales, L.J.; Vergara, C.; Sciences, A.C.n.-V. An optimization model for the location of disaster refuges. Socio-Econ. Plan. Sci. 2016, 59, 56–66. [Google Scholar] [CrossRef]
- Long, X. The Research on emergency Shelters Planning of Changsha. Master’s Thesis, Hunan University, Changsha, China, 2014. [Google Scholar]
- Wenyan, Y.; Yun, P.; Fengmei, Y. Two-level emergency centers location model based on the hazardous chemicals’ accidents. Syst. Eng. Theory Pract. 2015, 35, 728–735. [Google Scholar]
- Ozkapici, D.B.; Ertem, M.A.; Aygünes, H. Intermodal humanitarian logistics model based on maritime transportation in Istanbul. Nat. Hazards. 2016, 83, 345–364. [Google Scholar] [CrossRef]
- Chen, Z.; Chen, X.; Li, Q.; Chen, J. The temporal hierarchy of shelters: A hierarchical location model for earthquake-shelter planning. Int. J. Geogr. Inf. Sci. 2013, 27, 1612–1630. [Google Scholar] [CrossRef]
- Li, H. Research on Urban Emergency Shelter Planning Models with Consideration of Varying Shelter Demand. Ph.D. Thesis, Shanghai University, Shanghai, China, 2018. [Google Scholar]
- Strasser, F.; Bommer, J.; Şeşetyan, K.; Erdik, M.; Çağnan, Z.; Irizarry, J.; Goula, X.; Lucantoni, A.; Sabetta, F.; Bal, I.; et al. Seismic amplification maps of Italy based on site-specific microzonation dataset and one-dimensional numerical approach. Eng. Geol. 2021, 289, 106170. [Google Scholar] [CrossRef]
- Falcone, G.; Acunzo, G.; Mendicelli, A.; Mori, F.; Naso, G.; Peronace, E.; Porchia, A.; Romagnoli, G.; Tarquini, E.; Moscatelli, M. A comparative study of European earthquake loss estimation tools for a scenario in Istanbul. J. Earthqu. Eng. 2008, 12 (Suppl. 2), 246–256. [Google Scholar] [CrossRef]
- Tapia-Hernández, E.; Reddy, E.; Oros-Avilés, L.J. Earthquake predictions and scientific forecast: Dangers and opportunities for a technical and anthropological perspective. Earth Sci. Res. J. 2019, 23, 309–315. [Google Scholar] [CrossRef] [Green Version]
- Fayjaloun, R.; Negulescu, C.; Roullé, A.; Auclair, S.; Gehl, P.; Faravelli, M. Sensitivity of earthquake damage estimation to the input data (soil characterization maps and building exposure): Case study in the luchon valley, france. Geoscience 2021, 11, 249. [Google Scholar] [CrossRef]
- Zanini, M.A.; Hofer, L.; Pellegrino, C. A framework for assessing the seismic risk map of Italy and developing a sustainable risk reduction program. Int. J. Disaster Risk Reduct. 2019, 33, 74–93. [Google Scholar] [CrossRef]
- Su, Y. Planning and Design of Urban Disaster Prevention and Refuge Sites; China Construction Industry Press: Beijing, China, 2012. [Google Scholar]
- Trivedi, A.; Singh, A. A hybrid multi-objective decision model for emergency shelter location-relocation projects using fuzzy analytic hierarchy process and goal programming approach. Int. J. Proj. Manag. 2017, 35, 827–840. [Google Scholar] [CrossRef]
- Flores, I.; Ortuno, M.; Tirado, G.; Vitoriano, B. Supported evacuation for disaster relief through lexicographic goal programming. Mathematics 2020, 8, 648. [Google Scholar] [CrossRef]
- Bayram, V.; Yaman, H. Shelter location and evacuation route assignment under uncertainty: A benders decomposition approach. Transp. Sci. 2017, 52, 416–436. [Google Scholar] [CrossRef]
- Sheu, J.B. Dynamic relief-demand management for emergency logistics operations under large-scale disasters. Transp. Res. Pt. e-Logist. Transp. Rev. 2010, 46, 1–17. [Google Scholar] [CrossRef]
- Taskin, S.; Lodree, E.J. Inventory decisions for emergency supplies based on hurricane count predictions. Int. J. Prod. Econ. 2010, 126, 66–75. [Google Scholar] [CrossRef]
- Shilton, E. Persuasive design for products leading to health and sustainability using case-based reasoning. Sustainability 2016, 8, 318. [Google Scholar] [CrossRef] [Green Version]
- Zhang, Y. Research on Emergency Logistics System and Material Management under Earthquake Disaster. Master’s Thesis, Hefei University of Techonology, Hefei, China, 2012. [Google Scholar]
- Ohlmacher, G.C.; Davis, J.C. Using multiple logistic regression and GIS technology to predict landslide hazard in northeast Kansas, USA. Eng. Geol. 2003, 69, 331–343. [Google Scholar] [CrossRef]
- Banerjee, M.M.; Gillespie, D.F. Strategy and Organizational Disaster Preparedness. Disasters 2010, 18, 344–354. [Google Scholar] [CrossRef]
- Koltko-Rivera, M.E. Rediscovering the later version of Maslow’s hierarchy of needs: Self-transcendence and opportunities for theory, research, and unification. Rev. Gen. Psychol. 2006, 10, 302–317. [Google Scholar] [CrossRef]
- Benson, S.G.; Dundis, S.P. Understanding and motivating health care employees: Integrating Maslow’s hierarchy of needs, training and technology. J. Nurs. Manag. 2003, 11, 315–320. [Google Scholar] [CrossRef]
- Allen, J.; Muoz, J.C.; Ortúzar, J. Understanding public transport satisfaction: Using maslow’s hierarchy of (transit) needs. Transp. Policy 2019, 81, 75–94. [Google Scholar] [CrossRef]
- Ran, M. Based on the Seismic Behavior Psychological Refuge Shelter Space System Research. Master’s Thesis, Southwest Jiaotong University, Chengdu, China, 2012. [Google Scholar]
- Chen, C.; Chen, T.; Chen, Y.; Yu, S.; Chung, P. Storm surge prediction with management information systems: A case study of estimating value and observations system. Nat. Hazards. 2013, 66, 1009–1027. [Google Scholar] [CrossRef]
- Varotsos, P.; Sarlis, N.V.; Skordas, E.S. Natural Time Analysis: The New View of Time: Precursory Seismic Electric Signals, Earthquakes and Other Complex Time Series; Springer Science & Business Media: Berlin/Heidelberg, Germany, 2011. [Google Scholar]
- Varotsos, P.A.; Sarlis, N.V.; Skordas, E.S. Study of the temporal correlations in the magnitude time series before major earthquakes in Japan. J. Geophys. Res. Space Physics. 2014, 119, 9192–9206. [Google Scholar] [CrossRef]
- Sarlis, N.V.; Skordas, E.S.; Varotsos, P.A.; Nagao, T.; Kamogawa, M.; Uyeda, S. Spatiotemporal variations of seismicity before major earthquakes in the Japanese area and their relation with the epicentral locations. Proc. Natl. Acad. Sci. USA 2015, 112, 986–989. [Google Scholar] [CrossRef] [Green Version]
- Sarlis, N.; Skordas, E.; Varotsos, P. Order parameter fluctuations of seismicity in natural time before and after mainshocks. EPL Europhys. Lett. 2010, 91, 59001. [Google Scholar] [CrossRef] [Green Version]
- Sarlis, N.V.; Skordas, E.S.; Varotsos, P.A.; Nagao, T.; Kamogawa, M.; Tanaka, H.; Uyeda, S. Minimum of the order parameter fluctuations of seismicity before major earthquakes in Japan. Proc. Natl. Acad. Sci. USA 2013, 110, 13734–13738. [Google Scholar] [CrossRef] [Green Version]
- E Silva, F.B.; Freire, S.; Schiavina, M.; Rosina, K.; Marín-Herrera, M.A.; Ziemba, L.; Craglia, M.; Koomen, E.; Lavalle, C. Uncovering temporal changes in Europe’s population density patterns using a data fusion approach. Nat. Commun. 2020, 11, 4631. [Google Scholar] [CrossRef] [PubMed]
- GB/T 38591-2020. Standard for Seismic Resilience Assessment of Buildings; China Quality and Standards Publishing: Beijing, China, 2020. [Google Scholar]
- Jena, R.; Pradhan, B.; Beydoun, G. Earthquake vulnerability assessment in Northern Sumatra province by using a multi-criteria decision-making model. Int. J. Disaster Risk Reduct. 2020, 46, 101518. [Google Scholar] [CrossRef]
- GB/T 17742-2020. The Chinese Seismic Intensity Scale; Seismological Press: Beijing, China, 2020. [Google Scholar]
- Du, K.; Ding, B.; Luo, H.; Sun, J. Relationship between peak ground acceleration, peak ground velocity, and macroseismic intensity in Western China. Bull. Seismol. Soc. Am. 2019, 109, 284–297. [Google Scholar] [CrossRef]
- GB/T 50223-2008. Standard for Classification of Seismic Protection of Building Constructions; China Architecture Publishing: Beijing, China, 2008. [Google Scholar]
- GB 50413-2007. Standard for Urban Planning on Earthquake Resistance and Hazardous Prevention; China Architecture Publishing: Beijing, China, 2007. [Google Scholar]
- GB/T 50011-2010. Code for Seismic Design of Buildings; China Architecture Publishing: Beijing, China, 2010. [Google Scholar]
- Lin, L.; Nilsson, A.; Sjölin, J.; Abrahamsson, M.; Tehler, H. On the perceived usefulness of risk descriptions for decision-making in disaster risk management. Reliab. Eng. Syst. Saf. 2015, 142, 48–55. [Google Scholar] [CrossRef] [Green Version]
- Aijazi, O. Social repair and structural inequity: Implications for disaster recovery practice. Int. J. Dis. Resili. Built Environ. 2015, 6, 454–467. [Google Scholar] [CrossRef]
- Falcone, G.; Boldini, D.; Martelli, L.; Amorosi, A. Quantifying local seismic amplification from regional charts and site specific numerical analyses: A case study. Bull. Earthq. Eng. 2020, 18, 77–107. [Google Scholar] [CrossRef]
- Gazetas, G. Vibrational characteristics of soil deposits with variable wave velocity. Int. J. Numer. Anal. Methods Geomech. 1982, 6, 1–20. [Google Scholar] [CrossRef]
- Mayoral, J.; Asimaki, D.; Tepalcapa, S.; Wood, C.; Roman-de la Sancha, A.; Hutchinson, T.; Franke, K.; Montalva, G. Site effects in Mexico City basin: Past and present. Soil Dyn. Earthq. Eng. 2019, 121, 369–382. [Google Scholar] [CrossRef]
- Wasowski, G.J. Advances and problems in understanding the seismic response of potentially unstable slopes. Eng. Geol. 2011, 122, 73–83. [Google Scholar] [CrossRef]
- Das, R.; Hanaoka, S. Relief inventory modeling with stochastic lead-time and demand. Oper. Res. 2015, 55, 547–548. [Google Scholar]
- Mohammadi, R.; Ghomi, S.; Zeinali, F. A new hybrid evolutionary based RBF networks method for forecasting time series: A case study of forecasting emergency supply demand time series. Eng. Appl. Artif. Intell. 2014, 36, 204–214. [Google Scholar] [CrossRef]
- Zhou, G.; Wang, H.; Li, X. Earthquake disasters in Yunnan Province in 2008. J. Seismol. Res. 2009, 312–315. [Google Scholar] [CrossRef]
- Chen, D. Resources Allocation and Optimization in Mass Disaster: The Case of Earthquake. Ph.D. Thesis, Beijing Institute of Technology, Beijing, China, 2017. [Google Scholar]
- Zhou, M. Emergency Material Demand Forecasting and Supply Strategy Simulation under Earthquake Disaster. Master’s Thesis, Beijing Jiaotong University, Beijing, China, 2019. [Google Scholar]
- Wang, C.N.; Dang, T.T.; Nguyen, N.; Le, T. Supporting better decision-making: A combined grey model and data envelopment analysis for efficiency evaluation in E-Commerce marketplaces. Sustainability 2020, 12, 385. [Google Scholar] [CrossRef]
- Zakaria, N.N.; Othman, M.; Sokkalingam, R.; Daud, H.; Abdullah, L.; Abdul Kadir, E. Markov chain model development for forecasting air pollution index of Miri, Sarawak. Sustainability 2019, 11, 5190. [Google Scholar] [CrossRef] [Green Version]
- Sheu, J.B.; Pan, C. A method for designing centralized emergency supply network to respond to large-scale natural disasters. Transp. Res. Pt. B-Methodol. 2014, 67, 284–305. [Google Scholar] [CrossRef]
- Guangcai, F.; Zhiwei, L.; Xinjian, S.; Bing, X.; Yanan, D. Source parameters of the 2014 Mw 6. 1 South Napa earthquake estimated from the Sentinel 1A, COSMO-SkyMed and GPS data. Tectonophysics 2015, 655, 139–146. [Google Scholar] [CrossRef]
- GB 21734-2008. Emergency Shelter for Earthquake Disasters-Site and Its Facilities; China Quality and Standards Publishing: Beijing, China, 2008. [Google Scholar]
- GB/T 33744-2017. Emergency Shelter for Earthquake Disasters-Guidelines on the Operation and Management; China Quality and Standards Publishing: Beijing, China, 2017. [Google Scholar]
Figure 1.
Maslow’s hierarchy of needs.

Figure 2.
Demand hierarchy for emergency asylum.

Figure 3.
Demand forecasting process for evacuees.

Figure 4.
Function change trend.

Figure 5.
Location of Ya’an in Sichuan Province.

Figure 6.
Trends in the number of evacuees within 30 days of the earthquake.

Figure 7.
The dynamic demand for emergency supplies of evacuees in need of medical services.

Figure 8.
The dynamic demand for emergency supplies of evacuees in need of living services.


Table 1.
Analysis of factors affecting the number of victims.
| Influencing Factors | Occurrence Time | Magnitude | Intensity | Population Density | Seismic Precautionary Intensity | Number of Victims |
|---|---|---|---|---|---|---|
| Occurrence time | 1.00 | 0.01 | −0.15 | 0.11 | 0.26 | −0.20 |
| Magnitude | 0.01 | 1.00 | 0.25 | −0.28 | −0.18 | 0.51 |
| Intensity | −0.15 | 0.25 | 1.00 | −0.17 | −0.24 | 0.61 |
| Population density | 0.11 | −0.28 | −0.17 | 1.00 | 0.07 | 0.48 |
| Building defense capabilities | 0.26 | −0.18 | −0.24 | 0.07 | 1.00 | 0.36 |
| Number of victims | −0.20 | 0.51 | 0.61 | 0.48 | 0.36 | 1.00 |
Table 2.
Correction factor for emergency response ability after the earthquake.
| Time (h) | 0–12 | 12–24 | 24–36 | 36–48 | 48–60 | 60–72 | ≥72 | ≥84 |
|---|---|---|---|---|---|---|---|---|
| Correction Factor | 0.3 | 0.4 | 0.5 | 0.6 | 0.7 | 0.8 | 0.9 | 1 |
Table 3.
Regression fitting results of the linear regression model.
| Parameter | Evaluated Value | Sig. | Significance |
|---|---|---|---|
| −2.46 | 0.001 | Very significant | |
| 3.00 | 0.002 | Very significant | |
| −0.36 | 0.02 | Significant | |
| 0.58 | 0.03 | Significant | |
| 0.691 | |||
Table 4.
The accuracy grading standards.
| P | C | Accuracy Grading |
|---|---|---|
| >0.95 | <0.35 | Good |
| >0.80 | <0.5 | Qualified |
| >0.75 | <0.65 | Barely pass |
| ≤0.70 | ≥0.65 | Unqualified |
Table 5.
Emergency supplies-related parameter settings.
| 2 | 2 | 0.5 | 0.5 | 1.5 | 2 | 0.05 | 1.65 | 1 | 1.0–1.1 |
Table 6.
The accuracy grading standards.
| Day | Original Value | Predictive Value | Absolute Error | Relative Error (%) | Original Value/ Predictive Value |
|---|---|---|---|---|---|
| 0d | 13,950 | 13,950 | 0 | 0 | 1.000 |
| 1d | 18,600 | 20,196 | −1596 | 8.58 | 0.921 |
| 2d | 27,900 | 26,723 | 1177 | 4.21 | 1.044 |
| 3d | 37,200 | 35,358 | 1842 | 4.95 | 1.052 |
| 4d | 46,500 | 46,783 | −283 | 0.61 | 0.994 |
| 5d | -- | 61,900 | -- | -- | -- |
| 6d | -- | 81,901 | -- | -- | -- |
| 7d | -- | 108,366 | -- | -- | -- |
| 8d | -- | 143,382 | -- | -- | -- |
| 9d | -- | 189,713 | -- | -- | -- |
| 10d | -- | 251,015 | -- | -- | -- |
Table 7.
State of each day after the earthquake.
| Days after Earthquake | 0d | 1d | 2d | 3d | 4d |
|---|---|---|---|---|---|
| State |
Table 8.
Markov chain prediction results for the number of victims within 3 days of the earthquake.
| Day | Original Value | GM (1,1) Gray Prediction Model | Gray–Markov Chain Model | ||
|---|---|---|---|---|---|
| Predictive Value | Relative Error (%) | Predictive Value | Relative Error (%) | ||
| 0d | 13,950 | 13,950 | 0 | 13,762 | 1.35 |
| 1d | 18,600 | 20,196 | 8.58 | 19,045 | 2.39 |
| 2d | 27,900 | 26,723 | 4.21 | 27,525 | 1.34 |
| 3d | 37,200 | 35,358 | 4.95 | 36,419 | 2.10 |
| 4d | 46,500 | 46,783 | 0.61 | 46,151 | 0.75 |
Table 9.
Markov chain prediction value of the number of victims in the 4th to 10th days after the earth-quake.
Table 9.
Markov chain prediction value of the number of victims in the 4th to 10th days after the earth-quake.
| Day | State | Optimization Results |
|---|---|---|
| 5d | 58,372 | |
| 6d | 84,358 | |
| 7d | 102,189 | |
| 8d | 147,683 | |
| 9d | 178,899 | |
| 10d | 258,545 |
Publisher’s Note: MDPI stays neutral with regard to jurisdictional claims in published maps and institutional affiliations. |
© 2021 by the authors. Licensee MDPI, Basel, Switzerland. This article is an open access article distributed under the terms and conditions of the Creative Commons Attribution (CC BY) license (https://creativecommons.org/licenses/by/4.0/).
Share and Cite
MDPI and ACS Style
Geng, S.; Hou, H. Demand Stratification and Prediction of Evacuees after Earthquakes. Sustainability 2021, 13, 8837. https://doi.org/10.3390/su13168837
AMA Style
Geng S, Hou H. Demand Stratification and Prediction of Evacuees after Earthquakes. Sustainability. 2021; 13(16):8837. https://doi.org/10.3390/su13168837
Chicago/Turabian StyleGeng, Shaoqing, and Hanping Hou. 2021. "Demand Stratification and Prediction of Evacuees after Earthquakes" Sustainability 13, no. 16: 8837. https://doi.org/10.3390/su13168837
Note that from the first issue of 2016, this journal uses article numbers instead of page numbers. See further details here.