
Study on Evolution Mechanism of Structure-Type Rockburst: Insights from Discrete Element Modeling


1
School of Resources and Safety Engineering, Central South University, Changsha 410083, China
2
School of Civil and Resource Engineering, University of Science and Technology Beijing, Beijing 100083, China
3
Faculty of Land Resource Engineering, Kunming University of Science and Technology, Kunming 650093, China
*
Author to whom correspondence should be addressed.
Sustainability 2021, 13(14), 8036; https://doi.org/10.3390/su13148036
Submission received: 10 May 2021
/
Revised: 13 July 2021
/
Accepted: 15 July 2021
/
Published: 19 July 2021
(This article belongs to the Special Issue Advances in Rock Mechanics and Geotechnical Engineering)
Abstract
:Taking the “11.28” rockburst occurred in the Jinping II Hydropower Station as the engineering background, the evolution mechanism of structure-type rockburst was studied in detail based on the particle flow code. The results indicate that the failure mechanism of structure-type rockburst includes a tensile fracture induced by tangential compressive stress and a shear fracture caused by shear stress due to overburdened loadings and shear slip on the structural plane. In addition, it is found that the differences between structure-type rockburst and strainburst mainly include (a) the distribution of the local concentrated stress zone after excavation, (b) the evolution mechanism, and (c) the failure locations. Finally, the influence of four factors on the structure-type rockburst are explored. The results show that (1) when the friction coefficient is greater than 0.5, the effect of structural plane is weakened, and the rock near excavation tends to be intact, the structural-type rockburst intensity decreases; (2) the dissipated and radiated energy in structural-type rockburst reduces with rockmass heterogeneity m; (3) the lateral pressure coefficient has a significant effect on the intensity of deep rock failure, specifically in the form of the rapid growth in dissipative energy; (4) and the structural-type rockburst is more pronounced at a structural plane length near 90 mm.
1. Introduction
Globally, there is an increasing demand for clean energy due to national controls on CO2 emissions [1]. Hydropower is a typically clean energy source that contributes about 16% of global electricity production at all renewable energy sources [2], which plays an important role in maintaining social stability and sustainable development. However, many deep tunnels are designed in hydropower stations, owing to topographical and geological conditions. Therefore, during construction, rockbursts often occur in hard brittle rocks after excavation under high geostress [3], which severely limits the safety and sustainability of site construction.
Rockburst is a failure phenomenon in which the tangential stress in hard brittle surrounding rock exceeds its strength limit due to excavation unloading under high in situ stress. Due to sharp release of elastic energy, rockburst is usually accompanied by spalling of rock debris, dynamic ejection of rock blocks, and different degrees of crackling sound. Both strainburst and spalling are common stress-induced failure phenomena after excavation in brittle rock under high geostress [4]. Strainburst is a violent failure accompanying the ejection of rock fragments and a large release of energy [5]; however, spalling is a static progressive failure in a stable manner with no obvious ejection performance [6], which depends on the magnitude of energy stored in surrounding rock before failure. Structure-type rockburst in this study is the kind of rockburst influenced by the local geological structure near excavation, e.g., joints, faults, or other structural planes, in the surrounding rock of deep underground engineering [7,8]. The main difference between structure-type rockburst and strainbursts is that the former is obviously impacted by the structural plane, which makes the two distinct in terms of the mechanisms of energy release and the excavation damage processes [5].
In order to effectively prevent and control rockburst, it is extremely important to study the evolution mechanism of rockburst. A large number of laboratory tests had been carried out to study the rockburst. He et al. [9] reproduced the rockburst process in the laboratory, which was divided into four stages, namely the calm period, small grains ejection, rock flakes and/or grains ejection, and entire fracture collapse. He et al. [10] then studied the acoustic emission characteristics of the limestone rockburst process under true triaxial unloading. Chen et al. [11] conducted a series of true triaxial tests to quantitatively study the energy dissipation of rock blocks during the rockburst process. Su et al. [12] studied the characteristics of strainburst with different loading rates under true triaxial conditions. Zhai et al. [13] comparatively analyzed the rupture, fragmentation characteristics, and failure modes of six rock types during the rockburst process. It is worth noting that cuboid rock specimens were used in the above studies, which mainly adopted the method of keeping one face free or unloading σ3 to simulate the strainburst occurring in the tunnel sidewalls after excavation.
Hu et al. [14] studied the acoustic emission characteristics of rockburst using cubic specimens with a circular hole under biaxial load. Si et al. [15] performed a series of true triaxial tests, in which the cubic specimens with a circular hole were loaded in three directions with different stresses. The results indicated the middle part at both sides of the circular holes was damaged first, then developed radially to the deep part, and finally formed two symmetrical V-shaped notches. Gong et al. [16] further found that the line connecting the centers of the two V-shaped notches was perpendicular to the maximum principal stress direction. Liang et al. [17] discussed the effect of the horizontal load on the energy evolution law of rockburst and revealed the occurrence mechanism of rockburst in the tunnel from the energy point of view. Although cubic specimens with prefabricated holes were used in the above experiments, the simulated phenomenon was also essentially the strainburst.
The experimental evidence for revealing the mechanism and evolution process of strainburst was provided in the above studies. However, structural planes often exist in rock mass, and the influence of structural planes on the failure of rock mass should also be carefully studied [18,19]. Durrheim et al. [20] summarized 21 rockbursts in the deep gold mines of South Africa in detail and believed that regional structures such as faults and rock walls were the main controlling factors for triggering rockburst. Based on field micro-seismic monitoring and numerical simulation, the impact of the structural plane of the tunnel on the location of the rockburst is reported by Hu et al. [21]. Liu et al. [18] investigated the characteristics and evolution process of rockburst controlled by structural planes through field micro-seismic monitoring technology. Moreover, it was reported that several severe rockbursts affected by the structural plane occurred in the Jinping II Hydropower Station. For example, the “11.28” rockburst in the drainage tunnel at a depth of 2330 m caused seven deaths, one injury, and the destruction of a tunnel boring machine [22], resulting in serious economic losses and severe social impact.
Therefore, it is very necessary to study the influence of the structural plane on rockburst. Zhou et al. [8] qualitatively analyzed the mechanism of structure-type rockburst, and structure-type rockburst was divided into fault-slip burst, shear rupture burst, and buckling burst. Based on the rockburst in the diversion tunnel of Jinping II Hydropower Station, they [23] further conducted a series of shear tests to study the effect of the structural plane on rockburst. The results revealed that there were three failure mechanisms of the structural plane under shear stress: slip dislocation, tensile failure, and impact fracture. Zhang et al. [24] explored the failure development of the surrounding rock mass in “11.28” rockburst and “7.14” rockburst of the Jinping II Hydropower Station using FLAC3D software. Based on Abaqus 2D simulation, Manouchehrian and Cai [25] found that weak planes around deep underground tunnels might affect rockburst failure when they were in the right position and orientation.
The above-used numerical methods belong to the continuous numerical analysis methods. However, the continuous method could not effectively reproduce the failure process of rockburst [26], because the contact mode among system elements could not continuously vary with the deformation process [27]. In addition, it is difficult to simulate the structure-type rockburst in laboratory tests, especially the excavation process at the ground stress state. Moreover, the study on the effect of structural plane on deep rockmass failure based on laboratory and numeirical shear tests neglected the effect of excavation [23,28].
Therefore, this study numerically further investigates the evolution mechanism of structure-type rockburst using PFC 2D, a well-known discrete element numerical method, taking into account the interaction between the tunnel and the structural plane after excavation. The reasons for using PFC 2D models in this study are as follows: (1) the exposed fault after the “11.28” rockburst event was sub-parallel to the tunnel axis [22]; (2) the distance of the damaged cross-section at the drainage tunnel was long in the “11.28” rockburst (about 25 m) [25]. Therefore, the 2D plane strain models built in this study are reasonable. In addition, the calculation time of the 3D model for PFC is usually longer than that of the 2D model due to excessive particles in the 3D model, so the latter is generally given priority.
2. Generation of Numerical Model
Particle flow code (PFC) is a commercial numerical simulation software in geotechnical engineering developed by Itasca, Minneapolis, MN, USA, counted as one of the discrete element methods (DEMs). Compared with finite element softwares, PFC software has prominent advantages in simulating the discontinuous characteristics of the research object.
2.1. Contact Models
2.1.1. Flat-Joint Model
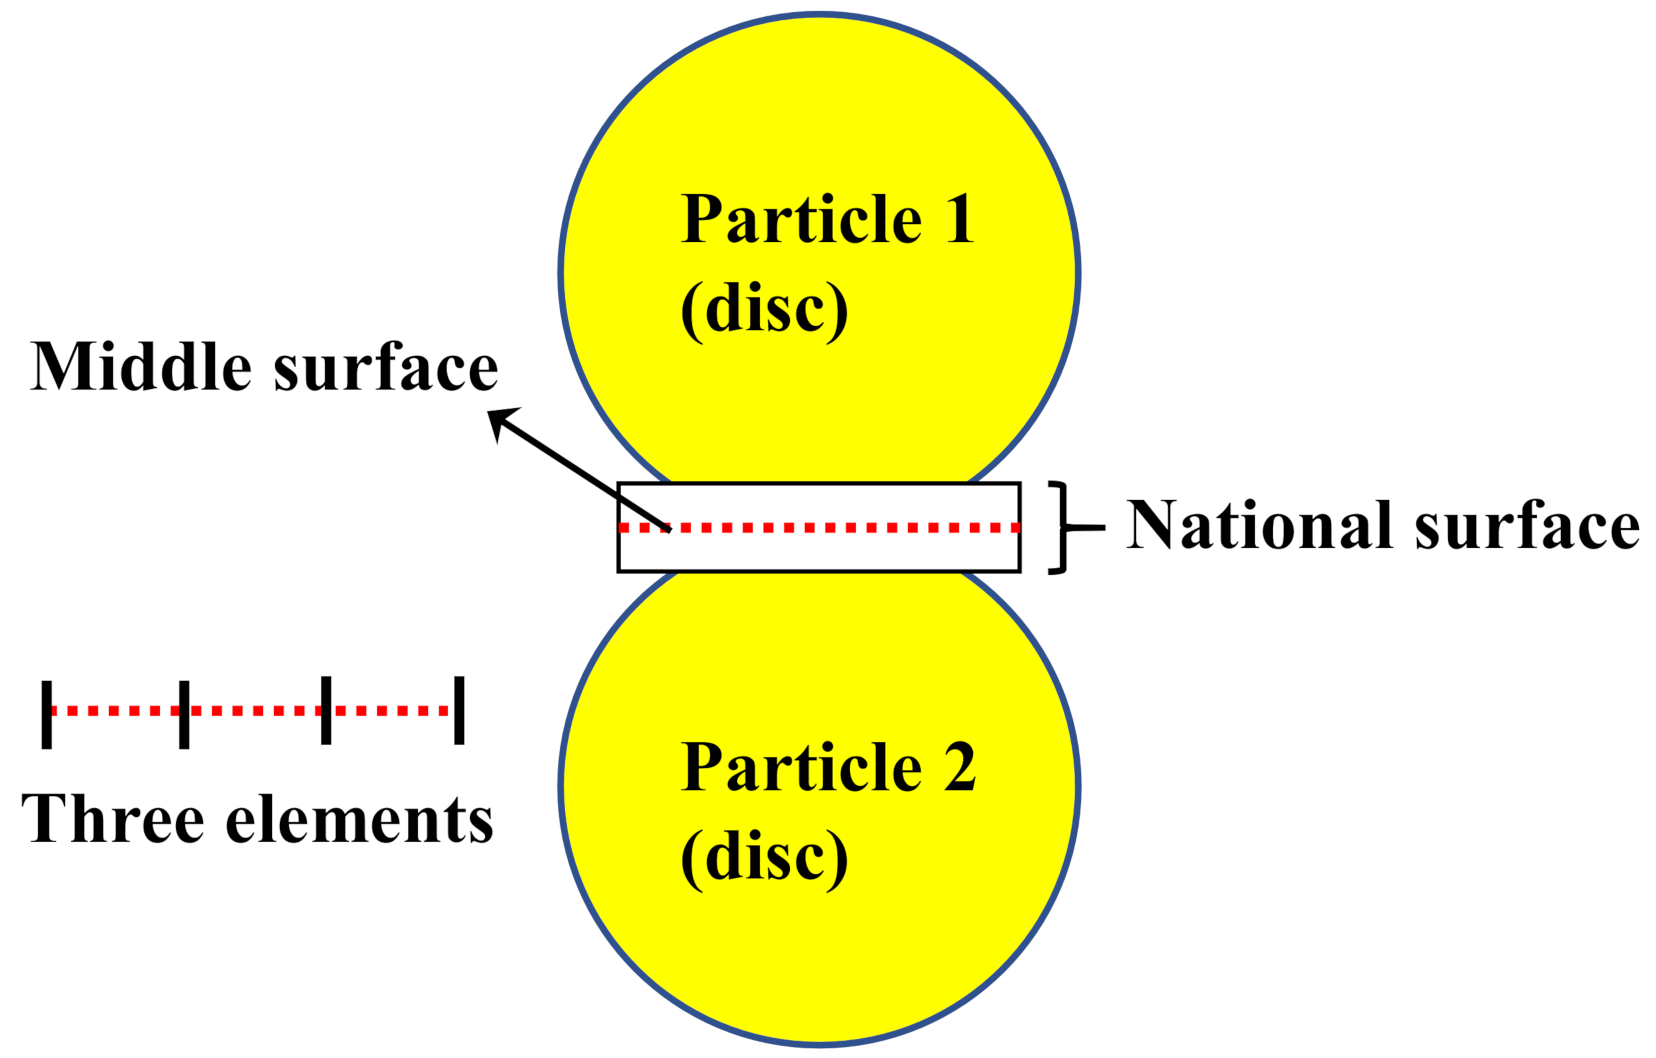
The flat-joint model (FJM) was first proposed by Potondy [29,30] in 2012. The model is composed of rigid grains, which include disc particles and notional surfaces in two dimensions. The two grains are bonded by flat-joint contact (FJC) to simulate the interface behavior between two notional surfaces. The notional surface is rigidly connected to the corresponding grains. A grain could form several FJCs with other grains, which means one grain could have multiple notional surfaces. Therefore, the effective contact between the grains in an FJC becomes the contact between the notional surfaces. In a two-dimensional (2D) model, the middle surface is a straight line segment, which can be discretized into several small elements with equal length (Figure 1). Each element can be bonded or unbonded. Therefore, the behavior of the middle surface is mainly acted as bonding or unbonding and varied along the contact surface. Interested readers can refer to previous publications for other features of FJM [29,31,32]. The FJM had been proven to be capable of simulating the characteristics of brittle rocks well [26], such as a high ratio of uniaxial compressive strength and tensile strength, large friction angle, and non-linear strength envelope.
2.1.2. Smooth-Joint Model
The SJM can ignore the direction of particle contact to simulate the sliding of a surface. The frictional joint can be simulated by assigning SJM to initial contacts between particles located on both sides of the joint. The smooth-joint contact (SJC) can be regarded as a group of springs, which are evenly distributed on a circular cross section, centered on the contact position, and parallel to the joint surface. If the load exceeds the bond strength, the bond will break, and the associated particles can slide along the surface. The smooth-joint model was often adopted to simulate the shear behavior of faults or joints near the excavation boundary in the surrounding rock [33] and prefabricated fissures in rock specimens [34]. For detailed information about SJM, readers can refer to previous publications [35,36].
2.2. Calibration of Micro-Parameters
The Jinping II Hydropower Station is a typical deep underground project in China, and the maximum buried depth exceeds 2500 m. During the construction period, failure phenomena of deep rock mass, such as rockburst, were commonly observed. Zhang et al. [22] reported that four extremely intense rockbursts occurred in the drainage and headrace tunnels of the Jinping II Hydropower Station in detail. Among them, the most intense rockburst took place on 28 November 2009, at Stake SK9+283-9+322 in the drainage tunnel with a diameter of 7.2 m, which was known as the “11.28” rockburst. More information on the “11.28” rockburst can be found in References [22,24].
Jinping marble is a typical brittle rock, and its mechanical properties have been reported in many studies [31,37,38,39,40,41,42,43]. In this study, the Jinping marble is used for parameter calibration, and a set of mechanical properties of Jinping marble, including uniaxial compressive strength (UCS), elastic modulus, Poisson’s ratio, and tensile strength (TS), are matched with the simulated values [31,43]. The calibrated micro-parameters are then used to study the evolution mechanism of structure-type rockburst from a mesoscopic viewpoint.
In the parameter calibration, the size of the generated specimens in the PFC is consistent with that used in laboratory tests. For the numerical specimen in uniaxial compression tests, the height (H) of the model is set to be 100 mm, and the ratio of height (H) to diameter (d) is set to be 2. For the numerical specimen in Brazilian splitting tests, the height of the model is set as 25 mm, and the ratio of height to diameter is set to be 0.5. The grain diameter is in the range from 0.7 to 1.16 mm, which obeys uniform distribution, and the ratio of maximum to minimum grain diameter is 1.66. Moreover, the grain density is set to be 2690 kg/m3. According to the calibration procedures proposed by Wu et al. [31], the simulated mechanical properties are obtained, which agree well with those in laboratory tests (Table 1). The calibrated micro-parameters are shown in Table 2.
Based on field observation of “11.28” rockburst in previous studies, a structural plane with a dip angle of 40°~50°, which was straight and smooth with no filling, was detected near the failure zone [8,22,24,44]. The rock mass beneath the fault collapsed in the rockburst, creating a V-shaped failure zone with a depth of 7 m [22]. In the present study, the dip angle of the structural plane is assigned with a value of 45°. The structural plane is represented by unbonded SJM in the numerical model [36]. Several parameters, including normal stiffness, shear stiffness, and the friction coefficient, are associated with unbonded SJM. According to the results by Duan et al. [34], the shear stiffness of SJC has negligible influence on the simulated UCS and Young’s modulus. The normal stiffness has a significant effect on the mechanical behavior, only when the dip angle of joints is smaller than 45°. Because the dip angle of the structural plane is set as 45°, we only consider the effect of the friction coefficient in this study. The micro-parameters of SJC were usually determined on the basis of the rock mechanical properties with inclined pre-existing fracture or different bedding plane inclinations [45,46], which is obviously not suitable for this study due to lack of the mechanical properties of the rockmass at the drainage tunnel. Therefore, the micro-parameters of SJC were calibrated to acquire simulation results that are closer to the observed failure range or locations of the surrounding rock observed in the field after “11.28” rockburst. Micro-parameters used in the smooth-joint model are shown in Table 3. The joint length is assumed to be 90 mm due to the lack of detailed information, and the influence of the joint length on the simulation results will be discussed later.
It needs to be noted that the FJM model is used for all the particles of the rock mass, while the SJM model is only used for the particles of the structural plane.
2.3. Simulation Procedures
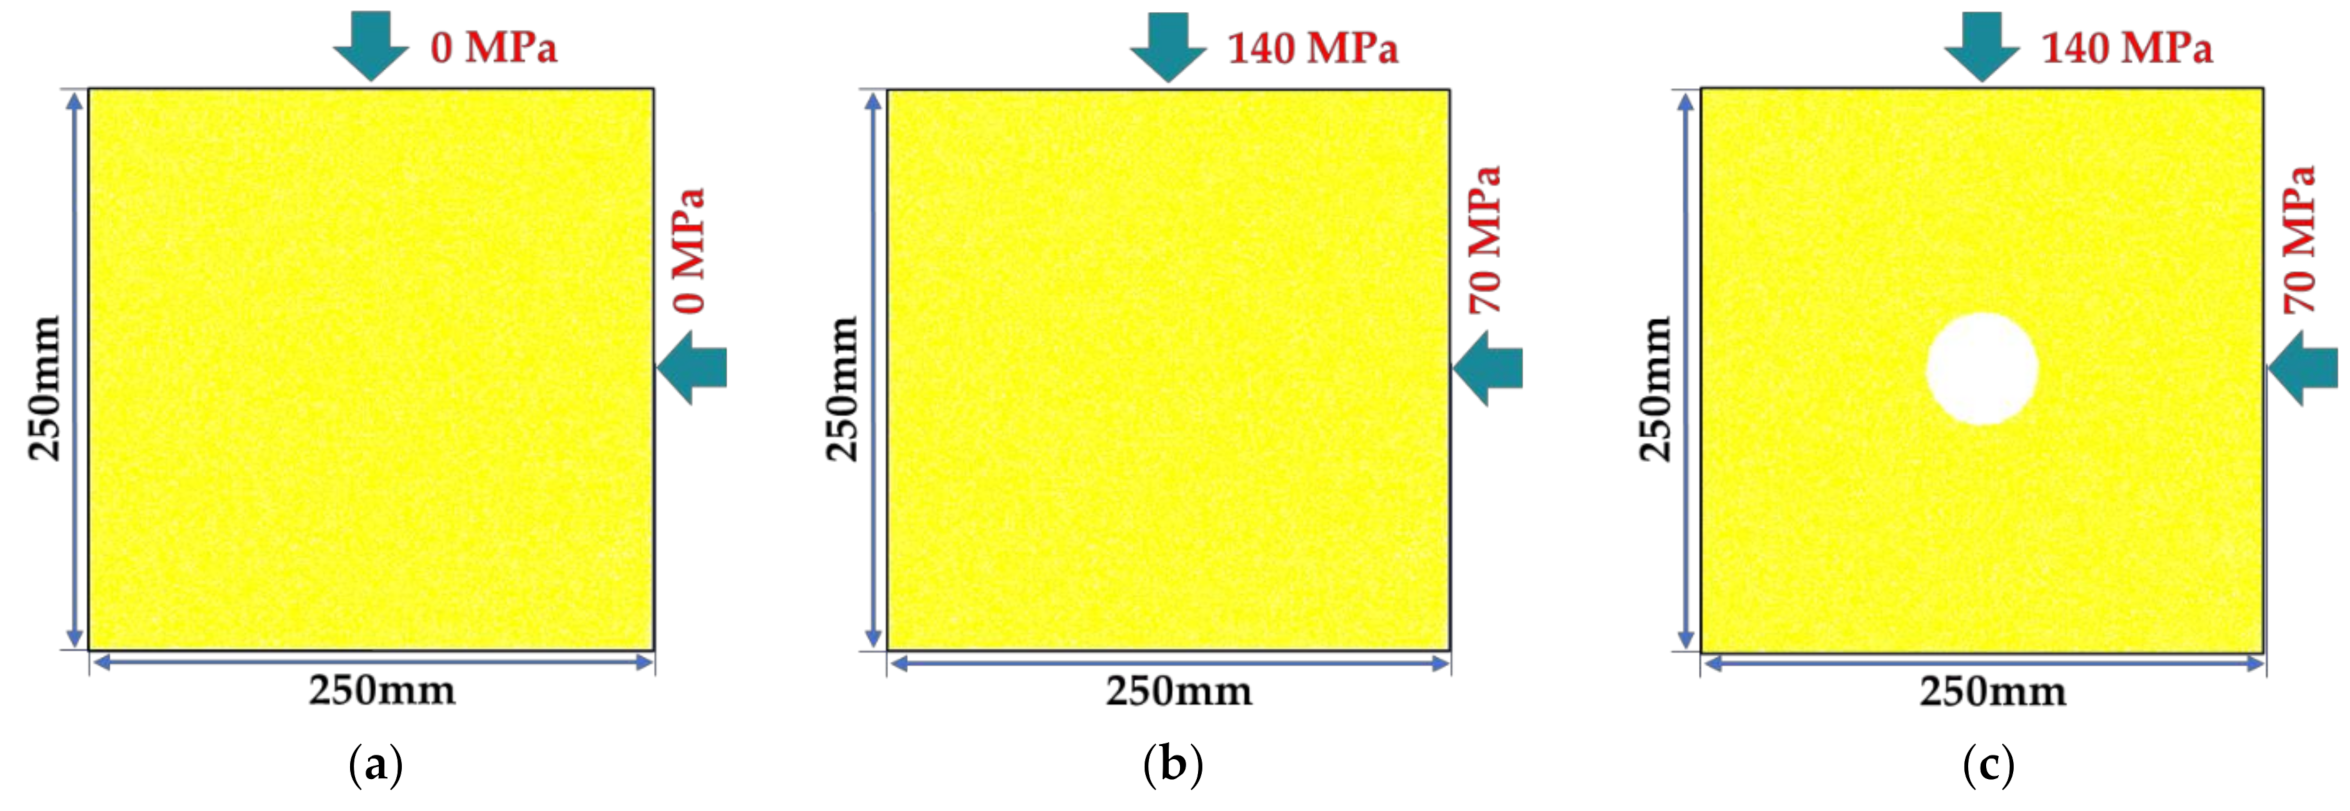
To model the evolution of “11.28” rockburst, a square numerical model is generated (Figure 2). The particle size in the model is the same as that used in numerical specimens for parameter calibration. In previous studies, the dimension of a cubic model for simulating underground tunnels ranged from 70 to 240 mm [47,48,49]. In view of the boundary effect and calculation time of the model, the side length of the model in this study is set as 250 mm. A circular hole with a radius of 25 mm is built into the model by directly deleting the particles in the range, which is one-fifth of the horizontal distance between the center of the circular hole and the boundary of the model. A total of 73,333 particles are included in the model. The similarity between the numerical modeling and the actual tunnelling case will be discussed in Section 5.
After model generation, the unbalanced forces are eliminated, and the overlap between particles is reduced gradually. The FJM is then installed at ball–ball contacts when the distance between two particles is less than installation gap. As shown in Figure 2, the load is firstly applied to the model step by step till the initial geostress is reached (i.e., vertical stress of 140 MPa and horizontal stress of 70 MPa). Then, a circular hole with a diameter of 50 mm was excavated by deleting particles, and the stress in vertical and horizontal directions was kept constant in the servo-controlled loading.
2.4. Energy Balance Calculations
In PFC, based on the law of energy conservation, the meso-scale energy equation can be obtained:
where is the boundary work accumulated, which is generated by the external forces acting on the boundary of numerical model. is strain energy stored in the model. is the dissipative energy, which is the released energy from the surrounding rock after excavation and can be considered a measure of overall damage in rockmass [50,51]. is the kinetic energy of particles. is the slip energy, defined as the total energy dissipated by frictional slip. is the energy dissipated by local damping. The sum of both and , which is the radiated energy from surrounding rock as a result of unstable failure after excavation, can be a measure of rockburst intensity [50,51].
3. Analysis of Simulation Results
3.1. Evolution Mechanism of Strainburst
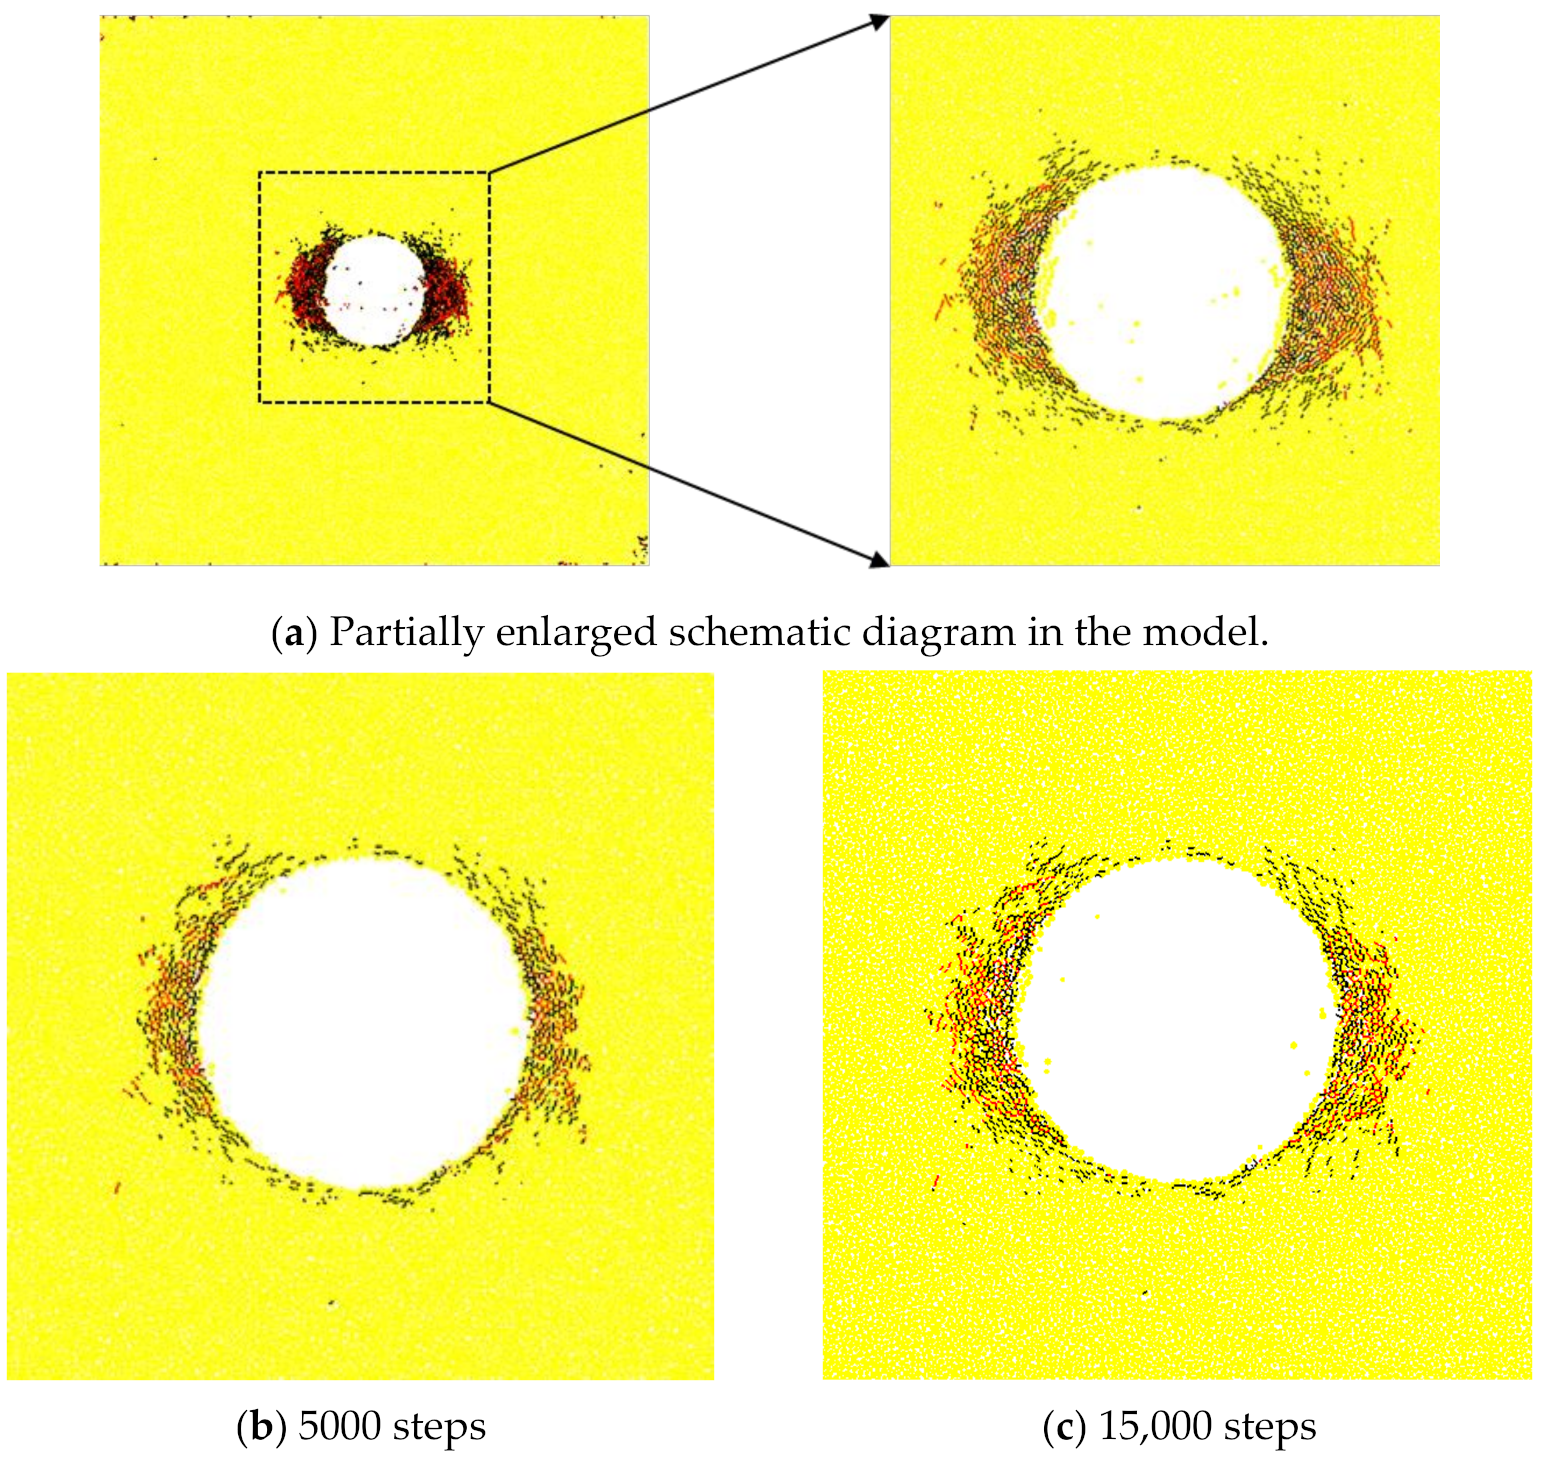
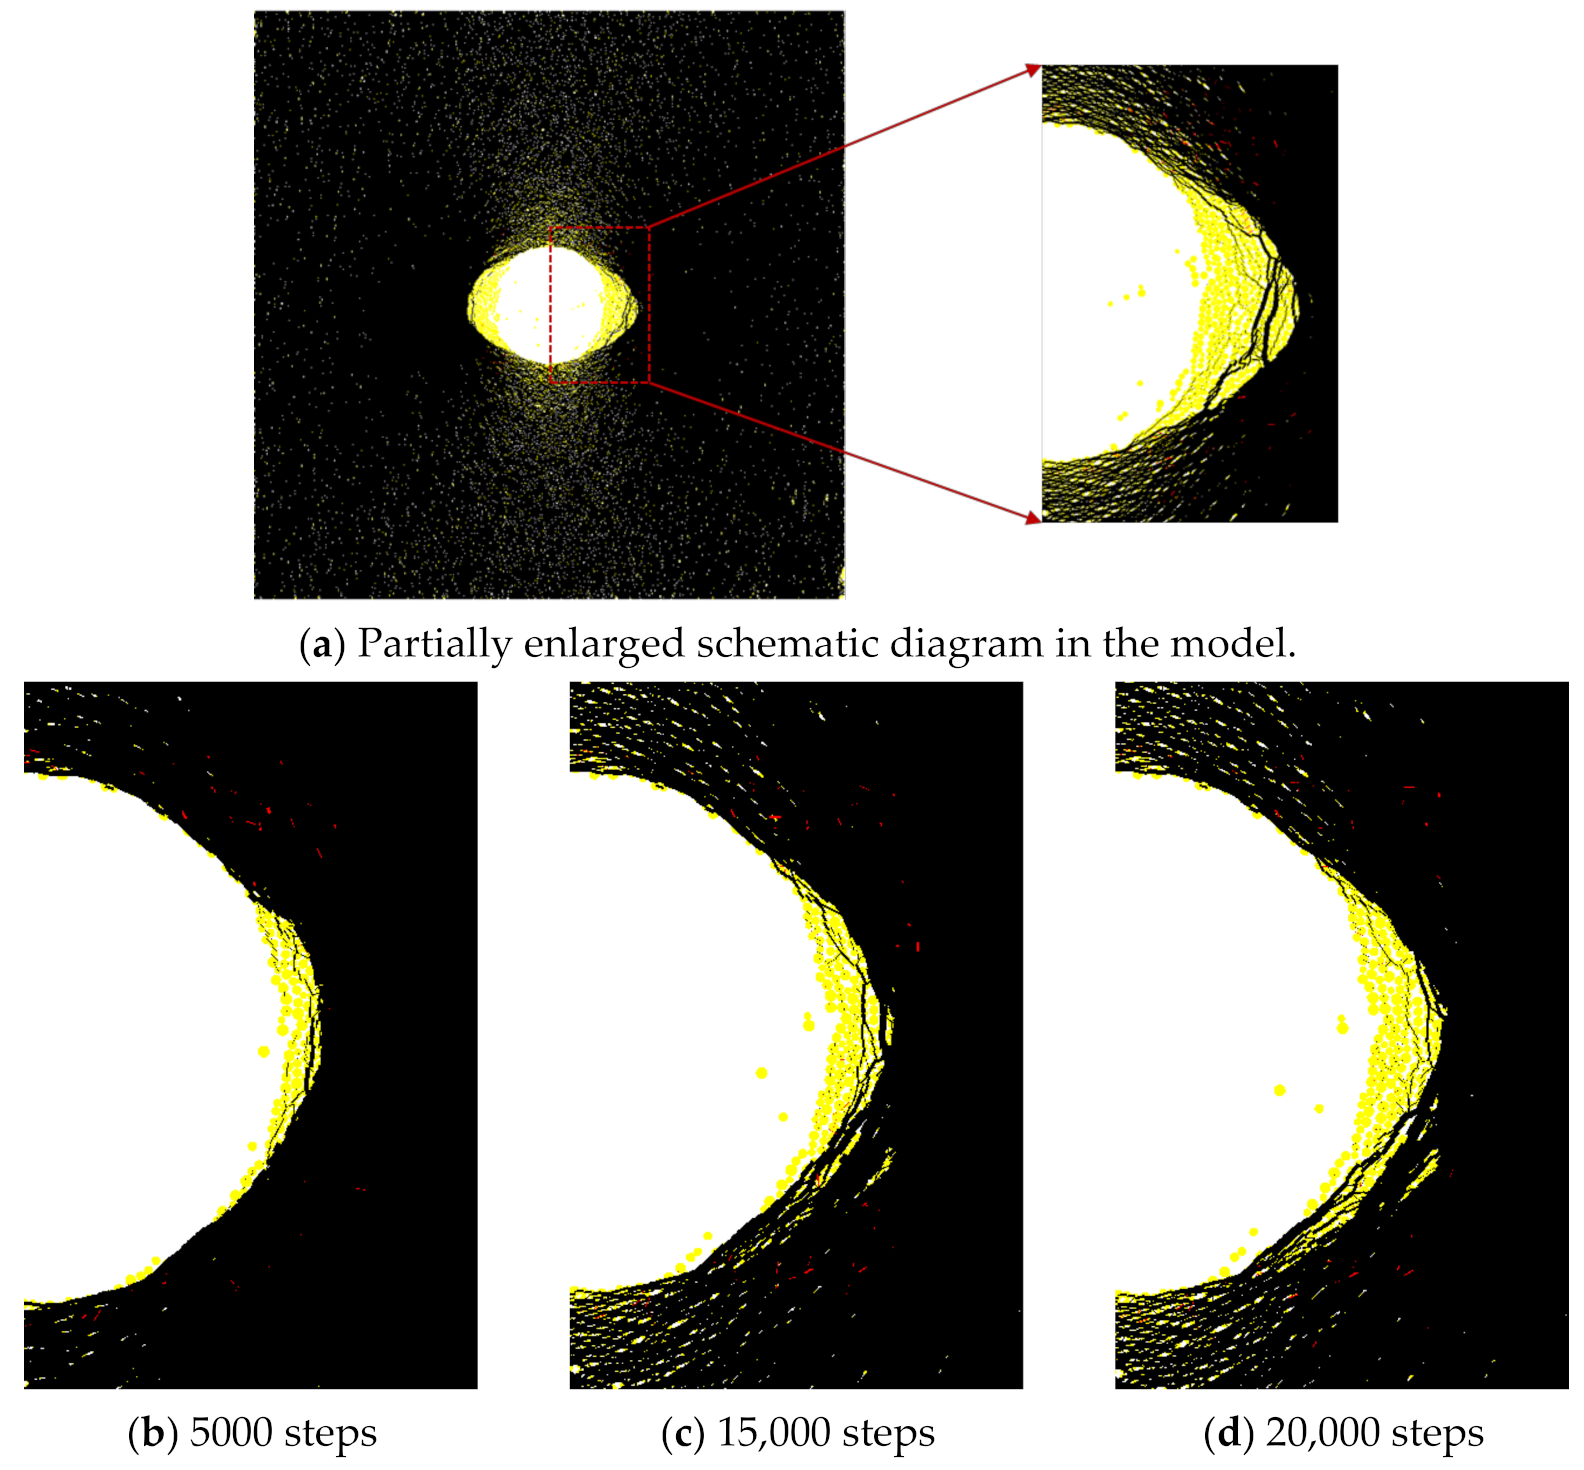
The simulation results in terms of micro-cracking pattern and force chain of rockburst without a structural plane are shown in Figure 3 and Figure 4, respectively. Because the rockburst zones at the walls of both sides are symmetric, the right side wall is taken as an example to illustrate the evolution process of rockburst.
After excavation, tangential stress concentration gradually occurs in the middle portion of the right side wall. When the model runs to 5000 steps, damage occurs in the surface and interior of the right wall within a small range, and scattered particles fall off, showing slight spalling failure.
At 15,000 steps, the spalling damage of the right side wall further aggravates and develops unceasingly toward the interior. Due to tensile fracture induced by the tangential stress, the surrounding rock is cut into thin rock plates, which can be considered to be a slight slabbing phenomenon. The thickness of the force chain is positively correlated with the magnitude of contact force among particles, and the black force chain formed in the evolution process of rockburst at the right side wall is regarded as the rock plates.
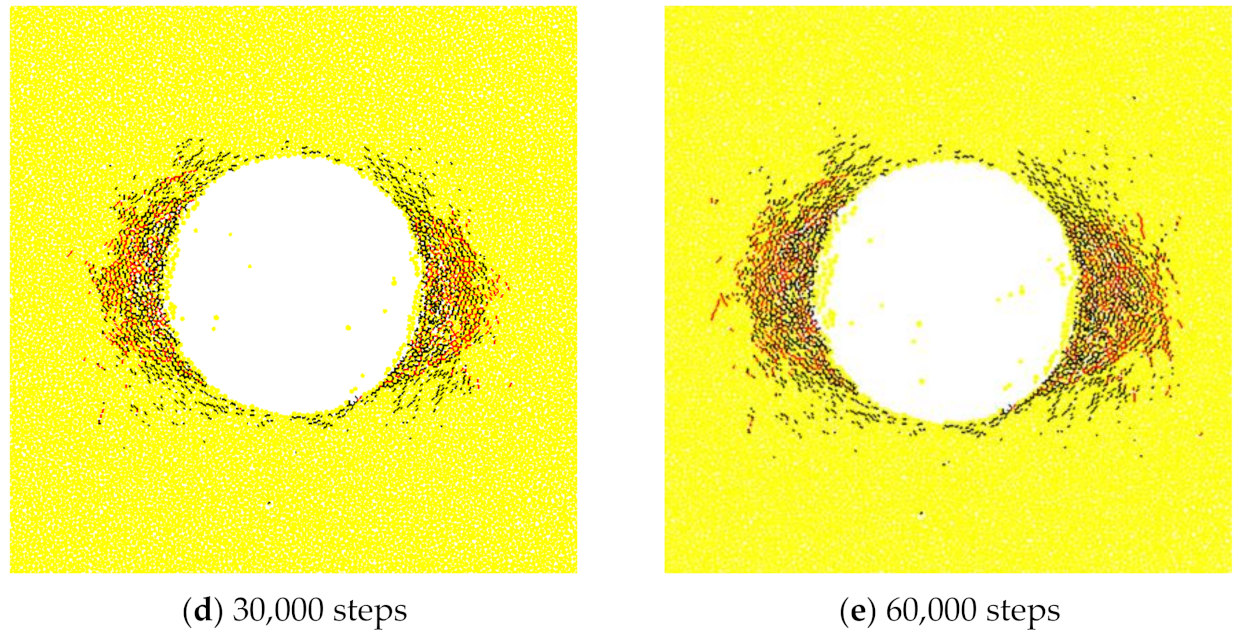
At 20,000 steps, the range of the slabbing failure further extends. Once the bending stress caused by the compressive stress exceeds the bending strength, the rock plates formed previously will break into numerous rock blocks and eject, indicating the occurrence of rockburst.
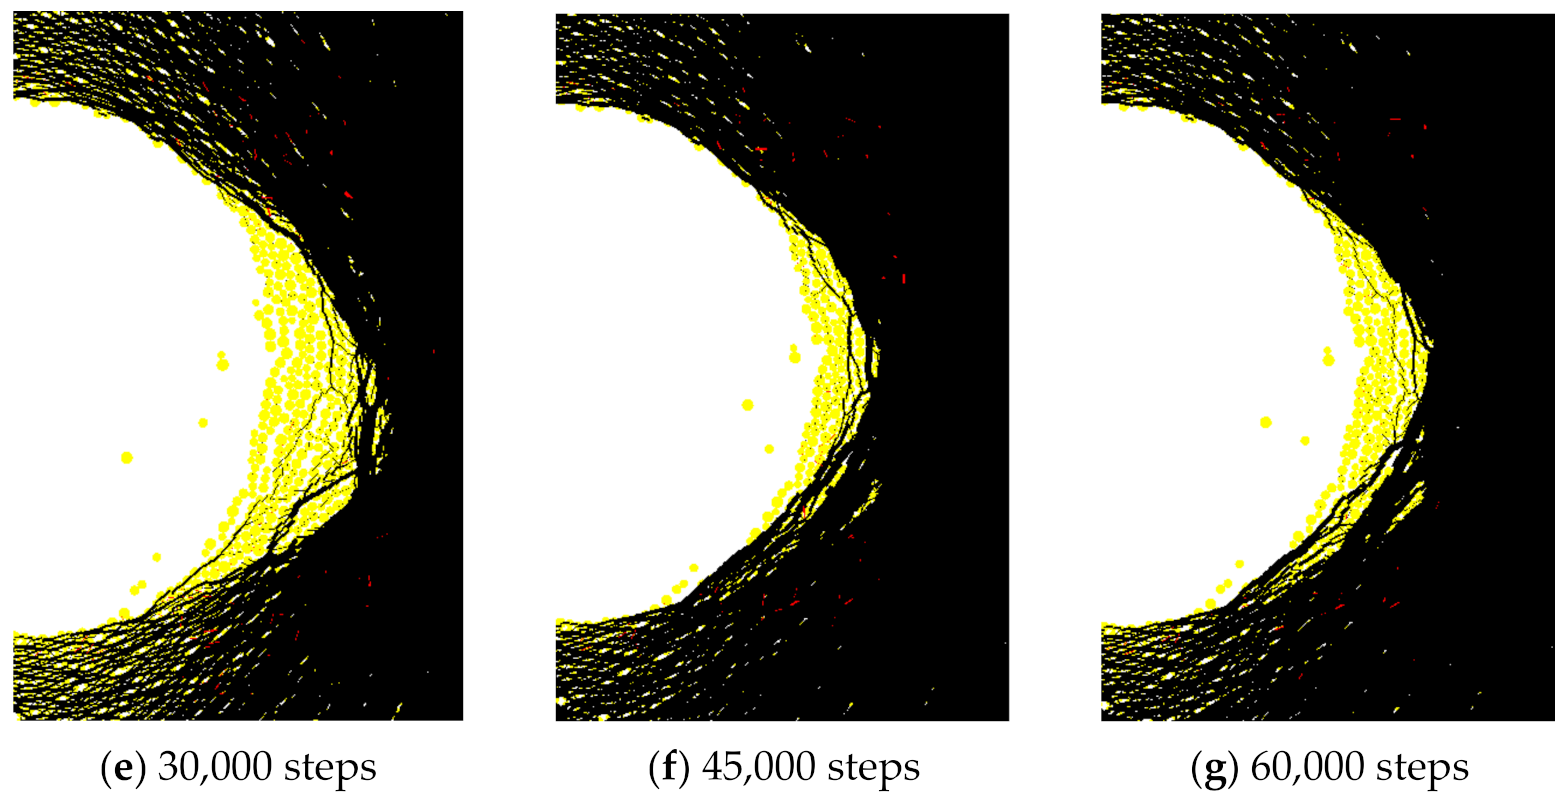
At 30,000, 45,000, and 60,000 steps, the above rock failure is repeated constantly until it reaches a stable state. It is worth noting that as the fracture propagates to the interior of the surrounding rock, its vertical fracture range is shrinking, forming a typical V-shaped fracture zone. Haimson [52] believed that the failed thin rock plate left hanging cantilevers at the upper and lower ends, which might limit the length of the next spalled rock fragments. As the failure deepened, spalled rock fragments became shorter, resulting in the decrease in the vertical failure span continuously. The entire process would stop once the rock plates were supported steadily by the remaining cantilever that was previously damaged. The simulation results in this study are quite consistent with the laboratory test results [53] and the field observation results [52].
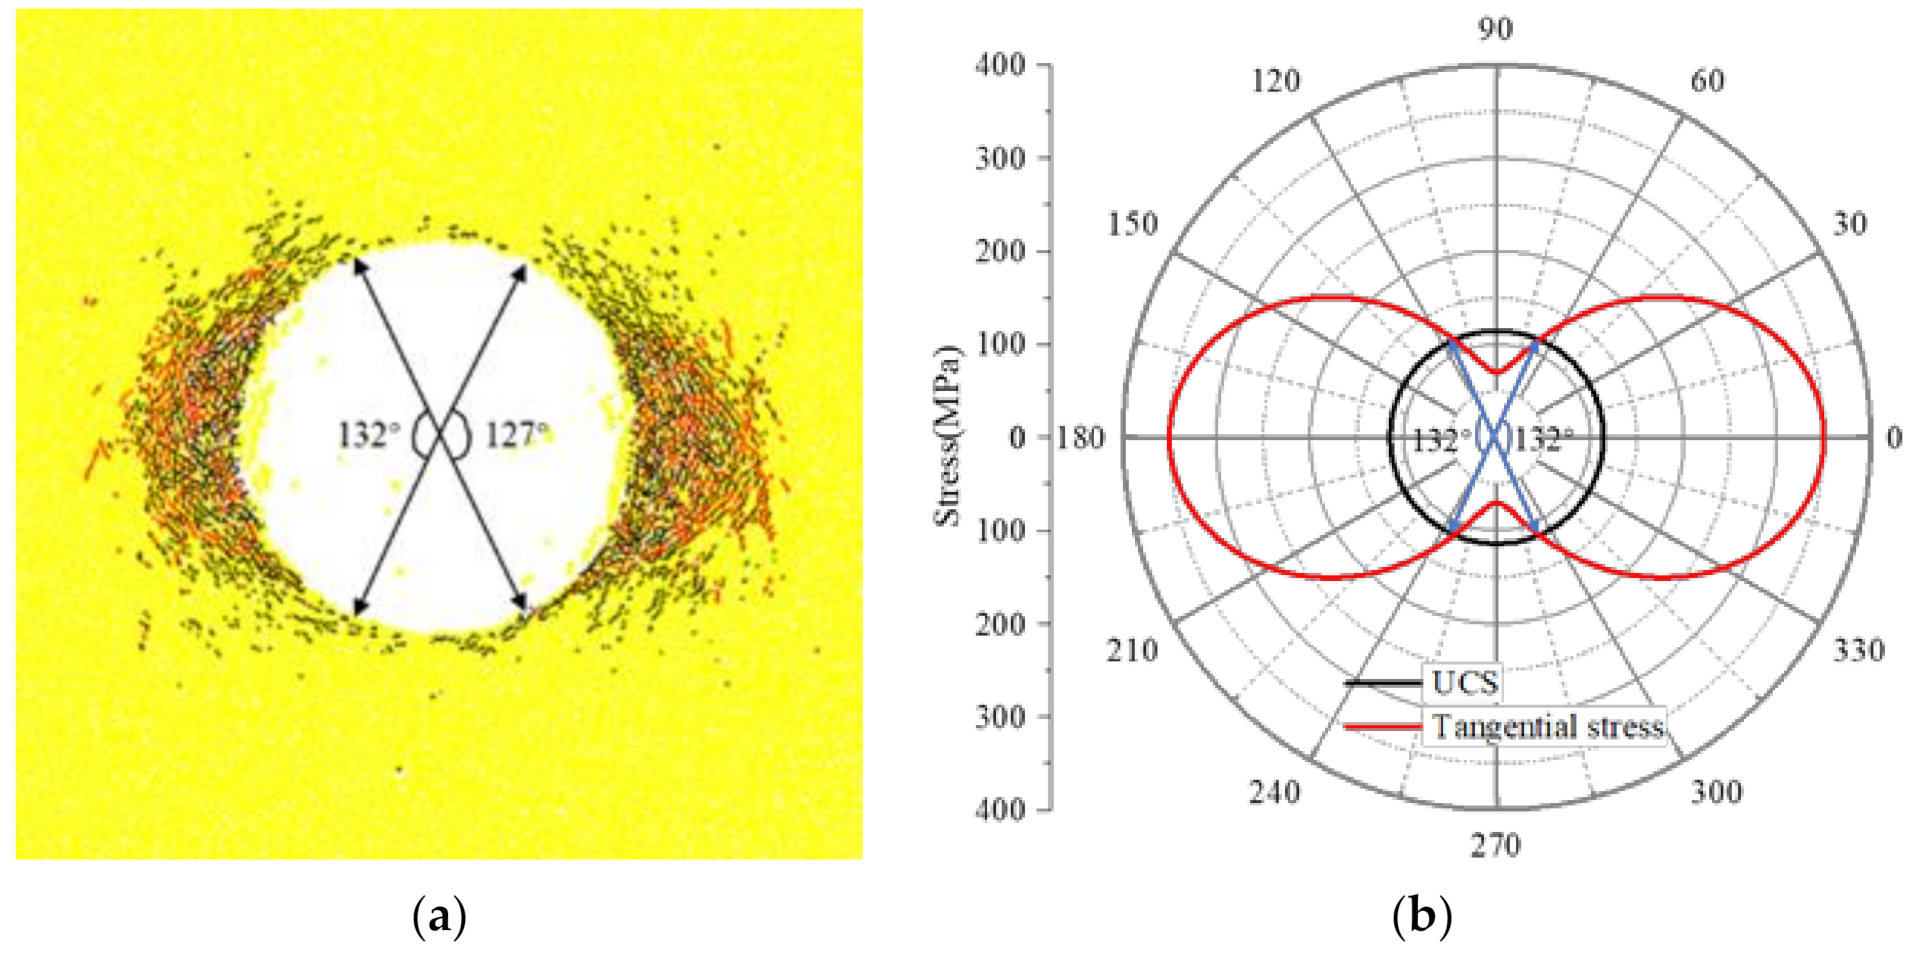
The surrounding rock in the underground opening is often subjected to high tangential compressive stress but zero or low radial stress, which is similar to uniaxial compressive loading or conventional triaxial loading under low confining pressure. The uniaxial compression state is considered in this study. Based on the stress relations of the circular hole in elastic theory (Equation (3)) [54], the damage range around the tunnel can be estimated. The condition for rock failure is that the axial stress is equal to or larger than the UCS of the rock. Taking the left side wall as an example, the damage range is from −66° to 66°. As shown in Figure 5a,b, the simulation result in the present study agrees well with the analytical result.
where σθ is tangential stress in the surrounding rock, q is the horizontal load, p is the vertical load, a is the radius of the tunnel, r is the length of the connecting line between a point in the rock mass and the center of the tunnel, which is called the polar radius, and θ is the angle between the polar radius and the horizontal axis.
3.2. Evolution Mechanism of Structure-Type Rockburst
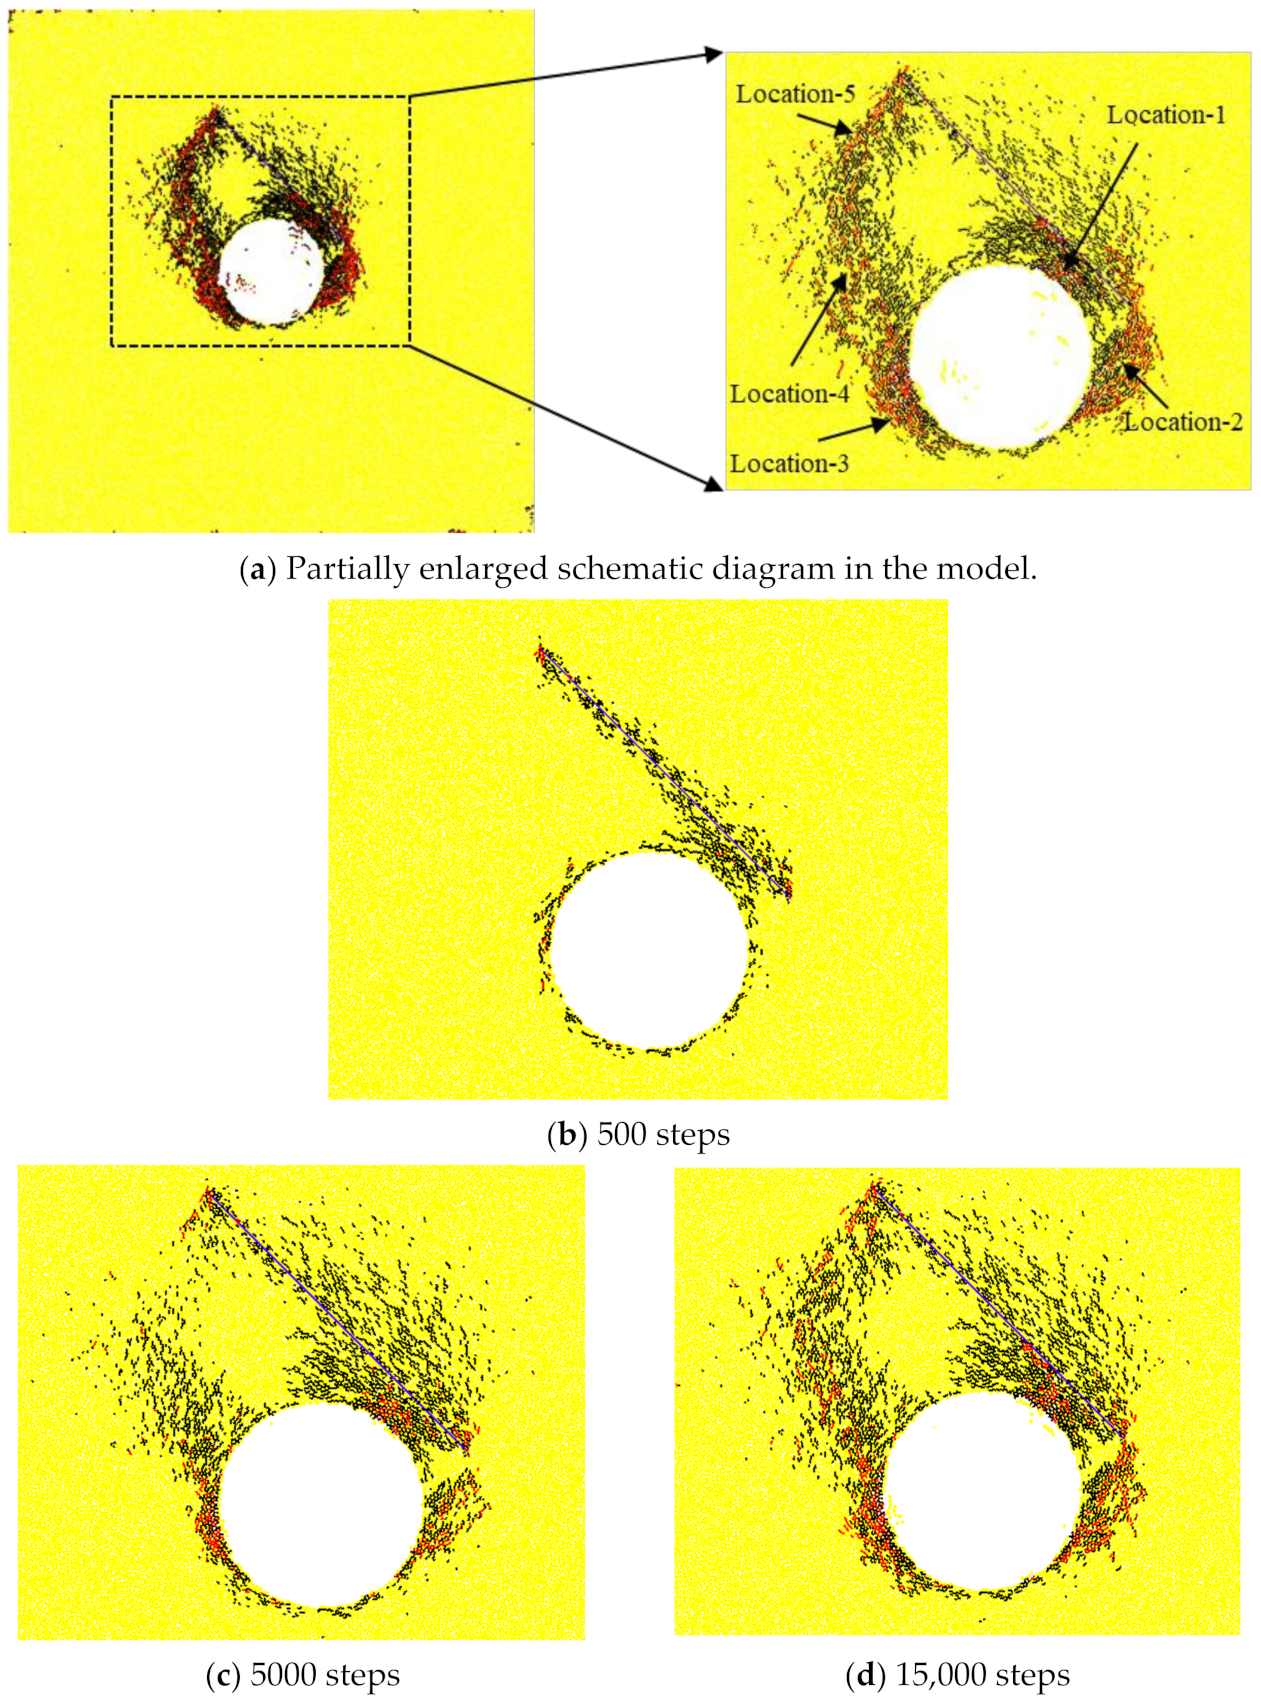
The simulation results of the micro-cracking pattern in the model with the structural plane are shown in Figure 6.
At 500 steps, the damage zone first occurs in the Location-1 where it is most vulnerable to excavation. At 5000 steps, with the adjustment of the tangential stress, a lot of tensile and shear cracks generate at the local crack band (Location-4) and the left and right side walls (Location-2 and Location-3). A large damage zone occurs in the interaction zone between the structural plane and the tunnel (Location-1). The local crack band at the left side wall (Location-4) propagates towards the upper left. It is worth noting that the oblique secondary crack band (Location-5) is formed in the upper end of the structural plane. This is because the upper end of the structural plane is far away from the tunnel and is less affected by the tunnel compared with the lower end of the structural plane.
At 15,000 steps, the damage degree at Location-1 greatly increases, and the tensile and shear cracks become denser compared with the results of 5000 steps. After the damage reaches a certain degree, small-scale collapse occurs at the right arched shoulder. It is worth noting that rockburst occurs at Location-3 in Figure 6, which is the symmetric position of Location-1. The local crack band (Location-4) develops towards the upper left, and the oblique secondary crack band (Location-5) at the upper end of the structural plane further extends to the lower left.
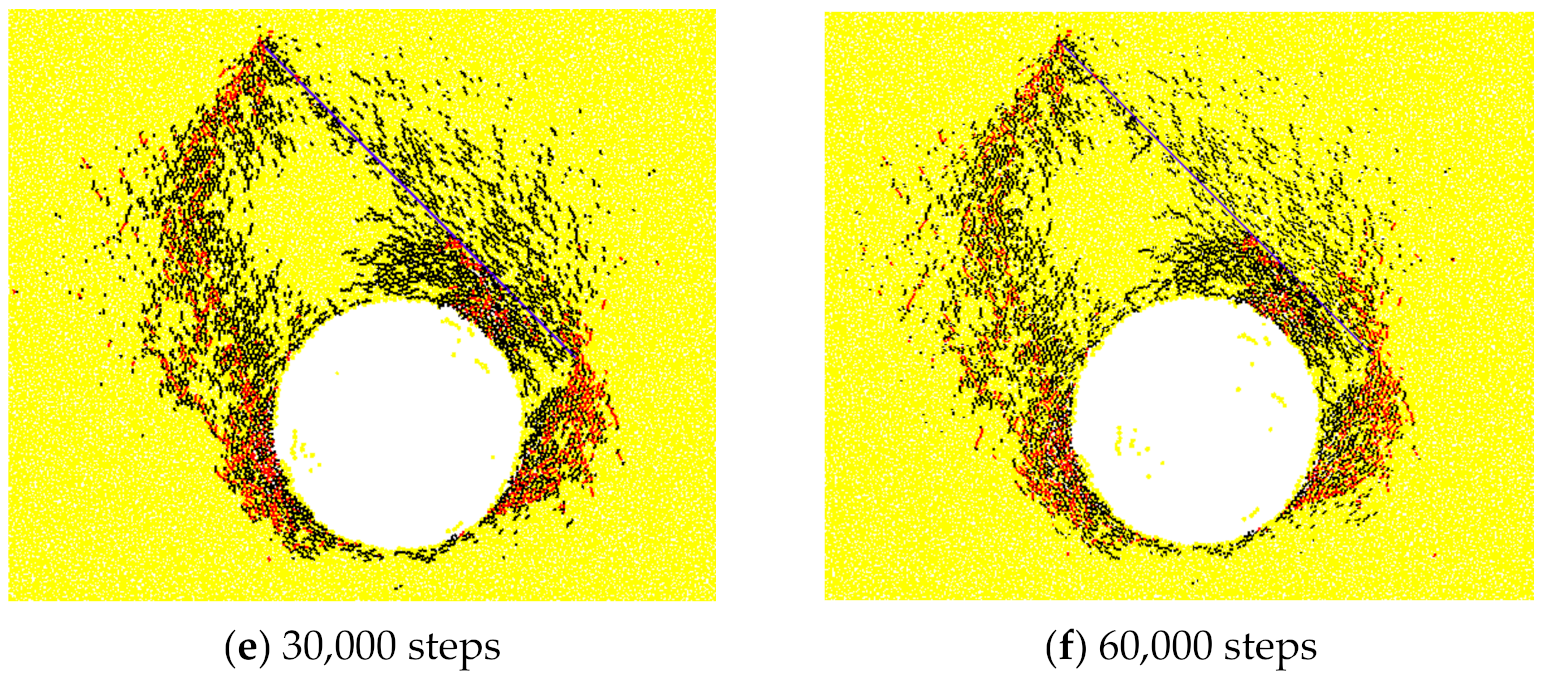
At 30,000 steps, rockburst occurs in the right and left side walls (Location-2 and Location-3), forming two small-scale V-shaped notches. Tensile cracks caused by tangential compressive stress tend to be accompanied by buckling and slabbing phenomena. The oblique secondary crack band (Location-5) coalesces gradually with the local crack band (Location-4), but the coalescence of the internal cracks in the two bands (Location-4 and Location-5) has not formed yet, indicating that the two bands still have a certain bearing capacity. The interaction zone between the structural plane and the tunnel (Location-1) continues to be damaged until it reaches the structural plane.
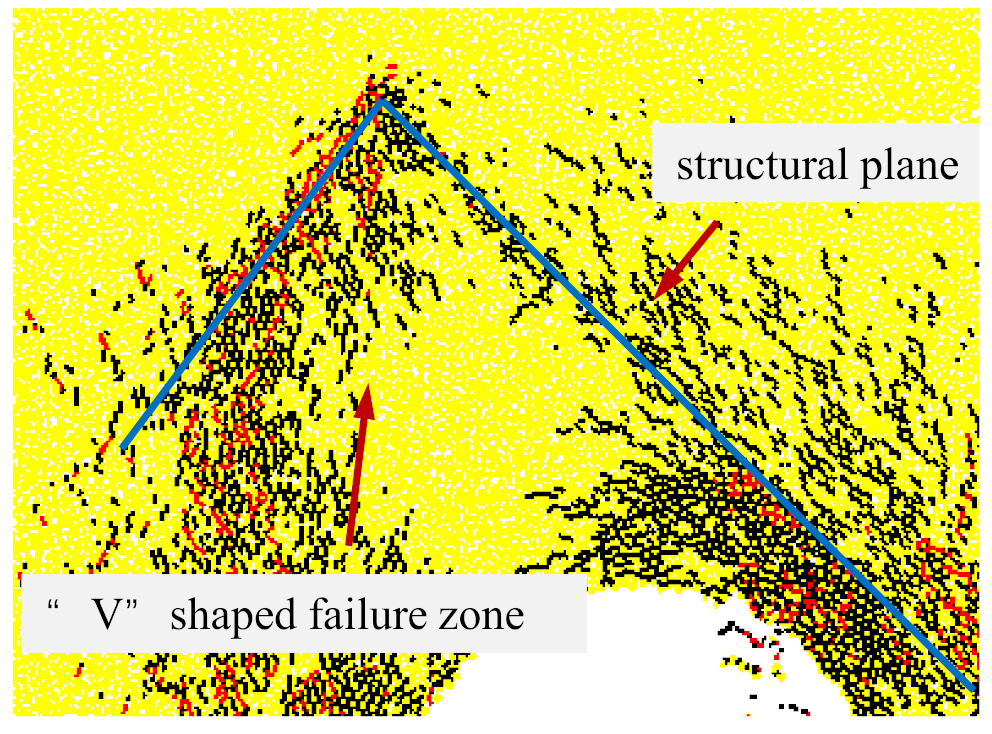
At 60,000 steps, ultimate failure occurs in the interaction zone between the structural plane and the tunnel (Location-1). The V-shaped notches on both wall sides continue to develop toward the interior of surrounding rock to form the final V-shaped failure surface. The cracks inside the two crack bands (Location-4 and Location-5) continue to expand, so the rock inside the two crack bands still has part of the bearing capacity. When the gravity of the uncollapsed rock in the enclosed area between two crack bands and the structural plane exceeds the bearing capacity of the rock inside the two crack bands, the uncoalesced parts among the cracks in the two crack bands will be snipped to form a macro fracture band and shear fracture occurs, causing severe rockburst and forming a large V-shaped pit. As shown in Figure 7, the simulation results are in good agreement with the results obtained from field observation [55].
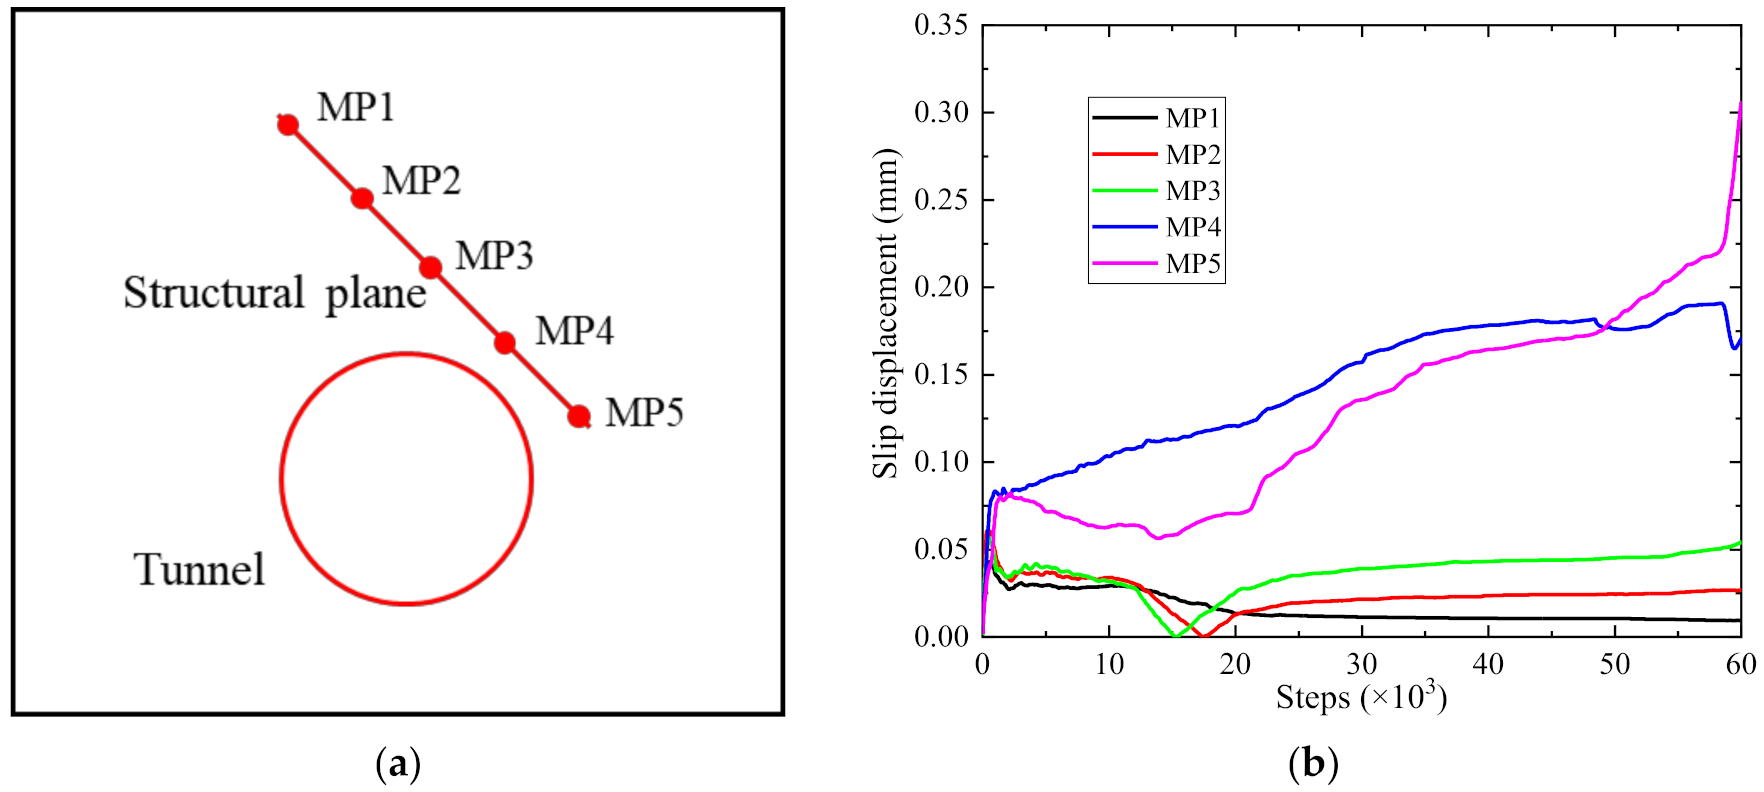
In order to obtain slip displacement on the structural plane, we arrange five measuring points (MP1~MP5) to record the histories of slip displacement, as shown in Figure 8. At each measuring point we monitor the displacement of three particles in the hanging wall and footwall, respectively.
It is obvious that slip displacement at MP1, MP2, and MP3 along the structural plane is less affected by excavation compared with that at MP4 and MP5 due to the relative distances from the tunnel, which are 0.01, 0.03, and 0.05 mm, respectively. The slip displacement at MP4 is greater than that at MP5 until 49,200 steps, after which the opposite occurs. This can be attributed to the randomness of particles movement in terms of the magnitude and direction and the effect of contact force concentration at MP5. In general, the slip displacement on the structural plane is approximately positively correlated with the distance between the measuring point and tunnel, which is consistent with the simulating results from Manouchehrian and Cai [25].
3.3. Comparison between Strainburst and Structure-Type Rockburst
Based on the simulation results in this study, it is found that the main differences between strainburst and structure-type rockburst are as follows:
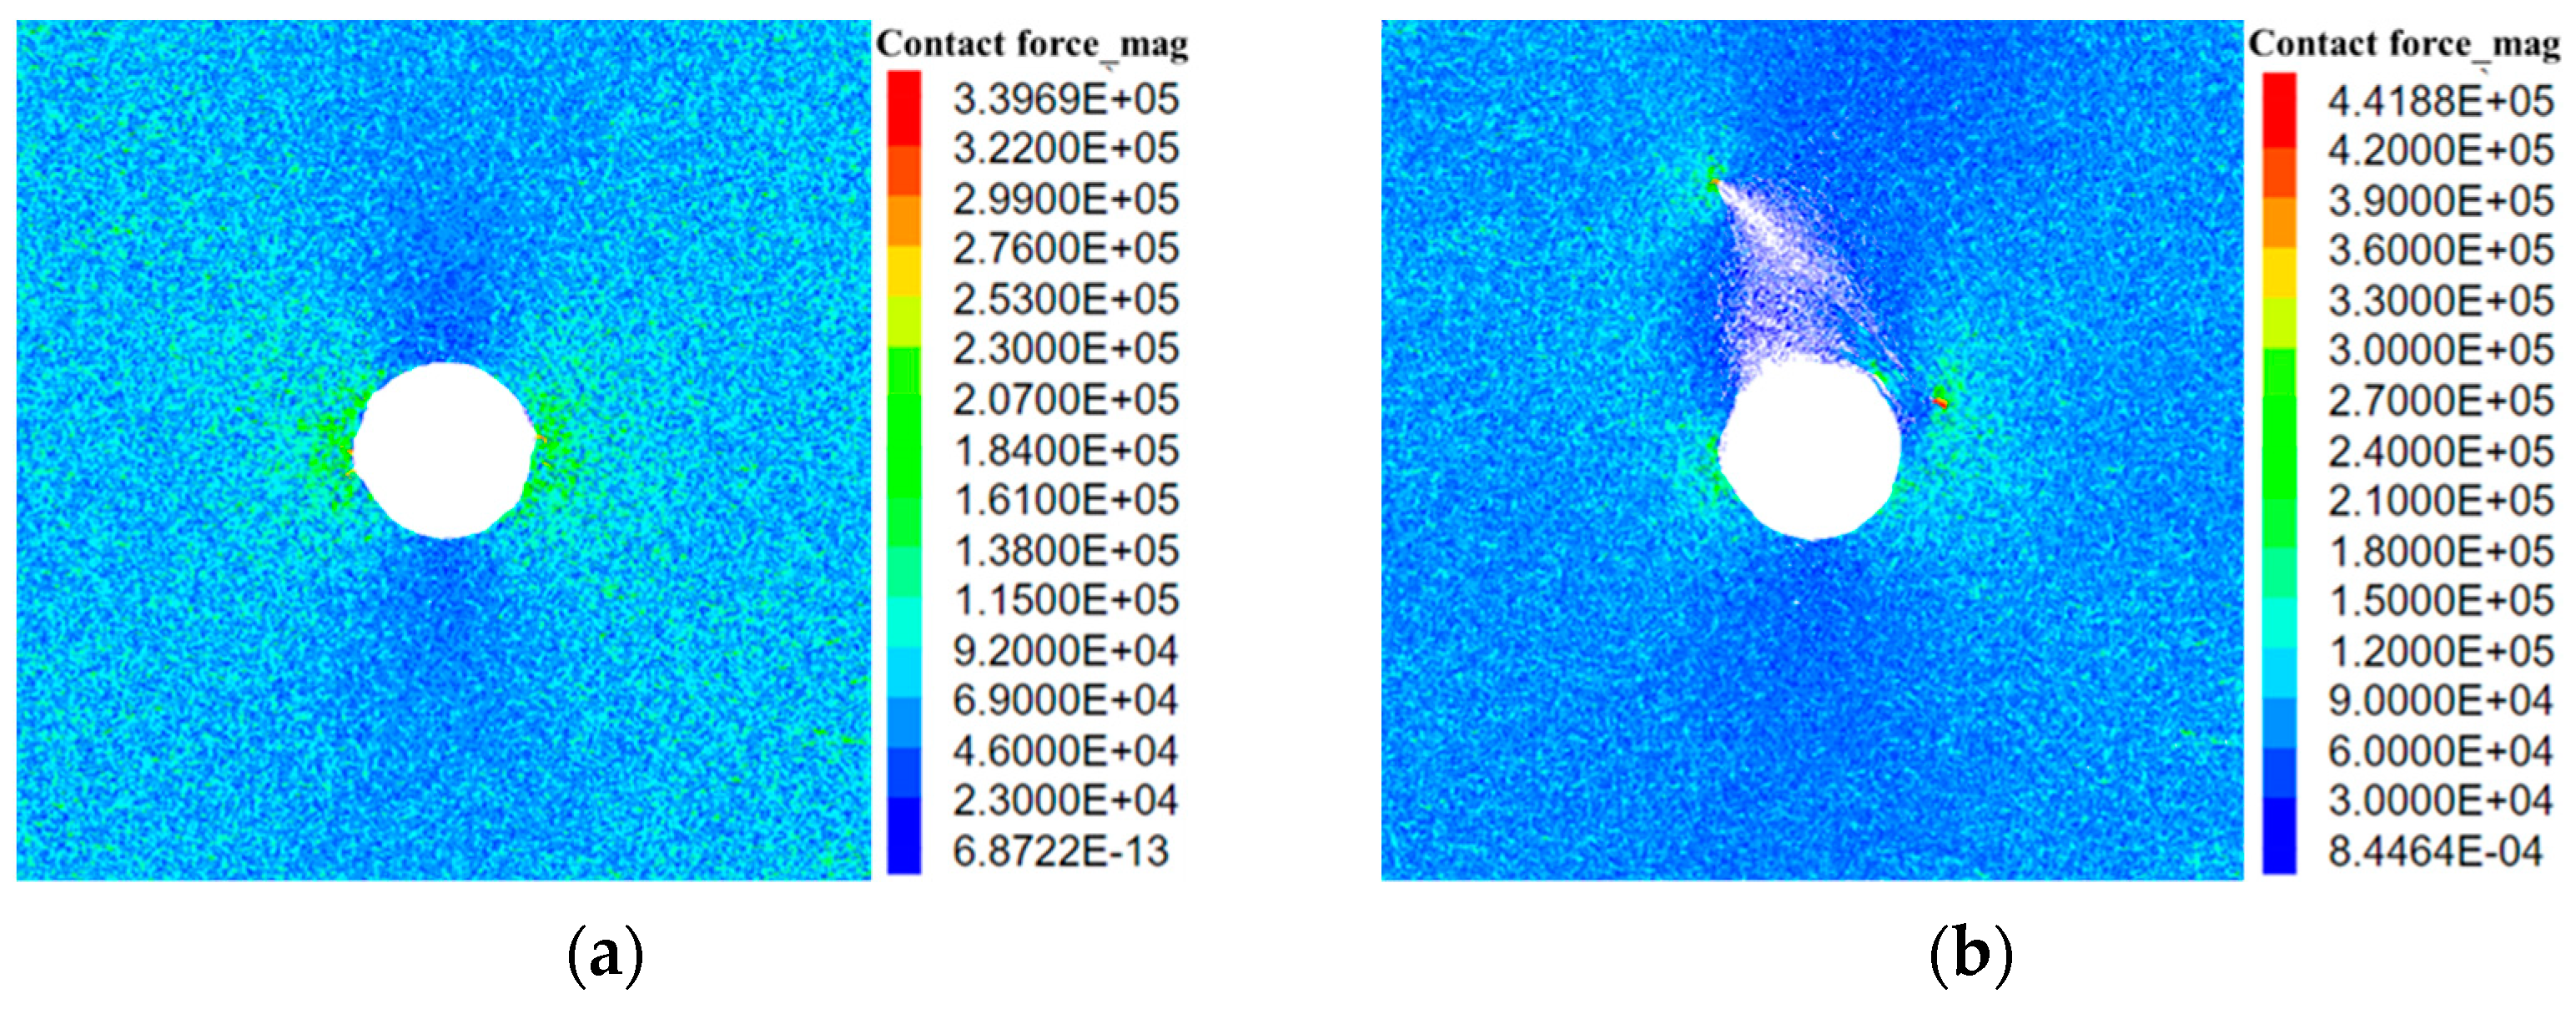
(1) Figure 9 displays the contact force vector plots for strainburst and structure-type rockburst at 2000 steps after excavation. As shown in Figure 9, the existence of the structural plane directly changes the original in situ stress field, making the stress distribution more complicated after the tunnel excavation. Under high in situ stress, stress concentration zones for structure-type rockburst are formed at various places, i.e., both ends of the structural plane, left and right side walls, and the interaction zone between the structural plane and the tunnel. However, stress concentration zones for strainburst appear at the left and right side walls, which have good symmetry.
(2) The strainburst is mainly caused by the tensile cracking induced by tangential compressive stress, in which buckling and slabbing failure is formed, accompanied by ejection of thin rock blocks. However, the cause and evolution process mentioned above also exists in the structure-type rockburst. Moreover, for structure-type rockburst, the shear fracture in two crack bands (Location-4 and Location-5), due to high in situ stress and shear stress induced by overburdened loadings and shear slip along structural plane, results in a larger-scale rockburst with a large V-shaped pit.
(3) The failure locations for strainburst mainly exist in the middle of both side walls, while the failure locations for structure-type rockburst are closely related to the location of the structural plane.
4. Sensitivity Analysis
4.1. Influence of Structural Plane Roughness
The existence of structural plane has a significant effect on the intensity and failure mode of rockburst [23]. However, the study related to the effect of the structural plane roughness on the rockburst is still limited. Moreover, the results from previous studies showed that the shear strength increased with the increase in friction coefficient μ in the SJM [56,57], and the joint roughness coefficient (JCR) was positively correlated with the shear strength [58].
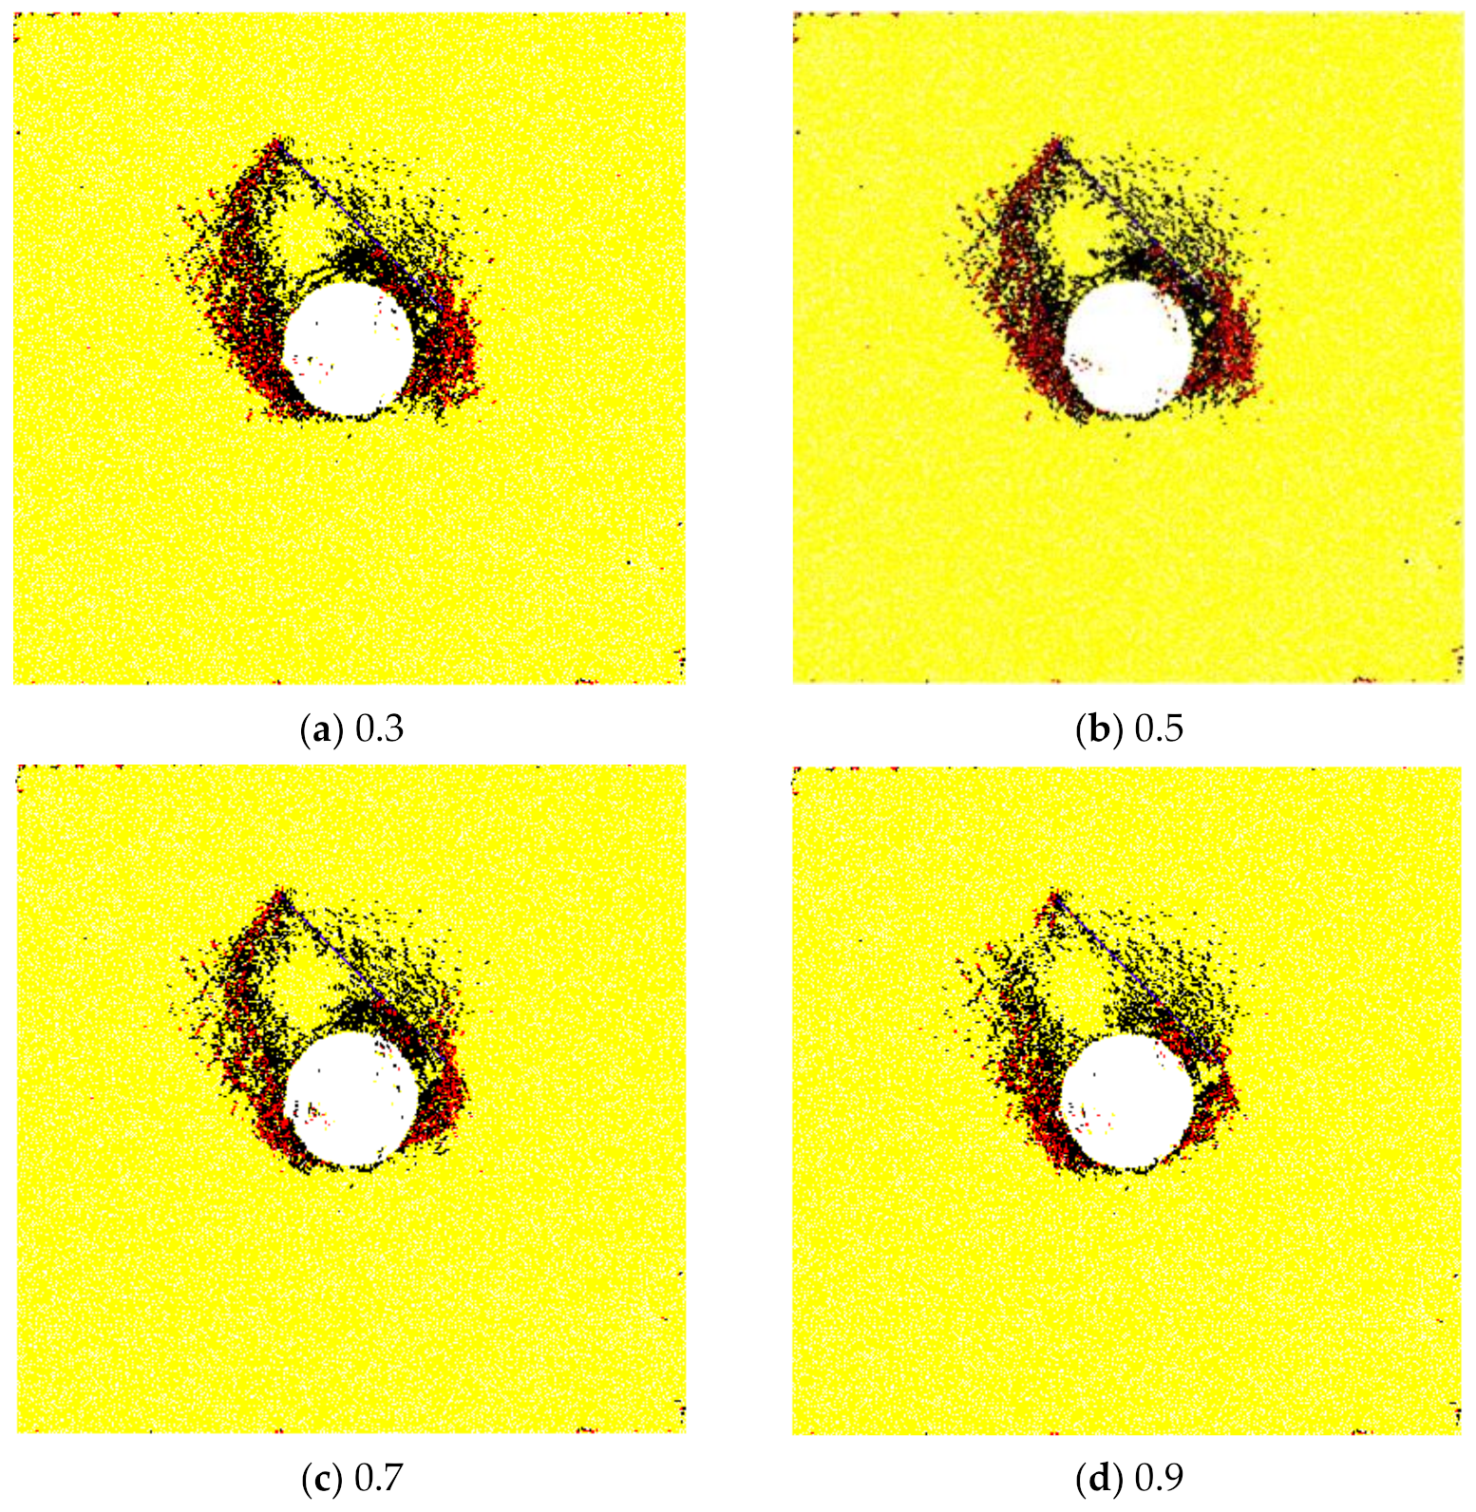
In this study, the effect of structural plane roughness on the rockburst is investigated. The roughness is represented by the friction coefficient in the SJM. The friction coefficient is assigned with the values of 0.3, 0.5, 0.7, and 0.9 in the present study. The simulation results of the four cases are shown in Figure 10. It is seen intuitively that the width and the density of two crack bands and the range of the V-shaped notch formed at the left and right side walls decrease with the increasing friction coefficient. The structure-type rockburst is not obvious at 0.9 of the friction coefficient because the oblique secondary crack band and the local crack band (Location-4 and Location-5) are not fully penetrated. The above analysis suggests that structure-type rockbursts are more likely to occur at the friction coefficient of less than 0.9.
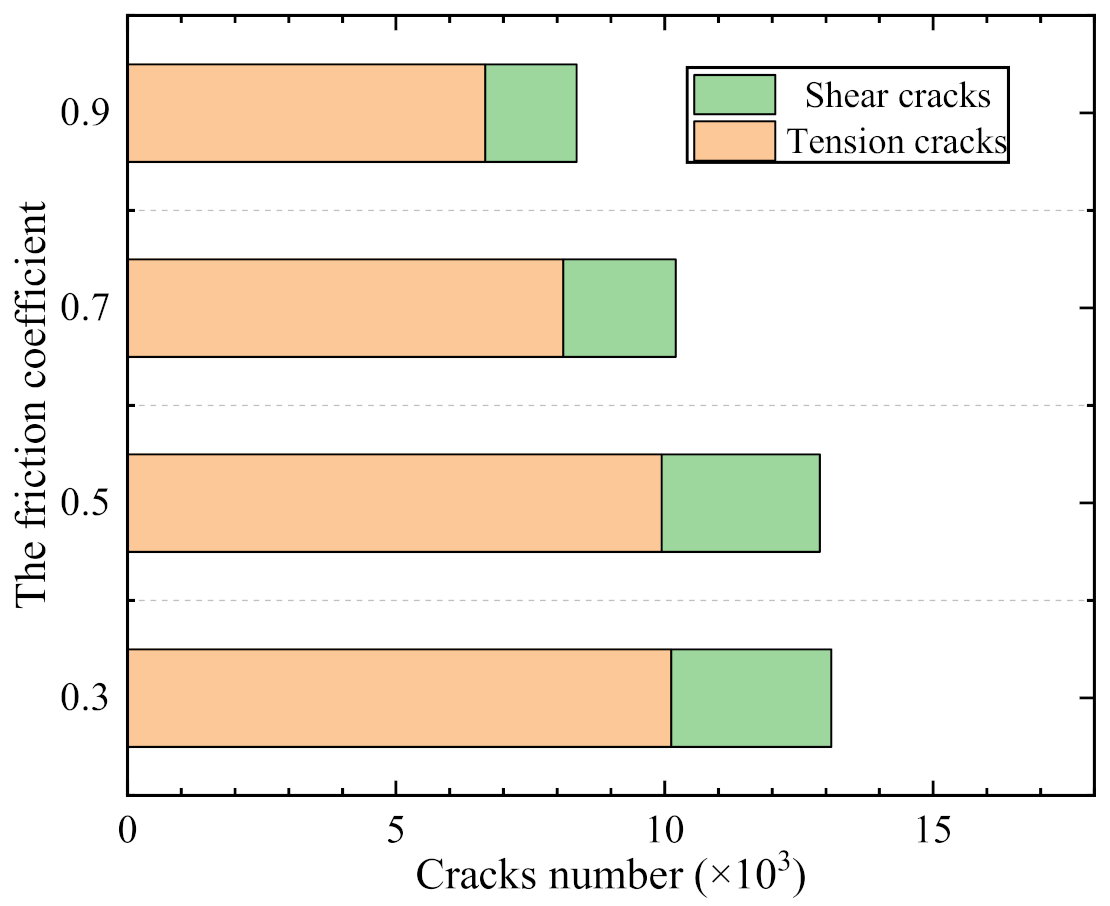
Figure 11 shows the variation of the crack number for numerical models with different friction coefficients at 60,000 steps. It is seen that the number of tensile cracks and shear cracks for the model with the friction coefficient of 0.3 is very close to that for the model with the friction coefficient of 0.5. When the friction coefficient is larger than 0.5, the crack number greatly decreases, indicating that the intensity of the overall rockburst weakens.
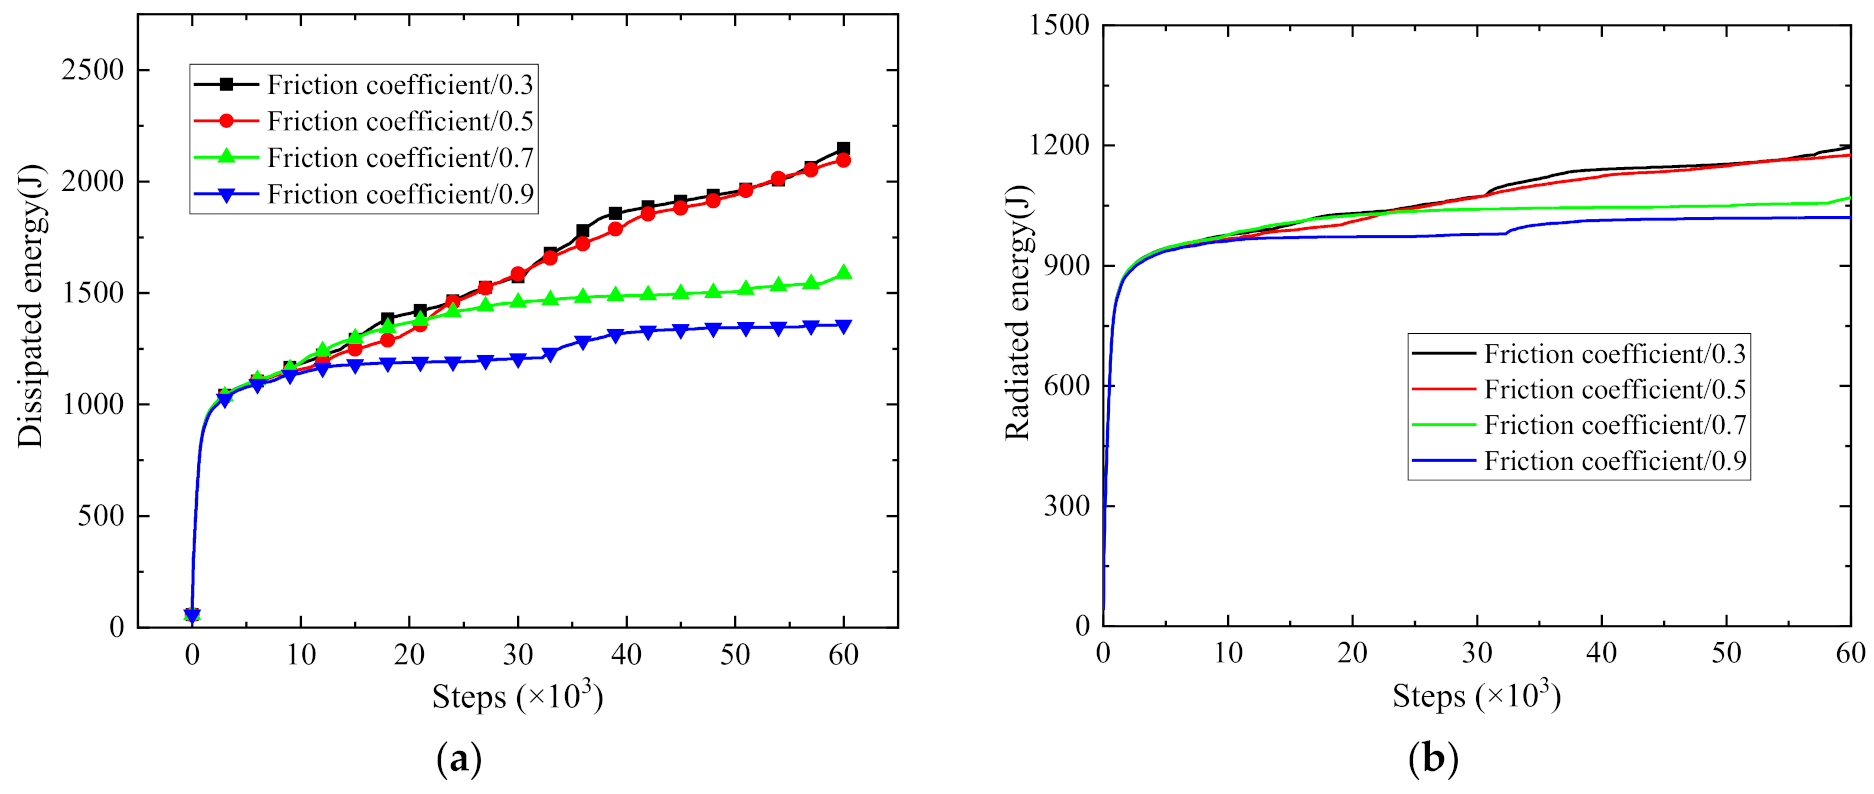
It can be seen from Figure 12 that varying the friction coefficient has little to zero impacts on the dissipated and radiated energy after excavation when the friction coefficient is less than 0.5. However, the dissipated and radiated energy decrease when the friction coefficient is larger than 0.5, which is consistent with the variation of the crack number with the friction coefficient. The above analysis shows that the impact of a friction coefficient below 0.5 on the structural-type rockburst intensity and overall damage in surrounding rock is not obvious. When the friction coefficient is greater than 0.5, the effect of the structural plane is weakened, the rock near the structural plane tends to be intact, and the intensity of structural-type rockburst decreases.
4.2. Influence of Rockmass Heterogeneity
4.2.1. Simulation of Heterogeneity
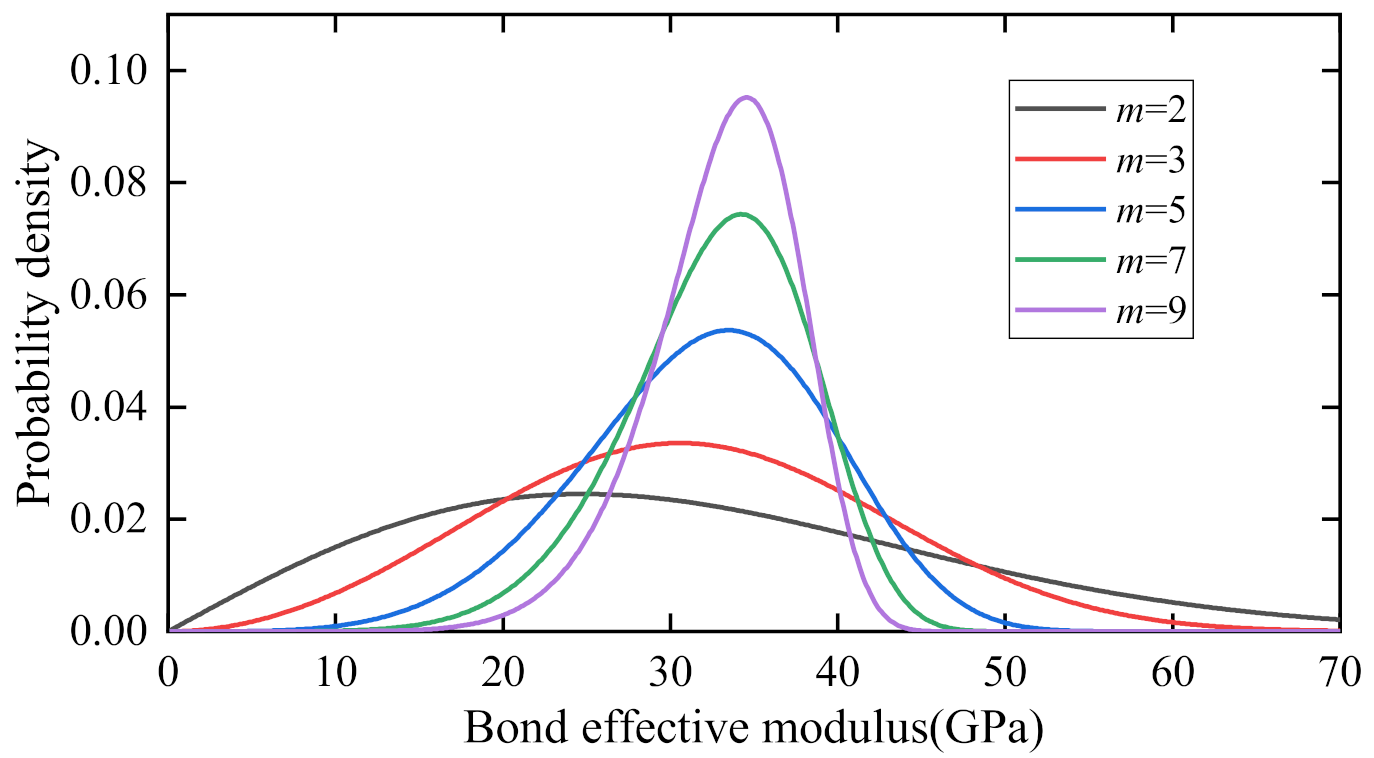
The heterogeneity in PFC can be considered in two ways. The first one is a direct incorporation of geometric heterogeneity of rock in a grain-based model [59,60]. The second one is an indirect method using statistical distribution models (i.e., Weibull distribution) for micro-parameters [61,62,63]. In this study, the Weibull distribution is used to describe the heterogeneity of micro-parameters (i.e., cohesion, effective modulus) of the FJM. The probability density function of the Weibull distribution is expressed as
where E is the effective modulus, E0 is the average value of the effective modulus, c is the cohesion, c0 is the average value of the cohesion, and m is a shape parameter, which can reflect the degree of rock heterogeneity. The smaller the parameter m is, the larger the heterogeneity will be. Taking the effective modulus as an example, the probability density curves under different m values are shown in Figure 13.
4.2.2. Influence of Cohesion Heterogeneity
The rock macro-mechanical properties are closely related to the micro-parameters in the model, especially the cohesion and effective modulus. The results from previous studies showed that the UCS increased with the increase in cohesion in FJM [64,65]. Hence, the UCS in the model may vary due to the change of the cohesion cb in grain scale [66].
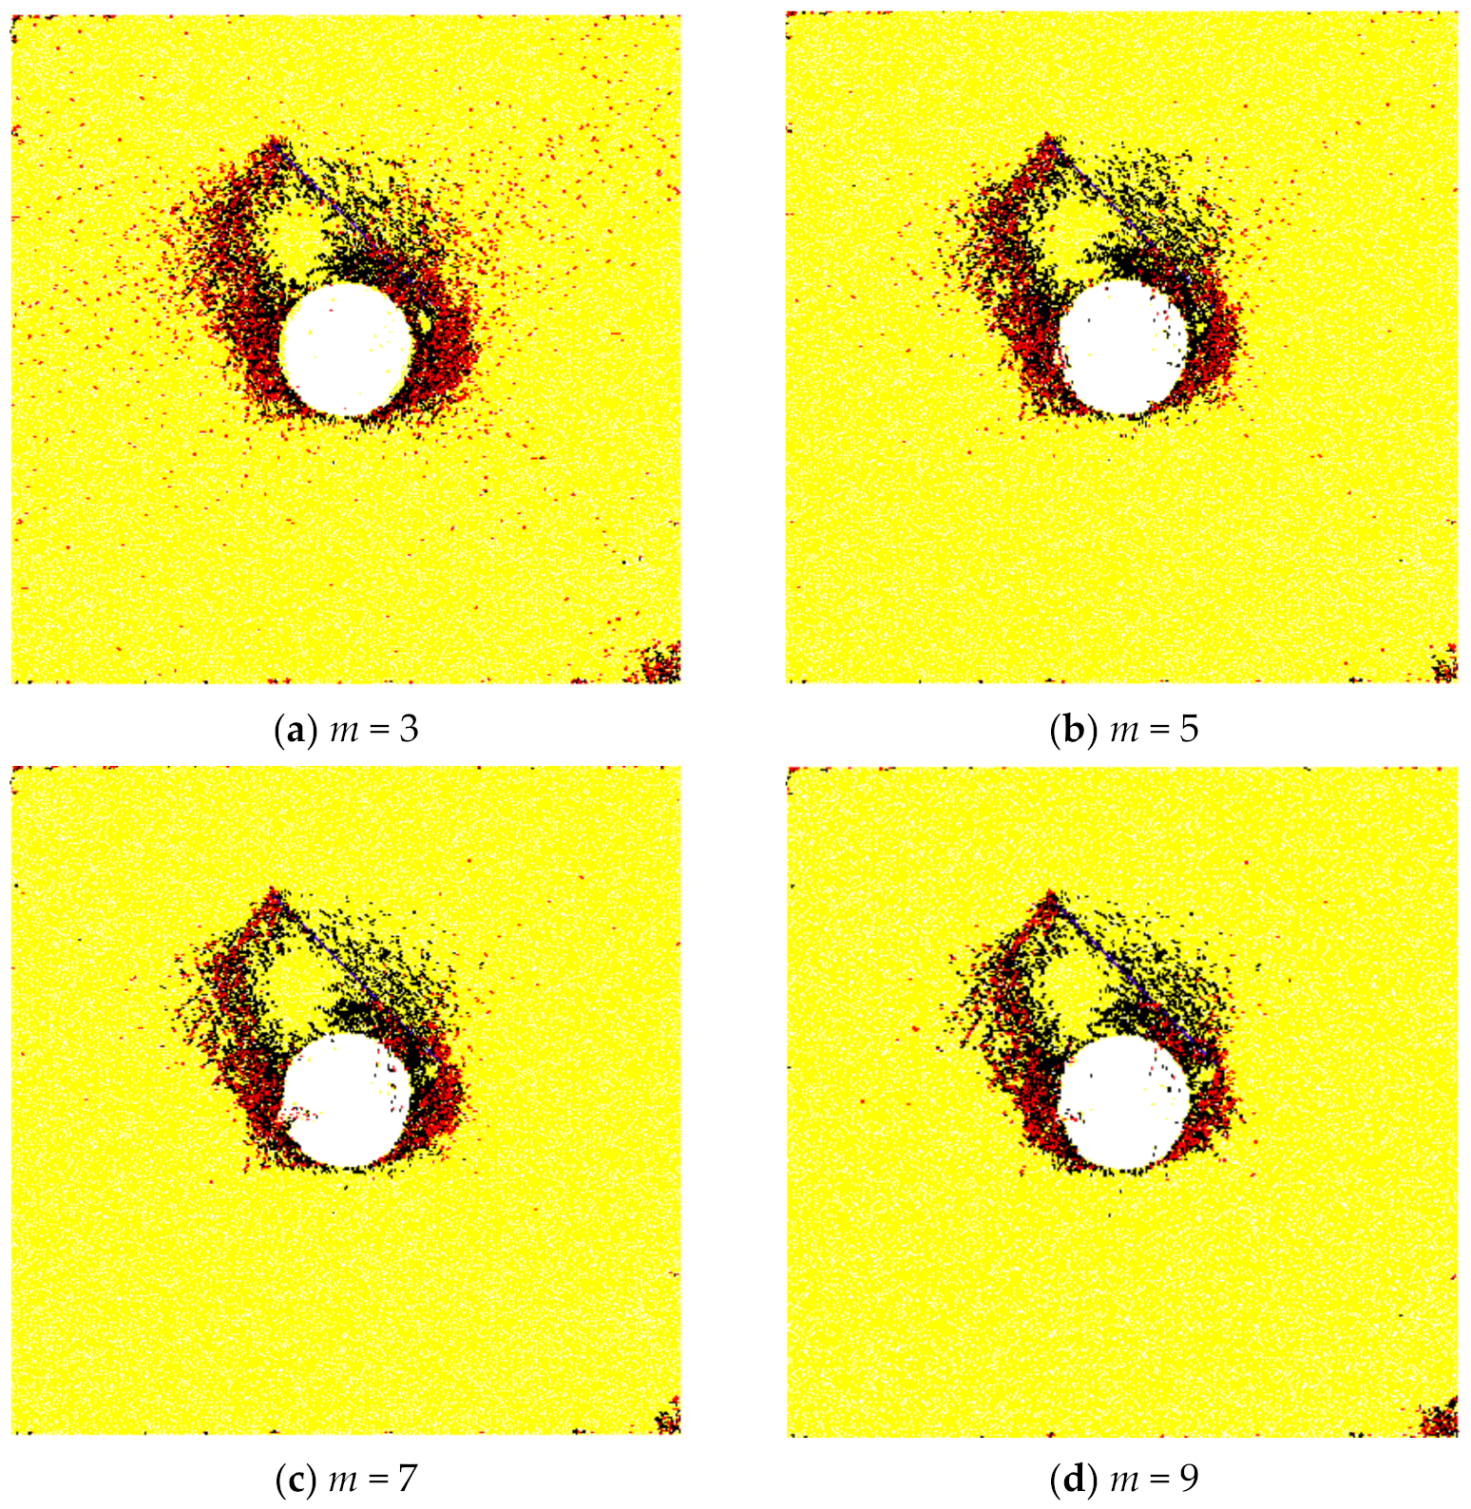
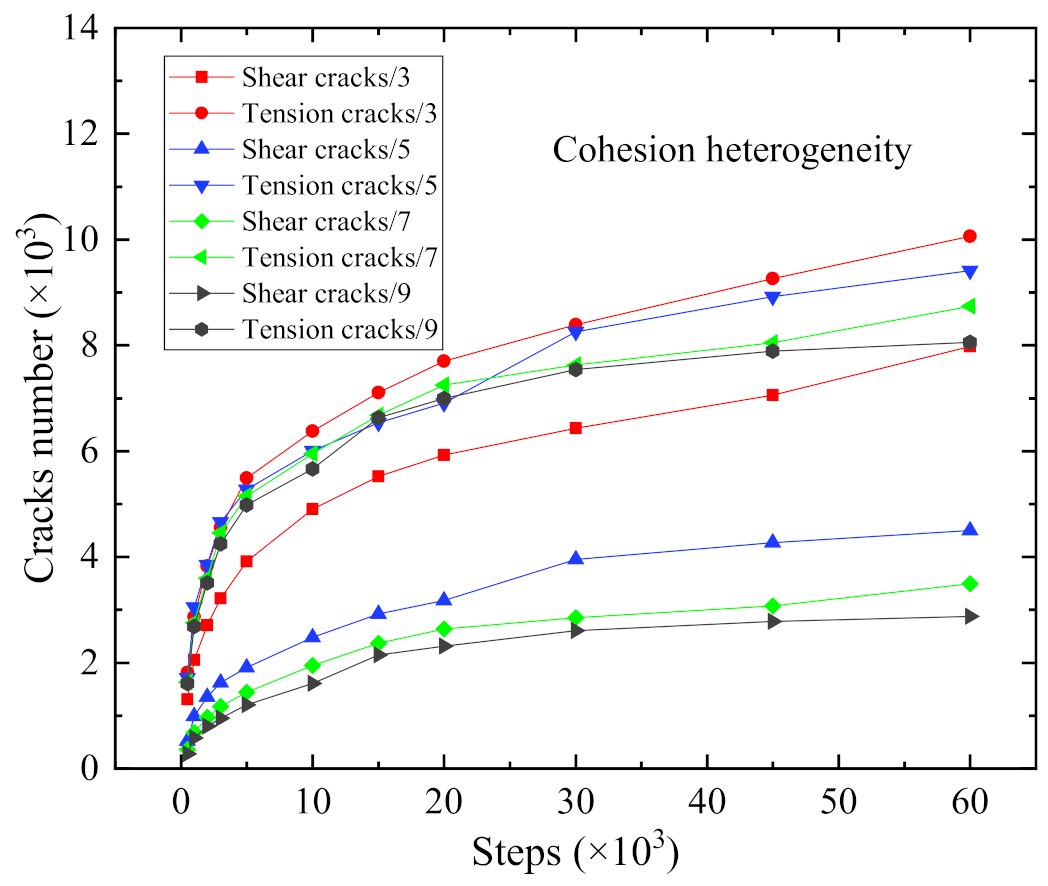
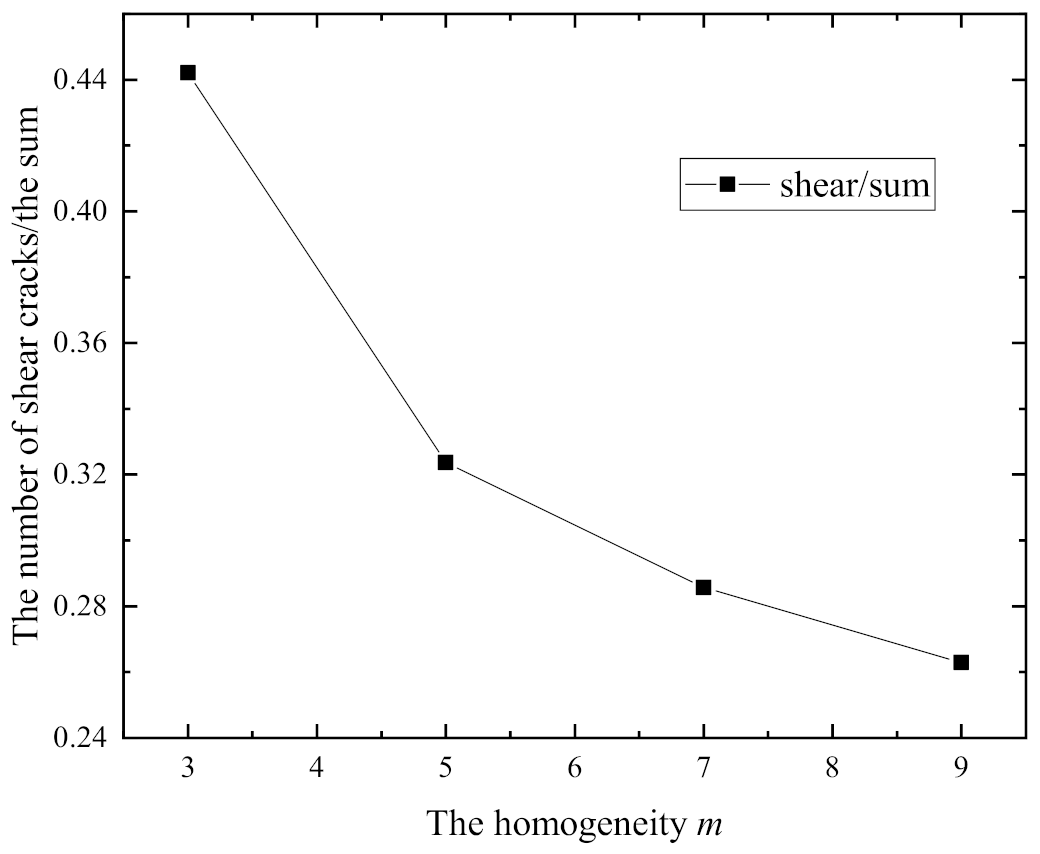
The parameter m for the cohesion is assigned with 3, 5, 7, and 9 in the study, and the corresponding simulation results are shown in Figure 14, Figure 15 and Figure 16; it is seen that the variation of the number of shear cracks and tension cracks under different parameters m is basically the same. However, the proportion of the number of shear cracks to the total number of cracks decreases with the increase in parameter m for cohesion.
The shear strength τc follows the Coulomb criterion with a tension cut-off for bonded elements in the FJC [29,31], which is expressed as
where is the cohesion, is the friction angle, and is the normal stress. The bonded state is broken in shear, and a shear crack is generated when the shear stress exceeds the shear strength . The cohesion will be more discrete as the heterogeneity m decreases, which will make shear strength more discrete. Therefore, many contacts with the low shear strength distribute non-uniformly in rockmass, which makes it easier for shear cracks to form. Due to the randomness of the cohesion value at assignment for the grains at different positions, the distribution of shear cracks also has the characteristic of scatter.
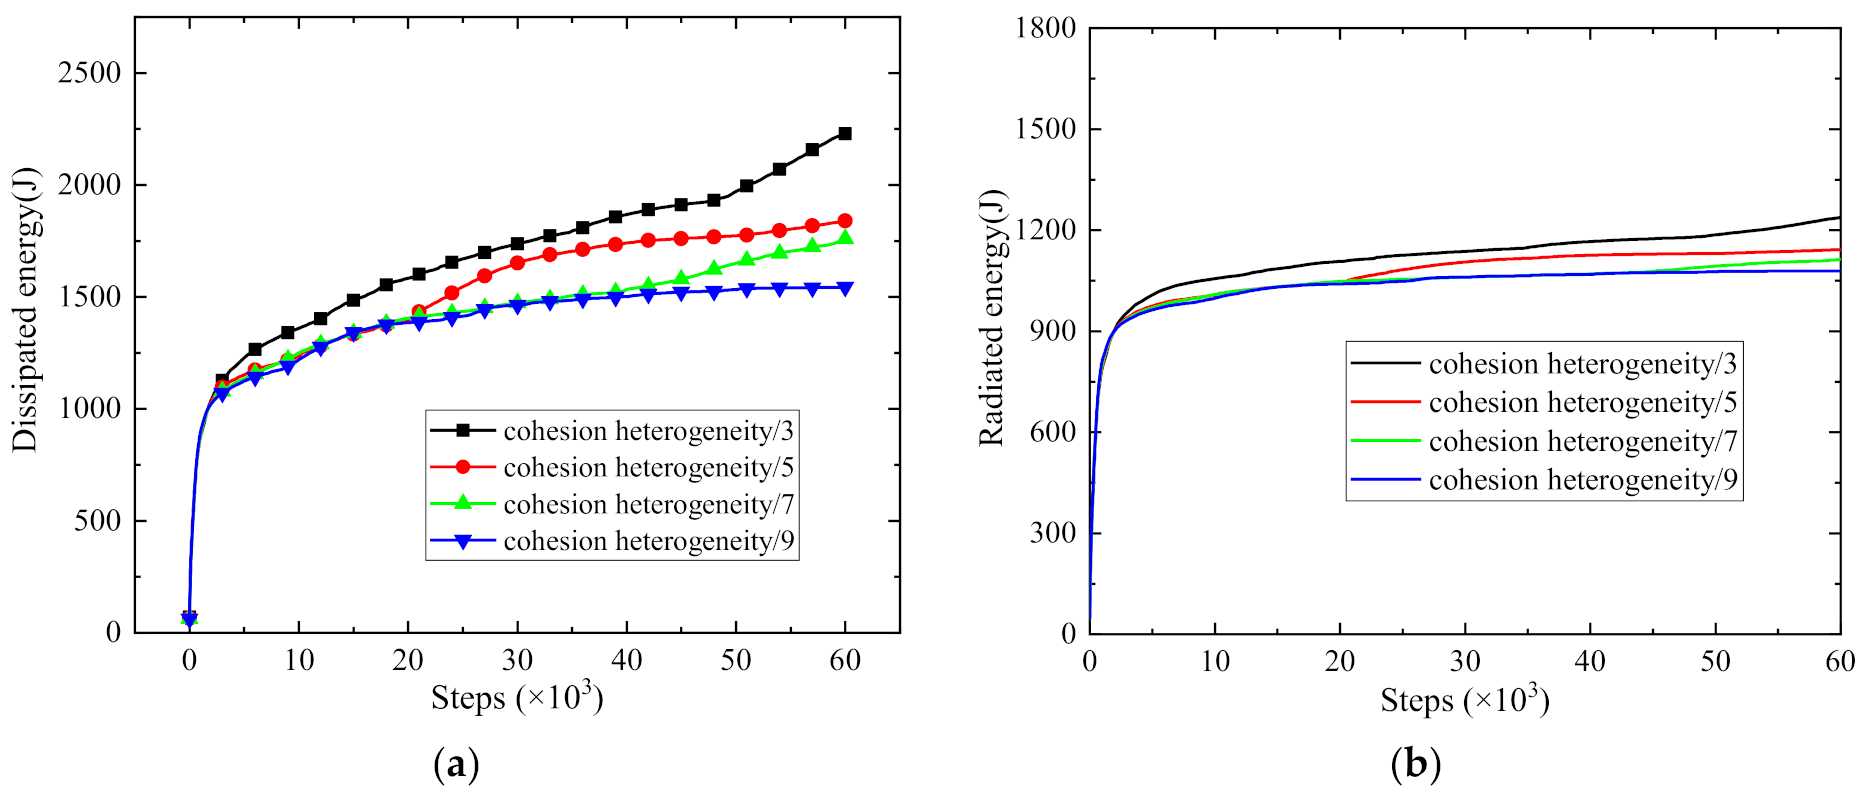
As shown in Figure 17, dissipated and radiated energy in models decreases with the growth of cohesion heterogeneity m. The energy dissipated for the cases at m of 3, 5, 7, and 9 is 2229.06, 1839.90, 1760.31, and 1543.22 J, respectively, which increase by 40.40%, 15.87%, 10.85%, and −2.82% compared with the 1587.97 J of dissipated energy for homogeneous rockmass. The energy radiated for the cases at m of 3, 5, 7, and 9 are 1237.71, 1142.54, 1113.56, and 1078.71 J, respectively, which increase by 15.67%, 6.78%, 4.07%, and 0.81% compared with the 1070 J of that for homogeneous rockmass. This indicates that the structure-type rockburst intensity and overall damage in surrounding rock decrease and rockmass near excavation tends to be homogeneous with increasing cohesion heterogeneity m.
4.2.3. Influence of Effective Modulus Heterogeneity
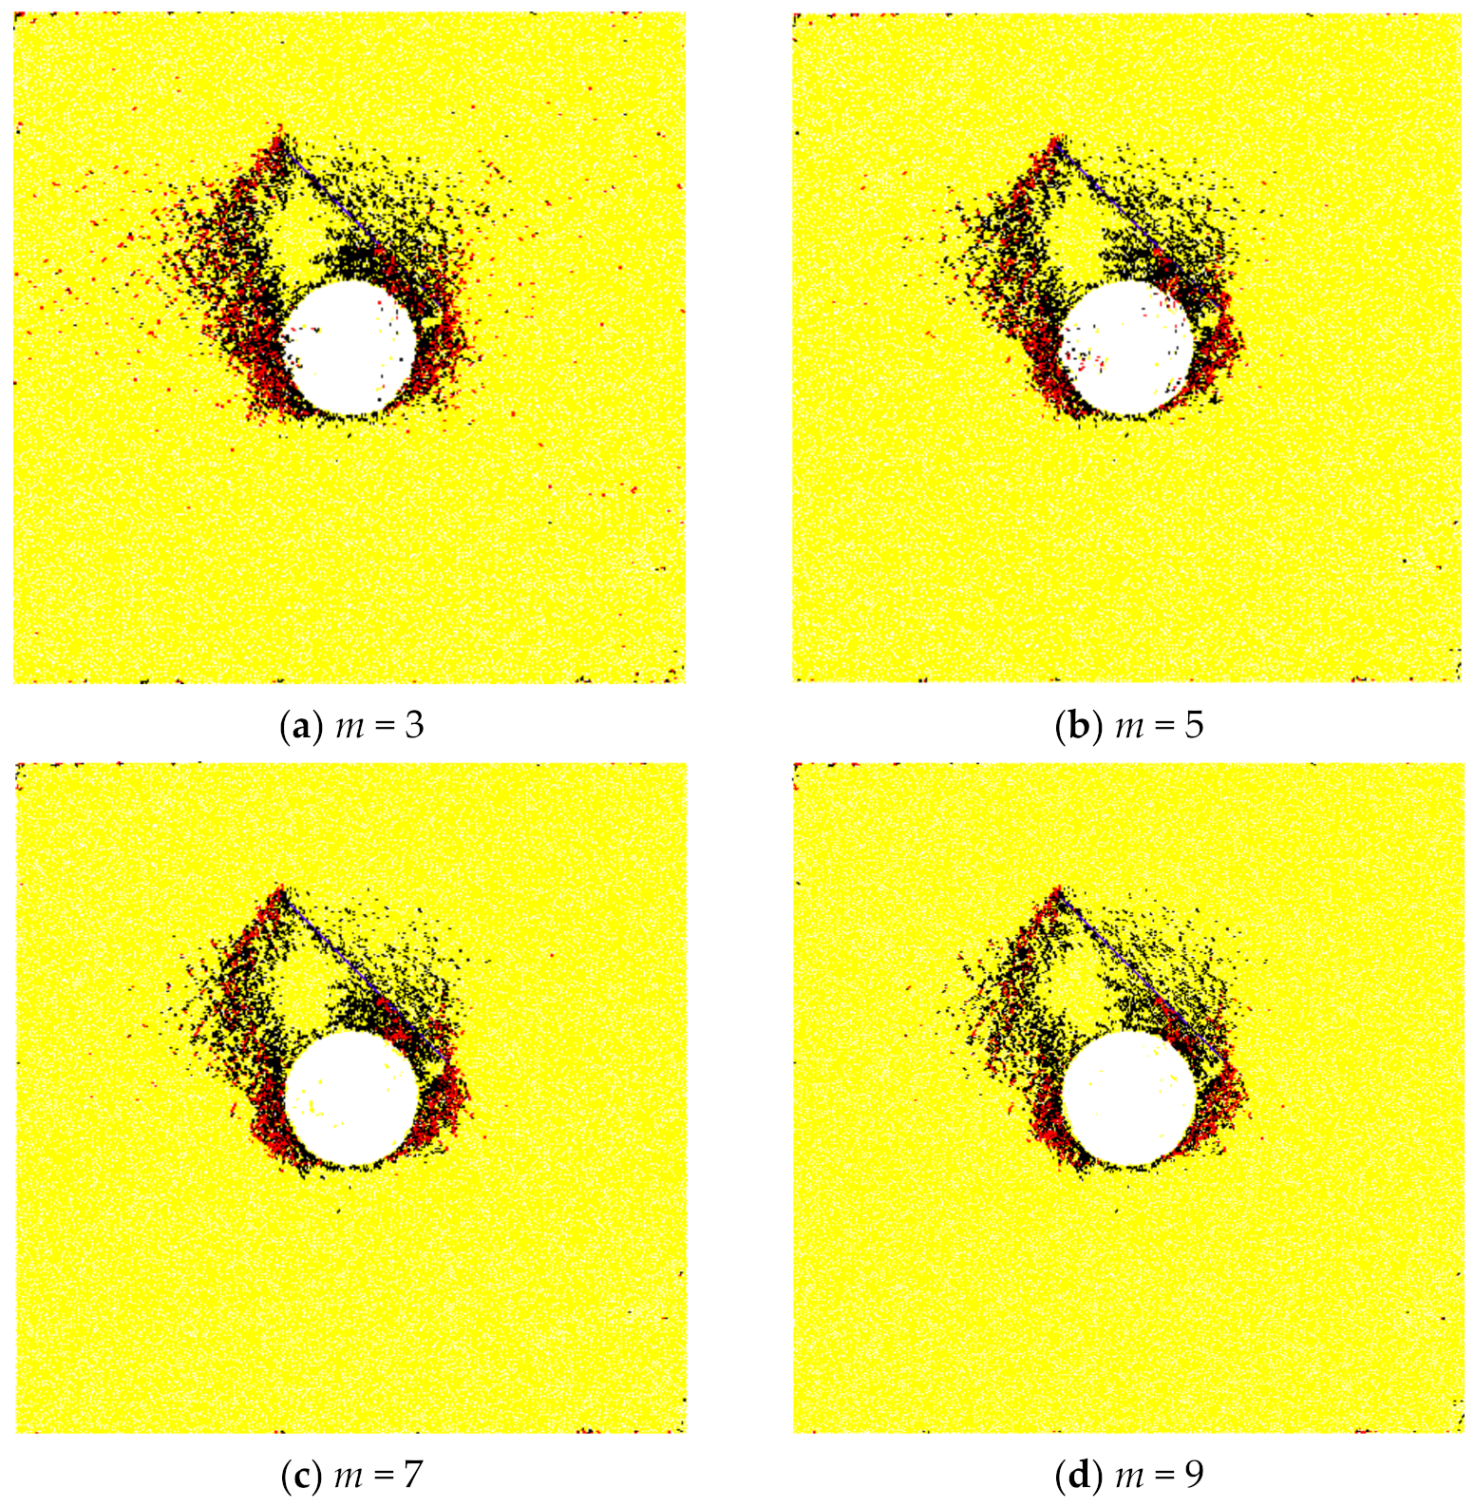
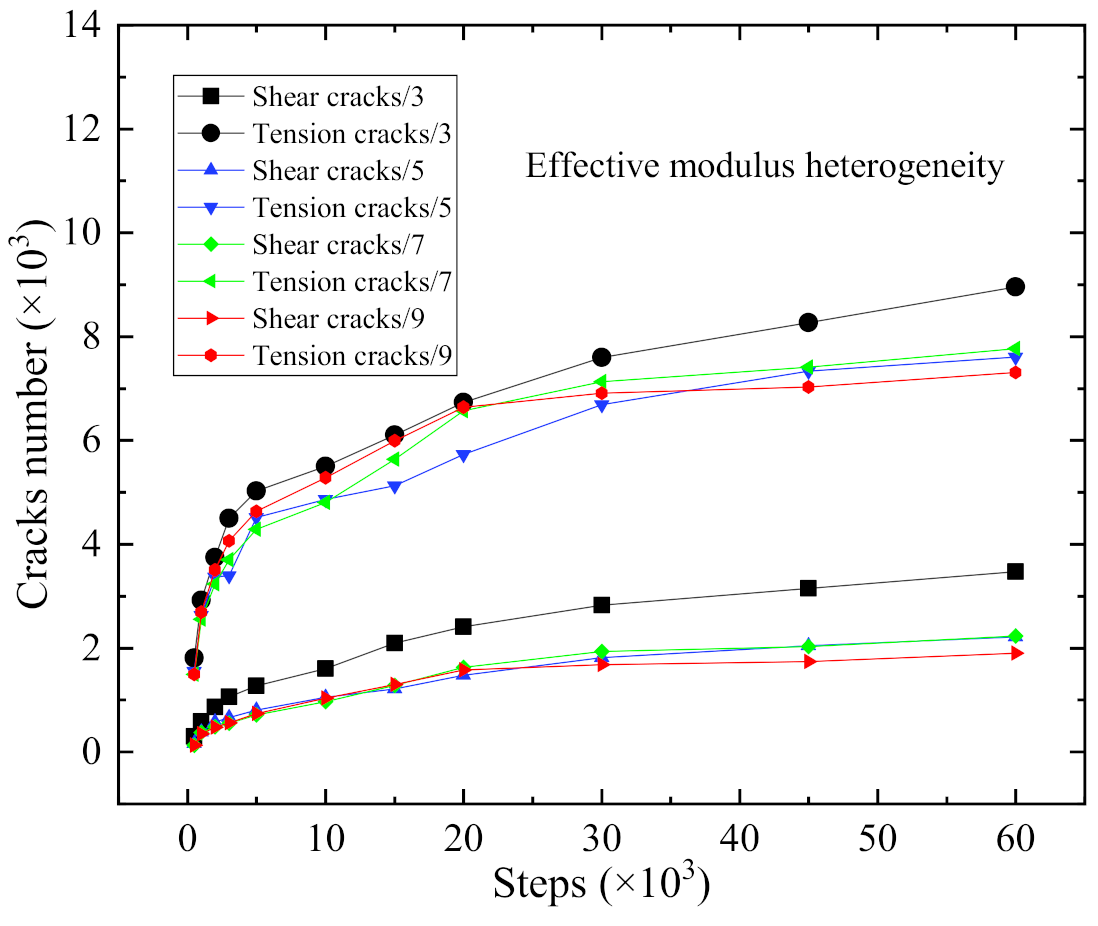
The simulation results in models with different m for effective modulus are shown in Figure 18 and Figure 19. It can be seen that the overall coalescence of the crack bands in models with different m is basically the same. In addition, due to the strength variation in rockmass under heterogeneous condition, discretized cracks may appear at some positions far away from the tunnel. It is worth noting that the number of cracks is not a completely negative correlation with the parameter m for the effective modulus. The number of cracks at m = 5 is less than that at m = 7. Dai et al. [63] also observed a similar result.
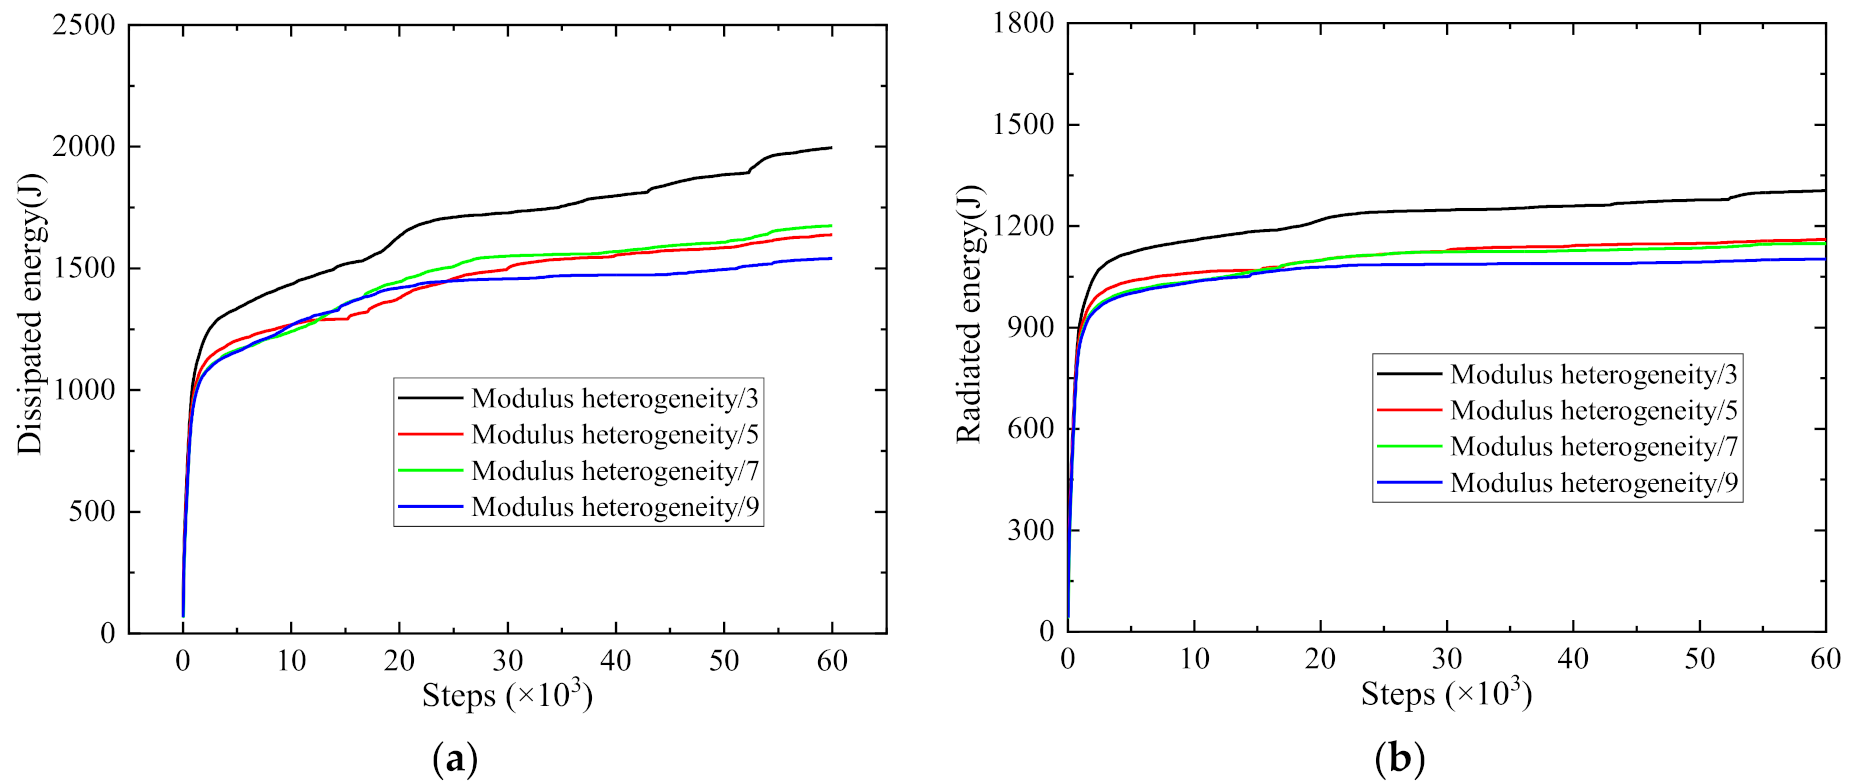
As shown in Figure 20, dissipated energy in models after excavation decreases with the growth of modulus heterogeneity m except m = 7, at which dissipated energy is slightly larger than that at m = 5. This is in accordance with the variation of cracks number. The energy dissipated for the cases at m of 3, 5, 7, and 9 are 1995.89, 1638.03, 1675.05, and 1540.44 J, respectively, which increase by 25.70%, 3.15%, 5.48%, and −3.00% compared with the 1587.97 J of dissipated energy for homogeneous rockmass. The energy radiated for the cases at m of 3, 5, 7, and 9 are 1304.68, 1160.14, 1148.35, and 1102.56 J, respectively, which increase by 21.93%, 8.42%, 7.32%, and 3.04% compared with the 1070 J of that for homogeneous rockmass. This shows the structure-type rockburst intensity and overall damage in surrounding rock decrease in general and rockmass near excavation tends to be homogeneous with the growth of modulus heterogeneity m.
4.2.4. Comparison for Influence of Cohesion and Modulus Heterogeneity
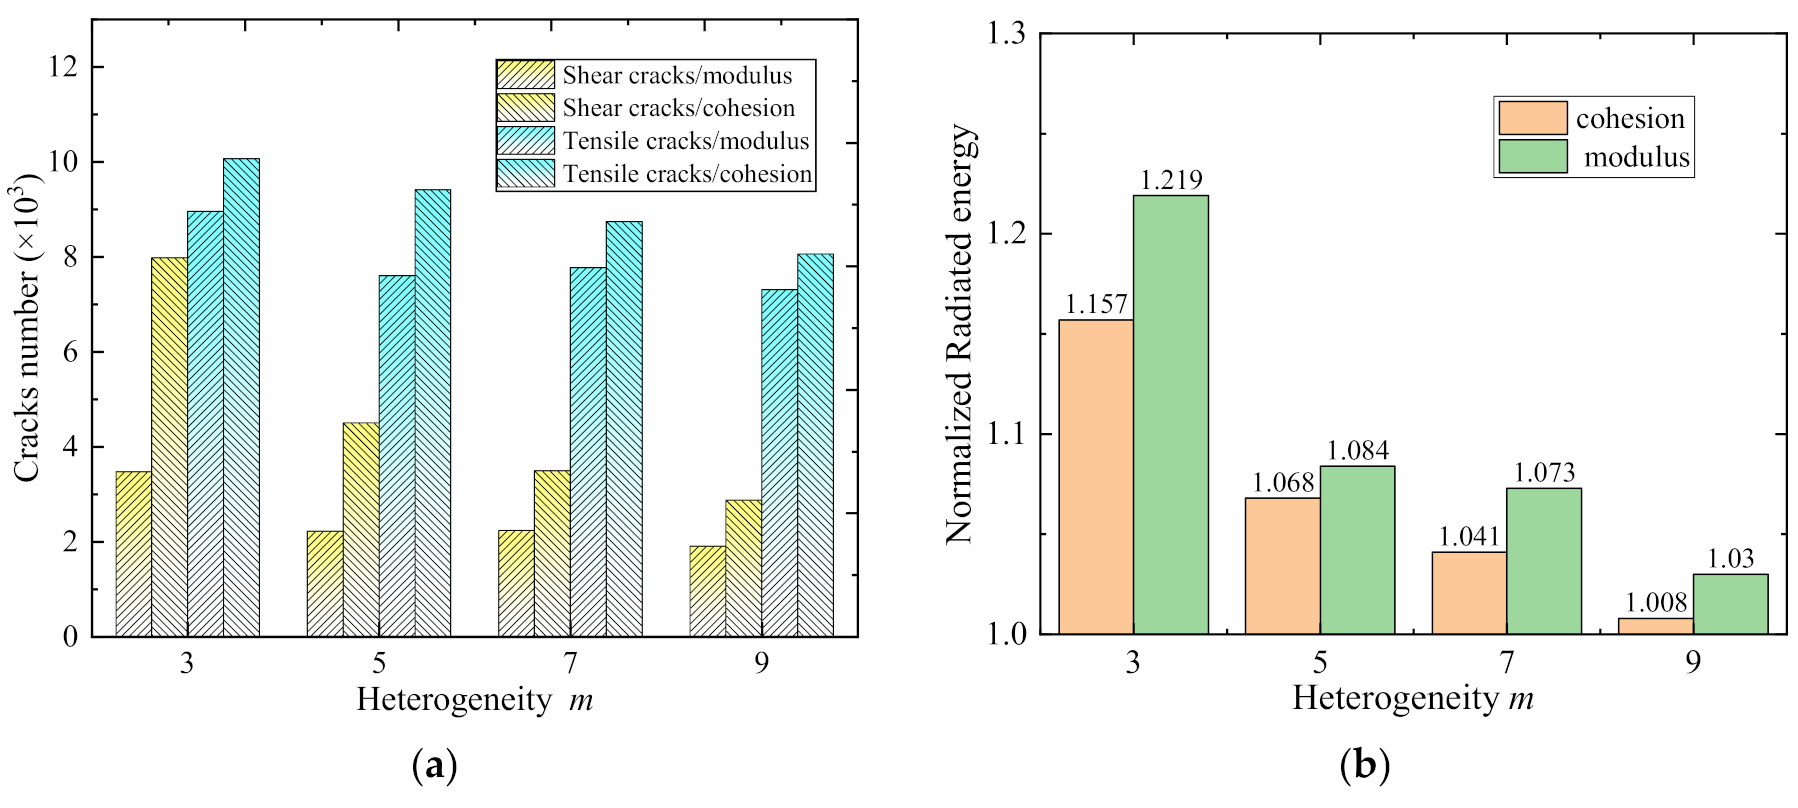
It can be found from Figure 21a that the number of shear and tensile cracks in the models with cohesion heterogeneity is significantly higher than that in the models with modulus heterogeneity at the same parameter m, which means that the effect of cohesion heterogeneity on overall damage in surrounding rock is greater than the effect of modulus heterogeneity. In order to compare the impact of two parameters’ heterogeneity on rockburst, as shown in Figure 21b, the radiated energy is normalized with the value for homogeneous rockmass. It is obvious that normalized radiated energy in the models with cohesion heterogeneity is always lower than that in the models with modulus heterogeneity, indicating the effect of modulus heterogeneity on the structure-type rockburst intensity is greater than the effect of cohesion heterogeneity.
4.3. Influence of Lateral Pressure Coefficient
In this section, we study the effect of lateral pressure coefficient λ on the simulation results. The lateral pressure coefficient λ is defined as the ratio of vertical in situ stress to horizontal in situ stress. In this study, the vertical in situ stress is kept unchanged (i.e., 140 MPa). The horizontal in situ stress is set to be 35, 70, 105, and 140 MPa, and the corresponding λ is 0.25, 0.5, 0.75, and 1, respectively.
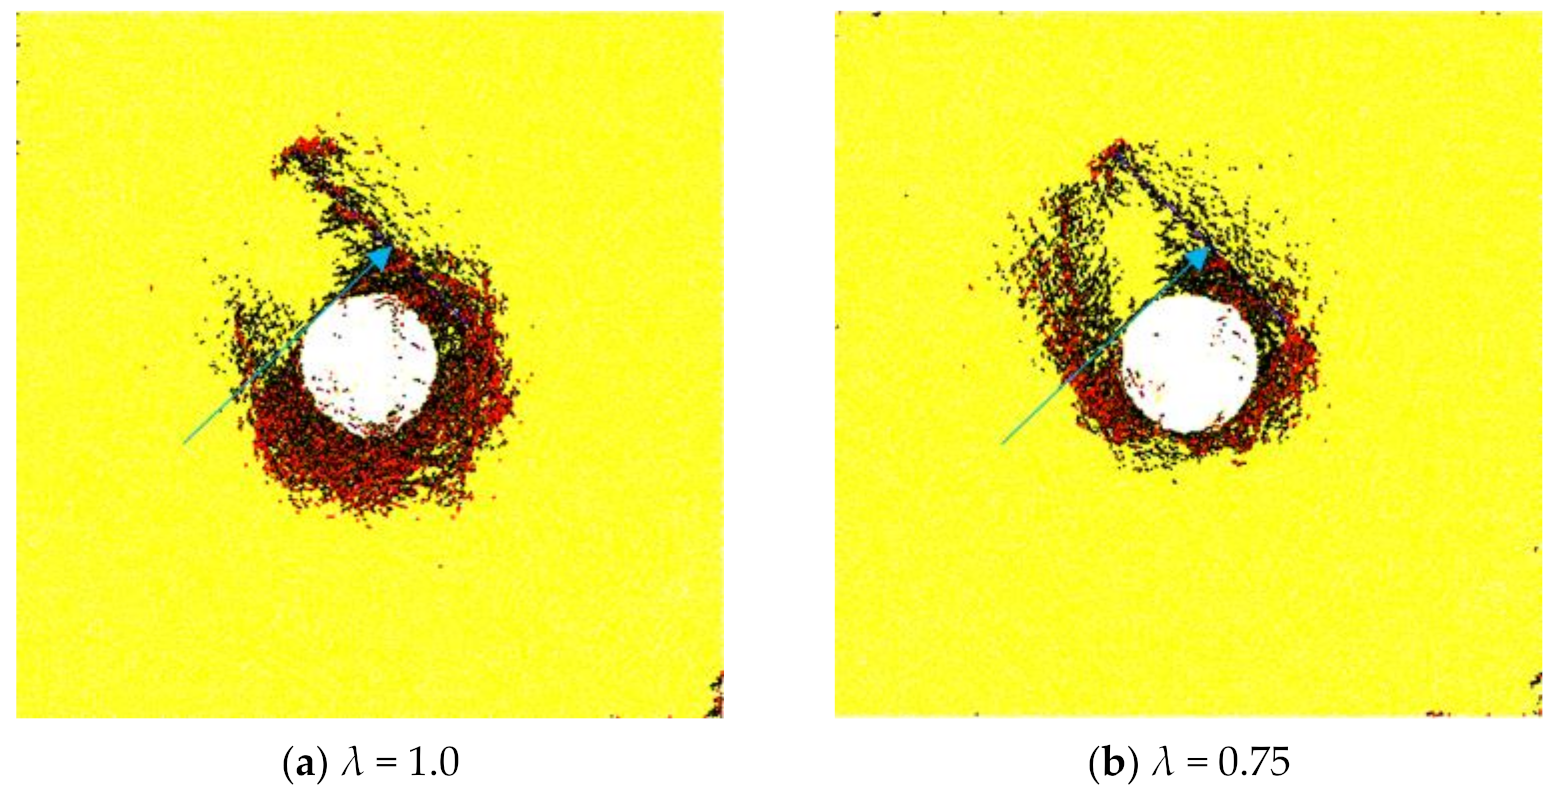
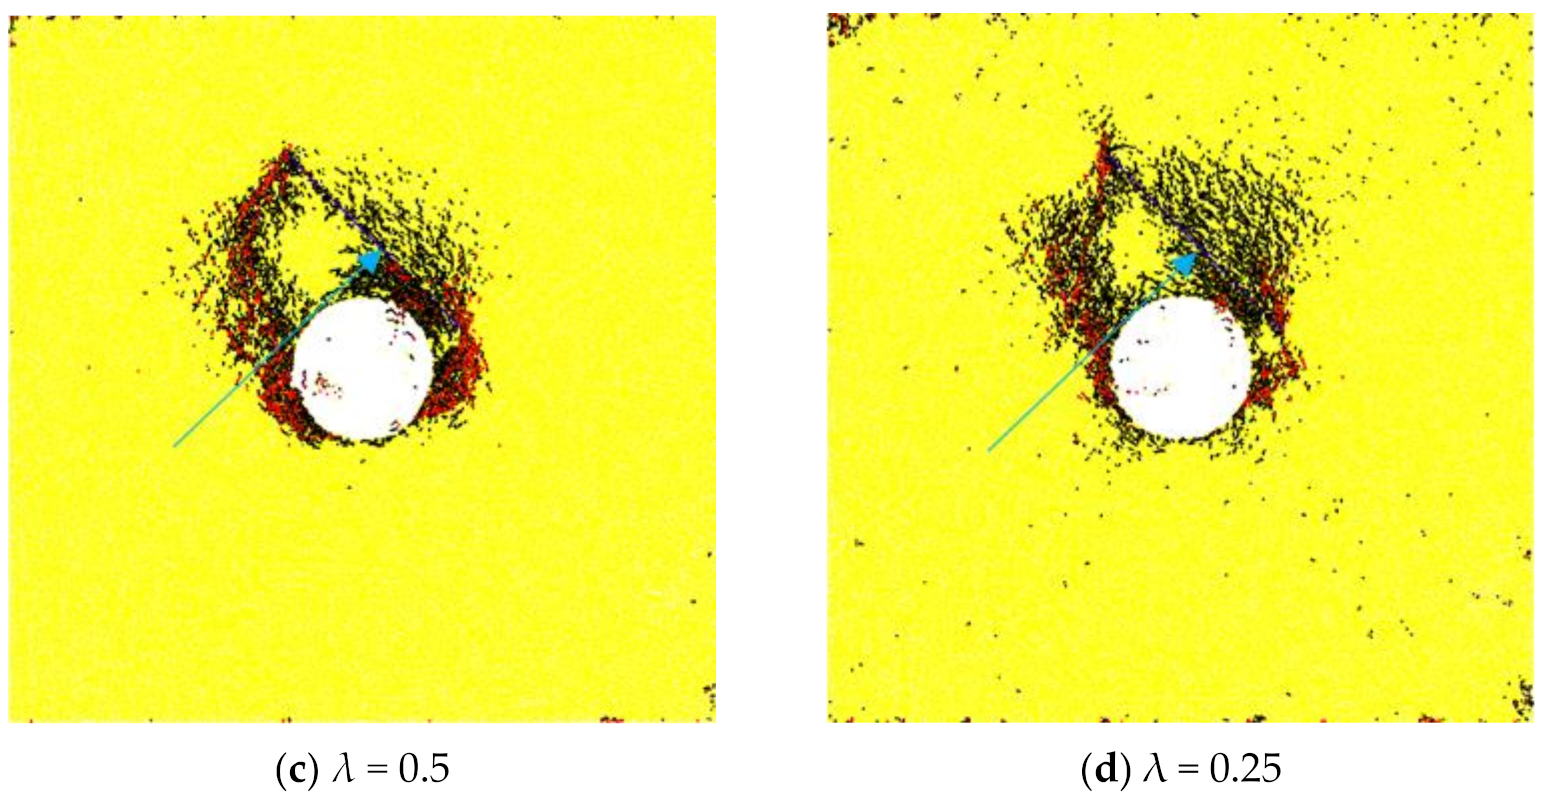
The simulation results for models with different λ are shown in Figure 22. When the λ is 1, the failure zones are formed in the two ends of the structural plane, the interaction zone between the structural plane and the tunnel, and the lower half of the tunnel. It can be seen that the structure-type rockburst is not obvious at λ of 1. The results for models with λ of 0.25, 0.5, and 0.75 are quite different from that for the model with λ of 1. The oblique secondary crack band (Location-5) and the local crack band (Location-4) (see blue arrow in Figure 22) are connected at λ of 0.25, 0.5, and 0.75, which becomes more obvious as λ decreases. Moreover, the width of the failure zones at both side walls decreases with λ owing to the existence of the structural plane and the reduction of horizontal in situ stress. The damage zone at both side walls becomes very small at λ of 0.25 compared with that at λ of 0.5. Therefore, it can be concluded that structure-type rockburst is more pronounced when the λ is close to 0.5.
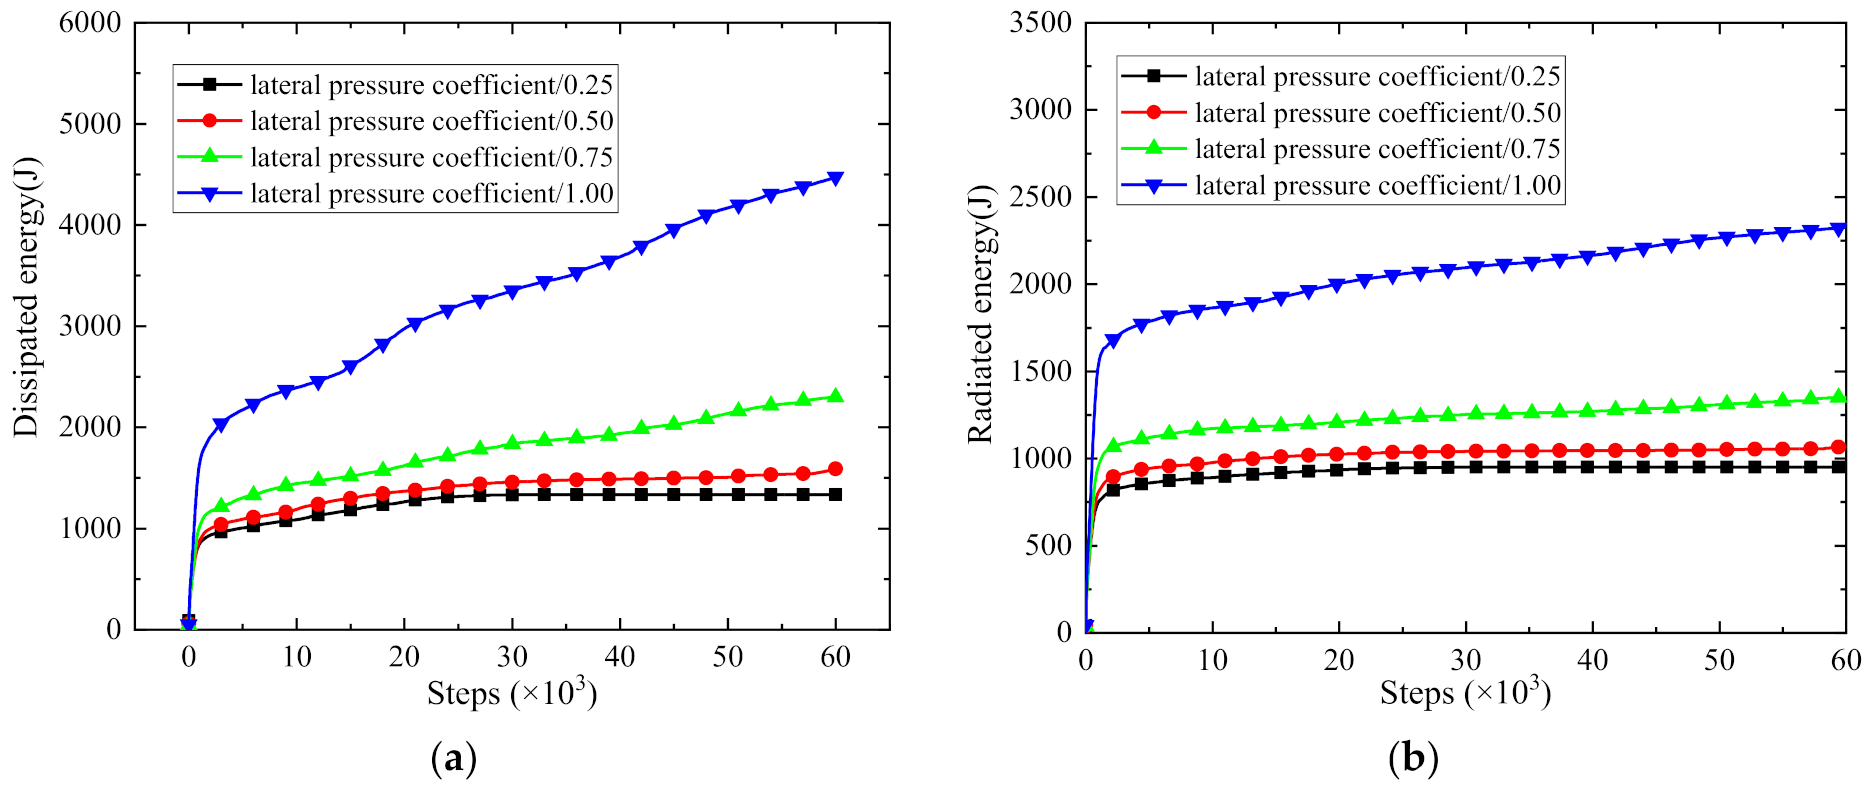
As shown in Figure 23, the dissipative and radiated energy after excavation rise with lateral pressure coefficient λ. Concretely speaking, the energy dissipated for the cases at λ of 0.25, 0.5, 0.75, and 1 are 1333.59, 1587.97, 2298.68, and 4474.17 J, respectively, which increase by 19.07%, 53.81%, and 175.11%, respectively, compared with that at λ of 0.25, indicating that λ has a very significant effect on the overall damage in surrounding rock. The energy radiated for the cases at λ of 0.25, 0.5, 0.75, and 1 are 949.98, 1069.98, 1351.7, and 2327.76, respectively, which increase by 12.63%, 42.29%, and 145.03%, respectively, compared with that at λ of 0.25, showing λ has a very significant effect on the intensity of rockmass failure. The results show that the elastic strain energy stored in the rock under initial in situ stress eliminates with the decreasing lateral pressure coefficient under constant vertical in situ stress. The dissipative energy during the stress redistribution after excavation reduces obviously, accompanied by the decrease in crack number and radiated energy.
4.4. Influence of Structural Plane Length
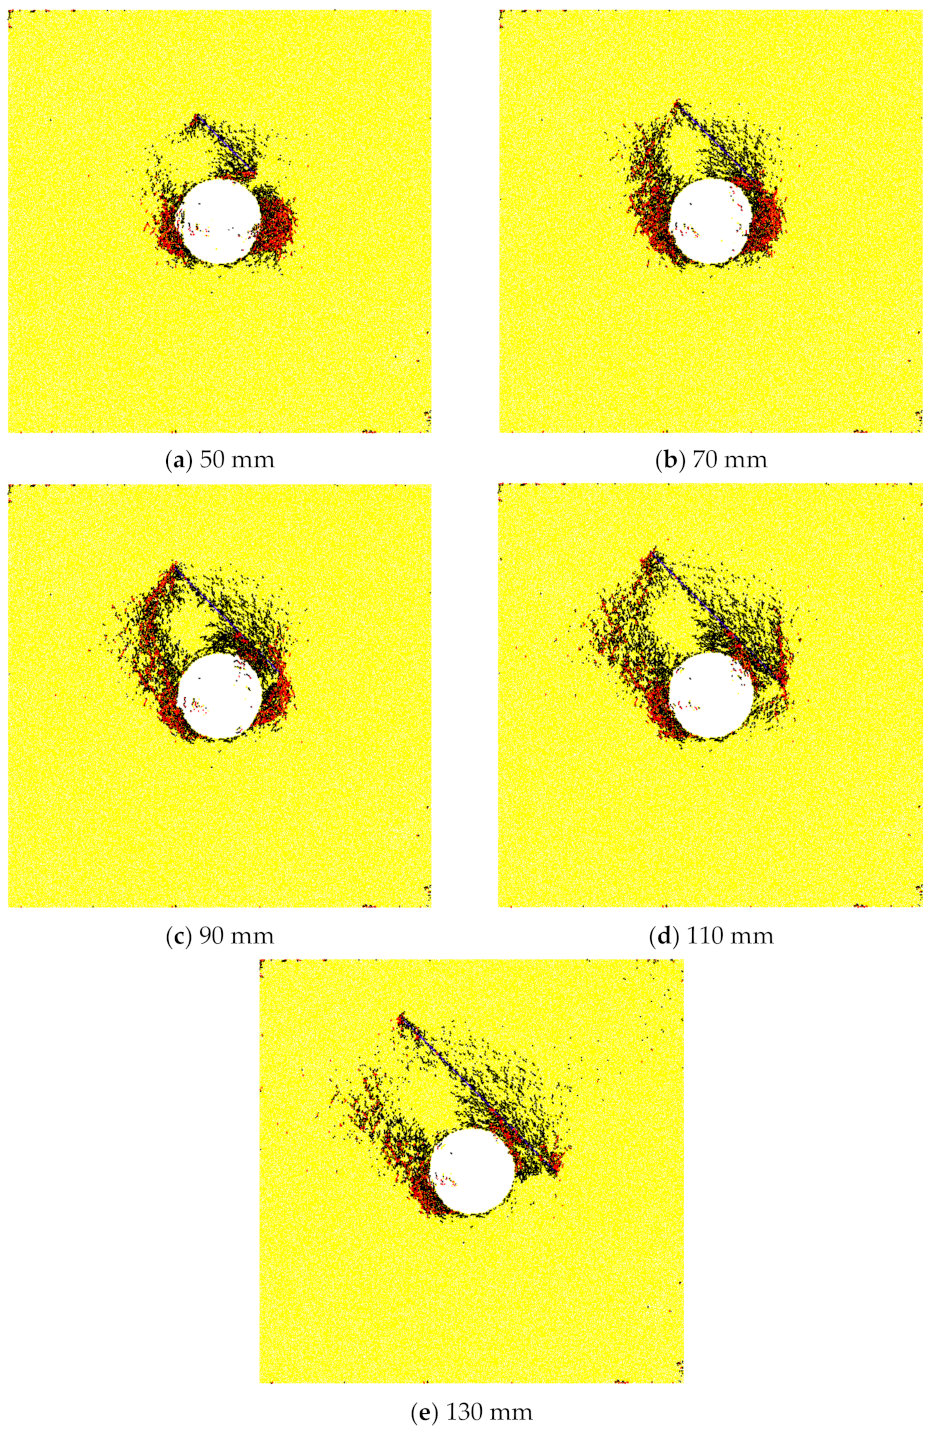
The results in previous sections show that the existence of the structural plane has a significant effect on rock failure in deep ground. However, the effect of structural plane length on rock failure is seldom discussed in previous studies. This section examines the influence of structural plane length on the simulation results. Numerical models with structural plane length ranging from 50 to 130 mm are generated, and the simulation results of different models are shown in Figure 24.
The length of the structural plane in the “11.28” rockburst that occurred in the Jinping II Hydropower Station is not given in the literature. It is found that when the structural plane length is near 90 mm, the simulation results agree with the field observation. If the length of the structural plane is smaller, the damage is mainly concentrated in the interaction zone and both side walls. The oblique secondary crack band and the local crack band are not developed sufficiently, so it is difficult to form a V-shaped failure zone at the tunnel dome. If the length of the structural plane is larger, the damage mainly occurs in the interaction zone and the left side wall. The upper end of the structural plane is less affected by the tunnel, so the V-shaped failure zone at the tunnel dome is hard to form. Therefore, it can be concluded that structure-type rockburst is more pronounced when the structural plane length is close to 90 mm.
5. Similarity between the Numerical Modeling and the Actual Tunnelling Case
In order to explore the evolution mechanism of the “11.28” rockburst from the view of DEM, based on the field observations, this problem was considered as the PFC 2D plane strain model at the laboratory scale, e.g., the interaction mechanism between the single joint and the circular hole under high geostress and unloading induced by excavation. In this study, the initial geostress state near the tunnel before excavation was reached and kept constant by the servo mechanism, which is in agreement with the actual tunnelling case and is difficult to achieve in laboratory tests currently. A more realistic simulation can be carried out by building the models of the same size as the field tunnel to study the failure mechanism of a tunnel near the fault. However, due to ISRM’s requirements for specimen size in the uniaxial compressive test [67] and Brazilian split test [68], the particle size used in the micro-parameters calibration is in the range of 0.7~1.16 mm, which is usually consistent with the particle size in the model due to the dependence of mechanical properties for numerical specimens on the particle radius [26,69,70]. However, this also limits the overall size of the model in PFC. The field-scale numerical models based on the particle flow code are still needed to further study the problem in the future.
6. Conclusions
The present numerical study investigates the evolution mechanism of structure-type rockburst using a discrete element modeling approach. The main conclusions are as follows:
(1) For the structure-type rockburst, the failure occurs first in the interaction zone between the structural plane and the tunnel. A small-scale strainburst occurs at both sides of the tunnel before complete failure of rock mass. The secondary crack band develops obliquely downwards and connects with the local crack band that develops upward. The shear slip along the structural plane may happen through the whole loading process. Before the two crack bands penetrate completely, shear fracture occurs in the positions where micro-cracks are incomplete coalescence, causing violent rockburst and V-shaped notch.
(2) The main differences between strainburst and structure-type rockburst mainly include (a) the distribution of local concentrated stress zone, (b) the evolution mechanism, and (c) the failure locations.
(3) For the friction coefficient greater than 0.5, the influence of the structural plane is weakened, the rock near excavation tends to be intact, and the dissipated and radiated energy in model decreases. The structure-type rockburst is more likely to occur when the friction coefficient is less than 0.9.
(4) The dissipated and radiated energy and crack number in structural-type rockburst reduce with increasing cohesion and effective modulus heterogeneity m in rockmass.
(5) The lateral pressure coefficient has a significant effect on the intensity and failure mode of deep rock failure, and the dissipative and radiated energy after excavation rise obviously with lateral pressure coefficient under constant vertical stress. The structural-type rockburst is more pronounced when the structural plane length is close to 90 mm.
Furthermore, this study is based on a two-dimensional plane strain model and intermediate principal stress is not considered. In addition, due to the limitation of the particle size, numerical models at the laboratory scale rather than field scale are built to study the evolution mechanism of structure-type rockburst. Therefore, further research is still needed in the future.
Author Contributions
Conceptualization, C.Z.; methodology, D.L.; writing—original draft, C.Z.; writing—review and editing, S.W., L.C. and J.P.; supervision, S.W.; funding acquisition, D.L. All authors have read and agreed to the published version of the manuscript.
Funding
The study presented in this paper was supported by the Distinguished Youth Science Foundation of Hunan Province of China (No. 2019JJ20028) and the key project of the National Natural Science Foundation of China (No. 41630642).
Institutional Review Board Statement
Not applicable.
Informed Consent Statement
Not applicable.
Data Availability Statement
Not applicable.
Conflicts of Interest
The authors declare no conflict of interest.
References
- Jiang, T.; Shen, Z.; Liu, Y.; Hou, Y. Carbon Footprint Assessment of Four Normal Size Hydropower Stations in China. Sustainability 2018, 10, 2018. [Google Scholar] [CrossRef] [Green Version]
- Tang, W.; Li, Z.; Tu, Y. Sustainability Risk Evaluation for Large-Scale Hydropower Projects with Hybrid Uncertainty. Sustainability 2018, 10, 138. [Google Scholar] [CrossRef] [Green Version]
- Feng, G.; Xia, G.; Chen, B.; Xiao, Y.; Zhou, R. A Method for Rockburst Prediction in the Deep Tunnels of Hydropower Stations Based on the Monitored Microseismicity and an Optimized Probabilistic Neural Network Model. Sustainability 2019, 11, 3212. [Google Scholar] [CrossRef] [Green Version]
- Martin, C.; Kaiser, P.; McCreath, D. Hoek-Brown parameters for predicting the depth of brittle failure around tunnels. Can. Geotech. J. 1999, 36, 136–151. [Google Scholar] [CrossRef]
- Cai, M.; Kaiser, P. Rockburst Support Reference Book—Volume I: Rockburst Phenomenon and Support Characteristics; MIRARCO- Mining Innovation: Sudbury, ON, Canada, 2018; pp. 40–47. [Google Scholar]
- Jiang, Q.; Feng, X.T.; Fan, Y.; Fan, Q.; Liu, G.; Pei, S.; Duan, S. In situ experimental investigation of basalt spalling in a large underground powerhouse cavern. Tunn. Undergr. Space Technol. 2017, 68, 82–94. [Google Scholar] [CrossRef]
- Wu, W.; Feng, X.; Zhang, C.; Qiu, S. Classification of failure modes and controlling measures for surrounding rock of deep tunnel in hard rock. Chin. J. Rock Mech. Eng. 2011, 30, 1782–1801. [Google Scholar]
- Zhou, H.; Meng, F.; Zhang, C.; Lu, J.; Xu, R. Effect of structural plane on rockburst in deep hard rock tunnels. Chin. J. Rock Mech. Eng. 2015, 34, 720–727. [Google Scholar]
- He, M.C.; Miao, J.L.; Li, D.; Wang, C.G. Experimental study on rockburst processes of granite specimen at great depth. Chin. J. Rock Mech. Eng. 2007, 26, 865–876. [Google Scholar]
- He, M.C.; Miao, J.L.; Feng, J.L. Rock burst process of limestone and its acoustic emission characteristics under true-triaxial unloading conditions. Int. J. Rock Mech. Min. Sci. 2010, 47, 286–298. [Google Scholar] [CrossRef]
- Chen, Z.Y.; Su, G.S.; Ju, J.W.; Jiang, J.Q. Experimental study on energy dissipation of fragments during rockburst. Bull. Eng. Geol. Environ. 2019, 78, 5369–5386. [Google Scholar] [CrossRef]
- Su, G.S.; Jiang, J.Q.; Feng, X.T.; Jiang, Q.; Chen, Z.Y.; Mo, J.H. Influence of loading rate on strainburst: An experimental study. Bull. Eng. Geol. Environ. 2019, 78, 3559–3573. [Google Scholar] [CrossRef]
- Zhai, S.B.; Su, G.S.; Yin, S.D.; Zhao, B.; Yan, L.B. Rockburst characteristics of several hard brittle rocks: A true triaxial experimental study. J. Rock. Mech. Geotech. 2020, 12, 279–296. [Google Scholar] [CrossRef]
- Hu, X.C.; Su, G.S.; Chen, G.Y.; Mei, S.M.; Feng, X.T.; Mei, G.X.; Huang, X.H. Experiment on rockburst process of borehole and its acoustic emission characteristics. Rock Mech. Rock Eng. 2019, 52, 783–802. [Google Scholar] [CrossRef]
- Si, X.F.; Gong, F.Q.; Luo, Y.; Li, X.B. Experimental simulation on rockburst process of deep three-dimensional circular cavern. Rock Soil Mech. 2018, 39, 621–634. [Google Scholar]
- Gong, F.Q.; Si, X.F.; Li, X.B.; Wang, S.Y. Experimental investigation of strain rockburst in circular caverns under deep three-dimensional high-stress conditions. Rock Mech. Rock Eng. 2019, 52, 1459–1474. [Google Scholar] [CrossRef]
- Liang, P.; Zhang, Y.B.; Tian, B.Z.; Yao, X.L.; Sun, L.; Liu, X.X. Experimental study on energy evolution characteristics in the process of tunnel rock burst. Chin. J. Rock Mech. Eng. 2019, 38, 736–746. [Google Scholar]
- Liu, F.; Tang, C.A.; Ma, T.H.; Tang, L.X. Characterizing rockbursts along a structural plane in a tunnel of the Hanjiang-to-Weihe river diversion project by microseismic monitoring. Rock Mech. Rock Eng. 2019, 52, 1835–1856. [Google Scholar] [CrossRef]
- Sun, S.R.; Sun, H.Y.; Wang, Y.J.; Wei, J.; Liu, J.H.; Kanungo, D.P. Effect of the combination characteristics of rock structural plane on the stability of a rock-mass slope. Bull. Eng. Geol. Environ. 2014, 73, 987–995. [Google Scholar] [CrossRef]
- Durrheim, R.J.; Roberts, M.K.C.; Haile, A.T.; Hagan, T.O.; Jager, A.J.; Handley, M.F.; Spottiswoode, S.M.; Ortlepp, W.D. Factors influencing the severity of rockburst damage in South African gold mines. J. S. Afr. Inst. Min. Met. 1998, 98, 53–57. [Google Scholar]
- Hu, L.; Feng, X.T.; Xiao, Y.X.; Wang, R.; Feng, G.L.; Yao, Z.B.; Niu, W.J.; Zhang, W. Effects of structural planes on rockburst position with respect to tunnel cross-sections: A case study involving a railway tunnel in China. Bull. Eng. Geol. Environ. 2020, 79, 1061–1081. [Google Scholar] [CrossRef]
- Zhang, C.Q.; Feng, X.T.; Zhou, H.; Qiu, S.L.; Wu, W.P. Case histories of four extremely intense rockbursts in deep tunnels. Rock Mech. Rock Eng. 2012, 45, 275–288. [Google Scholar] [CrossRef]
- Zhou, H.; Meng, F.Z.; Zhang, C.Q.; Hu, D.W.; Yang, F.J.; Lu, J.J. Analysis of rockburst mechanisms induced by structural planes in deep tunnels. Bull. Eng. Geol. Environ. 2015, 74, 1435–1451. [Google Scholar] [CrossRef]
- Zhang, C.Q.; Feng, X.T.; Zhou, H.; Qiu, S.L.; Wu, W.P. Rockmass damage development following two extremely intense rockbursts in deep tunnels at Jinping II hydropower station, southwestern China. Bull. Eng. Geol. Environ. 2013, 72, 237–247. [Google Scholar] [CrossRef]
- Manouchehrian, A.; Cai, M. Numerical modeling of rockburst near fault zones in deep tunnels. Tunn. Undergr. Space Technol. 2018, 80, 164–180. [Google Scholar] [CrossRef]
- Xu, X.L.; Wu, S.C.; Gao, Y.T.; Xu, M.F. Effects of micro-structure and micro-parameters on Brazilian tensile strength using flat-joint model. Rock Mech. Rock Eng. 2016, 49, 3575–3595. [Google Scholar] [CrossRef]
- Jing, L. A review of techniques, advances and outstanding issues in numerical modelling for rock mechanics and rock engineering. Int. J. Rock Mech. Min. Sci. 2003, 40, 283–353. [Google Scholar] [CrossRef]
- Hazzard, J.F.; Collins, D.S.; Pettitt, W.S.; Young, R.P. Simulation of Unstable Fault Slip in Granite Using a Bonded-particle Model. Pure Appl. Geophys. 2002, 159, 221–245. [Google Scholar] [CrossRef]
- Potyondy, D.O. A flat-jointed bonded-particle material for hard rock. In Proceedings of the 46th US Rock Mechanics/Geomechanics Symposium, Chicago, IL, USA, 24–27 June 2012. [Google Scholar]
- Potyondy, D.O. PFC 2D Flat Flat-Joint Contact Model; Technical Memorandum ICG7138-L; Itasca Consulting Group, Inc.: Minneapolis, MN, USA, 2012. [Google Scholar]
- Wu, S.C.; Xu, X.L. A study of three intrinsic problems of the classic discrete element method using flat-joint model. Rock Mech. Rock Eng. 2016, 49, 1813–1830. [Google Scholar] [CrossRef]
- Potyondy, D.O. The bonded-particle model as a tool for rock mechanics research and application: Current trends and future directions. Geosyst. Eng. 2015, 18, 1–28. [Google Scholar] [CrossRef]
- Wu, S.; Chen, L.; Cheng, Z. Macro and meso research on the zonal disintegration phenomenon and the mechanism of deep brittle rock mass. Eng. Fract. Mech. 2019, 211, 254–268. [Google Scholar] [CrossRef]
- Duan, K.; Kwok, C.; Pierce, M. Discrete element method modeling of inherently anisotropic rocks under uniaxial compression loading. Int. J. Numer. Anal. Methods 2016, 40, 1150–1183. [Google Scholar] [CrossRef]
- Mas Ivars, D.; Potyondy, D.O.; Pierce, M.; Cundall, P.A. The smooth-joint contact model. In Proceedings of the 8th World Congress on Computational Mechanics/5th European Congress on Computational Methanics and Applied Science and Engineering, Venice, Italy, 30 June–4 July 2008. [Google Scholar]
- Hu, W.R.; Kwok, C.; Duan, K.; Wang, T. Parametric study of the smooth-joint contact model on the mechanical behavior of jointed rock. Int. J. Numer. Anal. Methods 2018, 42, 358–376. [Google Scholar] [CrossRef]
- Zhao, J.; Feng, X.T.; Zhang, X.W.; Zhang, Y.; Zhou, Y.Y.; Yang, C.X. Brittle-ductile transition and failure mechanism of Jinping marble under true triaxial compression. Eng. Geol. 2018, 232, 160–170. [Google Scholar] [CrossRef]
- Zhao, X.J.; Chen, B.R.; Zhao, H.B.; Jie, B.H.; Ning, Z.F. Laboratory creep tests for time-dependent properties of a marble in Jinping II hydropower station. J. Rock. Mech. Geotech. 2012, 4, 168–176. [Google Scholar] [CrossRef] [Green Version]
- Zhang, C.S.; Chu, W.J.; Liu, N.; Zhu, Y.S.; Hou, J. Laboratory tests and numerical simulations of brittle marble and squeezing schist at Jinping II hydropower station, China. J. Rock. Mech. Geotech. 2011, 3, 30–38. [Google Scholar] [CrossRef] [Green Version]
- Jiang, Q.; Zhong, S.; Cui, J.; Feng, X.T.; Song, L.B. Statistical characterization of the mechanical parameters of intact rock under triaxial compression: An experimental proof of the Jinping marble. Rock Mech. Rock Eng. 2016, 49, 4631–4646. [Google Scholar] [CrossRef]
- Zheng, Z.; Feng, X.T.; Yang, C.X.; Zhang, X.W.; Li, S.J.; Qiu, S.L. Post-peak deformation and failure behaviour of Jinping marble under true triaxial stresses. Eng. Geol. 2020, 265, 105444. [Google Scholar] [CrossRef]
- Wang, B.; Zhu, J.B.; Wu, A.Q.; Hu, J.M.; Xiong, Z.M. Experimental study on mechanical properties of Jinping marble under loading and unloading stress paths. Chin. J. Rock Mech. Eng. 2008, 27, 2138–2145. [Google Scholar]
- Zhou, H.; Yang, Y.S.; Xiao, H.B.; Zhang, C.Q.; Fu, Y.P. Research on loading rate effect of tensile strength property of hard brittle marble-test characteristics and mechanism. Chin. J. Rock Mech. Eng. 2013, 32, 1868–1875. [Google Scholar]
- Feng, G.L.; Feng, X.T.; Chen, B.R.; Xiao, Y.X.; Zhao, Z.N. Effects of structural planes on the microseismicity associated with rockburst development processes in deep tunnels of the Jinping-II Hydropower Station, China. Tunn. Undergr. Space Technol. 2019, 84, 273–280. [Google Scholar] [CrossRef]
- Duan, K.; Ji, Y.L.; Xu, N.W.; Wan, Z.J.; Wu, W. Excavation-induced fault instability: Possible causes and implications for seismicity. Tunn. Undergr. Space Technol. 2019, 92, 103041. [Google Scholar] [CrossRef]
- Cao, R.H.; Yao, R.B.; Hu, T.; Wang, C.S.; Li, K.H.; Meng, J.J. Failure and mechanical behavior of transversely isotropic rock under compression-shear tests: Laboratory testing and numerical simulation. Eng. Fract. Mech. 2021, 241, 107389. [Google Scholar] [CrossRef]
- Sarfarazi, V.; Haeri, H.; Safavi, S.; Marji, M.F.; Zhu, Z.M. Interaction between two neighboring tunnel using PFC2D. Struct. Eng. Mech. 2019, 71, 77–87. [Google Scholar]
- Zhu, W.C.; Li, Z.H.; Zhu, L.; Tang, C.A. Numerical simulation on rockburst of underground opening triggered by dynamic disturbance. Tunn. Undergr. Space Technol. 2010, 25, 587–599. [Google Scholar] [CrossRef]
- Wang, S.Y.; Sloan, S.W.; Tang, C.A.; Zhu, W.C. Numerical simulation of the failure mechanism of circular tunnels in transversely isotropic rock masses. Tunn. Undergr. Space Technol. 2012, 32, 231–244. [Google Scholar] [CrossRef]
- Khademian, Z.; Ugur, O. Computational framework for simulating rock burst in shear and compression. Int. J. Rock Mech. Min. Sci. 2018, 110, 279–290. [Google Scholar] [CrossRef]
- Khademian, Z.; Ozbay, U. Modeling violent rock failures in tunneling and shaft boring based on energy balance calculations. Tunn. Undergr. Space Technol. 2019, 90, 62–75. [Google Scholar] [CrossRef]
- Haimson, B. Micromechanisms of borehole instability leading to breakouts in rocks. Int. J. Rock Mech. Min. Sci. 2007, 44, 157–173. [Google Scholar] [CrossRef]
- Liu, X.X.; Zhan, S.B.; Zhang, Y.B.; Wang, X.L.; Liang, Z.Z.; Tian, B.Z. The mechanical and fracturing of rockburst in tunnel and its acoustic emission characteristics. Shock Vib. 2018, 1–11. [Google Scholar] [CrossRef]
- Li, D.Y.; Zhu, Q.Q.; Zhou, Z.L.; Li, X.B.; Ranjith, P. Fracture analysis of marble specimens with a hole under uniaxial compression by digital image correlation. Eng. Fract. Mech. 2017, 183, 109–124. [Google Scholar] [CrossRef]
- Zhang, C.Q.; Feng, X.T.; Zhou, H.; Qiu, S.L.; Wu, W.P. A top pilot tunnel preconditioning method for the prevention of extremely intense rockbursts in deep tunnels excavated by TBMs. Rock Mech. Rock Eng. 2012, 45, 289–309. [Google Scholar] [CrossRef]
- Bahaaddini, M.; Hagan, P.; Mitra, R.; Hebblewhite, B. Parametric study of smooth joint parameters on the shear behaviour of rock joints. Rock Mech. Rock Eng. 2015, 48, 923–940. [Google Scholar] [CrossRef]
- Lambert, C.; Coll, C. Discrete modeling of rock joints with a smooth-joint contact model. J. Rock Mech. Geotech. 2014, 6, 1–12. [Google Scholar] [CrossRef] [Green Version]
- Huan, J.Y.; He, M.M.; Zhang, Z.Q.; Li, N.; Nascimbene, R. A New Method to Estimate the Joint Roughness Coefficient by Back Calculation of Shear Strength. Adv. Civ. Eng. 2019, 1–11. [Google Scholar] [CrossRef] [Green Version]
- Li, X.F.; Li, X.; Li, H.B.; Zhang, Q.B.; Zhao, J. Dynamic tensile behaviours of heterogeneous rocks: The grain scale fracturing characteristics on strength and fragmentation. Int. J. Impact Eng. 2018, 118, 98–118. [Google Scholar] [CrossRef]
- Peng, J.; Wong, L.N.Y.; Teh, C.I. Influence of grain size heterogeneity on strength and microcracking behavior of crystalline rocks. J. Geophys. Res. Solid Earth 2017, 122, 1054–1073. [Google Scholar] [CrossRef] [Green Version]
- Tang, C.A.; Liu, H.; Lee, P.K.K.; Tsui, Y.; Tham, L.G. Numerical studies of the influence of microstructure on rock failure in uniaxial compression—part I: Effect of heterogeneity. Int. J. Rock Mech. Min. Sci. 2000, 37, 555–569. [Google Scholar] [CrossRef]
- Tang, C.A. Numerical simulation of progressive rock failure and associated seismicity. Int. J. Rock Mech. Min. Sci. 1997, 34, 249–261. [Google Scholar] [CrossRef]
- Dai, S.; Gao, W.; Wang, C.; Xiao, T. Damage Evolution of Heterogeneous Rocks Under Uniaxial Compression Based on Distinct Element Method. Rock Mech. Rock Eng. 2019, 52, 2631–2647. [Google Scholar] [CrossRef]
- Wong, T.F.; Wong, R.H.; Chau, K.T.; Tang, C.A. Microcrack statistics, Weibull distribution and micromechanical modeling of compressive failure in rock. Mech. Mater. 2006, 38, 664–681. [Google Scholar] [CrossRef]
- Bahaaddini, M.; Sheikhpourkhani, A.M.; Mansouri, H. Flat-joint model to reproduce the mechanical behaviour of intact rocks. Eur. J. Environ. Civ. Eng. 2019, 1–22. [Google Scholar] [CrossRef]
- Chen, P.Y. Effects of microparameters on macroparameters of flat-jointed bonded-particle materials and suggestions on trial-and-error method. Geotech. Geol. Eng. 2017, 35, 663–677. [Google Scholar] [CrossRef]
- Fairhurst, C.; Hudson, J.A. Draft ISRM suggested method for the complete stress-strain curve for intact rock in uniaxial compression. Int. J. Rock Mech. Min. Sci. 1999, 36, 279–289. [Google Scholar]
- International Society for Rock Mechanics. Suggested methods for determining tensile strength of rock materials. Int. J. Rock Mech. Min. Sci. Geomech. Abstr. 1978, 15, 99–103. [Google Scholar] [CrossRef]
- Ding, X.B.; Zhang, L.Y.; Zhu, H.H.; Zhang, Q. Effect of model scale and particle size distribution on PFC3D simulation results. Rock Mech. Rock Eng. 2014, 47, 2139–2156. [Google Scholar] [CrossRef]
- Koyama, T.; Jing, L. Effects of model scale and particle size on micro-mechanical properties and failure processes of rocks—A particle mechanics approach. Eng. Anal. Bound. Elem. 2007, 31, 458–472. [Google Scholar] [CrossRef]
Figure 1.
A typical schematic diagram for a 2D flat-joint contact.

Figure 2.
Generated numerical models: (a) before stress is applied, (b) at initial geostress state, (c) after excavation.
Figure 2.
Generated numerical models: (a) before stress is applied, (b) at initial geostress state, (c) after excavation.

Figure 3.
Micro-cracking patterns at corresponding steps.


Figure 4.
Force chain diagrams at corresponding steps.


Figure 5.
Schematic diagram of damage range for the simulation result (a) and the analytical result (b).
Figure 5.
Schematic diagram of damage range for the simulation result (a) and the analytical result (b).

Figure 6.
Micro-cracking patterns at corresponding steps.


Figure 7.
V-shaped failure at PFC numerical result in this study.

Figure 8.
Slip displacement on the structure plane. (a) Arrangement of measuring points along the structure plane; (b) measuring results.
Figure 8.
Slip displacement on the structure plane. (a) Arrangement of measuring points along the structure plane; (b) measuring results.

Figure 9.
Force vector plots for strainburst (a) and structure-type rockburst (b) at 2000 steps.

Figure 10.
Micro-cracking patterns of numerical models with different friction coefficients.

Figure 11.
Number of generated cracks for numerical models with different friction coefficients.

Figure 12.
Dissipated energy (a) and radiated energy (b) in models with different friction coefficients after excavation.
Figure 12.
Dissipated energy (a) and radiated energy (b) in models with different friction coefficients after excavation.

Figure 13.
Probability density curves with different m values.

Figure 14.
Micro-cracking patterns in models with different m values for cohesion.

Figure 15.
Number of cracks in models with different m values for cohesion.

Figure 16.
Shear cracks to total cracks ratio.

Figure 17.
Dissipated energy (a) and radiated energy (b) in models for different m values of cohesion heterogeneity.
Figure 17.
Dissipated energy (a) and radiated energy (b) in models for different m values of cohesion heterogeneity.

Figure 18.
Micro-cracking patterns in models with different m values for effective modulus.

Figure 19.
Number of cracks in models with different m values for effective modulus.

Figure 20.
Dissipated energy (a) and radiated energy (b) in models for different m values of modulus heterogeneity.
Figure 20.
Dissipated energy (a) and radiated energy (b) in models for different m values of modulus heterogeneity.

Figure 21.
Crack number (a) and normalized radiated energy (b) of the two micro-parameters under different homogeneity levels.
Figure 21.
Crack number (a) and normalized radiated energy (b) of the two micro-parameters under different homogeneity levels.

Figure 22.
Micro-cracking patterns in models with different coefficients of lateral pressure.


Figure 23.
Dissipated energy (a) and radiated energy (b) in models for different lateral pressure coefficient after excavation.
Figure 23.
Dissipated energy (a) and radiated energy (b) in models for different lateral pressure coefficient after excavation.

Figure 24.
Micro-cracking patterns in models with different structural plane lengths.


Table 1.
Laboratory test results and simulation results.
| Category | UCS (MPa) | TS (MPa) | Poisson’s Ratio | Elastic Modulus (GPa) |
|---|---|---|---|---|
| Laboratory test | 114.2 | 6.5 | 0.26 | 42.8 |
| FJM results | 113.6 | 5.4 | 0.26 | 43.4 |
Table 2.
Micro-parameters in flat-joint model.
| Micro-Parameters | Value |
|---|---|
| Installation gap ratio, gratio | 0.3 |
| Bonded element fraction, | 0.9 |
| Slit element friction, | 0.1 |
| Contact elements, N | 2 |
| Effective modulus of both particle and bond, (MPa) | 35 |
| Ratio of normal to shear stiffness of particle and bond (GPa) | 1.5 |
| Bond tensile strength, (MPa) | 8.7 |
| Bond cohesion strength, (MPa) | 50.5 |
Table 3.
Micro-parameters in smooth-joint model.
| 5 | 5 | 0.7 | 0 | 0 | 0 |
Publisher’s Note: MDPI stays neutral with regard to jurisdictional claims in published maps and institutional affiliations. |
© 2021 by the authors. Licensee MDPI, Basel, Switzerland. This article is an open access article distributed under the terms and conditions of the Creative Commons Attribution (CC BY) license (https://creativecommons.org/licenses/by/4.0/).
Share and Cite
MDPI and ACS Style
Zhang, C.; Li, D.; Wu, S.; Chen, L.; Peng, J. Study on Evolution Mechanism of Structure-Type Rockburst: Insights from Discrete Element Modeling. Sustainability 2021, 13, 8036. https://doi.org/10.3390/su13148036
AMA Style
Zhang C, Li D, Wu S, Chen L, Peng J. Study on Evolution Mechanism of Structure-Type Rockburst: Insights from Discrete Element Modeling. Sustainability. 2021; 13(14):8036. https://doi.org/10.3390/su13148036
Chicago/Turabian StyleZhang, Chenxi, Diyuan Li, Shunchuan Wu, Long Chen, and Jun Peng. 2021. "Study on Evolution Mechanism of Structure-Type Rockburst: Insights from Discrete Element Modeling" Sustainability 13, no. 14: 8036. https://doi.org/10.3390/su13148036
Note that from the first issue of 2016, this journal uses article numbers instead of page numbers. See further details here.