Article

A Multicriteria Evaluation of Sustainable Riparian Revegetation with Local Fruit Trees around a Reservoir of a Hydroelectric Power Plant in Central Brazil

by
José Roberto Ribas
1,*,
Jorge Santos Ribas
2,
Andrés Suárez García
3,
Elena Arce Fariña
4,
David González Peña
5 and
Ana García Rodríguez
5
1
Department of Industrial Engineering, Universidade Federal do Rio de Janeiro, Rio de Janeiro 21941-485, Brazil
2
Agricultural and Livestock Defense Agency of the State of Paraná, Cabral 80035-050, Brazil
3
University Defense Center, Spanish Naval School, 36920 Marín, Spain
4
Research Group Cybernetics Science and Technology (CTC), Department of Industrial Engineering, University of A Coruña, 15405 Ferrol, Spain
5
Research Group Solar and Wind Feasibility Technologies (SWIFT), Electromechanical Engineering Department, Universidad de Burgos, 09006 Burgos, Spain
*
Author to whom correspondence should be addressed.
Sustainability 2021, 13(14), 7849; https://doi.org/10.3390/su13147849
Submission received: 4 June 2021 / Revised: 30 June 2021 / Accepted: 9 July 2021 / Published: 14 July 2021

Abstract

:
The construction of hydropower plants often requires the flooding of large land areas, causing considerable alterations in the natural environment. In the region surrounding the reservoir of the Corumbá IV hydroelectric plant, located in the Cerrado region of Central Brazil, two types of soil predominate, classified as Dystroferric Red Latosol and Dystroferric Haplic Cambisol. The plant owners have to restore the degraded biome after the flooding of the margins caused by the filling of the reservoir. An experiment was carried out with fifteen native species, selected for having ideal phytosociological properties. Nine of them showed a survivability considered satisfactory in a planting situation, with a view to large-scale planting. Assuming that the planting of native fruit trees can be a quick solution to the attraction and preservation of wildlife, it would therefore provide sustainable riparian revegetation around the reservoir. We adopted the SIMOS technique to rank the criteria based on four morphological features and a Fuzzy AHP model to rank the contributions of the nine fruit tree species to the sustainable restoration of part of the riparian vegetation cover around the reservoir. In practical terms, we concluded that the soil types did not have any influence on tree survival after two years of growth, but the native trees’ morphological features varied among the species. These findings simplify the large-scale planting of seedlings that must be carried out by the operator in the riparian forest around the reservoir.

1. Introduction

A hydropower plant provides clean and renewable energy, controls floods, and offers the most efficient and flexible means of storing large amounts of energy, with instant response to changes in electricity demand [1,2]. On the other hand, it modifies rivers and their ecosystems by fragmenting channels, changing river flows, and transforming watersheds. Perverse effects provoked by artificial reservoirs can be seen through the increase in the riverine population, water pollution by untreated sewage, deforestation, and water withdrawals for irrigation and municipal water supply [3,4,5,6,7,8]. The outcome is the disintegration of aquatic and terrestrial ecosystems. Among many upstream impacts, the water impoundment destroys the vegetation in and around the reservoir area, causes habitat fragmentation, and blocks the natural flow of nutrients [9]. Moreover, the flooding and transformed regime during all stages of the project increase the concentration of pollutants and remove habitats for terrestrial wildlife [10]. Reforestation by planting trees in cleared sites bordering a reservoir, where the existing vegetation is in most cases restricted to pasture, is an important means to restore tree cover, although it is not a straightforward process [11]. The sustainability of reforestation projects [12,13,14], competition for land with farming and livestock grazing [15,16], and biodiversity [17] may affect the ability to attract wildlife and improve environmental quality.
After forest conversion to human land uses, there are four different modes of reforestation: (a) spontaneous natural regeneration, (b) assisted natural regeneration, (c) agroforestry, and (d) commercial tree planting [18]. Previous research on native seedlings for restoration of degraded environments was carried out in different contexts, mainly because of the wide diversity of biomes affected by the various stages of degradation worldwide. Among other issues, researchers have studied the growth, yield, and economic viability of different tree species [19,20,21], the influence of pedological factors [22,23], climatic factors [24], and the impact of biotic factors on water resources and other water-related issues [25,26], as well as the search for sustainable solutions to social and economic demands [27]. Seedlings of native species have been recommended because of their better resistance against local pests and adaptability to the climate and pedological conditions of the region [28,29,30]. Grossnickle and MacDonald [31] identified the attributes that are used to assess the quality of seedlings and how this is used in forest restoration programs; Bojórquez-Tapia et al. [32] used an integrated approach with GIS and MCDA to identify main land degradation drivers in a study area, and Holl and Brancalion [33] recommended community involvement and an adequate time scale for maintenance and monitoring to achieve the potential benefits of increasing tree cover.
Research aimed at the conservation and sustainability of nature using multiple criteria decision analysis (MCDA) has been classified into forest management and restoration; conservation prioritization and planning; protected area planning and management; and mapping of biodiversity according to wilderness and naturalness [34]. Regarding forest management and restoration, Martin et al. [35] assessed economic-environmental tradeoffs related to restoration strategies; Forsyth et al. [36] considered alternative water catchments; Harrison and Qureshi [37] calculated the preference weights of environmental, social, and economic objectives in ranking riparian revegetation options; and Aguirre-Salado et al. [38] adopted the Universal Soil Loss Equation and MCDA to identify physically degraded sites in need of feasible ecosystem restoration.
The Brazilian Cerrado is a tropical savanna biome consisting of different types of vegetation and physiognomies: (a) cerradão, an almost closed woodland with crown cover of 50% to 90%, made up of tall trees, typically found in most riparian forest formations along the banks of medium and large rivers; (b) cerrado sensu strictu, with more than 30% crown cover, having formations of shrubs and 3–8 m tall trees with twisted branches; (c) campo sujo (“dirty field”), with scattered shrubs and small trees and a large proportion of grasslands; and (d) campo limpo (“clean field”), consisting only of dry grasslands, without shrubs or trees [39]. The soil and climate characteristics of the Brazilian Cerrado biome are peculiar, marked by a high variety of soils and rainfall seasonality, with extremes. The wet season is concentrated between October and March, with annual average rainfall of 800 to 2000 mm. During the dry season, July and August have almost no rain and the relative air humidity reaches 10%. The temperature ranges from 18 °C to 28 °C. The climate is classified as Aw, or Equatorial Savannah, according to the Köppen system, with dry winter [40].
The Brazilian Forest Code determines that some areas, because of their importance to preserving the environment and water resources, are considered areas of permanent preservation, such as areas adjacent to rivers or natural or artificial reservoirs, springs, hilltops, and hillside properties with inclinations steeper than 45°. Artificial water reservoirs for energy generation or water supply must have permanent preservation areas located 100 m wide along their banks, measured from the limit determined by the maximum water level in the reservoir. Suppression of vegetation in these areas can only occur in cases of public need or social interest, provided it is previously authorized by the proper environmental agencies. This measure created a riparian line of native trees along both borders of the majority of the Brazilian Cerrado rivers, but part of the remaining area was deforested. This biome is the second most important agricultural biome in Brazil, covering almost 200 million hectares. Half of this area has been replaced by cropland and pasture [41]. The biodiversity of the Brazilian Cerrado is high, with about 7000 species of plants, 199 species of mammals, and 837 species of birds, among others. The substitution of forest by crops is increasingly threatening this biodiversity [42]. To mitigate this problem when infrastructure projects such as hydropower plants are built, reforestation projects are required to mitigate the impacts on ecosystems. However, approximately 200–300 species per hectare are replaced by only a few species that show fast growth and high survival rate, such as eucalyptus, with negative consequences to the local fauna, endangering animal species [43]. In the study reported here, we analyzed the contribution of nine species of fruit trees of native to the Brazilian Cerrado biome in terms of their morphological features for revegetation around the reservoir of a hydroelectric plant, aiming at large-scale planting to restore the local biome.

2. Materials and Methods

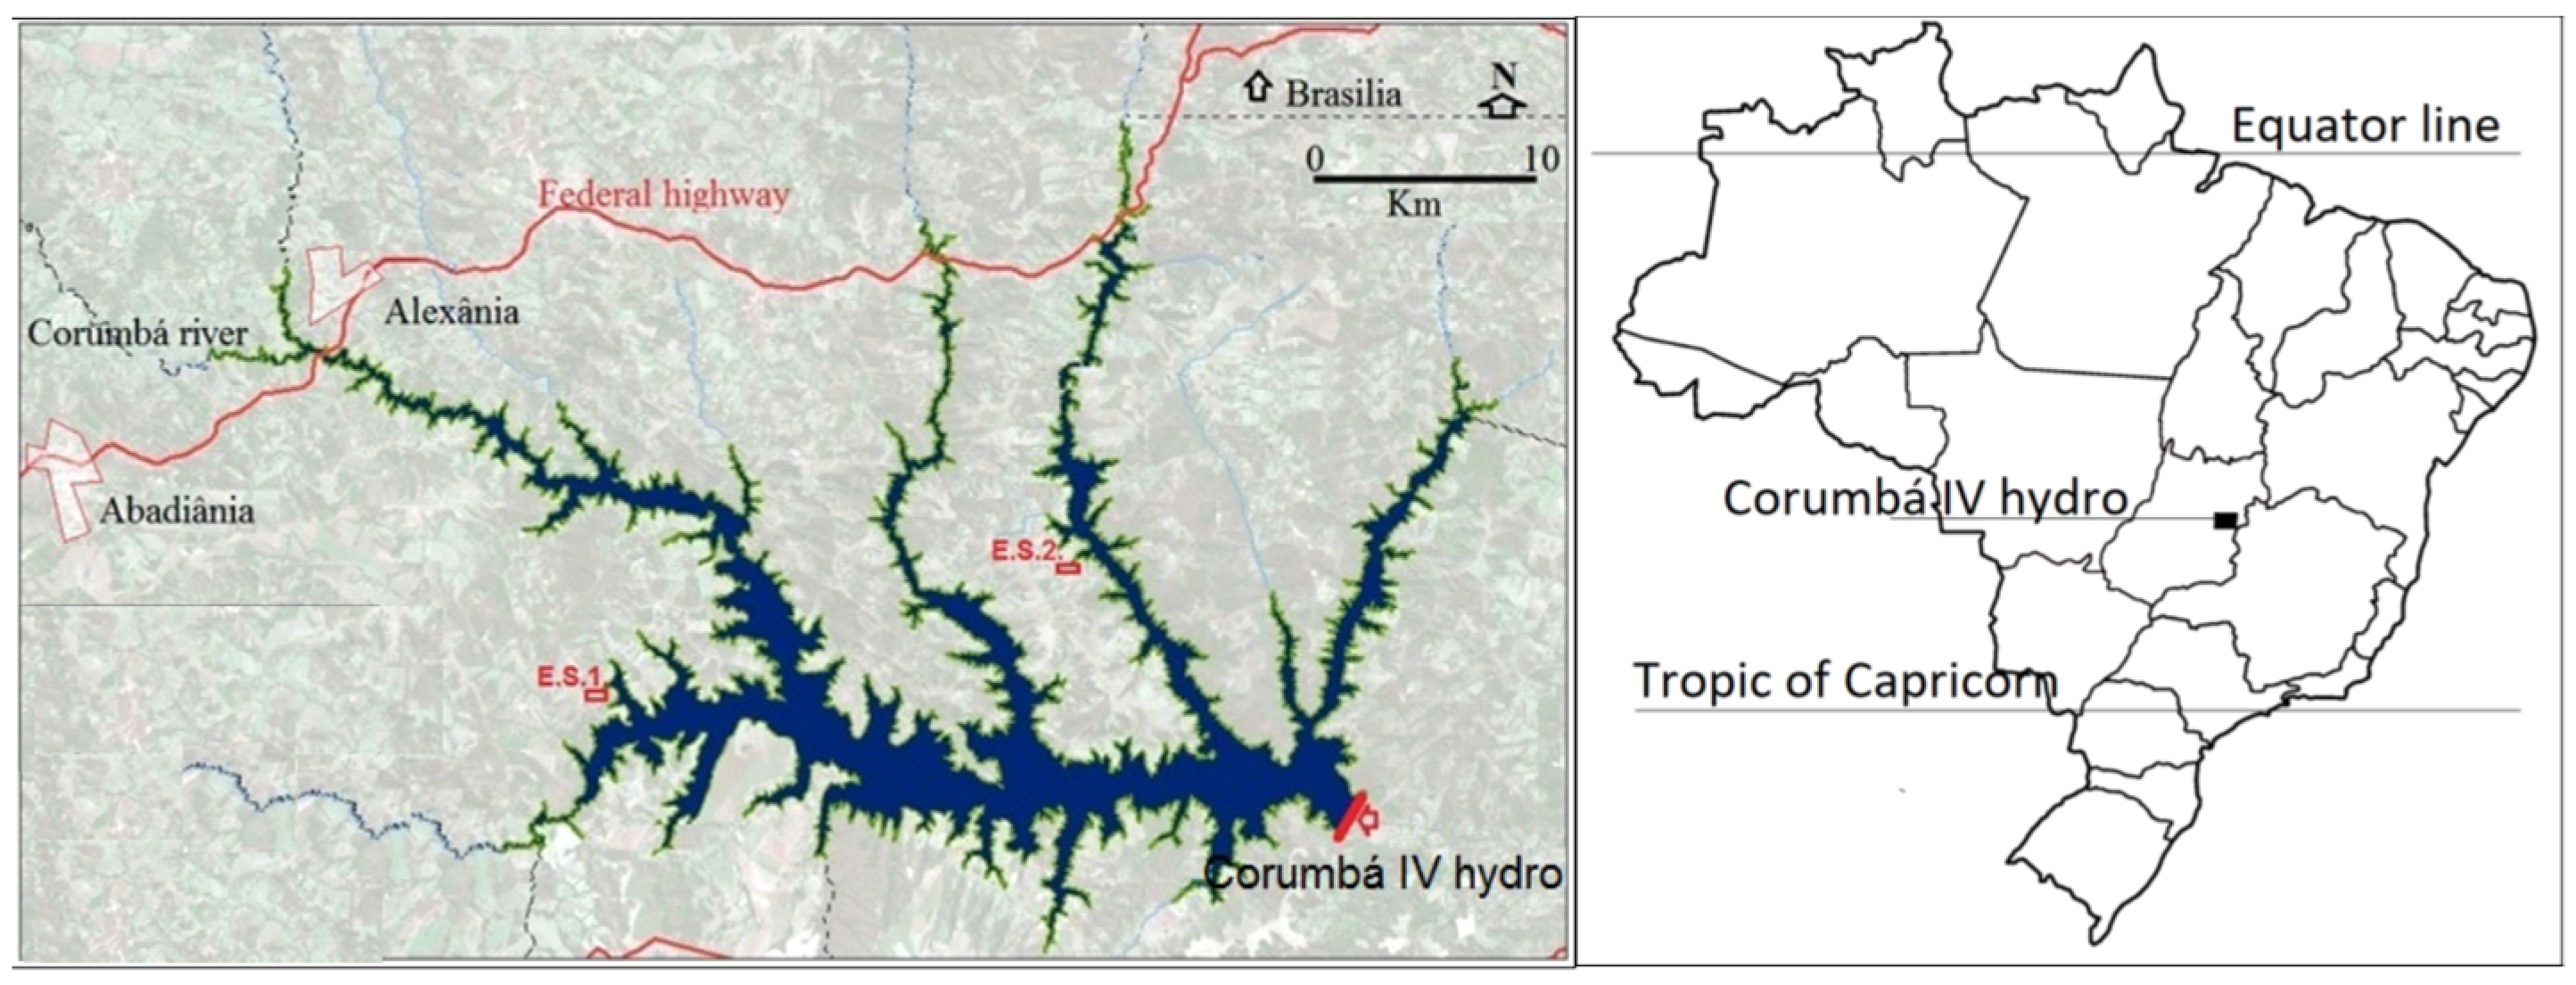
The reservoir area of the Corumbá IV power plant, located in the Central region of Brazil, is delimited by the border between a permanent preservation area and the neighboring properties. It was formed by the impoundment of the Corumbá River, which flooded an extensive native riparian forest area and required rerouting the main highway in the area. The water partially or totally flooded the bordering properties. It forced some rural inhabitants to move to urban areas and transformed the surrounding landscape of the municipalities directly affected by the reservoir, among them Abadiânia and Alexânia (Figure 1). The municipality is the local administrative unit in Brazil. It is akin to a county, except that government is by a single mayor and municipal council. Municipalities range from lightly populated rural ones with one or two small towns to heavily populated urban ones that are part of greater metropolitan regions. During the construction period of the Corumbá IV power plant reservoir, illegal charcoal makers and cattle breeders extracted the vegetation in the region, eliminating virtually all its wildlife. The riparian forest disappeared and most of the vegetation remaining around the reservoir’s borders was pasture, mainly consisting of Brachiaria sp. grass. Moreover, different forms of illegal fishing combined with wastewater discharge have decimated the fish population [44].
The state of Goias, where the reservoir is located, is characterized by public policies strongly oriented to agricultural production and livestock breeding. The inexistence of soil conservation techniques and the removal of gallery forests have contributed to the disappearance of entire species native to the Brazilian Cerrado. The few initiatives to restore the forests have been limited to the planting of high-performance exotic trees. Reforestation with exotic tree species in Brazil is mainly with species of Eucalyptus and Pinus, widely used in South America [45,46,47]. Although they have fair resistance against environmental threats, insects, and microorganisms and provide satisfactory forest yield, they do not add value to ecosystems, mainly because they upset the balance between flora and fauna, favorably biased to the exotic trees [48]. First developed in Queensland, Australia [49], the framework species method involves the planting of indigenous trees that attract wild animals, which in turn are responsible for seed dispersion and germination, rapidly reestablishing the forest structure and revitalizing the ecosystem [20].
The experimental sites are identified as ES-1 and ES-2 (Figure 1), both located on the margins of the reservoir of the Corumbá IV hydroelectric power plant, located in central Brazil. They were in an advanced state of degradation caused by native tree deforestation, partial reforestation with exotic species like Eucalyptus, livestock grazing, and reservoir pollution due to indiscriminate discharge of untreated wastewater. The heterogeneity of soil between these sites was the primary factor for their choice among several location alternatives. The predominant types of soil in the study area are Dystroferric Red Latosol and Dystroferric Haplic Cambisol. Table 1 shows the granulometric and chemical compositions for the soils of the two experimental sites. The soil samples were analyzed for pH (0.01 M CaCl2; 1:5 soil: solution), Al, Mg, K, P, Fe, and C according to procedures recommended by Silva [50]. The Ca2+, Mg2+ and Al3+ were extracted using 1 mol L−1 KCl solution (Al3+ by tritation with 0.2 mol L−1 NAOH; Ca2+ and Mg2+ by atomic absortium spectrophotometry); and available K, P, and Fe were extracted with Mehlich-I. Concentration of K+ was determined by flame spectrophotometry, P was determined by calorimetry using an UV-Vis spectrometer, and Fe was determined by atomic absortium spectrophotometry. The (H + Al) was extracted by calcium acetate pH 7.0 and determined by titration with 0.2 mol L−1 NAOH. Organic carbon was determined by Walkley-Black (Na2Cr7O7 + H2SO4). Sum of base (SOB = Ca + Mg + K) and CEC ph 7.0 (CEC pH 7.0 = Ca + Mg + K + (H + Al)) were also determined. Organic matter was calculated considering the C content of 58%. Four samples were extracted, and the averages of the compositions were calculated for ES-1 and ES-2 sites. The granulometric composition is the determining factor for their differentiation, as they have relatively higher proportions of sand and silt, respectively. These soils are acidic with a pH approximately equal to 5 and have a low level of nutrients such as phosphorus, calcium, and sodium. The soil organic carbon (SOC), a critical indicator of soil health because it reflects the level of soil functionality associated with soil structure, hydraulic properties, and microbial activity, has a composition level considered medium, in both types of soils [51]. The sum of bases (SB) of the soil represents the sum of the exchangeable cation contents (SB = Ca2+ + Mg2+ + K+), except for H+ and Al3+. Base saturation (V%) is an excellent indicator of the general conditions of soil fertility, being used even as a complement in soil nomenclature. Both soils at ES-1 and ES-2 sites are considered dystrophic, or poorly fertile, as they present V% less than 50%, in this case 20% and 18%, respectively. A low V% index means that there are small amounts of cations, such as Ca2+, Mg2+, and K+, saturating the negative charges of the colloids and that most of them are being neutralized by H+ and Al3+. These dystrophic soils are poor in Ca2+, Mg2+, and K+ and have a very high exchangeable aluminum content, with aluminum saturation (Al sat%) above 50%. They have also a high content of iron and aluminum, which cause clogging of particles and a reduction in soil permeability. High levels of iron prevent the fixation of phosphorus in the particles, whose content is poor in these soils, hindering root absorption and the energy source of adenosine triphosphate (ATP), essential for photosynthesis, cell division, and growth. Excess aluminum, in turn, hinders the regular absorption of water and nutrients by the deeper roots, causing superficial rooting and limiting the growth of trees [39]. The aluminum saturation of 61% and 62% for ES-1 and ES-2, respectively, confirms the high toxicity of both soils.
The accessibility of the sites and the commitment of the farmer to performing daily inspection were taken into consideration as well [52]. Experimental site ES-1 has a total area of 9379 m2, which includes the firebreak perimeter and the access road. Its geographic coordinates for one vertex are S: 16°16′51.6″ and WO: 48°29′7.8″, and for the opposite vertex are S: 16°16′55.0″ and WO: 48°29′4.4″. The soil classification is Dystroferric Red Latosol, here called Latosol, rich in iron, with a clayey structure [53]. Experimental site ES-2 has a total area of 9655 m2, with firebreak and access road. Its geographic coordinates for one vertex are south: 16°12′55.7″ and west: 48°18′22.2″, and for the opposite vertex are S: 16°13′1.4″ and WO: 48°18′20.2″. The soil classification is Dystroferric Hapli Cambisol, here briefly called by Cambisol, with a light sandy loam structure [53].

2.1. Sampling Procedure

A phytosociological analysis considering the possible adaptation to the two types of soil initially identified 15 native fruit tree species as being viable [54]. All these fruits are juicy and sweet and make up part of the basic diet of many native species of birds and mammals. The protection of the two experimental sites against animal and human invasions was achieved with fences of barbed wire supported by autoclaved eucalyptus stakes erected along their perimeters. In order to evaluate the plants’ ability to survive in the presence of Brachiaria sp., the grass was not removed, and the seedlings were planted in holes spaced three meters apart [55]. Finally, three organic elements were added: fertilizer made from chicken excrement, a compound of aquatic macrophytes applied on the crown of the plants, and a pesticide against ants. The fertilizer is plentiful and available without charge from local poultry farms and the aquatic macrophytes were harvested directly from the reservoir. A total of 1942 seedlings of the 15 species were planted in a randomized block design in the experimental sites ES-1 and ES-2, but since six species were excluded from the study, the remaining number of seedlings planted was reduced to 1248. However, two years after the seedlings were planted, six species were unable to adapt to the aggressive conditions of the soil and competition with Brachiaria sp. grass, having an average survival rate of only 8.6%, significantly different from the remaining group of nine species, with an average survival rate of 56% (p-value < 0.001). The nine species selected for the present study are listed in Table 2. The binomial name and the Brazilian common name of the six species not considered in the present study are: Cheiloclinium cognatum (Bacupari da Mata), Anacardium humile St.Hilaire (Cajuí), Eugenia dysenterica (Cagaita), Brosimum gaudichaudii Tréc (Mama Cadela), Hancornia speciosa Gomes (Mangaba) and Caryocar brasiliense Cambess (Pequi).
The first measurements were carried out two years after planting. The researchers responsible for site inspection, measurement, and reporting were a forest engineer, an agriculture technician, and one of the authors. The inspections were performed in sunny and dry weather. The dry season from May to September is particularly severe in Central Brazil. On the other hand, the wet season in the summer receives almost 50 times more than the average precipitation [56]. Although the planting in both experimental sites was done in the beginning of the wet season, the hot weather and intense rainstorms influenced the survival capacity of some species. Moreover, the presence of Brachiaria sp. grass covering the entire experimental sites posed additional challenges to the seedlings. This exotic African grass was introduced by farmers in the Brazilian Cerrado for pasture. Due to its high dispersion capacity for vegetative seedling reproduction, fast reproductive cycle, high photosynthesis efficiency for nutrient usage, fast growth, resistance against livestock trampling, and fire tolerance, this grass has been a successful invader of natural ecosystems [57]. The competition between native plants and exotic grasses for soil nutrition resources changes the vegetation morphology. It also reduces the quantity and changes the composition of nutrients available for plant consumption, increasing plant vulnerability [58,59].

2.2. Data Analysis

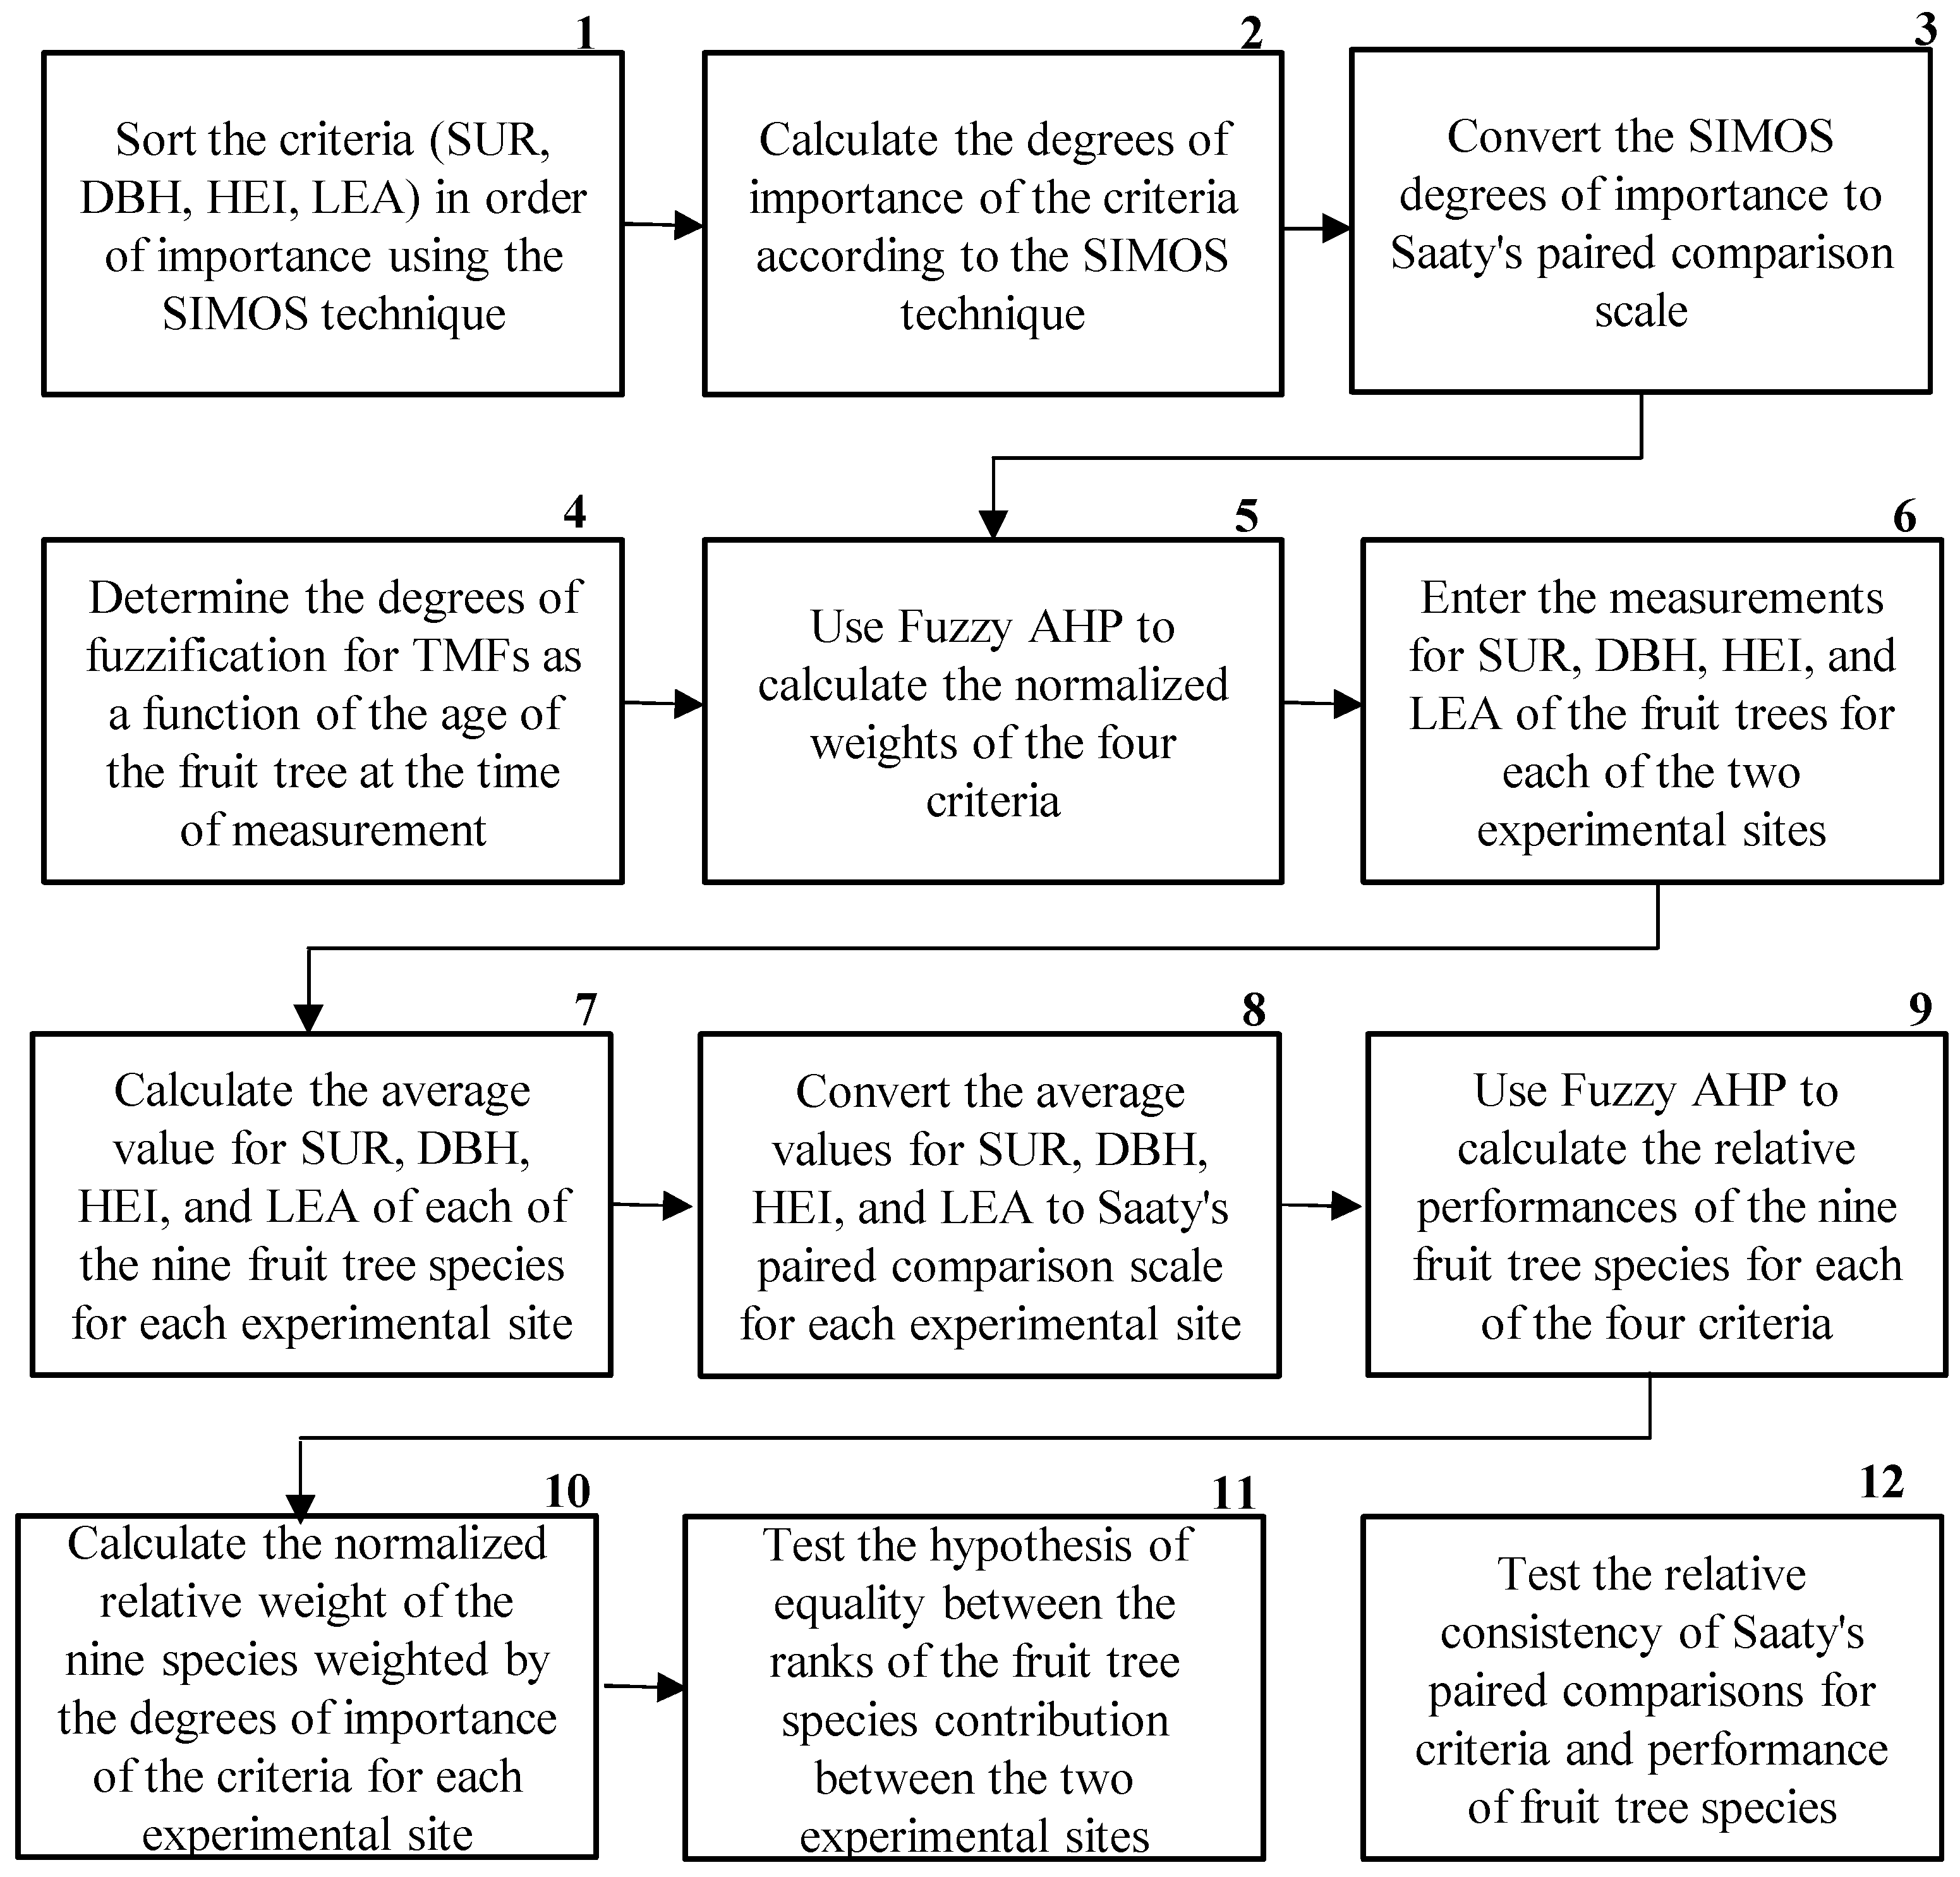
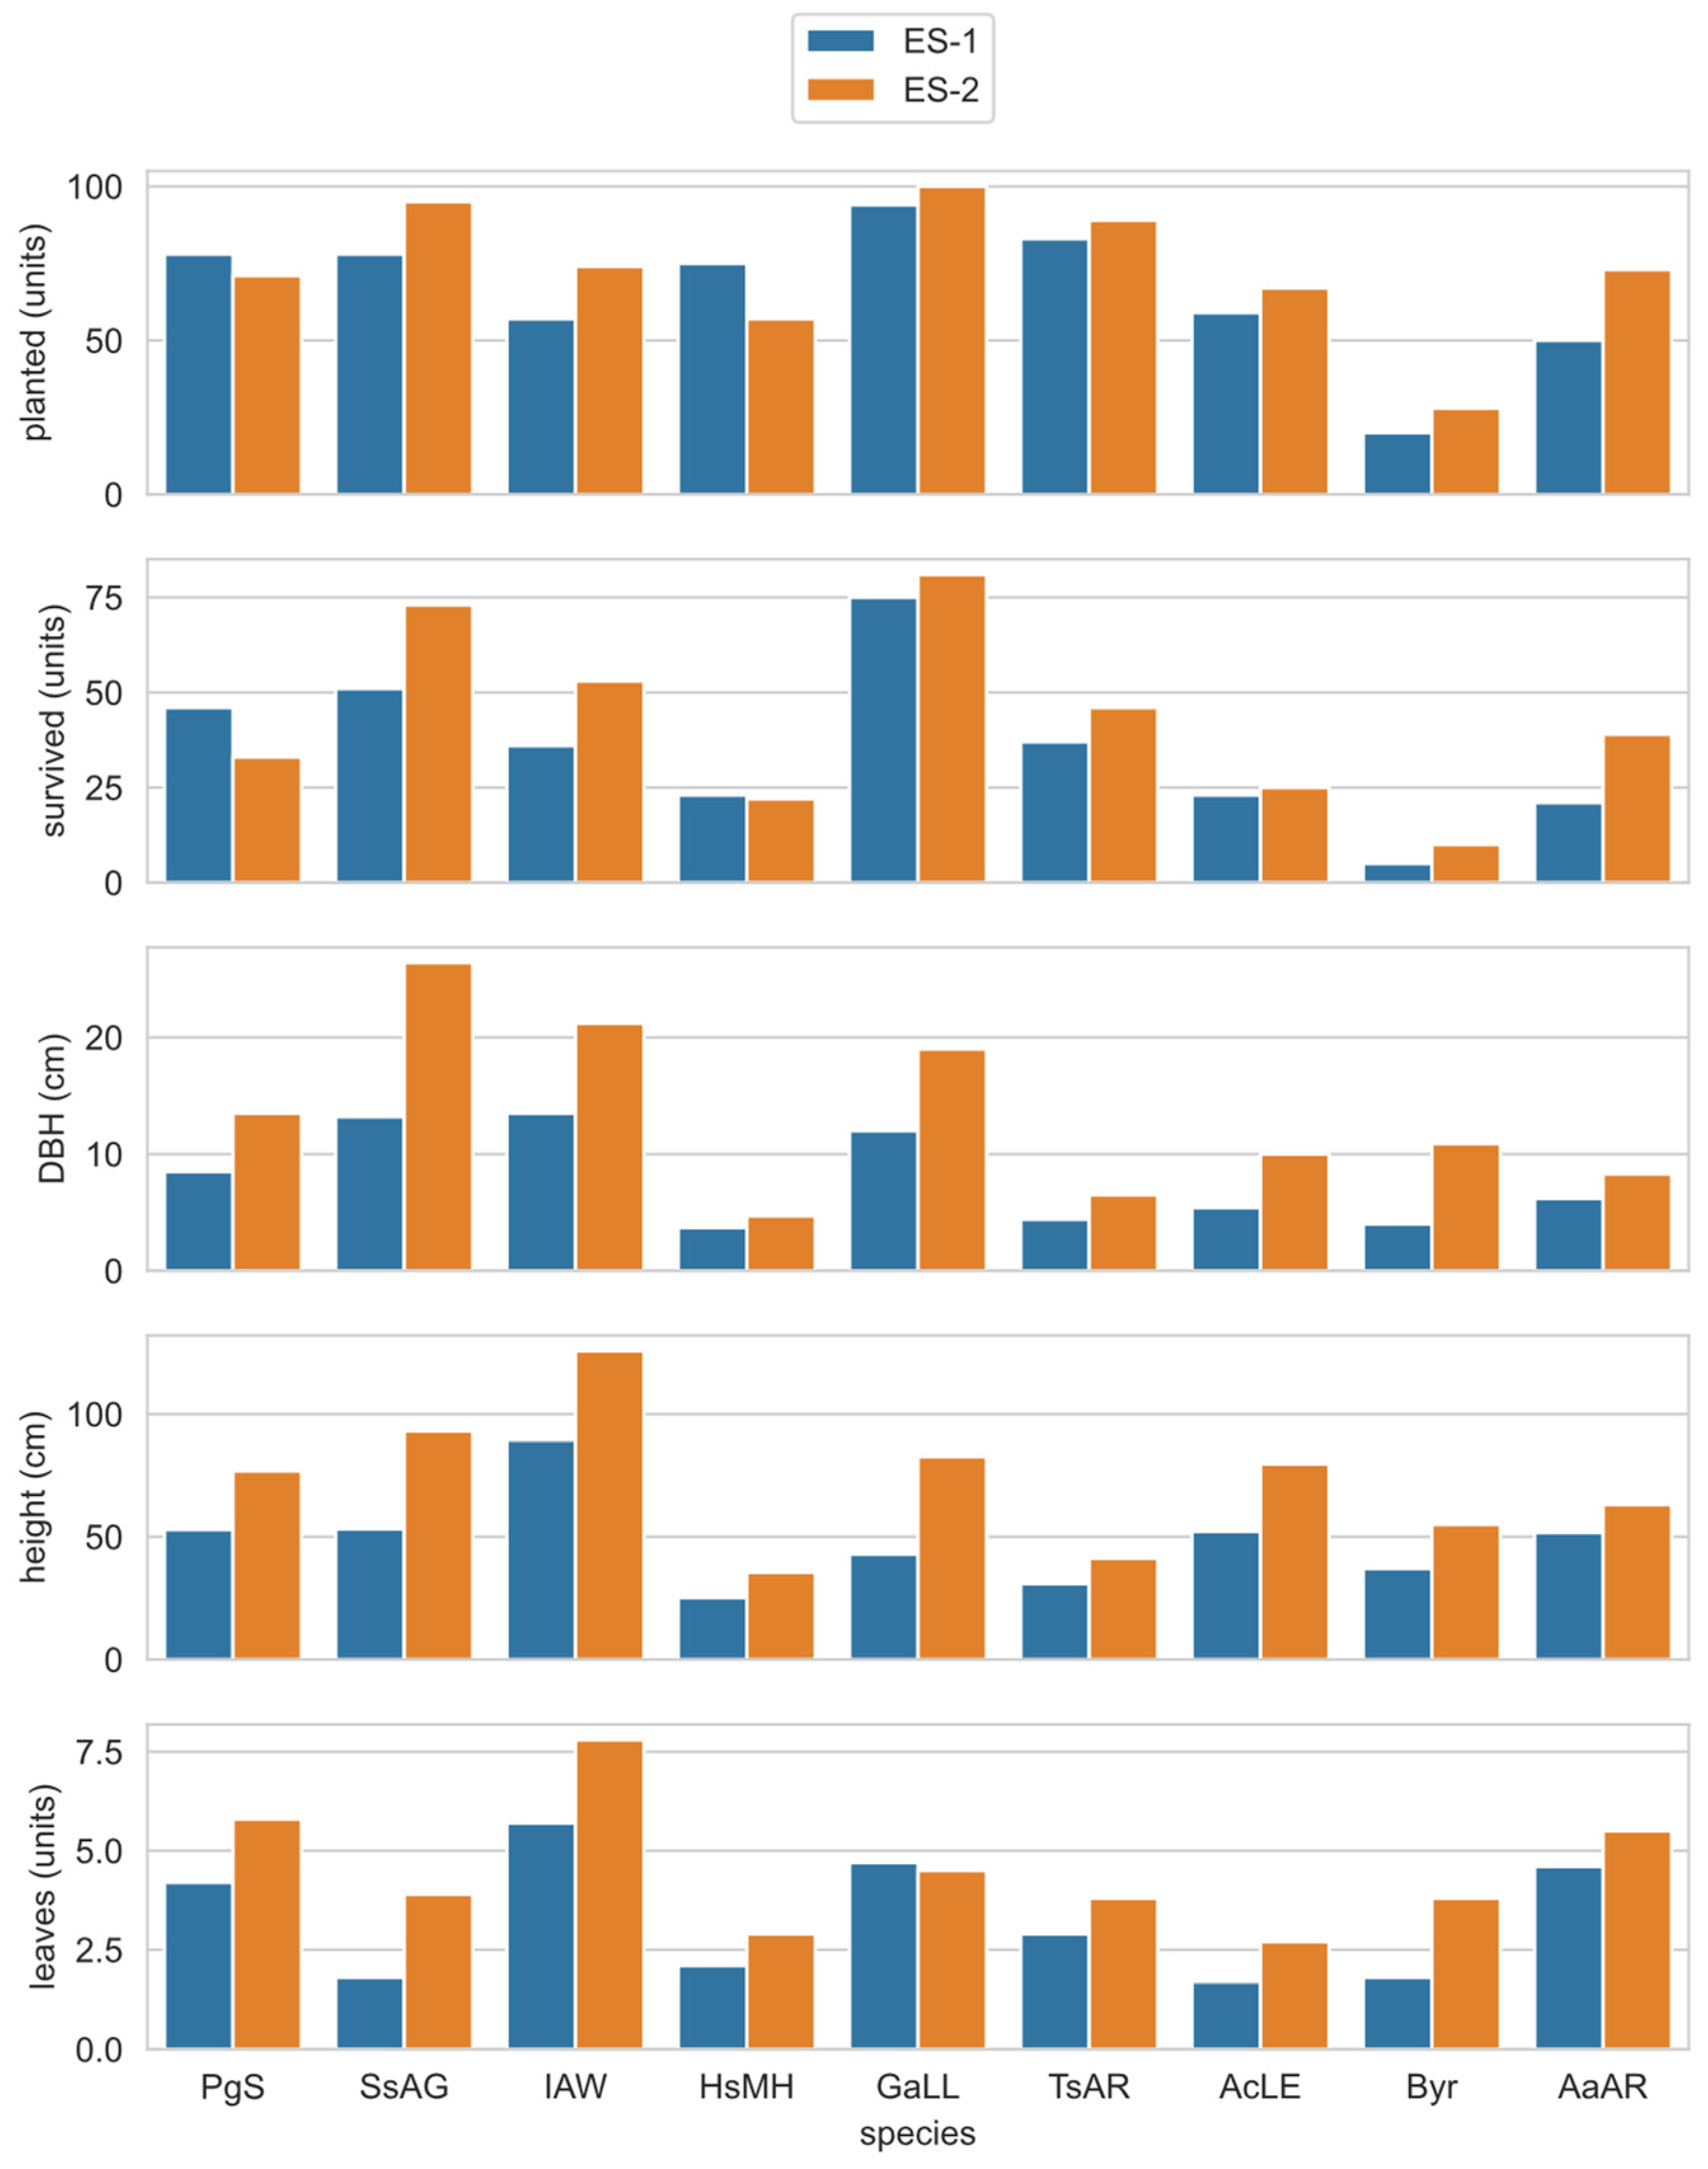
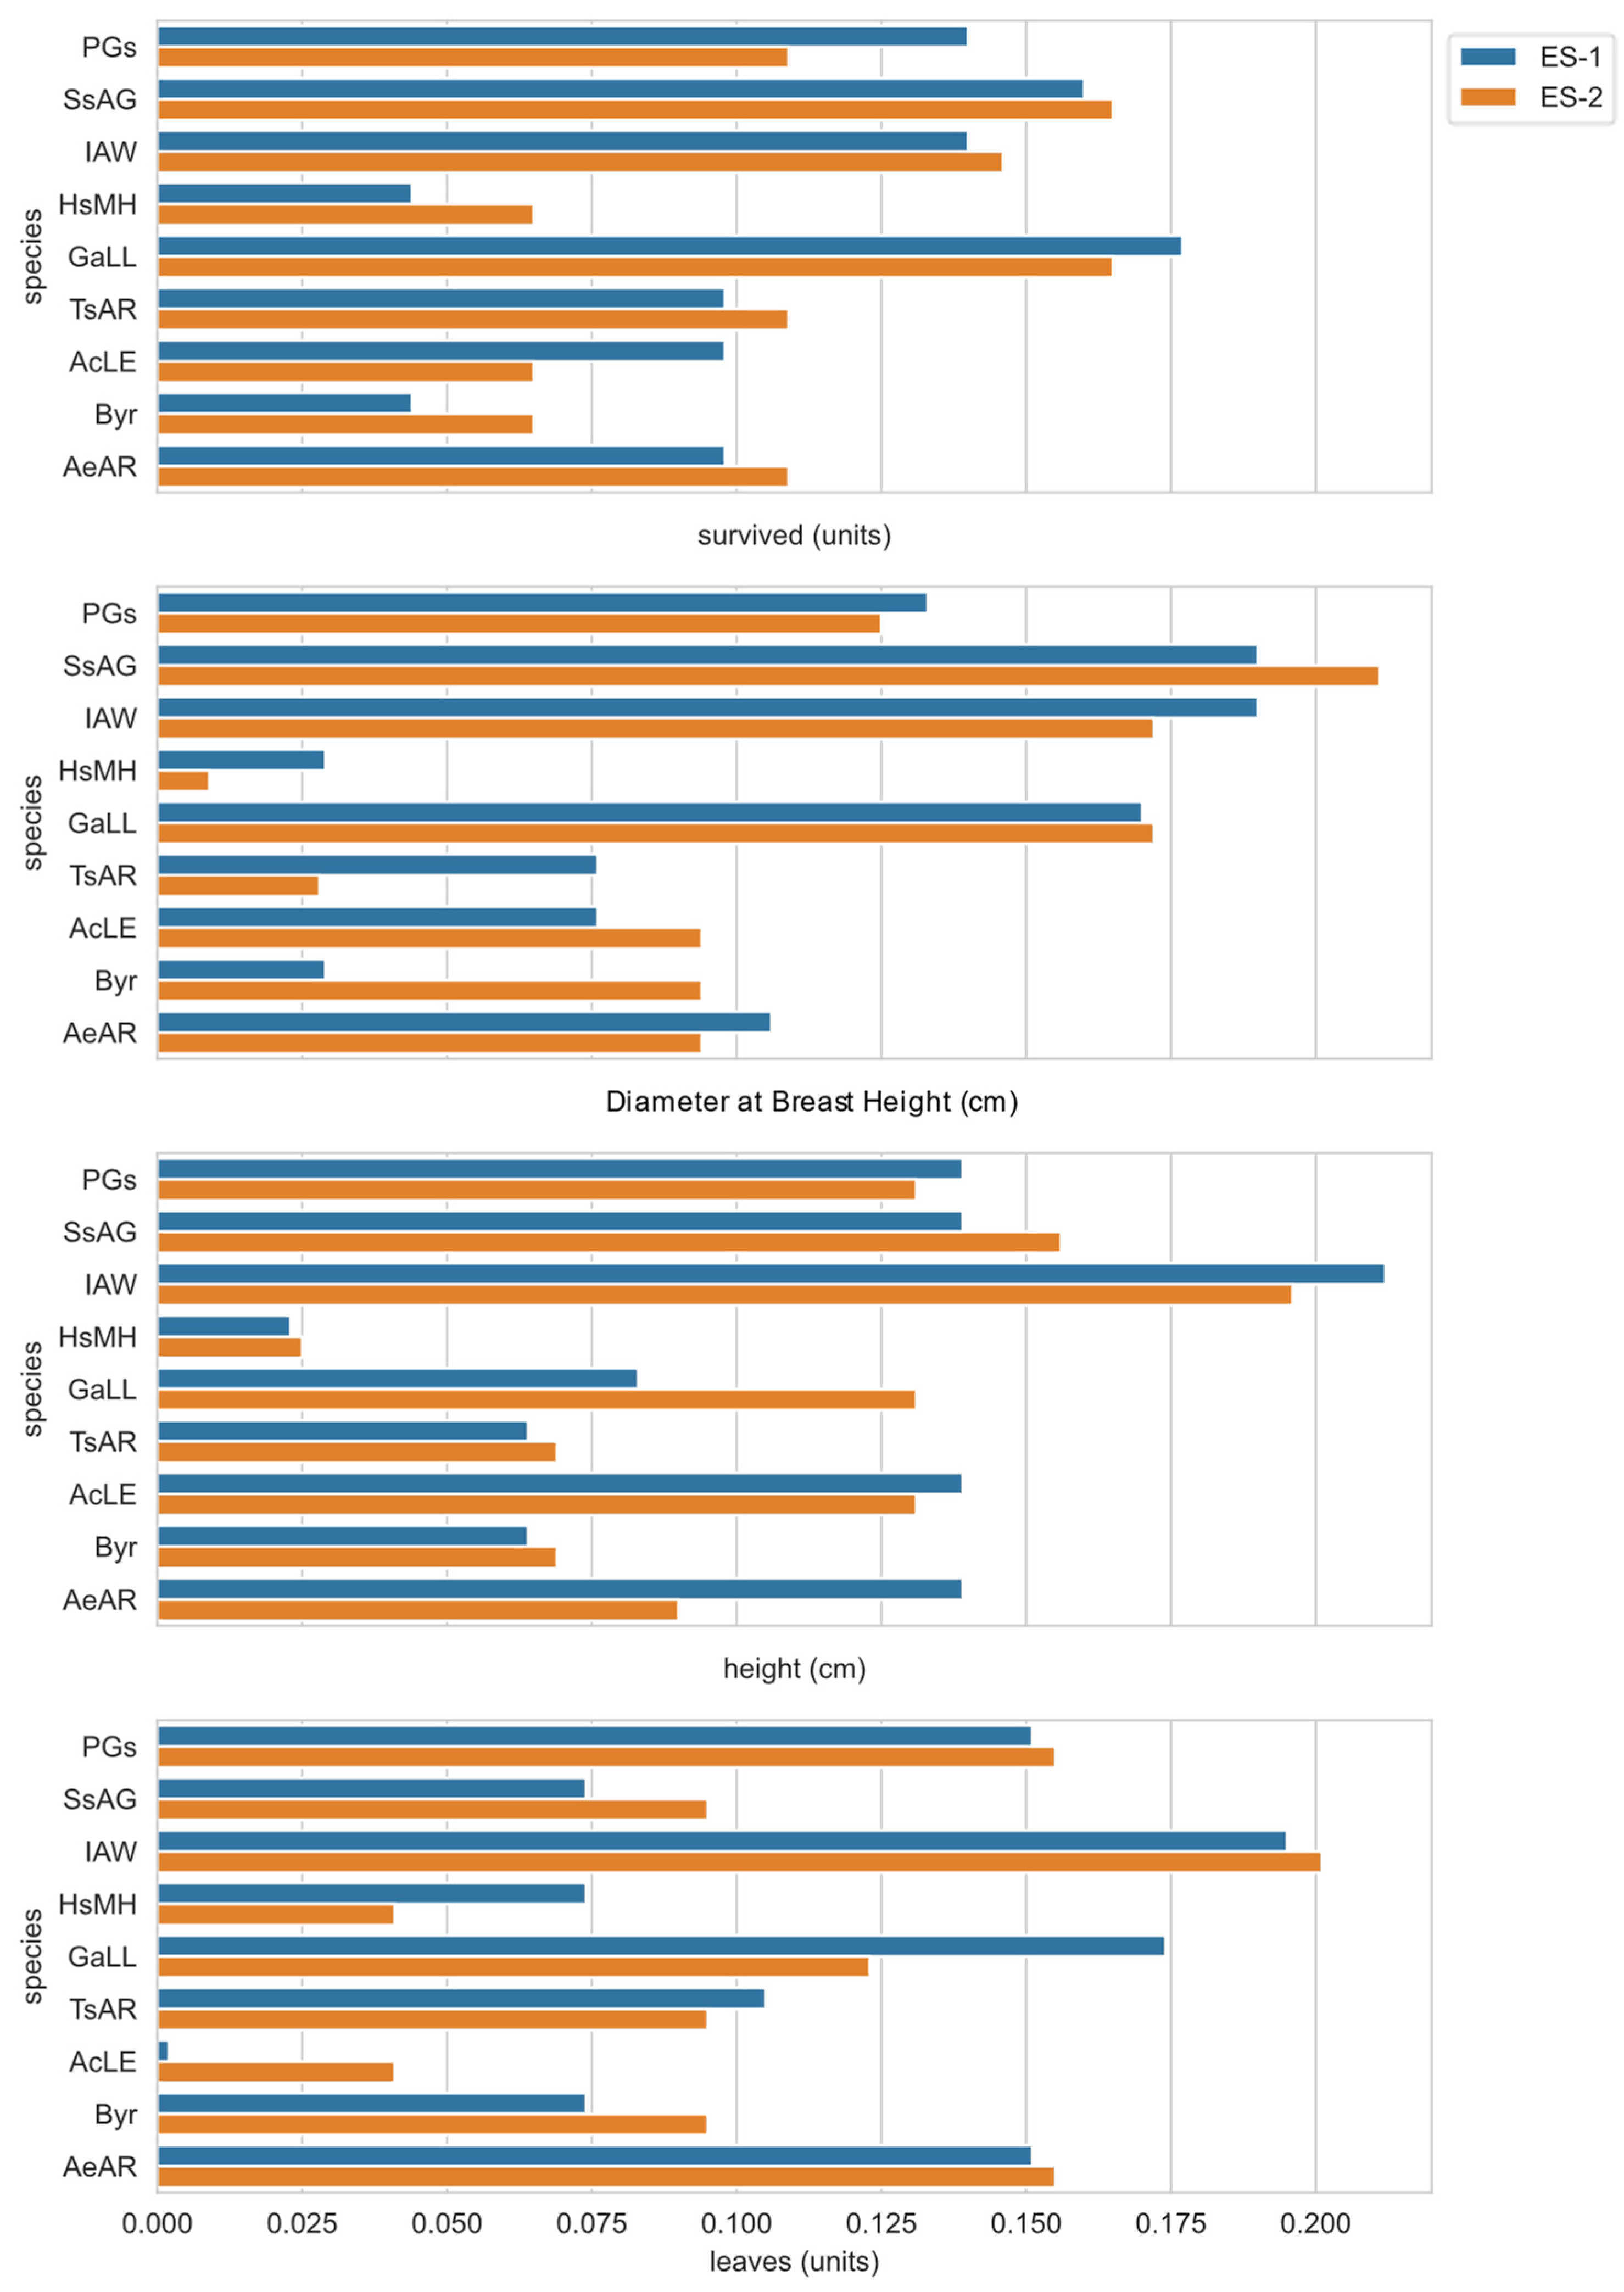
For the problem analyzed here, the comparison of the four morphological features—trees’ percentage of survivors (SUR), average diameter at breast height (DBH), average total height (HEI), and average number of leaves per branch (LEA)—by means of the fuzzy analytic hierarchy process (FAHP) allowed the assignment of weights to them. Then, the comparison of the species measurements for each criterium resulted in the species performance metrics as shown in Figure 2. The analytic hierarchy process (AHP) is a MCDA method based on priority theory whose main characteristic is the decomposition of a problem into two elements, the criteria, and the alternatives. The criteria are compared to each other in terms of their relative importance to achieve a certain result and then the alternatives are compared to each other according to their performance in relation to each of the criteria. The main limitation of this method is that it is not able to reproduce inaccuracy and uncertainty [60,61]. Fuzzy AHP allows including a measure of inaccuracy in any step of the analysis. This measure is represented by α-cuts delimitating a fuzzy membership function (FMF), which defines a range over a set of possible values for the fuzzy variables. Thus, inaccuracy is incorporated into the assessment procedure, allowing a more coherent approach to the real world, thus influencing the conclusion. Chang [62] proposed a method for synthesizing the model solution and tested the respective algorithm to solve hierarchy problems associated with fuzzy logic.
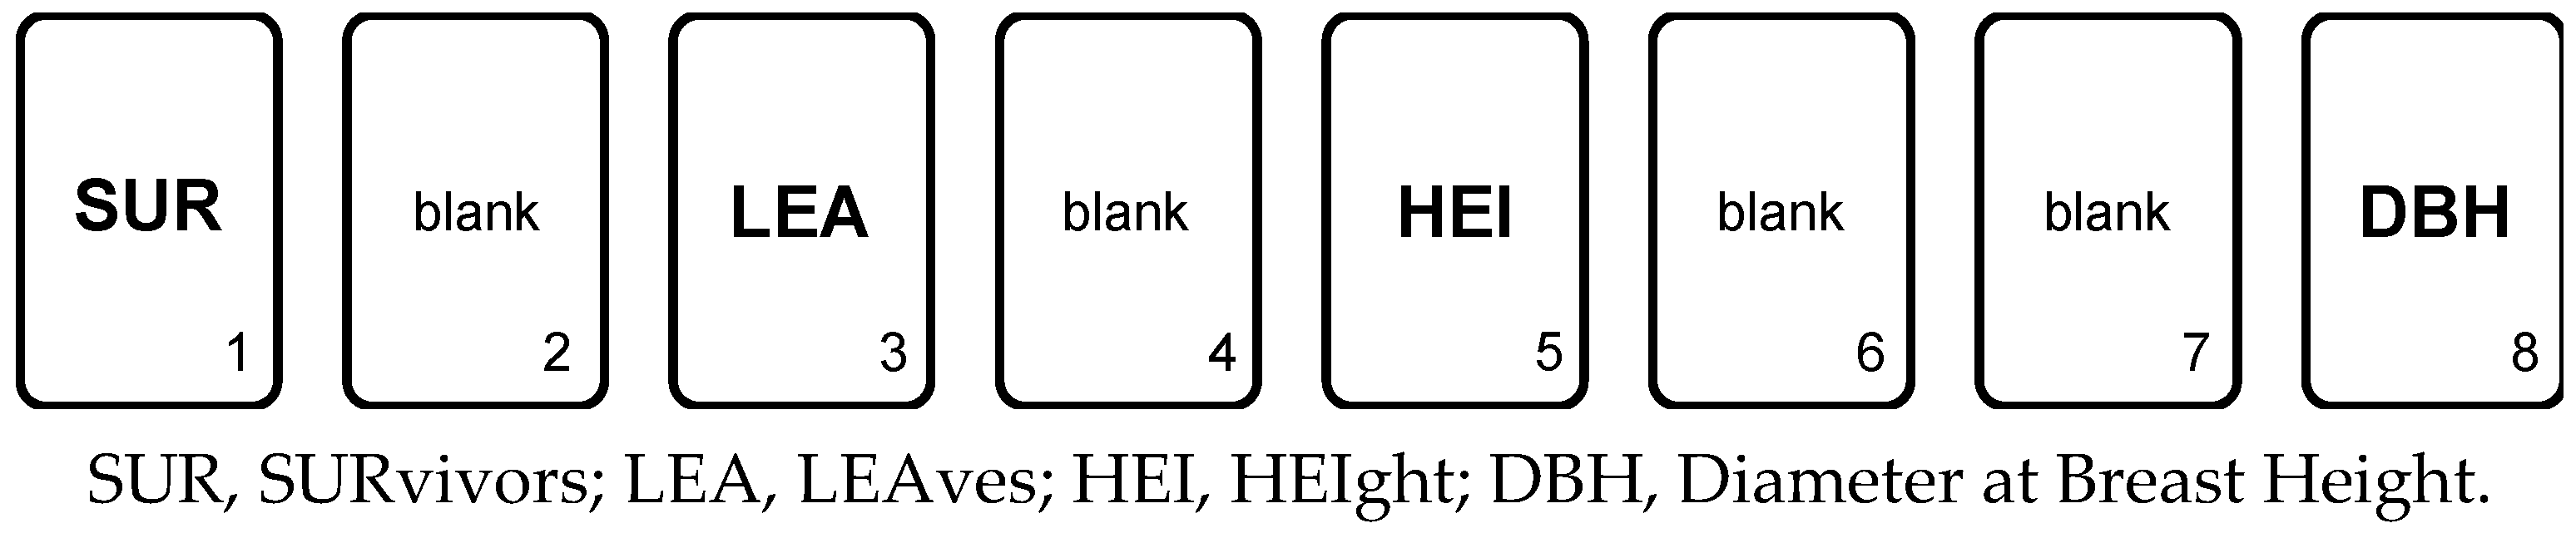
The SIMOS elicitation method [63] was used to obtain comparison scores of the degree of importance between the criteria. An expert received four cards containing identification of the four criteria and twelve blank cards. He was asked to place the cards containing the criteria identifications in descending order of importance. Each blank card inserted between two criteria indicated the degree of importance of that criterion over the next one. The greater the number of blank cards, the greater the degree of importance, with the absence of cards meaning that the criteria are equally important. The cards with the criteria occupy a certain position, which divided by the total number of cards results in the normalized weight by the SIMOS procedure. To convert these weights into scores according to the Saaty procedure, the change to base eight plus one was used [64]. In this study, the cards’ order represented the importance of the criteria that influence the survival of the species in the long run.
To apply the fuzzy AHP technique for the ranking of the tree species, we used the base eight plus one method, referring to the tree with the best performance. The result of the numerator or denominator, depending on the direction, must be rounded to the nearest integer. Therefore, the variable scores of relative survival rates are converted to the Saaty scale. The advantage of this approach is that it meets the format requirement of the input data established by Saaty and Vargas [65] and the resulting matrix is transitive.

3. Results

Two years after planting, the nine native trees’ capacity to survive and their average traits measured—DBH, total height, and number of leaves—varied, as shown in Figure 3. Since these morphological features provide the best estimate of seedling performance after planting [66,67,68], we specified them as the criteria of the MCDA model to estimate the contributions of species to the sustainable restoration of the biome through new vegetation cover with fruit trees around the reservoir.
The assignment of scores aims to obtain the values of the criteria and the average values of measurements of seedling species so they can be processed by the FAHP algorithm. For this to be possible, we first converted the comparison among criteria values to a 4 × 4 matrix and the performance of the average values of measurements to a 9 × 9 matrix compatible with the Saaty scale [65], and then fuzzified them.

3.1. Relative Importance among Criteria

The specialist chosen to give an opinion on the degree of relative importance among the four criteria is an agricultural engineer with 40 years of experience in the area of agricultural sciences. (The aim of identifying the fruit trees that would present the best performance for the revegetation of the surroundings of the reservoir led us to omit some representative variables for the environment, such as the stem CO2 efflux, which contributes to the ecosystem respiration and carbon sequestration [63,69]). Using the SIMOS approach, he ordered the cards according to Figure 4. If a blank card was inserted between two criteria, it means that a displacement occurred in one position in the order of importance. The greater the number of blank cards between two criteria, the larger this displacement is, where just one blank card means “slightly more important”, two blank cards mean “more important”, and three blank cards means “much more important”. The absence of a blank card between two criteria indicates a tie. The position value divided by the sum of criteria positions results in a basic or normalized score. Although the blank card occupies a position, no score is assigned to it since it is not a criterion.
Thus, for any species, the percentage of survivors (SUR) was slightly more important than the average number of leaves per branch (LEA); which in turn was slightly more important than average total height (HEI); this being more important than average DBH. The expert gave the following explanation: “Two years after planting, the plants continue to seek stability in the formation of the regenerative forest (attempt to survive) in an abundant climate in the sun, with rains from October to April and drought from May to September. The soil continues to have Brachiaria sp. grass, which was introduced throughout the Cerrado. The percentage of surviving plants in relation to those planted after this period is the most important criterion, as it identifies the ability of these native plants to adapt to the two predominant types of soil surrounding the reservoir, which is highly representative throughout the entire length of the Biome. Very close in degree of importance is the average number of leaves of each species, because the leaves absorb intense local solar radiation through photosynthesis transform thermal energy into chemical energy, producing sugar, starch, and cellulose, which are essential for plant growth. The average height of each species is slightly less important than both of the previous criteria, but high values are essential for the plant to be able to compete favorably with Brachiaria sp. and the other species that make up the experiment, competing for space to access solar radiation. The DBH is the least important among these criteria, but significant values denote greater capacity of the wood in the transport of mineral salts and water collected from the soil by the roots.” To obtain the matrix of paired comparisons shown in Table 2, we used base eight plus one according to the approach proposed by Ribas and Silva Rocha [64]. On the Saaty scale, whose domain ranges from 1/9 to 9, when comparing two elements, the unit value means equality, so to measure the comparative distance between such elements, it is necessary to subtract them and add one. On this same scale, the reverse situation is represented by the reciprocal of the value, so if the value 2 means that element A is slightly more important than B, the value 1/2 will mean that element B is slightly less important than A. In this way, reorganizing the matrix’s differences between the four criteria in the new base will produce the input data organized in accordance with the Saaty pairwise comparison matrix, providing values suitable for calculating weights by the FAHP method. The advantage of this approach is that the resulting matrix of Table 3 is transitive.

3.2. Comparison of Fruit Tree Species Relative to Each Other

To change the scale for a given species, it is necessary to multiply the species measure by eight and then divide it by the highest survival rate among all species. The result must be added to one and rounded to the nearest integer number. The matrix of paired comparisons was constructed in the same way as for the criteria of the previous step. Again, the resulting matrix was compatible with the Saaty scale and could be used as input for the FAHP method. For example, Table 4 shows the matrix of paired comparisons of seedlings planted at the ES-1 site in relation to the survival criterion (SUR), being similar to the other criteria and the ES-2 site.
For the matrix of paired comparisons between criteria and for the performance matrices of the seedling species in relation to each of the criteria in both sites, the fuzzy values were calculated upward and downward by a triangular membership function. The criterion for establishing the fuzzification degree (δ), was based on the number of years elapsed between measuring the survival rate and planting the seedlings, equal to 3.0 for one to three years, 2.0 for four to five years, and 1.5 for a period greater than five years. Since the measurement at both sites took place two years after planting, the value set for δ was equal to 3.0.
In the next step, the values of the synthetic extensions were calculated according to the FAHP method and used to calculate the possibilities of dominance in the pairwise comparison among the nine species. The resulting entries in the paired comparison matrix and the δ value of 3.0 were input data for the FAHP, whose normalized degrees of importance for the four criteria are shown in Table 5.

3.3. Calculation of Performance of the Fruit Tree Survival Rates at Both Sites

Considering the convexity of the fuzzy set, the Min operator [70] was used to obtain the degrees of possibility. The performances obtained for the nine species relative to the four criteria were normalized to find their estimated contribution to revegetation, as shown in Figure 5 for the sites ES-1 and ES-2, respectively.

3.4. Consistency Analysis of the Pairwise Comparison Matrix

Inconsistency between the scores of the pairwise comparison matrix in Table 4 occurs when the procedure of changing the scale, rounding, and reorganizing the survival rates according to the Saaty table is not efficient, failing to guarantee the transitivity of the matrix of paired comparisons. To ensure that both matrices are transitive, Saaty proposed the calculation of the consistency index [71]. The consistency ratio (CR) is found by comparing the consistency index (CI) of the matrix of pairwise comparisons against the consistency index of a random-like matrix (RI), where RI is the random index table value according to the number of species. The optimal value for the criteria to be evaluated as consistent would be CR ≤ 0.1 [71]. For four criteria, the RI value is 0.8816 and for nine species, the RI value is 1.45. We checked the consistency of the survival rates converted to the Saaty pairwise comparison matrices. The results shown in Table 6 demonstrate that criteria ES-1 and ES-2 scores had CR values below 0.1, so all matrices were consistent and transitive.

4. Discussion

The intensity of solar radiation and rainfall are climatological factors that affect the survival of the seedlings. The dry season from May to September is particularly severe in the state of Goias. The average monthly precipitation in July is only 1.7 mm, with a standard deviation of 3.5 mm. On the other hand, the wet season in the summer receives 47 times higher average precipitation, 882.6 mm. Although the planting in both experimental sites was done in the month of October, the hot weather with an average monthly temperature ranging from 30 °C to 32 °C and intense rainstorms influenced the survival capacity of some species.
As shown in Table 7, five species can be responsible for three-fourths of the revegetation of the reservoir margins if the results of this experiment are confirmed in large-scale planting. The production of Ingá (IAW), Chichá (SaAG), Jenipapo (GaLL), Araçá Vermelho (PgS), and Marmelada de Bezerro (AaAR) would not only serve for sustainable restoration of the biome, but also in some cases could produce an economic gain for the riverside population, since many of them are employed in the food industry.
The Pearson correlation value between the two columns of Table 7 of 0.9634 and the p-value close to zero demonstrated that the relative contributions of the nine species to the two types of soil had no significant differences. The same conclusion occurred with the Spearman rank correlations of the relative positions of the species, being equal to 0.90, with a p-value near zero. The vegetation and soil are intimately related, while the former protects the soil surface against water and wind erosion, induces the transfer of nutrients to the soil and provide surface soil enhancement [72], the latter is essential for the establishment of plant communities [73]. Because the proportion of surviving trees two years after planting was approximately equal between the two sites (53% for ES-1 and 58% for ES-2), we can state that the ability of the fruit trees to survive did not depend on the type of soil (between Latosol and Cambisol, the two predominant soils around the reservoir). Vegetation and soil are so closely related that it is hard to identify cause-and-effect relationships. For instance, vegetation can protect soil surface against erosion and influence the transfer of nutrients to the soil solution, especially iron and aluminum, adding organic components to the soil. The Latosol of ES-1 is highly weathered and has low natural fertility and a limited reserve of nutrients. It tends to have good physical but poor chemical properties relative to plant growth. The good physical properties are mainly due to high aggregate stability. Strong aggregate stability allows water and air to move through the soil readily and permits roots to penetrate with little resistance. The Cambisol of ES-2, on the other hand, is characterized by low natural fertility and high aluminum saturation. It has a high content of gravel and cobblestone [74]. The biome of ES-1 and ES-2 is classified according to its vegetation and physiognomies as “dirty field” and riverine forest. The latter aspect is ubiquitous throughout the Brazilian Cerrado biome, where nearly all water bodies are fringed by forests. This forest network is determined by the year-round high soil moisture, which despite the long dry season in the region, provides a suitable habitat for a large number of typical moist forest species. Soil moisture is one factor affecting plant performance, mostly restricted to soils that are well drained throughout the year, commonly causing pronounced physiognomic and floristic changes in the case of seasonally waterlogged grasslands. Where inter-fluvial lands are bordered by veredas (marshy grasslands), it is common to observe a decline in mean tree height and increased density of woody plants toward the land margin, where a distinct community of native tree species that are more resistant to soil saturation occurs. Another factor is the aluminum in the soil. The levels of this element are high in the dystrophic Brazilian Cerrado soils, making them extremely toxic to most cultivated plants. However, most native species are aluminum-tolerant, as would be expected. The tolerant species include a number of diverse unrelated families that accumulate aluminum in their tissues, particularly in leaves, but also in roots [39]. The roots of the trees, in turn, help to preserve the stability of the slopes on the banks of the reservoir, through hydro-mechanical reinforcement within the rooted zone. The combination of forest species with shrubs and grasses creates a dense mesh that prevents the formation of erosion and siltation along the reservoir [75,76] (Supplemental Materials).

5. Conclusions

Two effects were specified as factors in the proposed model: (1) two experimental sites containing two different types of predominant soil; and (2) 1248 seedlings of nine fruit tree species, randomly dispersed in these two sites, measured by applying four criteria. The model also considered the combined effect involving the criterion weights and the species performance relative to the criteria.
The large-scale agricultural expansion in the state of Goias, stimulated by growing global food demand, has increased deforestation in areas with high potential for production of beef and soybeans. Another factor is paper demand, causing the expansion of planted forests. Currently, only a small part of the original biome remains, most of it located in protected areas such as along riverbanks and in headwater areas. The filling of the Corumbá IV reservoir inundated pasture and cropland and partially flooded riparian forest areas. The occurrence of the exotic invasive grass Brachiaria sp. in nearly the entire region, the hot temperature and generally dry weather, the concentration of aluminum in the soil, and the widespread presence of livestock are some of the technical difficulties found in the Brazilian Cerrado in Goias to reforestation with native trees. The natural regeneration of the environment is seriously affected by the presence of Brachiaria sp. Due to its aggressiveness and high competitiveness for solar radiation and soil nutrients, whenever an area is converted with this exotic grass for cattle grazing, it is difficult to revert to its original condition with native vegetation. Therefore, its presence in ES-1 and ES-2 sites is one of the main causes of the high mortality rate observed in most seedlings [77,78]. Urban expansion, spread of croplands, commercial tree plantation with Eucalyptus and Pinus, and higher cost of seedlings and maintenance of native trees are additional issues deterring municipal authorities and farmers from sustainable reforestation practices. The planting of native fruit trees scattered in large groves can contribute to the vegetative cycle (flowering, fruiting, ripening), offering wildlife habitats and wildlife corridors, thus increasing biodiversity by enabling aquatic and riparian animals to move along river systems, gradually reintegrating the fragmented landscapes. This action also acts as an erosion buffer and provides shaded areas for leisure activities by riverine communities.
This study showed that the contribution of tree species is independent of the two most common soil types. These findings simplify the decision for extensive plantation around reservoirs with seedlings of native tree species having better survivability. Regardless of biome, instead of replanting riparian forests with exotic trees, Brazilian hydropower companies should use seedlings of native fruit trees, thus providing a short-term solution for wildlife habitat and promoting faster local environmental recovery as a whole.

Supplementary Materials

The following are available online at https://www.mdpi.com/article/10.3390/su13147849/s1.

Author Contributions

Conceptualization, methodology, investigation, formal analysis, and original draft preparation, J.R.R. and J.S.R.; data curation, visualization, review and editing, A.S.G. and E.A.F.; project administration and funding acquisition, D.G.P. and A.G.R. All authors have read and agreed to the published version of the manuscript.

Funding

This research was funded by Corumbá Concessões S/A, grant number PD-2262-1204/2012, Spanish Ministry of Science and Innovation, grant number RTI2018-098900-B-I00, and the Regional Government of Castilla y León under the “Health and Safety Program” (INVESTUN/19/BU/0004).

Institutional Review Board Statement

Not applicable.

Informed Consent Statement

Not applicable.

Data Availability Statement

Ribas, J.R.; Ribas, J.S.; Data Analysis of the Evaluation of Sustainable Riparian Revegetation with Local Fruit Trees around a Reservoir of a Hydroelectric Power Plant in Central Brazil. Mendeley Data, V1, doi:10.17632/h36pb9v55v.1.

Acknowledgments

The authors thank the Corumbá Concessões S/A and the Defense University Center at the Spanish Naval Academy (CUD-ENM) for all the support provided for this research.

Conflicts of Interest

The authors declare no conflict of interest.

References

  1. Egré, D.; Milewski, J.C. The diversity of hydropower projects. Energy Policy 2002, 30, 1225–1230. [Google Scholar] [CrossRef]
  2. Zhang, L.; Chai, J.; Zhu, J.; Zhao, Z. Dynamic simulation and assessment of the ecological benefits of hydropower as an alternative energy for thermal power under ecological civilization construction: A case study of Fujian, China. Energy Sci. Eng. 2020, 8, 2426–2442. [Google Scholar] [CrossRef] [Green Version]
  3. World Commission on Dams (WCD). Dams and Development: A New Framework for Decision-Making: The Report of the World Commission on Dams; Earthscan: London, UK, 2001. [Google Scholar]
  4. Van Looy, K.; Tormos, T.; Souchon, Y. Disentangling dam impacts in river networks. Ecol. Ind. 2014, 37, 10–20. [Google Scholar] [CrossRef] [Green Version]
  5. Tealdi, S.; Camporeale, C.; Ridolfi, L. Modeling the impact of river damming on riparian vegetation. J. Hydrol. 2011, 396, 302–312. [Google Scholar] [CrossRef]
  6. De Faria, F.A.; Davis, A.; Severnini, E.; Jaramillo, P. The local socio-economic impacts of large hydropower plant development in a developing country. Energy Econ. 2017, 67, 533–544. [Google Scholar] [CrossRef]
  7. Zeleňáková, M.; Fijko, R.; Diaconu, D.C.; Remeňáková, I. Environmental impact of small hydro power plant—A case study. Environments 2018, 5, 12. [Google Scholar] [CrossRef] [Green Version]
  8. Botelho, A.; Ferreira, P.; Lima, F.; Pinto, L.M.C.; Sousa, S. Assessment of the environmental impacts associated with hydropower. Renew. Sustain. Energy Rev. 2017, 70, 896–904. [Google Scholar] [CrossRef]
  9. Zarfl, C.; Berlekamp, J.; He, F.; Jähnig, S.C.; Darwall, W.; Tockner, K. Future large hydropower dams impact global freshwater megafauna. Sci. Rep. 2019, 9, 1–10. [Google Scholar] [CrossRef] [Green Version]
  10. Moran, E.F.; Lopez, M.C.; Moore, N.; Muller, N.; Hyndman, D.W. Sustainable hydropower in the 21st century. Proc. Natl. Acad. Sci. USA 2018, 115, 11891–11898. [Google Scholar] [CrossRef] [Green Version]
  11. Le, H.D.; Smith, C.; Herbohn, J. What drives the success of reforestation projects in tropical developing countries? The case of the Philippines. Glob. Environ. Chang. 2014, 24, 334–348. [Google Scholar] [CrossRef]
  12. Reed, M.S.; Stringer, L.; Dougill, A.; Perkins, J.; Atlhopheng, J.; Mulale, K.; Favretto, N. Reorienting land degradation towards sustainable land management: Linking sustainable livelihoods with ecosystem services in rangeland systems. J. Environ. Manag. 2015, 151, 472–485. [Google Scholar] [CrossRef] [Green Version]
  13. Chazdon, R.L.; Cullen, L., Jr.; Padua, S.M.; Padua, C.V. People, primates and predators in the Pontal: From endangered species conservation to forest and landscape restoration in Brazil’s Atlantic Forest. R. Soc. Open Sci. 2020, 7, 200939. [Google Scholar] [CrossRef]
  14. Buchanan, S.W.; Baskerville, M.; Oelbermann, M.; Gordon, A.M.; Thevathasan, N.V.; Isaac, M.E. Plant diversity and agroecosystem function in riparian agroforests: Providing ecosystem services and land-use transition. Sustainability 2020, 12, 568. [Google Scholar] [CrossRef] [Green Version]
  15. Meyfroidt, P. Environmental cognitions, land change and social-ecological feedbacks: Local case studies of forest transition in Vietnam. Hum. Ecol. 2013, 41, 367–392. [Google Scholar] [CrossRef]
  16. Lambin, E.F.; Meyfroidt, P. Global land use change, economic globalization, and the looming land scarcity. Proc. Natl. Acad. Sci. USA 2011, 108, 3465–3472. [Google Scholar] [CrossRef] [Green Version]
  17. Kemppinen, K.M.; Collins, P.M.; Hole, D.G.; Wolf, C.; Ripple, W.J.; Gerber, L.R. Global reforestation and biodiversity conservation. Conserv. Biol. 2020, 34, 1221–1228. [Google Scholar] [CrossRef]
  18. Chazdon, R.L. Making tropical succession and landscape reforestation successful. J. Sustain. For. 2013, 32, 649–658. [Google Scholar] [CrossRef]
  19. Calvo-Alvarado, J.C.; Arias, D.; Richter, D. Early growth performance of native and introduced fast growing tree species in wet to sub-humid climates of the Southern region of Costa Rica. For. Ecol. Manag. 2007, 242, 227–235. [Google Scholar] [CrossRef]
  20. Le, H.D.; Smith, C.; Herbohn, J.; Harrison, S. More than just trees: Assessing reforestation success in tropical developing countries. J. Rural Stud. 2012, 28, 5–19. [Google Scholar] [CrossRef] [Green Version]
  21. Silva, R.R.; Oliveira, D.R.; da Rocha, G.P.; Vieira, D.L. Direct seeding of Brazilian savanna trees: Effects of plant cover and fertilization on seedling establishment and growth. Restor. Ecol. 2015, 23, 393–401. [Google Scholar] [CrossRef] [Green Version]
  22. Miina, J.; Saksa, T. Predicting regeneration establishment in Norway spruce plantations using a multivariate multilevel model. New For. 2006, 32, 265–283. [Google Scholar] [CrossRef]
  23. Budke, J.C.; Jarenkow, J.A.; de Oliveira-Filho, A.T. Relationships between tree component structure, topography and soils of a riverside forest, Rio Botucaraí, Southern Brazil. Plant Ecol. 2007, 189, 187–200. [Google Scholar] [CrossRef]
  24. Vargas-Rodriguez, Y.L.; Vázquez-García, J.A.; Williamson, G.B. Environmental correlates of tree and seedling–sapling distributions in a Mexican tropical dry forest. Plant Ecol. 2005, 180, 117–134. [Google Scholar] [CrossRef]
  25. van Dijk, A.I.; Keenan, R.J. Planted forests and water in perspective. For. Ecol. Manag. 2007, 251, 1–9. [Google Scholar] [CrossRef]
  26. Valdecantos, A.; Fuentes, D.; Smanis, A.; Llovet, J.; Morcillo, L.; Bautista, S. Effectiveness of low-cost planting techniques for improving water availability to Olea Europaea seedlings in degraded drylands. Restor. Ecol. 2014, 22, 327–335. [Google Scholar] [CrossRef]
  27. Piotto, D.; Craven, D.; Montagnini, F.; Alice, F. Silvicultural and economic aspects of pure and mixed native tree species plantations on degraded pasturelands in humid Costa Rica. New For. 2010, 39, 369–385. [Google Scholar] [CrossRef]
  28. Engel, V.L.; Parrotta, J.A. An evaluation of direct seeding for reforestation of degraded lands in central Sao Paulo state, Brazil. For. Ecol. Manag. 2001, 152, 169–181. [Google Scholar] [CrossRef]
  29. Lamb, S.E.; Jørstad-Stein, E.C.; Hauer, K.; Becker, C. Development of a common outcome data set for fall injury prevention trials: The Prevention of Falls Network Europe consensus. J. Am. Geriatr. Soc. 2005, 53, 1618–1622. [Google Scholar] [CrossRef] [PubMed]
  30. Dodd, M.B.; Power, I.L. Direct seeding of indigenous tree and shrub species into New Zealand hill country pasture. Ecol. Manag. Restor. 2007, 8, 49–55. [Google Scholar] [CrossRef]
  31. Grossnickle, S.C.; MacDonald, J.E. Seedling quality: History, application, and plant attributes. Forests 2018, 9, 283. [Google Scholar] [CrossRef] [Green Version]
  32. Bojórquez-Tapia, L.A.; Cruz-Bello, G.M.; Luna-González, L. Connotative land degradation mapping: A knowledge-based approach to land degradation assessment. Environ. Model. Softw. 2013, 40, 51–64. [Google Scholar] [CrossRef]
  33. Holl, K.D.; Brancalion, P.H. Tree planting is not a simple solution. Science 2020, 368, 580–581. [Google Scholar] [CrossRef] [PubMed]
  34. Esmail, B.A.; Geneletti, D. Multi-criteria decision analysis for nature conservation: A review of 20 years of applications. Methods Ecol. Evol. 2018, 9, 42–53. [Google Scholar] [CrossRef] [Green Version]
  35. Martin, D.M.; Hermoso, V.; Pantus, F.; Olley, J.; Linke, S.; Poff, N.L. A proposed framework to systematically design and objectively evaluate non-dominated restoration tradeoffs for watershed planning and management. Ecol. Econ. 2016, 127, 146–155. [Google Scholar] [CrossRef] [Green Version]
  36. Forsyth, G.; Le Maitre, D.C.; O’Farrell, P.J.; Van Wilgen, B. The prioritisation of invasive alien plant control projects using a multi-criteria decision model informed by stakeholder input and spatial data. J. Environ. Manag. 2012, 103, 51–57. [Google Scholar] [CrossRef] [PubMed]
  37. Qureshi, M.E.; Harrison, S.R. Application of the analytic hierarchy process to riparian revegetation policy options. Small-Scale For. Econ. Manag. Policy 2003, 2, 441–458. [Google Scholar] [CrossRef] [Green Version]
  38. Aguirre-Salado, C.A.; Miranda-Aragón, L.; Pompa-García, M.; Reyes-Hernández, H.; Soubervielle-Montalvo, C.; Flores-Cano, J.A.; Méndez-Cortés, H. Improving identification of areas for ecological restoration for conservation by integrating USLE and MCDA in a GIS-environment: A pilot study in a priority region Northern Mexico. ISPRS Int. J. Geo Inf. 2017, 6, 262. [Google Scholar] [CrossRef] [Green Version]
  39. Oliveira-Filho, A.T.; Ratter, J.A. Vegetation Physiognomies and Woody Flora of the Cerrado Biome; Oliveira, P., Marquis, R., Eds.; Columbia University Press: New York, NY, USA, 2002; Volume 13, p. 91. [Google Scholar]
  40. Kottek, M.; Grieser, J.; Beck, C.; Rudolf, B.; Rubel, F. World map of the Köppen-Geiger climate classification updated. Meteorol. Z. 2006, 15, 259–263. [Google Scholar] [CrossRef]
  41. Carvalho, F.M.; Júnior, P.D.M.; Ferreira, L.G. The Cerrado into-pieces: Habitat fragmentation as a function of landscape use in the savannas of central Brazil. Biol. Conserv. 2009, 142, 1392–1403. [Google Scholar] [CrossRef]
  42. Klink, C.A.; Machado, R.B. Conservation of the Brazilian cerrado. Conserv. Biol. 2005, 19, 707–713. [Google Scholar] [CrossRef]
  43. Martinelli, L.A.; Naylor, R.; Vitousek, P.M.; Moutinho, P. Agriculture in Brazil: Impacts, costs, and opportunities for a sustainable future. Curr. Opin. Environ. Sustain. 2010, 2, 431–438. [Google Scholar] [CrossRef]
  44. Ribas, J.R. An assessment of conflicting intentions in the use of multipurpose water reservoirs. Water Resour. Manag. 2014, 28, 3989–4000. [Google Scholar] [CrossRef]
  45. Paulucio, V.d.O.; Silva, C.F.d.; Martins, M.A.; Pereira, M.G.; Schiavo, J.A.; Rodrigues, L.A. Reforestation of a degraded area with Eucalyptus and Sesbania: Microbial activity and chemical soil properties. Rev. Brasil. Ciência Solo 2017, 41, 41. [Google Scholar] [CrossRef] [Green Version]
  46. De Carvalho, J.C.B.; Espíndola, C.R.; Alves, M.C.; Figueiredo, G.C.; Dechen, S.C.F. Recovery of an oxisol degraded by the construction of a hydroelectric power plant. Rev. Brasil. Ciência Solo 2015, 39, 1776–1785. [Google Scholar] [CrossRef] [Green Version]
  47. Brockerhoff, E.G.; Jactel, H.; Parrotta, J.A.; Ferraz, S.F. Role of eucalypt and other planted forests in biodiversity conservation and the provision of biodiversity-related ecosystem services. For. Ecol. Manag. 2013, 301, 43–50. [Google Scholar] [CrossRef]
  48. Carriere, R.; Lohmann, L. Pulping the South: Industrial Tree Plantations and the World Paper Economy; Zed Books: London, UK, 1996. [Google Scholar]
  49. Tucker, N.I.; Murphy, T.M. The effects of ecological rehabilitation on vegetation recruitment: Some observations from the Wet Tropics of North Queensland. For. Ecol. Manag. 1997, 99, 133–152. [Google Scholar] [CrossRef]
  50. Da Silva, F.C. Manual de Análises Químicas de Solos, Plantas e Fertilizantes (Handbook of Chemical Analysis of Soils, Plants and Fertilizers); Embrapa Informação Tecnológica: Rio de Janeiro, Brazil; Embrapa Solos Brasília: Brasilia, Brazil, 2009. [Google Scholar]
  51. Hou, D.; Bolan, N.S.; Tsang, D.C.; Kirkham, M.B.; O’Connor, D. Sustainable soil use and management: An interdisciplinary and systematic approach. Sci. Total Environ. 2020, 729, 138961. [Google Scholar] [CrossRef] [PubMed]
  52. Schuren, S.; Snelder, D. Tree Growing on Farms in Northeast Luzon (The Philippines): Smallholders’ Motivations and Other Determinants for Adopting Agroforestry Systems; Snelder, D., Lasco, R., Eds.; Springer: New York, NY, USA, 2008; p. 75. [Google Scholar]
  53. Dos Santos, H.; Jacomine-Klinger, P.; Dos Anjos, L.; De Oliveira, V.; Lumbreras, J.F.; Coelho, M.; De Almeida, J.; de Araújo Filho, J.; De Oliveira, J.; Cunha, T. Sistema Brasileiro de Classificação de Solos; Embrapa: Brasília, Brazil, 2018. [Google Scholar]
  54. Silva, D.; Silva, J.; Junqueira, N.; Andrade, L. Frutas do Cerrado; Embrapa: Planaltina, Brazil, 2001. [Google Scholar]
  55. Bullock, J.M. Gaps in Seedling Colonization; Fenner, M., Ed.; CAB International: Wallingford, UK, 2000; Volume 2, p. 375. [Google Scholar]
  56. INPE. Sistema de Organizaçao Nacional de Dados Ambientais; Instituto Nacional de Pesquisas Espaciais: Natal, Brazil, 2021. [Google Scholar]
  57. Levine, J.M.; Vila, M.; Antonio, C.M.D.; Dukes, J.S.; Grigulis, K.; Lavorel, S. Mechanisms underlying the impacts of exotic plant invasions. Proc. R. Soc. Lond. Ser. B Biol. Sci. 2003, 270, 775–781. [Google Scholar]
  58. Da Silva, D.M.; Batalha, M.A. Defense syndromes against herbivory in a cerrado plant community. Plant Ecol. 2011, 212, 181–193. [Google Scholar] [CrossRef]
  59. Celis, G.; Jose, S. Restoring abandoned pasture land with native tree species in Costa Rica: Effects of exotic grass competition and light. For. Ecol. Manag. 2011, 261, 1598–1604. [Google Scholar] [CrossRef]
  60. Büyüközkan, G.; Ruan, D. Evaluation of software development projects using a fuzzy multi-criteria decision approach. Math. Comput. Simul. 2008, 77, 464–475. [Google Scholar] [CrossRef]
  61. Chand, P.; Thakkar, J.J.; Ghosh, K.K. Analysis of supply chain complexity drivers for Indian mining equipment manufacturing companies combining SAP-LAP and AHP. Resour. Policy 2018, 59, 389–410. [Google Scholar] [CrossRef]
  62. Chang, D. Applications of the extent analysis method on fuzzy AHP. Eur. J. Oper. Res. 1996, 95, 649–655. [Google Scholar] [CrossRef]
  63. Pictet, J.; Bollinger, D. The silent negotiation or how to elicit collective information for group MCDA without excessive discussion. J. Multi-Criteria Decis. Anal. 2005, 13, 199–211. [Google Scholar] [CrossRef]
  64. Ribas, J.R.; Rocha, M.d.S. A decision support system for prioritizing investments in an energy efficiency program in favelas in the city of Rio de Janeiro. J. Multi-Criteria Decis. Anal. 2015, 22, 89–99. [Google Scholar] [CrossRef]
  65. Saaty, T.L.; Vargas, L.G. How to Make a Decision; Springer: New York, NY, USA, 2012; p. 1. [Google Scholar]
  66. Bazzaz, F.; Ackerly, D.; Reekie, E. Reproductive Allocation in Plants; Fenner, M., Ed.; CAB International: Wallingford, UK, 2000; Volume 2, p. 30. [Google Scholar]
  67. Pons, T. Seed Responses to Light; Fenner, M., Ed.; CAB International: Wallingford, UK, 2000; Volume 2, p. 237. [Google Scholar]
  68. Mexal, J.G.; Landis, T.D. Target Seedling Concepts: Height and Diameter. 1990. Available online: https://agris.fao.org/agris-search/search.do?recordID=US9143647 (accessed on 4 June 2014).
  69. Rodríguez-Calcerrada, J.; Martin-StPaul, N.K.; Lempereur, M.; Ourcival, J.M.; del Rey, M.d.C.; Joffre, R.; Rambal, S. Stem CO2 efflux and its contribution to ecosystem CO2 efflux decrease with drought in a Mediterranean forest stand. Agric. For. Meteorol. 2014, 195, 61–72. [Google Scholar] [CrossRef] [Green Version]
  70. Klir, G.J.; Yuan, B. Fuzzy sets and fuzzy logic: Theory and applications. Possibility Theory Vs. Probab.Theory 1996, 32, 207–208. [Google Scholar]
  71. Saaty, T. Optimization in Integers and Related Problems Extreme; McGraw-Hill: New York, NY, USA, 1970. [Google Scholar]
  72. Ellis, M.; Mathews, E. Needs and trends in building and HVAC system design tools. Build. Environ. 2002, 37, 461–470. [Google Scholar] [CrossRef]
  73. Ruggiero, P.G.C.; Batalha, M.A.; Pivello, V.R.; Meirelles, S.T. Soil-vegetation relationships in cerrado (Brazilian savanna) and semideciduous forest, Southeastern Brazil. Plant Ecol. 2002, 160, 1–16. [Google Scholar] [CrossRef]
  74. Motta, P.; Curi, N.; Franzmeier, D. Relation of Soils and Geomorphic Surfaces in the Brazilian Cerrado; Oliveira, P., Marquis, R., Eds.; Columbia University Press: New York, NY, USA, 2002; Volume 13, p. 13. [Google Scholar]
  75. Stokes, A.; Norris, J.E.; Van Beek, L.; Bogaard, T.; Cammeraat, E.; Mickovski, S.B.; Jenner, A.; Di Iorio, A.; Fourcaud, T. How Vegetation Reinforces Soil on Slopes; Springer: New York, NY, USA, 2008; p. 65. [Google Scholar]
  76. Capobianco, V.; Robinson, K.; Kalsnes, B.; Ekeheien, C.; Høydal, Ø. Hydro-mechanical effects of several riparian vegetation combinations on the streambank stability—A benchmark case in southeastern Norway. Sustainability 2021, 13, 4046. [Google Scholar] [CrossRef]
  77. Fagundes, N.C.A.; Braga, L.D.L.; Silva, W.A.; Coutinho, C.A.; Neves, W.V.; De Souza, R.A.; Veloso, M.D.D.M.; Nunes, Y.R.F. Survival of saplings in recovery of riparian vegetation of pandeiros river (MG). Floresta Ambient. 2018, 25, 25. [Google Scholar] [CrossRef] [Green Version]
  78. Rossi, J.; Celini, L.; Mora, P.; Mathieu, J.; Lapied, E.; Nahmani, J.; Ponge, J.; Lavelle, P. Decreasing fallow duration in tropical slash-and-burn agriculture alters soil macroinvertebrate diversity: A case study in southern French Guiana. Agric. Ecosyst. Environ. 2010, 135, 148–154. [Google Scholar] [CrossRef] [Green Version]
Figure 1. Corumbá IV reservoir (Brazil).
Sustainability 13 07849 g001
Figure 2. Flowchart of the proposed method.
Sustainability 13 07849 g002
Figure 3. Measurements of seedlings planted after two years for each site.
Sustainability 13 07849 g003
Figure 4. Relative comparison between criteria according to the SIMOS technique.
Sustainability 13 07849 g004
Figure 5. Species performance for each of the criteria.
Sustainability 13 07849 g005
Table 1. Soil granulometric and chemical composition.
Granulometric CompositionpHChemical Composition
(cmolc/dm3 = mE/100 mL)
Clay (%)Sand (%)Silt (%)SOB **V%CECSOC ***SOM ****
ES-131.347.521.25.01.07205.3011.119.1
ES-229.460.010.64.80.90185.1413.122.4
Chemical Composition(cmolc/dm3 = mE/100 mL)
P *CaMgKNaFe *AlAl sat %
ES-11.10.40.40.180.022991.761
ES-20.70.40.20.200.022411.562
* Measured in mg/dm3 = ppm; *** SOC: soil organic carbon in g/kg; ** SOB: sum of bases; **** SOM: soil organic matter in g/kg; V%: base saturation in percentage; P is P2O5 and Fe is Fe2O3.
Table 2. Native fruit trees used in the experiment.
Abbreviation IdentificationBinomial NameBrazilian Common Name
PgSPsidium guineense SwartzAraçá Vermelho
SsAGSterculia striata A.St.-Hill & GaudinChichá
IAWIngá Alba (Sw) WilldIngá
HsMHHymenaea stigonocarpa Mart. ex HayneJatobá do Cerrado
GaLLGenipa americana L.Jenipapo
TsARTalisia esculenta (A.St.-Hill.) RadlkPitomba
AcLEAcrocomia aculeata (Jacq.) Lodd. Ex Mart.Macaúba
ByrByrsonima verbascifolia (L.) L.C.RichMurici
AaARAlibertia edulis (L.C.Rich) A.Riche ex DC.Marmelada de Bezerro
Table 3. Matrix of paired comparisons among criteria.
SURLEAHEIDBH
SUR1235
LEA1/2124
HEI1/31/213
DBH1/51/41/31
Table 4. ES-1 survival (SUR) rates converted to the Saaty pairwise comparison matrix.
PGsSsAGIAWHsMHGaLLTsARAcLEBgTAeAR
PGs11/2141/33343
SsAG21251/24454
IAW11/2141/33343
HsMH1/41/51/411/61/21/211/2
GaLL323615565
TsAR1/31/41/321/51121
AcLE1/31/41/321/51121
BgT1/41/51/411/61/21/211/2
AeAR1/31/41/321/51121
Table 5. Normalized degrees of importance for morphological features.
SURLEAHEIDBH
0.2850.2700.2480.197
Table 6. Consistency of the Saaty pairwise comparison matrices for ES-1 and ES-2.
CriteriaES-1ES-2
SURLEAHEIDBHSURLEAHEIDBH
CI0.0170.0190.0250.0190.0310.0120.0170.0230.031
CR0.0190.0130.0170.0130.0210.0080.0120.0160.022
Table 7. Weights of species contributions to the revegetation of sites.
SpeciesES-1ES-2
PGs0.1413rd0.13024th
SsAG0.1374th0.15312nd
IAW0.1831st0.17851st
HsMH0.0449th0.03779th
GaLL0.1522nd0.14653rd
TsAR0.0876th0.07968th
AcLE0.0787th0.08076th
Byr0.0548th0.07997th
AeAR0.1245th0.11395th
Publisher’s Note: MDPI stays neutral with regard to jurisdictional claims in published maps and institutional affiliations.

