Article

Household Food Consumption and Wastage during the COVID-19 Pandemic Outbreak: A Comparison between Peru and Brazil

by
Mirza Marvel Cequea
1,*,
Jessika Milagros Vásquez Neyra
2,
Valentina Gomes Haensel Schmitt
3 and
Marcos Ferasso
2
1
Business Management Department, Universidad de Piura, Piura 20009, Peru
2
Institute of Scientific Research and Graduate School, Universidad de Lima, Lima 15023, Peru
3
Graduate School, Universidad de Lima, Santiago de Surco 15023, Peru
*
Author to whom correspondence should be addressed.
Sustainability 2021, 13(14), 7583; https://doi.org/10.3390/su13147583
Submission received: 31 May 2021 / Revised: 28 June 2021 / Accepted: 4 July 2021 / Published: 7 July 2021
(This article belongs to the Special Issue Consumers’ Preferences and Food Products)

Abstract

:
The COVID-19 pandemic has represented a major global challenge. In Latin America, both Brazil and Peru reported the highest levels of impact in terms of proportional infection and death rates. Within this context, this study sought to compare food consumption and wastage patterns in Peruvian and Brazilian households. For these purposes, the authors conducted a quantitative research study based on a self-reported online survey submitted during the pandemic outbreak. Results revealed that the intention of reducing food wastage and implementing leftover management routines are related to the economic value of wasted food. In addition, in both countries, shopping lists are used as planning elements, and food purchases are influenced by on-sale products. Leftover management is also similar in both countries, and the expiration date on the label is the most commonly used criterion for consuming or discarding food items. Nevertheless, within the framework of the health and economic crisis generated, opportunities for change toward the adoption of smarter and more sustainable purchasing behaviors are emerging for both households and companies, in addition to giving equal importance to environmental, social, and economic benefits. This research study provided insights into food consumption and food wastage behaviors in times of crisis, such as a pandemic.

1. Introduction

The outbreak of the COVID-19 pandemic, which commenced at the beginning of 2020, has presented a challenge to society at large [1]. The pandemic created an extraordinary situation, which revealed the interconnected weaknesses of our food, social, and economic systems [2]. The forced social distancing and home confinement measures implemented by different governments not only changed food consumption patterns [3], but also generated uncertainty in the population and put food security at risk due to food supply shortages [4]. In many countries, this context demanded the adoption of new routines, which implied a drastic reduction in socialization and mobility [5,6,7,8], thus altering consumer behaviors and generating lifestyle changes and uncertainty [5,8,9,10,11,12]. Furthermore, it also generated emotional stress and unrest, causing strong reactions in terms of food supply, the perception of food scarcity risk, and less access to food [7,8,11]. The possibility of contagion also forced the food industry to rethink safety and hygiene practices [6,7,10] and to redesign its supply networks to guarantee the safety and sustainability of their production systems [6,10,13]. In addition, at the onset of the pandemic, panic buying driven by these behavioral changes led people to overstock perishable food products regardless of their shelf life, thus generating additional food waste at home [7,8,14].
Food consumption and food waste production have already been assessed by different authors, from different perspectives and using different methodologies, in North America [15,16,17], Europe [2,12,18,19,20,21,22,23,24,25,26,27,28,29,30,31], North Africa [7,32,33,34], Asia [9,35,36,37,38,39,40,41], Oceania [42], and Latin America [43,44], with some studies focusing specifically on the COVID-19 pandemic [7,9,12,19,27,29,31,35,42,43,45]. In addition, it is important to mention that there is a lack of comparative studies among that consider different countries within Latin America during the forementioned period. In the particular case of Latin America, the first COVID-19 case was reported at the end of February 2020 in Brazil [46]. Thereafter, several countries in the region started adopting different transmission prevention measures such as forced social distancing and market access restrictions. Still, both Brazil and Peru have reported a proportionally higher infection rate in the region than the rest of the countries [46]. In Brazil, the first quarter of the pandemic was marked not only by the declaration of community transmission [47] and the adoption of social distancing measures [43], but also by divergences among government authorities, which left the population to fight the virus pretty much on its own. Conversely, in Peru, a nationwide state of emergency was declared 10 days after the first case, which compelled the entire population to forced social distancing, mobility restrictions, and border closings [48]. Nevertheless, even when Brazil and Peru had adopted contrasting measures, after the first three months of the COVID-19 pandemic outbreak, both countries had led the indicator of deaths and infections in Latin America [46]. This situation caused changes in the lifestyle of the people: They began to be at home all the time, in a situation of uncertainty about the future and therefore the behavior of buying and consuming food was affected, since people worried about ensuring the availability of food [7,26]. An example of this were panic purchases in the first weeks of the pandemic, seeking to protect themselves from the shortage of food during the confinement, which could cause excessive purchases, inadequate food storage, or excessive food preparation, generating more food wasted than usual [7,8,14].
In consideration of the above facts, this study posed the following question: What are the similarities and differences in food consumption and food waste behaviors between Brazil and Peru during the COVID-19 pandemic? Hence, this study aimed to compare food consumption and food wastage patterns in Peruvian and Brazilian households within the context of the COVID-19 pandemic. This research study contributes to the knowledge on food consumption and food wastage behaviors in these two Latin American countries in times of crisis, such as a pandemic outbreak, to prevent these behaviors in the future and, in turn, the generation of food waste. The results and analysis may contribute to: (1) Practitioners that intend to better understand consumer behavior and improve business strategies and develop new products and services; (2) public policy development, within the crisis context and considering food consumption and food waste context; (3) the academy, by improving the knowledge and methodology within the study of food consumption and food waste in different countries.

2. Conceptual Framework

Several previous studies have already explained the factors affecting household food consumption and waste generation. These studies used different approaches to determine their different aspects and interrelationships [20,26,49,50,51,52,53]. However, the research focuses on three main behavioral practices related to buying and wasting food: (a) the pre-shopping process, (b) in-store shopping behaviors, and (c) food and waste management at home, as proposed by Bravi et al., 2020 [20] and Principato et al., 2015 [26].

2.1. Pre-Shopping Process

At the household level, many factors are involved in the pre-shopping process [43]. Herein, behavioral intention is determined by consumer attitudes toward behaviors, subjective standards, and perceived behavioral control [54]. In fact, the most favorable attitudes toward a particular behavior develop into stronger intentions to perform the desired behavior [43]. Therefore, one can expect that a favorable attitude toward consumption and not wasting food generates an actual effective waste prevention behavior [30,53,54,55]. However, awareness of the consequences of food wastage is significantly related to food waste, and there is a strong correlation between food wastage and domestic economy [13,26,28,43,49,53,55]. Therefore, intention, both as a prior process to shopping for food and as a predictor of food-buying behaviors, can also influence the amount of food wasted and its economic value [35,39,43].
People usually follow shopping routines. These routines are systematized processes that people perform in their daily activities to make them more comfortable [53,55], but they do not constitute an automatic action. They are related to food item selection and action plans to make decisions in several situations and are related to food wastage [43,53,55]. Likewise, planning skills are related to understanding that food wastage represents wastage of money [43,51]. Hence, poor purchase planning is detrimental to the family budget [43,52], which means that planning is an indicator of responsible shopping, and its application reduces food wastage [53,55,56,57]. Planning and shopping routines include checking food stocks at home and preparing a shopping list [12,20,29,30,32,36,38,50,51,53,55,58,59,60], and budget availability, thereby reducing excessive purchases and, in turn, subsequent wastage [60]. In addition, shopping frequency exerts an influence on food wastage [20,27,29,49,50], and in situations of crisis and uncertainty, purchases should be carefully planned to avoid impulsive in-store shopping behaviors [20,35,61].

2.2. In-Store Shopping Behavior

Consumer shopping behavior is one of the main causes of residential food wastage, particularly if food is bought in excess [20,29,35]. Herein, negative behaviors include impulsive or exaggerated purchases [20]. Excessive buying is caused by marketing and sales strategies applied by food producers and distributors [13], which, through their communication and promotion, impact residential food wastage, as customers buy more products than they actually need [29,62,63]. Furthermore, food-wastage amounts are even greater when food items are purchased in bulk at large supermarkets because of the sizes of the packages they sell [23,29,49,54,58]. However, shopping at small and local markets and stores, where different sizes are available, allows customers to select only what they actually need [23,49].
Another important element is the appearance of products at the store, as the aesthetic standards for fresh products (weight, size, and appearance) influence both buying decisions and food wastage [7]. In addition, the attraction of on-sale or discounted products is a reducing factor of food wastage [7,23,60]. Nevertheless, promotional discounts and lower unit prices encourage consumers to buy more than what they actually need, thereby exerting a negative impact on food-wastage levels [43,56]. As suggested above, sales and promotions lead consumers to buy larger quantities and, therefore, increase the economic value of their food waste.
Conversely, consumers who clearly understand food labels are more motivated to waste less food [18,21,35,64]. For this reason, providing adequate information, especially through labels [54,65], on storage conditions after opening and expiration dates for safe consumption or disposal [7,13,41,54,66,67] is extremely critical because considering the expiration date and storage recommendations for store-bought food products reduce the economic value of household food waste. However, consumers often misinterpret expiration date information. For example, “use before” and “consume before” labels commonly lead to the disposal of food that is fit for consumption [28] due to the risk of a decrease in quality, freshness, or safety of consumption [13,67]. Then, the importance of understanding labels is verified and their incorrect use affects food waste [13,20,67].

2.3. Food and Waste Management at Home

Poor household management practices, such as poor purchase planning, excessive buying, and overstocking, are detrimental to the family’s budget, as they increase food wastage [43,52]. Food management at home is another part of the process, as food preparation and storage practices are critical to waste production [23,28,29,30,42]. Inadequate storage, the preparation of excessive amounts of food, and lack of culinary skills are all sources of residential waste [7,20,23,35,40,51]. For example, preparation of large portions and the habit of leaving uneaten food on the plate [19,20,28], and improperly freezing or refrigerating leftovers or uneaten food are all causes of wasting large amounts of food [41] and are related to food management skills at home. Another factor that contributes to food waste is preventing health risks associated with consuming leftovers or products beyond their expiration date, despite being concerned about the idea of wasting food [66]. The freshness and safety of refrigerated food is related to the time for which it is refrigerated because its odor and flavor can change [28,40,66].
Meanwhile, the reasons for avoiding food wastage can be economic, environmental, and social [49,60,62,63,68,69]. Here, food-wastage awareness is crucial because not everyone is aware of its effects and consequences or do not consider it a real problem, nor perceive it as something that can be avoided [62]. Excessive buying and poor knowledge on how to reuse leftovers, leftover food, and its proper preservation contribute to increasing food wastage and constitutes a waste of money [28,29,69]. Hence, food wastage awareness constitutes a critical step for fostering its reduction [28,29]. In addition, awareness of the economic values associated with wasted food, saving money, environmental awareness, and social awareness [69] are also influencing factors. However, in the middle a crisis, reasons may be more economic than environmental [62,70], which suggests the importance of consumer information and education when making food purchases and reducing waste, especially during a crisis [48].
Within the context of the COVID-19 pandemic, many households have seen their income reduced and, in periods of economic crisis, consumers become more motivated to minimize their food waste [7,18,20,61,68]. During this time, the main motivation for buying food has been to secure food availability as well as to save money, rather than protecting the environment [7,26] because the loss of income in many households caused a contraction of consumption patterns. In this sense, saving money is an important motivation not to waste. In other words, the economic value associated with food wastage is an element considered by buyers [66,69,71]. Furthermore, in times of crisis, people experience financial constraints [70,72], focus on monitoring their economic resources, and are more aware of their spending patterns [23]. Consequently, consumers become more motivated to minimize their food wastage [68]. Overall, consumers use different coping strategies to deal with constraints and prioritize spending on products that must be consumed in the face of the health threats [73].
As sociodemographic characteristics also influence the amount of food wasted [27,35,63,71], several studies have found significant relationships between household waste and the sociodemographic characteristics of members of the household, such as age [15,31,50,53,66,69,71], family income, and number of household members [15,23,27,50,53,59], as well as gender [50], educational level [42,50,58,69], and occupation [35] of the purchasing decision-makers. In this sense, household size influences food wastage because households with few members waste less food and people living alone waste even less [71]. Likewise, it was found that young people tended to spend more than their elders [26,42,58], women usually wasted more than men [26,50,71], there is a correlation between culture and demographics in terms of household food waste generation [42], and higher academic levels are usually related to a low food wastage rates [58].
Finally, according to the study model of Schmitt et al. [43], in which a multiple regression was applied—with the following as regressor variables: intention to reduce food wastage, food purchasing planning routines in households, shopping routines for on-sale food, understanding of food label information, leftover or uneaten food management, and taking actions to prevent food wastage—the same relationships between several of these independent variables and the economic value of waste, the dependent variable, have been proposed for Peru in order to compare both behaviors, since both countries took different actions to combat the pandemic and also present cultural differences [51,52]. These relationships are shown in Figure 1. The proposed hypotheses are as follows:
Hypothesis 1 (H1).
The intention to reduce food wastage in households is positively related to lower economic values of food waste.
Hypothesis 2 (H2).
Proper food purchasing planning routines reduces the economic value of food waste for households.
Hypothesis 3 (H3).
Shopping routines for on-sale food items are positively related to reducing the economic value of food waste for households.
Hypothesis 4 (H4).
Proper understanding of food label information reduces the economic value of food waste for households.
Hypothesis 5 (H5).
Leftover or uneaten food management is positively related to reducing the economic value of food waste for households.
Hypothesis 6 (H6).
Taking actions to prevent food wastage reduces the economic value of food waste for households.
Meanwhile, to assess the differences and similarities in food buying and food wasting behaviors in Brazil and Peru during the pandemic, our null hypotheses (H0) specify that there are no differences between Peru and Brazil in terms of attraction to sales and promotions, food wastage prevention activities, taking preventive actions, understanding label information, intention to reduce food wastage, and managing leftovers and uneaten food. Our alternative hypotheses are as follows:
Hypothesis 7 (H7).
There are differences in the intentions to reduce food wastage between both countries.
Hypothesis 8 (H8).
There are differences in food purchasing planning routines between both countries.
Hypothesis 9 (H9).
There are differences in shopping routines for on-sale food items between both countries.
Hypothesis 10 (H10).
There are differences regarding the understanding of food labels between both countries.
Hypothesis 11 (H11).
There are differences in the management of leftovers and uneaten food between both countries.
Hypothesis 12 (H12).
There are differences in the food waste reduction activities performed in both countries.
Hypothesis 13 (H13).
There are differences in the average food expenses in both countries.

3. Materials and Methods

Different studies have quantified food wastage in several ways, for example, based on weight [7,20], composition, caloric value, costs, and waste frequency per type of food [20]. In this study, we decided to adopt a survey-based self-reporting procedure focused on the economic value of household food waste during the COVID-19 pandemic. In these surveys, buying decision-makers calculated the weekly amount associated with their household food waste in local currency, which was then converted to USD for comparison purposes. The economic value of food waste was considered relevant because, in this context, people experienced restrictions and uncertainty [43,70], as referenced in previous studies [32,34,41,43], especially in the studies conducted within the COVID-19 context [7,43], in addition to adapting the instrument used in those studies [43].

3.1. Sample Collection

This study focused on households in Peru and Brazil, during the COVID-19 pandemic outbreak crisis, seeking to compare both food consumption and food wastage patterns in households subjected to quarantine in the COVID-19 pandemic. The population under study comprised people in charge of grocery shopping for their household. The sample was voluntary, with subjects freely deciding to complete the survey [74]. Therefore, we used convenience sampling from both countries during the socioeconomic crisis caused by the pandemic. All subjects filled their surveys anonymously and provided their consent to the use of the information therein for the purposes of this study. Data collection was conducted between 20 and 30 May 2020, through the application of a self-administered questionnaire, which was made available to respondents through Google Forms and posted on social networks, such as LinkedIn, Facebook, and WhatsApp [43], to avoid physical contact between people, respecting the recommended sanitary confinement and social distancing measures imposed because of COVID-19. In Brazil, the survey was answered by 489 people, 458 of whom were considered valid [43], while in Peru, the survey was answered by 454 people, 418 of whom were considered valid. The online procedure yielded a total of 876 usable questionnaires. The specific constraints of this study were associated with the data collection method and the representativeness of the sample related to the population [43,74].

3.2. Questionnaire

To obtain information on household grocery shopping behaviors related to food buying and food wastage habits in households, we used an instrument based on a questionnaire that had already been employed in previous research studies [7,32,33,34,43]. This questionnaire was adapted to the Brazilian [43] and Peruvian contexts, from the previous studies conducted in North Africa by Jribi et al. [7], Abouabdillah et al. [32], and Saasi et al. [34]. In each case, the original instrument was translated from English to Brazilian Portuguese and Peruvian Spanish by a native co-author and reviewed by another native speaker. The questionnaire comprised 60 multiple-choice questions, divided into seven categories [43]: (1) buying and spending behaviors; (2) understanding of food labels and information; (3) attitudes toward food wastage; (4) food waste characterization; (5) economic value of food waste; (6) information needed to reduce wastage and willingness to do so; and (7) sociodemographic characteristics of the respondents. All questions were multiple-choice questions, Likert-scale questions, or dichotomous questions [43].

3.3. Data Analysis

The data collected were assessed through descriptive and inferential statistics using the IBM SPSS software, release 27. A descriptive analysis was first performed to explain the sociodemographic profile of the sample from each country, and then frequency percentages were used for each category variables. Then, a multiple regression analysis was applied separately for each country to verify the associations of the variables identified in the model [43], as defined by the relationship between household food buying and food wastage behaviors and the economic value of food waste. The resulting relationships are depicted in Figure 1; for the multiple regression, a statistical significance at p-value < 0.05 was considered. Next, a joint inferential analysis was conducted to identify the behavioral similarities or differences through a hypothesis test, using the Mann–Whitney U test. For these purposes, our evaluation criteria were set at a p-value < 0.50. To verify the reliability of our constructs, only Cronbach’s alpha values over 0.60 were accepted [43,75].

4. Results

The data provided by the respondents were assessed to find significant similarities or differences in the food consumption and food-wastage behaviors reported by Peruvian and Brazilian households.

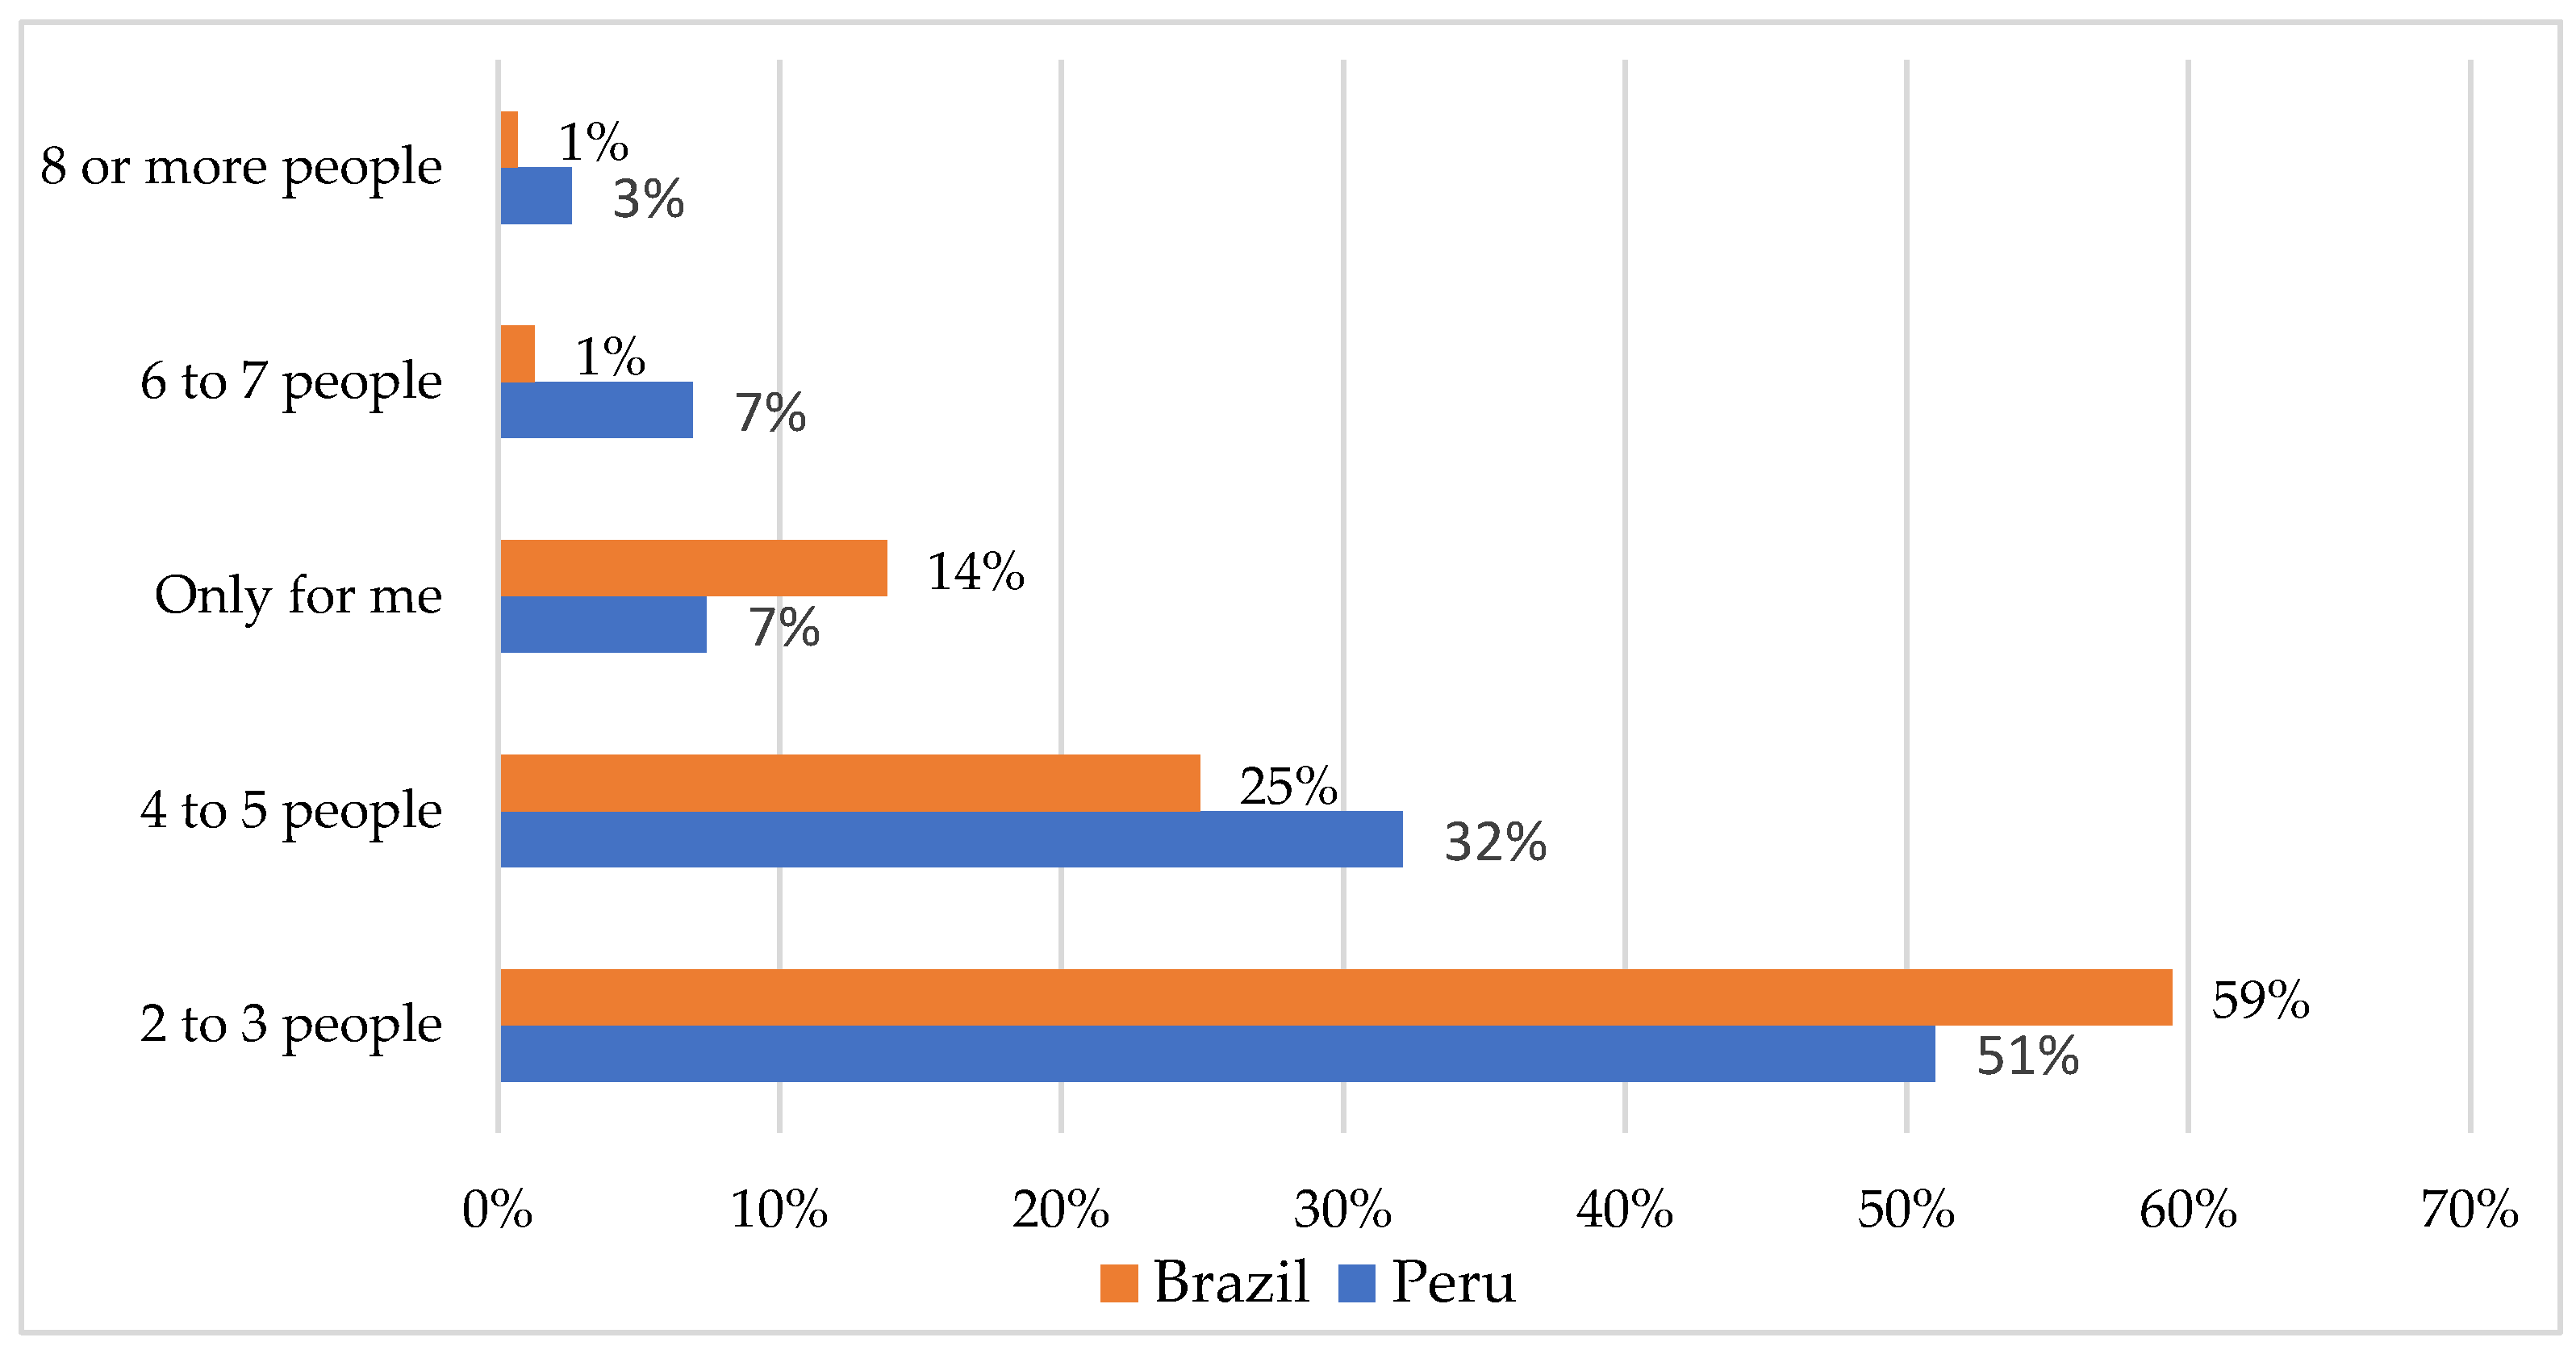
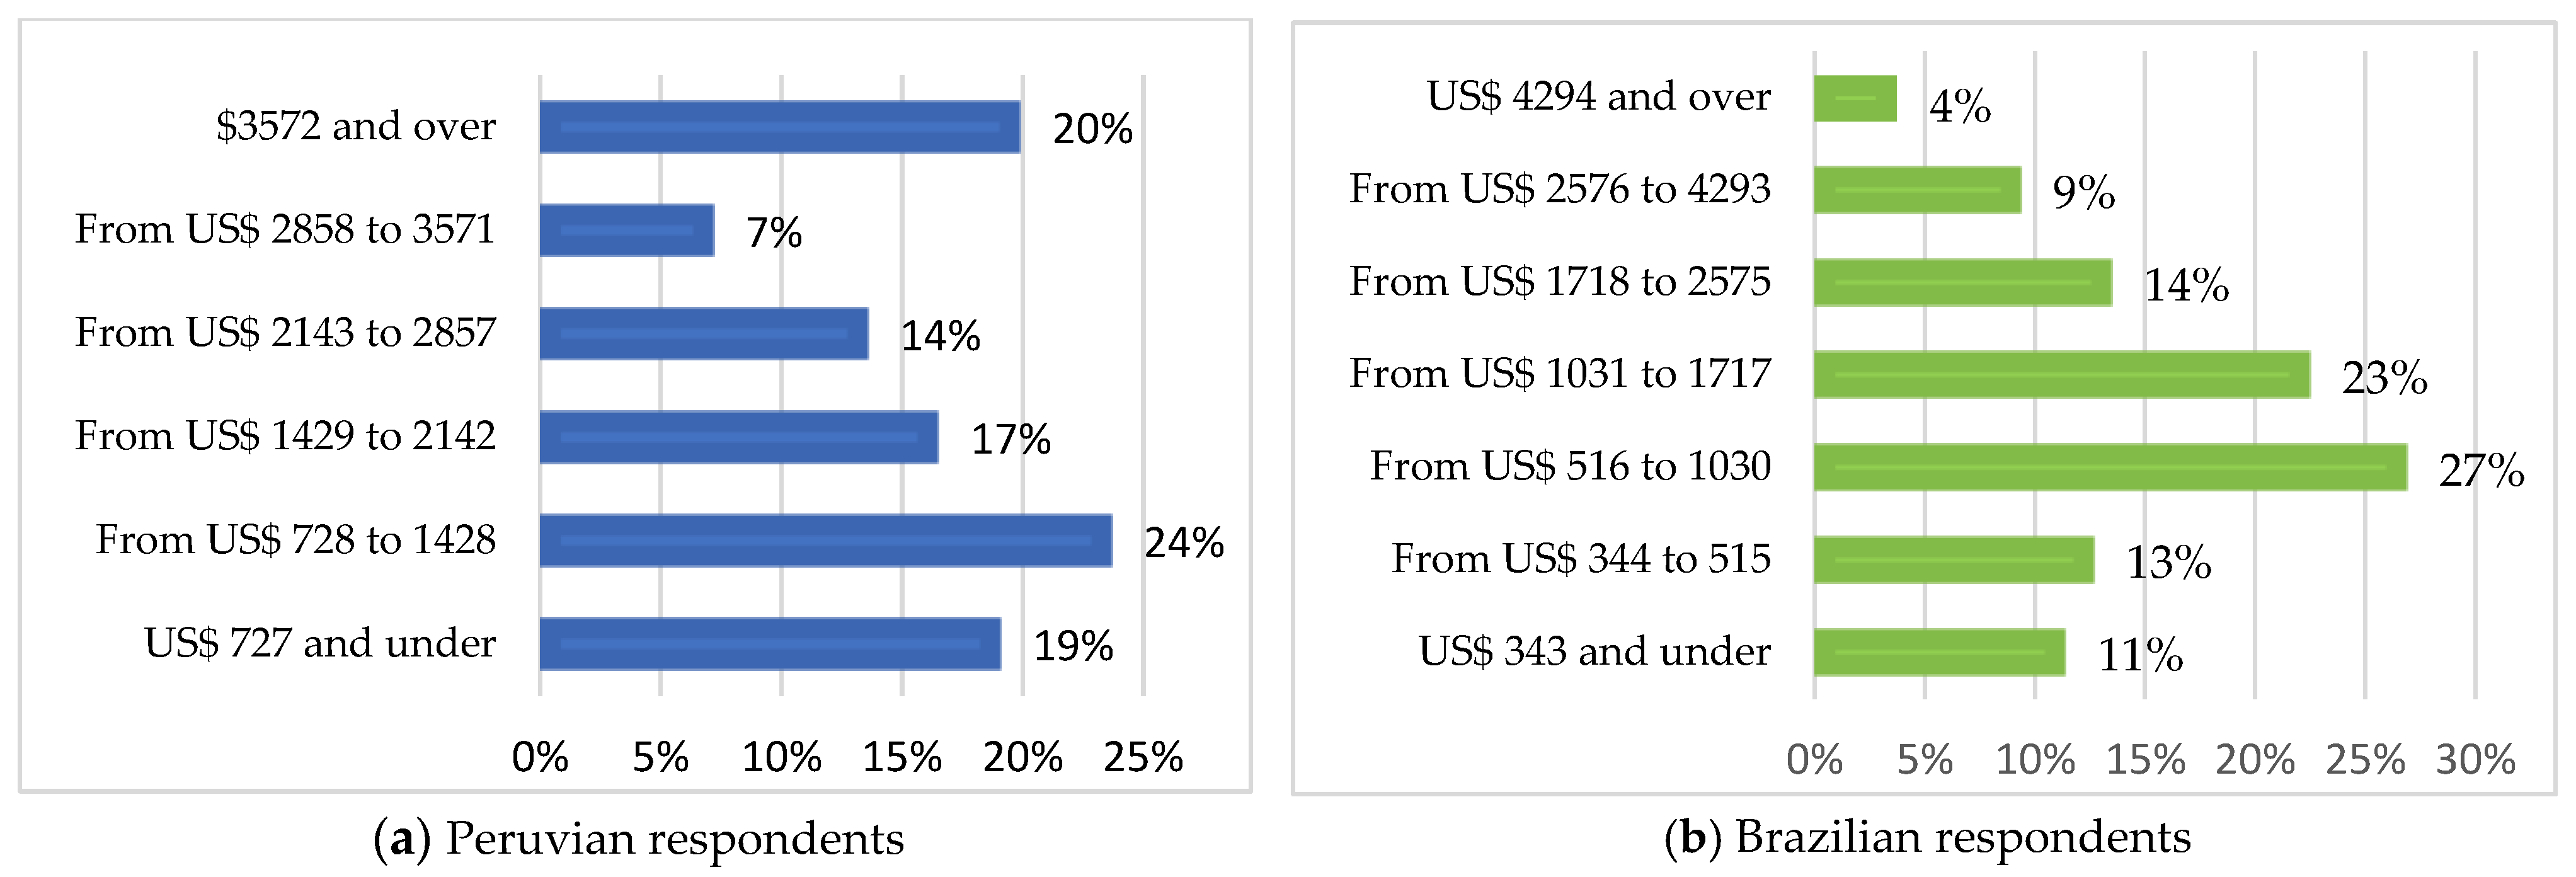
4.1. Sociodemographic Characteristics of the Respondents

A descriptive analysis was conducted to identify the profile of the participants who answered the questionnaire in both countries. Table 1 lists the frequency percentages for each response, detailing the sociodemographic characteristics of the respondents. Because of the type of sampling used in this study, the sample was not balanced by gender, resulting in most respondents being female in both countries (73.5% in Peru and 84.9% in Brazil).
Regarding age distribution, in Peru 34.0% of the respondents were in the 31–40 age group and 24.9% were in the 41–50 age group. In Brazil, 25.5% were in the 51–60 age group and 24.0% were in the 31–40 age group. Both countries reported a similar percentage of respondents in the 20–30 age group (15.8% for Peru and 16.8% for Brazil). The age group with the least number of responses was the over-60-years-old age group, with only 6.5% for Peru and 11.4% for Brazil.
Most of the respondents reported university/college as their academic level, representing 55.0% of all Peruvian subjects and 55.9% of Brazilian. Likewise, a significant percentage reported having achieved a graduate level, with 22.2% of Peruvians and 17.2% of Brazilians claiming to hold a master’s degree. In addition, 14.8% of Brazilians hold a PhD.
Regarding current occupation, a similar number of respondents from both countries fell in the “full-time salaried employee” category (39.2% Peru and 38.4% Brazil). However, 19.1%, of Peruvian and 16.2% of Brazilian respondents identified themselves as “self-employed”, thus representing a slight difference between both countries. Furthermore, 15.1% of Brazilian respondents were “retired/pensioner”, while this category only covered 2.6% of all Peruvian respondents.
Figure 2 depicts the answers for the number of household members for whom the respondent usually buys food. Most respondents buy food for 2–3 people (51.0% in Peru and 59.4% in Brazil), but another significant group is that of 4–5 household members (32.1% in Peru and 24. 9% in Brazil).
In terms of the place of residence of the respondents, the results revealed the following: (1) For Peru, a country with a population of 32,620,000 as of 2020 [76], 92.8% of the respondents live in Lima, the capital city that concentrates 32.5% of the total population of the country. (2) For Brazil, a country with a population of 211,755,692 as of 2020 [77], 64.63% of the respondents live in the major cities of the country, among which 26.42% live in Rio de Janeiro, 23.6% in Sao Paulo, and 19.43% in Santa Catarina.
Regarding monthly income, the survey revealed that 23.7% of the Peruvian respondents earn between S/. 2501 and S/. 5000, followed by 19.9% whose monthly income exceeds S/. 12,500 and 19.1% that earn less than S/. 2500 (Figure 3a). As for Brazil (Figure 3b), 26.9% of the respondents earn a monthly income between R$ 2862 and R$ 5724, followed by 22.5% who earn between R$ 5724 and R$ 9540 and 13.5% who earn between R$ 9540 and R$ 14,310.
Both the Peruvian and Brazilian respondents stated that they plan their grocery shopping, with 65.3% of Peruvians “always planning” and 33.7% “sometimes planning”; meanwhile, 62.2% of Brazilians “always plan” and 36.2% “sometimes plan.” Table 2 breaks down the results for these two most prominent categories for both countries.
In the case of Peru, 57.9% of those who “always plan” and 39.0% of those who “sometimes plan” use shopping lists as a planning instrument. Meanwhile, in Brazil, 51.9% of those who “always plan” and 39.0% of those who “sometimes plan” use shopping lists as a planning instrument.
In terms of shopping method, most respondents favored physically shopping at stores. In fact, 74.4% of Peruvians and 79.3% of Brazilians who “always plan” preferred shopping at stores. Likewise, 83.7% of Peruvians and 82.5% of Brazilians who “sometimes plan” also favored shopping in person.
As for means of payment, 32.2% of Peruvians who “always plan” preferred paying in cash, while 29.3% preferred using debit cards and 26.4% a credit card. As for Brazilians who “always plan”, 44.6% used debit cards, 43.9% used credit cards, and very few people reported paying in cash. Conversely, 34.0% of those Peruvian respondents who “sometimes plan” preferred using debit cards and 30.5% preferred cash payments. As for Brazilians, 45.8% favored credit cards, 44.0% debit cards, and very few people still used cash.
With respect to the groceries bought during the quarantine, two options were significantly prominent: (1) “all the food was consumed; nothing was wasted”, for those who “always plan” (Peru 67.0% and Brazil 54.0%) and for those who “sometimes plan” (Peru 56.0 % and Brazil 49.4%); (2) “part of the food was wasted”, for those who “always plan” (Peru 31.5% and Brazil 45.6%) and those who “sometimes plan” (Peru 41.8% and Brazil 50.0%).
Regarding the reasons for discarding food during the quarantine, two options were also significantly prominent: (1) “cooked in excess”, for those who “always plan” (Peru 67.0% and Brazil 13.0%) and for those who “sometimes plan” (Peru 24.8 % and Brazil 19.3%); (2) “food has been sitting in the refrigerator for too long”, for those who “always plan” (Peru 31.5% and Brazil 22.5%) and those who “sometimes plan” (Peru 41.8% and Brazil 19.3%).

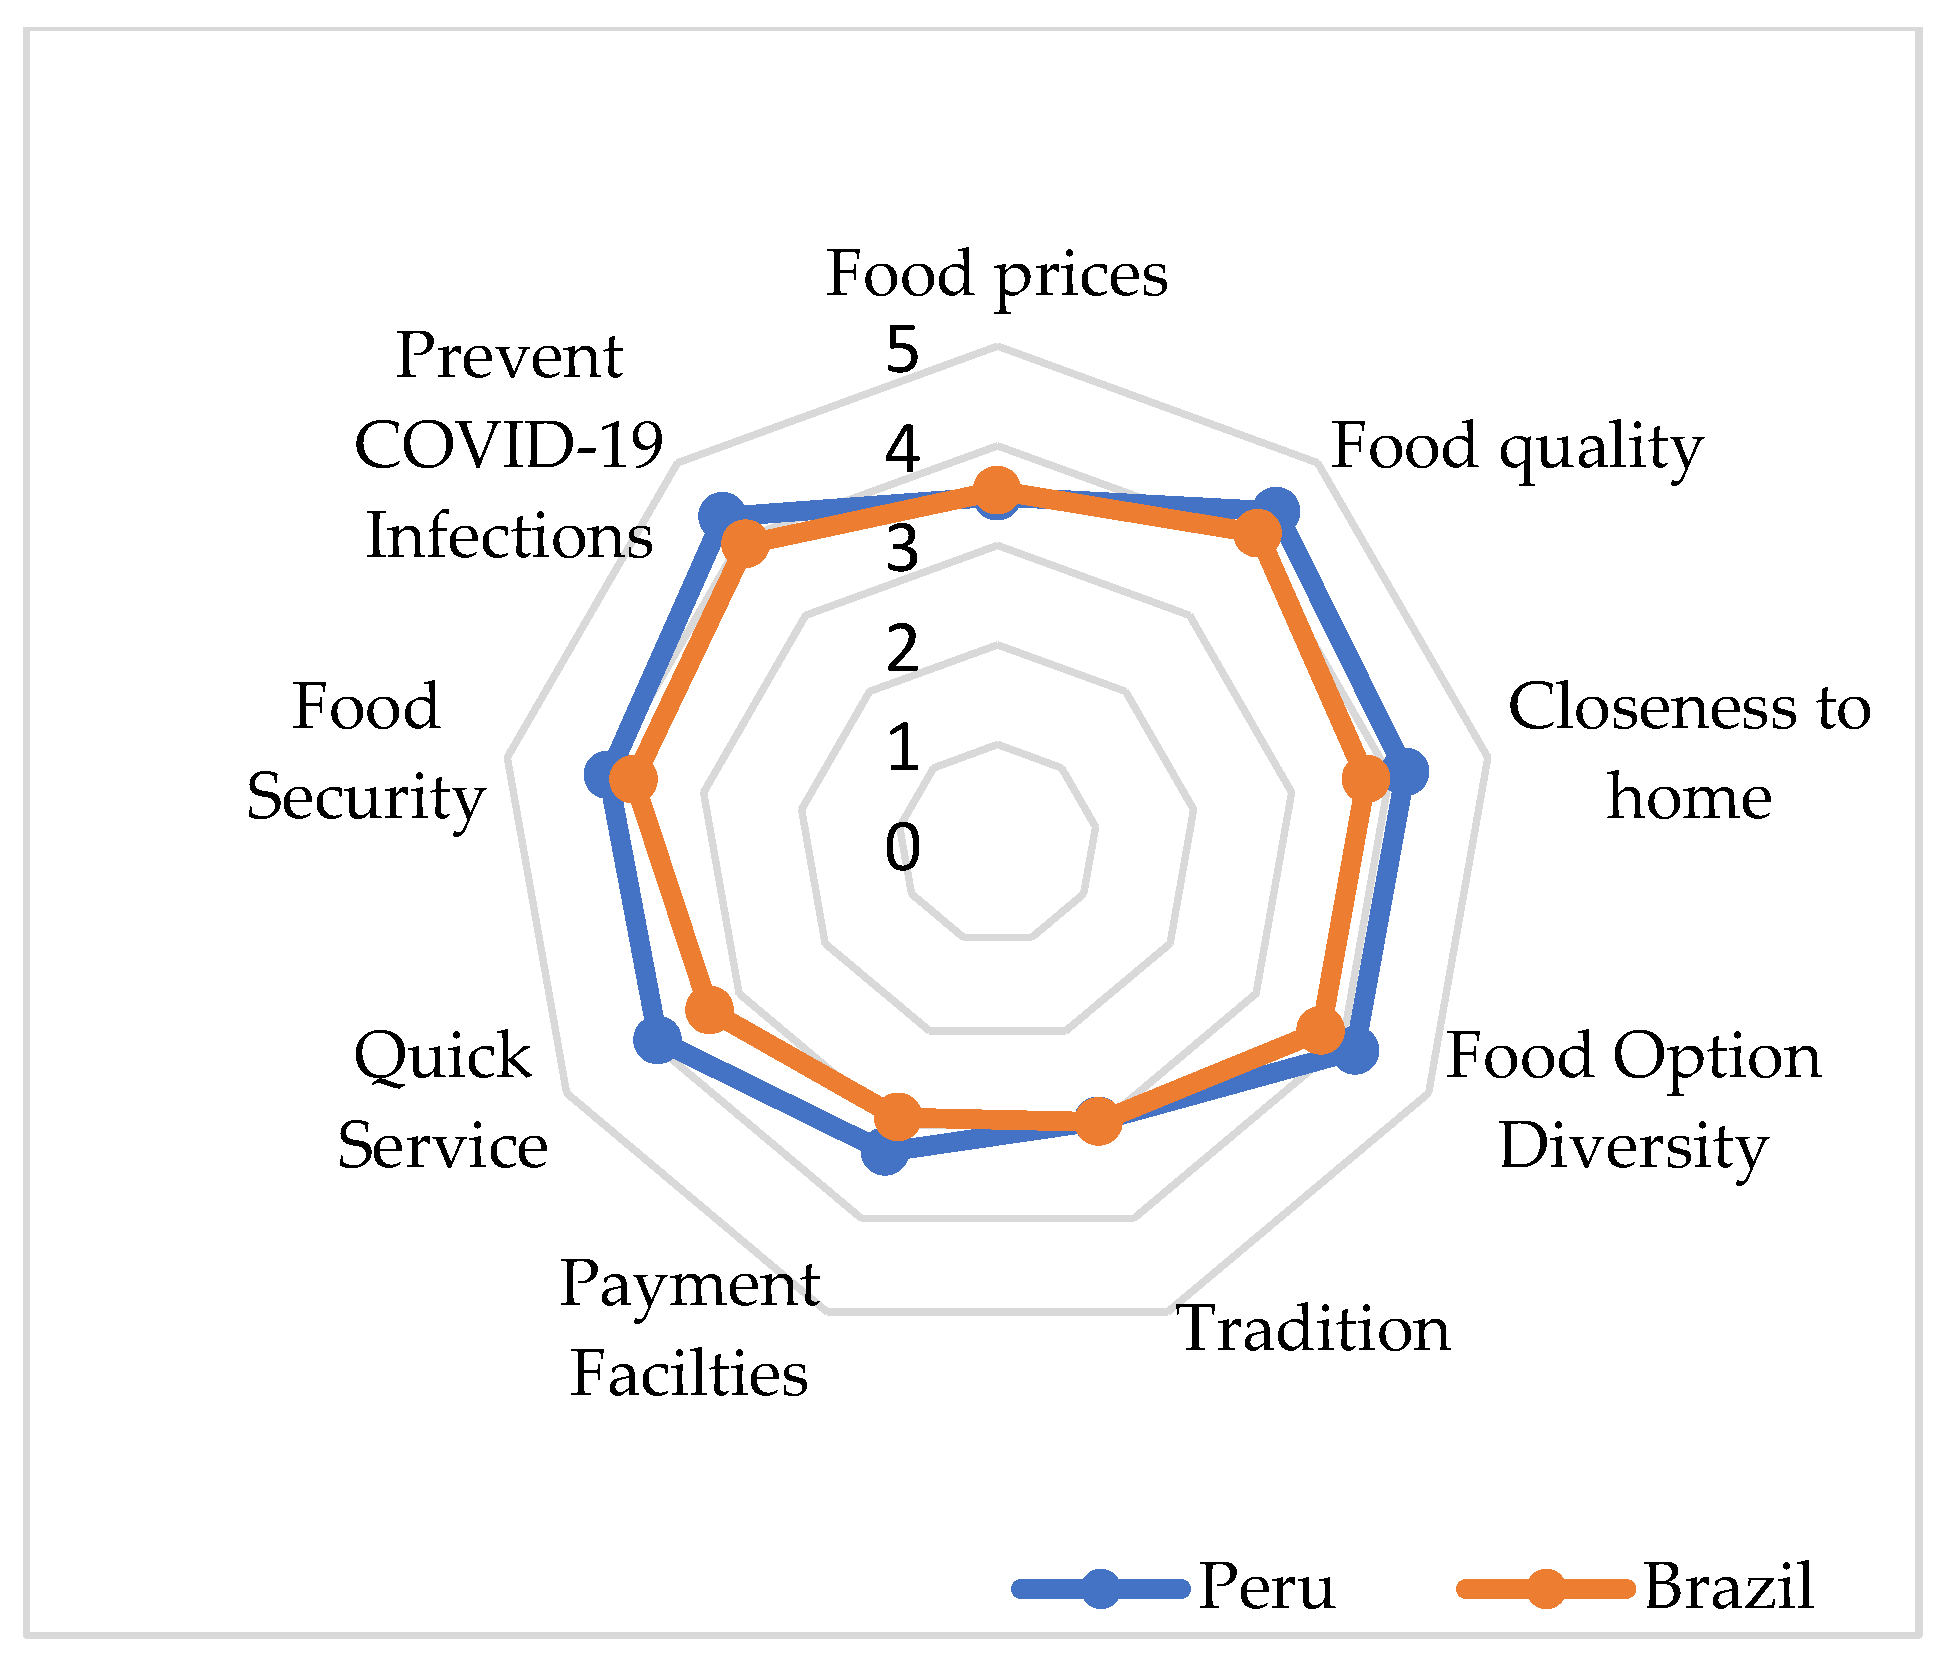
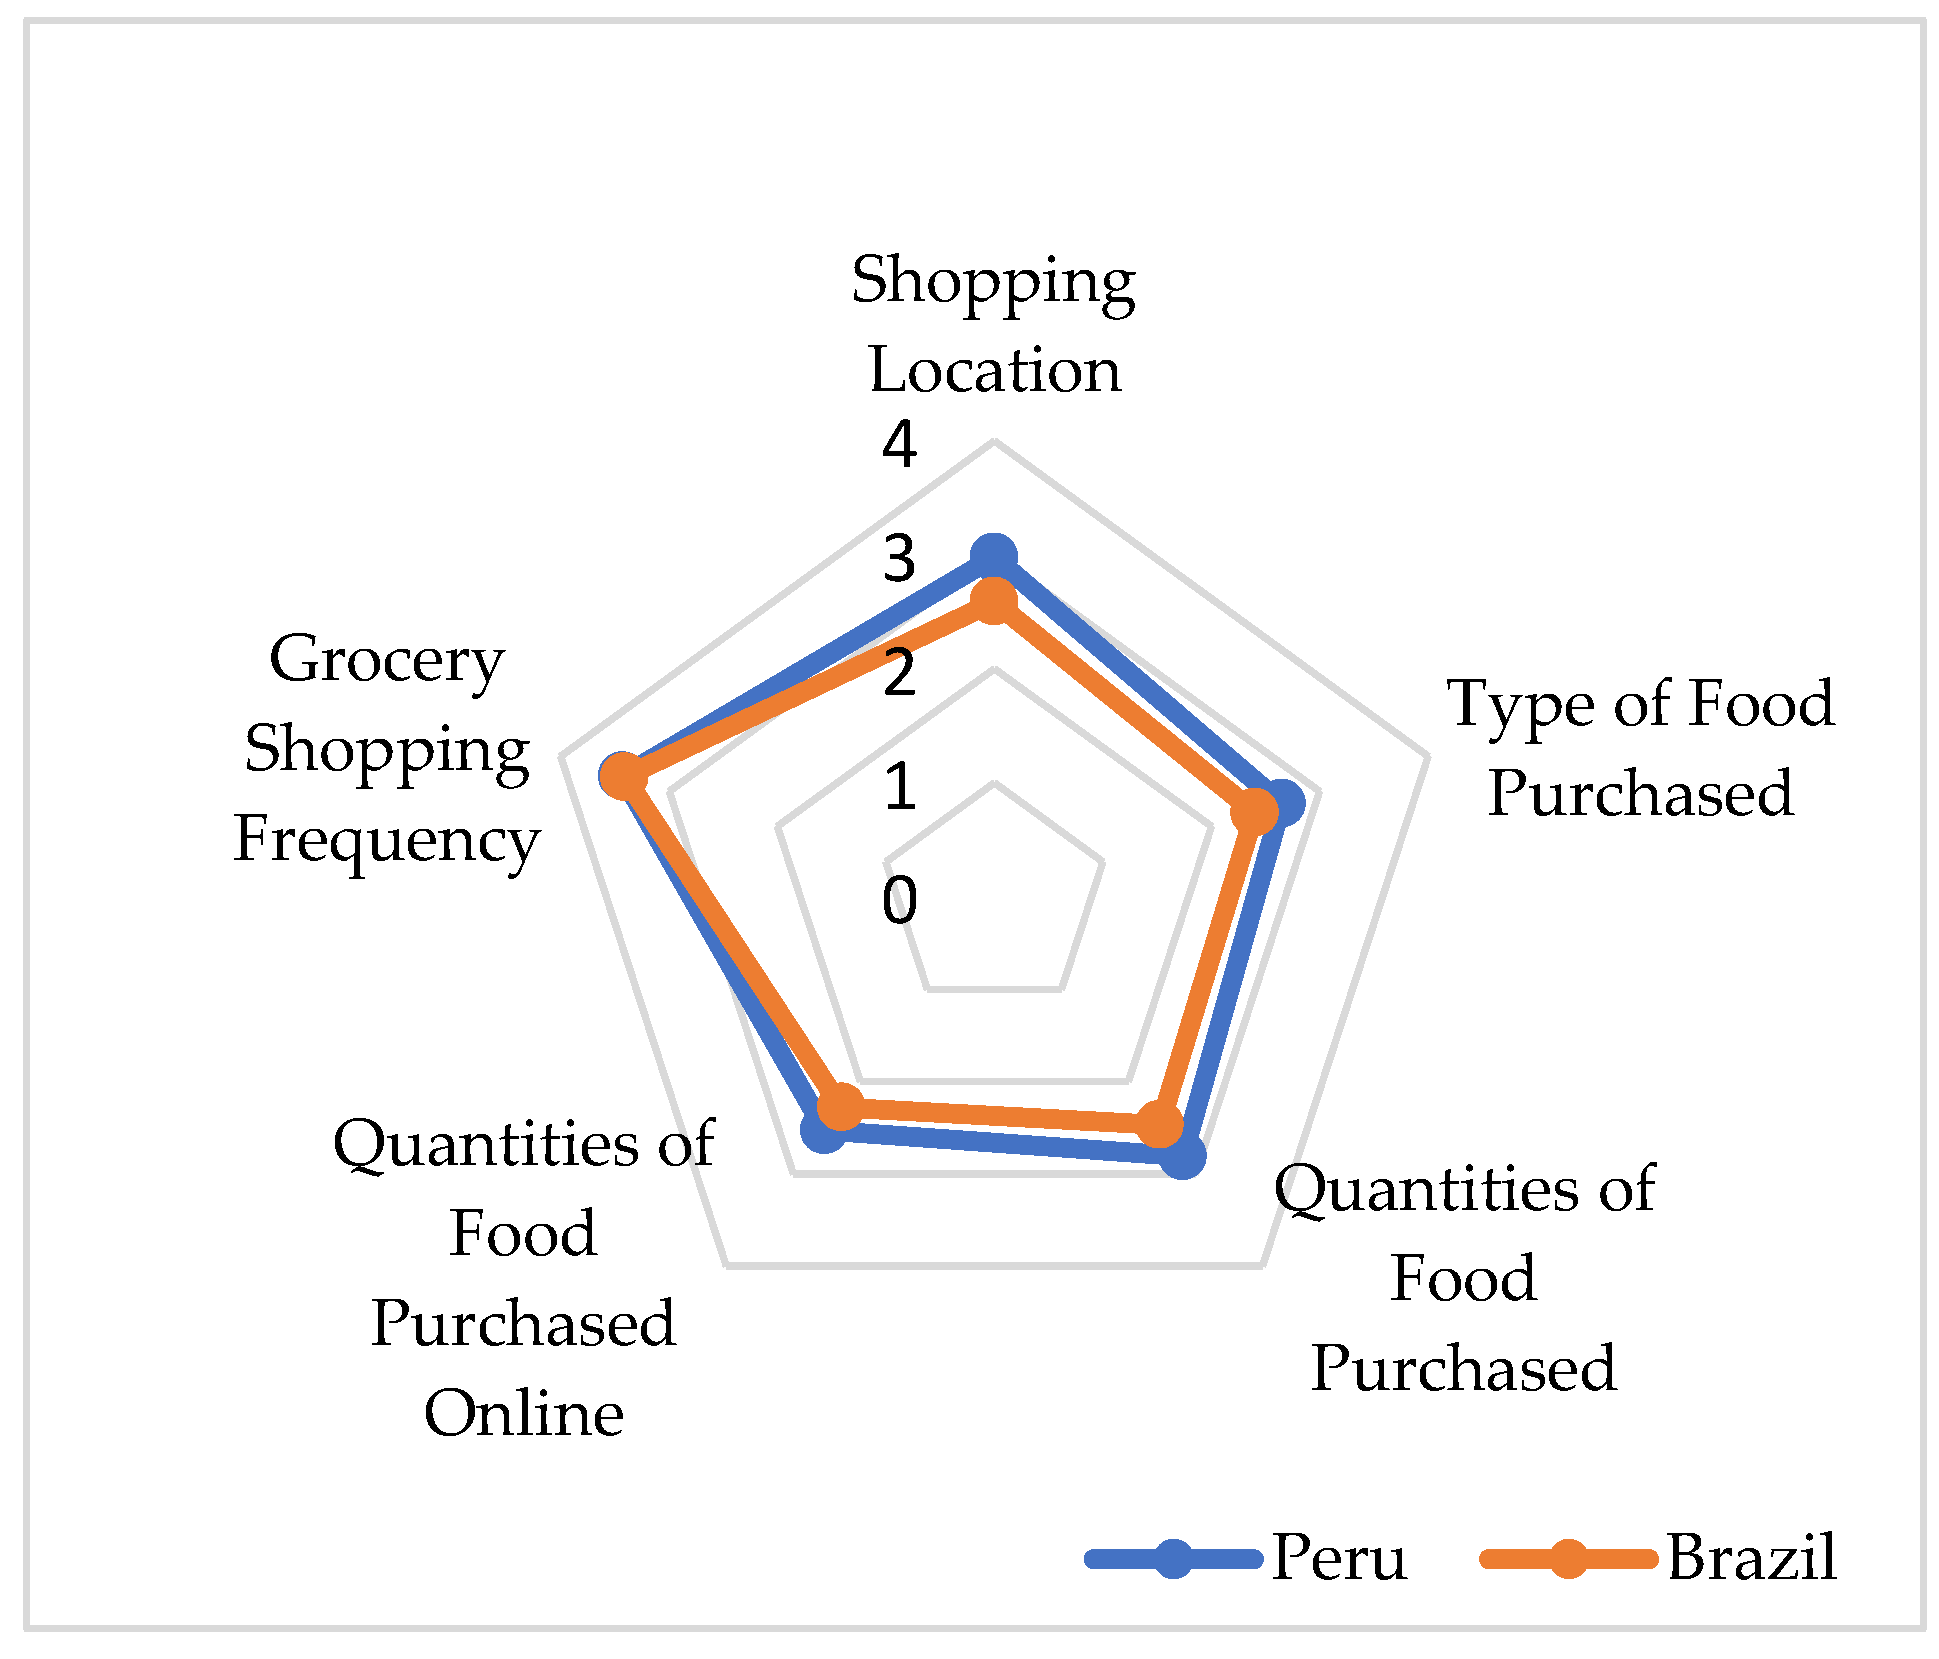
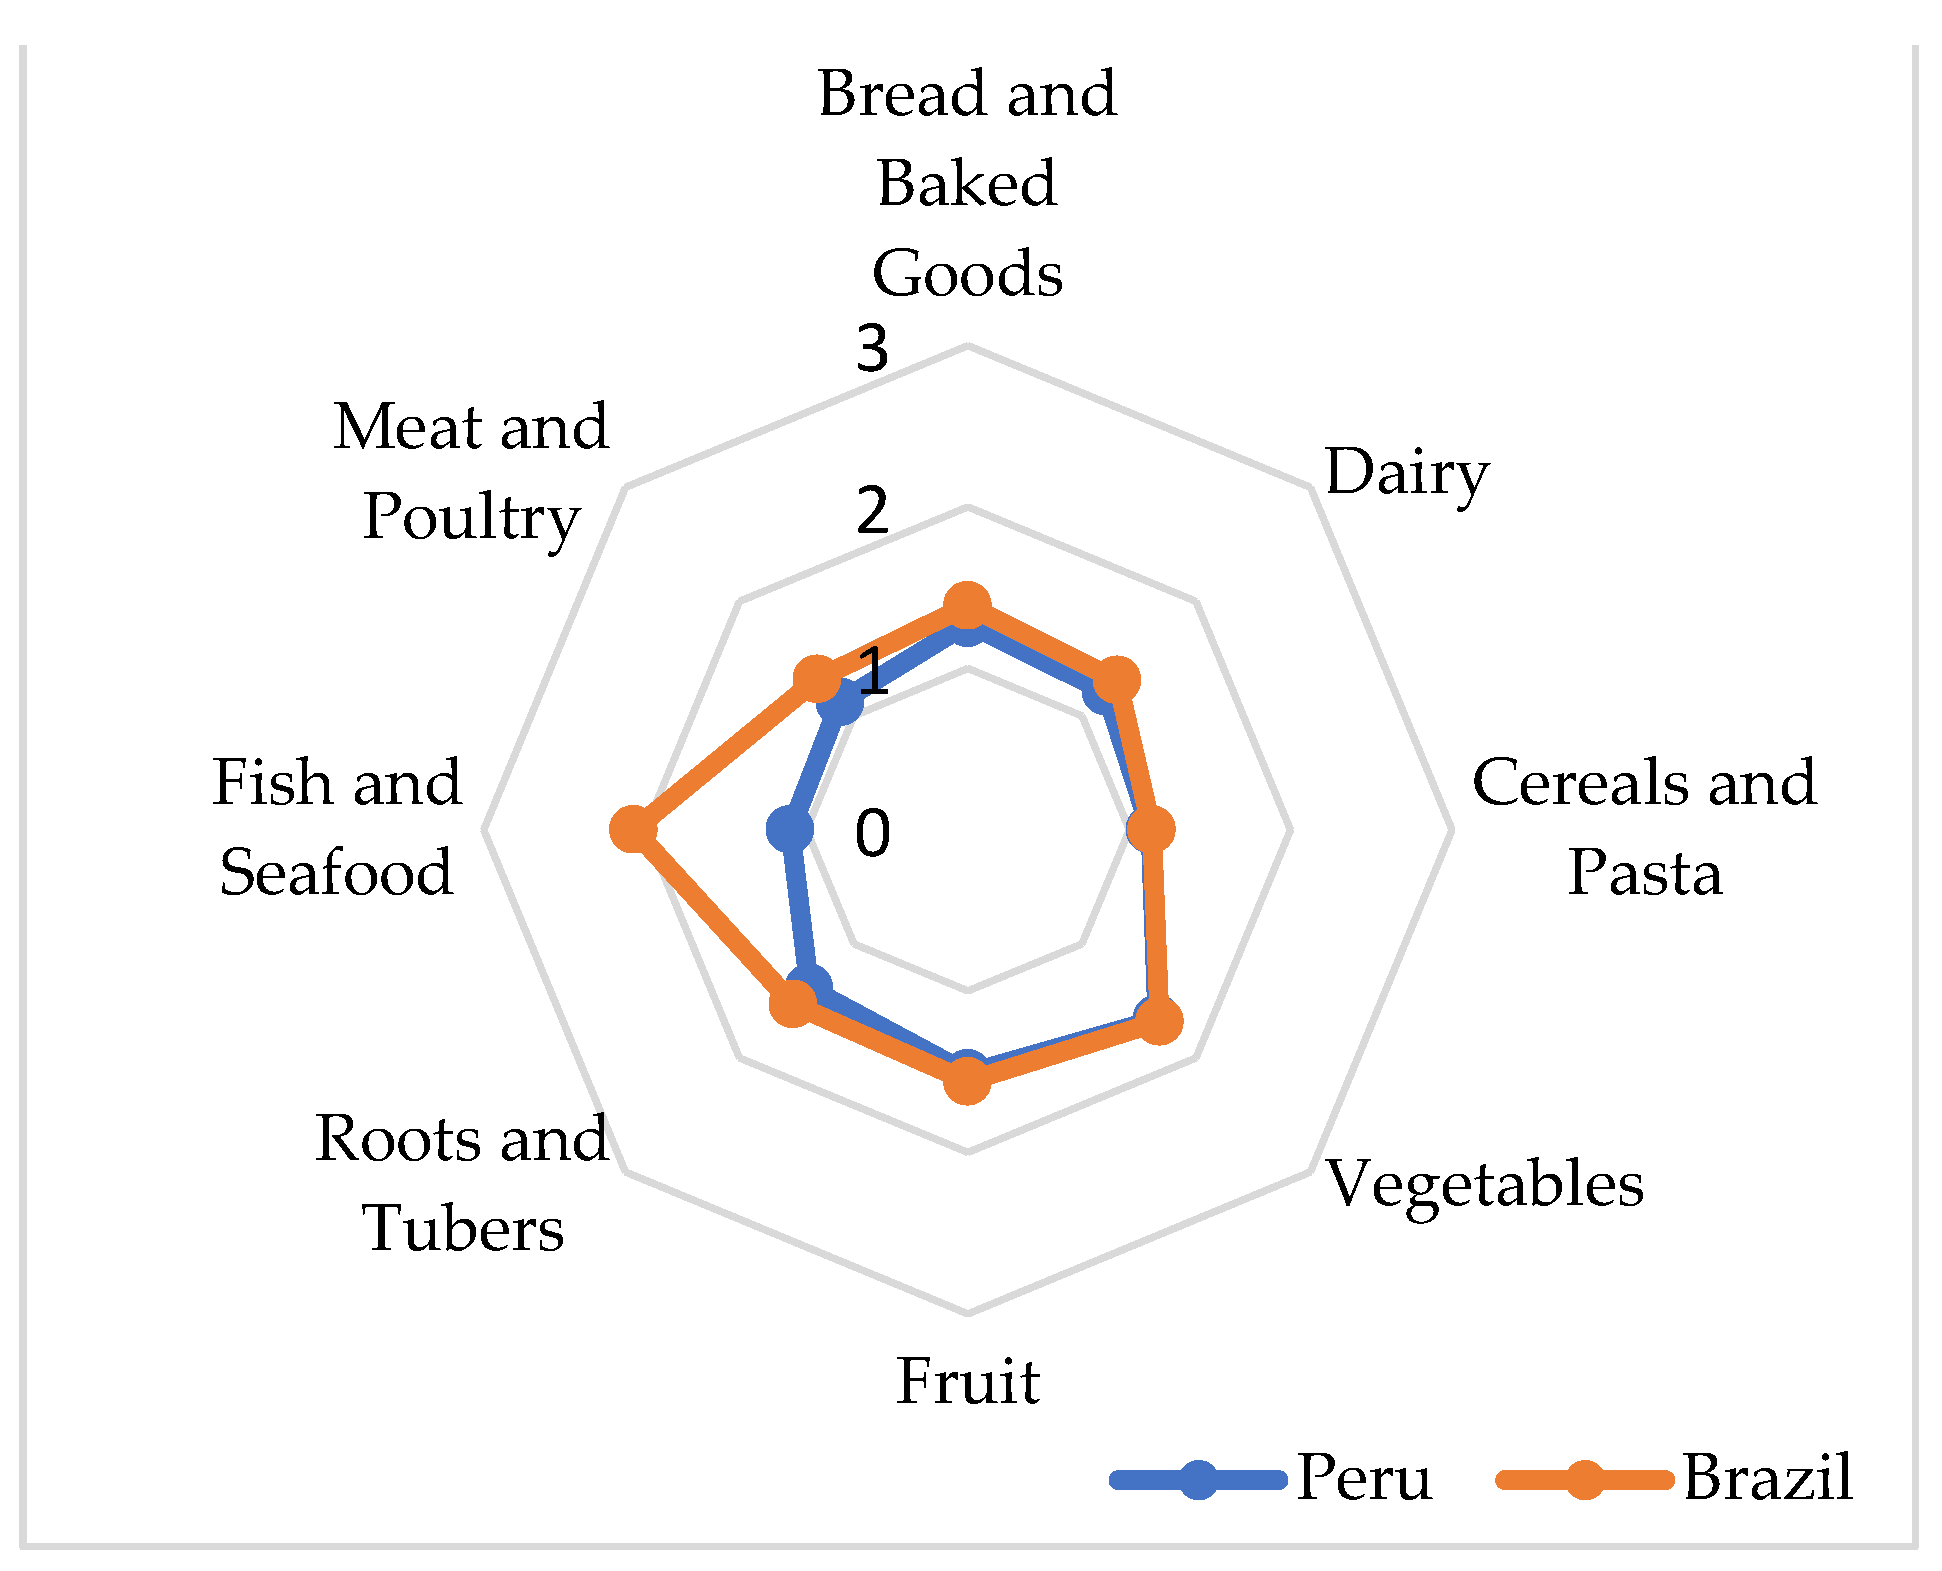
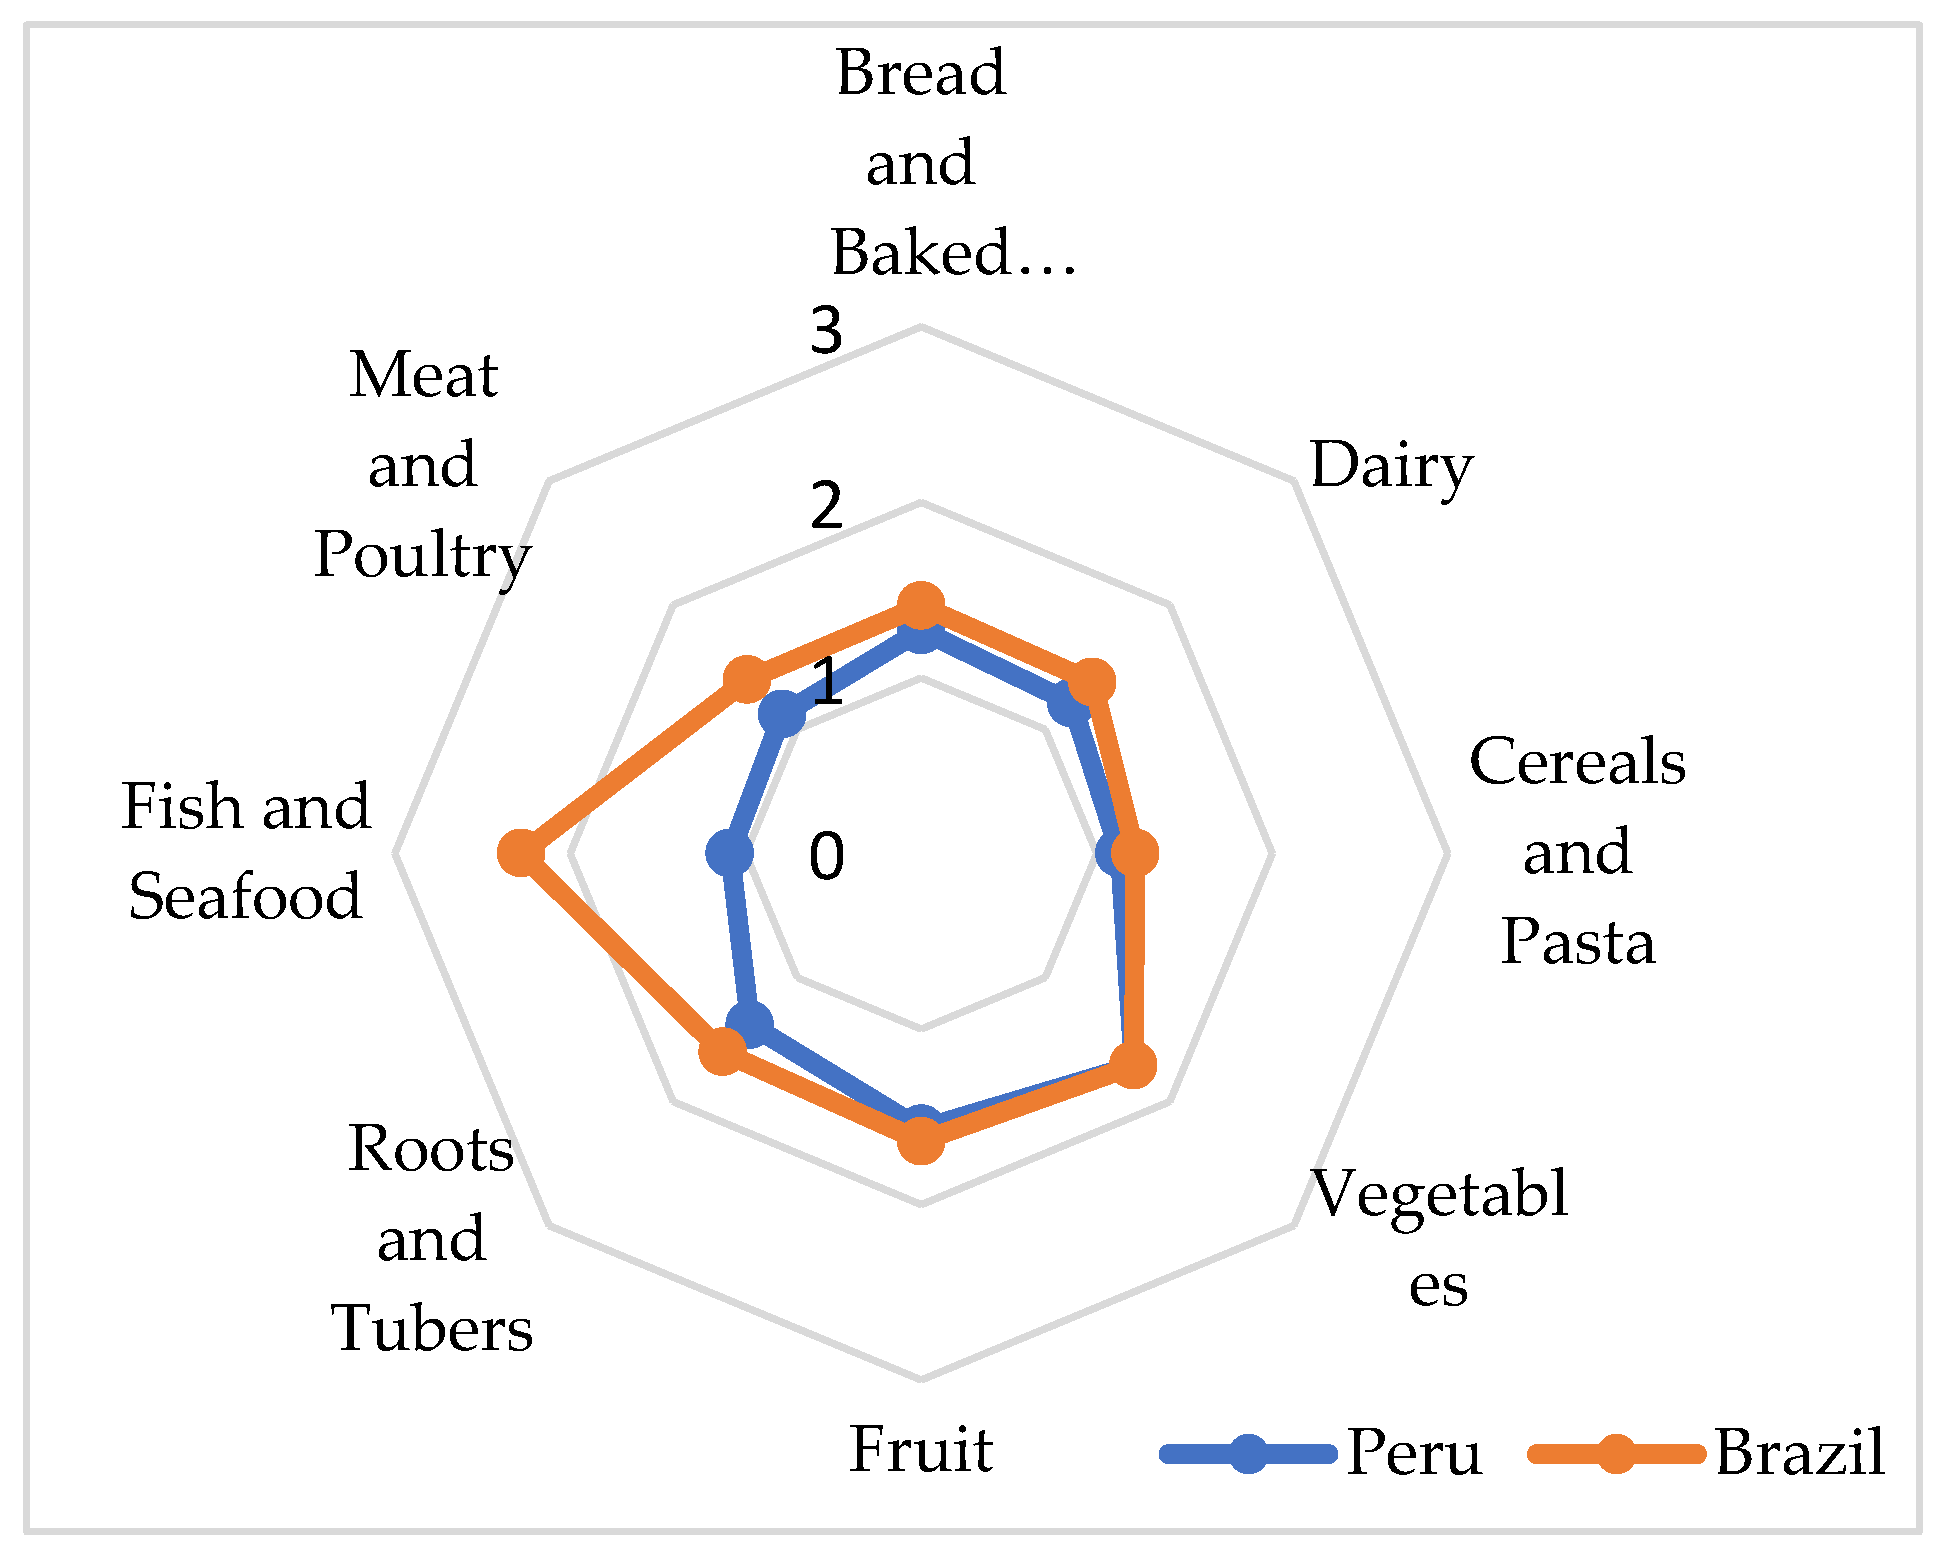
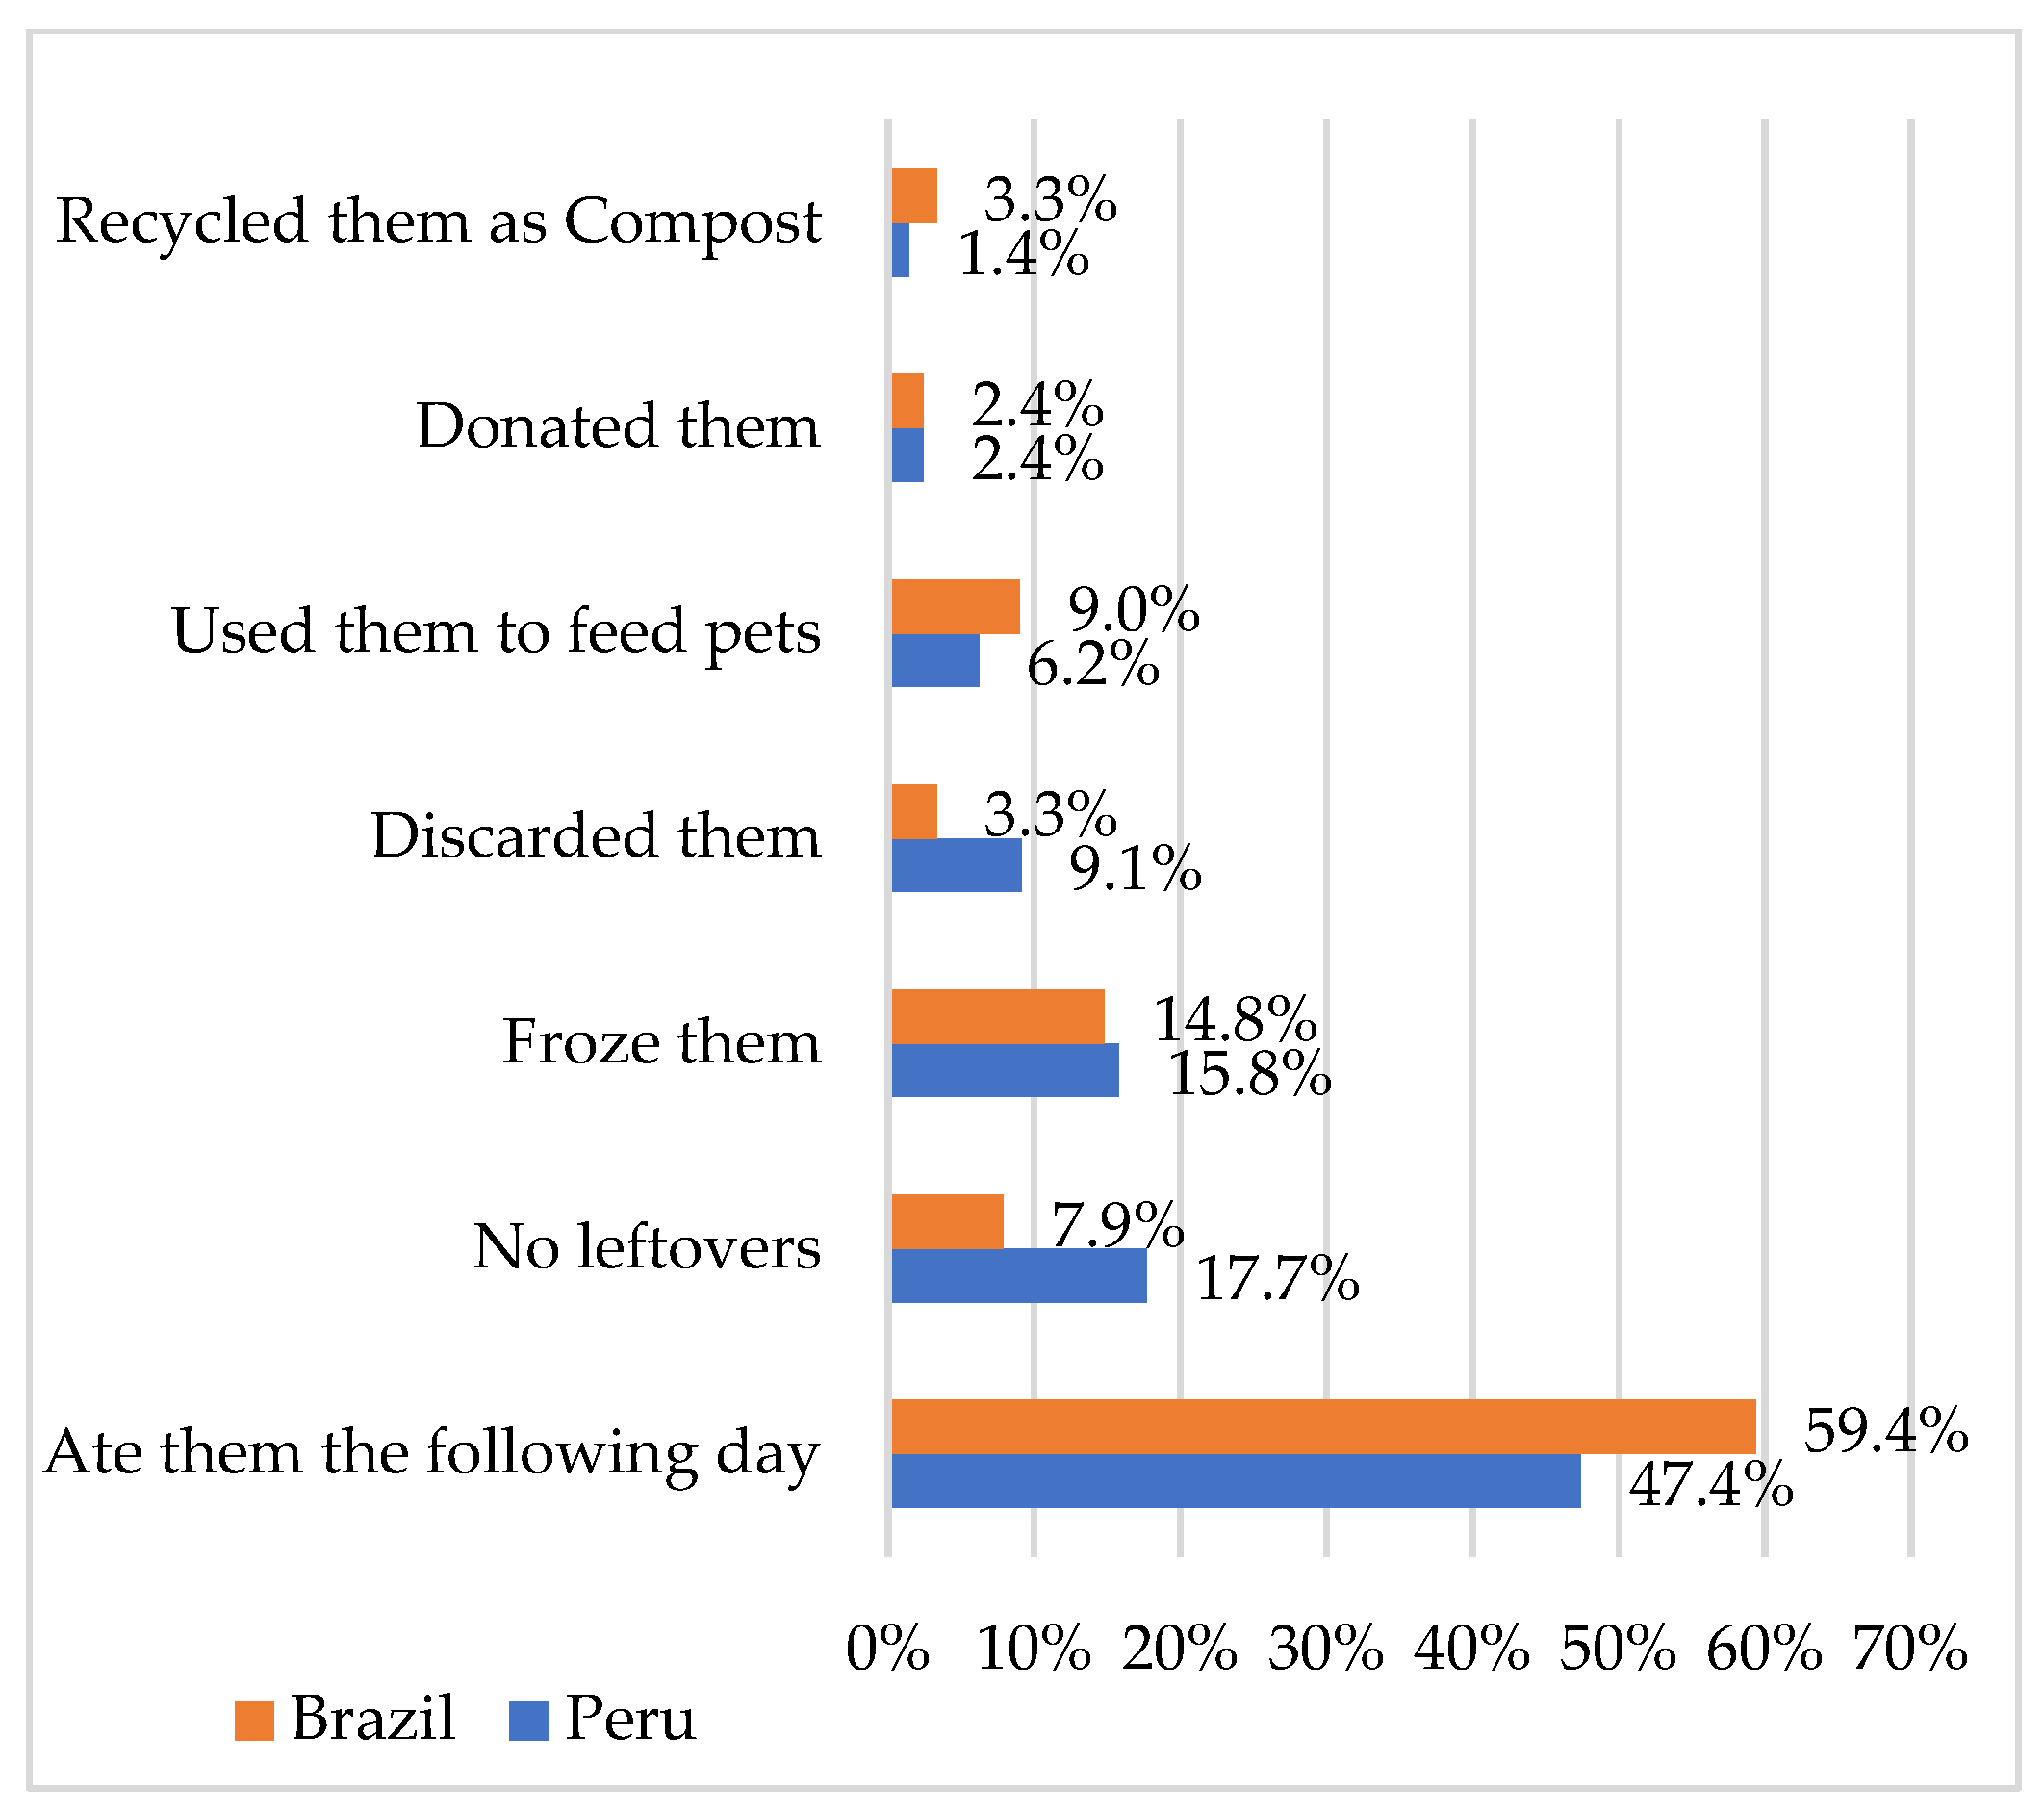
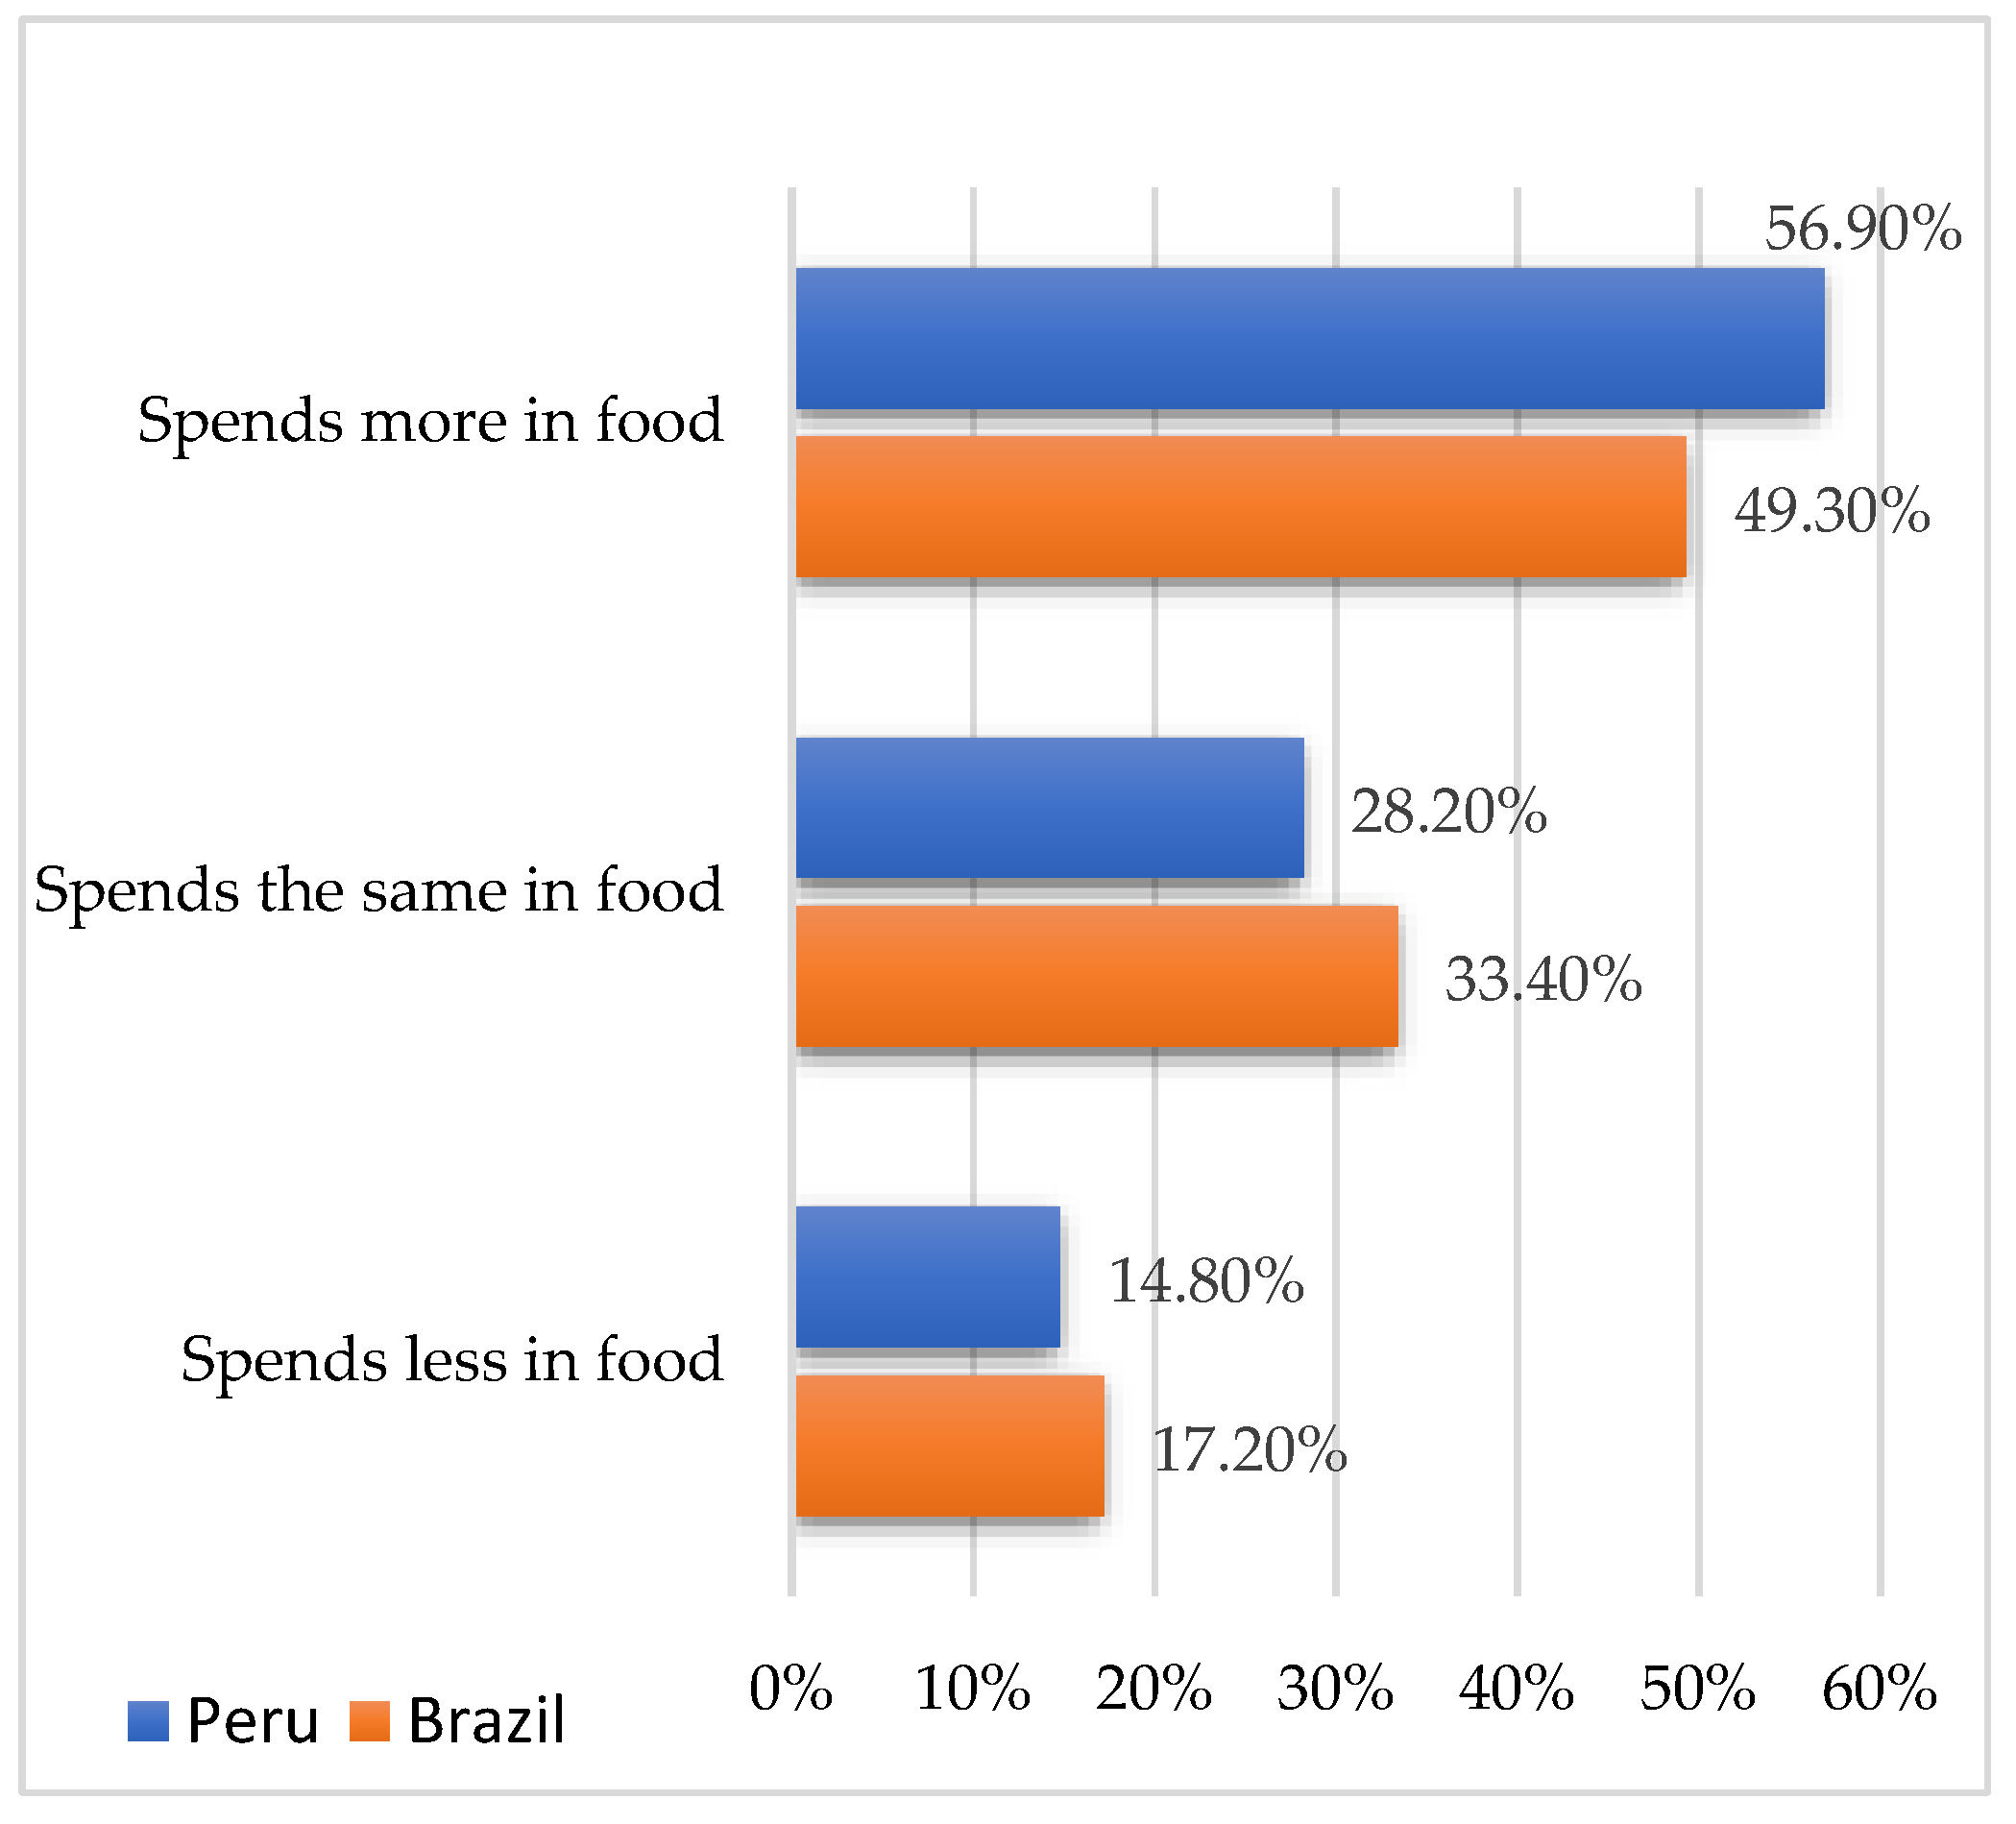
4.2. Behavior Comparisons during the COVID-19 Quarantine

Concerning where and how to shop for groceries, survey respondents were asked the following question: “During the quarantine, how important have the following aspects been when deciding where and how you wanted to shop for groceries?” The scale ranged from 1 = “not important at all” to 5 = “extremely important.” The behavior was similar in both countries (Figure 4), with slight differences in Peru.
As for grocery shopping behavior changes (Figure 5), respondents were asked the following question: “During the quarantine, to what extent have the following aspects changed in the way you buy food?” Here 1 = “not changed at all” and 5 = “changed a lot.” In this question, Peruvian consumers reported more changes than Brazilian consumers.
Regarding the type of food wasted (Figure 6), subjects were asked the following question: “During the quarantine, what type of food have you wasted the most on a weekly basis, and how much?” The behavior in both countries was somewhat similar, but Brazilians did report a significant difference in the “fish and seafood” category.
To measure the amount of food wasted (Figure 7), we asked the following question: “During the quarantine, how much food have you wasted on a weekly basis?” Here, we observed that both countries wasted similar amounts of cereals and pasta, fruits, and vegetables. In all the other options, Brazilians wasted more food than Peruvians, with “fish and seafood” representing the highest wastage of all.
For uneaten food, we included the following question: “During the quarantine, what did you do with your leftovers or the food you didn’t eat during meals?” Most subjects, 60% from Brazil and 46% from Peru, ate the leftovers the next day, with Brazilians adopting this behavior the most, while 17. 7% of Peruvian reported having no leftovers (Figure 8).
For food expenses, the question was, “Compared to other years, are you spending more in food”, and the possible options were “more”, “the same”, or “less” (Figure 9). Most respondents from both countries reported spending more on food during the quarantine, 56.9% of Peruvians and 49.3% of Brazilians.

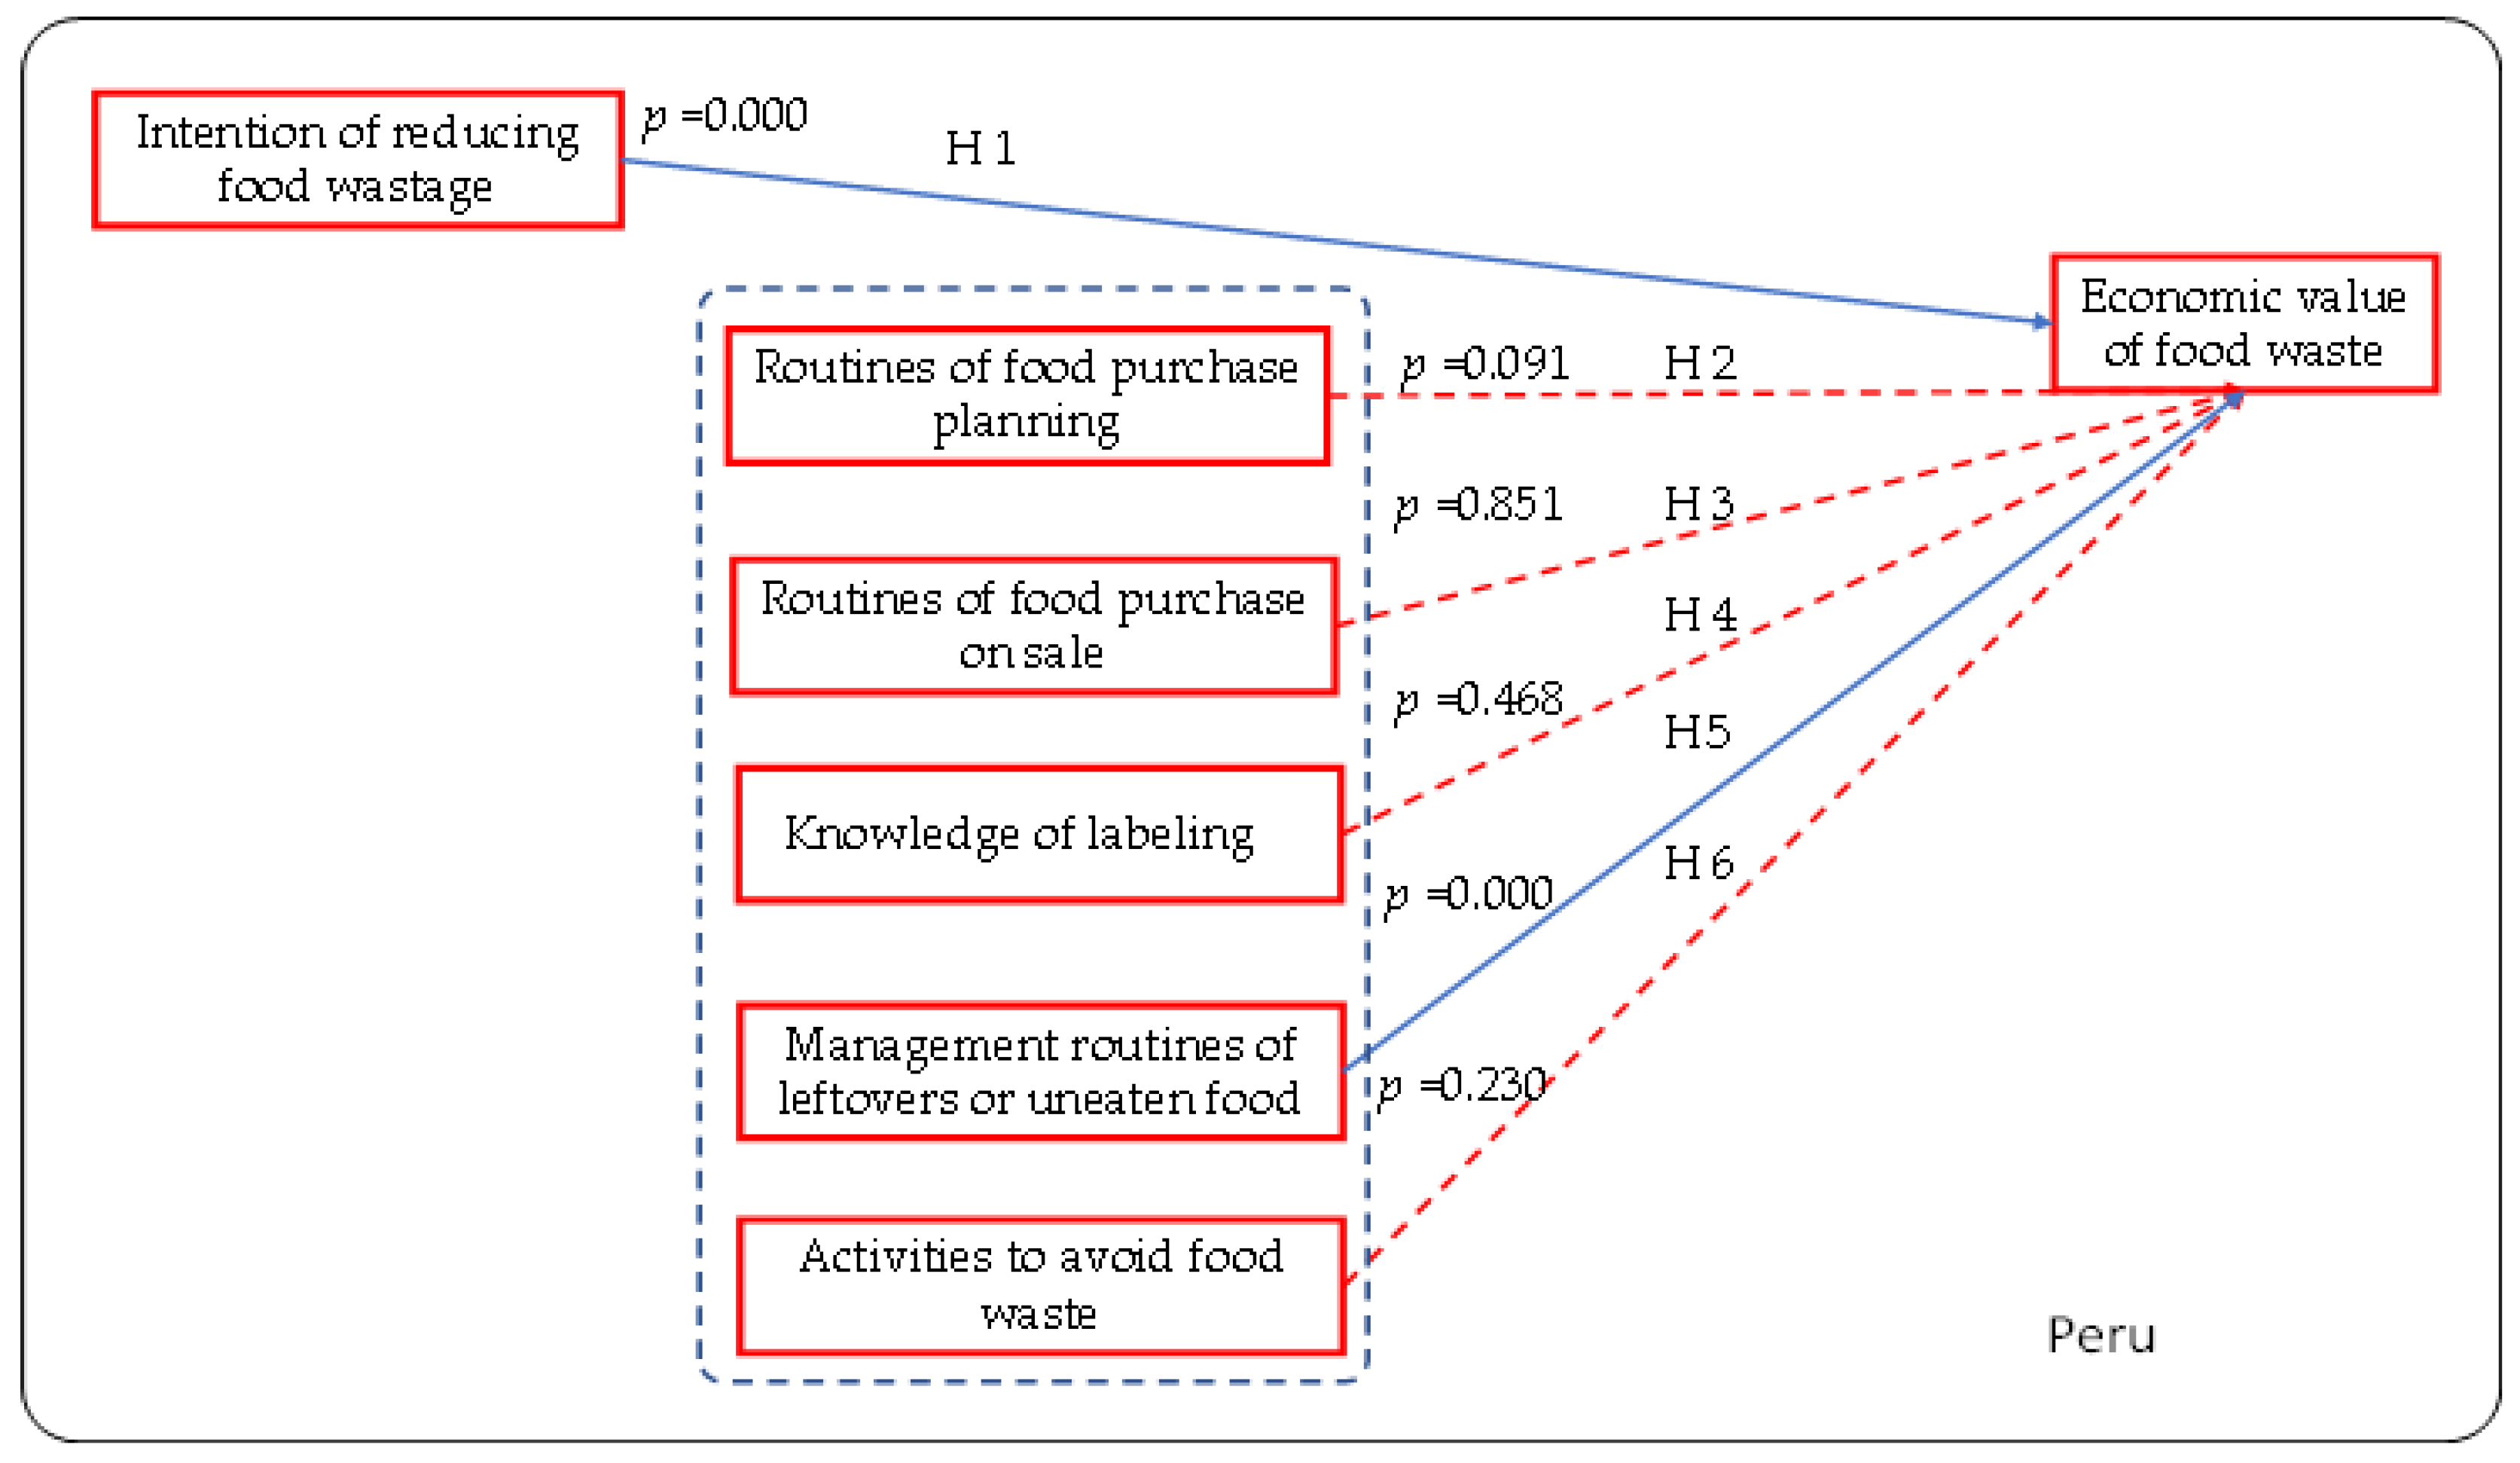
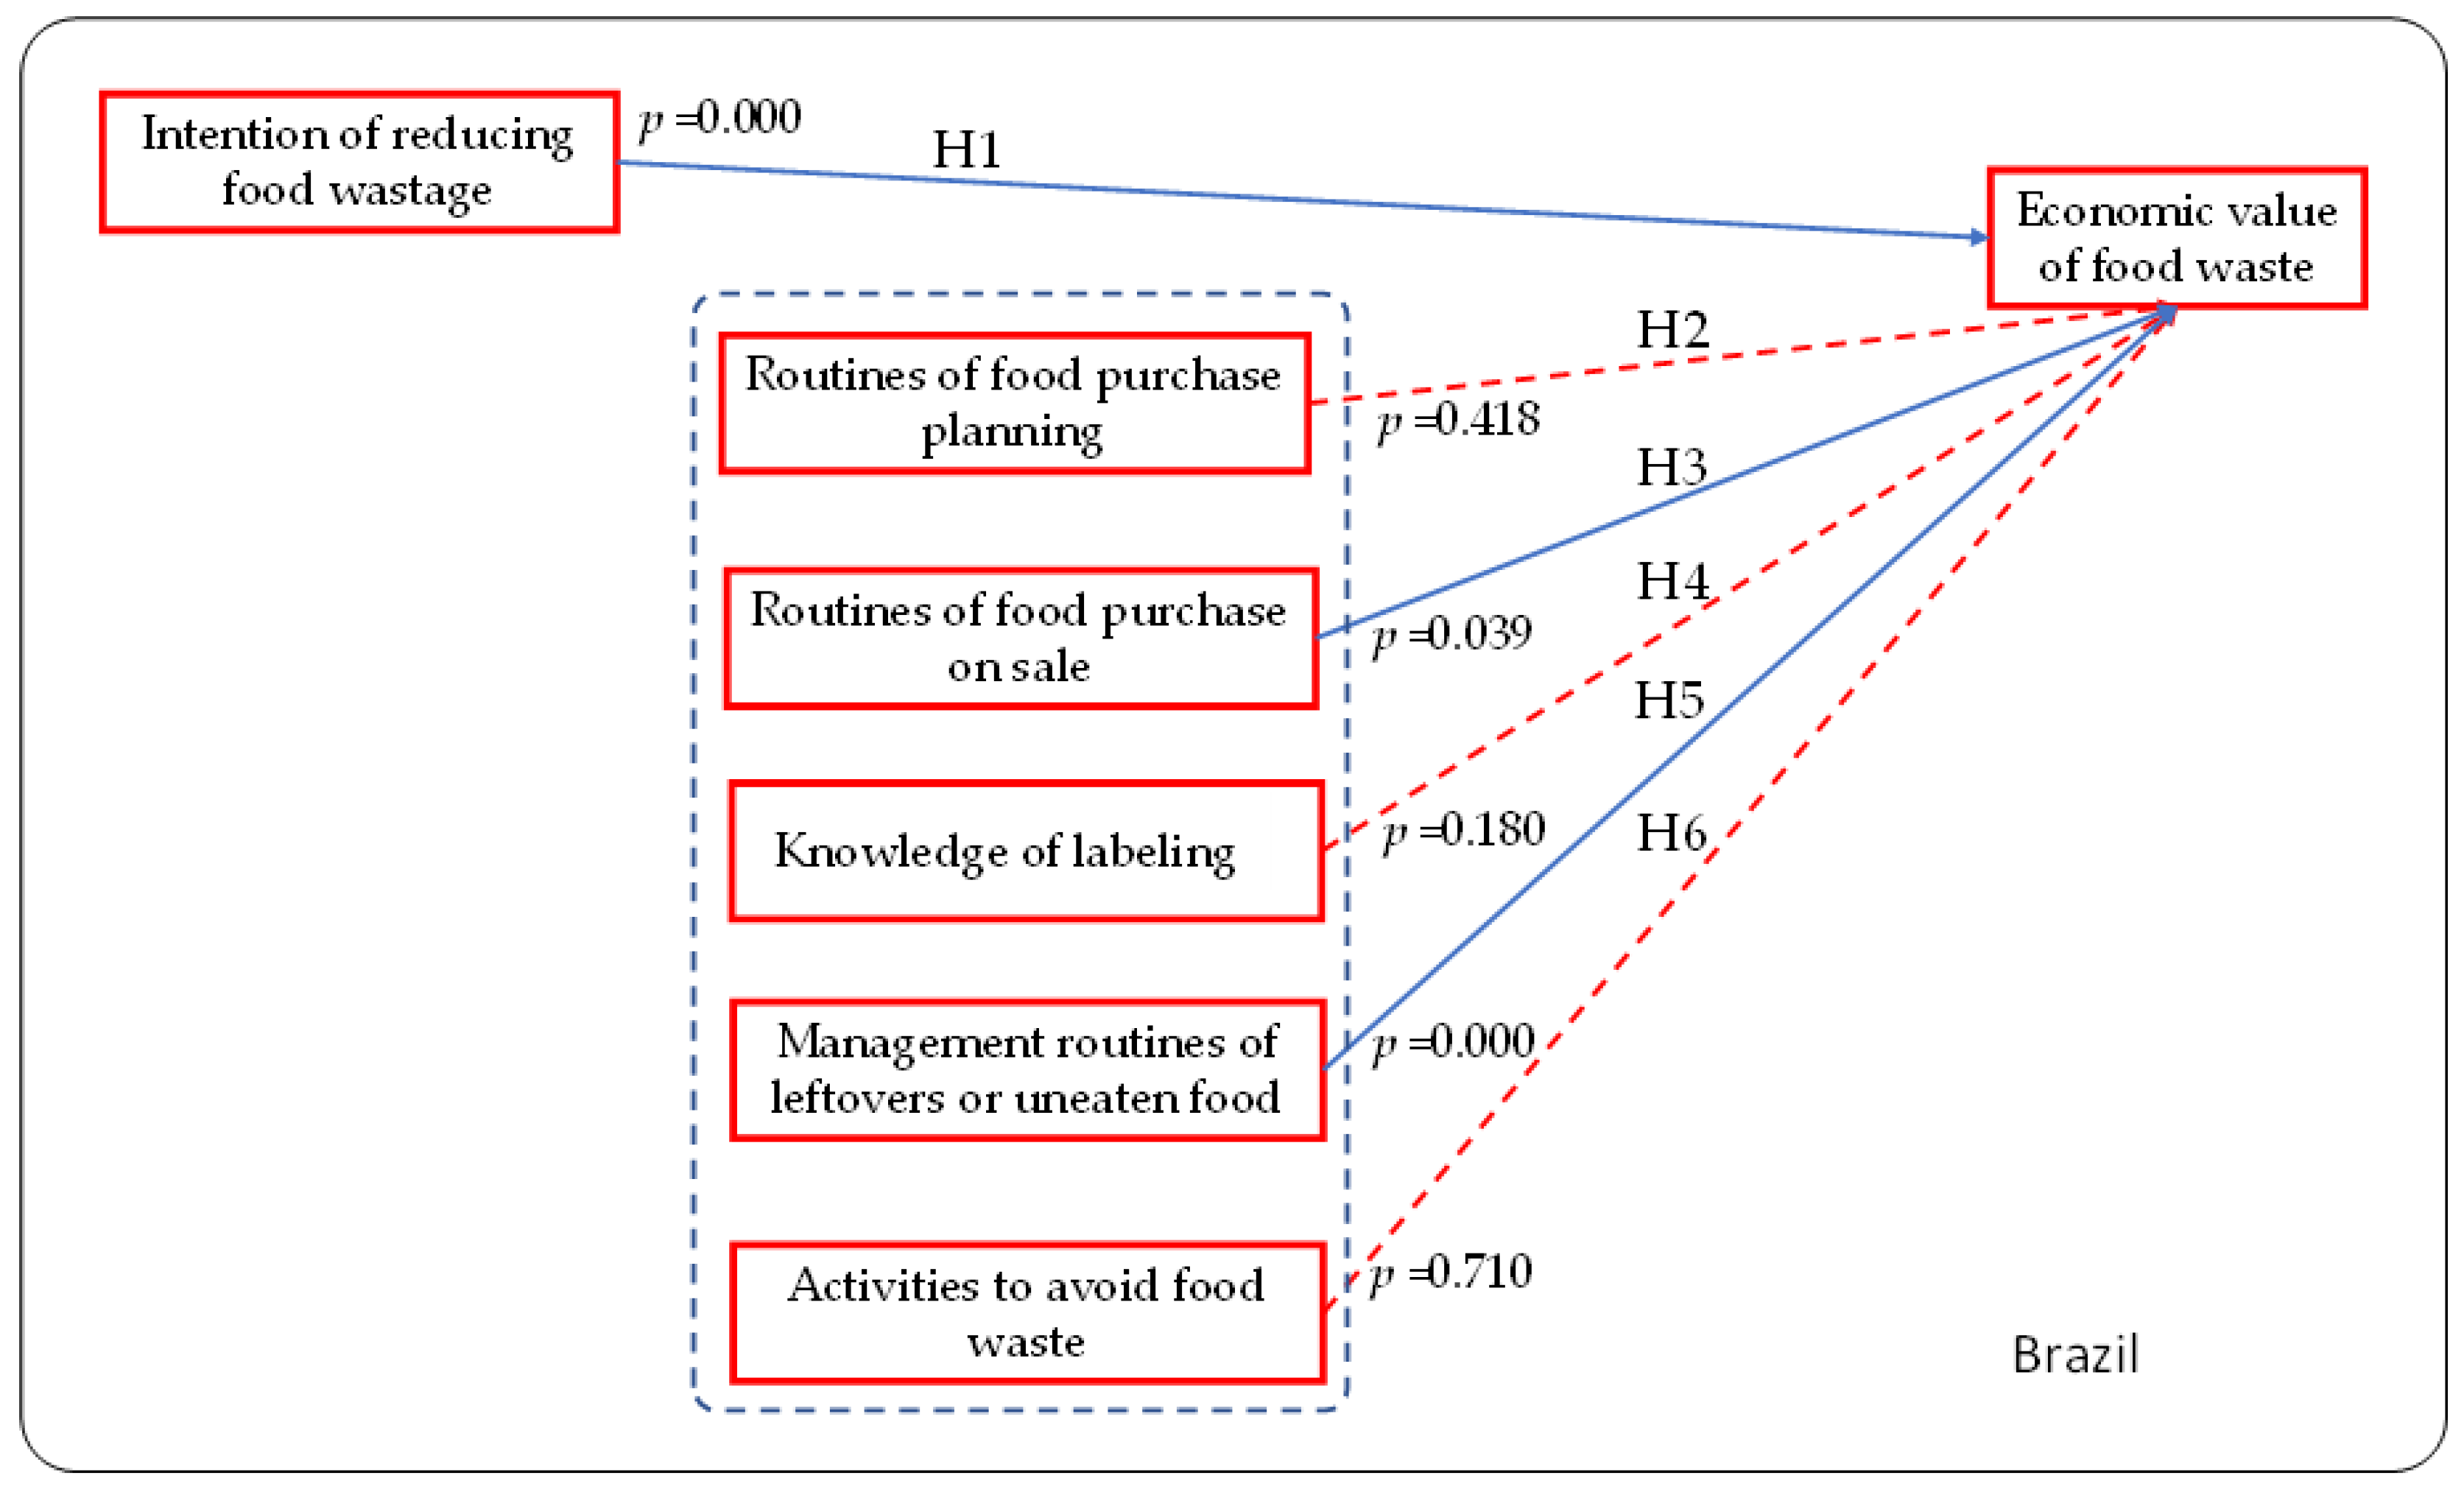
4.3. Relationship between Grocery Shopping Behavior and Food Wastage in Peru and Brazil

A multiple regression analysis was performed to determine the relationship between the independent and the dependent variables, wherein the “economic value of food wastage” served as the dependent variable of the regression model, while the “planning routines”, “understanding of labels”, “disposition to reduce waste”, “attraction toward sales and promotions”, and “reasons for wasting food” acted as independent variables. The regression analysis was run for each country separately. Table 3 lists the results for the unstandardized β coefficients and the p-value.
Based on the results from the multiple regression analysis for each country, the following conclusions were drawn:
  • Intention to reduce food wastage. H1: The intention to reduce food wastage in households is positively related to lower economic values of food waste. H1 was confirmed for both countries at a p-value of 0.000.
  • Food purchase planning routines. Hypothesis H2: Proper grocery shopping planning routines lowers the economic values of food waste for households. H2 was not confirmed either for Peru (p-value = 0.091) or Brazil (p-value = 0.418) [43].
  • Routines for planning the purchase of food on sale. Hypothesis H3: Shopping routines for on-sale food items are positively related to reducing the economic value of food waste for households. H3 was not confirmed for Peru (p-value = 0.851), but it was confirmed for Brazil (p-value = 0.039) [43].
  • Knowledge of labeling. Hypothesis H4: Proper understanding of food label information will reduce the economic value of food waste for households. H4 was not confirmed either for Peru (p-value = 0.726) or Brazil (p-value = 0.180) [43].
  • Routines for handling leftovers and uneaten food. Hypothesis H5: Leftover or uneaten food management is positively related to reducing the monetary value of food waste for household. H5 was confirmed for both countries at a p-value of 0.000 [43].
  • Activities to avoid food waste. Hypothesis H6: Taking actions to prevent food wastage positively reduces the economic value of food waste for households. H6 was confirmed for both countries at a p-value of 0.230 [43].
The results for the supported hypotheses are illustrated in Figure 10 for Peru and Figure 11 for Brazil [43]. In the model, the solid lines represented the relationships that were confirmed, and the dotted lines represented the relationships that could not be confirmed. For Peru, the following relationships were confirmed: (1) The intention to reduce food waste in households was positively related to lower economic values of food waste (H1) and (2) proper leftover or uneaten food management was positively related to reducing the monetary value of food waste for household (H5).
For Brazil (Figure 11), the following relationships were confirmed: (1) The intention to reduce food wastage in households was positively related to lower economic values of food waste (H1), (2) shopping routines for on-sale food items were positively related to reducing the economic value of food waste for households (H3), and (3) proper leftover or uneaten food management was positively related to reducing the monetary value of food waste for (H5).

4.4. Hypothesis Testing Regarding the Differences between Peru and Brazil

To verify differences between the two samples, the nonparametric Mann–Whitney U test was conducted for our variables of interest, as depicted in Table 4.
The results obtained for each of the hypotheses were as follows:
  • Intention to reduce wastage, H7. Sufficient evidence was provided to support H7 Hence, we assumed that there are differences in the intentions to reduce wastage between the two countries.
  • Proper grocery shopping planning routines, H8. Insufficient evidence was provided to support H8. Therefore, it can be stated that there are important routine planning similarities between the two countries.
  • Shopping routines for on-sale food items, H9. Insufficient evidence was provided to support H9. Therefore, it can be stated that there are important similarities in the attraction for food items on sale between the two countries.
  • Understanding food labels, H10. Insufficient evidence was provided to support H10. Therefore, it can be stated that there are important similarities in the understanding of food labels between the two countries.
  • Leftover and uneaten food management routines, H11. Sufficient evidence was provided to support H11. Hence, we assumed that there are differences in how uneaten food and leftovers are managed between the two countries.
  • Actions for preventing food wastage at home, H12. Sufficient evidence was provided to support H12. Hence, we assumed that there are differences in actions for preventing food wastage at home between the two countries.
  • Average food expenses, H13. Insufficient evidence was provided to support H13. Hence, we assumed that average food expenses are similar in both countries.

5. Discussion

5.1. Comparisons between Sociodemographic Factors of Peru and Brazil

The results from this research study reveal most of the respondents to be women in both countries. In fact, similar findings have been found in previous studies [7,28,29,33,34,35,38,41,50]. This could be explained by the fact that women are often responsible for buying and cooking food for their respective households [5], which also occurs in Peru and Brazil. For this reason, women usually have greater awareness and capacity for detecting and managing food-related issues [35], as argued by Jribi et al. [7], who pointed out that women commonly produced less leftovers than men during the COVID-19 pandemic. Regarding age distribution, most Peruvian respondents were in the 31–50 age group, whereas most Brazilian respondents were in the 31–60 age group. Hence, part of the Peruvian respondents was younger than the Brazilian respondents. The age group with the least number of responses for both countries was the “over 60 group”, which suggests that this group may be less familiar with technology as this was an online survey. According to Qian et al. [35], age is related to increased awareness and concern about food waste at home. However, like Koivupuro et al. [71], our research did not have enough people over 60 years old in the sample, which would allow us to analyze whether this group of older people produces less waste than younger people.
Regarding academic level, most respondents reported having a university/college education. These results are consistent with the literature [18,21,33,34,38,41,50], which suggests that people with a higher academic background are more likely to respond to these surveys. Likewise, a significant percentage of the respondents held graduate degrees, and 14.8% of Brazilian respondents held a PhD. According to these results, Brazilians may have a higher academic level than Peruvians, which, in turn, implies a higher level of awareness about environmental, social, and ethical issues offered by advanced education [17,18,38].
Regarding current occupation, a similar number of respondents from both countries fell in the “full-time salaried employee” category (39.2% Peru and 38.4% Brazil). An important difference is the number of “retired/pensioner” participants who responded in Brazil (11.4%), compared with just 2.6% in Peru. According to the literature, older people are usually more aware and conscious of food-wastage issues [35].
Regarding the number of people in their households, most of the respondents buy food for 2–3 people. The other significant group buys food for 4–5 people. According to the literature, the number of people in the household influences the amount of food wasted [15,23,35,54], which is consistent with the claim of not wasting food received from most respondents.
Regarding average household income, Peruvian respondents reported incomes between US$ 728 and US$ 1428 per month, with a significant segment exceeding US$ 3572, while half of the Brazilian respondents reported incomes between US$ 516 and US$ 1717. According to Van der Werf et al. [16], income is related to household food waste, while Koivupuro et al. [71] found no correlation between these variables.

5.2. Behavior Comparisons during the COVID-19 Quarantine

Consumer behavior was similar in both countries. For example, with respect to the decision of where and how to shop for groceries, there were slight differences in Peru (Figure 4) in terms of “quick shopping facilities”, “payment facilities”, and “avoid becoming infected”, which are related to the need of protecting themselves from contracting the virus [7]. Regarding changes in shopping behavior (Figure 5), Peruvian consumers reported more changes than Brazilian consumers. Even though shopping frequencies were similar in both countries, the percentages of purchasing items on sale, shopping online, and shopping locations were slightly higher in Peru.
In addition, 56.9% of Peruvians and 49.3% of Brazilians reported spending more on food during the quarantine. As for the type of food wasted, the behavior in both countries was similar. However, a significant difference was recorded for Brazil in the “fish and seafood” category, which may be due to the relatively short shelf-life of these foods [29] and cooking skills. In terms of the amount of food wasted on a weekly basis, Brazilians wasted a larger quantity of fish and seafood, but similar amounts of cereals and pasta as well as fruits and vegetables were wasted in both countries, which is consistent with the results reported by other authors in previous studies [22,28,34,69]. The amount of household food wastage reported by the respondents was “less than 250 g”; however, it could be higher because subjects may have underestimated the amounts of wasted food reported in the survey [59,66].
The management of leftovers and uneaten food contributes to reducing food wastage at home [7,12,13,19,60]. During the quarantine, most Brazilian and Peruvian respondents stated that they usually ate leftovers the following day, with Brazilians ranking higher in this behavior, while Peruvians exceled in the “no leftover” category. This is actually an expected behavior in moments of crisis, where people usually make the most of the resources available [13,19,35]. Within the COVID-19 quarantine context, most subjects adopted the money-saving strategies of storing and eating leftovers, thus managing the amount of food wasted by either reusing leftovers or freezing uneaten food, as discussed in previous research studies [7,12,19,31,35,60]. Therefore, activities aimed at preventing food wastage were similar in both countries.

5.3. Analysis of the Similarities and Differences between Peru and Brazil

Our results indicate similarities and differences between both countries in grocery shopping and food wastage behaviors during the quarantine. The studies validated that, for Peruvians, the intention to reduce household food waste was positively related to a lower economic value of the food wasted (H1). For Brazilians [43], these findings are similar to those reported in the theoretical framework [17,30,43,53,54,55,58]. The higher the intention, the more a person is likely to perform a given behavior. In addition, in the context of COVID-19, constant concerns about food prices and the monetary value of food waste are expected to foster a reduction in food wastage. For both countries, the intention to reduce waste is similar (H7), and both agreed on the need to receive more information on the negative impacts of food wastage.
As shopping planning and creating a shopping list was related to less food wastage, the economic value of food waste would lower (H2). This hypothesis was not confirmed either for Peru or Brazil [43]. However, Peruvians and Brazilians do plan their purchases and use a shopping list as a planning instrument, which is supported by the rejection of the hypothesis of differences between the two countries (H8), which is consistent with the results reported in previous research studies, wherein both shopping planning and shopping lists contribute to reducing food wastage [7,12,20,29,34,42,53].
This study also proposed that proper understanding of food label information reduces the economic value of food waste for households (H3). This hypothesis was not confirmed either for Peru or Brazil [43]. These findings contradict the findings reported in previous research studies, which indicated that in times of crisis, people tend to save money, practice smart shopping [65,77], and waste less food [61,72]. Respondents from both countries were attracted to sales and promotions (H9). Consequently, in the face of uncertainty due to the pandemic, it is possible that people will buy more food at discounted prices [43] and, in turn, waste more food.
The information provided by the labels indicates proper manipulation for each product, which also impacts the decision to acquire and consume them and contributes to reducing the economic value of wasted food (H4). This hypothesis was also not confirmed either for Peru or Brazil [43]. These findings contradict the results reported in other studies, wherein reading and properly understanding label information contributes to making better decisions related to buying food and reducing food wastage [7,12,21,22,50,60,63,64], and, in turn, its economic value. Peruvians and Brazilians are aware of the information provided by food labels (H10), and the respondents consider that information to make conscious food shopping and consumption decisions. However, this was not reflected in the economic value of wasted food.
Moreover, leftover, or uneaten food management is indeed related to less food wastage; therefore, it contributes to reducing its economic value (H5). This hypothesis was confirmed for both Peru and Brazil [43]. Further, households serving proper portions, wherein leftovers are properly stored and consumed, decrease food wastage, as reported in the literature [12,21,27,28,32,41,42,52,58,66], thereby also decreasing its economic value. The habit of leaving leftovers uneaten, serving excessive portions, coupled with poor food preparation skills and experience at home are key factors in how often food is wasted in the household [20,28,29,33,52]. Brazilians and Peruvians treat leftovers and uneaten food differently (H11). Both Brazil (59.4%) and Peru (47.4%) coincided in eating leftover food the following day, but Peruvians claim to seldom have leftovers and to freeze them more often.
Performing activities to prevent food wastage are related to reducing the amount of food wasted and, in turn, its economic value (H6). This hypothesis was also not confirmed for either Peru or Brazil [43]. Nevertheless, the literature establishes that food wastage is related to consumer behavior [7,9,12,13,16,17,18,19,20,21,28,30,33,43,49,58,73]. Aspects such as worrying, and the actions taken [43] allow us to verify whether people are really taking adequate measures to prevent or reduce their food wastage [43]. Activities to prevent food wastage in the household (H12) are different in Brazil and Peru.
Finally, we found similarities in average food expenses between the two countries (H13). In this regard, both Peruvians and Brazilians claimed to spend more because of the increased food prices. Previous studies assert that as household incomes decrease from the contraction of economic activities and the reduction of mobility associated with the context of crisis, such as the COVID-19 pandemic, people start becoming more careful with their budgets and minimizing food wastage [7,23,25,28,29,43,58,65,68]. Here, we would have to dig deeply into aspects such as awareness of the economic value of food waste [26,53,62,69], the environmental and social impacts caused by food wastage [53,58,69], and even ethical aspects [36,68] because food-related behaviors can be modified owing to uncertainty and anxiety caused by the pandemic [7,31,43,73]. However, better grocery shopping planning and organization during the COVID-19 lockdown also effectively prevented panic buying and cooking in excess [7].

5.4. Research Limitations

Finally, the constraints of the present study are associated with the data collection instrument because potential respondents may experience accessibility issues in online surveys. Furthermore, the sample may not fully represent the population of both countries due to the fact that the average respondent may be in a different segment of the average resident of the country [74]. Therefore, our results may not represent the entire population of both countries but are the closest we could reach during the considered period. Thus, for future studies, we recommend using strategies to overcome these constraints.

6. Conclusions

This research study sought to help close the existing gap in the literature on domestic food wastage in Latin America [43,44], especially because this problem involves economic, social, and environmental aspects and constitutes a critical sustainability issue at a global scale [2,49,60,62,63,68,69]. However, exhaustive research may still be required. The study conducted revealed that within the context of the COVID-19 pandemic outbreak, Brazilian and Peruvian households were characterized by planning their grocery shopping, using a shopping list, and their disposition for reducing food wastage. Nevertheless, even when there were planning efforts, the sales and promotions from commercial establishments also influenced their buying decisions. Hence, planning and promotions served as supplementary decision-making parameters, and, in turn, for buying optimal food quantities and minimizing food expenses and wastage.
Even when both countries imposed different social distancing measures during the pandemic outbreak [3], our results revealed that in both countries people decided where and how to buy food based on how they could best prevent getting infected with COVID-19. Nevertheless, our subjects still preferred shopping in person at their usual stores and buying the same type and quantities of food as always. Along the same lines, differences were identified in the preferred method of payment used because Peruvians favored paying in cash, a characteristic feature of low banking and digitization levels in society, and Brazilians commonly used debit cards. In this sense, this study validates the importance of health security as a decisive grocery shopping element, and, at the same time, an opportunity for changing behavior in relation to the potential of e-commerce and virtual payment methods.
Contributions are now addressed for company managers, mainly supermarkets and those related to food industry. It is recommended that these companies may address the packing information regarding food label information and dates for safe consumption or disposal. Another contribution is to adequately resize the products according to the needs of the families in order to avoid food waste. Thus, it may be seen that, for business managers and public policies professionals, there are plenty of opportunities and challenges to work on, promoting a change in societal behavior due to the characteristics of the crises, the availability of technologies, and building a business models compatible to the context. Some actions to be taken would be campaigns focused on educating the end consumer in purchase planning, responsible purchasing, and zero waste. For scholars, the contributions presented by this research deal with opportunities to carry out future studies aiming the need for responsible food behavior. Additionally, it is important to underline not only the economic impact of food waste, but also environmental and social ones. Another recommendation is to develop research after the vaccination period in order to identify differences or similarities in the consumer behavior between the pandemic period and post-vaccination period.
In addition, we were able to identify different reasons for wasting food. For example, Peruvian households tend to serve food in excess and Brazilian households leave prepared food sitting in the refrigerator for a long time, and in both cases, this kind of behavior may be understood as part of the local culture of cooking in abundance [51,52]. However, leftover management was similar in both countries as people often ate leftovers the following day, thereby also reducing waste. Moreover, this study confirmed the importance of information wastage because expiration date was the only criterion used by Peruvian households to decide whether to consume or discard food items, whereas Brazilian households used both the expiration date and the state of preservation of the food. Overall, this situation has presented an opportunity of informing and educating consumers about good practices related to food consumption and food waste, especially those related to sustainability issues.
Based on that the above findings, within the context of the health and economic crisis generated by the pandemic, households and companies now have opportunities for the adoption of more sustainable behaviors, such as individuals becoming more aware of the different waste reduction alternatives, and their impact of their decisions to prevent food wastage. Considering the above possibilities, food companies may provide additional information on the preservation of their food products, thereby not only contributing to reducing food wastage but also prompting more sustainable production mechanisms and consumption behaviors. Changing this system may be an opportunity for business and costumers better (re)connect its needs, expectations, and potential in a sustainable way.

Author Contributions

Conceptualization, M.M.C., V.G.H.S., J.M.V.N. and M.F.; methodology, software, validation, and formal analysis, J.M.V.N. and M.M.C.; investigation, V.G.H.S., M.M.C., J.M.V.N. and M.F.; resources, M.M.C., V.G.H.S., J.M.V.N. and M.F.; data curation, J.M.V.N. and M.M.C.; writing—original draft preparation, V.G.H.S. and M.M.C.; writing—review and editing, visualization, M.M.C., V.G.H.S. and M.F. All authors have read and agreed to the published version of the manuscript.

Funding

This research received no external funding.

Institutional Review Board Statement

Ethical review and approval were waived for this study, because, no personal information was collected about the respondents that would allow their identification, the participation was completely anonymous. Gathered information did not comprised psychological or any obtrusive situation and was carried out according to the guidelines of the Declaration of Helsinki.

Informed Consent Statement

Informed consent was obtained from all participants of the study. The survey included the following question: “Do you give your consent and authorization for the information in this survey to be used in an anonymous way for strictly academic and scientific purposes?”.

Acknowledgments

The authors appreciate and value the recommendations and suggestions of the anonymous reviewers.

Conflicts of Interest

The authors declare no conflict of interest.

References

  1. World Bank. Coronavirus Highlights the Need to Strengthen Health Systems. Available online: https://blogs.worldbank.org/voices/coronavirus-covid19-highlights-need-strengthen-health-systems (accessed on 1 July 2020).
  2. CEPAL. Food Systems and COVID-19 in Latin America and the Caribbean N° 10: Food Consumption Patterns and Malnutrition. FAO/ECLAC Bulletin Food Systems and COVID-19 No. 10. 2020. Available online: https://repositorio.cepal.org/handle/11362/45794 (accessed on 14 November 2020).
  3. FAO. Mitigating Risks to Food Systems during COVID-19: Reducing Food Loss and Waste; FAO: Rome, Italy, 2020; Available online: http://www.fao.org/3/ca9056en/ca9056en.pdf (accessed on 1 July 2020).
  4. FAO. The State of Food and Agriculture 2019. Moving forward on Food Loss and Waste Reduction; FAO: Rome, Italy, 2019; Available online: http://www.fao.org/3/ca6030en/ca6030en.pdf (accessed on 1 July 2020).
  5. Di Renzo, L.; Gualtieri, P.; Pivari, F.; Soldati, L.; Attinà, A.; Cinelli, G.; Leggeri, C.; Caparello, G.; Barrea, L.; Scerbo, F.; et al. Eating habits and lifestyle changes during COVID-19 lockdown: An Italian survey. J. Transl. Med. 2020, 18, 229. [Google Scholar] [CrossRef] [PubMed]
  6. Galanakis, C.M. The Food Systems in the Era of the Coronavirus (COVID-19) Pandemic Crisis. Foods 2020, 9, 523. [Google Scholar] [CrossRef]
  7. Jribi, S.; Ben-Ismail, H.; Doggui, D.; Debbabi, H. COVID-19 virus outbreak lockdown: What impacts on household food wastage? Environ. Dev. Sustain. 2020, 22, 3939–3955. [Google Scholar] [CrossRef] [PubMed] [Green Version]
  8. Romeo-Arroyo, E.; Mora, M.; Vázquez-Araújo, L. Consumer behavior in confinement times: Food choice and cooking attitudes in Spain. Int. J. Gastron. Food Sci. 2020, 21, 1–5. [Google Scholar] [CrossRef]
  9. Ismail, M.H.; Ghazi, T.I.M.; Hamzah, M.H.; Manaf, L.A.; Tahir, R.M.; Nasir, A.M.; Omar, A.E. Impact of Movement Control Order (MCO) due to Coronavirus Disease (COVID-19) on Food Waste Generation: A Case Study in Klang Valley, Malaysia. Sustainability 2020, 12, 8848. [Google Scholar] [CrossRef]
  10. OECD. Food Supply Chains and COVID-19: Impacts and Policy Lessons. Available online: http://www.oecd.org/coronavirus/policy-responses/food-supply-chains-and-covid-19-impacts-and-policy-lessons-71b57aea/ (accessed on 2 June 2020).
  11. Vergara-Castañeda, A.; Lobato, M.; Díaz Gay, M.; Ayala, M. Cambios en el Comportamiento Alimentario en la era del COVID-19. RELAIS 2020, 3, 27–30. Available online: https://repositorio.lasalle.mx/handle/lasalle/1767 (accessed on 13 October 2020).
  12. WRAP. Banbury, the COVID-19 Lockdown—Food Purchasing, Management and Waste, Prepared by WRAP & Icaro Consulting. Available online: https://wrap.org.uk/resources/report/citizens-and-food-during-lockdown (accessed on 21 February 2021).
  13. Aschemann-Witzel, J.; de Hooge, I.; Amani, P.; Bech-Larsen, T.; Oostindjer, M. Consumer—Related Food Waste: Causes and Potential for Action. Sustainability 2015, 7, 6457–6477. [Google Scholar] [CrossRef] [Green Version]
  14. Sharma, H.B.; Vanapalli, K.R.; Cheela, V.S.; Ranjan, V.P.; Jaglan, A.K.; Dubey, B.; Bhattacharya, J. Challenges, opportunities, and innovations for effective solid waste management during and post COVID-19 pandemic. Resour. Conserv. Recycl. 2020, 162, 1–12. [Google Scholar] [CrossRef]
  15. Van der Werf, P.; Seabrook, J.A.; Gilliland, J.A. Reduce Food Waste, Save Money: Testing a Novel Intervention to Reduce Household Food Waste. Environ. Behav. 2019, 1–33. [Google Scholar] [CrossRef] [Green Version]
  16. van der Werf, P.; Larsen, K.; Seabrook, J.A.; Gilliland, J. How Neighbourhood Food Environments and a Pay-as-You-Throw (PAYT) Waste Program Impact Household Food Waste Disposal in the City of Toronto. Sustainability 2020, 12, 7016. [Google Scholar] [CrossRef]
  17. Qi, D.; Roe, B.E. Household Food Waste: Multivariate Regression and Principal Components Analyses of Awareness and Attitudes among U.S. Consumers. PLoS ONE 2016, 11. [Google Scholar] [CrossRef] [PubMed]
  18. Abeliotis, K.; Lasaridi, K.; Chroni, C. Attitudes and behaviour of Greek households regarding food waste prevention. Waste Manag. Res. 2014, 32, 237–240. [Google Scholar] [CrossRef] [PubMed]
  19. Amicarelli, V.; Bux, C. Food waste in Italian households during the Covid-19 pandemic: A self-reporting approach. Food Secur. 2021, 13, 25–37. [Google Scholar] [CrossRef]
  20. Bravi, L.; Francioni, B.; Murmura, F.; Savelli, E. Factors affecting household food waste among young consumers and actions to prevent it. A comparison among UK, Spain and Italy. Resour. Conserv. Recycl. 2020, 153, 104586. [Google Scholar] [CrossRef]
  21. Bogevska, Z.; Berjan, S.; Capone, R.; Debs, P.; El Bilali, H.; Bottalico, F.; Davitkovska, M. Household food wastage in North Macedonia. Agric. For. 2020, 66, 125–135. [Google Scholar] [CrossRef]
  22. Gaiani, S.; Caldeira, S.; Adorno, V.; Segrè, A.; Vittuari, M. Food wasters: Profiling consumers’ attitude to waste food in Italy. Waste Manag. 2018, 72, 17–24. [Google Scholar] [CrossRef]
  23. Jörissen, J.; Priefer, C.; y Bräutigam, K.-R. Food Waste Generation at Household Level: Results of a Survey among Employees of Two European Research Centers in Italy and Germany. Sustainability 2015, 7, 2695–2715. [Google Scholar] [CrossRef] [Green Version]
  24. Laguna, L.; Fiszman, S.; Puerta, P.; Chaya, C.; Tárrega, A. The impact of COVID-19 lockdown on food priorities. Results from a preliminary study using social media and an online survey with Spanish consumers. Food Qual. Prefer. 2020, 86, 104028. [Google Scholar] [CrossRef]
  25. Herzberg, R.; Schmidt, T.G.; Schneider, F. Characteristics and Determinants of Domestic Food Waste: A Representative Diary Study across Germany. Sustainability 2020, 12, 4702. [Google Scholar] [CrossRef]
  26. Principato, L.; Secondi, L.; Pratesi, C.A. Reducing food waste: An investigation on the behaviour of Italian youths. Br. Food J. 2015, 117, 731–748. [Google Scholar] [CrossRef]
  27. Pocol, C.B.; Pinoteau, M.; Amuza, A.; Burlea-Schiopoiu, A.; Glogovețan, A.-I. Food Waste Behavior among Romanian Consumers: A Cluster Analysis. Sustainability 2020, 12, 9708. [Google Scholar] [CrossRef]
  28. Preka, R.; Berjan, S.; Capone, R.; El Bilali, H.; Allahyari, M.S.; Debs, P.; Bottalico, F.; Mrdalj, V. Household Food Wastage in Albania: Causes, Extent and Implications. Future Food J. Food Agric. Soc. 2020, 8, 1–20. [Google Scholar] [CrossRef]
  29. Przezbórska-Skobiej, L.; Wiza, P.L. Food Waste in Households in Poland—Attitudes of Young and Older Consumers towards the Phenomenon of Food Waste as Demonstrated by Students and Lecturers of PULS. Sustainability 2021, 13, 3601. [Google Scholar] [CrossRef]
  30. Stefan, V.; van Herpen, E.; Tudoran, A.A.; Lähteenmäki, L. Avoiding food waste by Romanian consumers: The importance of planning and shopping routines. Food Qual. Prefer. 2013, 28, 375–381. [Google Scholar] [CrossRef]
  31. Vidal-Mones, B.; Barco, H.; Diaz-Ruiz, R.; Fernandez-Zamudio, M.-A. Citizens’ Food Habit Behavior and Food Waste Consequences during the First COVID-19 Lockdown in Spain. Sustainability 2021, 13, 3381. [Google Scholar] [CrossRef]
  32. Abouabdillah, A.; Capone, R.; Youssfi, L.E.L.; Debs, P.; Harraq, A.; El-Bilali, H.; El-Amrani, M.; Bottalico, F.; Driouech, N. Household food waste in Morocco: An exploratory survey. Sixth International Scientific Agricultural Symposium “Agrosym 2015”, Jahorina, Bosnia and Herzegovina, October 15–18, 2015. Book Proc. 2015, 1353–1360. [Google Scholar] [CrossRef]
  33. Arous, S.; Capone, R.; Debs, P.; Haddadi, Y.; El Bilali, H.; Bottalico, F.; Hamidouche, M. Exploring household food waste issue in Algeria. AGROFOR Int. J. 2017, 2, 55–67. [Google Scholar] [CrossRef]
  34. Sassi, K.; Capone, R.; Abid, G.; Debs, P.; El Bilali, H.; Daaloul, B.O.; Bottalico, F.; Driouech, N.; Terras, D.S. Food wastage by Tunisian households. Int. J. AgroFor. 2016, 1, 172–181. [Google Scholar] [CrossRef] [Green Version]
  35. Qian, K.; Javadi, F.; Hiramatsu, M. Influence of the COVID-19 Pandemic on Household Food Waste Behavior in Japan. Sustainability 2020, 12, 9942. [Google Scholar] [CrossRef]
  36. Heidari, A.; Mirzaii, F.; Rahnama, M.; Alidoost, F. A theoretical framework for explaining the determinants of food waste reduction in residential households: A case study of Mashhad, Iran. Environ. Sci. Pollut. Res. Int. 2020, 27, 6774–6784. [Google Scholar] [CrossRef]
  37. Li, J.; Hallsworth, A.G.; Coca-Stefaniak, J.A. Changing Grocery Shopping Behaviours Among Chinese Consumers At The Outset Of The COVID-19 Outbreak. Tijdschr. Econ. Soc. Geogr. 2020, 111, 574–583. [Google Scholar] [CrossRef]
  38. Mattar, L.; Abiad, M.G.; Chalak, A.; Diab, M.; Hassan, H. Attitudes and behaviors shaping household food waste generation: Lessons from Lebanon. J. Clean. Prod. 2018, 198, 1219–1223. [Google Scholar] [CrossRef]
  39. Mu’azu, N.D.; Blaisi, N.I.; Naji, A. Food waste management current practices and sustainable future approaches: A Saudi Arabian perspectives. J. Mater Cycles Waste Manag. 2019, 21, 678–690. [Google Scholar] [CrossRef]
  40. Nordin, N.H.; Kaida, N.; Othman, N.A.; Akhir, F.N.; Hara, H. Reducing Food Waste: Strategies for Household Waste Management to Minimize the Impact of Climate Change and Contribute to Malaysia’s Sustainable Development. IOP Conf. Ser. Earth Environ. Sci. 2020, 479, 012035. [Google Scholar] [CrossRef]
  41. Zainal, D.; Hassan, K.A. Factors Influencing household food waste behaviour in Malaysia. Int. J. Res. Bus. Econ. Manag. 2019, 3, 56–71. Available online: http://www.ijrbem.com/doc/138.pdf (accessed on 13 October 2020).
  42. Keegan, E.; Breadsell, J.K. Food Waste and Social Practices in Australian Households. Sustainability 2021, 13, 3377. [Google Scholar] [CrossRef]
  43. Schmitt, V.G.H.; Cequea, M.M.; Neyra, J.M.V.; Ferasso, M. Consumption Behavior and Residential Food Waste during the COVID-19 Pandemic Outbreak in Brazil. Sustainability 2021, 13, 3702. [Google Scholar] [CrossRef]
  44. Ruviaro, C.F.; Borges, A.; Farinha, M.; Bernardo, L.M.; Morais, H.B.; Leis, C.M.; Domingues, C.F. Food losses and wastes in Brazil: A systematic review. Desenvolv. Socioeconômico Debate 2020, 6, 78–90. [Google Scholar] [CrossRef]
  45. Scacchi, A.; Catozzi, D.; Boietti, E.; Bert, F.; Siliquini, R. COVID-19 Lockdown and Self-Perceived Changes of Food Choice, Waste, Impulse Buying and Their Determinants in Italy: QuarantEat, a Cross-Sectional Study. Foods 2021, 10, 306. [Google Scholar] [CrossRef]
  46. PAHO. Coronavirus Disease (COVID-19) Pandemic. Available online: https://www.paho.org/en/topics/coronavirus-infections/coronavirus-disease-covid-19-pandemic (accessed on 1 July 2020).
  47. Ministério de Saúde, 2020. PORTARIA N° 454, DE 20 DE MARÇO DE 2020: Declara, em todo o Território Nacional, o Estado de Transmissão Comunitária do Coronavírus (COVID-19). Available online: https://www.in.gov.br/en/web/dou/-/portaria-n-454-de-20-de-marco-de-2020-249091587 (accessed on 1 July 2020).
  48. Gobierno del Perú. Coronavirus: Restricciones, Recomendaciones y Excepciones Para el Traslado de Personas. Available online: https://www.gob.pe/8792-coronavirus-restricciones-recomendaciones-y-excepciones-para-el-traslado-de-personas (accessed on 1 July 2020).
  49. Schanes, K.; Doberniga, K.; Gözeta, B. Food waste Matters—A systematic review of household food waste practices and their policy implications. J. Clean. Prod. 2018, 182, 978–991. [Google Scholar] [CrossRef]
  50. Di Talia, E.; Simeone, M.; Scarpato, D. Consumer behaviour types in household food waste. J. Clean. Prod. 2019. [Google Scholar] [CrossRef]
  51. Porpino, G.; Parente, J.; Wansink, B. Food waste paradox: Antecedents of food disposal in low income households. Int. J. Consum. Stud. 2015, 39, 619–629. [Google Scholar] [CrossRef] [Green Version]
  52. Porpino, G. Household Food Waste Behavior: Avenues for Future Research. The Behavioral Science of Eating. J. Assoc. Consum. Res. 2016, 1, 41–51. [Google Scholar] [CrossRef] [Green Version]
  53. Stancu, V.; Haugaard, P.; Lähteenmäki, L. Determinants of consumer food waste behaviour: Two routes to food waste. Appetite 2016, 96, 7–17. [Google Scholar] [CrossRef]
  54. Brennan, L.; Langley, S.; Verghese, K.; Lockrey, S.; Ryder, M.; Francis, C.; Hill, A. The role of packaging in fighting food waste: A systematised review of consumer perceptions of packaging. J. Clean. Prod. 2021, 281, 125276. [Google Scholar] [CrossRef]
  55. Soorani, F.; Ahmadvand, M. Determinants of consumers’ food management behavior: Applying and extending the theory of planned behavior. Waste Manag. 2019, 98, 151–159. [Google Scholar] [CrossRef] [PubMed]
  56. Barone, A.; Grappi, S.; Romani, S. “The road to food waste is paved with good intentions”: When consumers’ goals inhibit the minimization of household food waste. Resour. Conserv. Recycl. 2019, 149, 97–105. [Google Scholar] [CrossRef]
  57. Stangherlin, I.; y de Barcellos, M. Drivers and barriers to food waste reduction. Br. Food J. 2018, 120, 2364–2387. [Google Scholar] [CrossRef]
  58. Annunziata, A.; Agovino, M.; Ferraro, A.; Mariani, A. Household Food Waste: A Case Study in Southern Italy. Sustainability 2020, 12, 1495. [Google Scholar] [CrossRef] [Green Version]
  59. Giordano, C.; Alboni, F.; Cicatiello, C.; Falasconi, L. Do discounted food products end up in the bin? An investigation into the link between Deal—Prone shopping behaviour and quantities of household food waste. Int. J. Consum. Stud. 2019, 43, 199–209. [Google Scholar] [CrossRef]
  60. van Geffen, L.; van Herpen, E.; van Trijp, H. Household Food Waste—How to Avoid It? An Integrative Review. In Food Waste Management; Närvänen, E., Mesiranta, N., Mattila, M., Heikkinen, A., Eds.; Palgrave Macmillan: Cham, Switzerland, 2020. [Google Scholar] [CrossRef] [Green Version]
  61. Valaskova, K.; Kramarova, K.; Bartosova, V. Multi Criteria Models Used in Slovak Consumer Market for Business Decision Making. Procedia Econ. Financ. 2015, 26, 174–182. [Google Scholar] [CrossRef] [Green Version]
  62. Graham-Rowe, E.; Jessop, D.C.; Sparks, P. Identifying motivations and barriers to minimising household food waste. Resour. Conserv. Recycl. 2014, 84, 15–23. [Google Scholar] [CrossRef] [Green Version]
  63. Principato, L. Food Waste at Consumer Level. A Comprehensive Literature Review. Springer Briefs Environ. Sci. 2018. [Google Scholar] [CrossRef]
  64. Neff, R.A.; Spiker, M.; Rice, C.; Schklair, A.; Greenberg, S.; Leib, E.B. Misunderstood food date labels and reported food discards: A survey of U.S. consumer attitudes and behaviors. Waste Manag. 2019, 86, 123–132. [Google Scholar] [CrossRef]
  65. Coderoni, S.; Perito, M.A. Sustainable consumption in the circular economy. An analysis of consumers’ purchase intentions for waste-to-value food. J. Clean. Prod. 2020, 252, 119870. [Google Scholar] [CrossRef]
  66. Neff, R.A.; Spiker, M.L.; Truant, P.L. Wasted Food: U.S. Consumers’ Reported Awareness, Attitudes, and Behaviors. PLoS ONE 2015, 10, e0127881. [Google Scholar] [CrossRef] [PubMed] [Green Version]
  67. Veríssimo, A.C.; Barbosa, M.C.; Almeida, N.; Queiroz, A.C.; Kelmann, R.; da Silva, C. Association between the habit of reading food labels and Health—Related factors in elderly individuals of the community. Rev. Nutr. 2019, 32, 2–12. [Google Scholar] [CrossRef]
  68. Albisu, L. Consumer Behaviour with Respect to Food Losses and Waste. In Mediterra 2016: Zero Waste in the Mediterranean. Natural Resources Food and Knowledge; Press de Science Po: Paris, France, 2016; Volume 13, pp. 303–319. Available online: https://www.iamm.ciheam.org/ress_doc/opac_css/index.php?lvl=notice_display&id=37200 (accessed on 29 June 2020).
  69. Clark, J.; Manning, L. What are the factors that an opportunity sample of UK students insinuate as being associated with their wastage of food in the home setting? Resour. Conserv. Recycl. 2018, 130, 20–30. [Google Scholar] [CrossRef]
  70. Hamilton, R.; Mittal, C.; Shah, A.; Thompson, D.V.; Griskevicius, V. How Financial Constraints Influence Consumer Behavior: An Integrative Framework. J. Consum. Psychol. 2019, 29, 285–305. [Google Scholar] [CrossRef]
  71. Koivupuro, H.-K.; Hartikainen, H.; Silvennoinen, K.; Katajajuuri, J.-M.; Heikintalo, N.; Reinikainen, A.; Jalkanen, L. Influence of socio-demographical, behavioural and attitudinal factors on the amount of avoidable food waste generated in Finnish households. Int. J. Consum. Stud. 2012, 36, 183–191. [Google Scholar] [CrossRef]
  72. Sheth, J. Impact of Covid-19 on Consumer Behavior: Will the Old Habits Return or Die? J. Bus. Res. 2020, 117, 280–283. [Google Scholar] [CrossRef] [PubMed]
  73. Casco, A.R. Efectos de la pandemia de COVID-19 en el comportamiento del consumidor. Innovare Rev. Cienc. Tecnol. 2020, 9, 98–105. [Google Scholar] [CrossRef]
  74. de Rada, V.D. Ventajas e inconvenientes de la encuesta por Internet. Papers 2012, 97, 193–223. Available online: https://core.ac.uk/download/pdf/13313060.pdf (accessed on 14 October 2020). [CrossRef]
  75. Nunnally, J.C.; Bernstein, I.H. Psychometric Theory, 3rd ed.; McGraw-Hill: New York, NY, USA, 1994. [Google Scholar]
  76. Instituto Nacional de Estadística (INEI). Estado de la Población Peruana 2020. Available online: https://www.inei.gob.pe/media/MenuRecursivo/publicaciones_digitales/Est/Lib1743/Libro.pdf (accessed on 26 February 2021).
  77. World Bank. Total Population—Brazil. Available online: https://datos.bancomundial.org/indicator/SP.POP.TOTL?locations=BR (accessed on 26 February 2021).
Figure 1. Proposed model. Source: Schmitt et al. [43]. Reproduced with permission from Schmitt et al. [43]; published by Sustainability, 2021, 13, 3702. https://doi.org/10.3390/su13073702.
Sustainability 13 07583 g001
Figure 2. Number of people the respondent buys food for.
Sustainability 13 07583 g002
Figure 3. Average monthly household income of Peruvian and Brazilian respondents. (a) Peru (1 Peruvian Sol (PEN) = 0.29 USD, as of 30 May 2020). (b) Brazil (1 Brazilian Real (BRL) = 0.18 USD, as of 30 May 2020). Source: primary data.
Sustainability 13 07583 g003
Figure 4. Criteria used to decide where and how to shop for groceries.
Sustainability 13 07583 g004
Figure 5. Changes in grocery shopping behavior.
Sustainability 13 07583 g005
Figure 6. Type of food wasted on a weekly basis.
Sustainability 13 07583 g006
Figure 7. Amount of food wasted on a weekly basis.
Sustainability 13 07583 g007
Figure 8. Leftover or uneaten food management.
Sustainability 13 07583 g008
Figure 9. Changes in food expenses.
Sustainability 13 07583 g009
Figure 10. Resulting model for Peru.
Sustainability 13 07583 g010
Figure 11. Resulting model for Brazil. Source: Schmitt et al. [43]. Reproduced with permission from Schmitt et al. [43]; published by Sustainability, 2021, 13, 3702. https://doi.org/10.3390/su13073702.
Sustainability 13 07583 g011
Table 1. Sociodemographic characteristics.
CharacteristicsPeru
(n = 418)
% of Responses
Brazil *
(n = 458)
% of Responses
GenderFemale73.084.9
Male27.014.8
Age20–30 years old15.816.8
31–40 years old34.024.0
41–50 years old24.922.3
51–60 years old18.925.5
>60 years old6.511.4
EducationElementary0.00.2
Secondary2.45.9
Technical16.75.9
Higher education55.055.9
Masters22.217.2
Ph.D.3.614.8
Current occupationWork as a full-time employee39.238.4
Work as a freelancer19.116.2
Work in your own company12.98.1
Work at home10.83.1
Work as a part-time employee7.20
Unemployed6.09.4
Retired/pensioner2.615.1
Student2.29.8
* Source: primary data. [43].
Table 2. Food buying and food wastage behaviors.
Grocery ShoppingAlways PlanSometimes Plan
PeruBrazilPeruBrazil
Using a shopping list57.9%51.9%39.0%44.0%
During the quarantine period, how have you bought your groceries?
At stores74.4%79.3%83.7%82.5%
Home delivery25.6%20.7%16.3%17.5%
During the quarantine period, which has been your preferred method of payment when buying groceries?
Cash32.2%7.7%30.5%8.4%
Debit card29.3%44.6%34.0%44.0%
Credit card26.4%43.9%27.7%45.8%
During the quarantine period, regarding the groceries you bought:
All the food was consumed; nothing was wasted67.0%54.0%56.0%49.4%
Part of the food was wasted31.5%45.6%41.8%50.0%
During the quarantine, why have you had to throw away food?
Cooking in excess27,1%13.0%24.8%19.3%
Food has been sitting in the refrigerator for too long17,2%22.5%22.0%19.3%
Bad smell, appearance, or taste of food7.3%7.4%6.4%7.8%
Improperly stored food5.5%2.1%7.8%7.8%
Source: primary data.
Table 3. Multiple regression analysis results.
Model: Dependent Variable = Economic Value of WasteHypothesisPeruBrazil **
Coefficient βStatistic tp-ValueCoefficient βStatistic tp-Value
Constant −1.613−0.5000.618−2.364−1.1560.248
Intention to reduce food wasteWL10.77329.0260.000 *0.82236.0300.000 *
Food purchase planning routinesWL2−1.407−1.6950.091−0.338−0.8100.418
Shopping routines for on-sale food itemsH30.0310.1870.851−0.975−2.0750.039 *
Understanding food labelsH4−0.470−0.7260.468−0.496−1.3430.180
Leftover and uneaten food Management routines H53.0267.6570.000 *2.3288.2730.000 *
Food waste prevention activitiesH6−1.040−1.2020.230−0.254−0.3720.710
R2 adjusted 0.785 0.850
F 254.800 425.883
Sig. 0.000 0.000
N 418 458
* p-value < 0.05; ** Source: Schmitt et al. (2021) [43].
Table 4. Differences between Peru and Brazil.
Variables ConsideredHypothesisp-ValueDecision
Intention to reduce wasteH70.000 *H0 is rejected
Food purchase planning routinesH80.319H0 is not rejected
Shopping routines for on-sale food itemsH90.830H0 is not rejected
Understanding food labelsH100.531H0 is not rejected
Leftover and uneaten food management routinesH110.000 *H0 is rejected
Food wastage prevention activitiesH120.000 *H0 is rejected
Average food expensesH130.306H0 is not rejected
* p-value < 0.05.
Publisher’s Note: MDPI stays neutral with regard to jurisdictional claims in published maps and institutional affiliations.

