
Determination of NPS Pollutant Unit Loads from Different Landuses
by
 , , , and
Jiyeon Choi
1 ,
,
Baekyung Park
1,*,
Jinsun Kim
1,
Soyoung Lee
2,
Jichul Ryu
3,
Kyunghyun Kim
1 and
Yongseok Kim
1 1
Water Environment Research Department, National Institute of Environmental Research, Incheon 22689, Korea
2
Han River Environment Research Center, National Institute of Environmental Research, Yangpyeong-gun 12585, Korea
3
Research Strategy and Planning Division, National Institute of Environmental Research, Incheon 22689, Korea
*
Author to whom correspondence should be addressed.
Sustainability 2021, 13(13), 7193; https://doi.org/10.3390/su13137193
Submission received: 31 May 2021
/
Revised: 20 June 2021
/
Accepted: 24 June 2021
/
Published: 26 June 2021
(This article belongs to the Special Issue Application of Wetlands as Nature Based Solutions for Ecological Service)
Abstract
:This study aimed to estimate pollutant unit loads for different landuses and pollutants that reflected long-term runoff characteristics of nonpoint source (NPS) pollutants and recent environmental changes. During 2008–2014, 2026 rainfall events were monitored. The average values of antecedent dry days, total rainfall, rainfall intensity, rainfall duration, runoff duration, and runoff coefficient for each landuse were 3.8–5.9 d, 35.2–65.0 mm, 2.9–4.1 mm/h, 12.5–20.4 h, 12.4–27.9 h, and 0.24–0.45, respectively. Uplands (UL) exhibited high suspended solids (SS, 606.2 mg/L), total nitrogen (TN, 7.38 mg/L), and total phosphorous (TP, 2.27 mg/L) levels, whereas the runoff coefficient was high in the building sites (BS), with a high impervious surface ratio. The event mean concentration (EMC) for biological oxygen demand (BOD) was the highest in BS (8.0 mg/L), while the EMC was the highest in BS (in the rainfall range <10 mm) and UL and forest land (in the rainfall range >50 mm). The unit loads for BOD (1.49–17.76 kg/km2·d), TN (1.462–10.147 kg/km2·d), TP (0.094–1.435 kg/km2·d), and SS (15.20–327.70 kg/km2·d) were calculated. The findings can be used to manage NPS pollutants and watershed environments and implement relevant associated management systems.
1. Introduction
Quantification of nonpoint source (NPS) pollutants is an essential factor for introducing suitable pollution control measures and analyzing the policy effects for implementing national water management plans. In South Korea, the total maximum daily load (TMDL) program, a representative policy, promoted the quantification of NPS pollutants. This program used unit loads for quantifying pollutant loads from land, and was first introduced in 1999 to assess the total water quality system of the Han River. Since its legal enforcement in 2004, the total TMDL program has been included and specified in the technical guidelines for total water pollution control systems. The technical guidelines recommend that the survey results of the target area must be used in principle for assessing the NPS pollution loads, while the unit loads should be used for areas wherein NPS pollutant survey is difficult [1].
Countriesthat have adopted the TMDL program, including South Korea, quantify pollution loads using the unit loads. Most countries generally use survey results and basin model simulation of the target areas, but the use of unit load for areas with model coefficient calibrations and measurements is difficult. In the U.S., the NPS load was calculated to establish the TMDL program for stormwater runoff. The load calculation methods are largely divided into simple methods, which directly survey the target area, and detailed methods, which calculate the load by applying the unit load method and watershed model by statistically analyzing the survey results of other areas. A comparison of the load calculation methods in 17 regions in the U.S. showed that the simple and detailed methods were used in nine and eight regions, respectively. In addition, the watershed model was verified through the event mean concentration (EMC) of the target area or other areas [2,3]. In Japan, the NPS pollution load was calculated to establish the reduction goal of the total water quality system and to apply the NPS unit loads for agricultural lands, urban areas, and forests. However, the unit loads were measured multiple times, repeatedly verified in the control watersheds, and finally determined through consultation with regional governments and experts before applying the unit loads to the control watersheds [4].
Thus, the unit loads are an efficient tool for watershed and pollutant management, since they allow quantification of NPS pollutants in large areas or areas wherein calculating or measuring the NPS pollutants is difficult [5]. South Korea also uses unit loads to examine pollution loads in such areas. The currently used unit loads were derived through a research project of the Ministry of Environment (MOE) in 1995 [6]. After selecting a representative watershed for each water system of four major rivers, five landuse categories (building sites, BS; paddy fields, PF; uplands, UL; forest lands, FL; and ranches) were surveyed for three months from June to September, 1995. The survey results for 297 rainfall events at 60 sites were used to calculate the biological oxygen demand (BOD), total nitrogen (TN), and total phosphorous (TP) unit loads for the different landuse categories. However, these unit loads exhibited high uncertainty because of short-term investigations for large unit load value of BS. Consequently, BS largely influenced the load calculation, thereby making it difficult to manage the loads; additionally, the investigation did not consider recent environmental changes [7,8,9]. Therefore, this study aimed to overcome the limitations of the existing unit loads by reflecting the latest NPS pollutants runoff characteristics considering climate, environmental, and landuse changes, river basin representation, and long-term scientific investigation. It presented the unit load for NPS pollutants in various landuses using monitoring results for 123 areas. The findings of this study can be used not only for managing NPS pollutants, but also for quantitative management of watershed environment, and thus, the results have potential applications for successful planning and implementation of the associated management systems.
2. Materials and Methods
2.1. Monitoring Sites
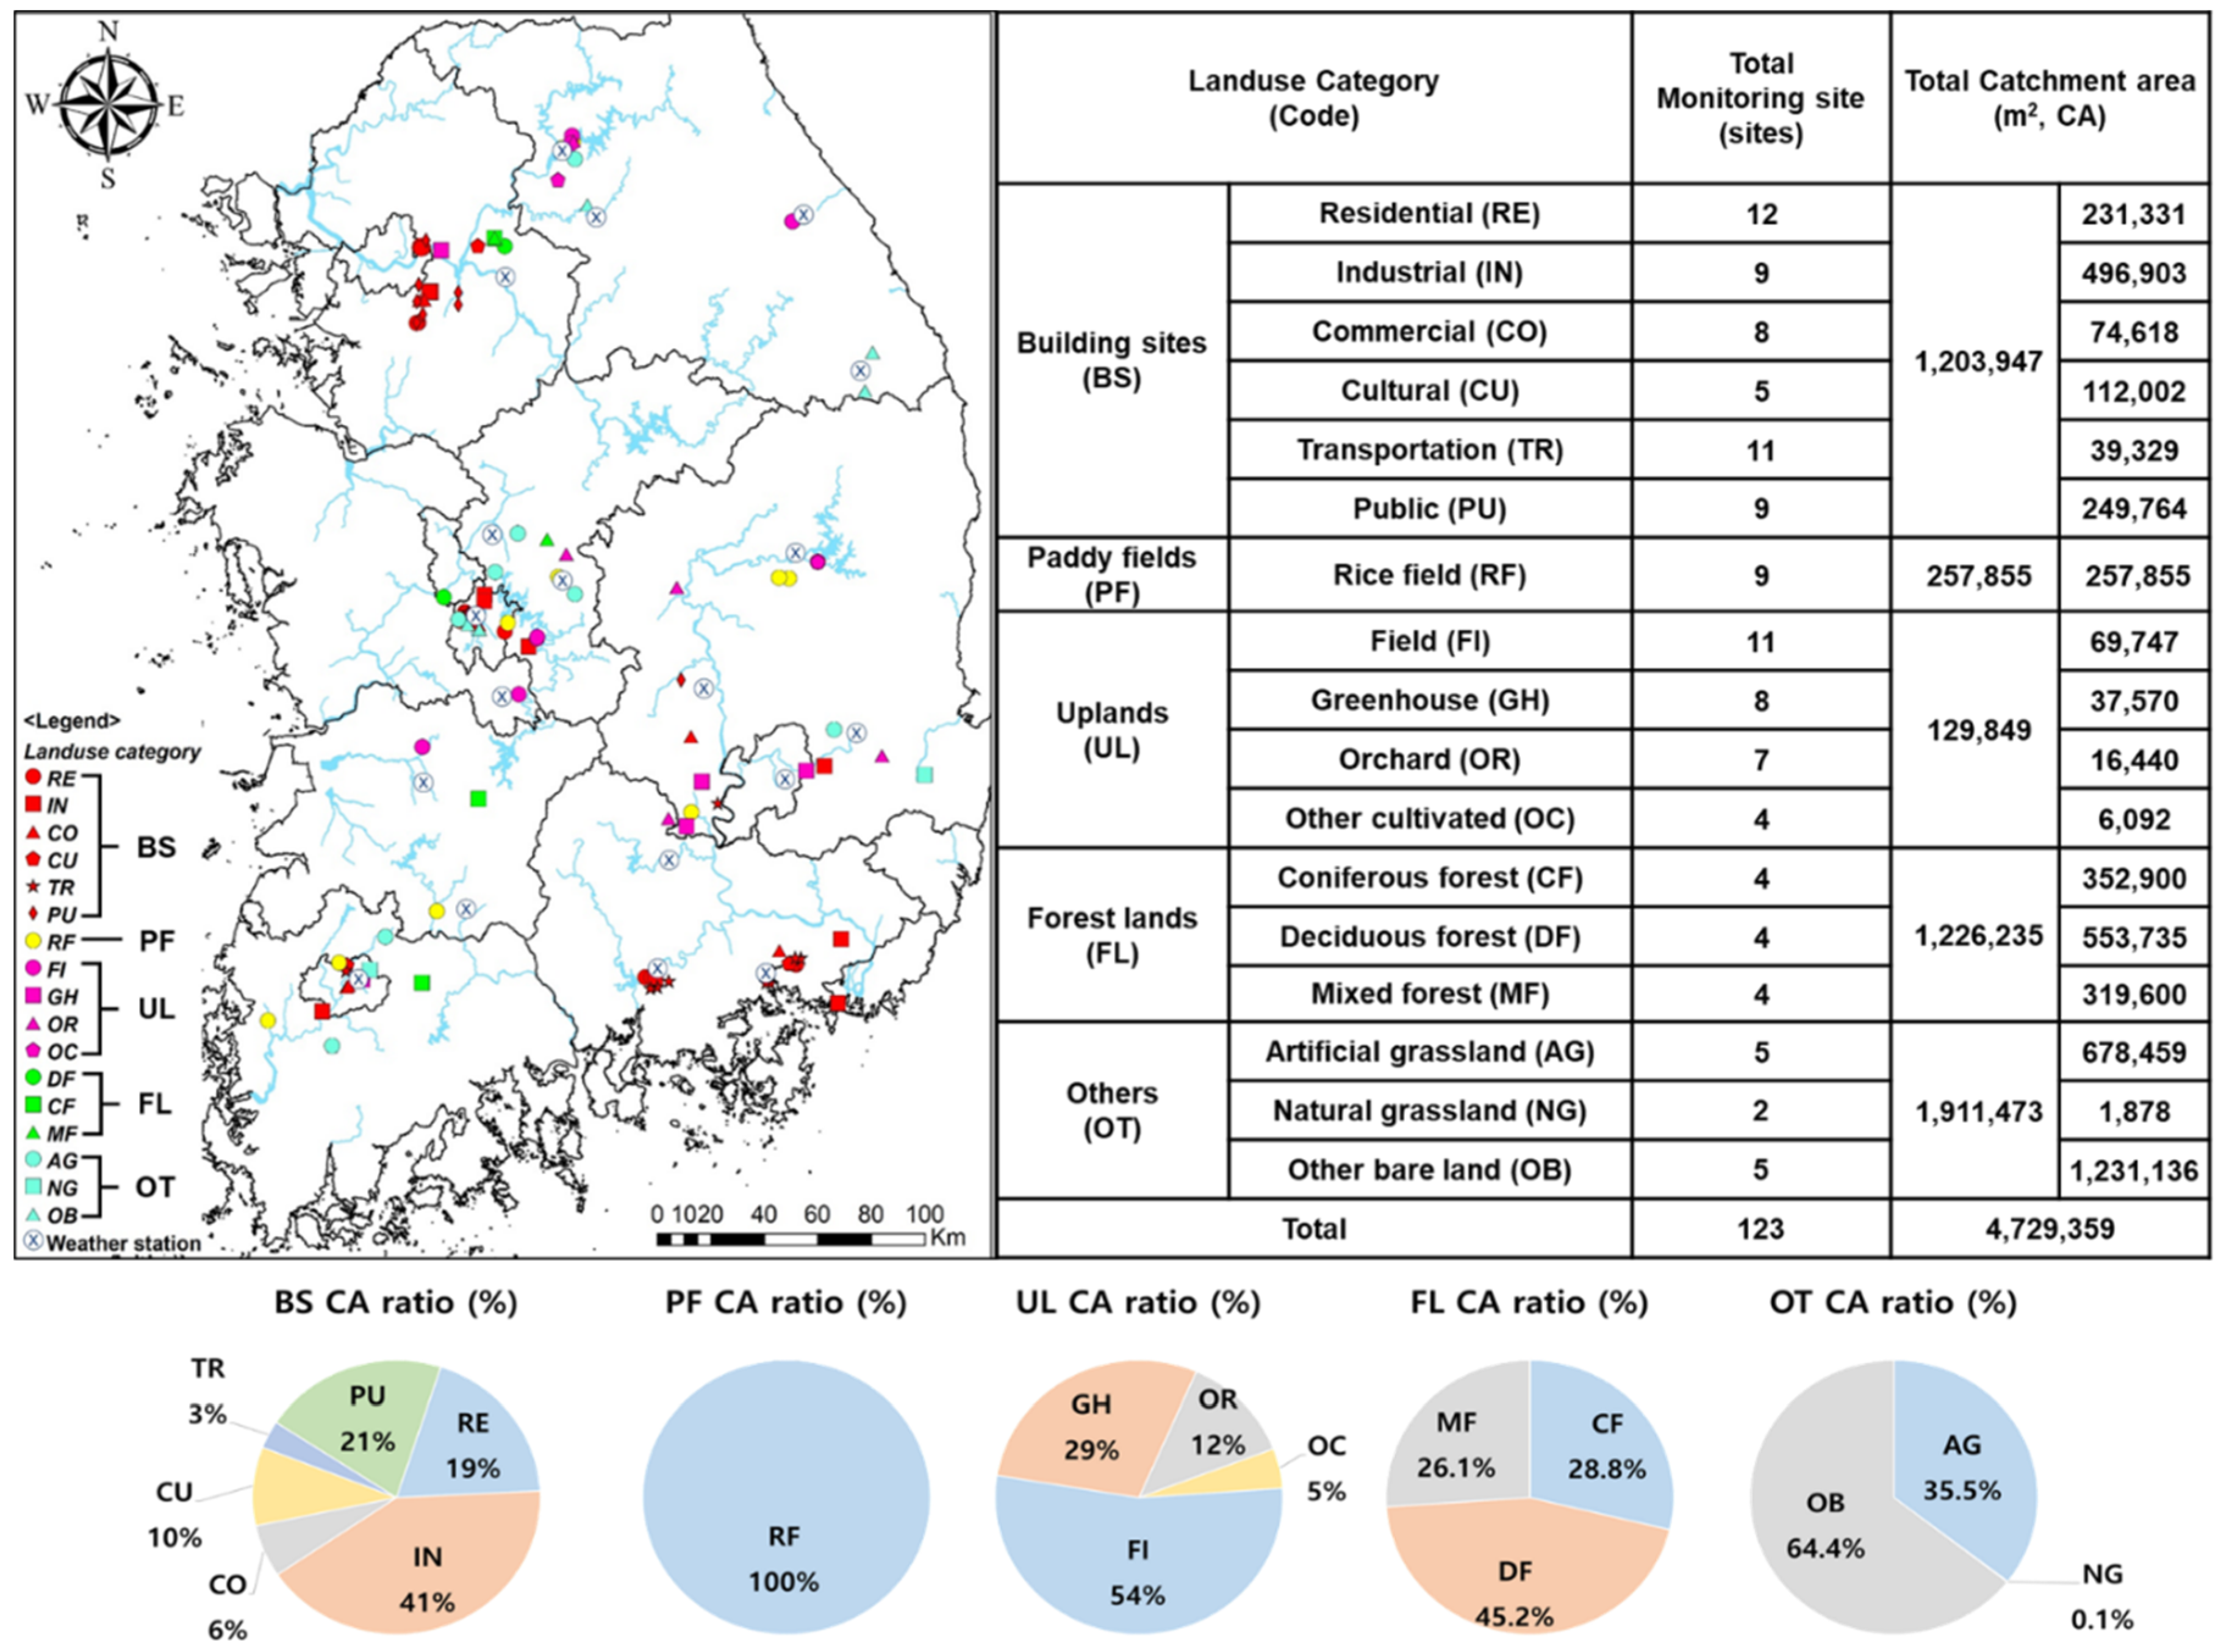
This study was conducted based on long-term monitoring and research on reduction methods for NPS pollutants in four major river basins (2007–2012) [10,11,12,13] and a research project for total monitoring and management methods for NPS pollutants (2013–2014) [14,15,16,17]. Figure 1 shows the geographical locations and status of the monitoring sites, classified into middle land cover categories, along with the number of monitoring sites for each river basin and catchment area and the monitoring site ratios. The monitoring sites (123) for 17 landuses, excluding five landuses, such as wetland and water areas, which are difficult to investigate based on the land cover map middle categories (22) given by the MOE, were selected considering the national representation, balance of river basins, and influence factors (e.g., amount of NPS pollutants, industry distribution, soil texture, slope, and crop types). Over 10 sites, such as residential areas (RE), transportation areas (TR), and fields (FI), which have a small catchment area, but a relatively high load of NPS pollutants, were monitored. In addition, 2–9 sites representing other (OT) landuses were monitored.
2.2. Investigation Method
Water quality and flow rates for each landuse classification category were investigated according to the stormwater runoff survey method [18]. Table 1 shows the landuse classification for monitoring stormwater runoff. Landuse Group I, including BS, PF, UL, and OT, were monitored for 2 h at an interval of 15 min since the initiation of stormwater runoff, and at an interval of 1 h after 2 h. If the runoff duration exceeded 6 h, the monitoring intervals were modified by adjusting the number of samples until the runoff flow ended. The landuse Group II, including FL and OT, were investigated at an interval of 1 h, since the initiation of stormwater runoff, and at an interval of 6 h when the runoff duration exceeded 24 h. If the runoff duration exceeded 48 h, the monitoring intervals were modified by adjusting the number of samples until the runoff flow ended. In addition, the criteria for conducting the appropriate number of investigations for each rainfall range in the stormwater runoff survey method were considered during monitoring.
2.3. Unit Load Calculation Method
The unit load was calculated using Equations (1)–(8) according to [18] based on the water quality and flow rate data derived through monitoring.
EMC represents the NPS pollutant concentration for each rainfall event and was calculated using the simultaneously measured flow rate and water quality data of stormwater runoff as follows:
where EMCx is the EMC (mg/L) for each rainfall event (x) and is determined by the ratio of the total pollutant mass and the total runoff for each rainfall event, Q is the runoff (m3/sec), C is the concentration of a specific pollutant (mg/L), Δt is the measurement time interval, and N is the total number of measurements.
The EMC for each rainfall range was calculated using the EMC for each rainfall event, as follows:
where EMCy is the EMC (mg/L) for each rainfall range (y), EMCx is the EMC (mg/L) for each stormwater runoff event (x) that belongs to the corresponding rainfall range (y), and M is the total number of measurements of the rainfall range (y).
The EMC for each landuse was calculated using the EMC for each rainfall range according to Equation (3):
where EMCz is the EMC (mg/L) for each landuse category (z), EMCy is the EMC (mg/L) for each rainfall range (y), M is the number of rainfall ranges, and fy is the ratio of the total rainfall volume for each rainfall range (y) calculated from the rainfall data during investigation.
The runoff coefficient for each rainfall event was calculated using the total rainfall volume of the rainfall event and the stormwater runoff depth as follows:
where the runoff coefficient (Rx) for each rainfall event is the ratio of the runoff depth and the total rainfall volume, Q is the runoff rate (m3/sec), P is the rainfall (mm), A is the catchment area (m2), N is the total number of runoff measurements, and M is the total number of rainfall volume measurements.
The runoff coefficient for each rainfall range was calculated using the runoff coefficient for each rainfall event that belongs to the corresponding rainfall range as follows:
where Ry is the runoff coefficient for each rainfall range (y), Rx is the runoff coefficient for each stormwater runoff event (x) that belongs to the corresponding rainfall range (y), and M is the number of investigations of the rainfall range.
The runoff coefficient for each landuse category was calculated using the runoff coefficient for each rainfall range as follows:
where Rz is the runoff coefficient for each landuse category (z), Ry is the runoff coefficient for each rainfall range (y), M is the number of rainfall ranges, and fy is the ratio of the total rainfall volume for each rainfall range (y) calculated from the rainfall data during the investigation period.
The pollution load for each landuse that flowed out because of rainfall events during the investigation period can be expressed as follows:
where Lz is the total pollution load (kg/km2) for each landuse category that flowed out by rainfall events during the investigation period, Pt is the total rainfall (mm) for each rainfall event that occurred during the investigation period, EMCz is the EMC for each landuse category, and Rz is the runoff coefficient for each landuse category.
Based on the pollution load for each landuse calculated using Equation (7), the unit load was calculated using Equation (8):
where Lzd is the unit load (kg/km2/d) generated for each landuse category, N is the number of rainfall events that occurred during the investigation period, and Nd is the total number of days of the investigation period.
3. Results
3.1. Analysis of Rainfall Characteristics
Rainfall runoff was monitored for approximately 7 years from 2008 to 2014. Table 2 shows the total number of rainy days and rainfall volume for each rainfall range in the study area during 2008–2014. Furthermore, the data from 19 weather stations near the study sites were analyzed [19]. The ratio of the total number of rainy days during 2008–2014 was 75%, with the highest in the <10 mm rainfall range, followed by 16% in the 10–30 mm range and 5% both in the 30–50 mm and >50 mm ranges. The total rainfall volume was 36%, with the highest in the >50 mm rainfall range, followed by the 10–30 mm (28%), 30–50 mm (20%), and <10 mm (16%) ranges.
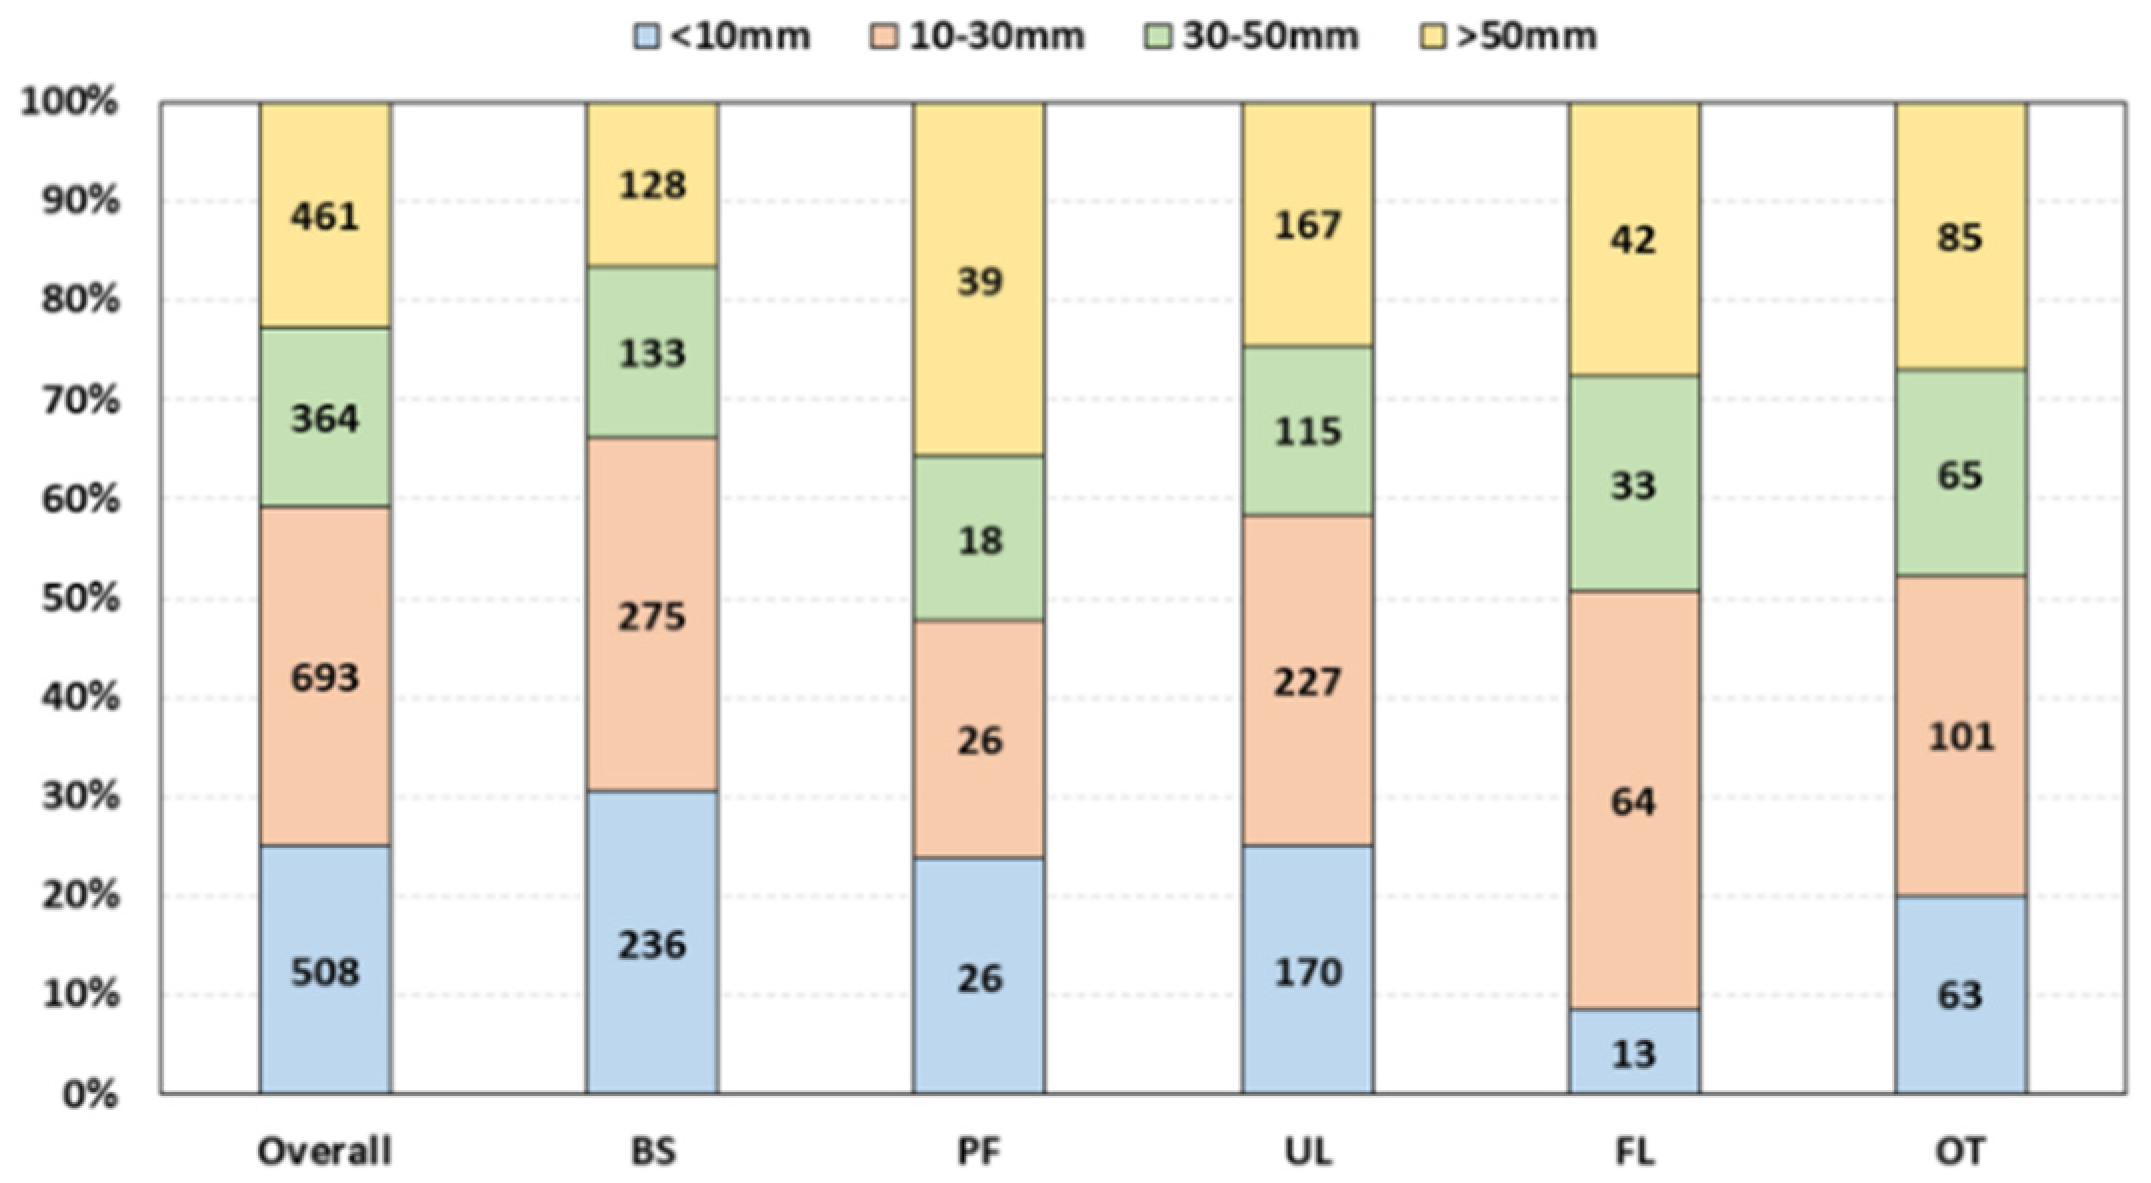
Figure 2 shows the total number of rainfall events (2026) classified by rainfall range during the monitoring of the selected 123 sites. The overall monitoring frequency for each rainfall range was 18%–34%. In particular, the proportion in the 10–30 mm rainfall range was 34%, indicating the highest proportion of monitoring in this rainfall range. Most of the monitoring was performed in the 10–30 mm rainfall range for all landuses except PF. In particular, in the case of FL, the results showed that 42% of the total monitoring was performed in the 10–30 mm rainfall range, and most runoff did not occur in rainfall events below the 10 mm rainfall range. This is similar to the results of some other studies [20,21,22,23]. For the same reason, in PF, 36% of the total monitoring was performed in the rainfall range of 50 mm or more. Since each rainfall range during rainfall was monitored according to the appropriate number of investigations as suggested by the National Institute for Environmental Research [18], the requirements of representation for each rainfall range were fulfilled.
3.2. Monitoring Results
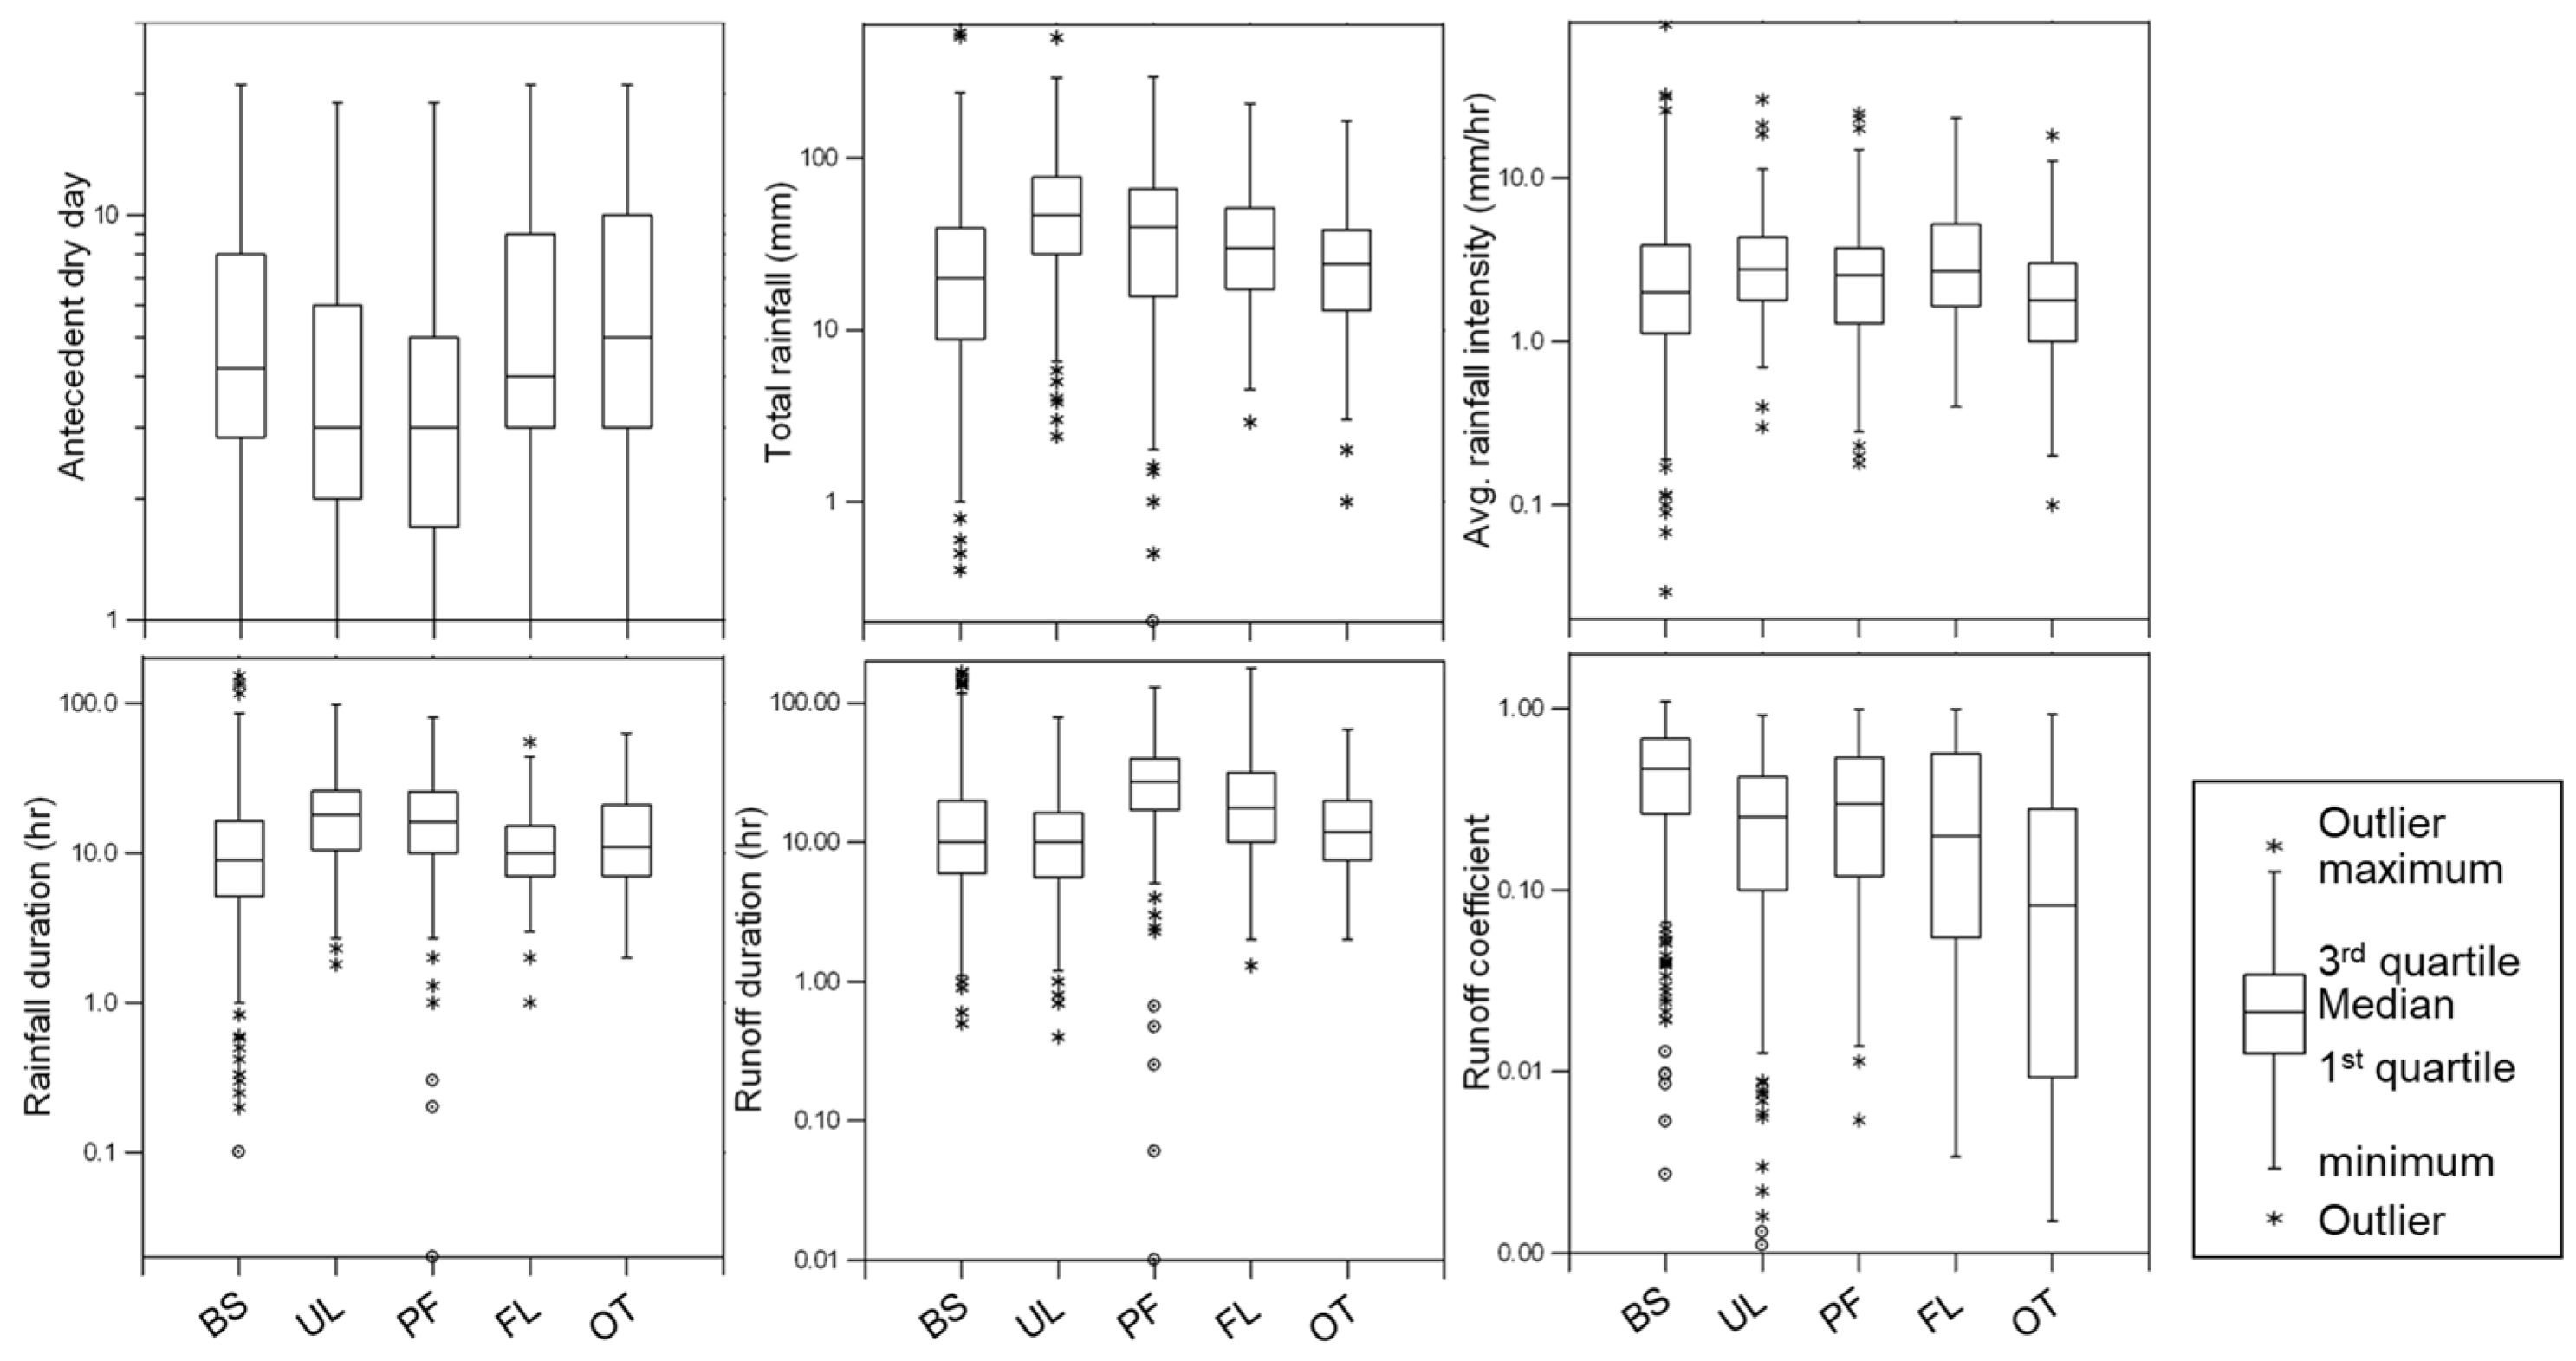
Figure 3 shows the monitoring results for antecedent dry day (ADD), total rainfall, rainfall duration, average rainfall intensity, runoff duration, and runoff coefficient for each landuse. The average ADD range by different landuses is approximately 4–6 days, which is relatively similar. The average rainfall was investigated in the order of OT (44.4 mm), PF (41.2 mm), FL (39.6 mm), and BS (35.2 mm), which were the highest in UL at 65.0 mm. The average rainfall duration was also highest in UL (20.4 h), followed by PF (18.2 h), OT (17.5 h), BS (13.8 h), and FL (12.5 h). In UL, OT, and PF, monitoring was performed on rainfall events with a total rainfall of 40 mm and a rainfall duration of 17 h or longer, whereas monitoring was performed in a relatively low range for FL and BS. The average rainfall intensity of FL (4.1 mm/h) and BS (3.5 mm/h) was higher than that of OT (3.0 mm/h) and PF (2.9 mm/h). On the other hand, UL, which has the largest total rainfall and rainfall duration, has an average rainfall intensity of 3.6 mm/h. The average runoff duration was over 24 h for FL (34.2 h) and PF (27.9 h), followed by OT (18.7 h), BS (15.4 h), and UL (12.7 h). For the average runoff coefficient, BS was the highest at 0.45, followed by PF (0.34), UL (0.29), FL (0.29), and OT (0.24).
3.3. EMC Results
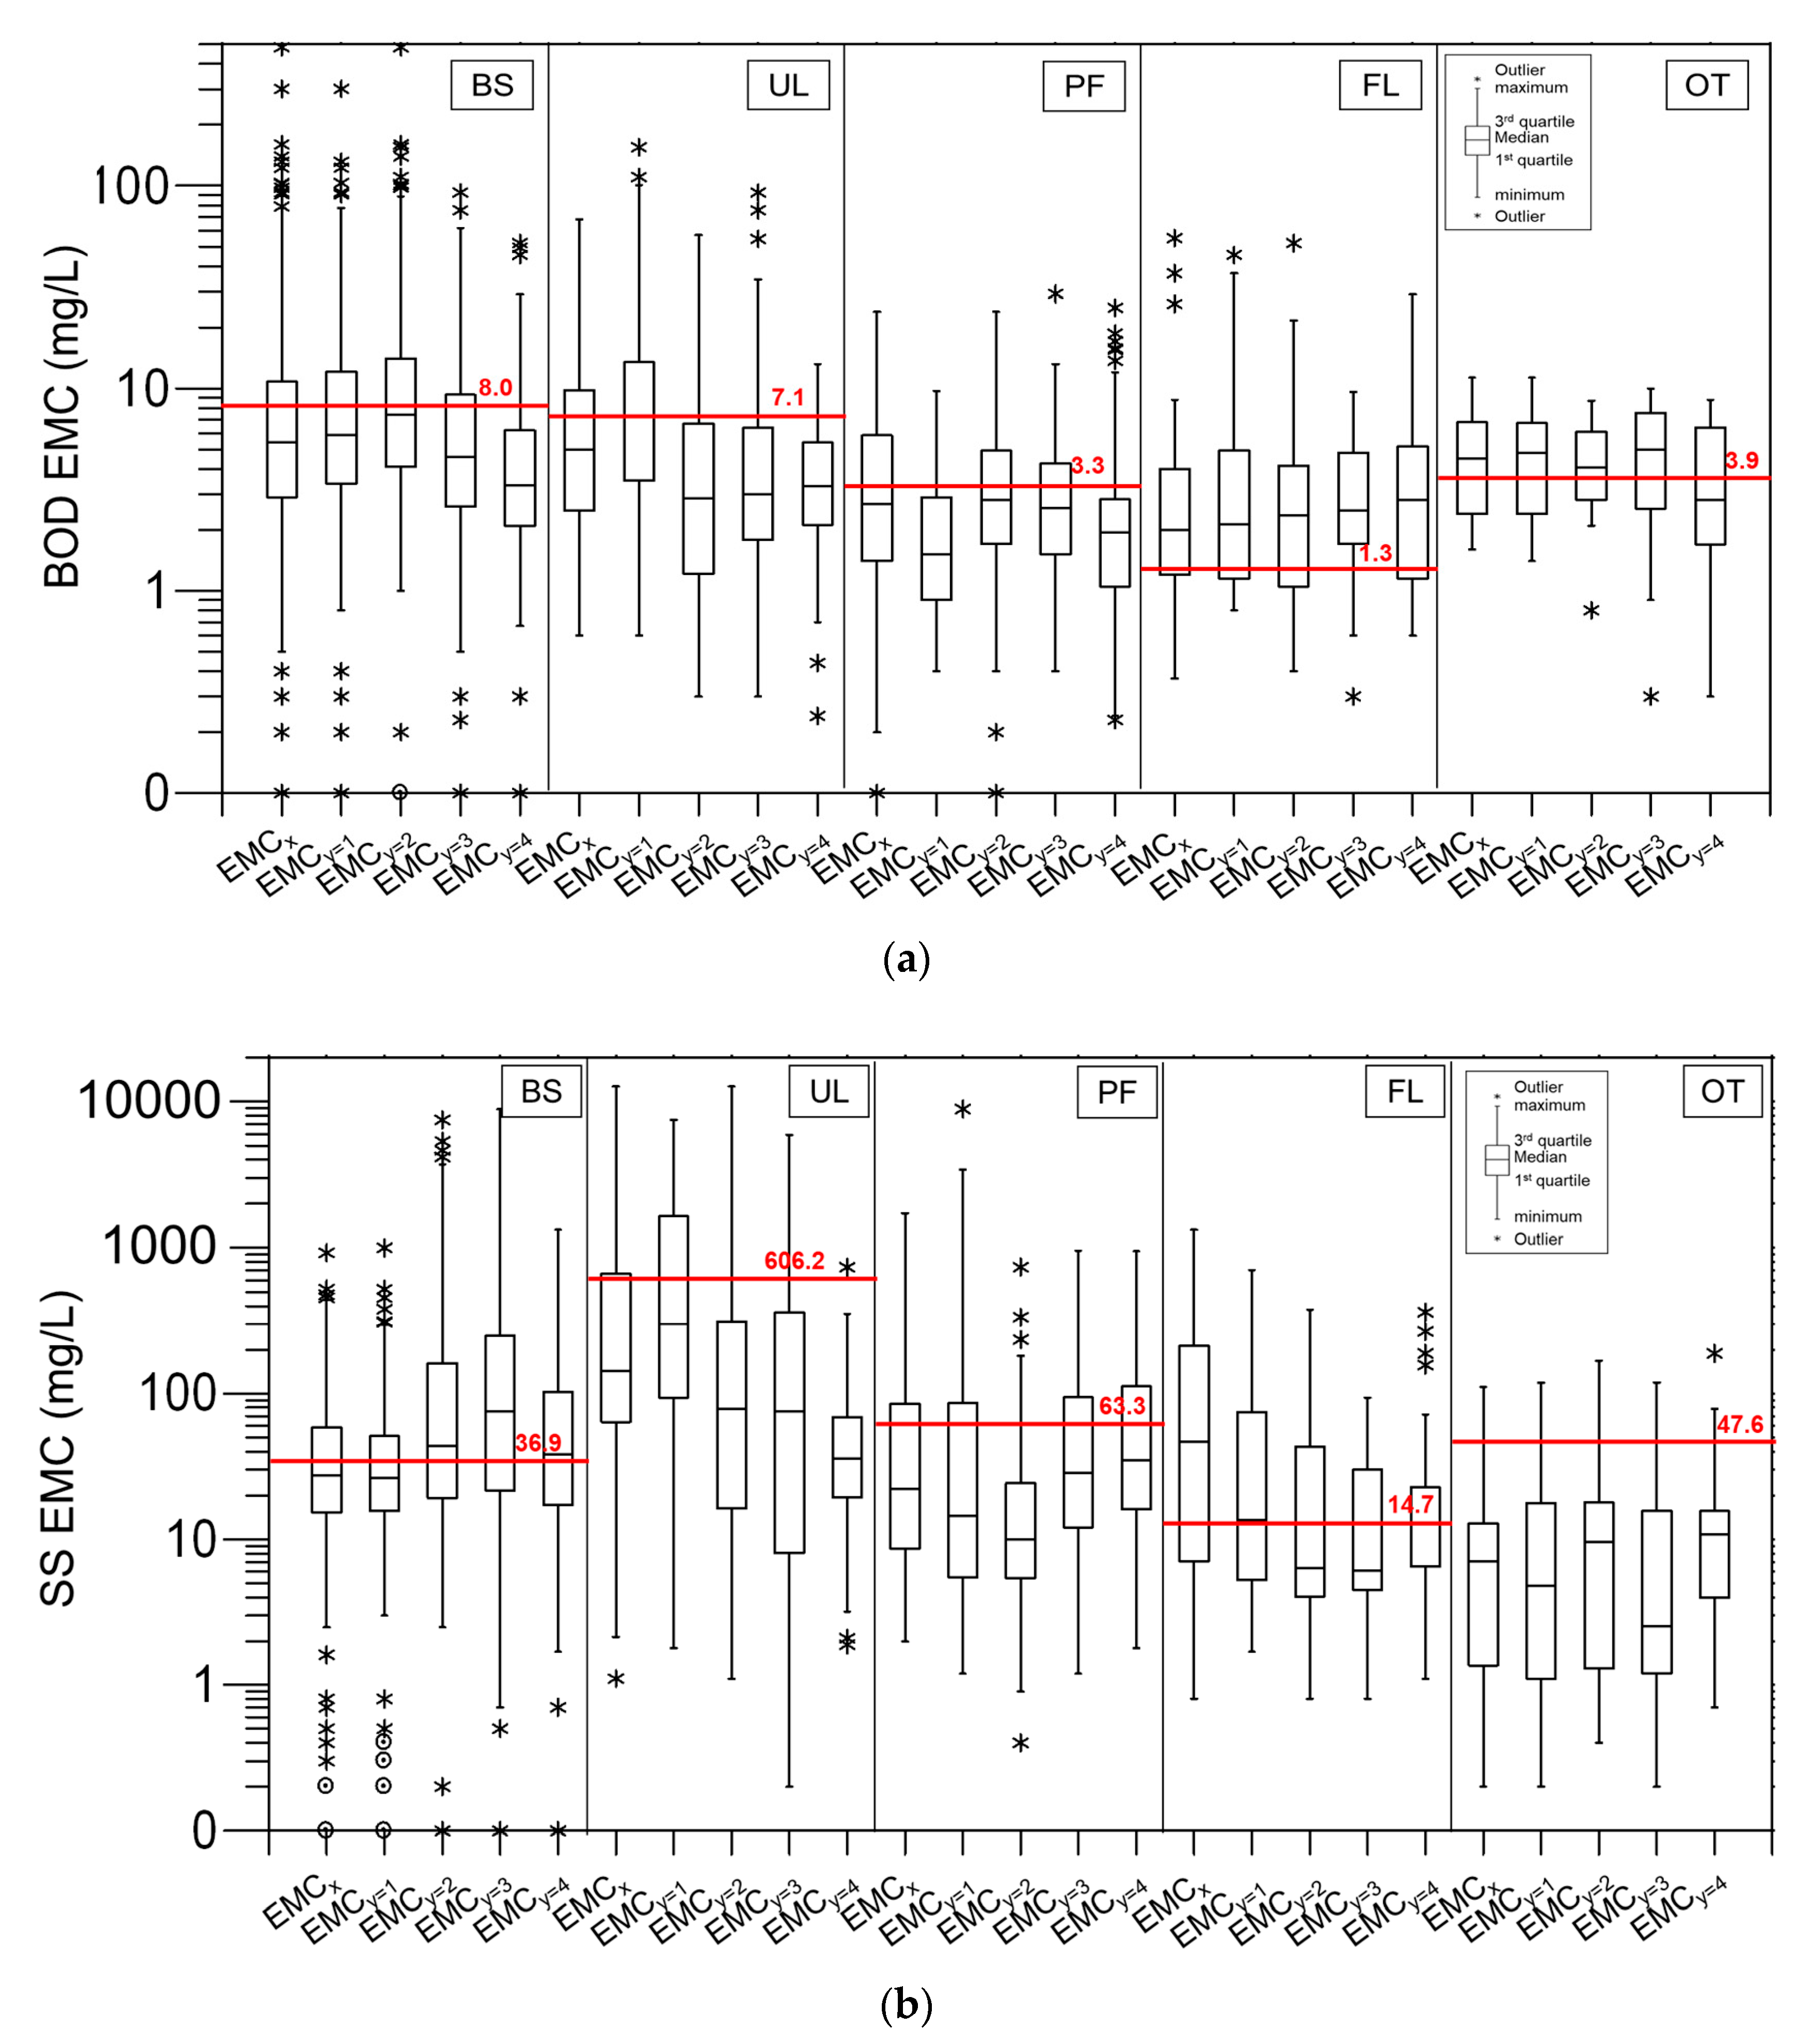
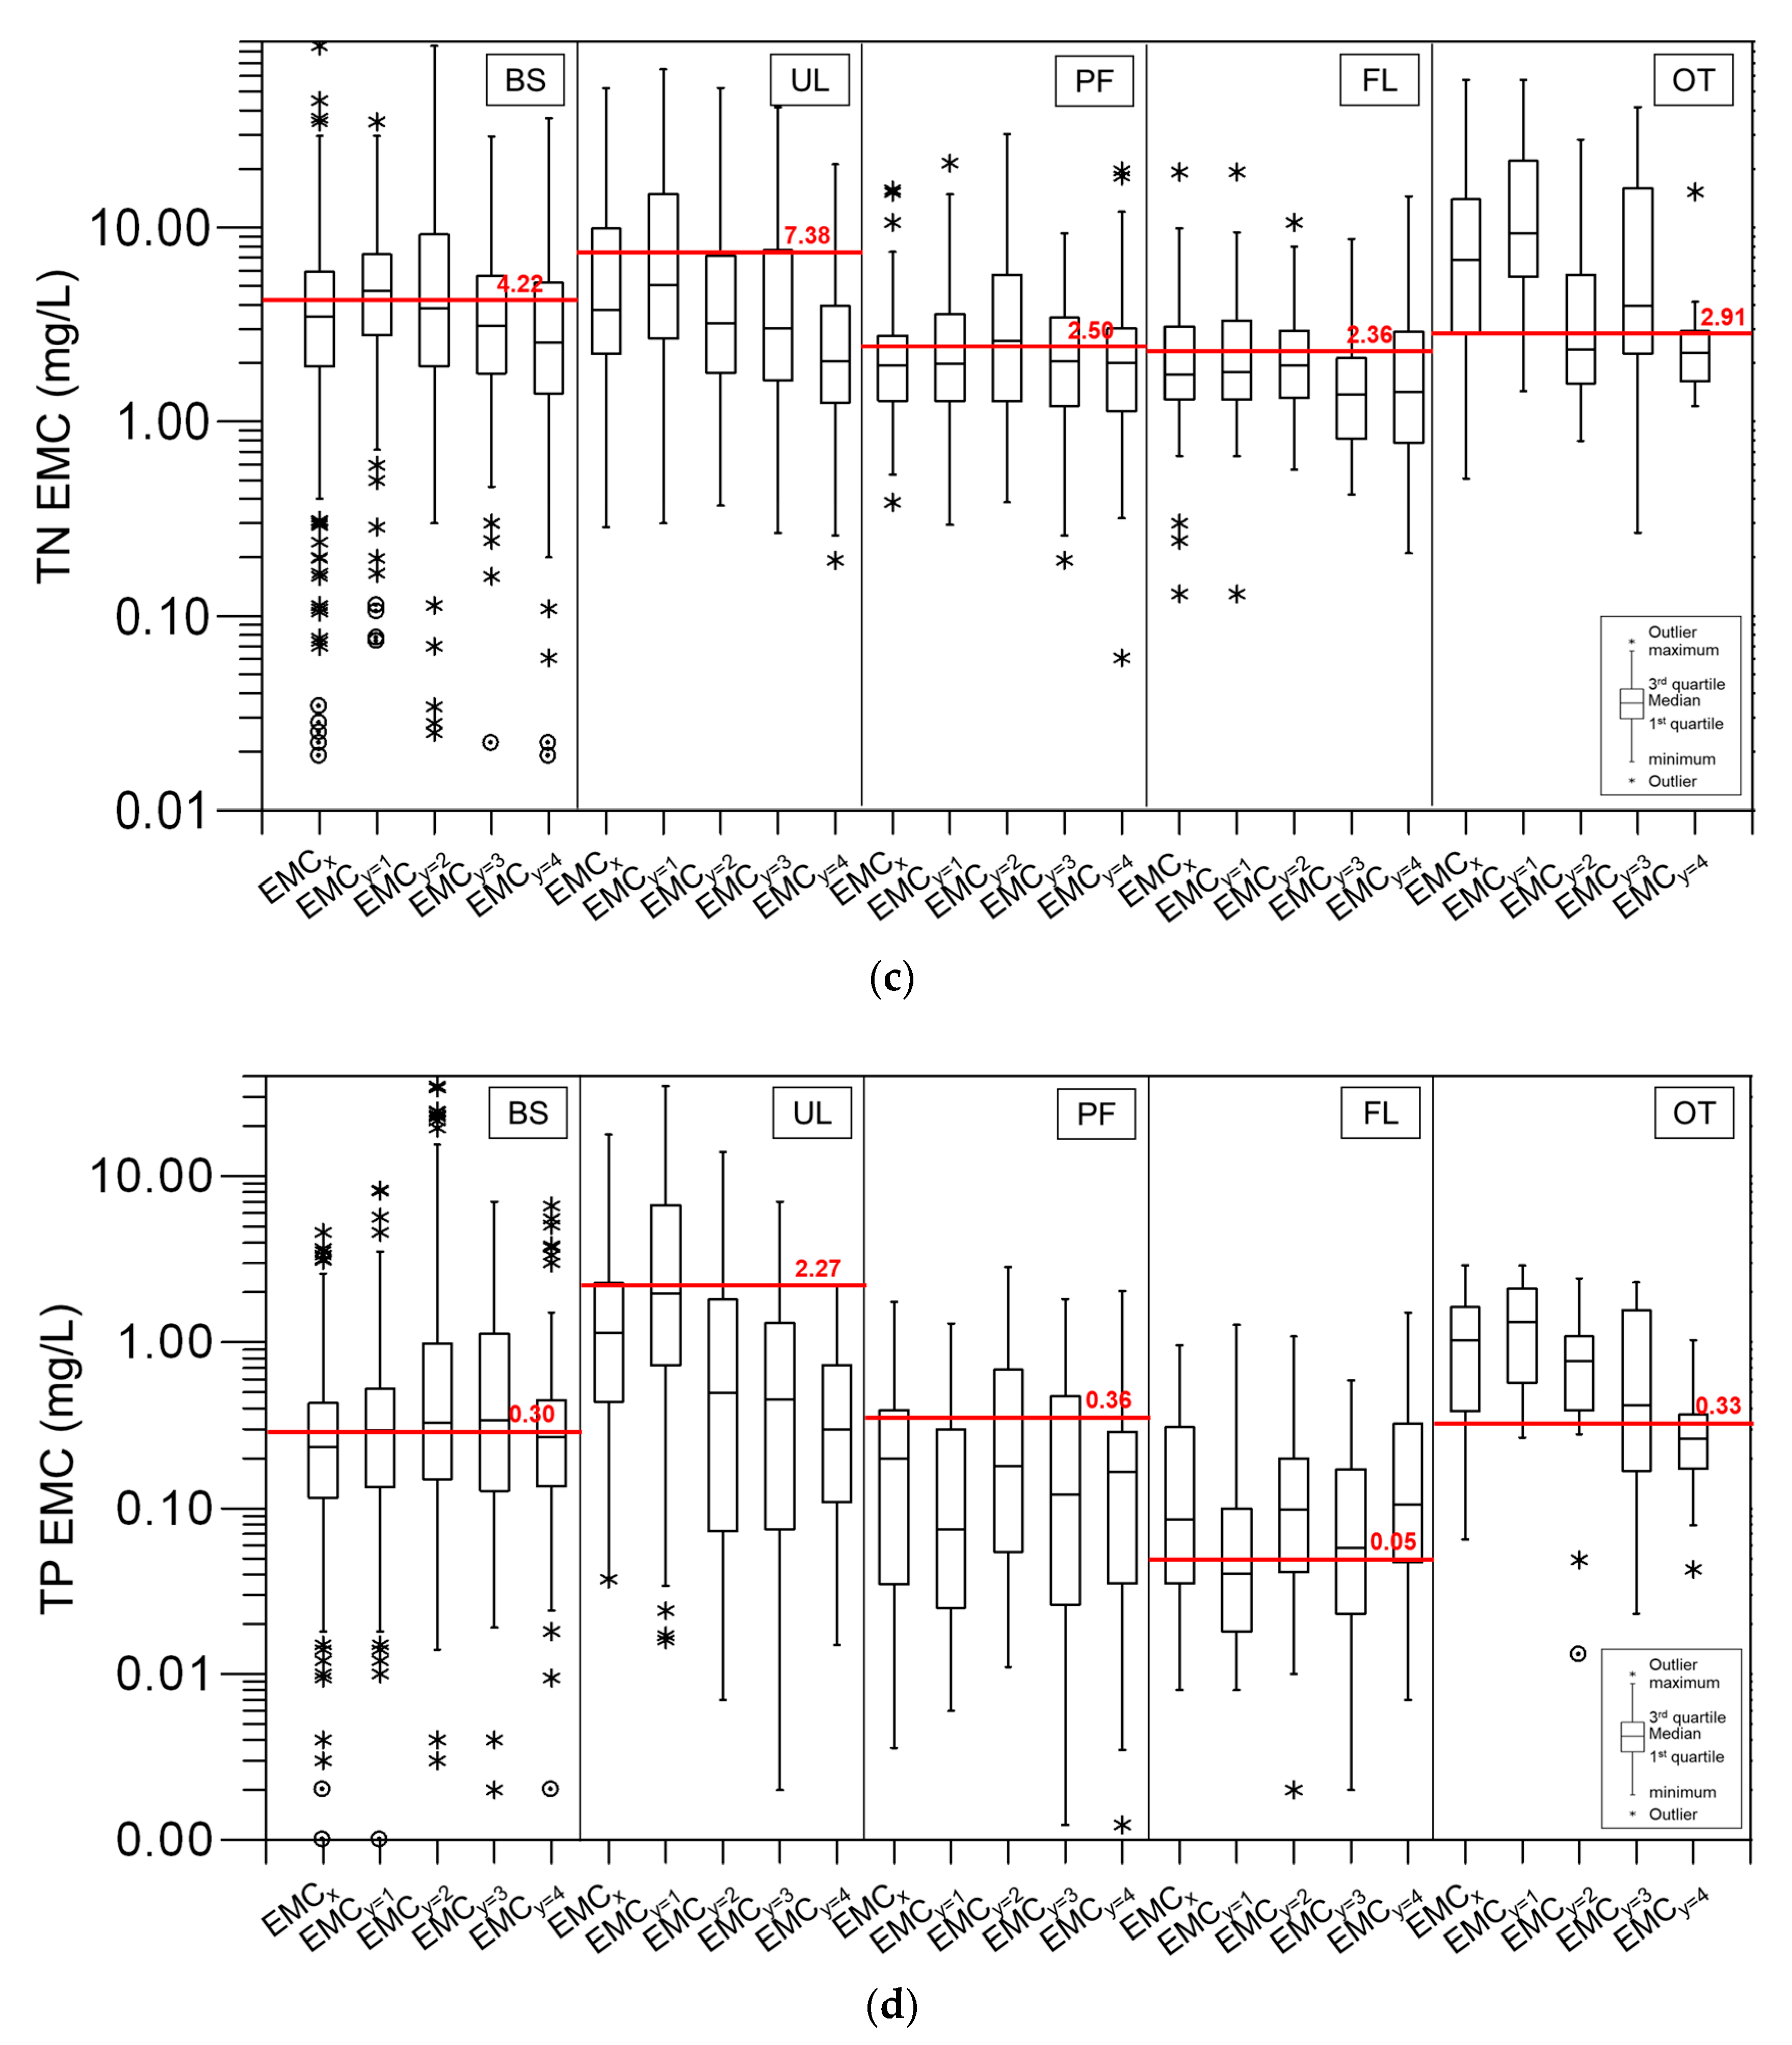
The pollutant concentrations of typical water quality parameters in various landuse runoff studies are generally quantified by means of the EMC. The statistical analysis results for EMC for each landuse are shown in Figure 4. Landuse related pollutants’ EMC showed a BOD of 8.0 mg/L, SS of 36.9 mg/L, TN of 4.22 mg/L, and TP of 0.30 mg/L in BS. UL was investigated with a BOD of 7.1 mg/L, SS of 606.2 mg/L, TN of 7.38 mg/L, and TP of 2.27 mg/L. PF was detected with a BOD of 3.3 mg/L, SS of 63.3 mg/L, TN of 2.50 mg/L, and TP of 0.36 mg/L. FL was detected with a BOD of 1.3 mg/L, SS of 14.7 mg/L, TN of 2.36 mg/L, and TP of 0.05 mg/L. Finally, OT was analyzed with a BOD of 3.9 mg/L, SS of 47.6 mg/L, TN of 2.91 mg/L, and TP of 0.33 mg/L.
The BOD EMC was higher in BS, which is a region closely related to the human living environment, than in other landuses. Agricultural areas UL and PF also showed high concentrations of SS, TN, and TP EMC. In OT, human activity (such as lawn care) was found to generate some pollutants and nutrients. On the other hand, in the case of FL, which is the area with the least human activity, the lowest EMC was shown in all pollutant parameters as compared to other landuses.
Furthermore, the EMC in BS was the highest in the <10 mm rainfall range, that is, during small-scale rainfall events. In addition, the EMC was the highest in the 10–30 mm rainfall range for PF, and in the >50 mm rainfall range for UL and FL. Therefore, early rainfall management is required to control NPS pollutants for BS, while effective reduction of NPS pollutants in other landuse categories, such as UL, would be possible only when medium- and large-scale rainfall events are managed in advance.
Given that stormwater runoffs are associated with high uncertainties due to landuse type and rainfall characteristics, the EMC values can also be affected, as reflected by the wide distribution and deviation of the EMC values found in several studies [5,8,9,20,21,22,23,24,25,26,27,28,29,30,31,32,33,34,35,36,37,38,39,40,41,42,43,44,45,46,47,48,49,50,51,52].
3.4. Pollutant Unit Loads
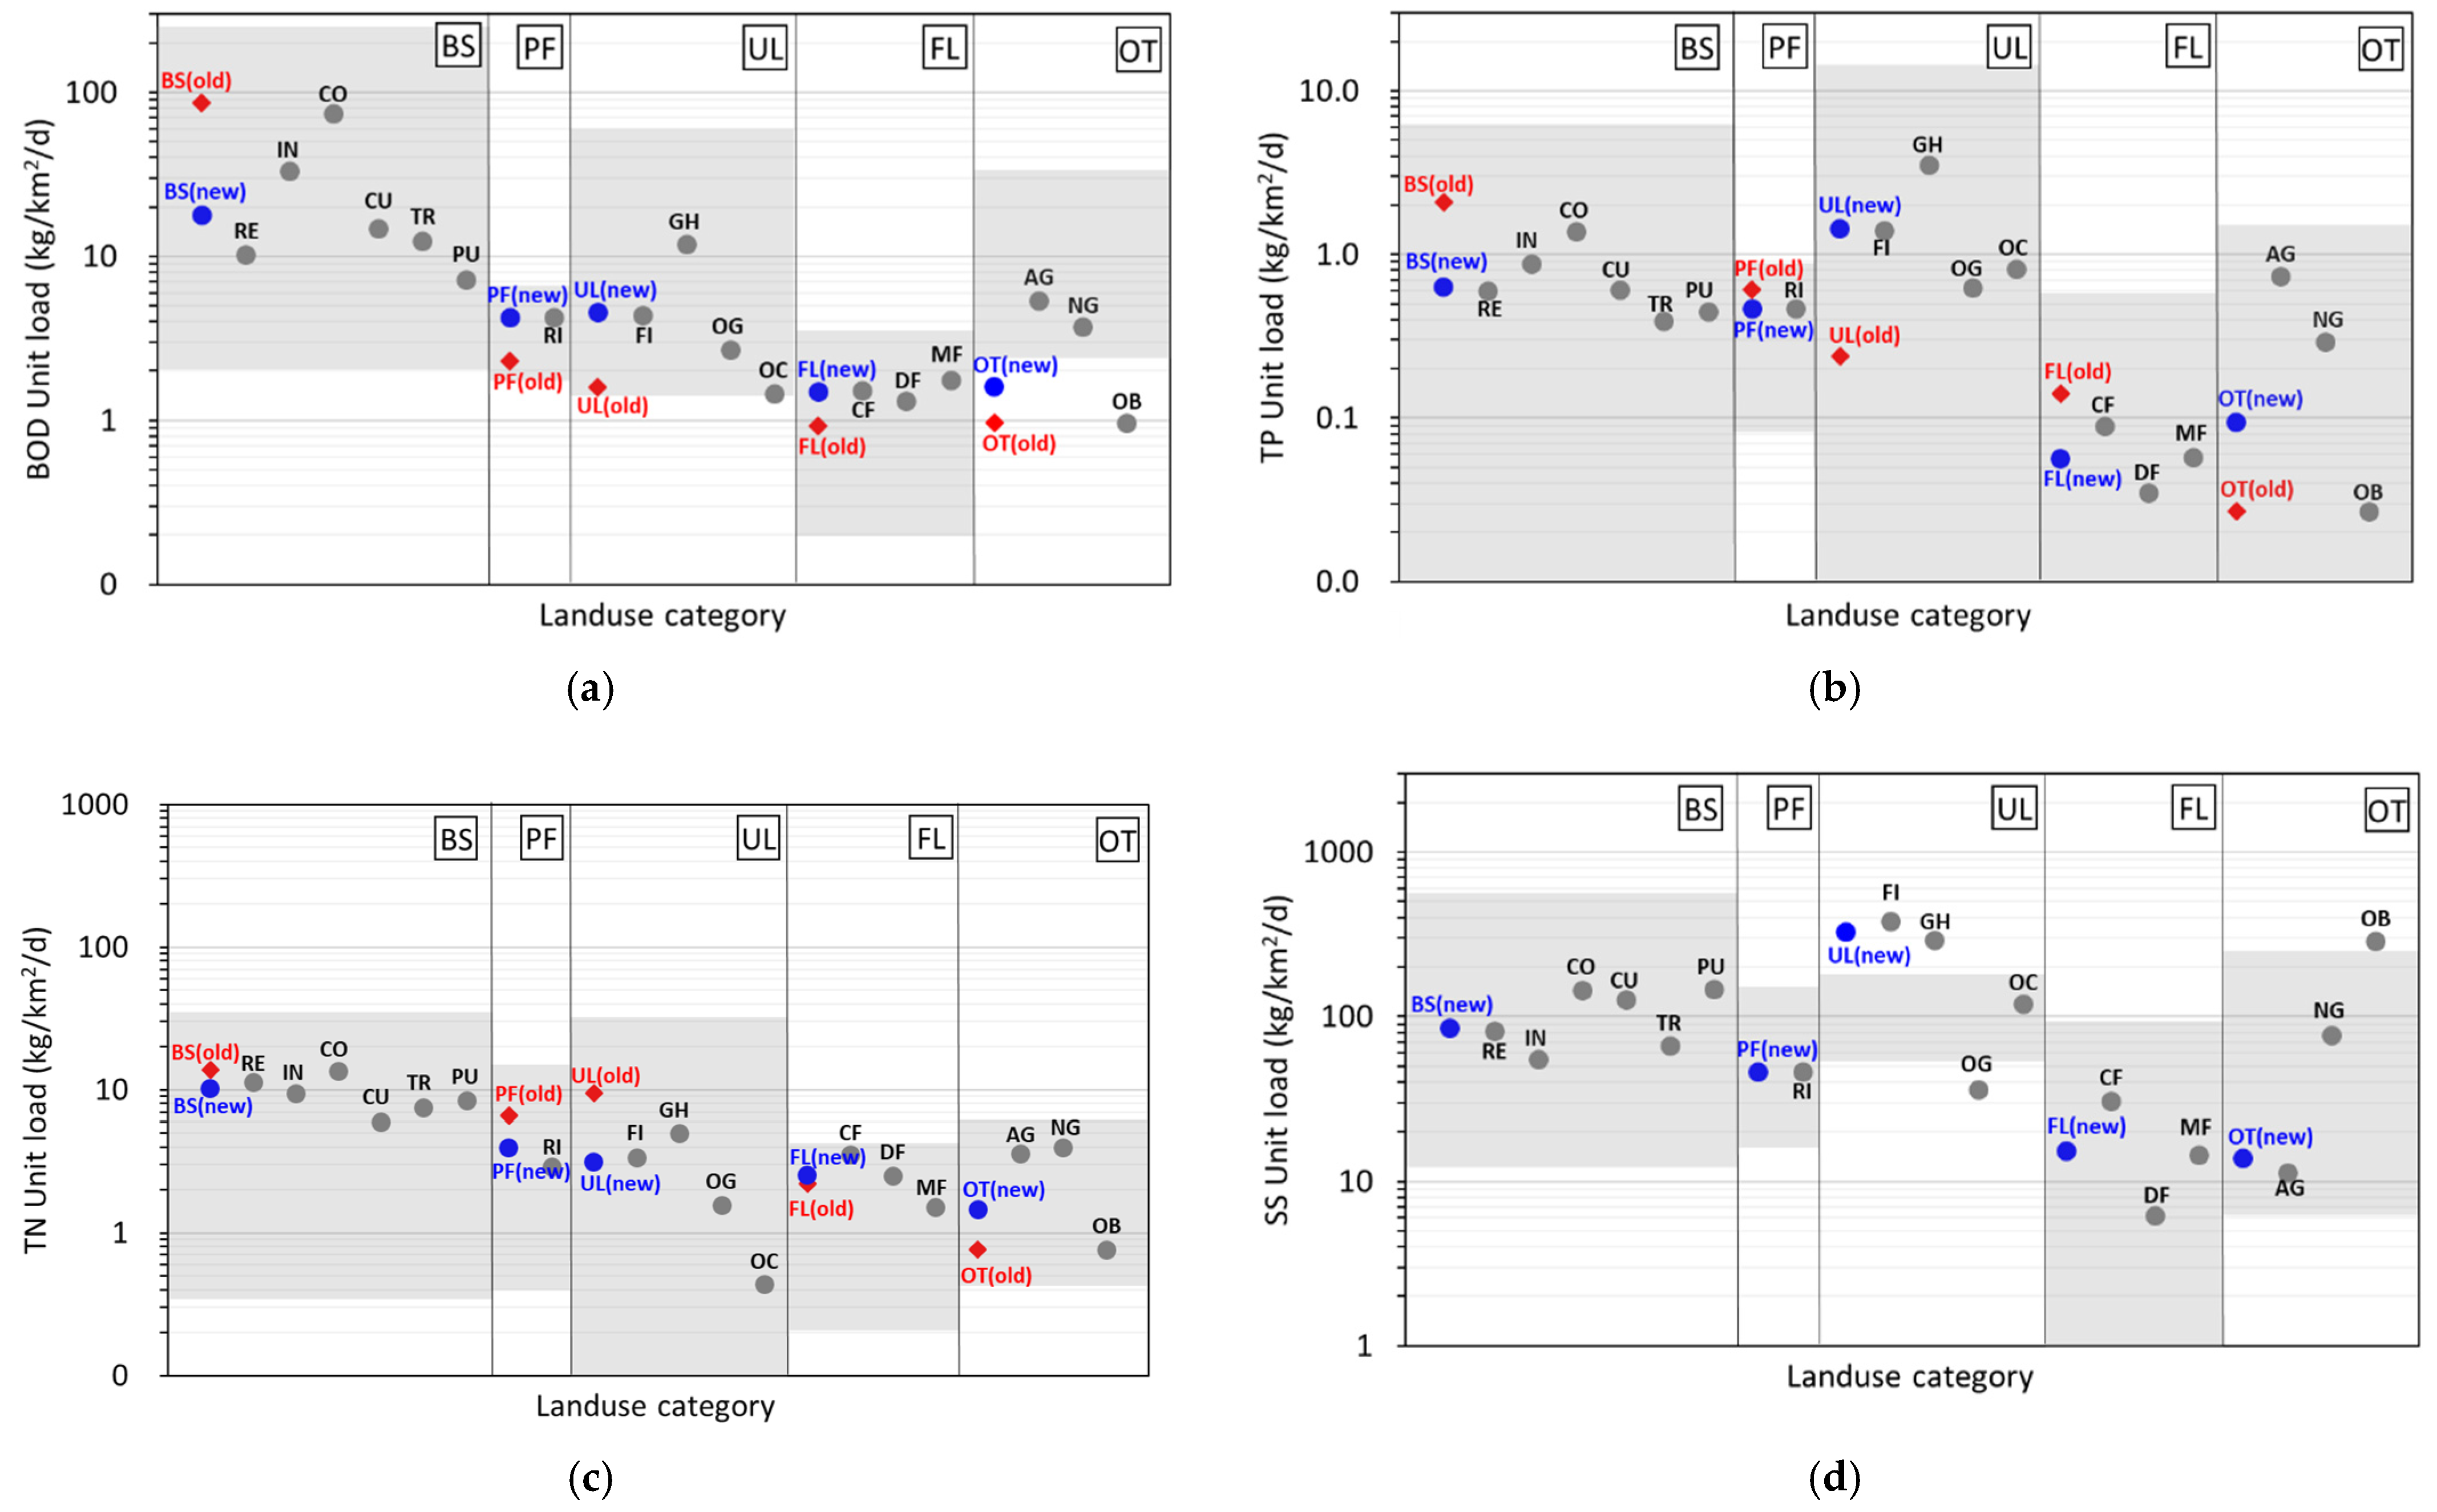
The unit loads for BOD, TN, TP, and SS were calculated using the EMC values for each landuse and the previously calculated data, and the corresponding results are summarized in Figure 5. The unit load values for each landuse (the unit load values calculated in this study and the existing unit load values) and the unit load ranges in the literature are indicated. As based on the results, BS BOD was calculated as 17.76 kg/km2/d, TP as 0.631 kg/km2/d, TN as 10.147 kg/km2/d, and SS as 85.44 kg/km2/d. The unit load values calculated in this study fall within the range presented in previous studies (BOD: 2.1–262.3 kg/km2/d, TP: 0.012–6.301 kg/km2/d, TN: 0.24–33.95 kg/km2/d, SS: 12.8–580.1 kg/km2/d) [4,6,21,27,28,29,30,31,32,33,34,36,37,38,39,40,41,42,43,44,45,46,47,48]. The BOD of PF was calculated as 4.24 kg/km2/d and was derived from a TP of 0.467 kg/km2/d, TN of 3.920 kg/km2/d, and SS of 46.04 kg/km2/d. Further ranges have been presented in existing studies (BOD: 1.8–6.8 kg/km2/d, TP: 0.082–0.877 kg/km2/d, TN: 0.3–14.7 kg/km2/d, SS: 17.8–164.5 kg/km2/d [4,6,27,30,32,33,37,40]). In UL, BOD was calculated as 4.57 kg/km2/d and was derived from a TP of 1.435 kg/km2/d, TN of 3.146 kg/km2/d and SS of 327.70 kg/km2/d. The existing literature shows a BOD of 1.6–61.7 kg/km2/d, TP of 0.011–16.359 kg/km2/d, TN of 0.02–32.35 kg/km2/d, and SS of 53.4–181.6 kg/km2/d [4,6,26,32,37,38,40]; except for SS, values were investigated in a range, as in the references. FL was derived from a BOD of 1.49 kg/km2/d, TP of 0.056 kg/km2/d, TN of 2.522 kg/km2/d, and SS of 15.20 kg/km2/d. It is included within the range presented in existing studies (BOD: 0.1–3.7 kg/km2/d, TP: 0.002–0.605 kg/km2/d, TN: 0.11–4.30 kg/km2/d, SS: 0.6–93.7 kg/km2/d) [6,26,27,30,32,37,38,39,40,41,52]. Finally, the unit loads of OT were derived from a BOD of 1.6 kg/km2/d, TP of 0.094 kg/km2/d, TN of 1.462 kg/km2/d, and SS of 13.85 kg/km2/d. The ranges in the existing literature is as follows: BOD: 2.6–35.1 kg/km2/d, TP: 0.003–1.720 kg/km2/d, TN: 0.33–6.51 kg/km2/d, and SS: 6.4–255.8 kg/km2/d [6,32,36,40,41].
4. Discussion
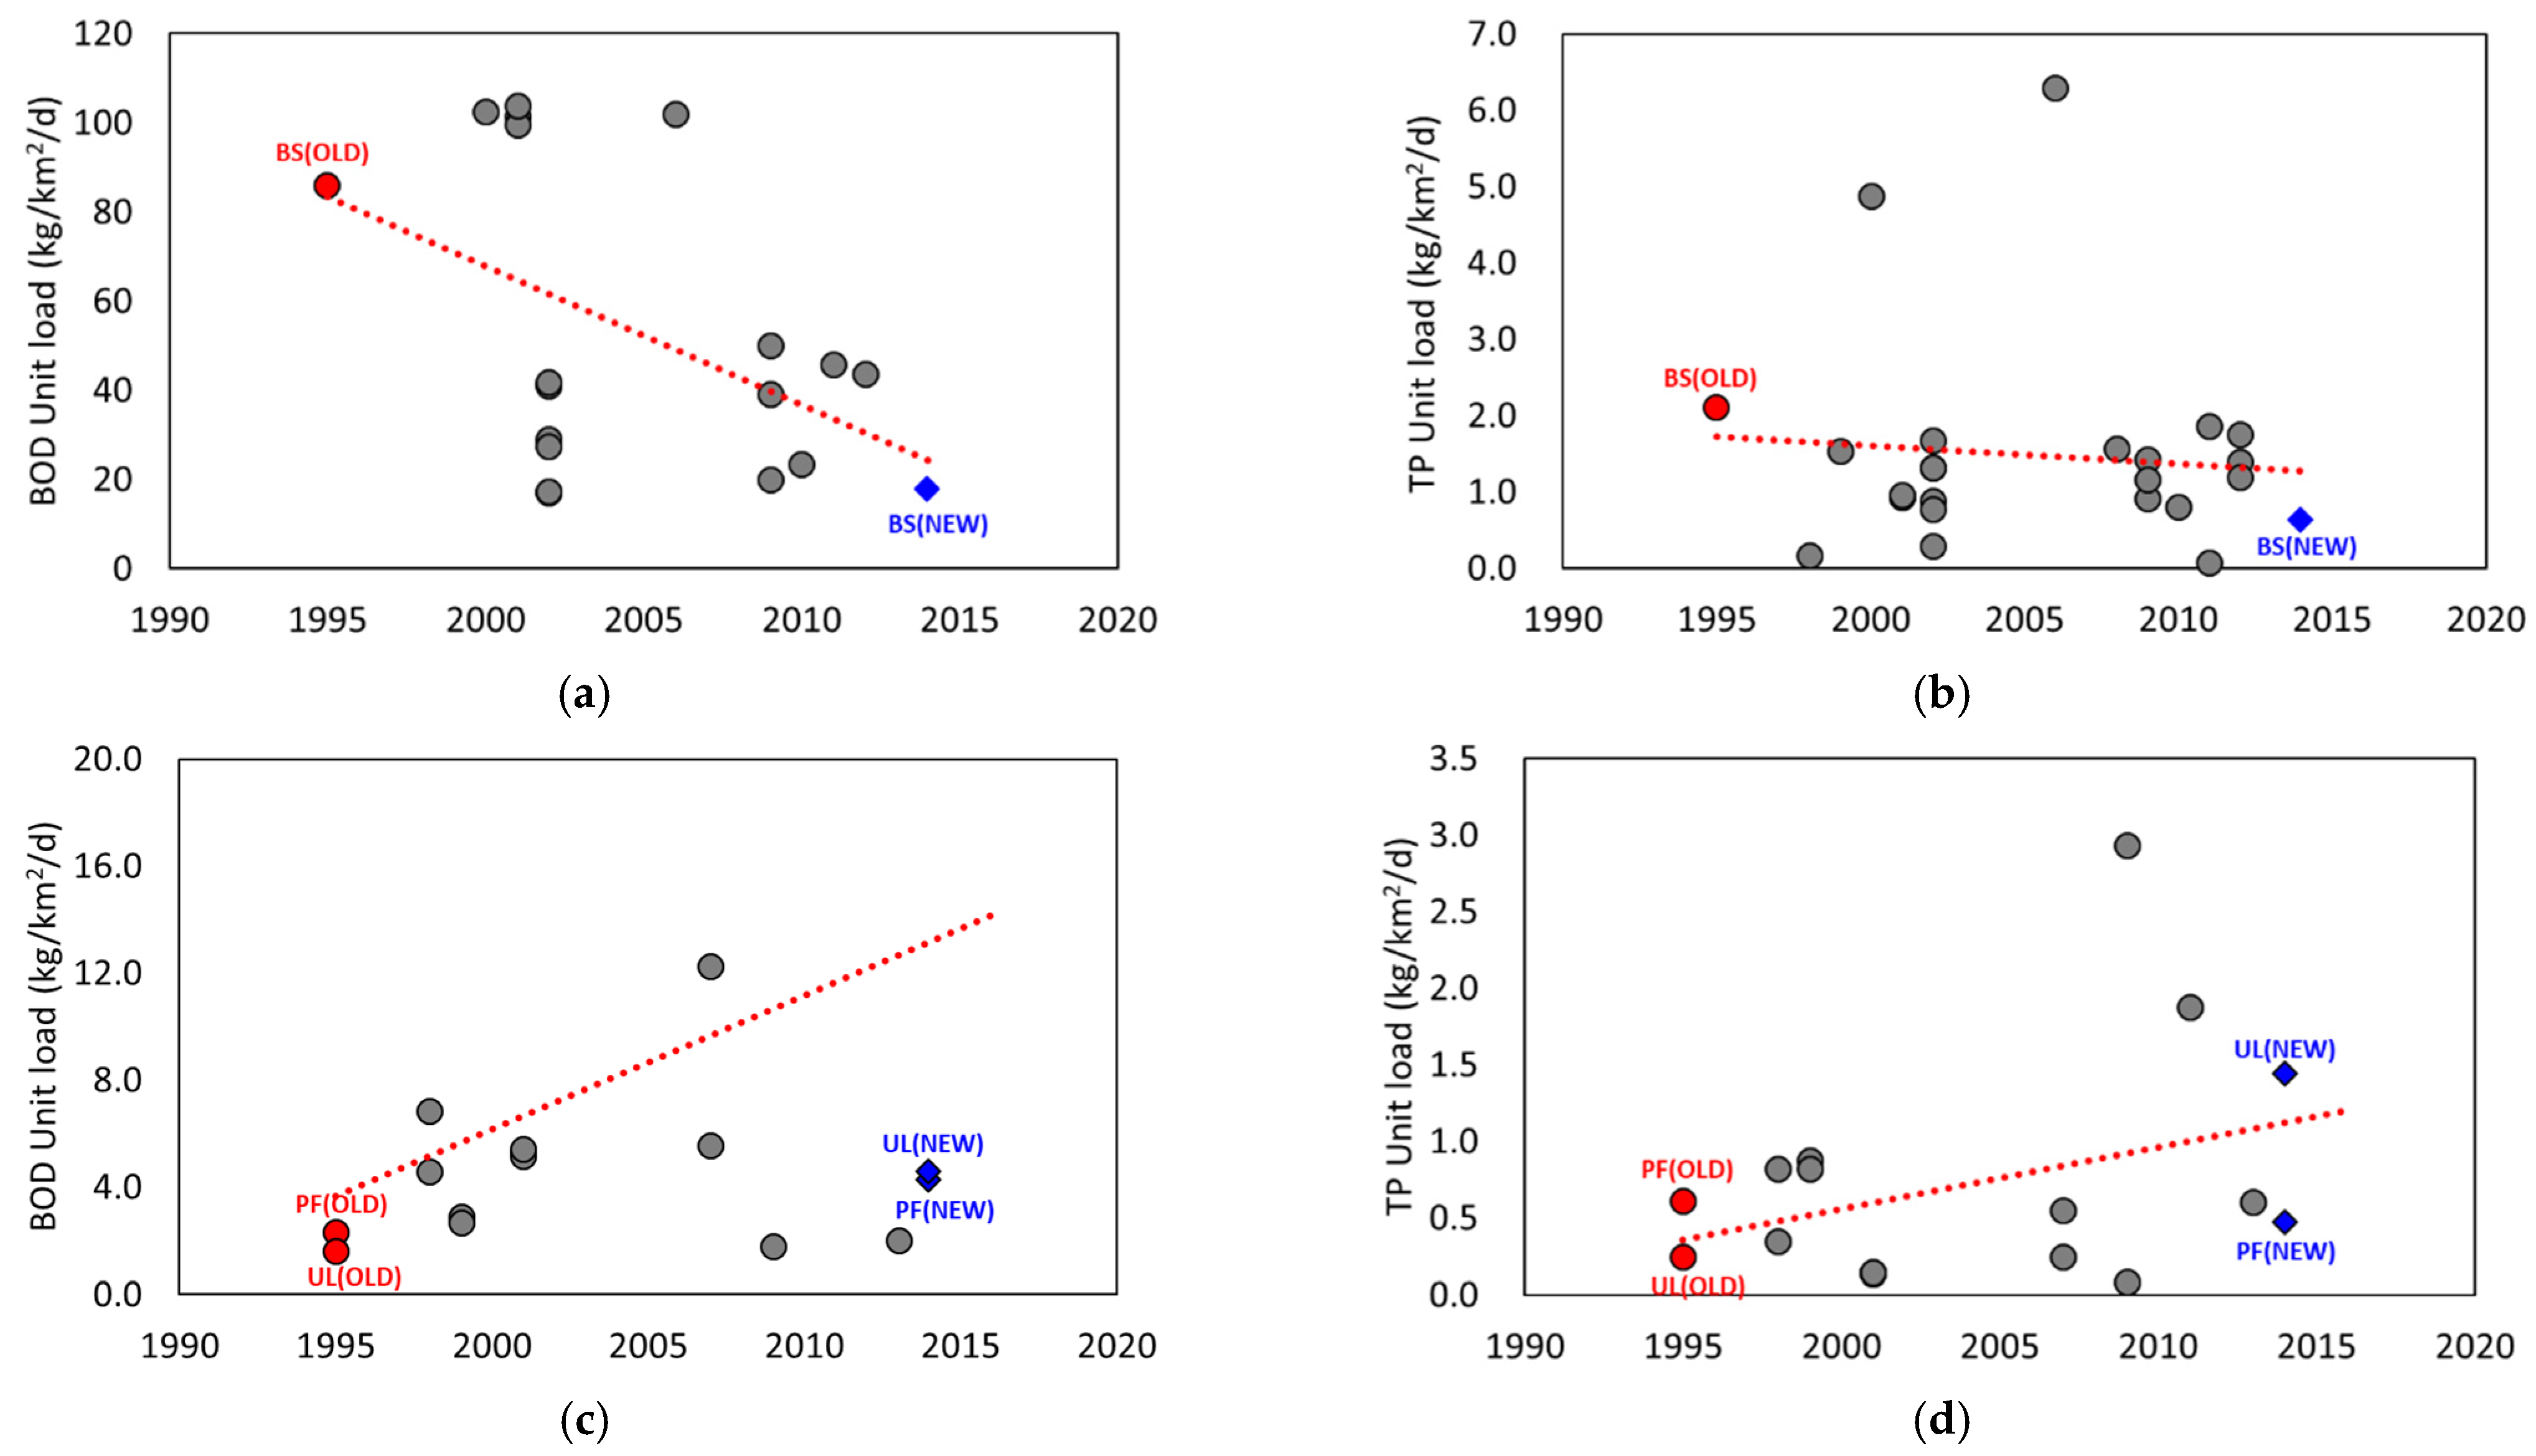
Based on the unit load calculation results, it was found that there was a large change from the conventional unit load in some landuse categories. The BOD unit loads calculated in this study decreased by 4.8 times from the existing values for the BS landuse category, whereas it increased by 1.6–2.9 times in all the landuse categories except BS. Furthermore, the TP unit loads calculated in this study for UL were 6.0 times higher than the existing values. The calculated unit loads were higher than the existing unit loads for the agricultural landuse categories (i.e., UL and PF), and lower for BS. Figure 6 shows the BOD and TP unit load of the BS, PF, and UL landuse by year, and the unit load results of domestic studies from 2000 to 2014 [6,23,26,27,28,29,30,31,32,33,34,37,38,39,40,44,45,46,47,48], the existing unit load (red), and the unit load calculated in this study (blue) are displayed together. BS, which represents urban areas, shows a tendency for BOD and TP unit load to decrease over time (Figure 6a, b). On the other hand, it was found that the BOD and TP unit load of PF and UL, which represent agricultural land, increased as time passed (Figure 6c,d).
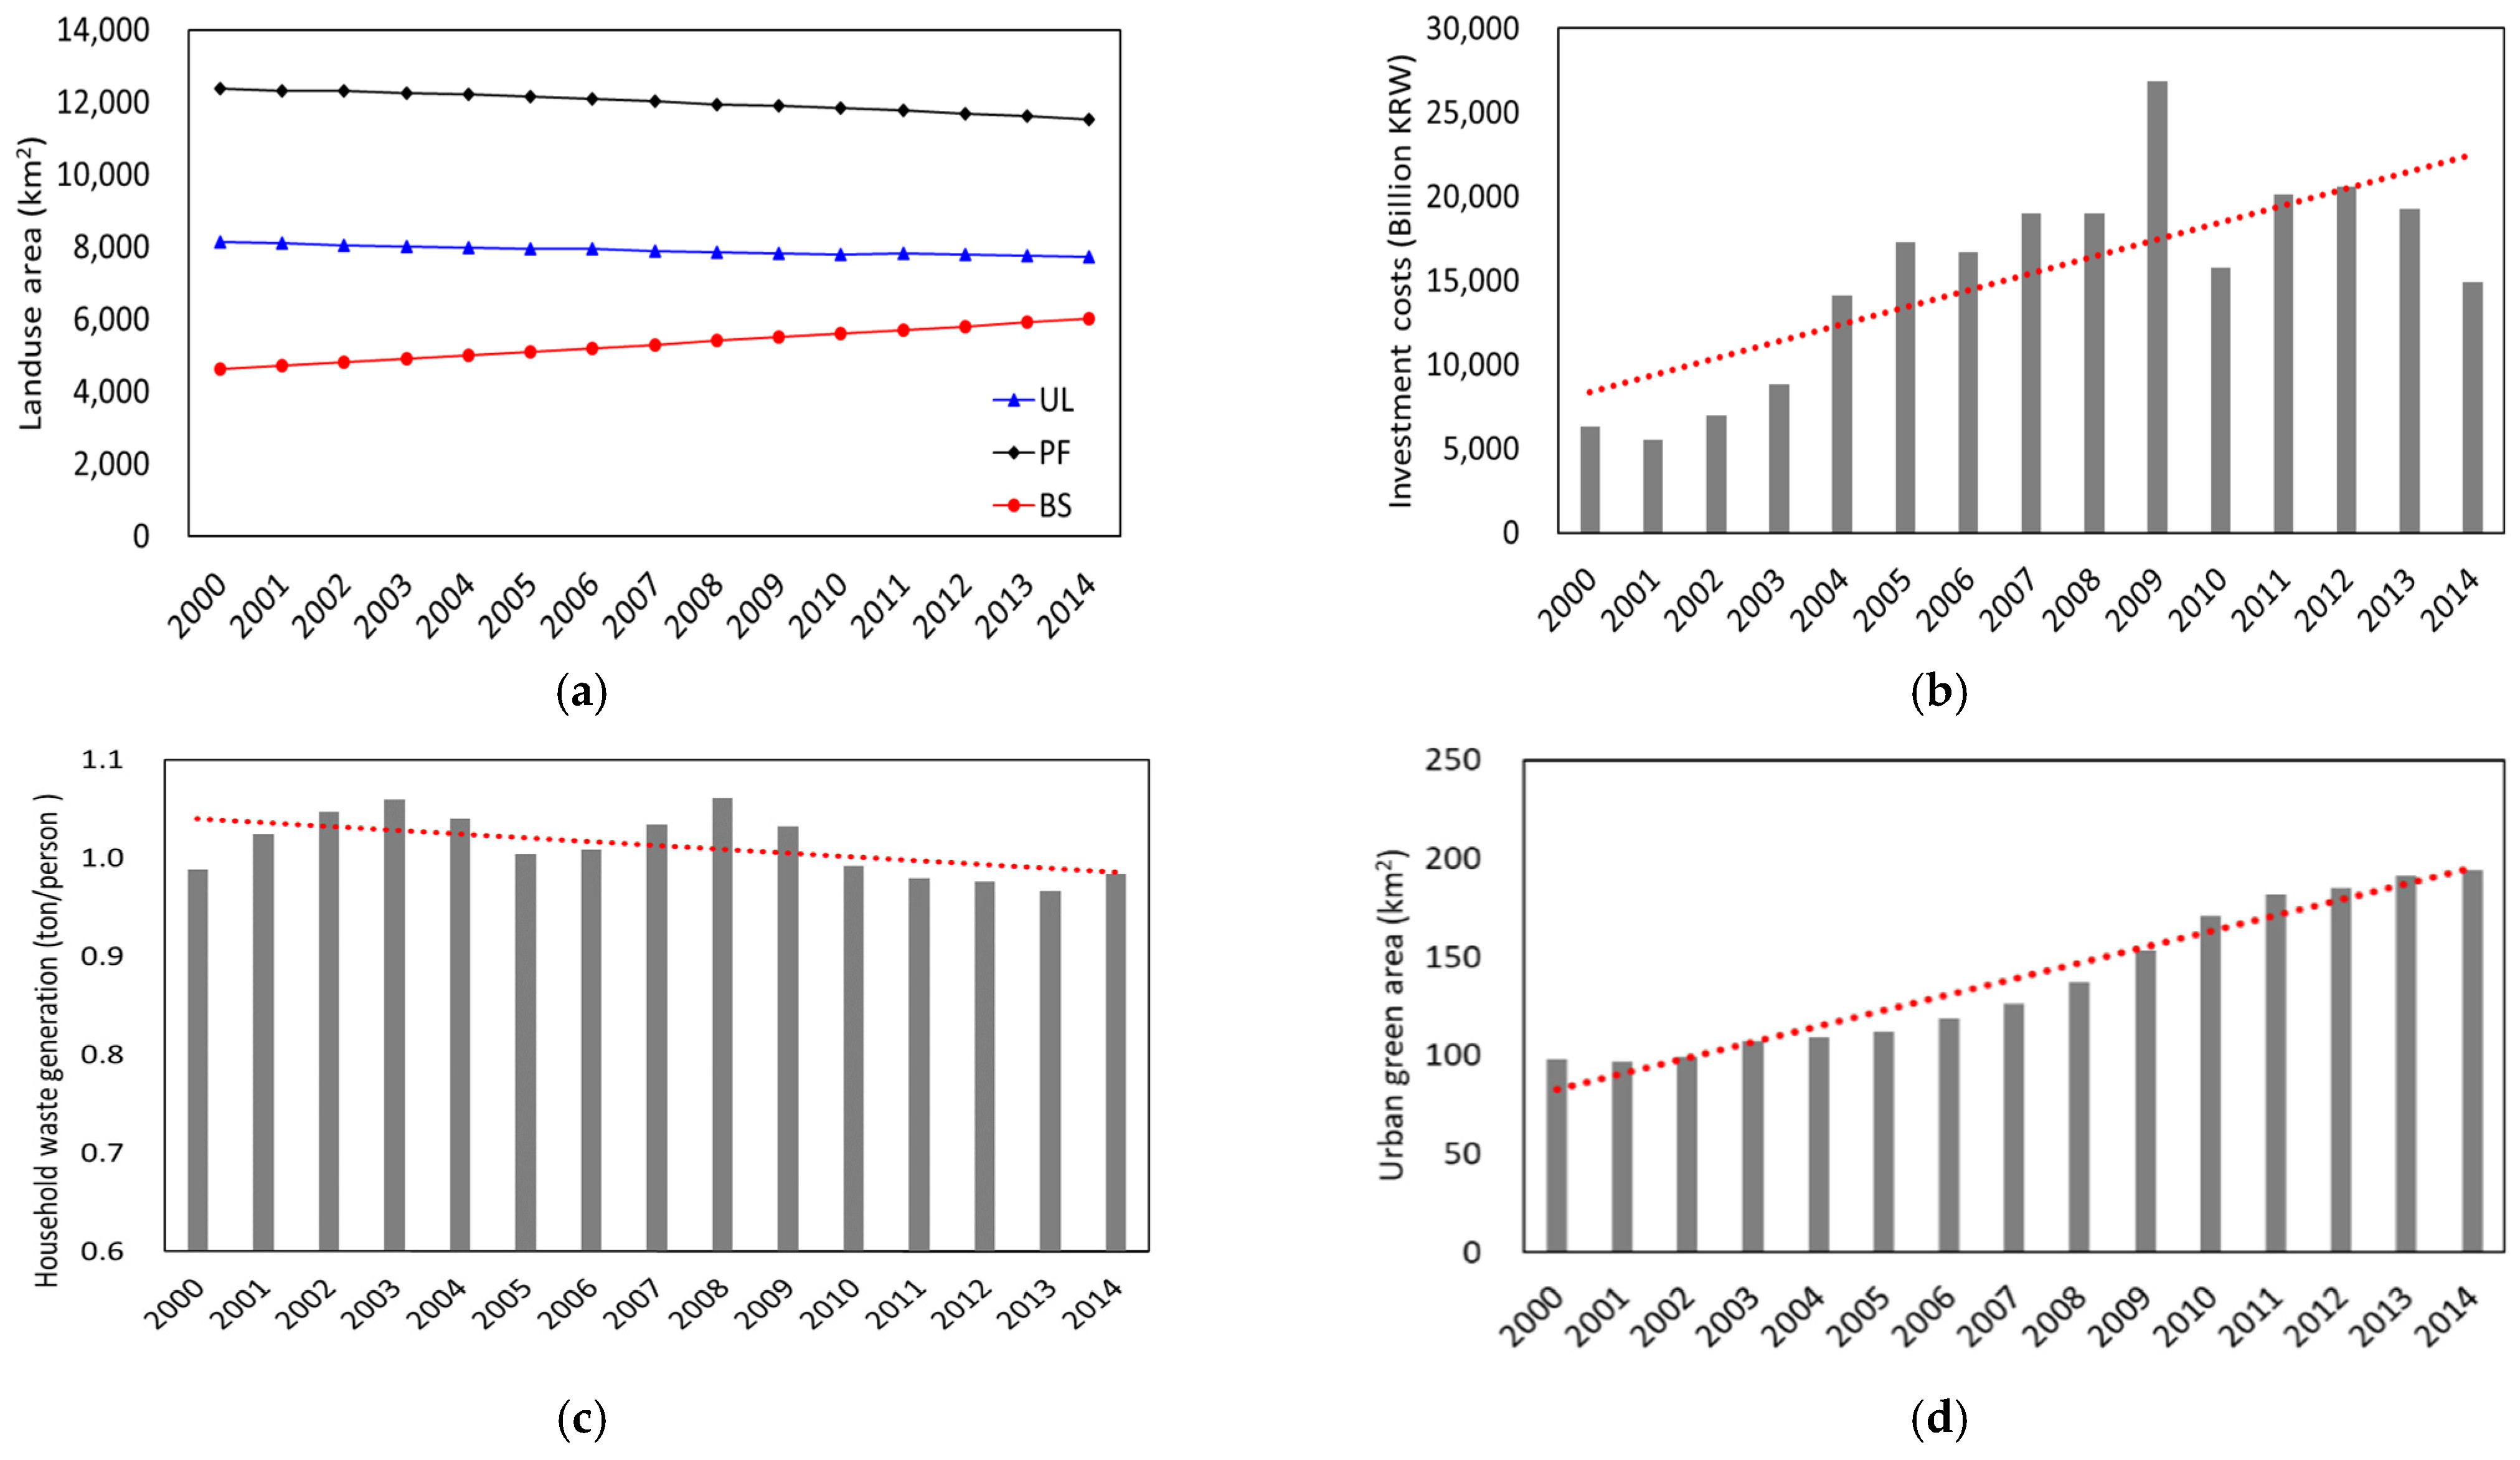
The national statistics data were investigated to examine the causes for the occurrence of this phenomenon [53]. The survey period was based on 2000–2014 considering the monitoring period. In order to investigate the causes of changes in urban (BS) unit loads, data on urban green areas, household waste generation, investment costs to prevent water pollution, and landuse areas (BS, PF, and UL) are used in national statistical data. These data were analyzed and are shown in Figure 7. As urbanization progressed (BS area increased, PF and UL area decreased), the investment budget for improving water quality increased, the urban environment improved to raise environmental awareness, and household waste generation decreased. Therefore, the BS unit load is reduced by the influence of pollutants.
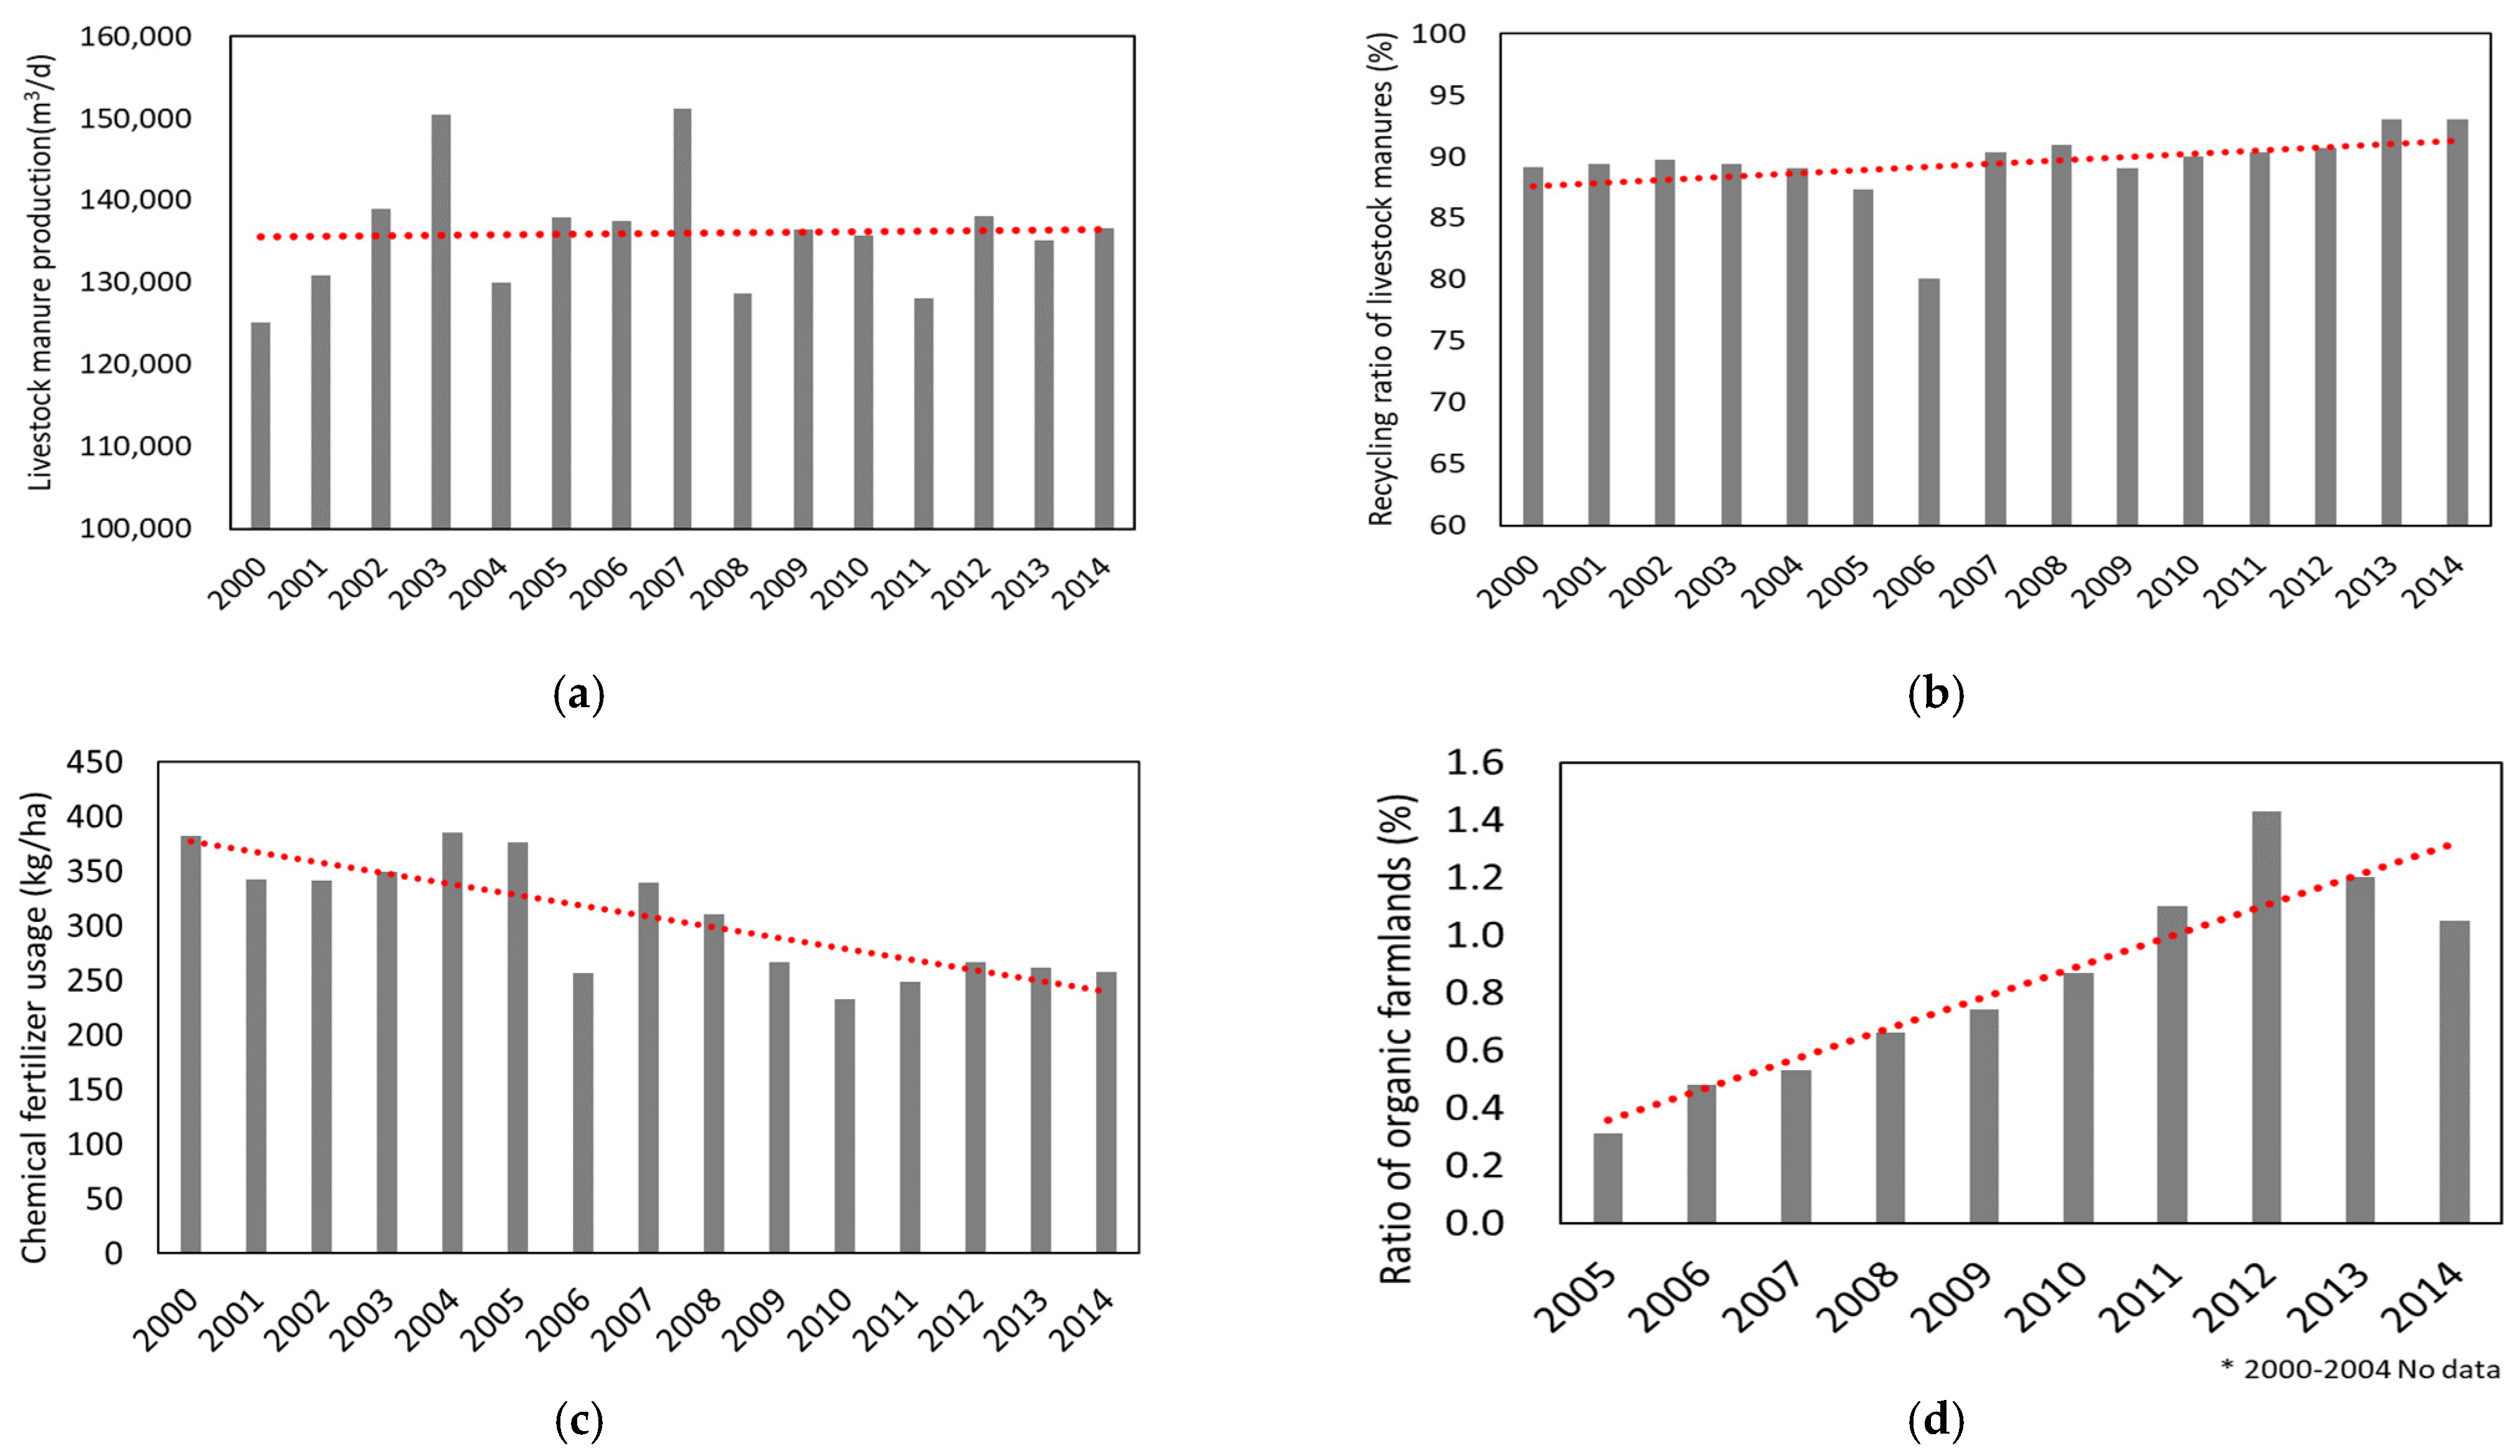
In order to understand the cause for the change in the agricultural area (PF and UL) unit load, we investigated the chemical fertilizer usage, organic farmlands, livestock manure production, and the recycling ratio of livestock manure items, shown in Figure 8. Since 2000, when ocean dumping livestock manure was banned, recycling of livestock manure has been promoted, and environmentally friendly organic farming methods that utilize livestock manure have become effective. Although the amount of chemical fertilizer used has decreased to promote environmentally friendly agricultural policies, it is judged that the unit load of the agricultural area has fluctuated due to poor management of organic fertilizer, including livestock manure compost and overuse [54,55,56].
5. Conclusions
This study aimed to derive the pollutant unit loads for each landuse category and pollutants that reflected the long-term runoff characteristics of NPS pollutants and recent changes in the living environment. Rainfall was monitored for 123 sites for 7 years from 2008 to 2014. Subsequently, the rainfall patterns were well-reflected through the long-term analysis of runoff characteristics for various landuses and rainfall ranges compared with previously published literature; additionally, statistical significance was observed in 30 or more measurements for each landuse category.
Furthermore, the average values of ADD, total rainfall, rainfall intensity, rainfall duration, runoff duration, and runoff coefficient for each landuse were 3.8–5.9 d, 35.2–65.0 mm, 2.9–4.1 mm/h, 12.5–20.4 h, 12.4–27.9 h, and 0.24–0.45, respectively. The total rainfall and rainfall duration was high in UL, while the runoff coefficient was high in BS, which exhibited a high impervious surface ratio.
Moreover, the BOD EMC was the highest at 8.0 mg/L in BS. In addition, the EMC values for SS (606.2 mg/L), TN (7.38 mg/L), and TP (2.27 mg/L) were the highest in all landuse categories. The EMC values in FL for BOD, SS, TN, and TP were 1.3 mg/L, 14.7 mg/L, 2.36 mg/L, and 0.05 mg/L, respectively. Thus, the concentration of each pollutant was low in FL. Furthermore, the EMC was the highest in the <10 mm rainfall range for BS and in the >50 mm rainfall range for UL and FL, implying that NPS pollutants in BS should be managed during the early rainfall stage, whereas middle- and large-scale rainfall events in other landuse categories should be managed to effectively reduce NPS pollutants.
The unit loads for BOD, TN, TP, and SS were 1.49–17.76 kg/km2·d, 1.462–10.147 kg/km2·d, 0.094–1.435 kg/km2·d, and 15.20–327.70 kg/km2·d, respectively. The unit load in BS decreased compared with those observed previously due to the reduction in the pollutant accumulation rate in urban areas, owing to improved urban environmental conditions and increased investment costs to prevent water pollution since 2000. However, in the agricultural landuse categories (UL and PF), the unit loads were higher than those observed previously due to pollutant accumulation in agricultural lands from an increased use of organic fertilizers and promotion of recycling livestock manures. The unit load ranges observed in this study were similar to those of previous local and international studies on unit loads.
The unit loads acquired in this study were statistically significant and scientifically reliable compared with those in the existing studies because various environmental conditions were considered through long-term monitoring of various landuse categories. The findings of this study can be used for quantitative management of watersheds and for effective management of NPS pollutants by calibrating the watershed model coefficient according to areas that have not been measured. Furthermore, the results can be used for successful promotion and implementation of the associated pollution and watershed management systems.
Author Contributions
Conceptualization, J.C., B.P., S.L. and J.R.; Investigation, J.C., J.K. and J. R.; Project administration, B.P., K.K. and Y.K.; Supervision, B.P.; Writing—original draft, J.C.; Writing—review & editing, J.C. All authors have read and agreed to the published version of the manuscript.
Funding
This research was funded by National Institute of Environment Research (NIER), grant number (NIER-RP2016-408, NIER-RP2018-248).
Institutional Review Board Statement
Not applicable.
Informed Consent Statement
Not applicable.
Data Availability Statement
Not applicable.
Acknowledgments
This research was supported by a grant from the National Institute of Environmental Research (NIER), funded by the Ministry of Environment (MOE) of the Republic of Korea (NIER-RP2016-408, NIER-RP2018-248).
Conflicts of Interest
The authors declare no conflict of interest.
References
- National Institute of Environmental Research (NIER). Technical Guidelines for TMDL; National Institute of Environmental Research: Incheon, Korea, 2019.
- U.S. Environmental Protection Agency (EPA). Total Maximum Daily Loads with Stormwater Sources: A Summary of 17 TMDLs; U.S. Environmental Protection Agency: Washington, DC, USA, 2007.
- U.S. Environmental Protection Agency (EPA). TMDLs to Stormwater Permit Handbook; U.S. Environmental Protection Agency: Washington, DC, USA, 2008.
- Ministry of Environment Government of Japan. Guideline for Introducing a TMDLs Program; Ministry of Environment Government of Japan: Tokyo, Japan, 2011.
- Shin, E.S.; Choi, J.Y.; Lee, D.H. Estimation of non-point source pollutant unit-loads in surface runoff considering landuse and basin characteristics. J. Korean Soc. Water Qual. 2001, 17, 137–146. [Google Scholar]
- Ministry of Environment (MOE). Investigation of Non-Point Source Pollutants Project Report; Ministry of Environment: Sejong, Korea, 1995.
- Kim, G. Impacts of uncertainty of water quality data on water quality management. J. Korean Soc. Water Environ. 2006, 22, 427–430. [Google Scholar]
- Kim, L.H.; Kang, J. Determination of event mean concentrations and pollution loadings in highway storm runoff. J. Korean Soc. Water Environ. 2004, 20, 631–640. [Google Scholar]
- Lee, S.Y.; Lee, E.; Maniquiz, M.C.; Kim, L.H. Determination of pollutant unit loads from various transportation landuses. J. Korean Soc. Water Environ. 2008, 24, 543–549. [Google Scholar]
- Geum River Watershed Management Committee (GWMC). Long-Term Monitoring of Non-Point Source Pollutants Discharge and Reduction Measures Study; Geum River Watershed Management Committee: Daejeon, Korea, 2012. [Google Scholar]
- Han River Watershed Management Committee (HWMC). Long-Term Monitoring and Control Measures of Non-Point Source Pollution from Major Land-Uses; Han River Watershed Management Committee: Gyeonggi-do, Korea, 2012. [Google Scholar]
- Nakdong River Watershed Management Committee (NWMC). Long-Term Monitoring and BMPs for the Non-Point Source Pollutants Discharge; Nakdong River Watershed Management Committee: Gyeongsangnam-do, Korea, 2008–2012.
- Yeongsan-Seomjin River Watershed Management Committee (YWMC). Research on Long-Term Monitoring and BMPs for the Non-Point Source Discharge; Yeongsan-Seomjin River Watershed Management Committee: Gwangju, Korea, 2012. [Google Scholar]
- Geum River Watershed Management Committee (GWMC). Monitoring of Non-Point Source Pollutants; Geum River Watershed Management Committee: Daejeon, Korea, 2014. [Google Scholar]
- Han River Watershed Management Committee (HWMC). Integrated Monitoring and Management Plan for Non-Point Pollution; Han River Watershed Management Committee: Gyeonggi-do, Korea, 2014. [Google Scholar]
- Nakdong River Watershed Management Committee (NWMC). A Monitoring and Management Scheme for the Non-Point Sources; Nakdong River Watershed Management Committee: Gyeongsangnam-do, Korea, 2014. [Google Scholar]
- Yeongsan-Seomjin River Watershed Management Committee (YWMC). Research on Long-Term Monitoring for the Non-Point Source Discharge; Yeongsan-Seomjin River Watershed Management Committee: Gwangju, Korea, 2014. [Google Scholar]
- National Institute of Environmental Research (NIER). Stormwater Runoff Survey Methods; National Institute of Environmental Research: Incheon, Korea, 2012.
- Korea Meteorological Administration (KMA). Available online: https://data.kma.go.kr/ (accessed on 10 May 2021).
- Won, C.H.; Choi, Y.H.; Seo, J.Y.; Kim, K.C.; Shin, M.H.; Choi, J.D. Determination of EMC and unit loading of rainfall runoff from forestry-crops field. J. Korean Soc. Water Environ. 2009, 25, 615–623. [Google Scholar]
- Shin, M.; Shin, D.; Lee, J.; Choi, J.; Won, C.; Seo, J.; Choi, J. Runoff characteristics of non-point source pollutants from different forest types during rainfall events. J. Korean Soc. Water Environ. 2010, 26, 507–517. [Google Scholar]
- Choi, J.Y.; Lee, S.Y.; Kim, L.H. Wash-off characteristics of NPS pollutants from forest landuse. J. Korean Soc. Hazard. Mitig. 2009, 9, 129–134. [Google Scholar]
- Choi, D.H.; Yoon, K.S.; Choi, W.J.; Yoo, S.H. Estimation of pollutant unit load of paddy fields with and without a rainfall factor. Irrig. Drain. 2016, 65, 112–120. [Google Scholar] [CrossRef]
- Göbel, P.; Dierkes, C.; Coldewey, W.G. Storm water runoff concentration matrix for urban areas. J. Contam. Hydrol. 2007, 91, 26–42. [Google Scholar] [CrossRef]
- Seo, Y.C. Simultaneous determination of organo-phosphorus and organo-chlorinated pesticides in soil and lawn samples of golf courses. J. Korean Soc. Environ. Eng. 2005, 27, 1257–1262. [Google Scholar]
- Choi, D.; Cho, S.; Hwang, T.; Kim, Y.; Jung, J.; Choi, W.; Park, H.; Yoon, K. Characteristics of biochemical oxygen demand export from paddy fields during storm and non-storm period and evaluation of unit load. J. Korean Soc. Water Environ. 2017, 33, 531–537. [Google Scholar]
- Kang, H.M.; Lee, D.J.; Bae, W.K. Analysis of unit pollution load on highway runoff. J. Korean Soc. Water Wastewater 2012, 26, 55–68. [Google Scholar] [CrossRef] [Green Version]
- Lee, H.W.; Choi, N.H.; Lee, Y.S.; Choi, J.H. Estimation of pollutants loading from non-point sources based on rainfall event and landuse characteristics. J. Korean Soc. Environ. Eng. 2011, 33, 572–577. [Google Scholar] [CrossRef]
- Shon, T.S.; Jang, J.K.; Lee, S.D.; Ju, D.J.; Shin, H.S. A study on estimation of the unit of nonpoint source pollution from the industrial site. In Proceedings of the Korea Water Resources Association Conference, Korea Water Resources Association, Daejeon, Korea, 13–14 May 2010; pp. 947–951. [Google Scholar]
- Hwang, B.G. Estimating unit load of non-point source pollutants for landuse types in Anseongchun Watershed. J. Korea Acad. Industr. Coop. Soc. 2009, 10, 1026–1033. [Google Scholar]
- Kim, K.S.; Lee, J.T. Estimation of total and unit loads of nonpoint-source in JungRang River Basin. J. Korean Soc. Environ. Eng. 2006, 28, 813–819. [Google Scholar]
- Lee, H.D.; Ahn, J.H.; Bae, C.H.; Kim, W.J. Estimation of the unit loading and total loading of nonpoint source in Paldang watershed by runoff loading during the rainfall. J. Korean Soc. Water Qual. 2001, 17, 313–326. [Google Scholar]
- Moon, J.P.; Kim, T.C.; Ahn, B.G. Load factor of nonpoint source pollutant owing to landuse in Bangdong reservoir watershed. Korean J. Agric. Sci. 1999, 26, 61–69. [Google Scholar]
- Go, S.H.; Memon, S.A.; Lee, C.H. Characterization of stormwater pollutants and estimation of unit loads for road and parking lot in Gyeongan stream watershed. J. Korean Soc. Water Environ. 2009, 25, 689–696. [Google Scholar]
- Bannerman, R.; Baun, K.; Bohn, M.; Hughes, P.; Graczyk, D. Nationwide Urban Runoff Program, Milwaukee, Wisconsin. Evaluation of Urban Nonpoint Source Pollution Management in Milwaukee County, Wisconsin. Volume 3. Study Site Characteristics, Experimental Methods and Quality Assurance Program; U.S. Environmental Protection Agency: Wisconsin, WI, USA, 1983.
- North Florida Water Management District (NFWMD). St Marks and Wakulla River Resource Assessment and Greenway Protection Plan, Appendix 4; North Florida Water Management District: Florida, FL, USA, 1994. [Google Scholar]
- Novotny, V. Water Quality: Prevention, Identification and Management of Diffuse Pollution; Van Nostrand-Reinhold Publishers: New York, NY, USA, 1994. [Google Scholar]
- U.S. Environmental Protection Agency (EPA). Technical Guidance Manual for Developing Total Maximum Daily Loads, Book 2: Streams and Rivers; EPA 823-B-97-002; U.S. Environmental Protection Agency: Washington, DC, USA, 1997.
- Choi, J.; Sin, C. Management of Nonpoint Pollutant by Reducing Storm Runoff; Environment Institute: Seoul, Korea, 2002. [Google Scholar]
- Choi, J.; Shin, E. Study on the Management of Nonpoint Sources Pollution in Agricultural Areas; Environment Institute: Seoul, Korea, 1998. [Google Scholar]
- Shaver, E.; Horner, R.; Skupien, J.; May, C.; Ridley, G. Fundamentals of Urban Runoff Management: Technical and Institutional Issues, 2nd ed.; North American Lake Management Society (NALMS): Wisconsin, WI, USA, 2007. [Google Scholar]
- Zhao, J.W.; Shan, B.Q.; Yin, C.Q. Pollutant loads of surface runoff in Wuhan City Zoo, an urban tourist area. J. Environ. Sci. 2007, 19, 464–468. [Google Scholar] [CrossRef]
- Wang, S.; He, Q.; Ai, H.; Wang, Z.; Zhang, Q. Pollutant concentrations and pollution loads in stormwater runoff from different landuses in Chongqing. J. Environ. Sci. 2013, 25, 502–510. [Google Scholar] [CrossRef]
- Kim, S.J.; Shin, S.M.; Jeon, Y.T.; Won, C.H. Washoff characteristics of non-point source pollutants and estimation of unit loads in suburban industrial complex areas runoff. J. Environ. Impact. Assess. 2012, 21, 315–325. [Google Scholar]
- Kim, T.; Gil, K. Comparison of estimation method of pollutant unit loads from bridge area. J. Korean Soc. Water Environ. 2011, 27, 597–604. [Google Scholar]
- Son, H.G.; Lee, E.J.; Lee, S.Y.; Kim, L.H. Determination of nonpoint pollutant unit loads in toll-gate of highway. J. Wet. Res. 2008, 10, 69–75. [Google Scholar]
- Lee, J.H.; Bang, K.W.; Choi, J.S. Pollutants unit loadings of the stormwater runoff in industrial complex. J. Korean Soc. Environ. Eng. 2000, 22, 355–362. [Google Scholar]
- Maniquiz, M.C.; Lee, S.; Min, K.S.; Kim, J.H.; Kim, L.H. Diffuse pollutant unit loads of various transportation landuses. Desalin. Water Treat. 2012, 38, 222–229. [Google Scholar] [CrossRef]
- Shin, M.; Choi, J.; Choi, Y.; Park, W.; Won, C.; Shin, D.; Lim, K.J.; Choi, J. Runoff characteristics of Non-point source pollution loads generated on golf course. J. Korean Soc. Water Environ. 2011, 27, 784–793. [Google Scholar]
- Joo, J.H.; Yang, J.E.; Ok, Y.S.; Oh, S.E.; Yoo, K.Y.; Yang, S.C.; Jung, Y.S. Assessment of pollution loads from alpine agricultural practices in Nakdong river basin. Korean J. Environ. Agric. 2007, 26, 233–238. [Google Scholar] [CrossRef] [Green Version]
- Lee, J.W.; Kwon, H.G.; Yi, Y.J.; Cheon, S.U. The calculation of NPS load per unit area in orchard to the Nakdong River Basin. J. Environ. Impact. Assess. 2013, 22, 557–568. [Google Scholar] [CrossRef] [Green Version]
- Zhang, Z.; Fukushima, T.; Onda, Y.; Mizugaki, S.; Gomi, T.; Kosugi, K.; Hiramatsu, S.; Kitahara, H.; Kuraji, K.; Terajima, T.; et al. Characterisation of diffuse pollutions from forested watersheds in Japan during storm events—Its association with rainfall and watershed features. Sci. Total Environ. 2008, 390, 215–226. [Google Scholar] [CrossRef] [PubMed] [Green Version]
- Statistics Korea. Available online: https://www.index.go.kr (accessed on 10 May 2021).
- So, H.; Jang, T.; Hong, S.G. Assessing unit load in farmland by application of liquid manure and organic farming. J. Korean Soc. Rural. Plan. 2017, 23, 39–48. [Google Scholar] [CrossRef]
- Lee, J.H.; Yoon, Y.M. Comparison of nutrient balance and nutrient loading index for cultivated land nutrient management. Korean J. Environ. Biol. 2019, 37, 554–567. [Google Scholar] [CrossRef]
- Jeon, B.J.; Lim, S.S.; Lee, K.S.; Lee, S.I.; Ham, J.H.; Yoo, S.H.; Yoon, K.S.; Choi, W.J. Understanding spatial variations of water quality using agricultural nutrient indices in Chonnam province. Korean J. Environ. Agric. 2014, 33, 44–51. [Google Scholar] [CrossRef] [Green Version]
Figure 1.
Locations and status of the selected monitoring sites.

Figure 2.
Investigation results for each rainfall range at the monitoring sites.

Figure 3.
Summary of monitored storm events.

Figure 4.
EMC results for each landuse and rainfall range: (a) BOD, (b) SS, (c) TN, and (d) TP (note: EMCx = Overall, EMCy=1 ≤ 10 mm, EMCy=2 = 10–30 mm, EMCy=3 = 30–50 mm, EMCy=4 ≥ 50 mm, and EMCz = red line).
Figure 4.
EMC results for each landuse and rainfall range: (a) BOD, (b) SS, (c) TN, and (d) TP (note: EMCx = Overall, EMCy=1 ≤ 10 mm, EMCy=2 = 10–30 mm, EMCy=3 = 30–50 mm, EMCy=4 ≥ 50 mm, and EMCz = red line).


Figure 5.
Unit load calculation results of (a) BOD, (b) TP, (c) TN, and (d) SS (red diamonds = existing unit load, blue and black dots = unit loads calculated in this study, and gray areas = ranges of the reference literature).
Figure 5.
Unit load calculation results of (a) BOD, (b) TP, (c) TN, and (d) SS (red diamonds = existing unit load, blue and black dots = unit loads calculated in this study, and gray areas = ranges of the reference literature).

Figure 6.
Changing trend of unit load in the BS, PF, and UL based on domestic literature: (a) BS BOD unit load, (b) BS TP unit load, (c) PF and UL BOD unit load, and (d) PF and UL TP unit load.
Figure 6.
Changing trend of unit load in the BS, PF, and UL based on domestic literature: (a) BS BOD unit load, (b) BS TP unit load, (c) PF and UL BOD unit load, and (d) PF and UL TP unit load.

Figure 7.
Trends of urban landuses and living environment: (a) landuse area, (b) investment costs to prevent water pollution, (c) household waste generation, and (d) status of urban green areas.
Figure 7.
Trends of urban landuses and living environment: (a) landuse area, (b) investment costs to prevent water pollution, (c) household waste generation, and (d) status of urban green areas.

Figure 8.
Environmental trends in agricultural areas: (a) trends in livestock manure production, (b) trends in the recycling ratio of livestock manures, (c) trends in chemical fertilizer usage, and (d) trends in organic farmlands.
Figure 8.
Environmental trends in agricultural areas: (a) trends in livestock manure production, (b) trends in the recycling ratio of livestock manures, (c) trends in chemical fertilizer usage, and (d) trends in organic farmlands.


Table 1.
Landuse classification for monitoring stormwater runoff.
| Group | Landuse Category | Details |
|---|---|---|
| I | BS | RE, IN, CO, CU, TR, and PU |
| PF/UL | RF, FI, OR, and OC | |
| OT | AG | |
| II | UL | GH |
| FL | CF, DF, and MF | |
| OT | OB |
Table 2.
Total number of rainy days and rainfall volume during 2008–2014.
| Rainfall Range | Total Number of Rainy Day Occurrence Ratio (%) | Total Rainfall Volume Ratio (%) | ||
|---|---|---|---|---|
| Range | Mean (Median) | Range | Mean (Median) | |
| <10 mm | 68–79 | 75 (76) | 10–21 | 16 (16) |
| 10–30 mm | 13–19 | 16 (15) | 21–36 | 28 (28) |
| 30–50 mm | 3–7 | 5 (5) | 15–29 | 20 (19) |
| >50 mm | 3–7 | 5 (4) | 25–47 | 36 (37) |
Publisher’s Note: MDPI stays neutral with regard to jurisdictional claims in published maps and institutional affiliations. |
© 2021 by the authors. Licensee MDPI, Basel, Switzerland. This article is an open access article distributed under the terms and conditions of the Creative Commons Attribution (CC BY) license (https://creativecommons.org/licenses/by/4.0/).
Share and Cite
MDPI and ACS Style
Choi, J.; Park, B.; Kim, J.; Lee, S.; Ryu, J.; Kim, K.; Kim, Y. Determination of NPS Pollutant Unit Loads from Different Landuses. Sustainability 2021, 13, 7193. https://doi.org/10.3390/su13137193
AMA Style
Choi J, Park B, Kim J, Lee S, Ryu J, Kim K, Kim Y. Determination of NPS Pollutant Unit Loads from Different Landuses. Sustainability. 2021; 13(13):7193. https://doi.org/10.3390/su13137193
Chicago/Turabian StyleChoi, Jiyeon, Baekyung Park, Jinsun Kim, Soyoung Lee, Jichul Ryu, Kyunghyun Kim, and Yongseok Kim. 2021. "Determination of NPS Pollutant Unit Loads from Different Landuses" Sustainability 13, no. 13: 7193. https://doi.org/10.3390/su13137193
Note that from the first issue of 2016, this journal uses article numbers instead of page numbers. See further details here.