
Evaluation of Latvian Power System Static Stability According to a New Development Strategy until 2025

 ,
,
Abstract
:1. Introduction
- Increasing energy efficiency;
- Developing the electricity market;
- Increasing the reliability of the power supply;
- Using and integrating RES. For instance, there is a possibility of increasing wind energy share from the existing 8% to 20% when considering the technical and economic factors of the Republic of Latvia, thus increasing the competitiveness of energy prices;
- Preserve the environment while producing, transmitting, and distributing different types of energy.
2. An Overview of Latvian Energy System Specifics
3. Theoretical Background of the Proposed Approach
- Determination of the admissibility of adding new loads to the existing power system and the need to modernize the energy system to meet current electricity demand;
- Identification of power system weak connections with regimes closest to the stability limit;
- Visibility of marked nodes where installation of active mode control devices is rational, leading to increased reliability and economy in the transmission of electricity.
4. The Obtained Results and Analysis
5. Discussion
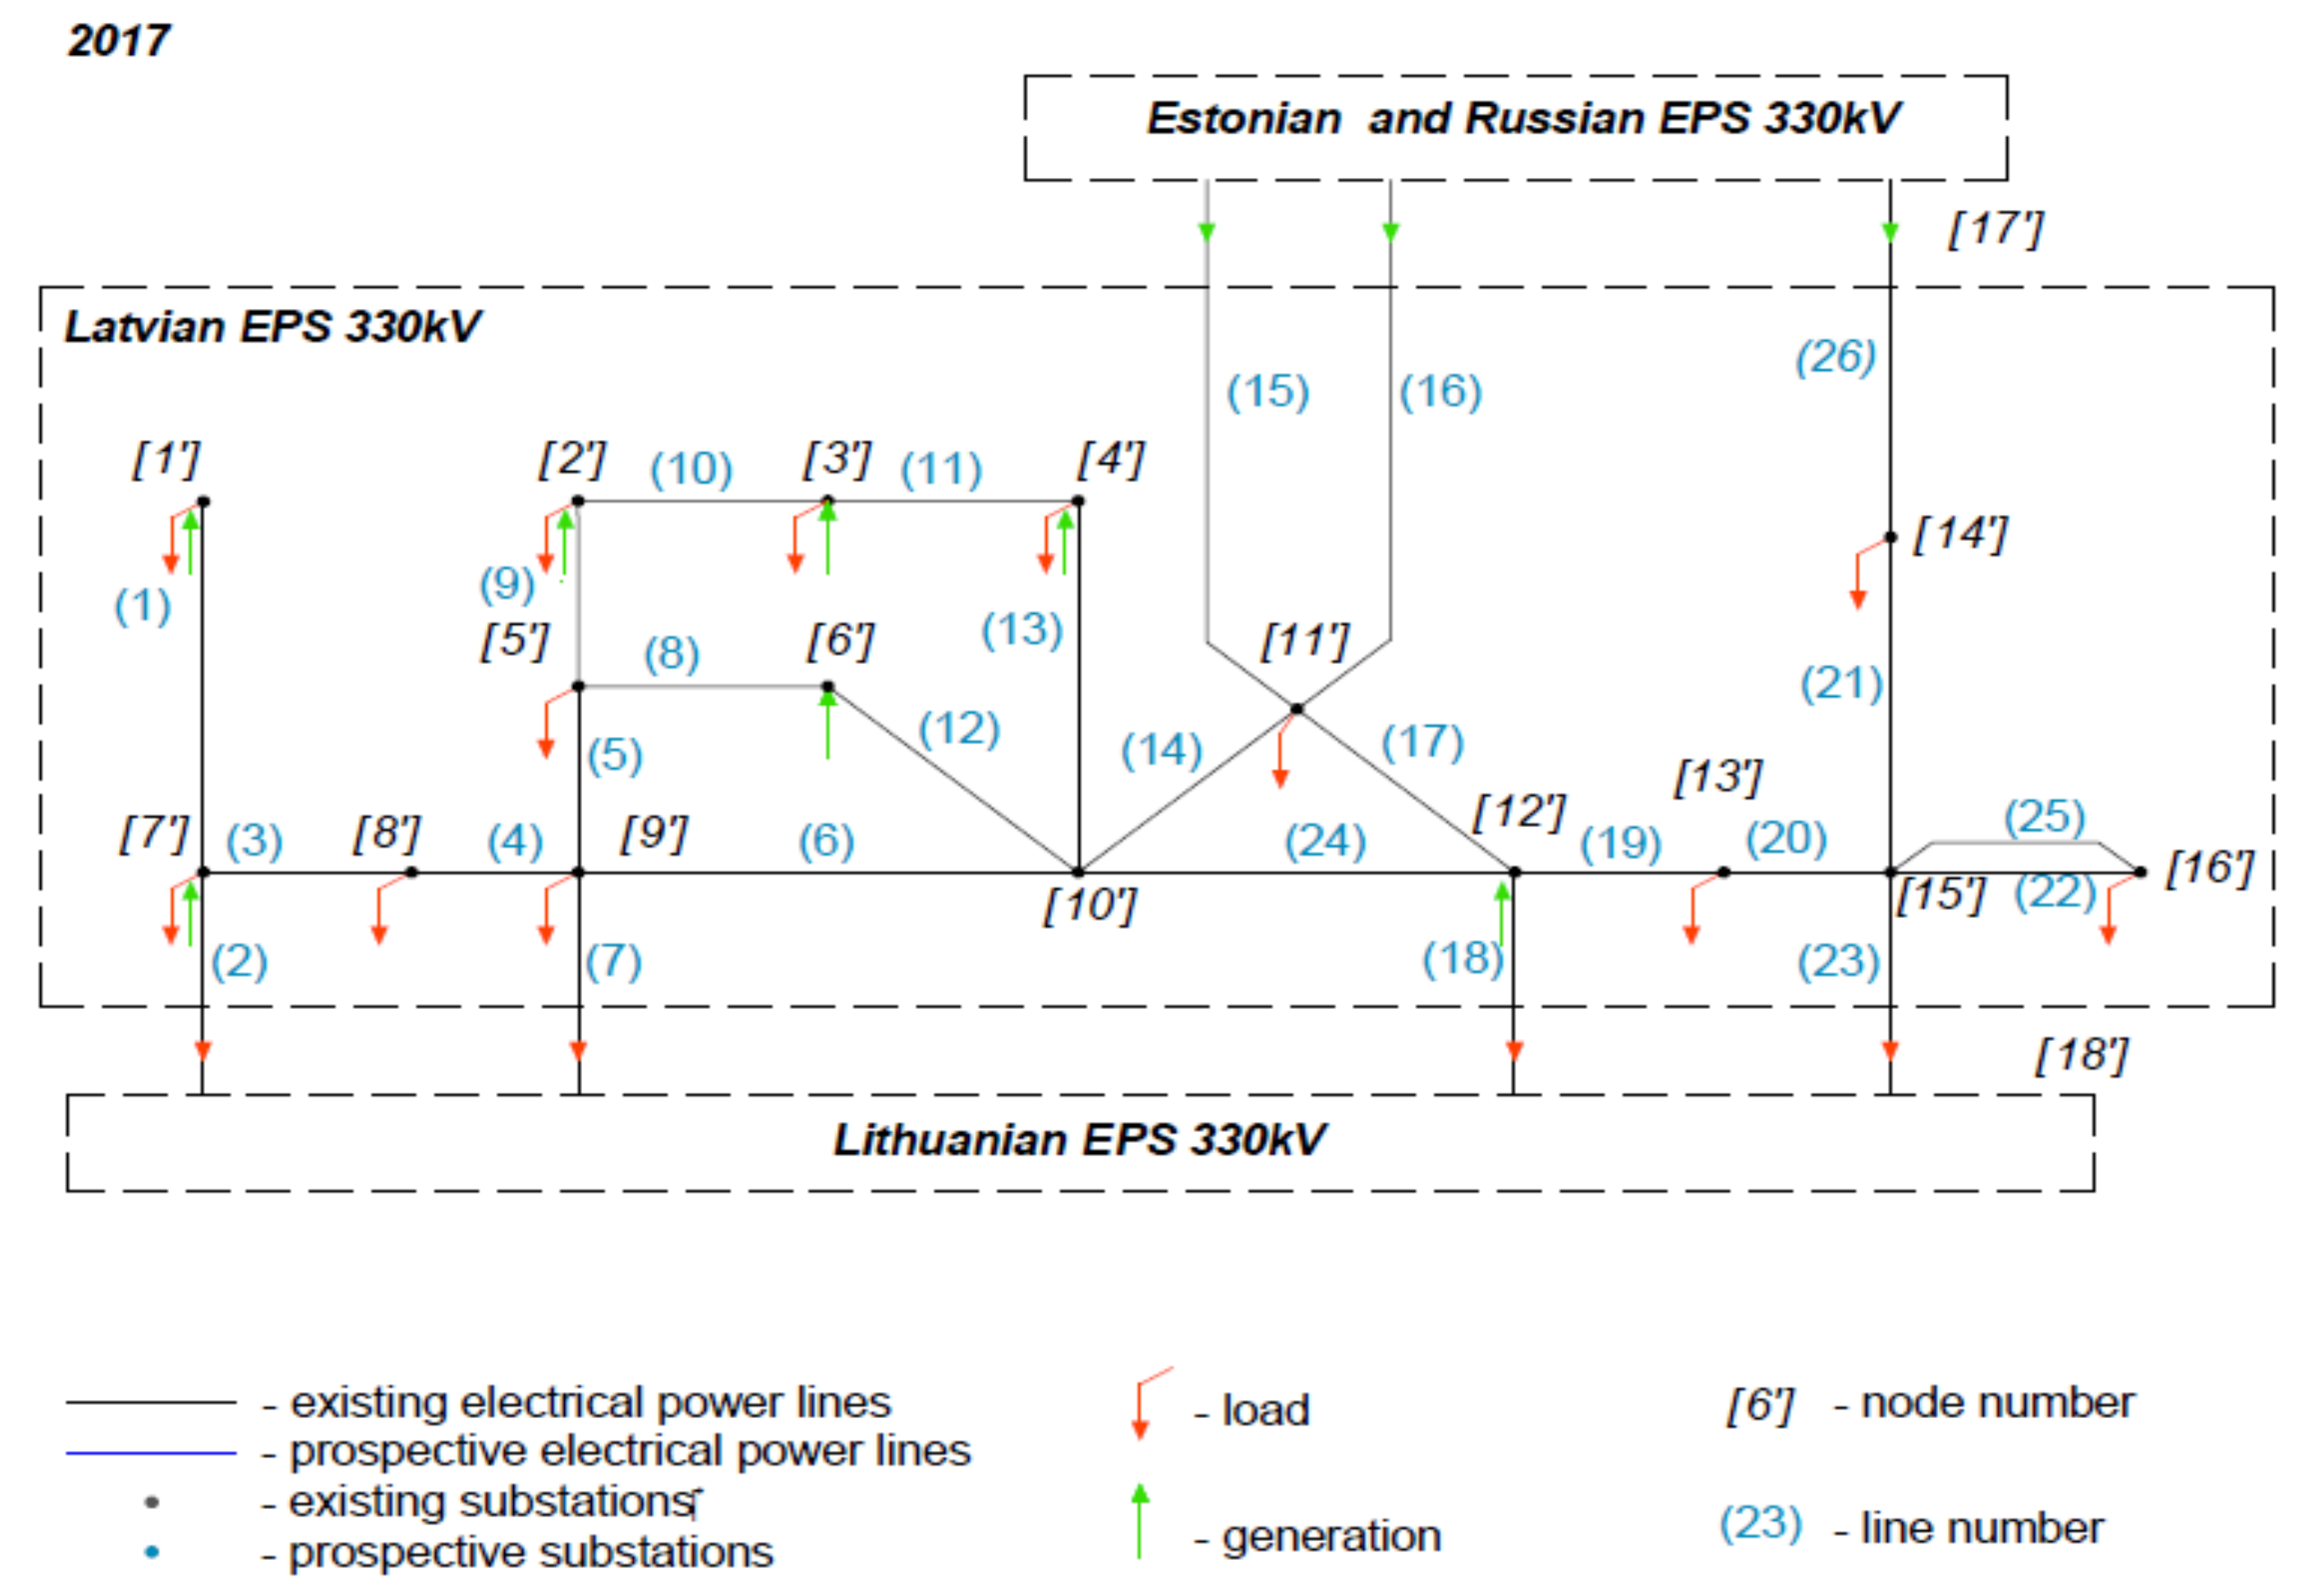
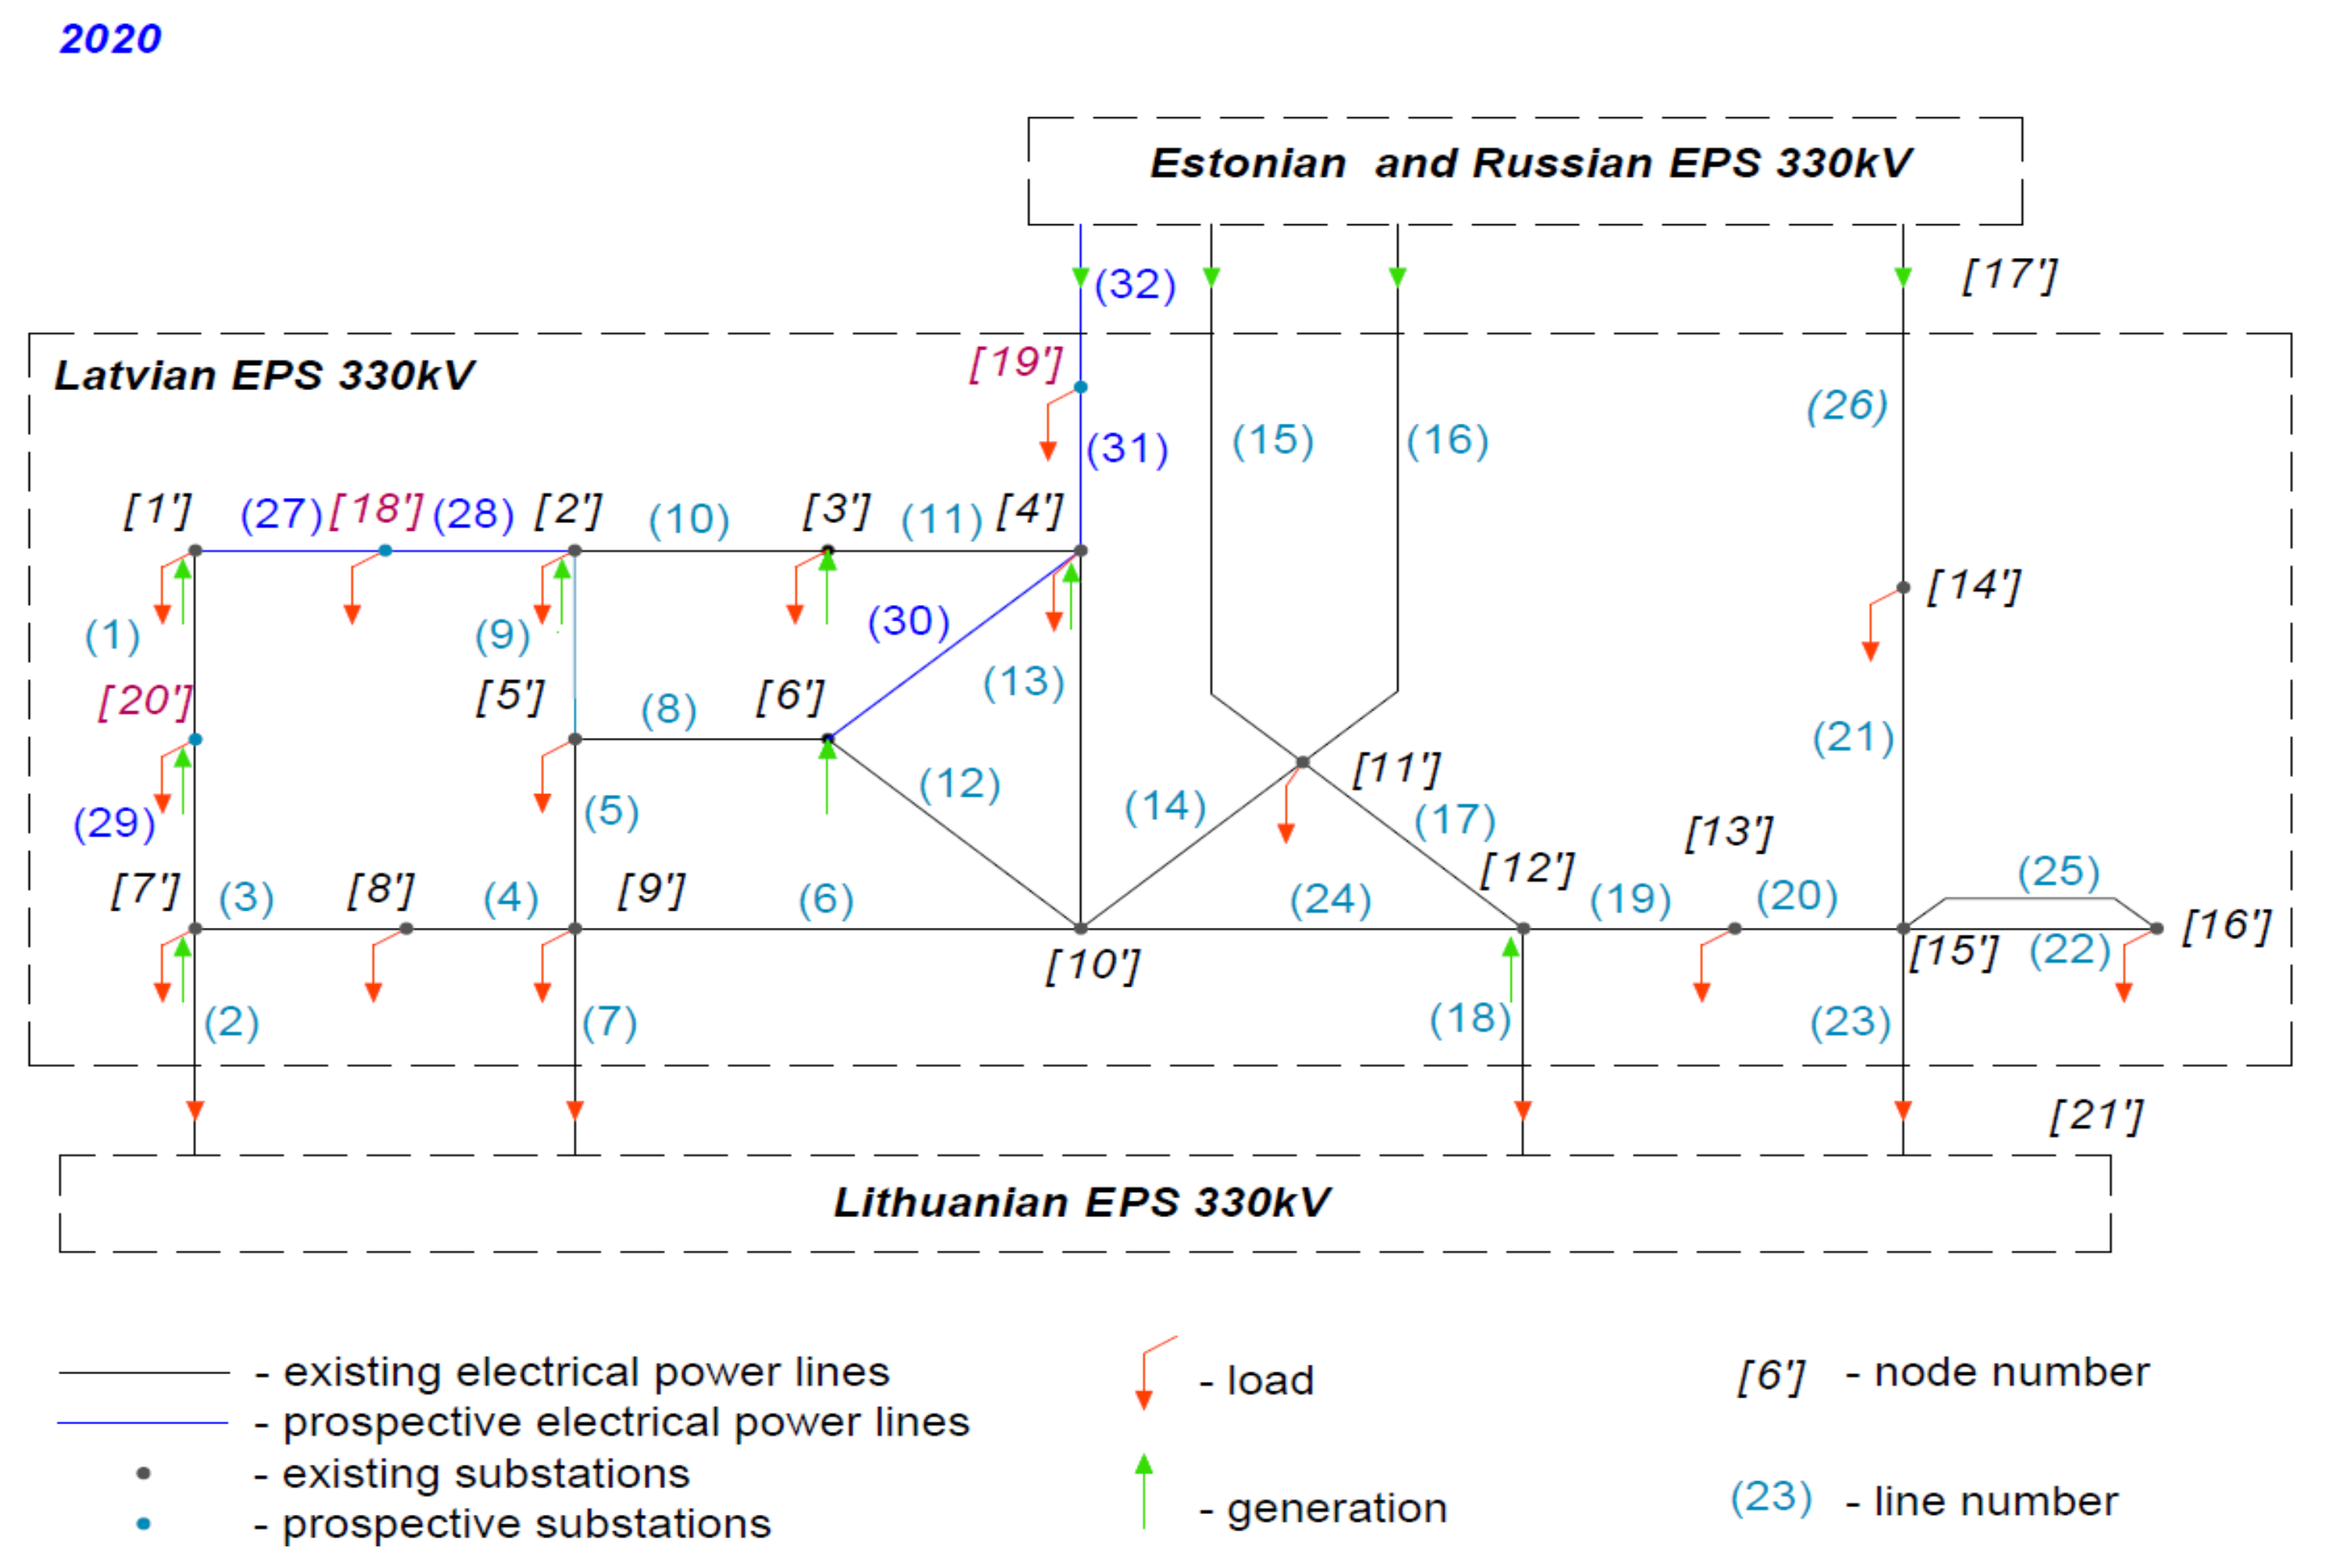
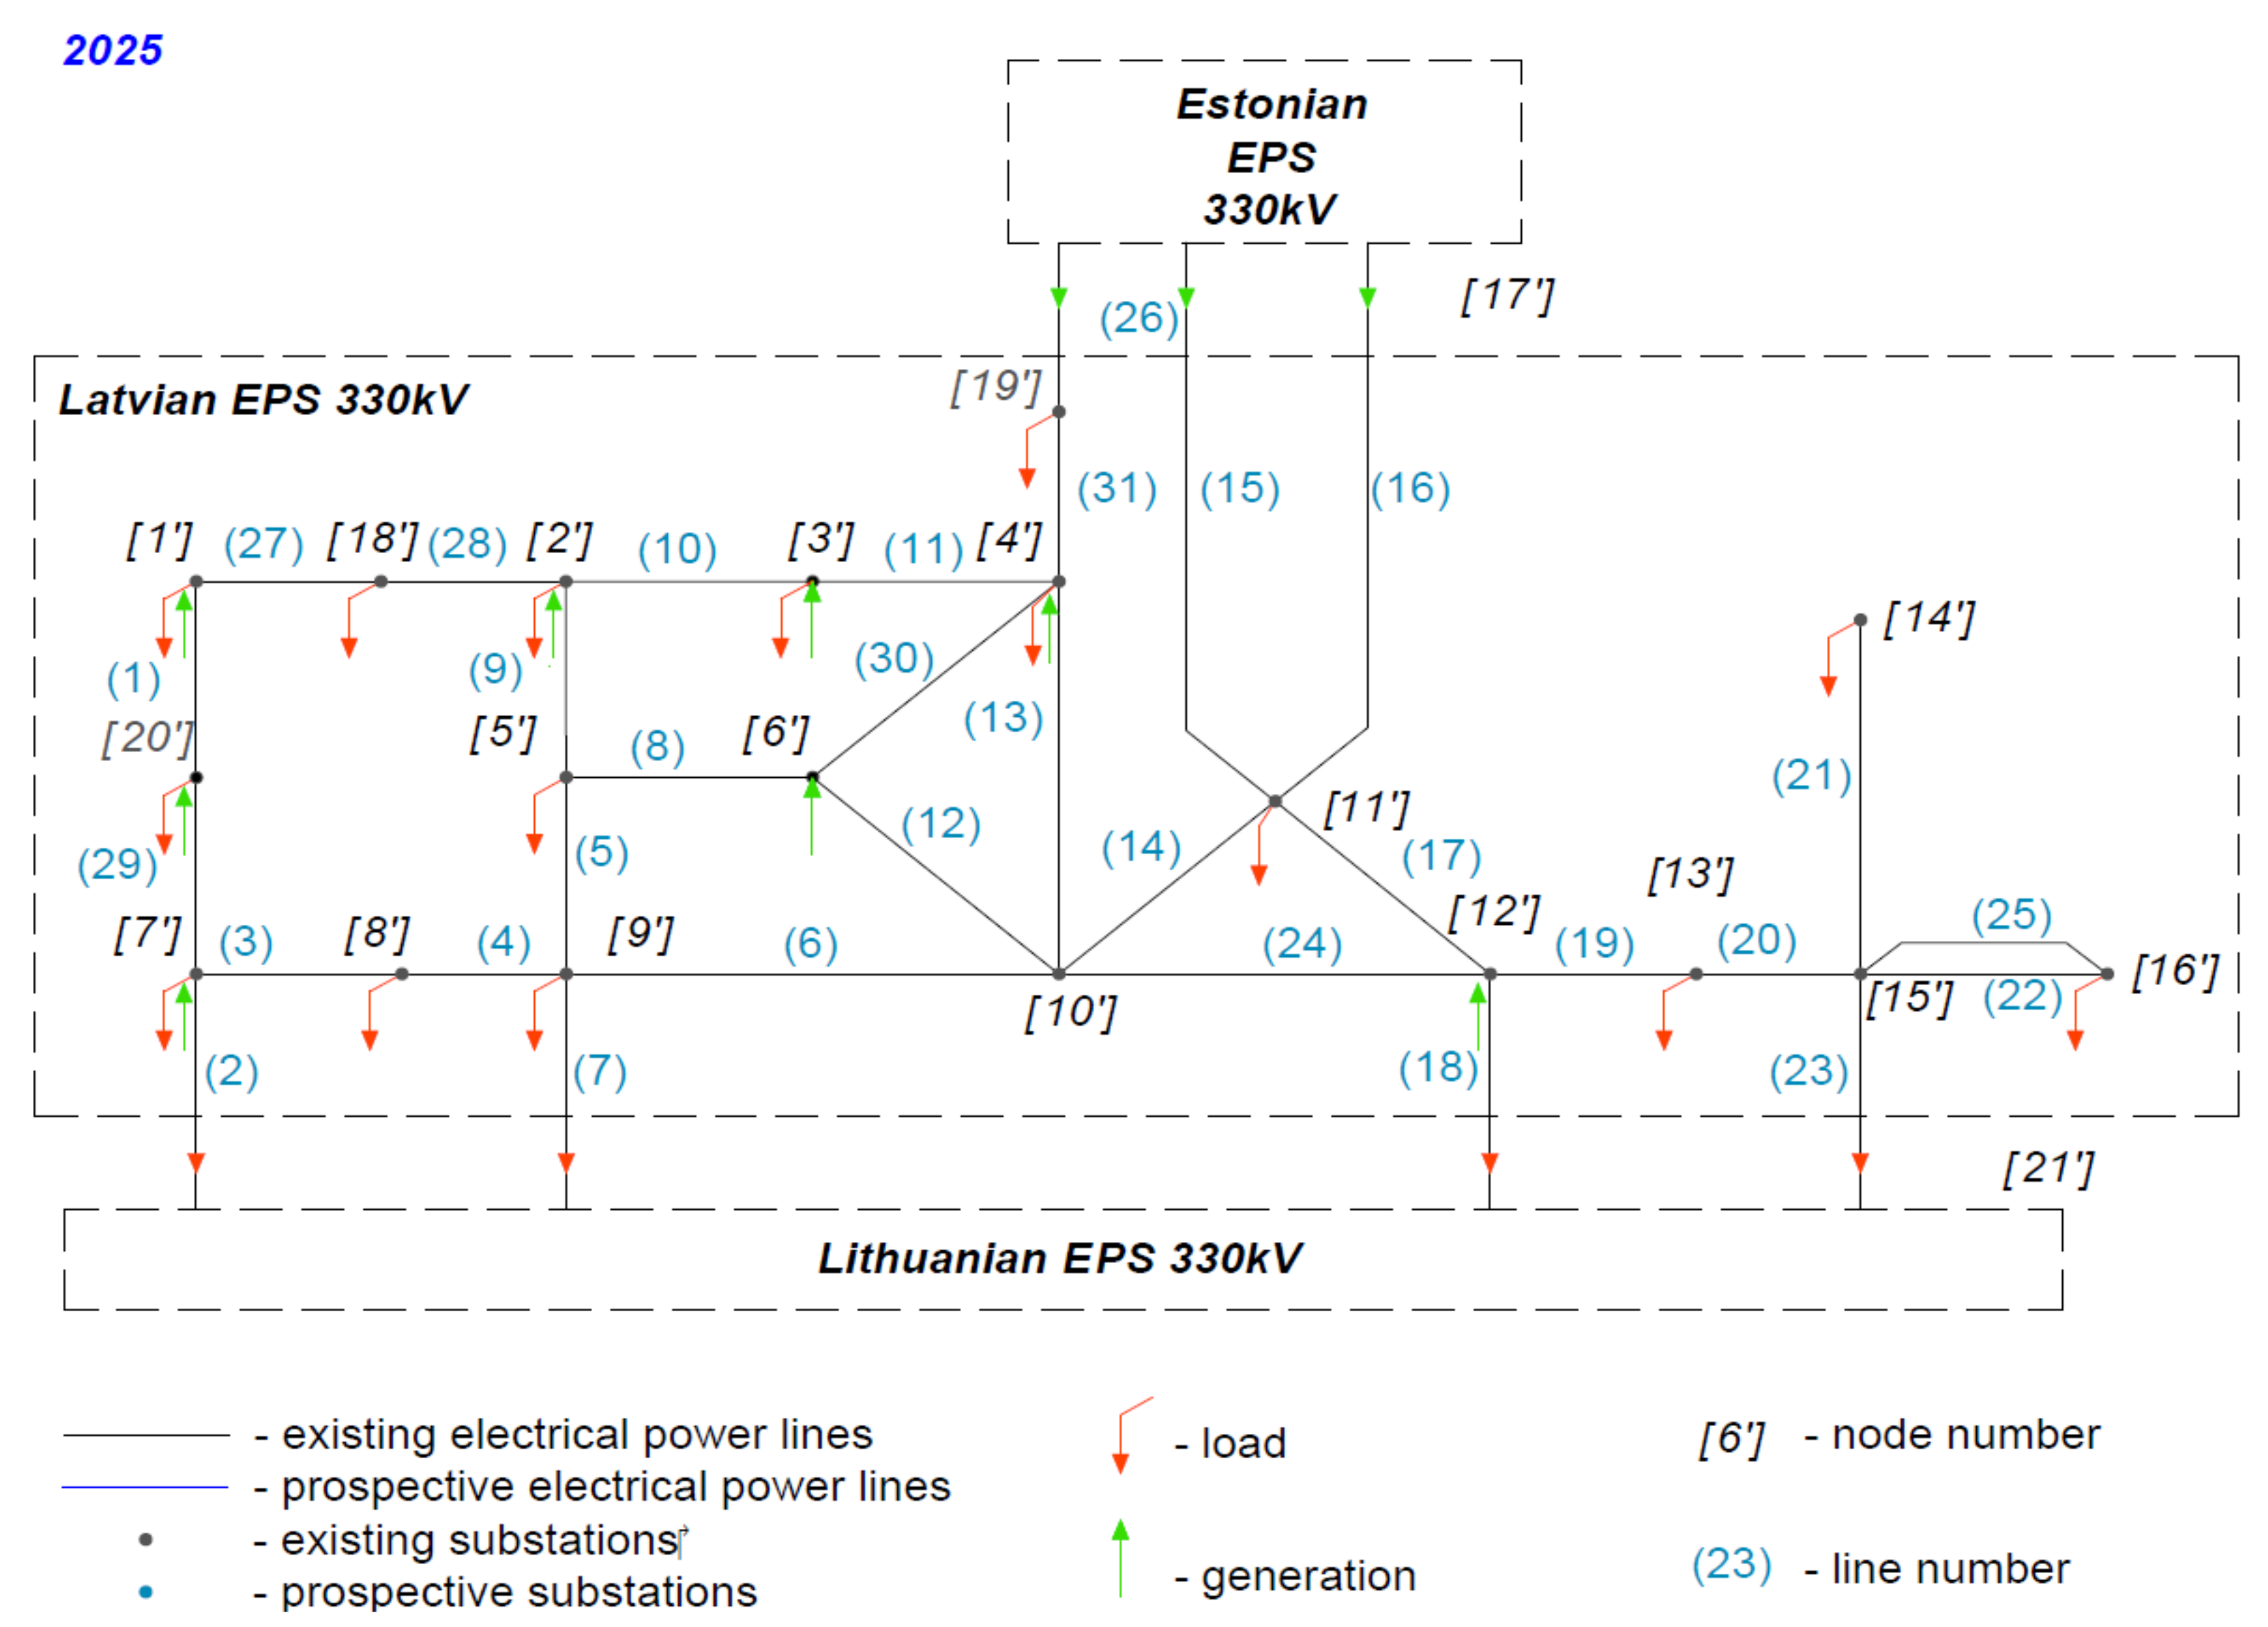
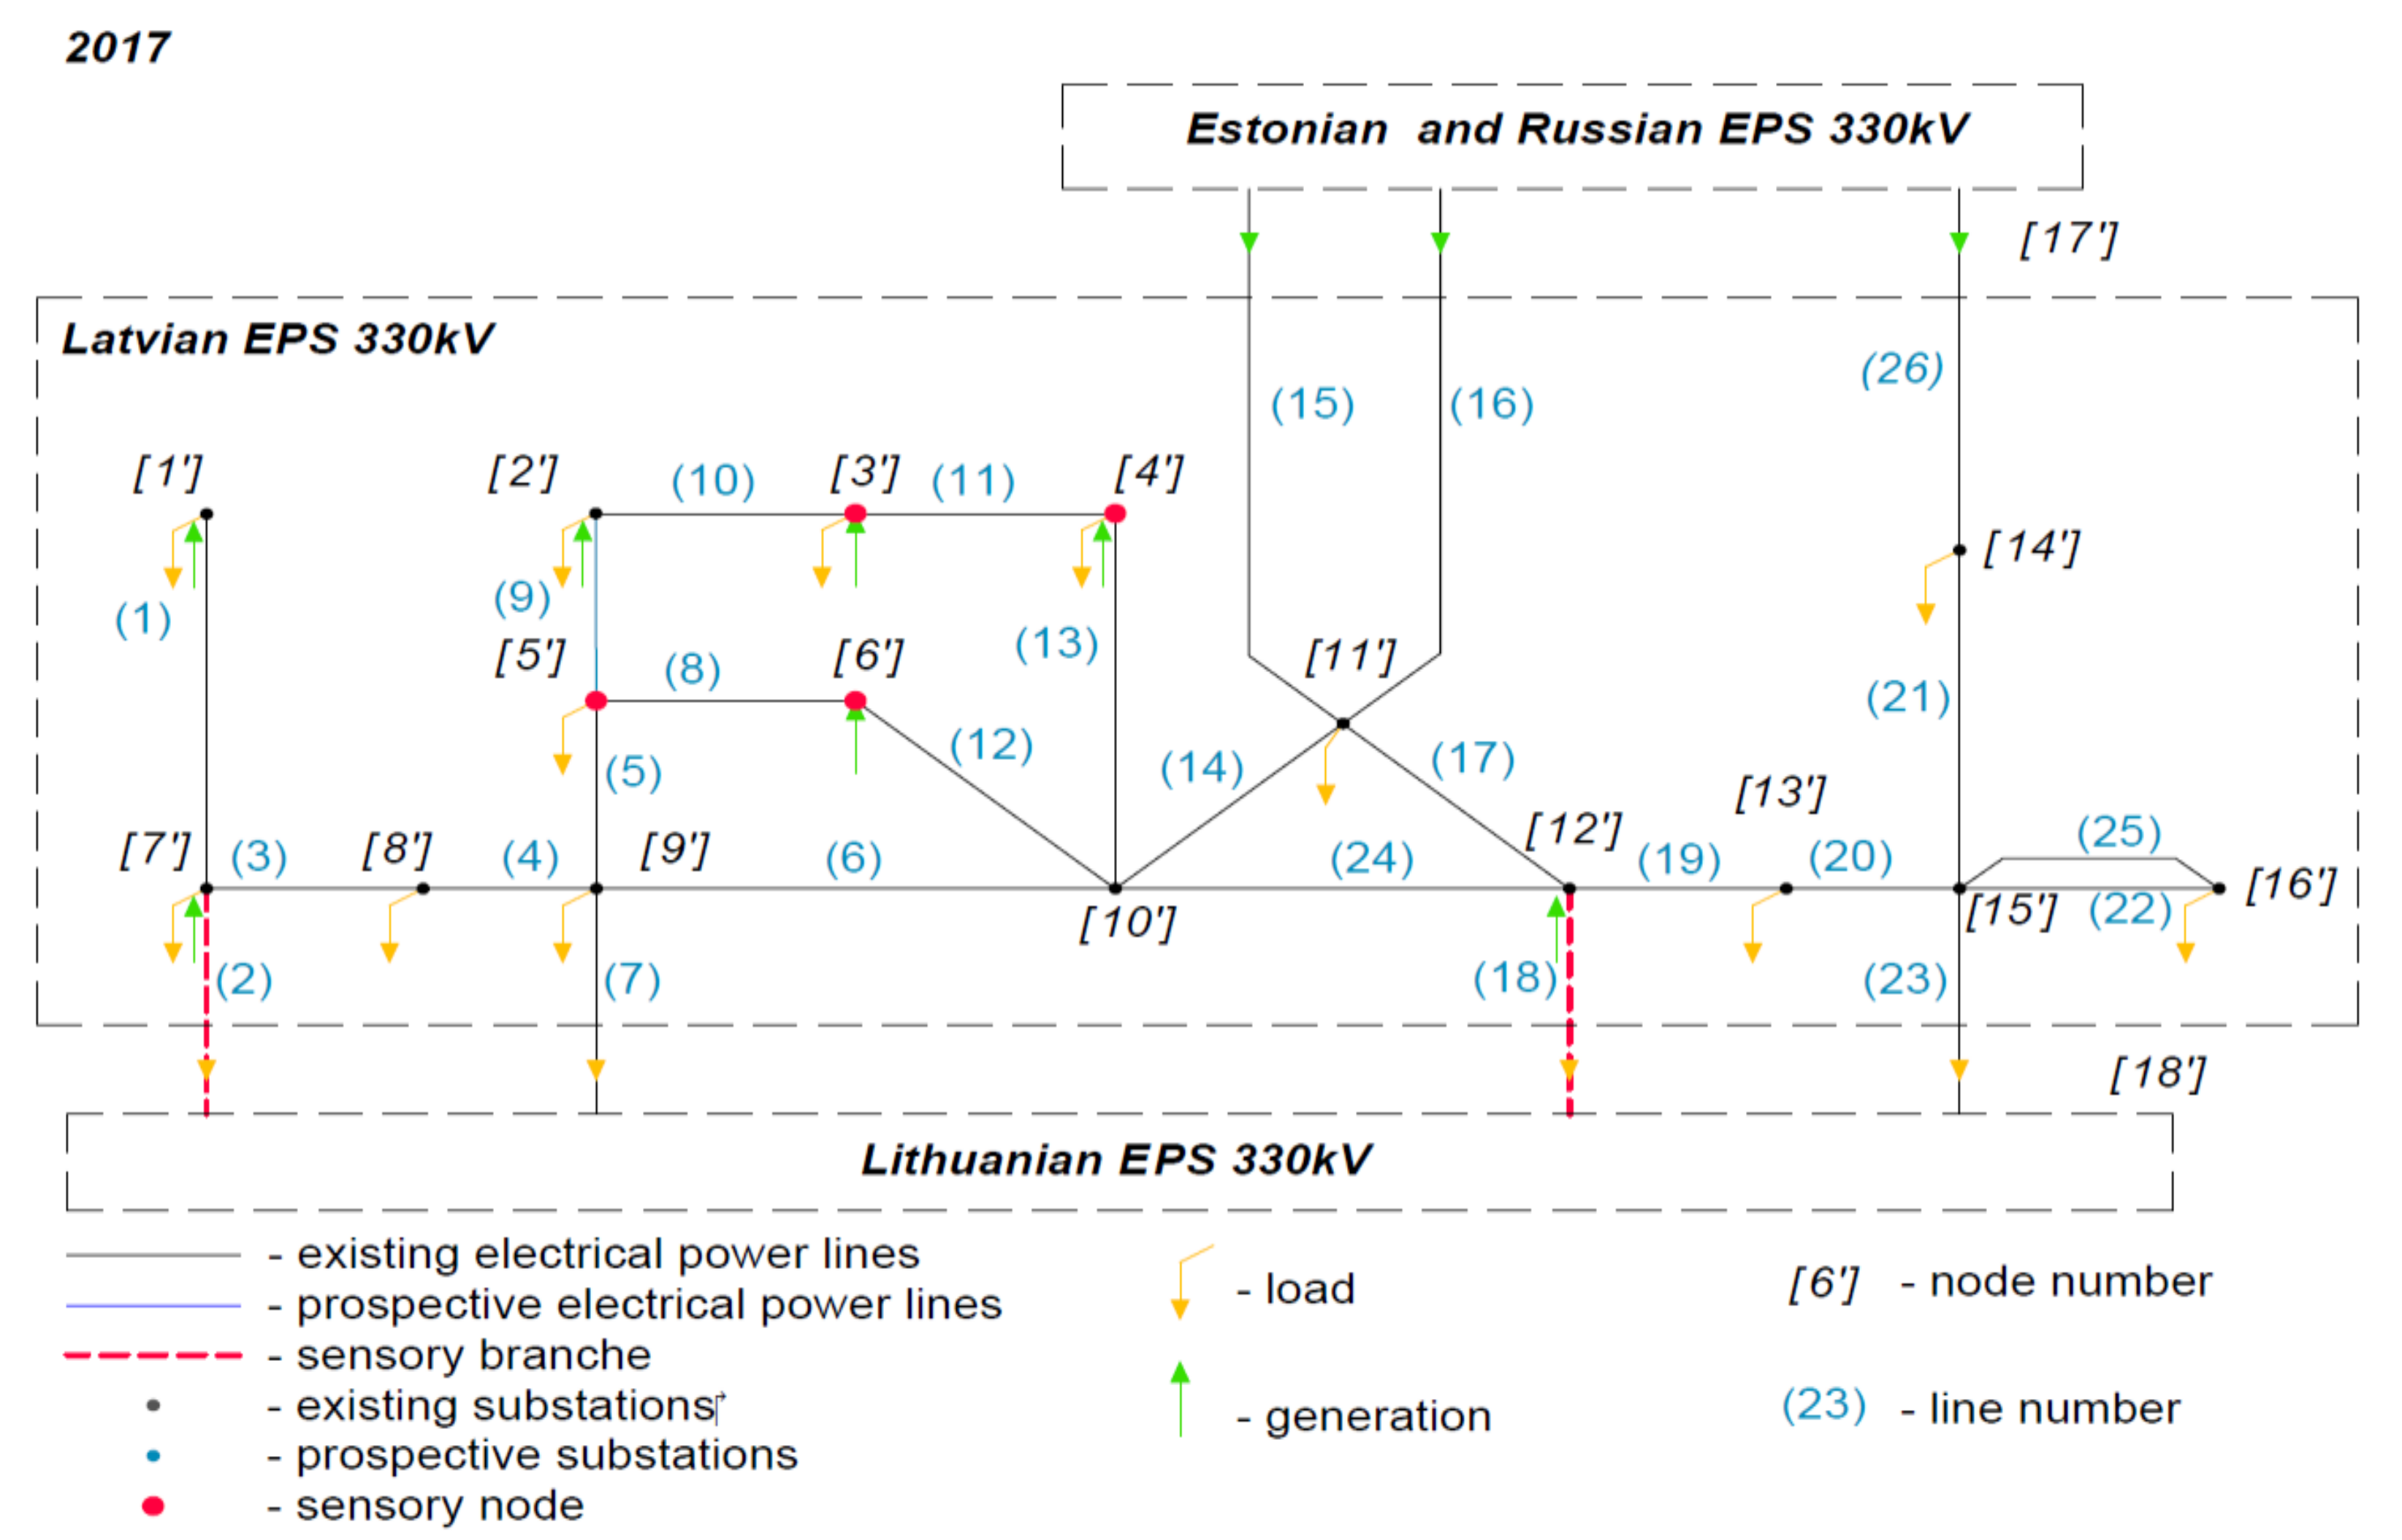
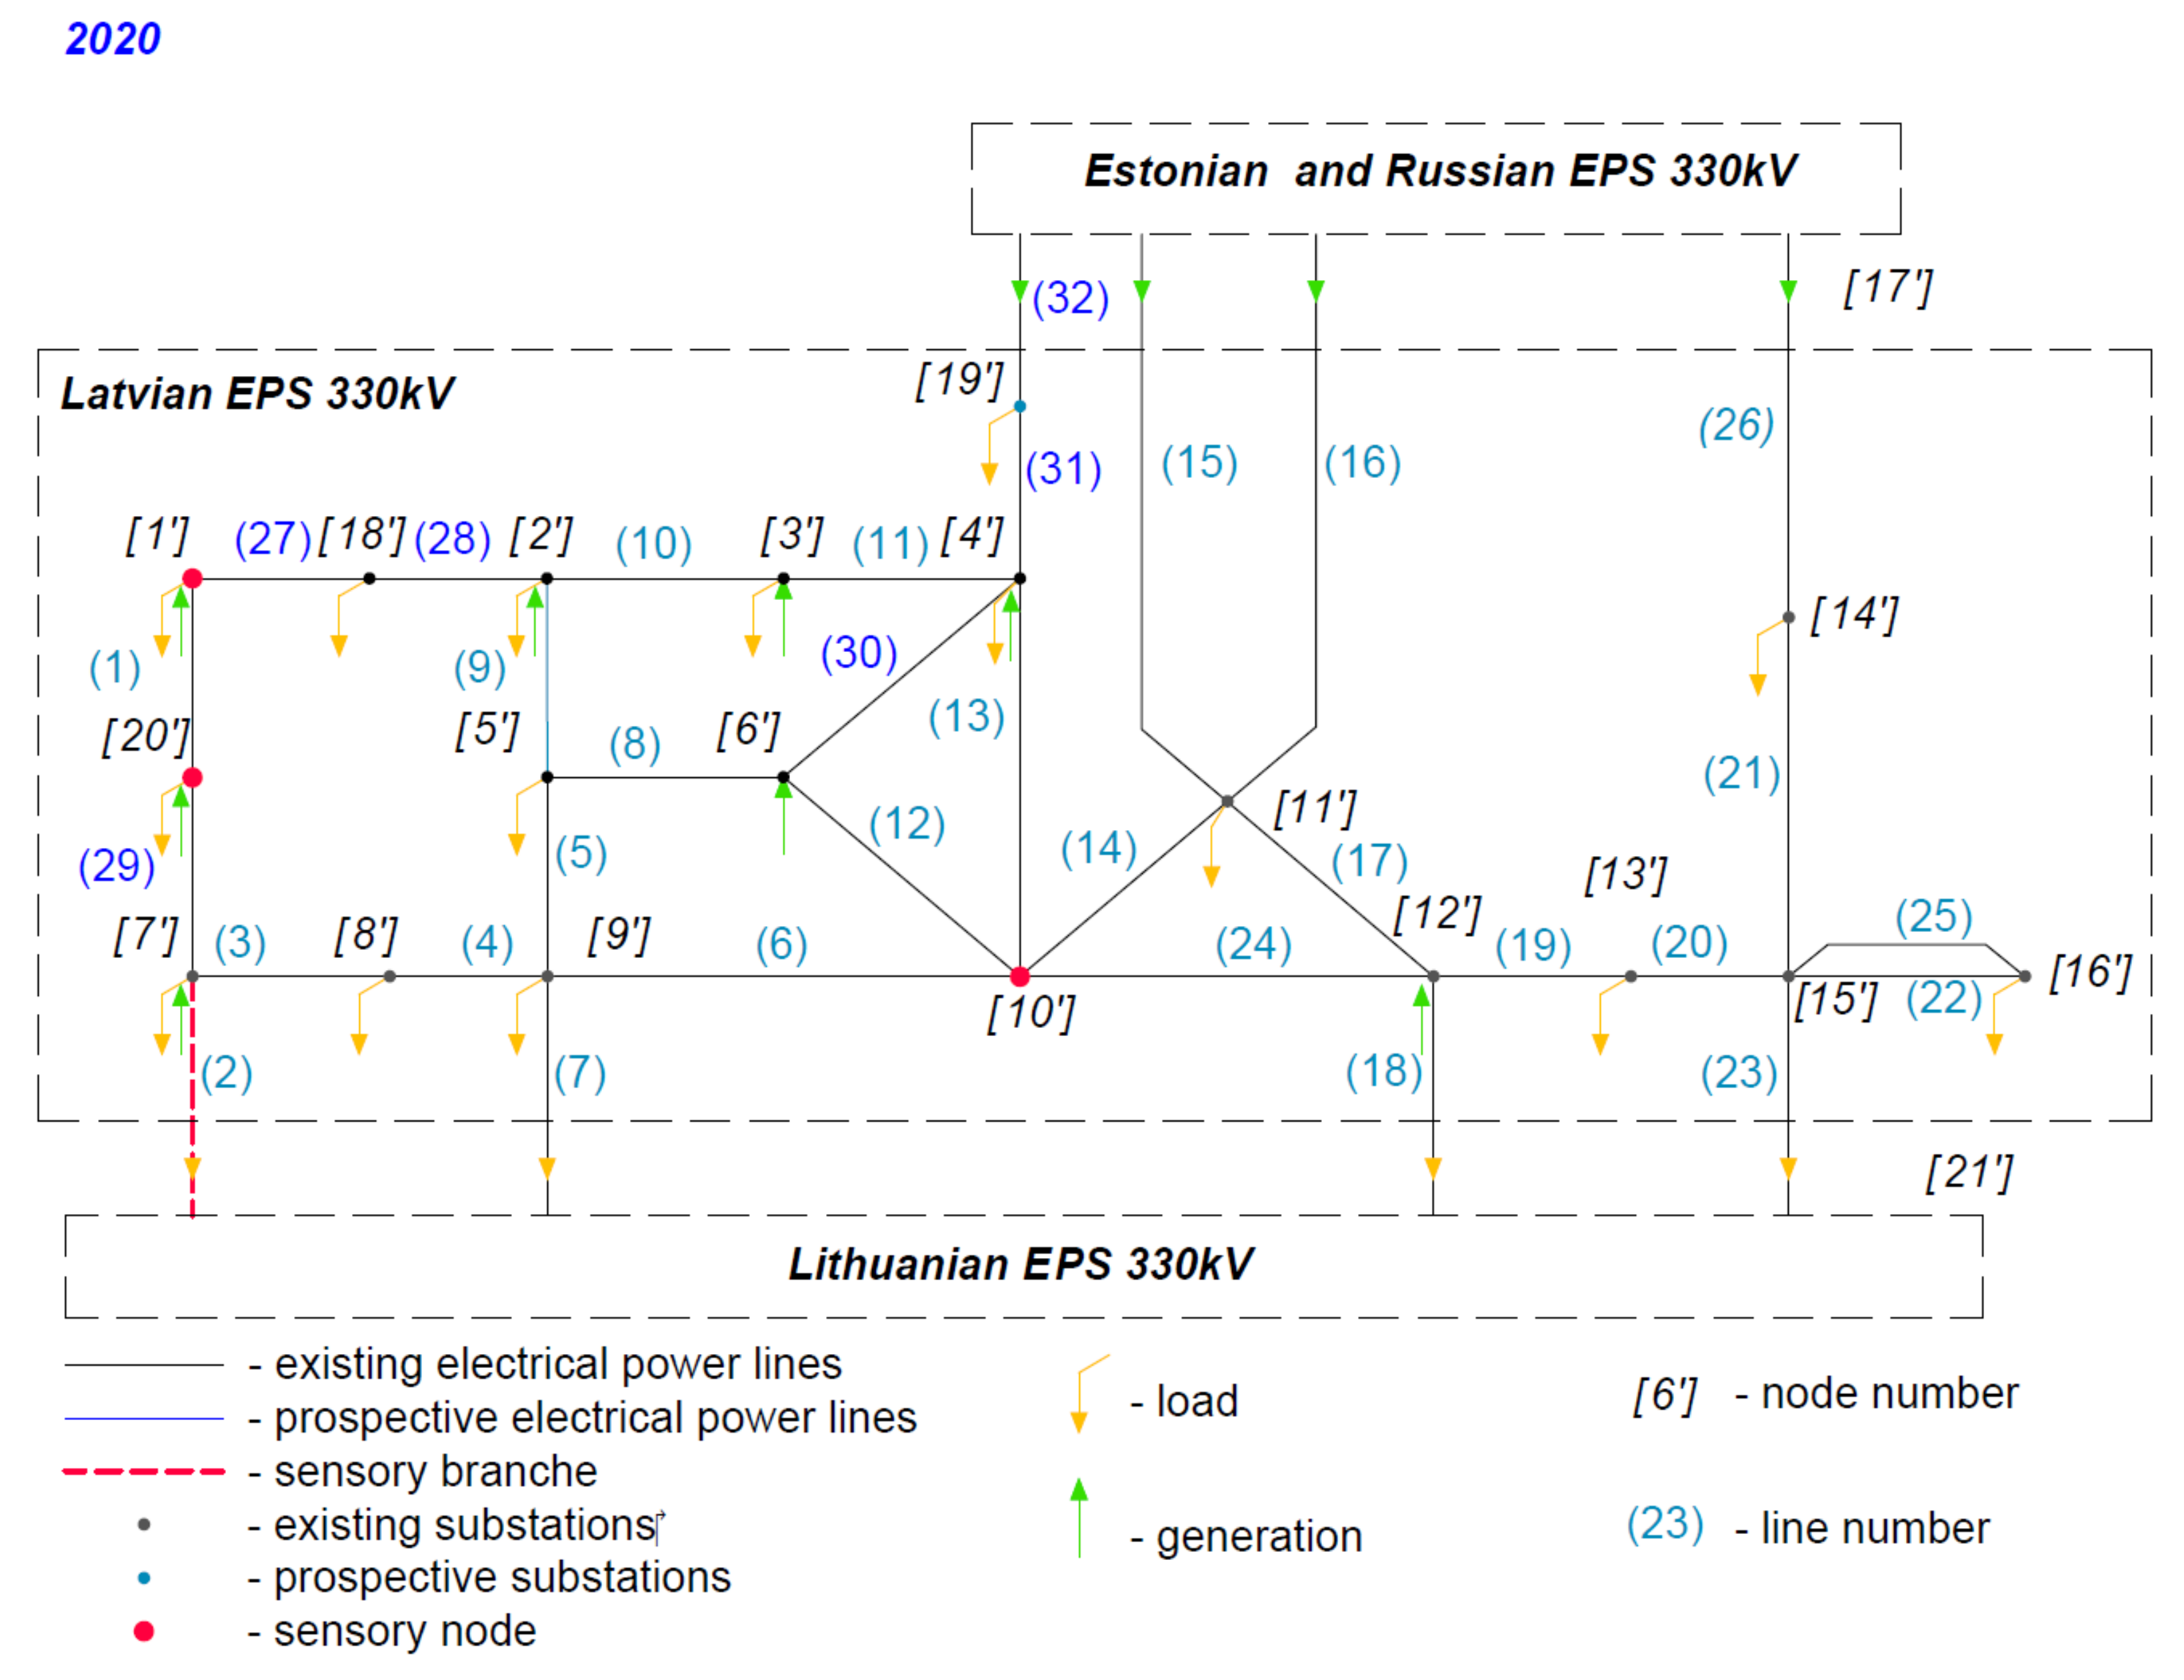
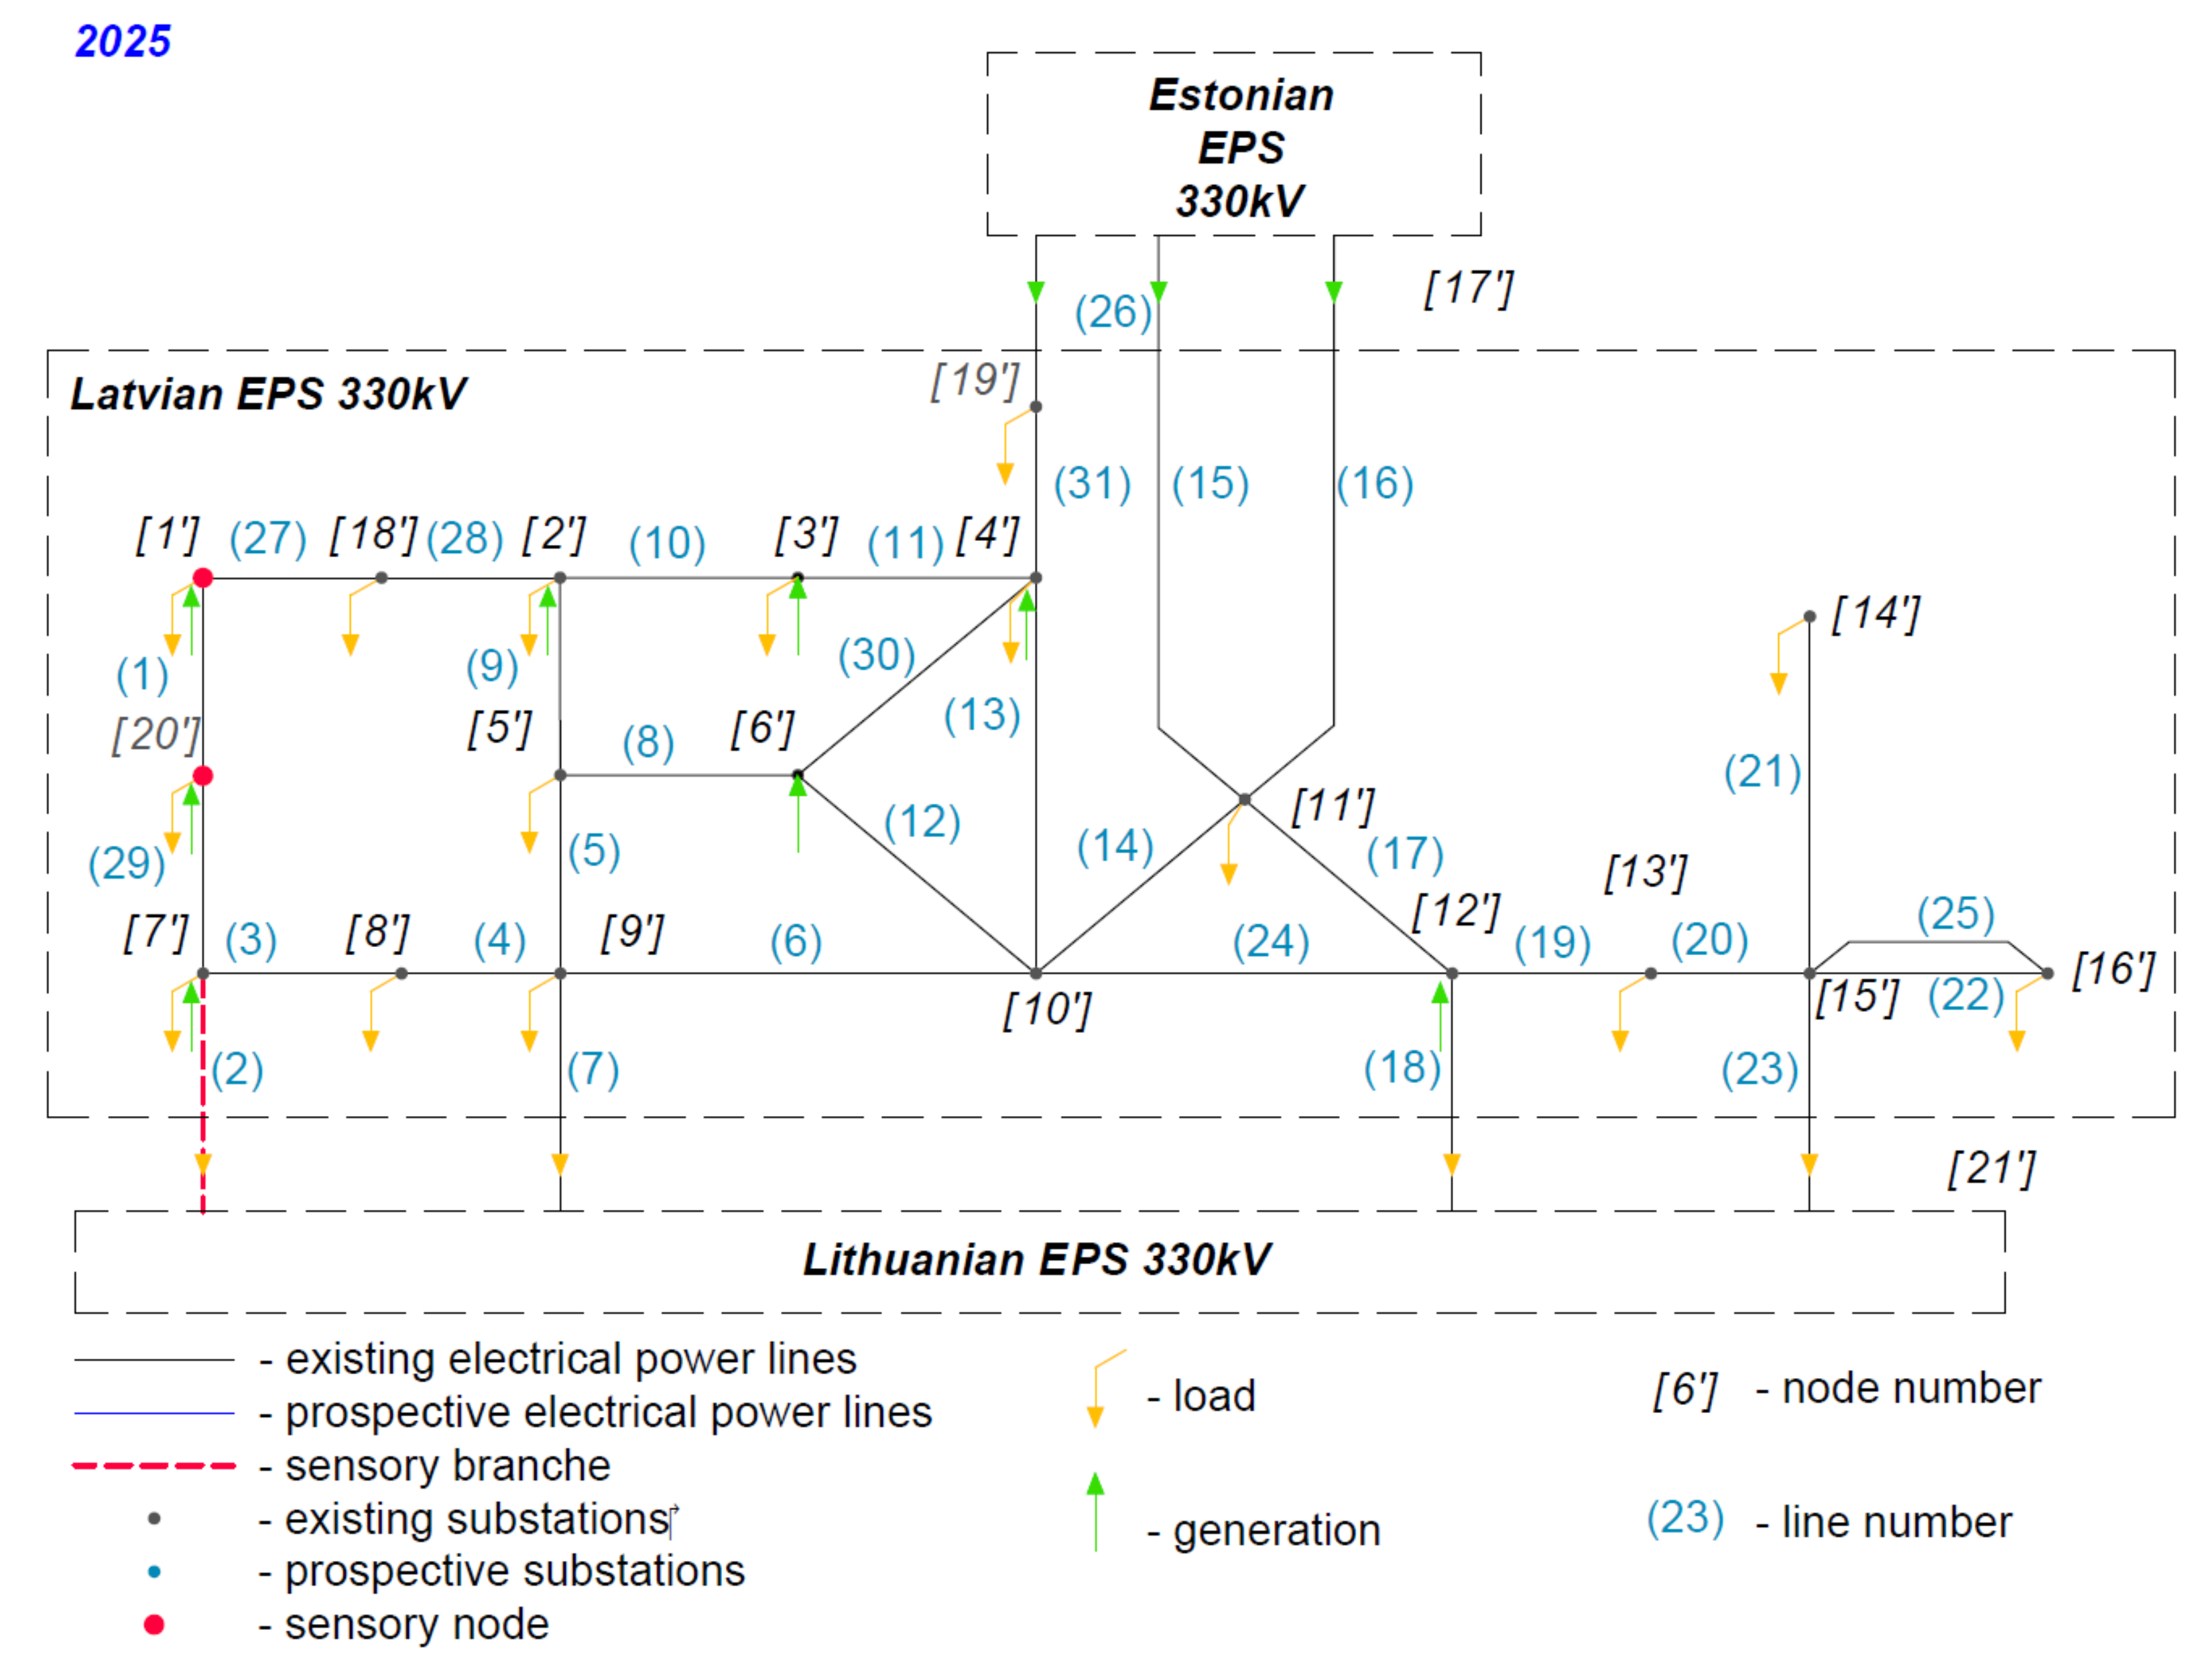
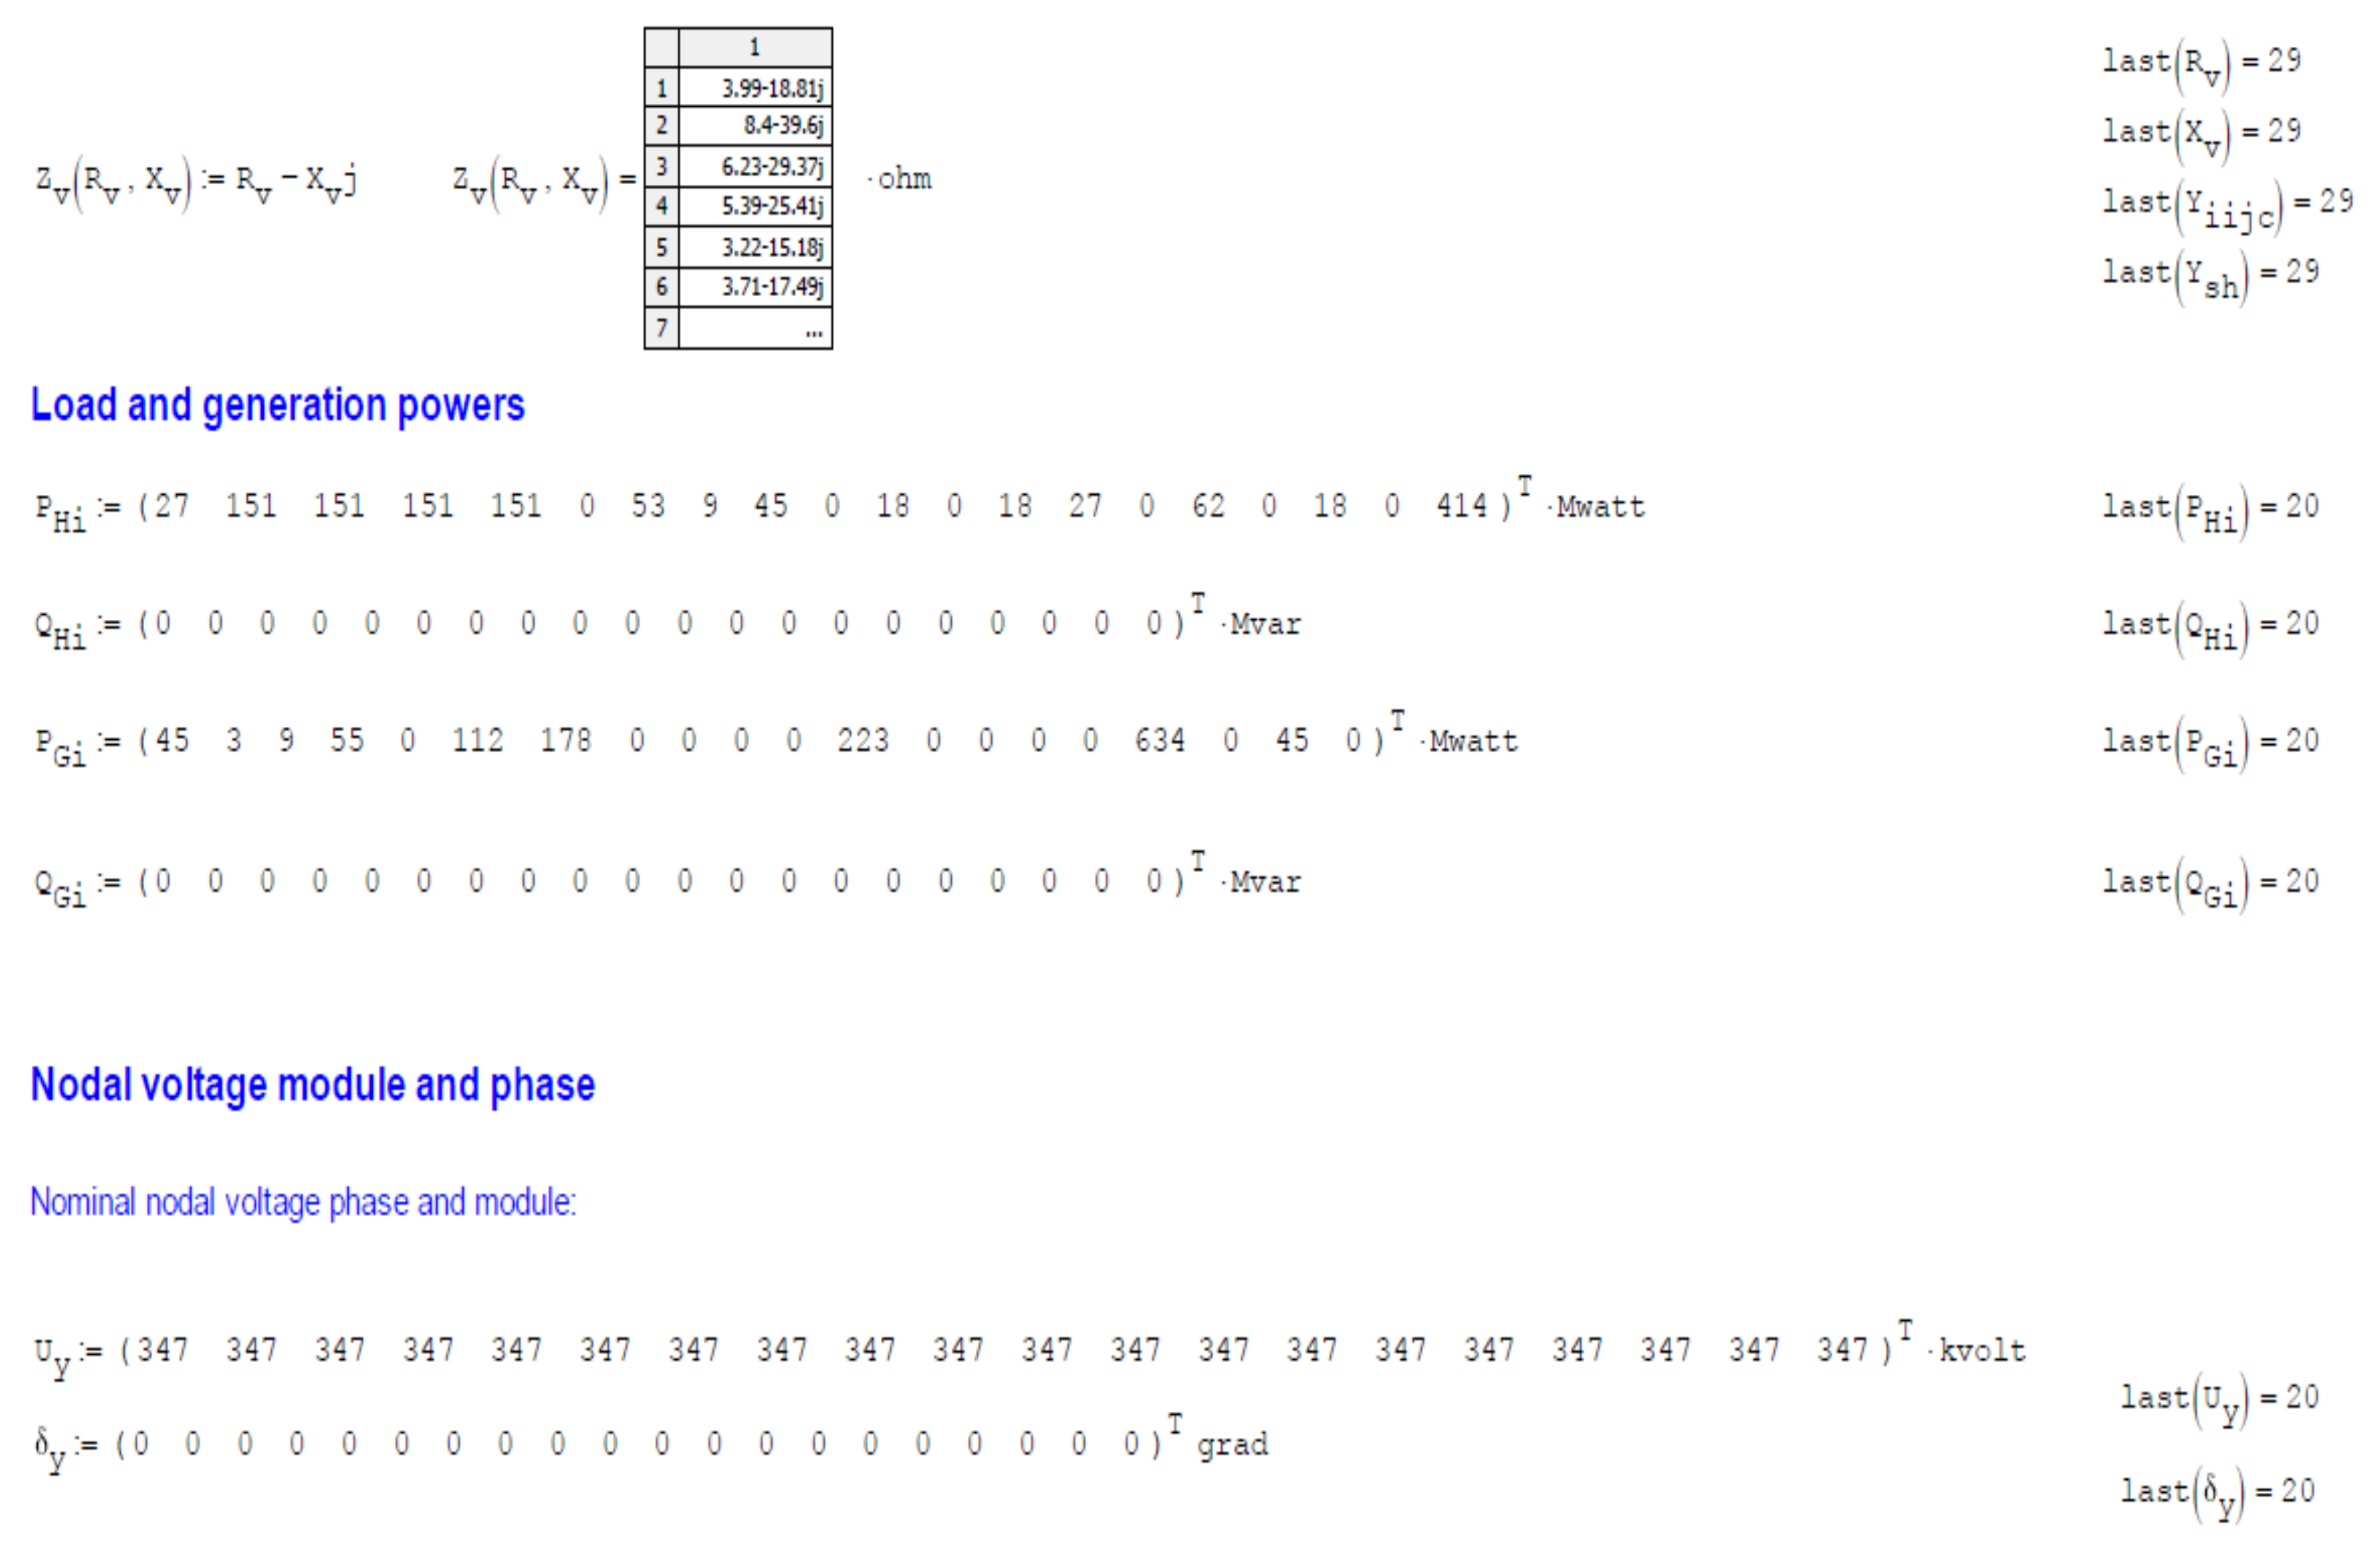
- EPS stationary mode parameters such as voltage magnitude and angle, power, load, and generation at nodes;
- Network parameters such as the internal and external communication sets for power transmission and branch resistance.
6. Conclusions
Author Contributions
Funding
Institutional Review Board Statement
Informed Consent Statement
Data Availability Statement
Conflicts of Interest
Appendix A
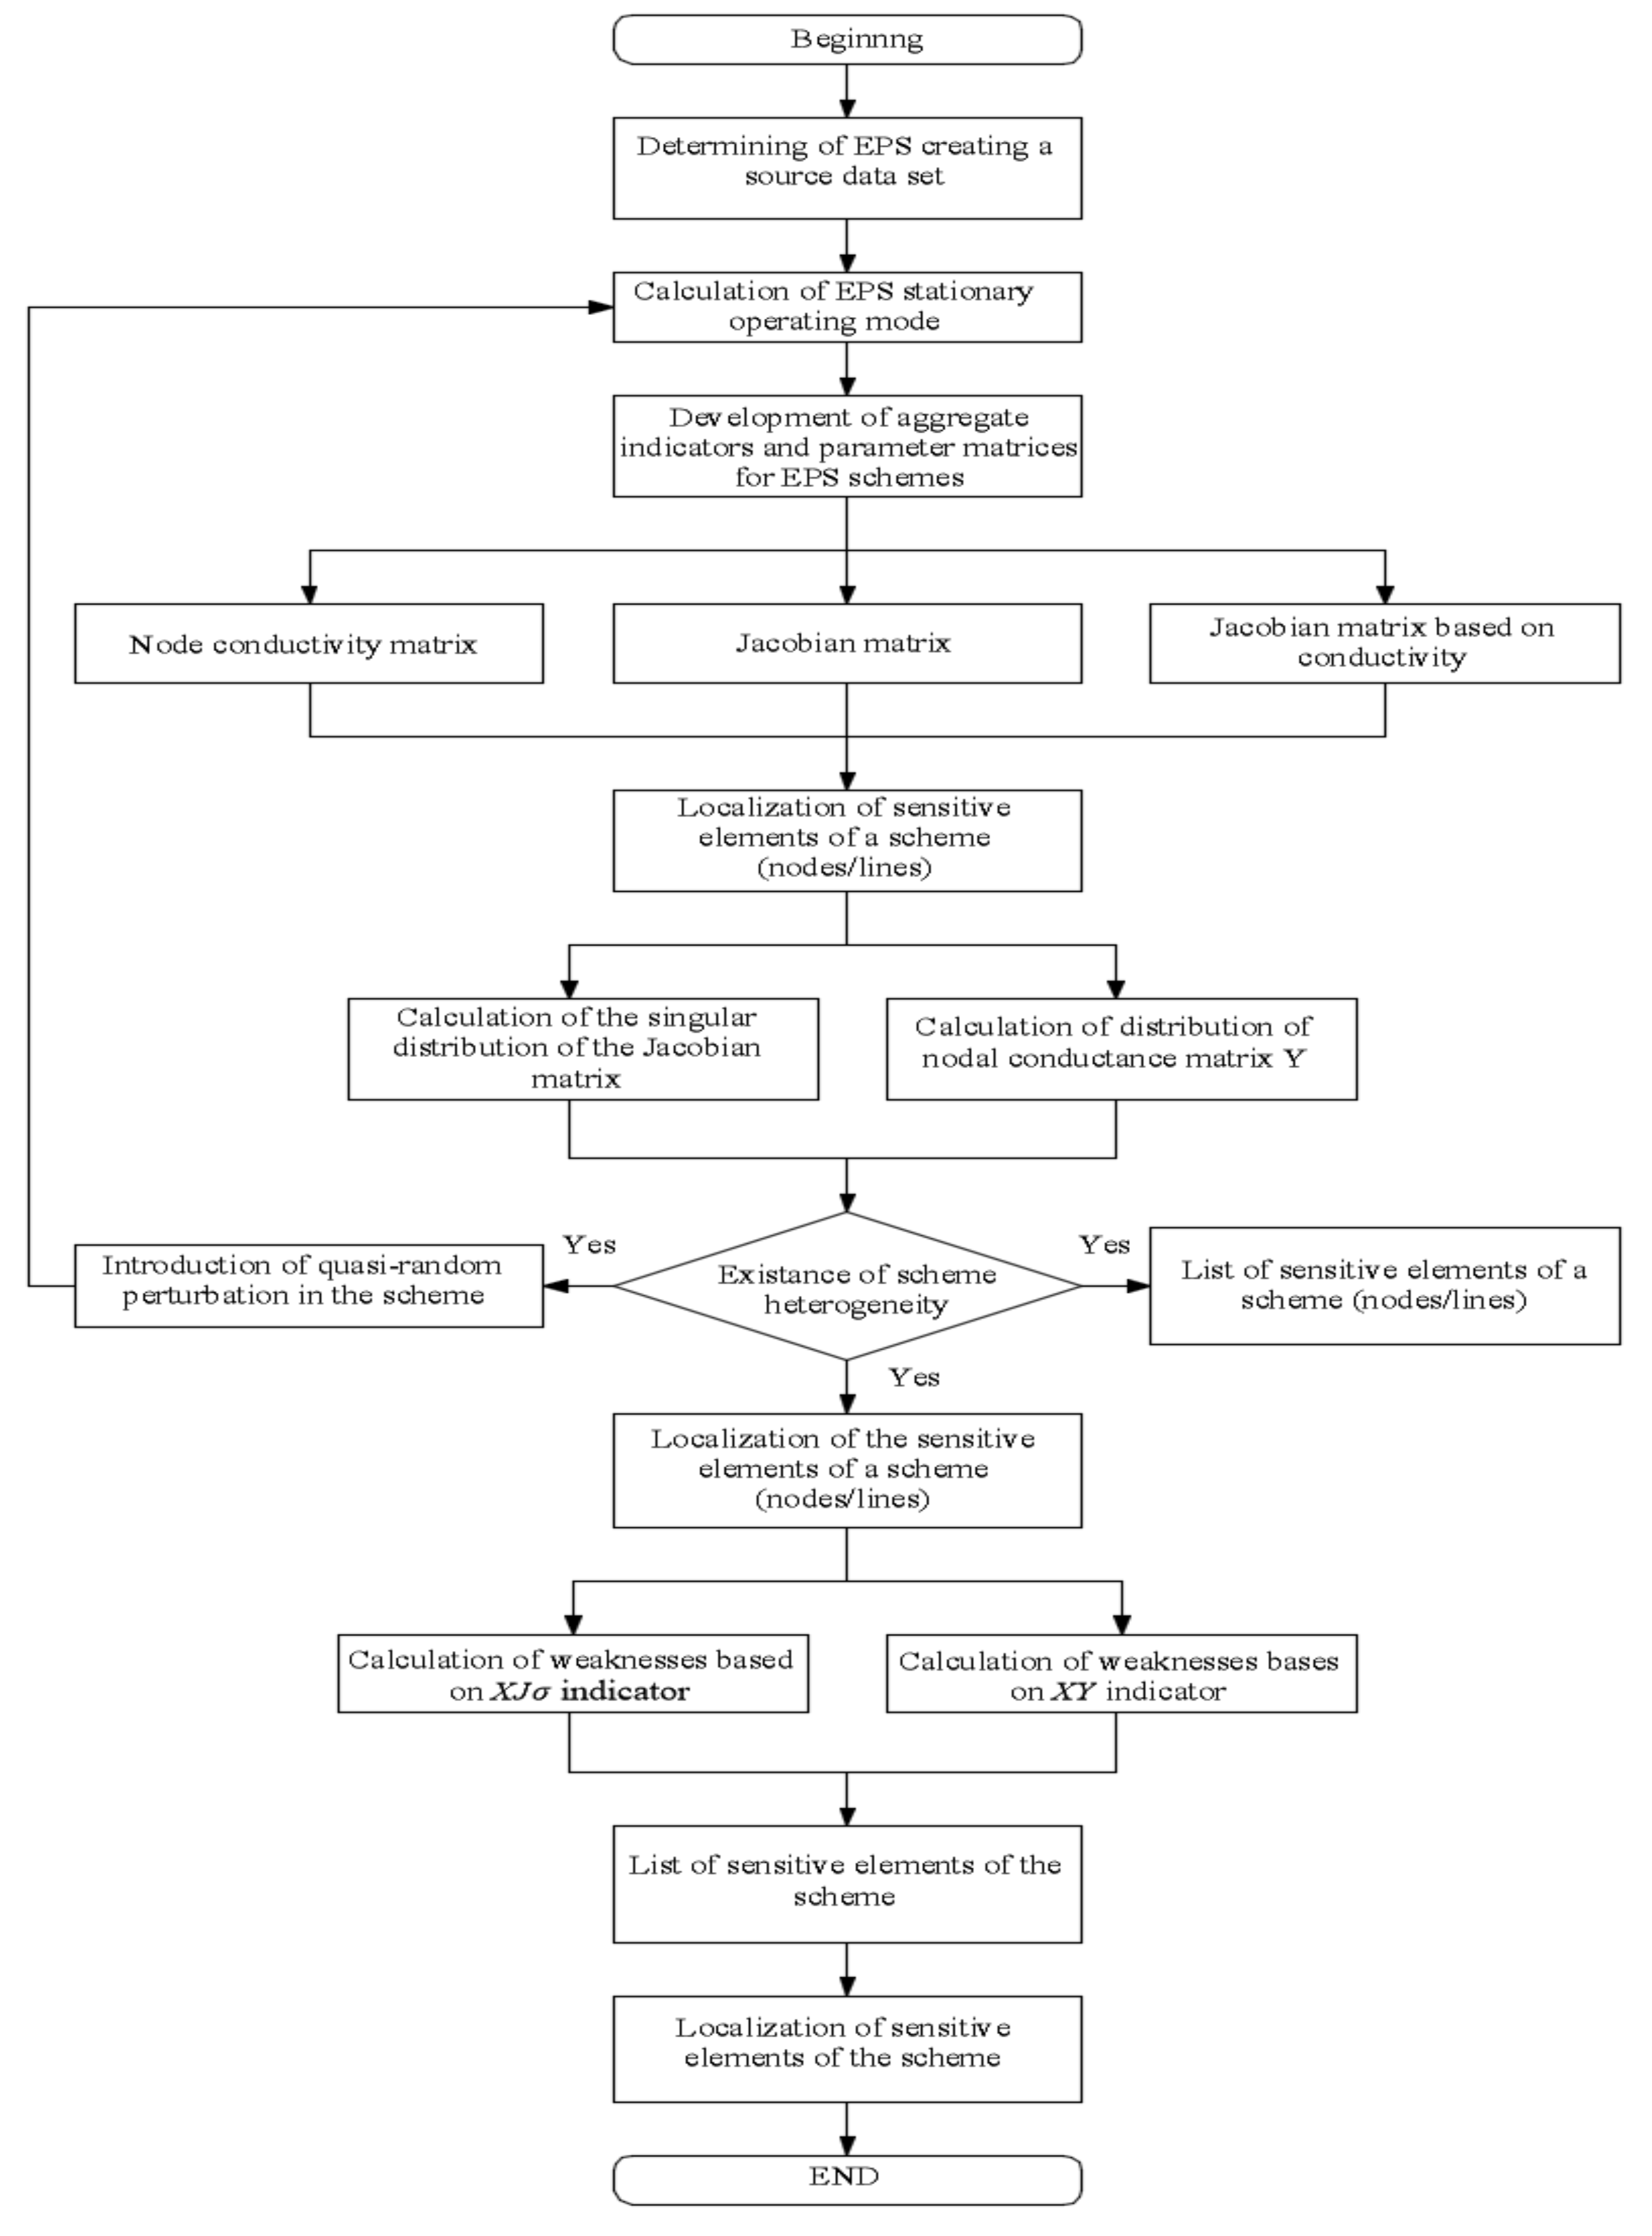
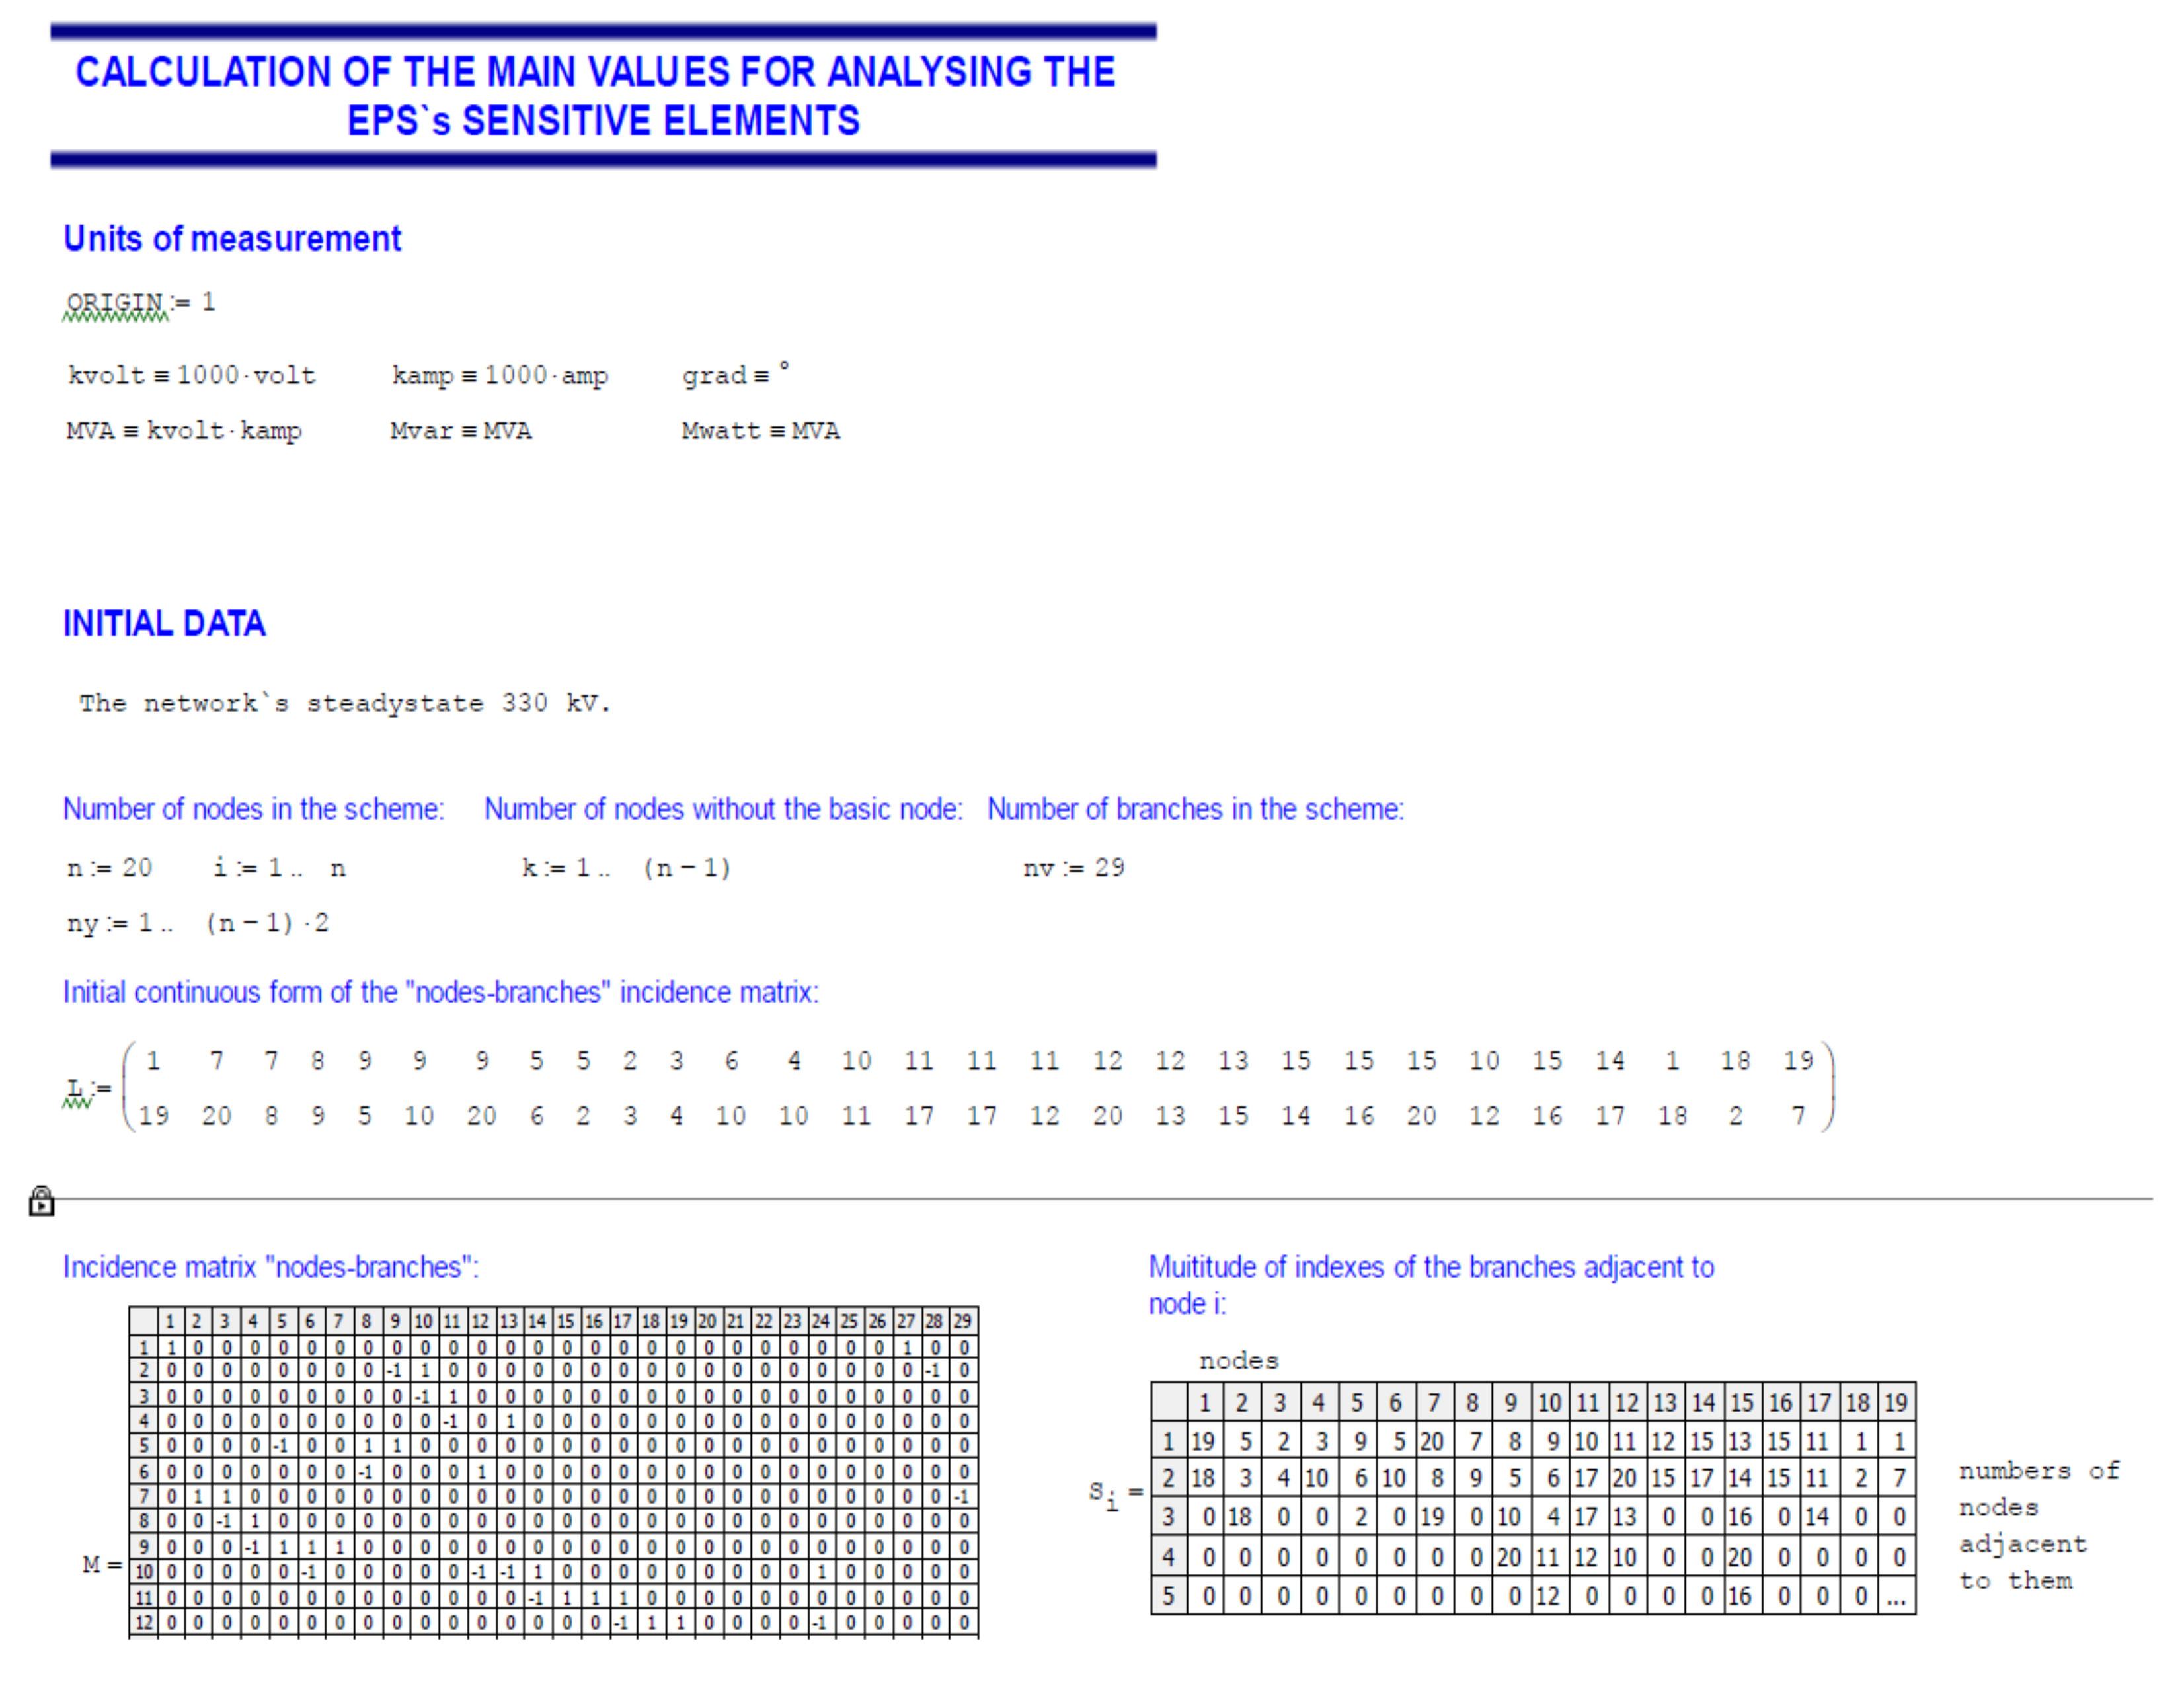
- Set up the initial data of the considered power network in a steady state;
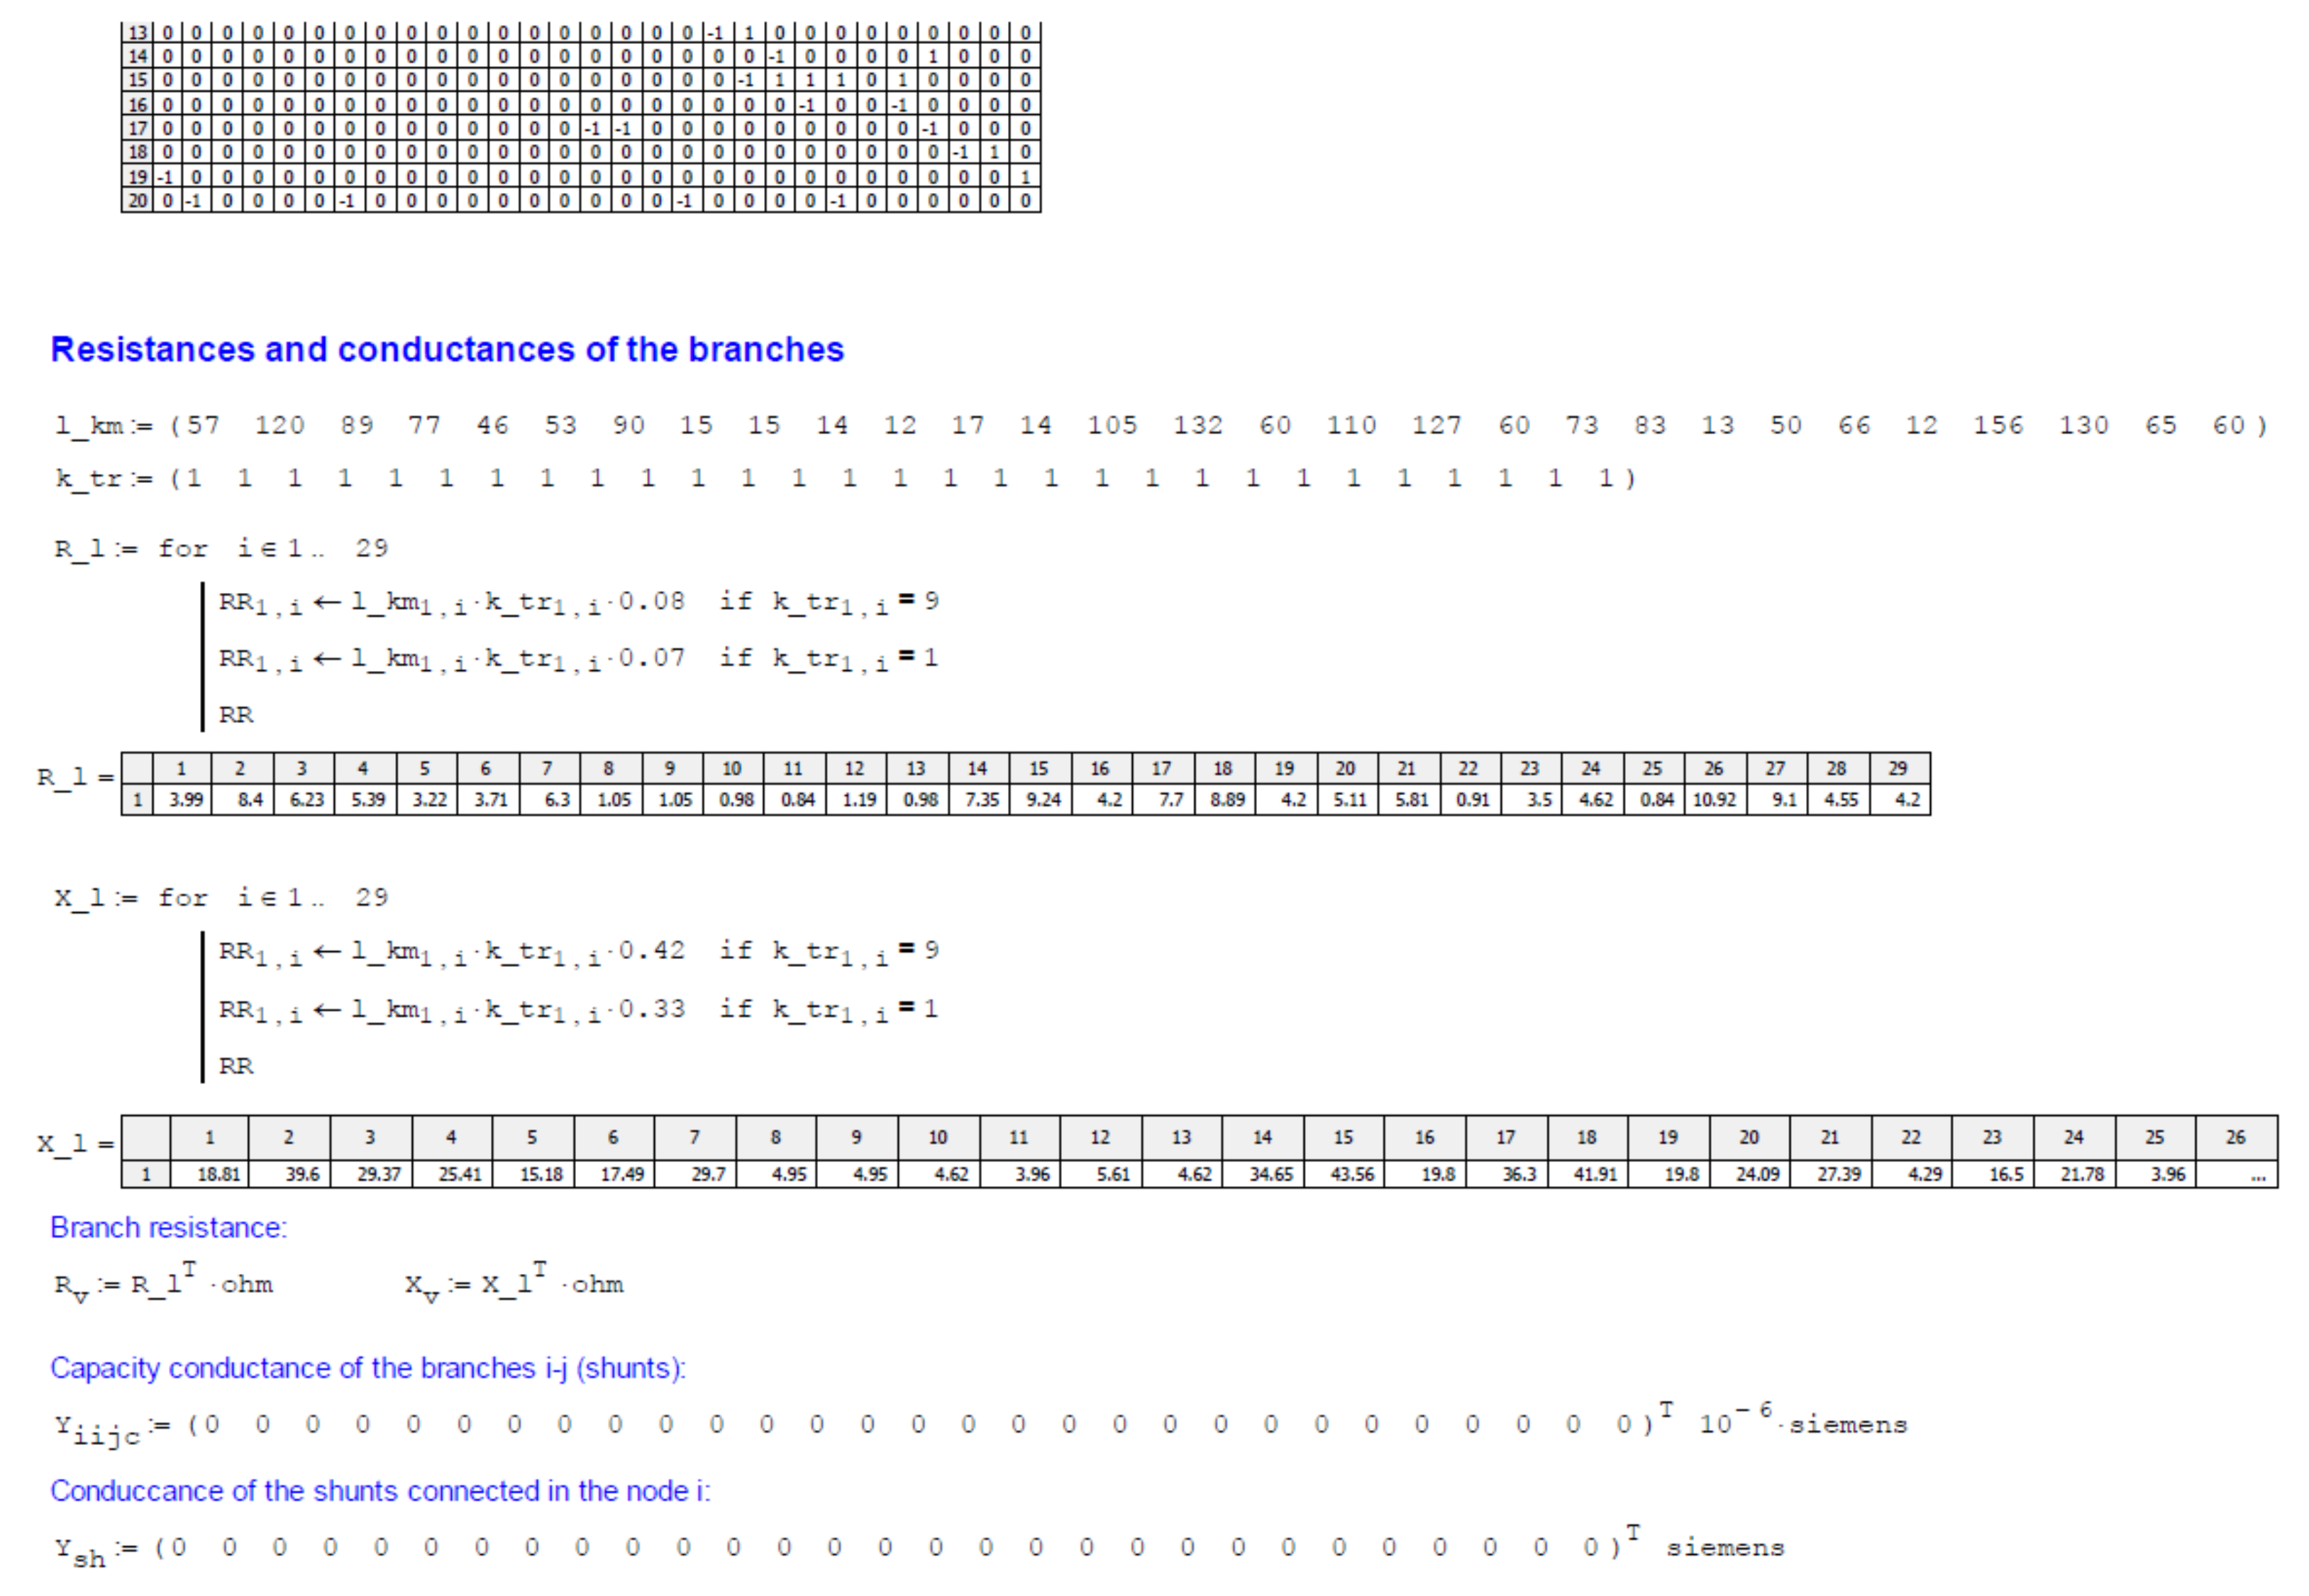
- Calculate the main parameters’ values of the examined EPS’ sensitive elements;
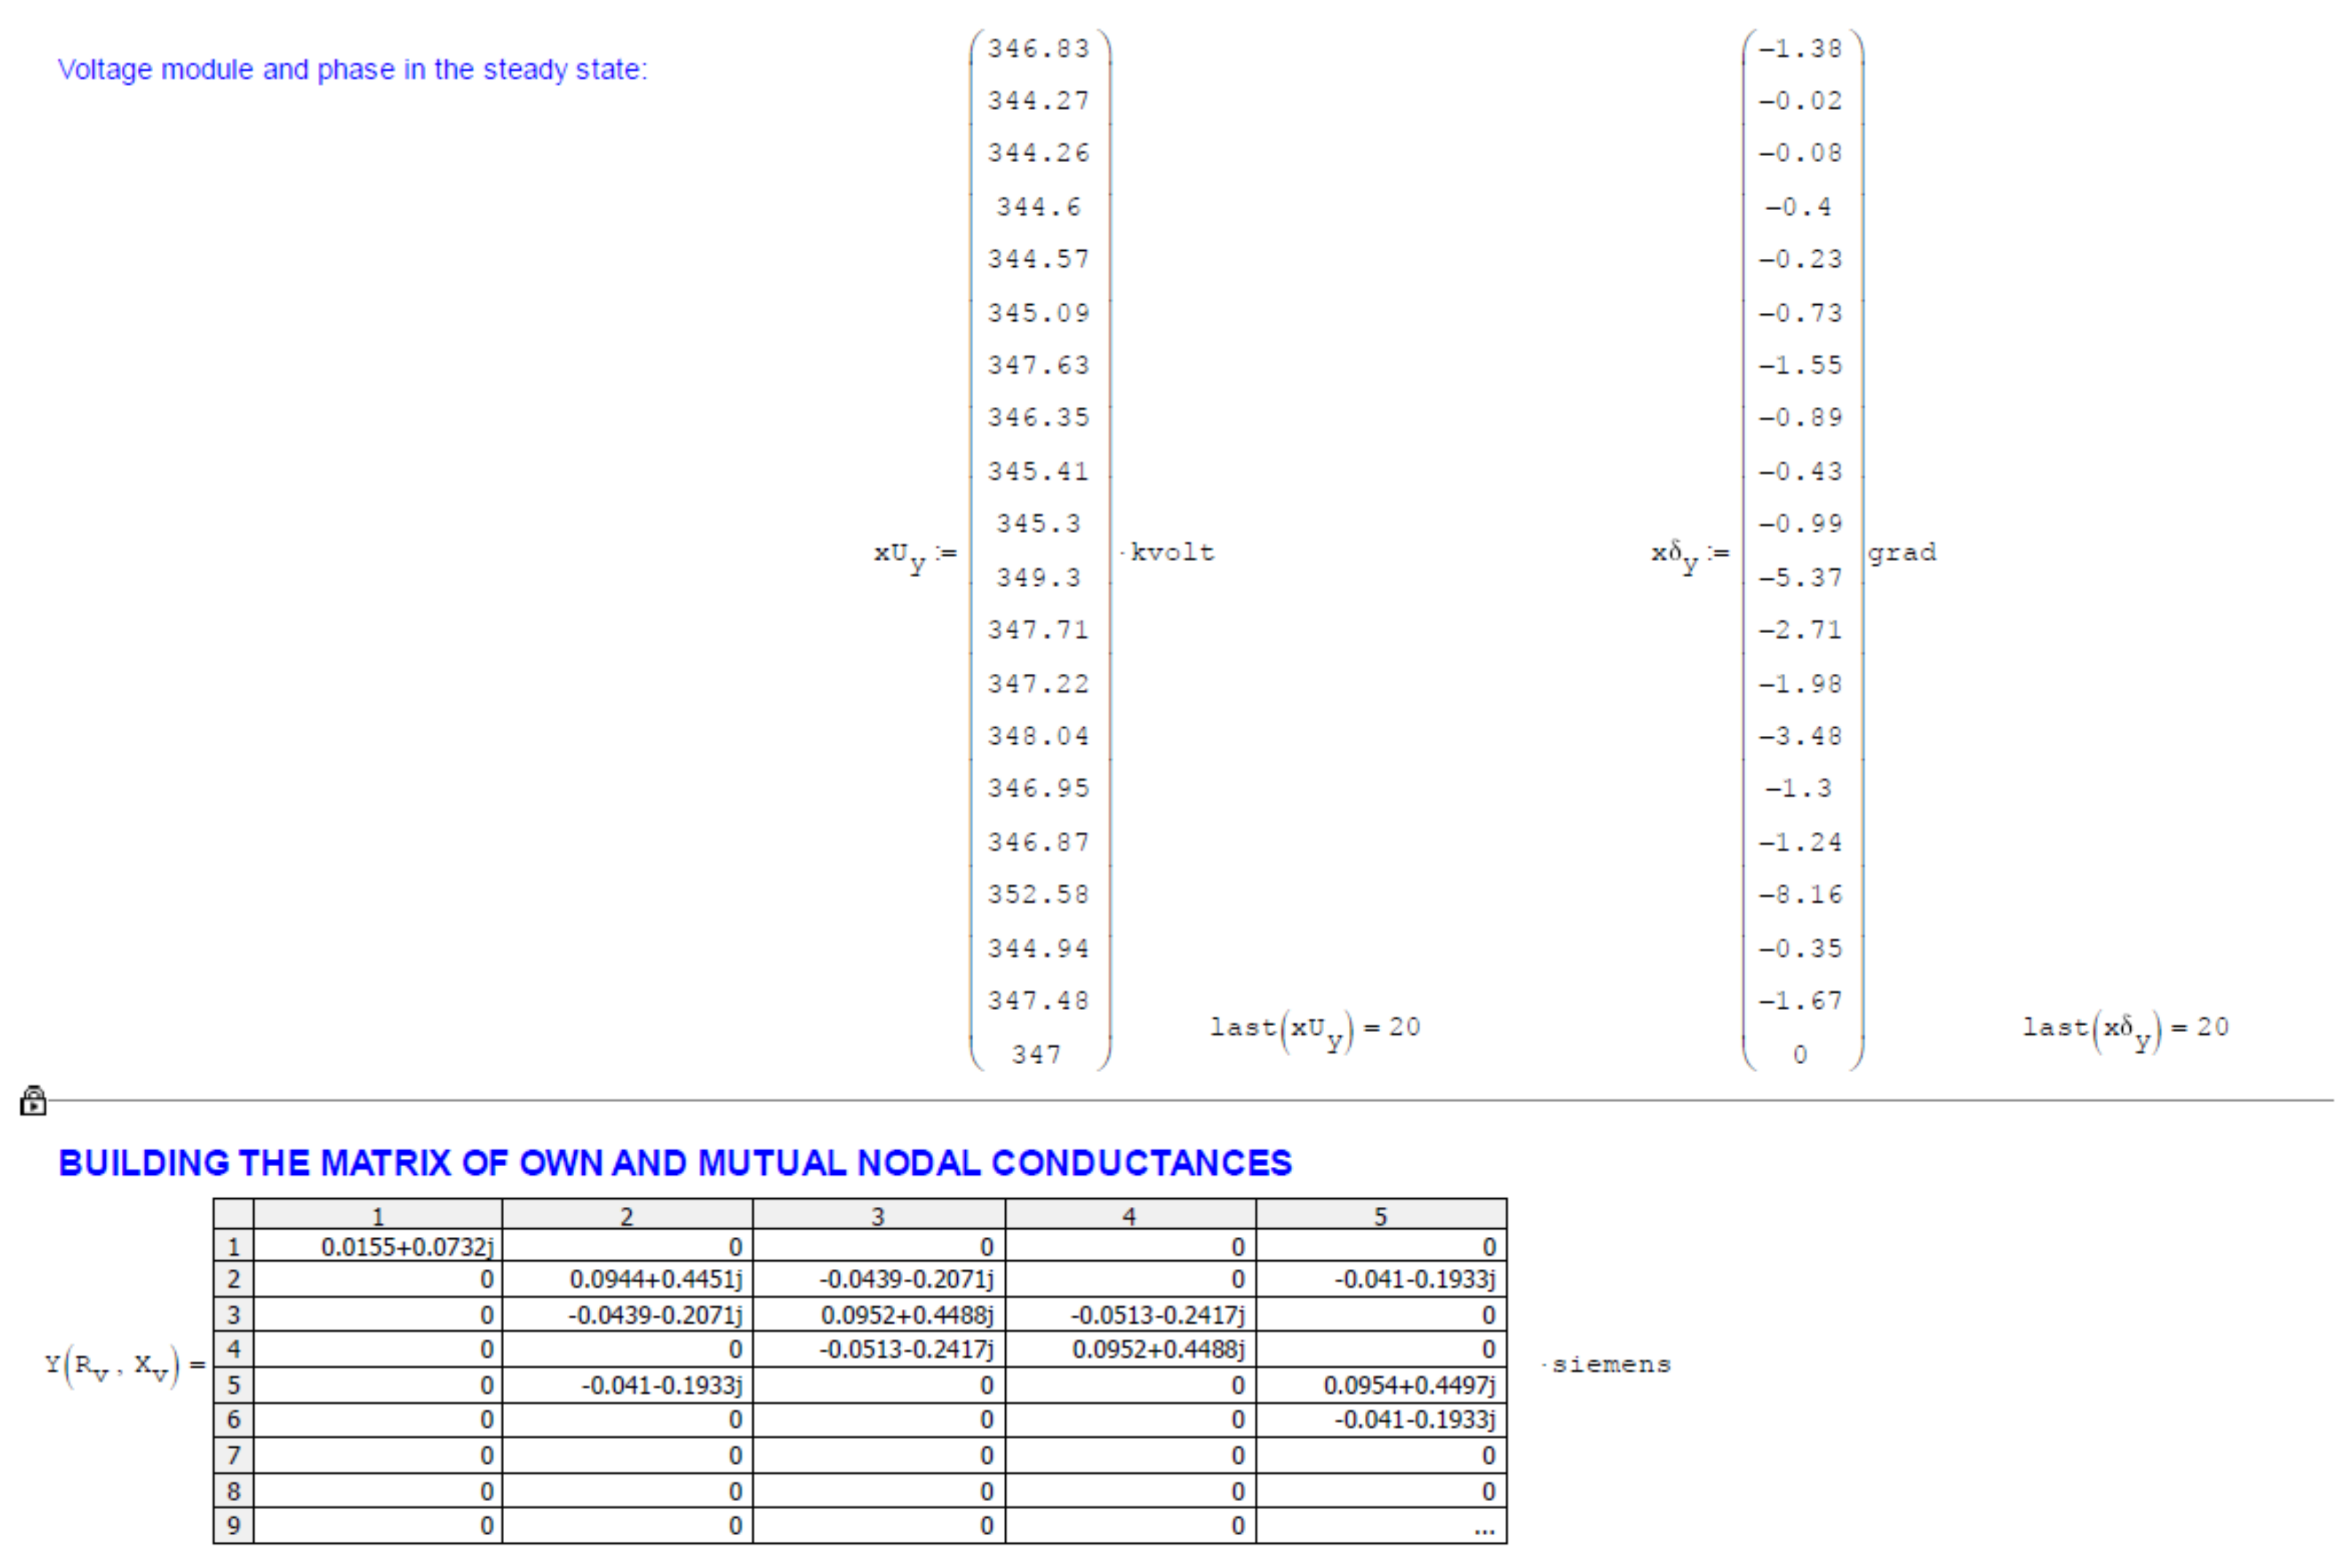
- Build the matrix of own and mutual node conductance;
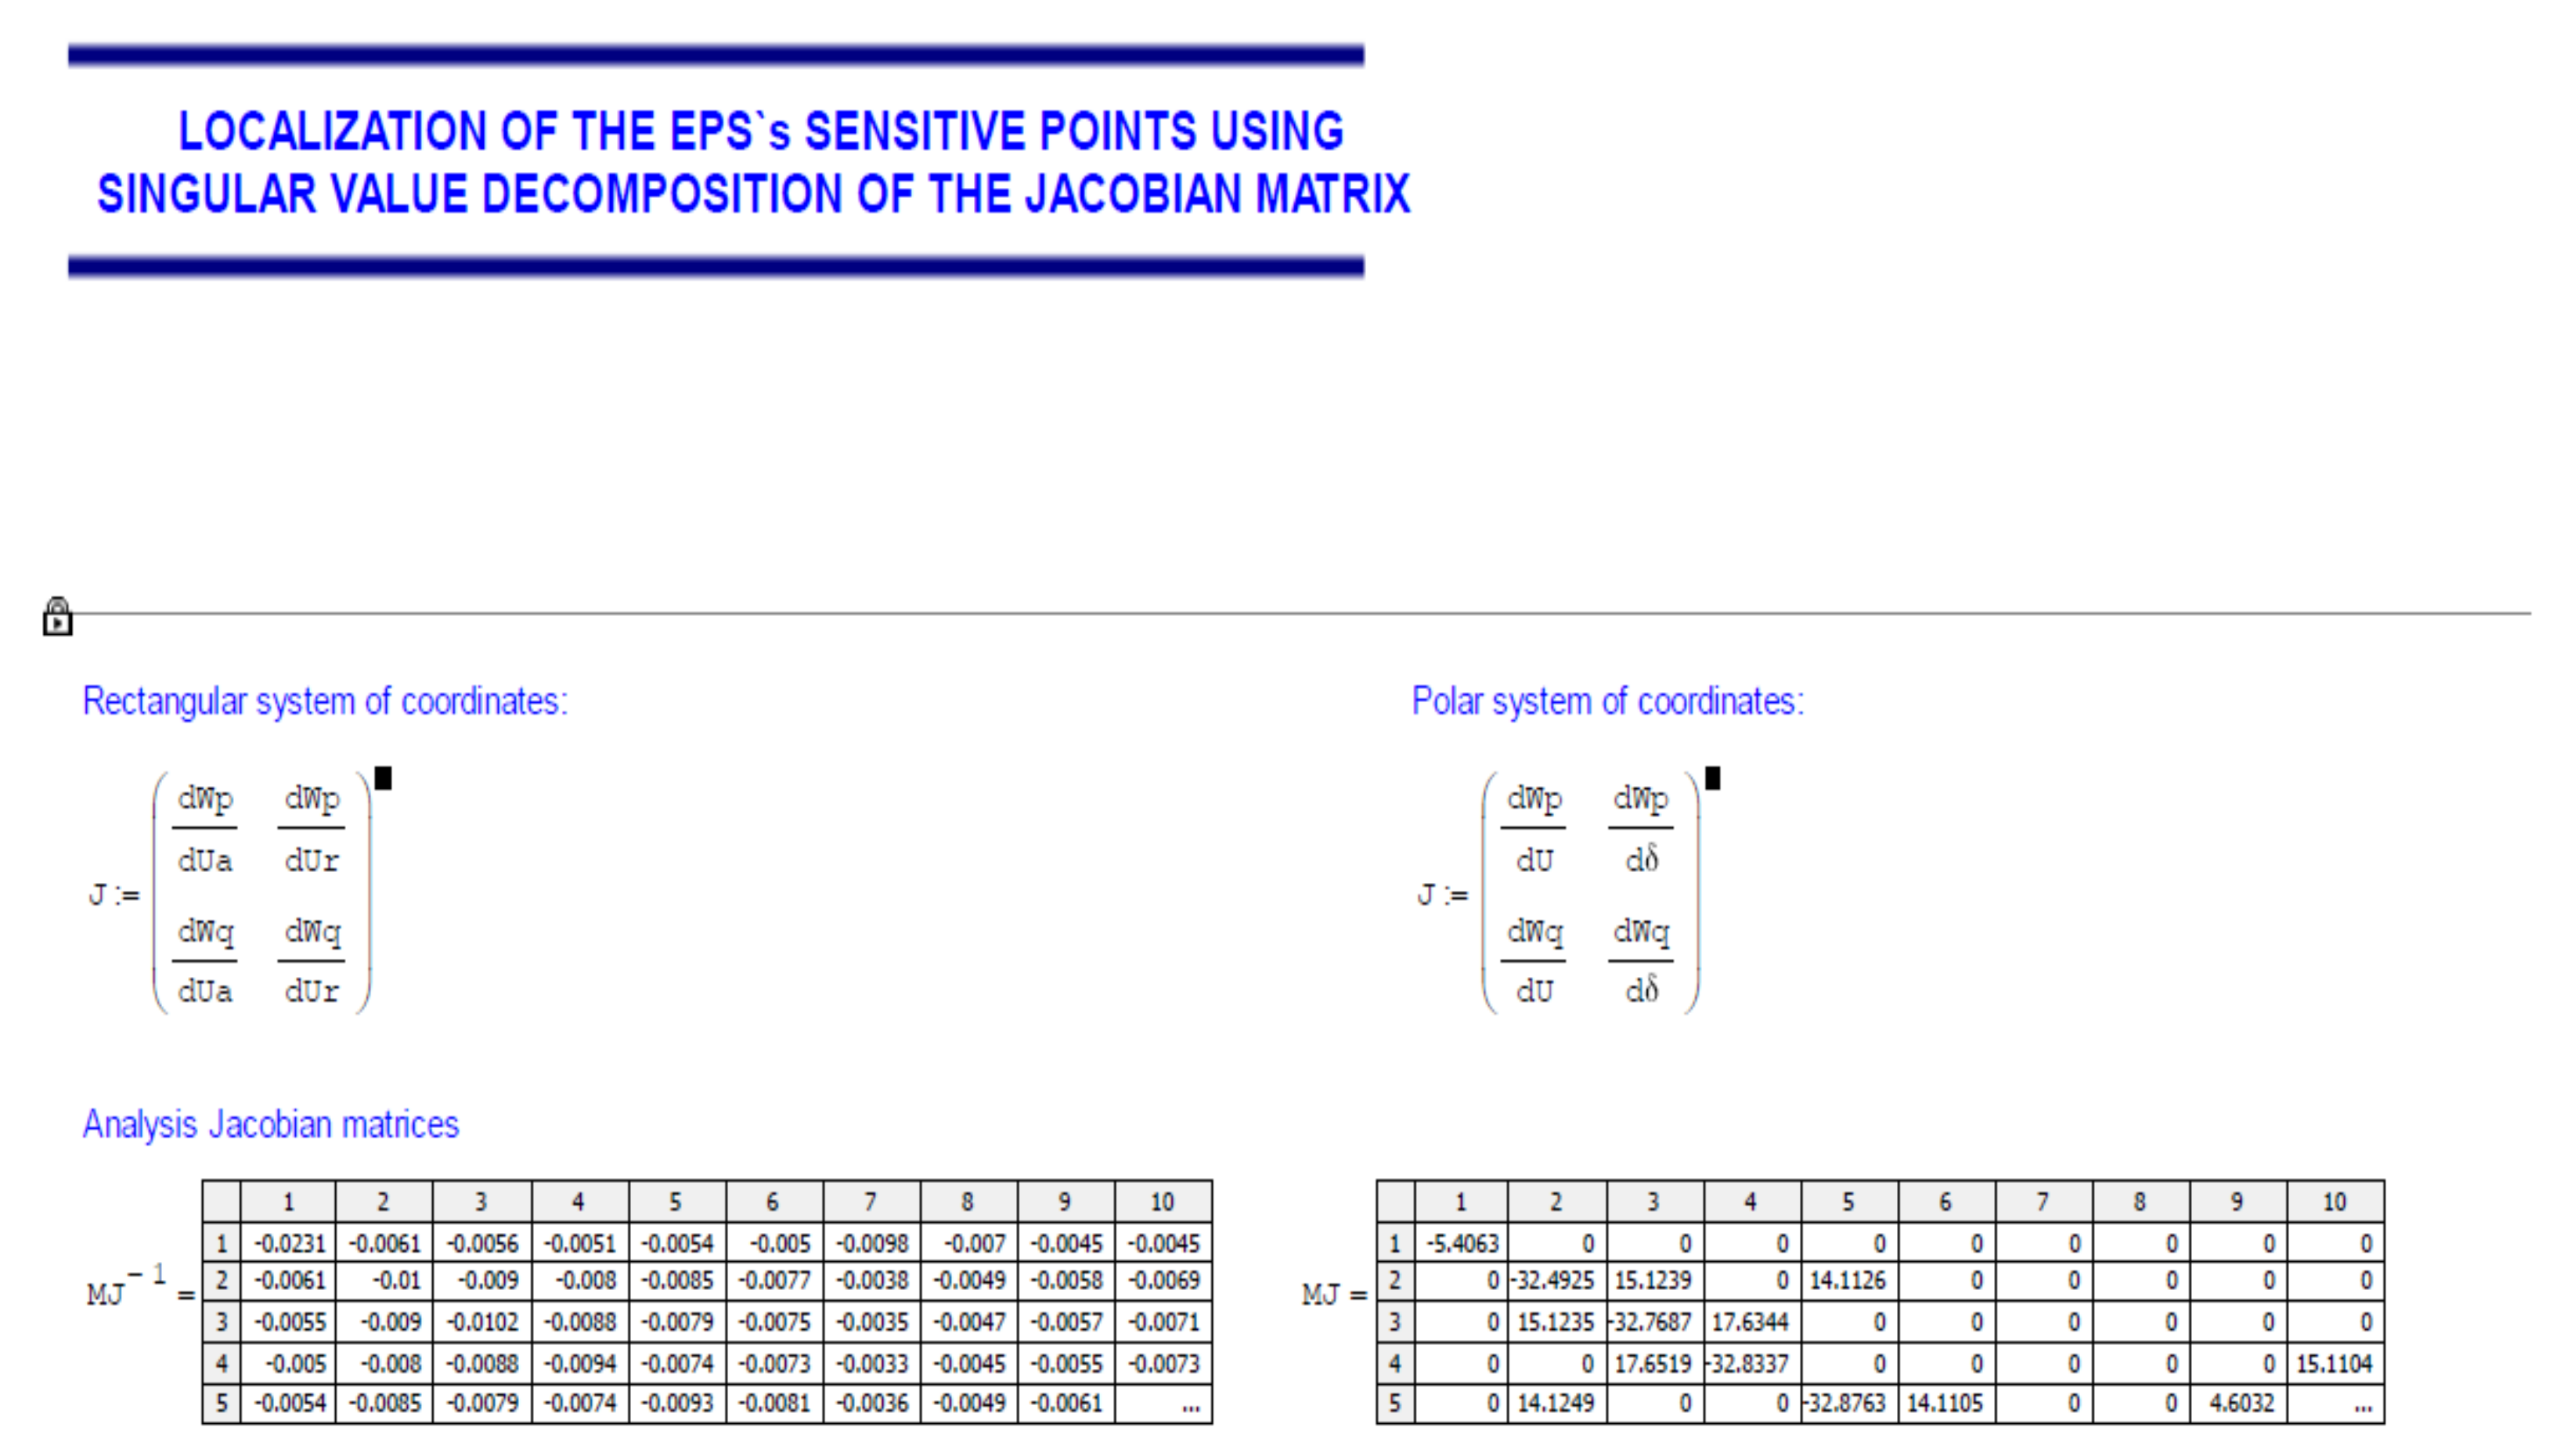
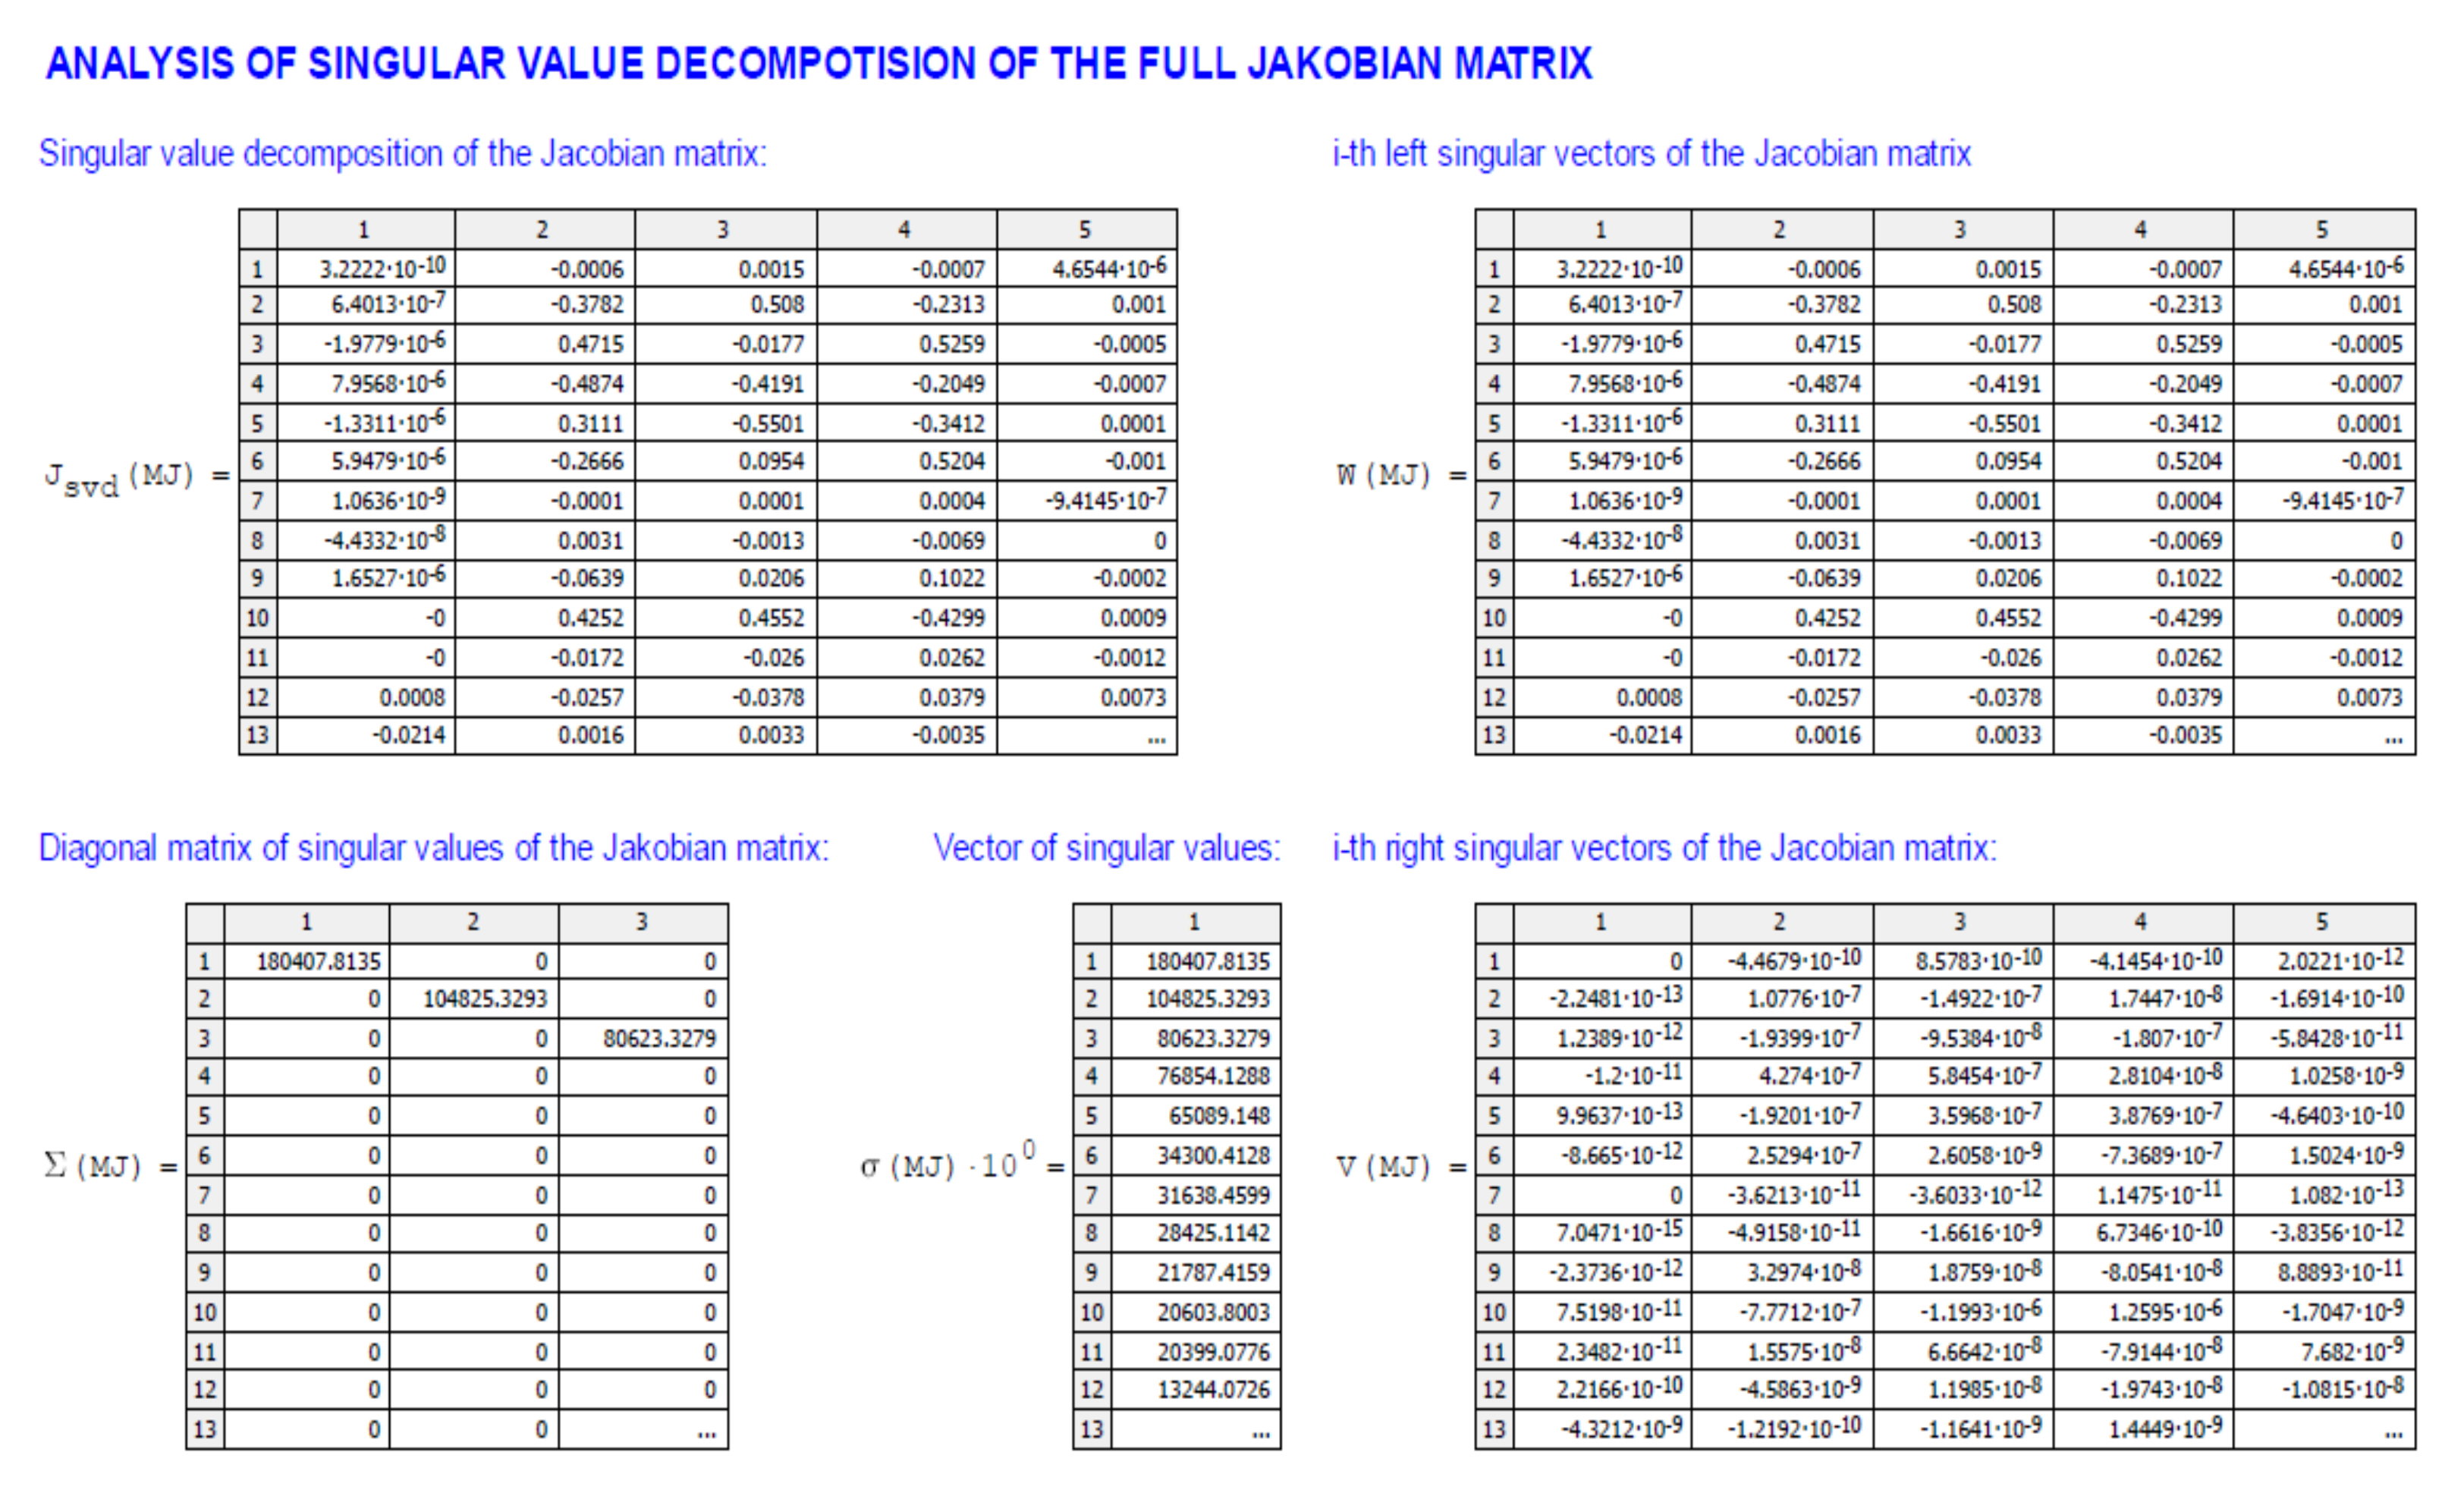
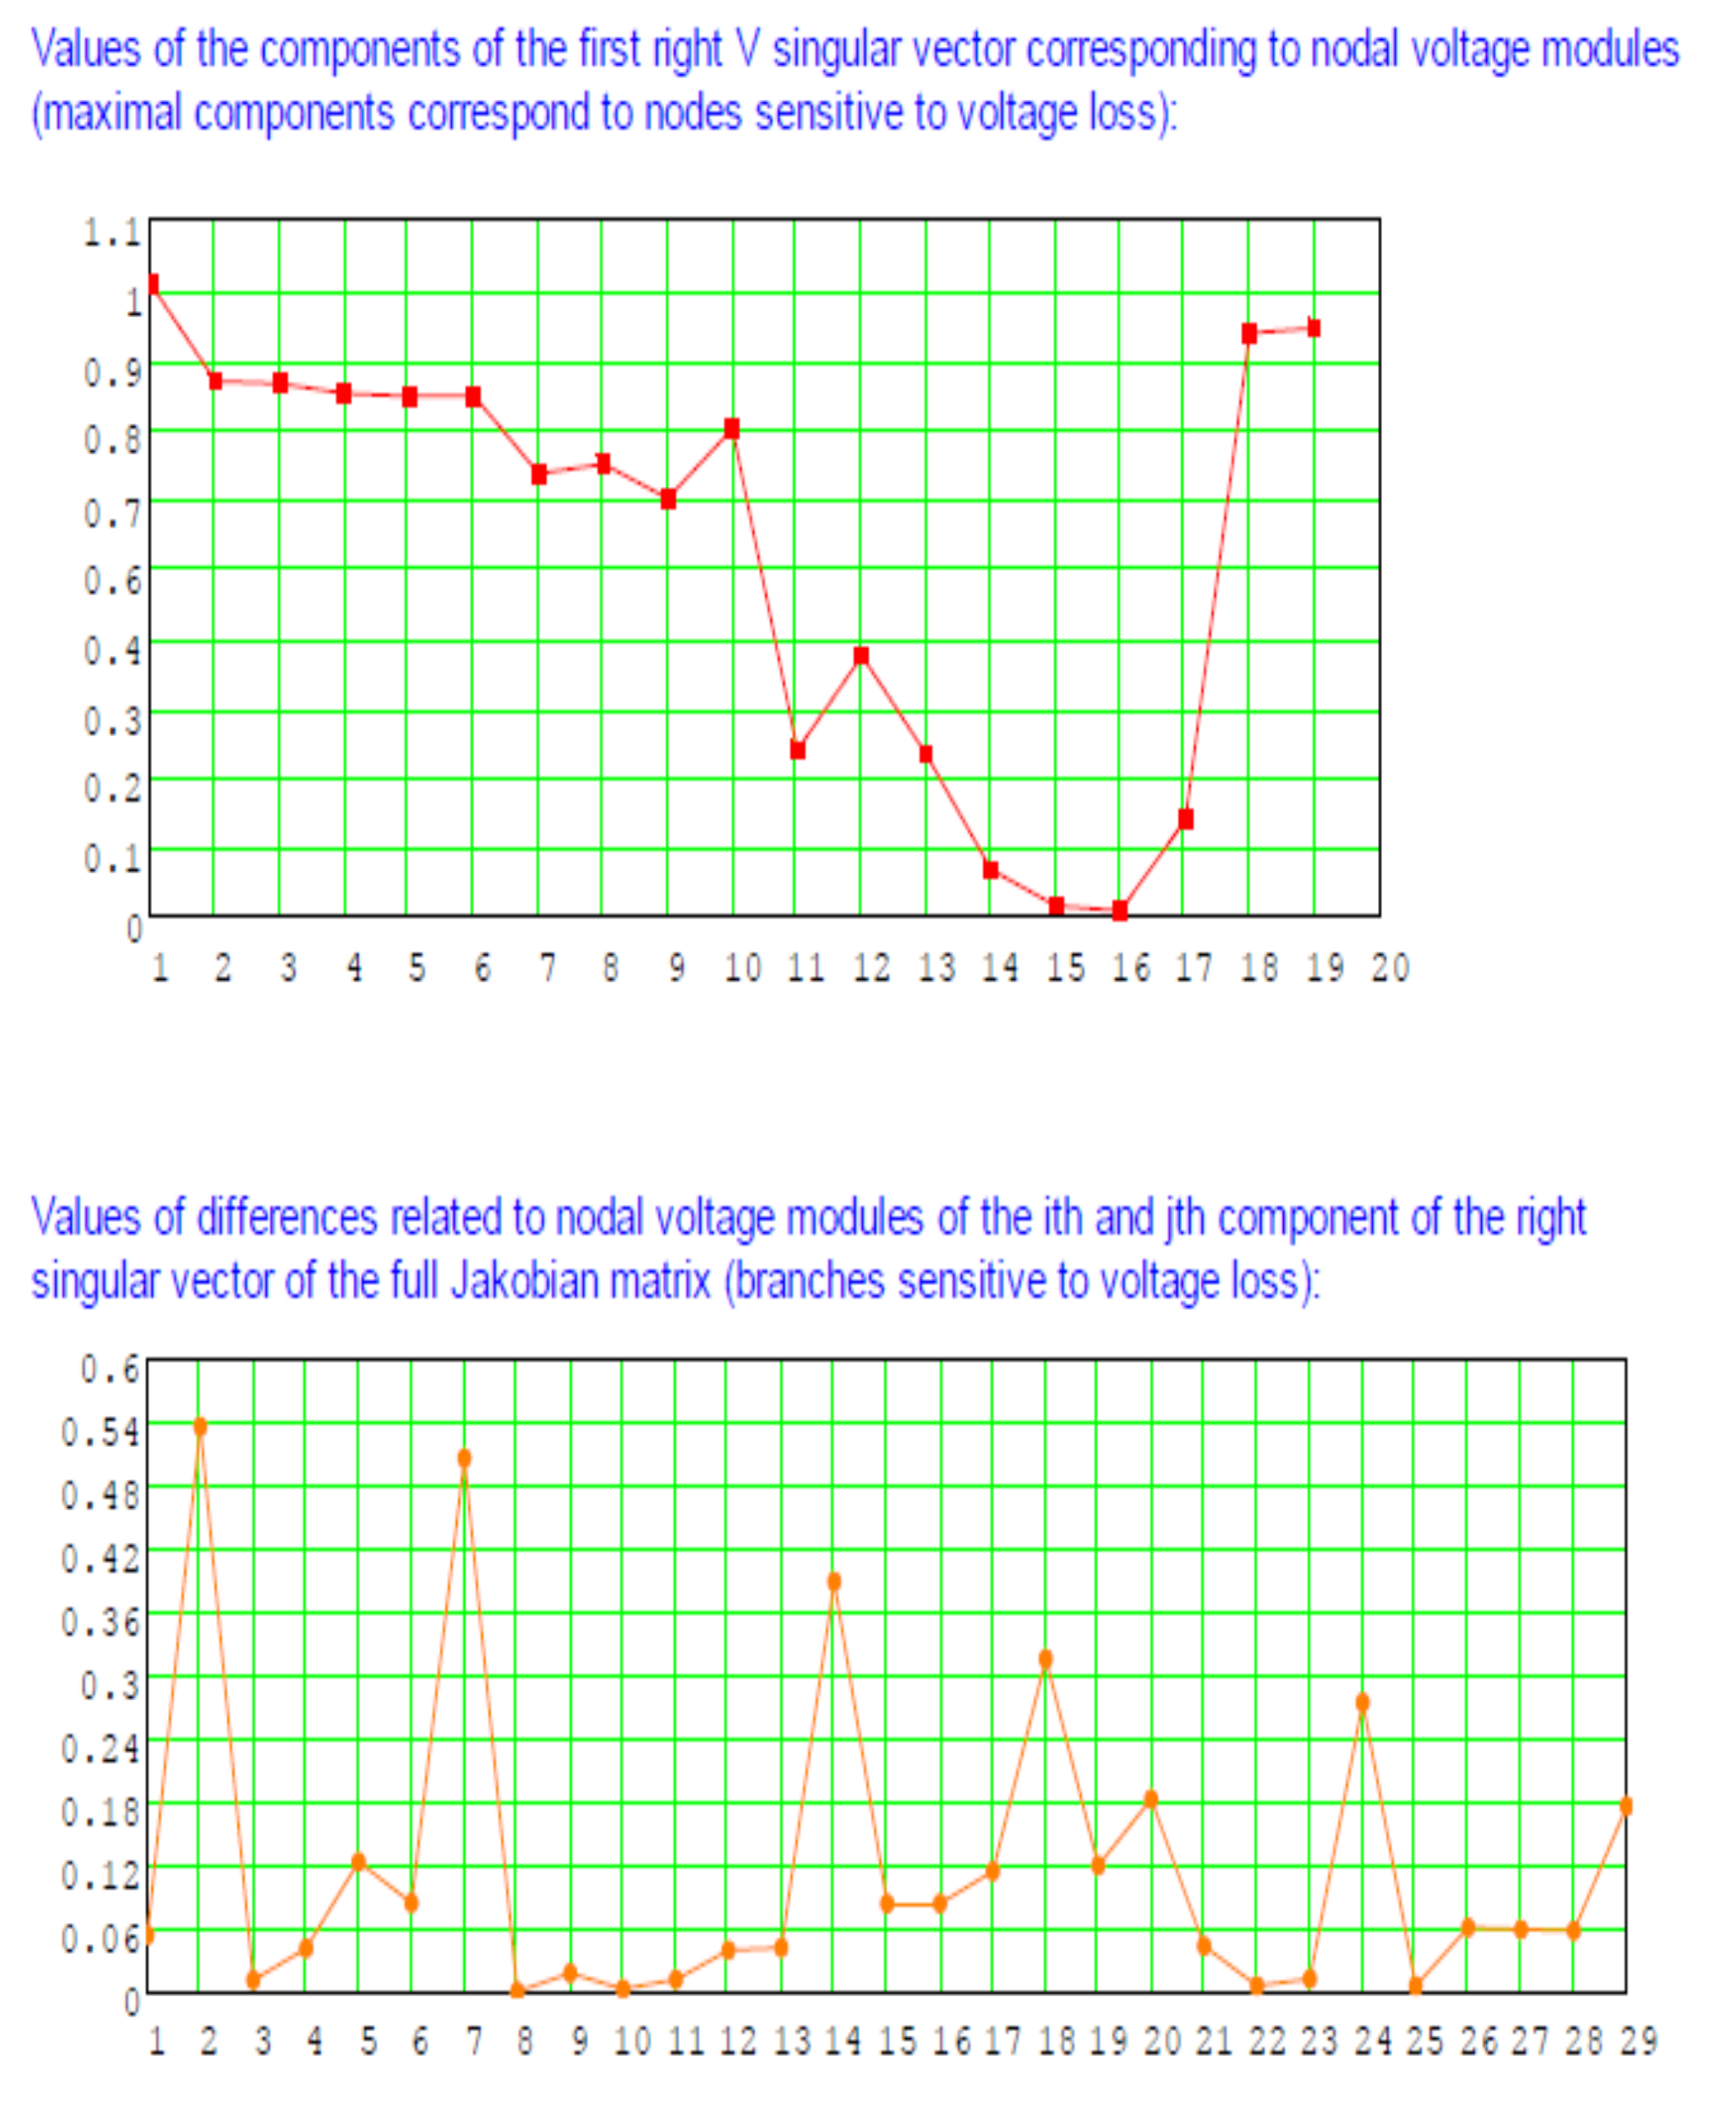
- Localize the EPS’ sensitive points using singular decomposition of the Jacobian matrix and obtain results;
- Localize the EPS’ sensitive points using singular decomposition of the node admittance matrix and obtain results;
- Analyze the obtained results and evaluate the EPS’ stability.


References
- Sadik-Zada, E.R.; Löwenstein, W.; Ferrari, M. Privatization and the role of sub-national governments in the Latin American power sector: A plea for less subsidiarity? Int. J. Energy Econ. Policy 2018, 8, 95–103. [Google Scholar]
- Mete, G.M.; Pei-Ru, J.G. The Role of the Energy Charter Process in Accelerating the Energy Transition and Ensuring Energy Security in South East Europe in Line with the Energy Union. In Aspects of the Energy Union; Energy, Climate and the Environment; Mathioulakis, M., Ed.; Springer: Cham, Switzerland, 2021; pp. 159–183. [Google Scholar] [CrossRef]
- Key cross border infrastructure projects. Available online: https://ec.europa.eu/energy/topics/infrastructure/projects-common-interest/key-cross-border-infrastructure-projects_en#the-pci-list (accessed on 24 May 2021).
- Nord Stream 2. Available online: https://www.nord-stream2.com/construction/overview/ (accessed on 24 May 2021).
- Sadik-Zada, E.R.; Gatto, A. Energy Security Pathways in South East Europe: Diversification of the Natural Gas Supplies, Energy Transition, and Energy Futures. In From Economic to Energy Transition; Energy, Climate and the Environment; Mišík, M., Oravcová, V., Eds.; Springer: Cham, Switzerland, 2021; pp. 491–514. [Google Scholar] [CrossRef]
- European Commission. Questions and answers on the synchronisation of the Baltic States’ electricity networks with the continental European network (CEN). Available online: https://ec.europa.eu/commission/presscorner/detail/de/MEMO_18_4285 (accessed on 12 March 2021).
- ENTSO-E. Available online: https://www.entsoe.eu/news-events/former-associations/ (accessed on 12 March 2021).
- European Commission. Energy efficiency targets. Available online: https://ec.europa.eu/energy/topics/energy-efficiency/targets-directive-and-rules/eu-targets-energy-efficiency_en#:~:text=2020%20targets,-In%202007%20the&text=In%20concrete%20terms%2C%20this%20means,turning%20off%20400%20power%20stations (accessed on 12 March 2021).
- Cabinet order No. 129 on the Energy Development Guidelines for 2016–2020. Available online: https://likumi.lv/ta/en/en/id/280236-on-the-energy-development-guidelines-for-2016-2020 (accessed on 12 March 2021).
- Voropai, N.I.; Efimov, D.N.; Reshetov, V.I. Analysis of system failures of mechanisms in EPS. Electricity 2008, 10, 12–24. [Google Scholar]
- Sobolevskis, A.; Zicmane, I.; Murach, V. Vulnerability assessment of electric power system for the case of Latvian EPS. In Proceedings of the 56th International Scientific Conference on Power and Electrical Engineering of Riga Technical University, Riga, Latvia, 14 October 2015. [Google Scholar]
- Arroyo, J.M.; Fernández, F.J.; Arroyo, J.M.; Fernández, F.J. A Genetic Algorithm for Power System Vulnerability Analysis under Multiple Contingencies. In Metaheuristics for Bi-Level Optimization; Studies in Computational Intelligence; Talbi, E.G., Ed.; Springer: Berlin/Heidelberg, Germany, 2013; Volume 482, pp. 41–68. [Google Scholar] [CrossRef]
- Kamwa, I.; Pradhan, A.K.; Joos, G. Automatic Segmentation of Large Power Systems Into Fuzzy Coherent Areas for Dynamic Vulnerability Assessment. IEEE Trans. Power Syst. 2007, 22, 1974–1985. [Google Scholar] [CrossRef]
- Yu, X.; Singh, C. A practical approach for integrated power system vulnerability analysis with protection failures. IEEE Trans. Power Syst. 2004, 19, 1811–1820. [Google Scholar] [CrossRef]
- Papkov, B.; Gerhards, J.; Mahņitko, A. System Problems of Power Supply Reliability Analysis Formalisation. In Proceedings of the IEEE 5th International Conference on Power Engineering, Energy and Electrical Drives (POWERENG), Riga, Latvia, 11–13 May 2015; pp. 225–228. [Google Scholar] [CrossRef]
- Wang, A.; Luo, Y.; Tu, G.; Liu, P. Vulnerability Assessment Scheme for Power System Transmission Networks Based on the Fault Chain Theory. IEEE Trans. Power Syst. 2011, 26, 442–450. [Google Scholar] [CrossRef]
- Yang, S.; Chen, W.; Zhang, X.; Liang, C.; Wang, H.; Cui, W. A Graph-Based Model for Transmission Network Vulnerability Analysis. IEEE Syst. J. 2020, 14, 1447–1456. [Google Scholar] [CrossRef]
- Ma, Z.; Shen, C.; Liu, F.; Mei, S. Fast Screening of Vulnerable Transmission Lines in Power Grids: A PageRank-Based Approach. IEEE Trans. Smart Grid 2019, 10, 1982–1991. [Google Scholar] [CrossRef]
- Gao, X.; Peng, M.; Tse, C.K.; Zhang, H. A Stochastic Model of Cascading Failure Dynamics in Cyber-Physical Power Systems. IEEE Syst. J. 2020, 14, 4626–4637. [Google Scholar] [CrossRef]
- Yan, J.; Tang, Y.; He, H.; Sun, Y. Cascading Failure Analysis With DC Power Flow Model and Transient Stability Analysis. IEEE Trans. Power Syst. 2015, 30, 285–297. [Google Scholar] [CrossRef]
- Li, X.; Qi, Z. A Power Grid Cascading Failure Model Considering the Line Vulnerability Index. In Proceedings of the ELM2019, Proceedings in Adaptation, Learning and Optimization, ELM 2019, Yangzhou, China, 14–16 December 2019. [Google Scholar] [CrossRef]
- Wasley, R.G.; Danesdoost, M. Identification and ranking of critical contingencies in dependent variable scale. IEEE Trans. Power Appar. Syst. 1983, 102, 881–892. [Google Scholar] [CrossRef]
- Beyza, J.; Garcia-Paricio, E.; Ruiz, H.F.; Yusta, J.M. Geodesic Vulnerability Approach for Identification of Critical Buses in Power Systems. J. Modern Power Syst. Clean Energy 2021, 9, 37–45. [Google Scholar] [CrossRef]
- Zang, T.; Lei, J.; Wei, X.; Huang, T.; Wang, T.; Pérez-Jiménez, M.J.; Lin, H. Adjacent Graph Based Vulnerability Assessment for Electrical Networks Considering Fault Adjacent Relationships Among Branches. IEEE Access 2019, 7, 88927–88936. [Google Scholar] [CrossRef]
- National Energy and Climate Plan of Latvia 2021–2030, draft version. Available online: https://ec.europa.eu/energy/sites/ener/files/documents/ec_courtesy_translation_lv_necp.pdf (accessed on 12 March 2021).
- Fulli, G. Electricity security: Models and methods for supporting the policy decision making in the European Union. Ph.D. Thesis, Politecnico di Torino, Torino, Italy, April 2016. [Google Scholar] [CrossRef]
- Energy vision for Latvia. Available online: http://www.inforse.org/europe/VisionLA.htm (accessed on 12 March 2021).
- Litgrid; AST; Elering. Review of RES perspective in Baltic countries till 2030. 2015. Available online: https://ast.lv/sites/default/files/editor/Review%20of%20RES%20perspective%20in%20Baltic%20countries%20till%202030_1.pdf (accessed on 12 March 2021).
- Latvian Electricity Market Overview. Available online: https://ast.lv/en/electricity-market-review?year=2020&month=13 (accessed on 16 March 2021).
- Elering Live. Production and Consumption. Available online: https://dashboard.elering.ee/en/system/with-plan/production-consumption?interval=minute&period=years&start=2019-12-31T22:00:00.000Z&end=2020-12-31T21:59:59.999Z&show=table (accessed on 16 March 2021).
- CEIC. Available online: https://www.ceicdata.com/en/indicator/lithuania/electricity-production (accessed on 16 March 2021).
- LitGrid. Available online: https://www.litgrid.eu/index.php/news-events-/news/litgrid-results-for-2020-increased-revenue-and-system-reliability-indicators/31409 (accessed on 16 March 2021).
- Energy statistics—Supply, transformation and consumption provided by European Environment Agency (EEA). Available online: https://www.eea.europa.eu/data-and-maps/data/external/supply-transformation-consumption-electricity-annual-data (accessed on 12 March 2021).
- Idelchik, V.K. On the question of errors’ influence in the initial data on the computation result of the power system stationary mode. Energy Transp. 1968, 2, 9–15. [Google Scholar]
- Synchronization with continental Europe by Elering. Available online: https://elering.ee/en/synchronization-continental-europe (accessed on 12 March 2021).
- Zicmane, I. Electromechanical Transition Processes in Electric Systems; RTU Publishing: Riga, Latvia, 2012; p. 402. [Google Scholar]
- Papkovs, B.; Zicmane, I. Electromagnetic Transition Processes in Electric Systems; RTU Publishing: Riga, Latvia, 2007; p. 306. [Google Scholar]
- Sobolevskis, A. Detection of the Most Vulnerable Network Elements in Power Systems. PhD Thesis, Riga Technical University, Riga, Latvia, 2020. [Google Scholar]
- Gamm, A.Z.; Golub, I.I. Sensors and Weaknesses in the Electric Power Systems; Science: Irkutsk, Russia, 1996; p. 99. [Google Scholar]
- Abramenkova, I.A.; Voropay, N.I.; Zaslavskaya, T.V. Structural Analysis of Energy Systems; Nauka: Novosibirsk, Russia, 1990; p. 224. [Google Scholar]
- Buchholz, B.M.; Povh, D.; Retzmann, D. Stability analysis for large power system interconnections in Europe. In Proceedings of the IEEE Russia Power Tech, St. Petersburg, Russia, 27–30 June 2005; pp. 1–7. [Google Scholar] [CrossRef]
- Hu, W.; Zheng, L.; Liu, X.; Zhang, P.; Xu, X.; Wang, C. Power grid’s Intelligent Stability Analysis based on big data technology. In Proceedings of the IEEE PES Asia-Pacific Power and Energy Engineering Conference (APPEEC), Xi’an, China, 25–28 October 2016; pp. 623–627. [Google Scholar] [CrossRef]
- Amjadya, N.; Esmailib, M. Improving voltage security assessment and ranking vulnerable buses with consideration of power system limits. Elect. Power Energy Syst. 2003, 25, 705–715. [Google Scholar] [CrossRef]
- Cepeda, J.C.; Colome, D.G. Vulnerability assessment of electric power systems through identification and ranking of vulnerable areas. Int. J. Emerg. Elect. Power Syst. 2012, 13. [Google Scholar] [CrossRef]
- Yang, J.; Jiang, K. The sensitive line identification in resilient power system based on fault chain model. Elect. Power Energy Syst. 2017, 92, 212–220. [Google Scholar] [CrossRef]
- Vital, V. Transient stability test systems for direct stability methods: IEEE Committee report. IEEE Trans. Power Syst. 1992, 7, 37–43. [Google Scholar]
- Grigg, C.; Wong, P.; Albercht, P.; Allan, R.; Bhavaraju, M.; Billinton, R.; Chen, Q.; Fong, C.; Haddad, S.; Kuruganty, S.; et al. The IEEE Reliability Test System—1996. A report prepared by the Reliability Test System Task Force of the Application of Probability Methods Subcommittee. IEEE Trans. Power Syst. 1999, 14, 1010–1020. [Google Scholar] [CrossRef]
- Tarasov, V.I. Newtonian-Type Minimization Methods for Calculating Steady-State Modes of Electric Power Systems; Nauka: Novosibirsk, Russia, 2001; p. 168. [Google Scholar]
- Pai, M.A. Energy Function Analysis for Power System Stability; Springer: Berlin/Heidelberg, Germany, 1989; pp. 223–228. [Google Scholar]
- Nepomnyaschiy, V.; Gerhards, J.; Mahņitko, A.; Lomane, T. Reliability of Latvian Power System’s 330 kV Substations. Latvian J. Phys. Tech. Sci. 2014, 51, 15–23. [Google Scholar] [CrossRef] [Green Version]
- Akdeniz, E.; Bagriyanik, M. A knowledge based decision support algorithm for power transmission system vulnerability impact reduction. Elect. Power Energy Syst. 2016, 78, 436–444. [Google Scholar] [CrossRef]
- Sobolevskis, A.; Zicmane, I. Analysis of vulnerability of the Latvian electrical power system. In Proceedings of the 16th IEEE International Conference on Environment and Electrical Engineering, Florence, Italy, 7–10 June 2016; pp. 2464–2468. [Google Scholar]
- Sobolevskis, A.; Zicmane, I. Assessing the Impact of Registering of Weak Points Calculating the Power System Operating Modes. In Proceedings of the 57th International Scientific Conference on Power and Electrical Engineering of Riga Technical University, Riga, Latvia, 13–14 October 2016. [Google Scholar]
- Sobolevskis, A.; Zicmane, I. Prediction of Latvian Electrical Power System For Reliability Evaluation Including Wind Energy. In Proceedings of the 17th IEEE International Conference on Environment and Electrical Engineering, Milan, Italy, 6–9 June 2017. [Google Scholar]
- Kovalenko, S. Power System Static Stability Assessment Methods, Criteria, and Algorithms. Ph.D. Thesis, Riga Technical University, Riga, Latvia, 2014. [Google Scholar]
- Zicmane, I.; Berzina, K.; Sobolevskis, A.; Kovalenko, S. Wind Power Plant Influence on the Latvian EPS Stability. In Proceedings of the 10th International Conference on Sustainable Energy & Environmental Protection (SEEP 2017), Bled, Slovenia, 27–30 June 2017; pp. 1–6. [Google Scholar]
- Zicmane, I.; Berzina, K.; Sobolevskis, A.; Kovalenko, S. Latvian Electrical Power System Stability’s Analysis Taking into Account New Development Strategy until 2025. In Proceedings of the 11th International Conference on Electromechanical and Power Systems (SIELMEN 2017), Chisinau, Moldova, 12–13 October 2017; pp. 1–6. [Google Scholar]
- ETAP—A Unified Digital Twin Platform. Available online: https://etap.com/software/etap-digital-twin?gclid=EAIaIQobChMIhs67n8_97gIVhIBQBh1OFwlBEAAYASAAEgIo_fD_BwE (accessed on 12 March 2021).
- REGUS. Available online: https://www.regus.com/en-us (accessed on 12 March 2021).
- Mathcad Software for Your Engineering Calculations. Available online: https://www.mathcad.com/en (accessed on 12 March 2021).


| Power Plant (PP) | Net Generation Capacity, MW | Energy Source |
|---|---|---|
| LITHUANIA | ||
| Fossil fuel PP | 1139 | |
| Lithuania PP | 570 | Natural gas |
| Kaunas combined heat and power plant (CHP) | 102 | Natural gas |
| Vilnius CHP | 160 | Natural gas |
| Panevėžys CHP | 33 | Natural gas |
| Industrial PPs | 274 | Natural gas |
| Kruonis hydroelectric pumped storage power plant (HPSPP) | 1125 | |
| RES | 1205 | |
| Kaunas hydro power plants (HPPs) | 99 | Hydro |
| Small HPPs | 40 | Hydro |
| Wind | 750 | Wind |
| Solar | 80 | Solar |
| Bio | 236 | Including 37 MW waste |
| TOTAL | 3469 | |
| LATVIA | ||
| Fossil fuel PP | 1144 | |
| Riga CHPs | 989 | Natural gas |
| Other CHPs | 155 | Natural gas |
| RES | 2050 | |
| Daugava HPPs | 1589 | Hydro/Run-of-River |
| Small HPPs | 28 | Hydro |
| Wind PPs | 310 | Wind |
| Solar | 3 | Solar |
| Biomass and Biogas PPs | 170 | Bio |
| TOTAL | 3244 | |
| ESTONIA | ||
| Fossil fuel PP | 2185 | Thermal (oil shale, natural gas etc.) |
| RES | 1046 | |
| HPPs | 8 | Hydro |
| Wind PPs, Solar | 925 | Wind, solar, etc. |
| Bio | 95 | Biomass, biogas |
| Bio | 19 | Waste |
| TOTAL | 3232 | |
| Indicator | Electricity in 2019, MWh | Electricity in 2020, MWh | Relative Changes, % |
|---|---|---|---|
| Daugava Hydro | 2,036,063 | 2,514,338 | 23.5 |
| Thermal | 2,822,835 | 1,739,352 | −38.4 |
| Wind | 152,489 | 175,084 | 14.8 |
| Cogeneration (up to 10 MW) | 383,821 | 308,543 | −19.6 |
| Biomass (up to 10 MW) | 399,627 | 391,788 | −2.0 |
| Biogas (up to 10 MW) | 322,780 | 309,070 | −4.2 |
| Small Hydro (up to 10 MW) | 59,829 | 69,671 | 16.4 |
| Solar | 1534 | 2039 | 33.0 |
| Production (Total) | 6,178,978 | 5,509,885 | −10.8 |
| Electricity import to Latvian electricity grid | 4,610,761 | 4,173,365 | −9.5 |
| Export from Latvian electricity grid | 3,492,683 | 2,547,730 | −27.1 |
| Net exchange SALDO | 1,118,078 (deficit) | 1,625,635 (deficit) | 45.4 |
| Latvian electricity consumption | 7,297,056 | 7,135,520 | −2.2 |
| Consumption share covered by local generation | 84.70% | 77.2% | −7.46 |
| Import from 3rd countries to the Baltic States | 7,823,174 | 3,949,672 | −50 |
| Import from EU countries to the Baltic states | 7,913,798 | 11,455,952 | 45 |
| EU Member State | Primary Energy Consumption, Mtoe | Final Energy Consumption, Mtoe |
|---|---|---|
| Austria | 31.5 | 25.1 |
| Belgium | 43.7 | 32.5 |
| Bulgaria | 16.9 | 8.6 |
| Croatia | 10.7 | 7.0 |
| Cyprus | 2.2 | 1.9 |
| Czechia | 44.3 | 25.3 |
| Denmark | 17.5 | 15.2 |
| Estonia | 6.5 | 2.8 |
| Finland | 35.9 | 26.7 |
| France * | 226.4 | 137.9 |
| Germany | 276.6 | 194.3 |
| Greece | 24.7 | 18.4 |
| Hungary | 26.6 | 18.2 |
| Ireland | 13.9 | 11.7 |
| Italy | 158.0 | 124.0 |
| Latvia | 5.4 | 4.5 |
| Lithuania | 6.5 | 4.3 |
| Luxemburg | 4.5 | 4.2 |
| Malta | 0.8 | 0.6 |
| Netherlands | 60.7 | 52.2 |
| Poland | 96.4 | 71.6 |
| Portugal | 22.5 | 17.4 |
| Romania | 43.0 | 30.3 |
| Slovakia | 16.4 | 9.2 |
| Slovenia | 7.1 | 5.1 |
| Spain | 123.4 | 87.2 |
| Sweden | 43.4 | 30.3 |
| United Kingdom | 177.6 | 129.2 |
| Sum of indicative targets EU28 | 1543.1 | 1095.8 |
| EU target 2020 | 1483 | 1086 |
| Node Name | Past Mode—2017 | Current Mode—2020 | Planned Mode—2025 | |||
|---|---|---|---|---|---|---|
| Node No. | Generation, MW | Node No. | Generation, MW | Node No. | Generation, MW | |
| Ventspils (wind farm) | 1′ | 4 | 1′ | 45 | 1′ | 49 |
| CHP-Imanta (Riga) | 2′ | 13 | 2′ | 3 | 2′ | 3 |
| CHP-1 (Riga) | 3′ | 46 | 3′ | 9 | 3′ | 10 |
| CHP-2 (Riga) | 4′ | 270 | 4′ | 55 | 4′ | 61 |
| Bishiciems (Riga) | 5′ | 0 | 5′ | 0 | 5′ | 0 |
| HPP (Riga) | 6′ | 96 | 6′ | 112 | 6′ | 123 |
| Grobina | 7′ | 8 | 7′ | 178 | 7′ | 197 |
| Broceni | 8′ | 0 | 8′ | 0 | 8′ | 0 |
| Viskali | 9′ | 0 | 9′ | 0 | 9′ | 0 |
| Salaspils (Riga) | 10′ | 0 | 10′ | 0 | 10′ | 0 |
| Valmiera | 11′ | 0 | 11′ | 0 | 11′ | 0 |
| Plavinas HPP | 12′ | 192 | 12′ | 223 | 12′ | 246 |
| Krustpils | 13′ | 0 | 13′ | 0 | 13′ | 0 |
| Rezekne | 14′ | 0 | 14′ | 0 | 14′ | 0 |
| Liksna | 15′ | 0 | 15′ | 0 | 15′ | 0 |
| Daugavpils | 16′ | 0 | 16′ | 0 | 16′ | 0 |
| Russian and Estonian EPS | 17′ | 600 | 17′ | 634 | 17′ 1 | 700 |
| Tume | - | - | 18′ | 0 | 18′ | 0 |
| Salacgriva (Aloja) | - | - | 19′ | 0 | 19′ | 0 |
| Wind farm | - | - | 20′ | 45 | 20′ | 49 |
| Lithuanian EPS | 21′ | 0 | 21′ | 0 | 21′ | 0 |
| Applied Method | Past Mode—2017 | Current Mode—2020 | Planned Mode—2025 | |||
|---|---|---|---|---|---|---|
| Node No. | Branch No. | Node No. | Branch No. | Node No. | Branch No. | |
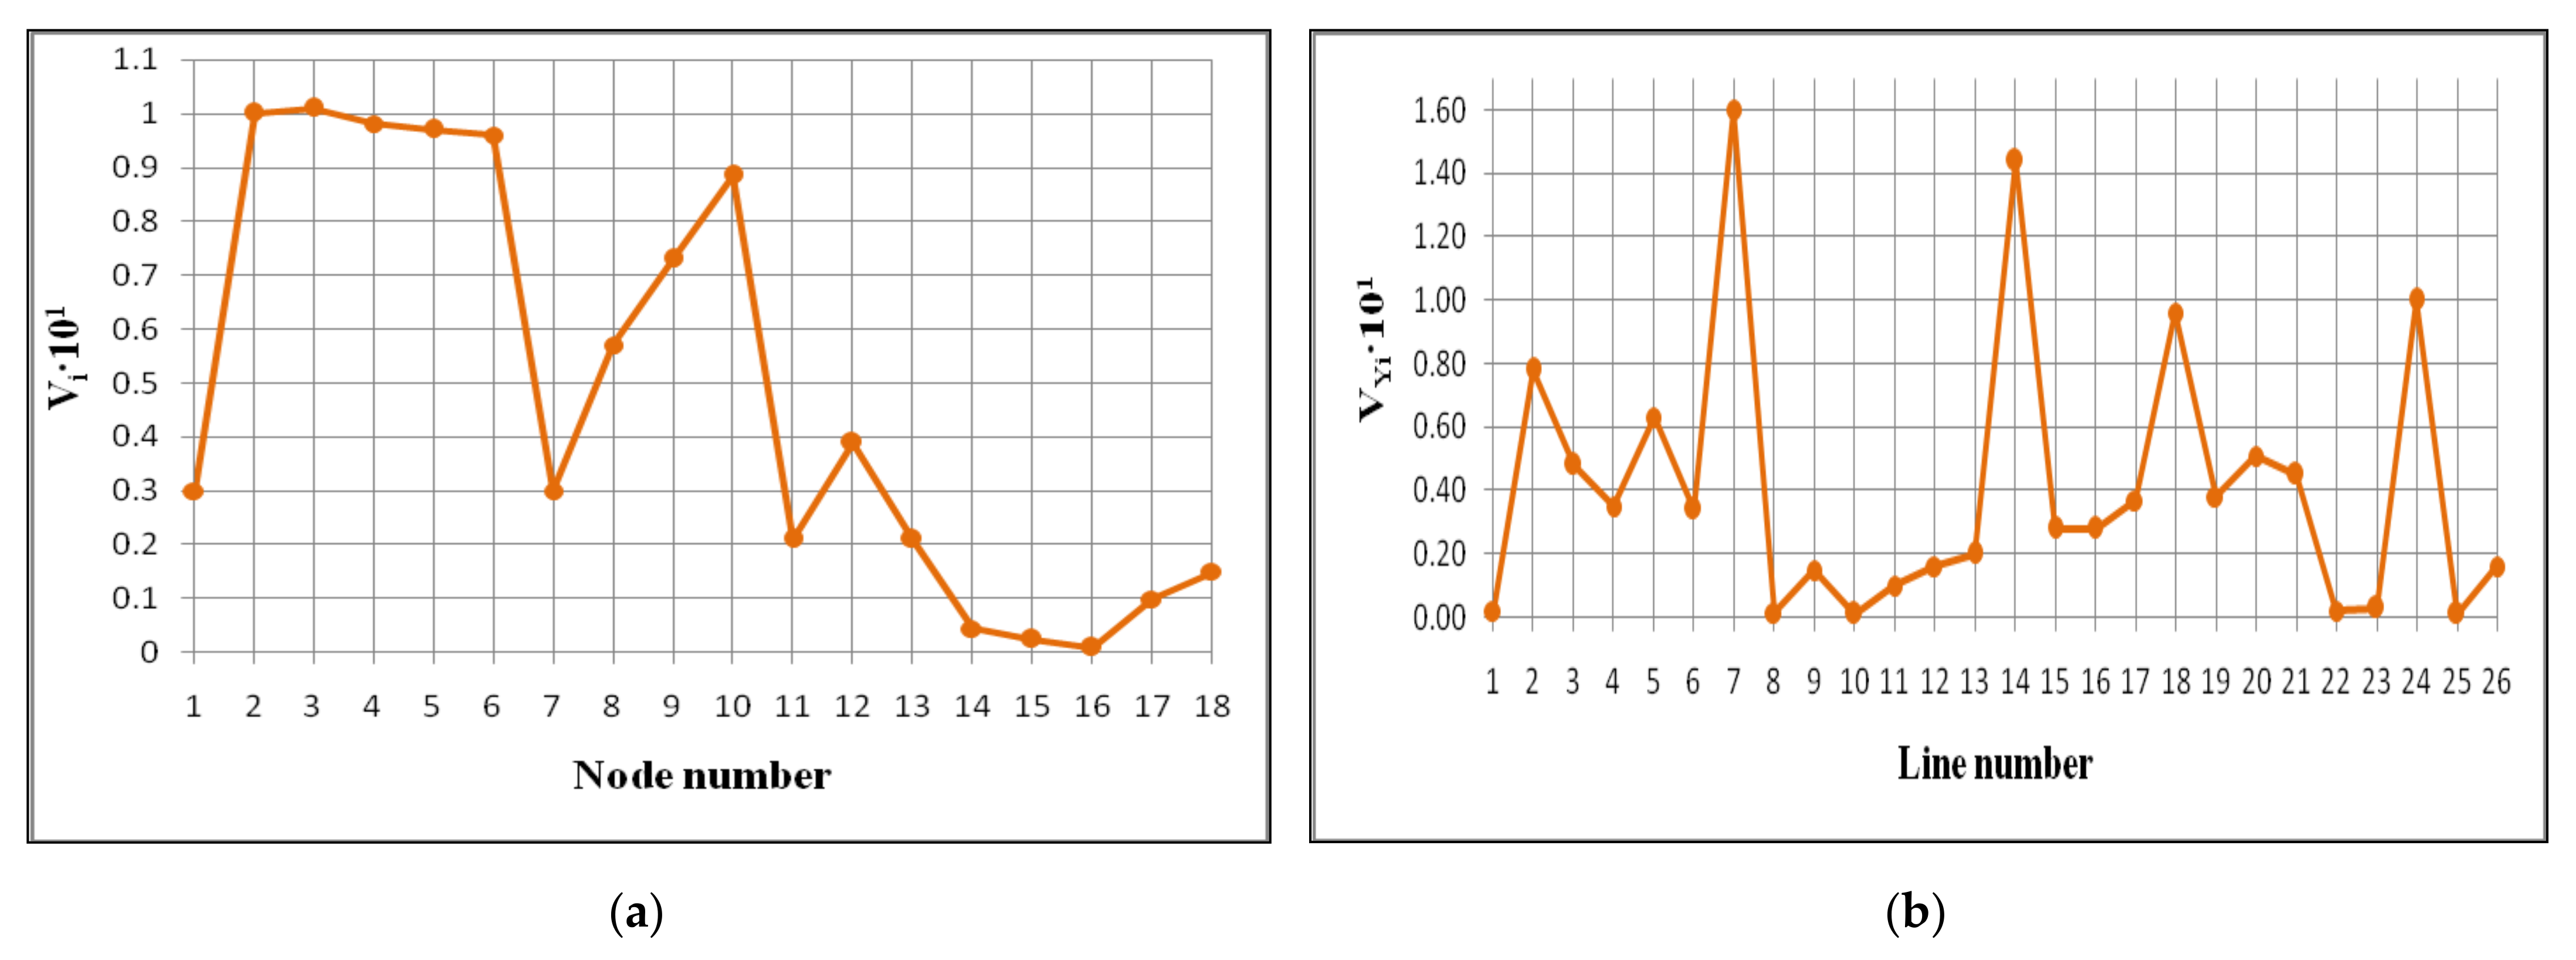
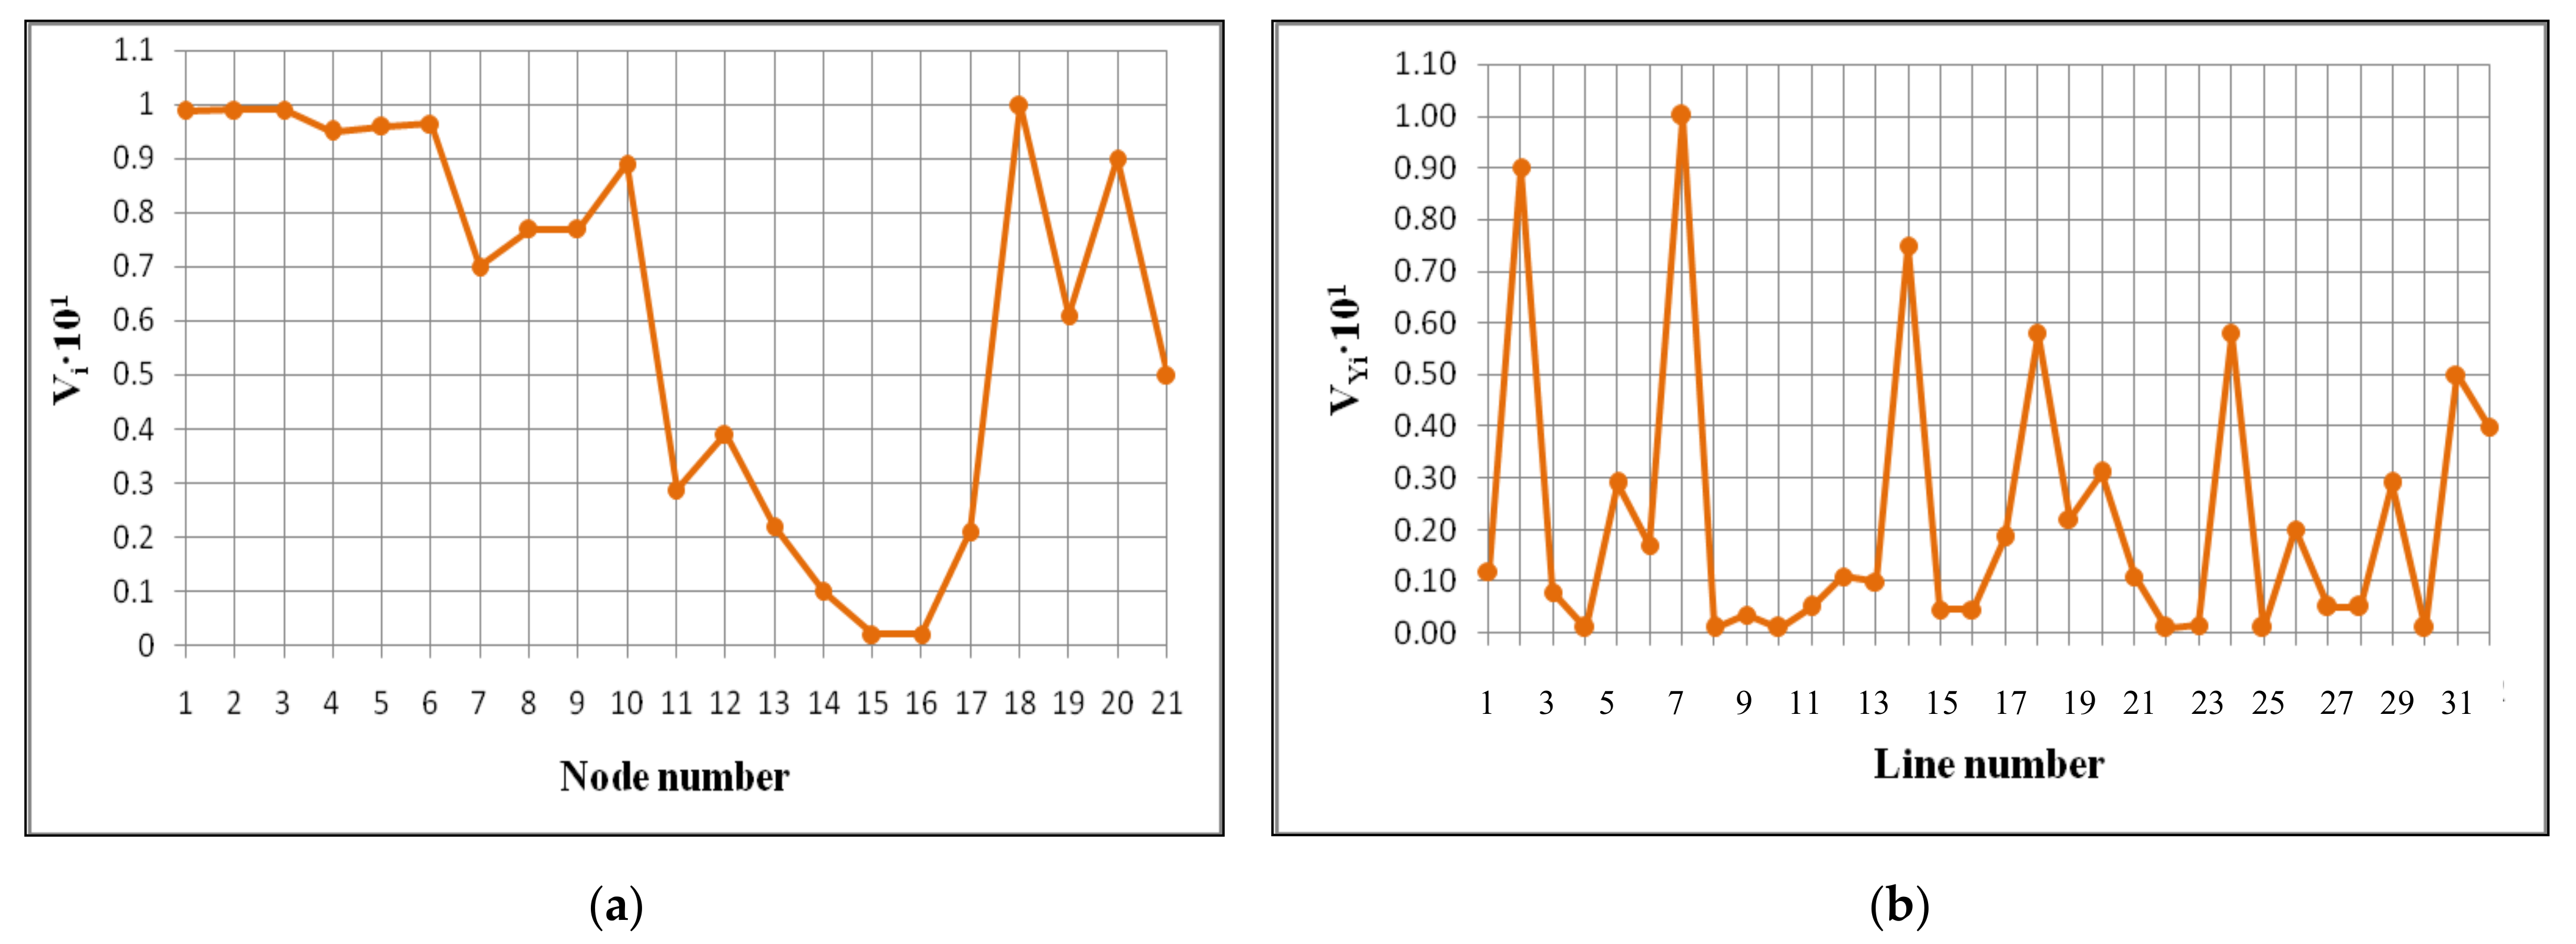
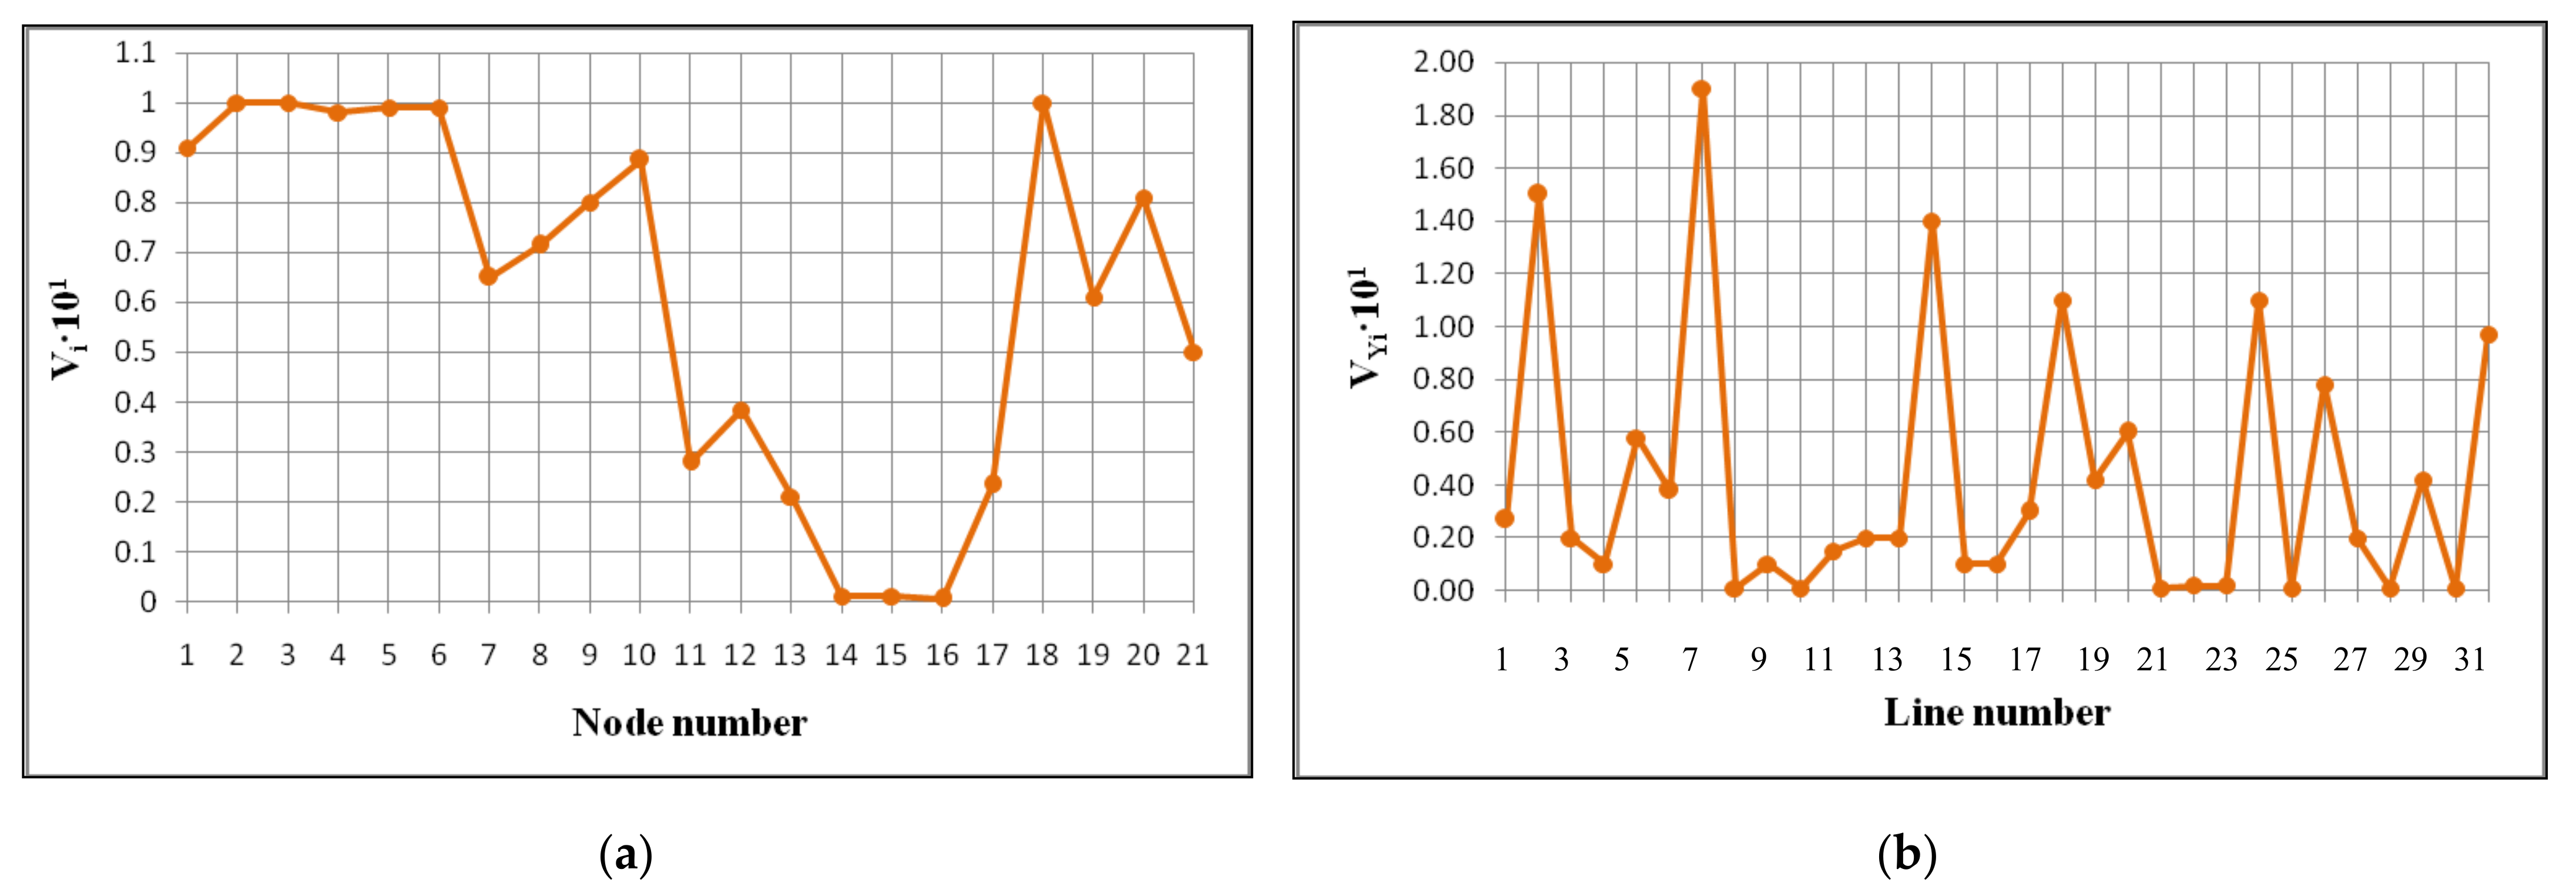
| Singular analysis of the Jacobian matrix | 3′, 4′, 5′, 6′, 9′, 18′ | 2, 4, 6, 10, 12, 18, 23 | 1′, 2′, 4′, 5′, 6′, 10′, 18′, 20′ | 2, 7, 14, 18, 24 | 1′, 2′, 3′, 4′, 5′, 6′, 9′, 10′, 18′ | 2, 7, 14, 18, 24 |
| Note: | Figure 9a | Figure 9b | Figure 11a | Figure 11b | Figure 13a | Figure 13b |
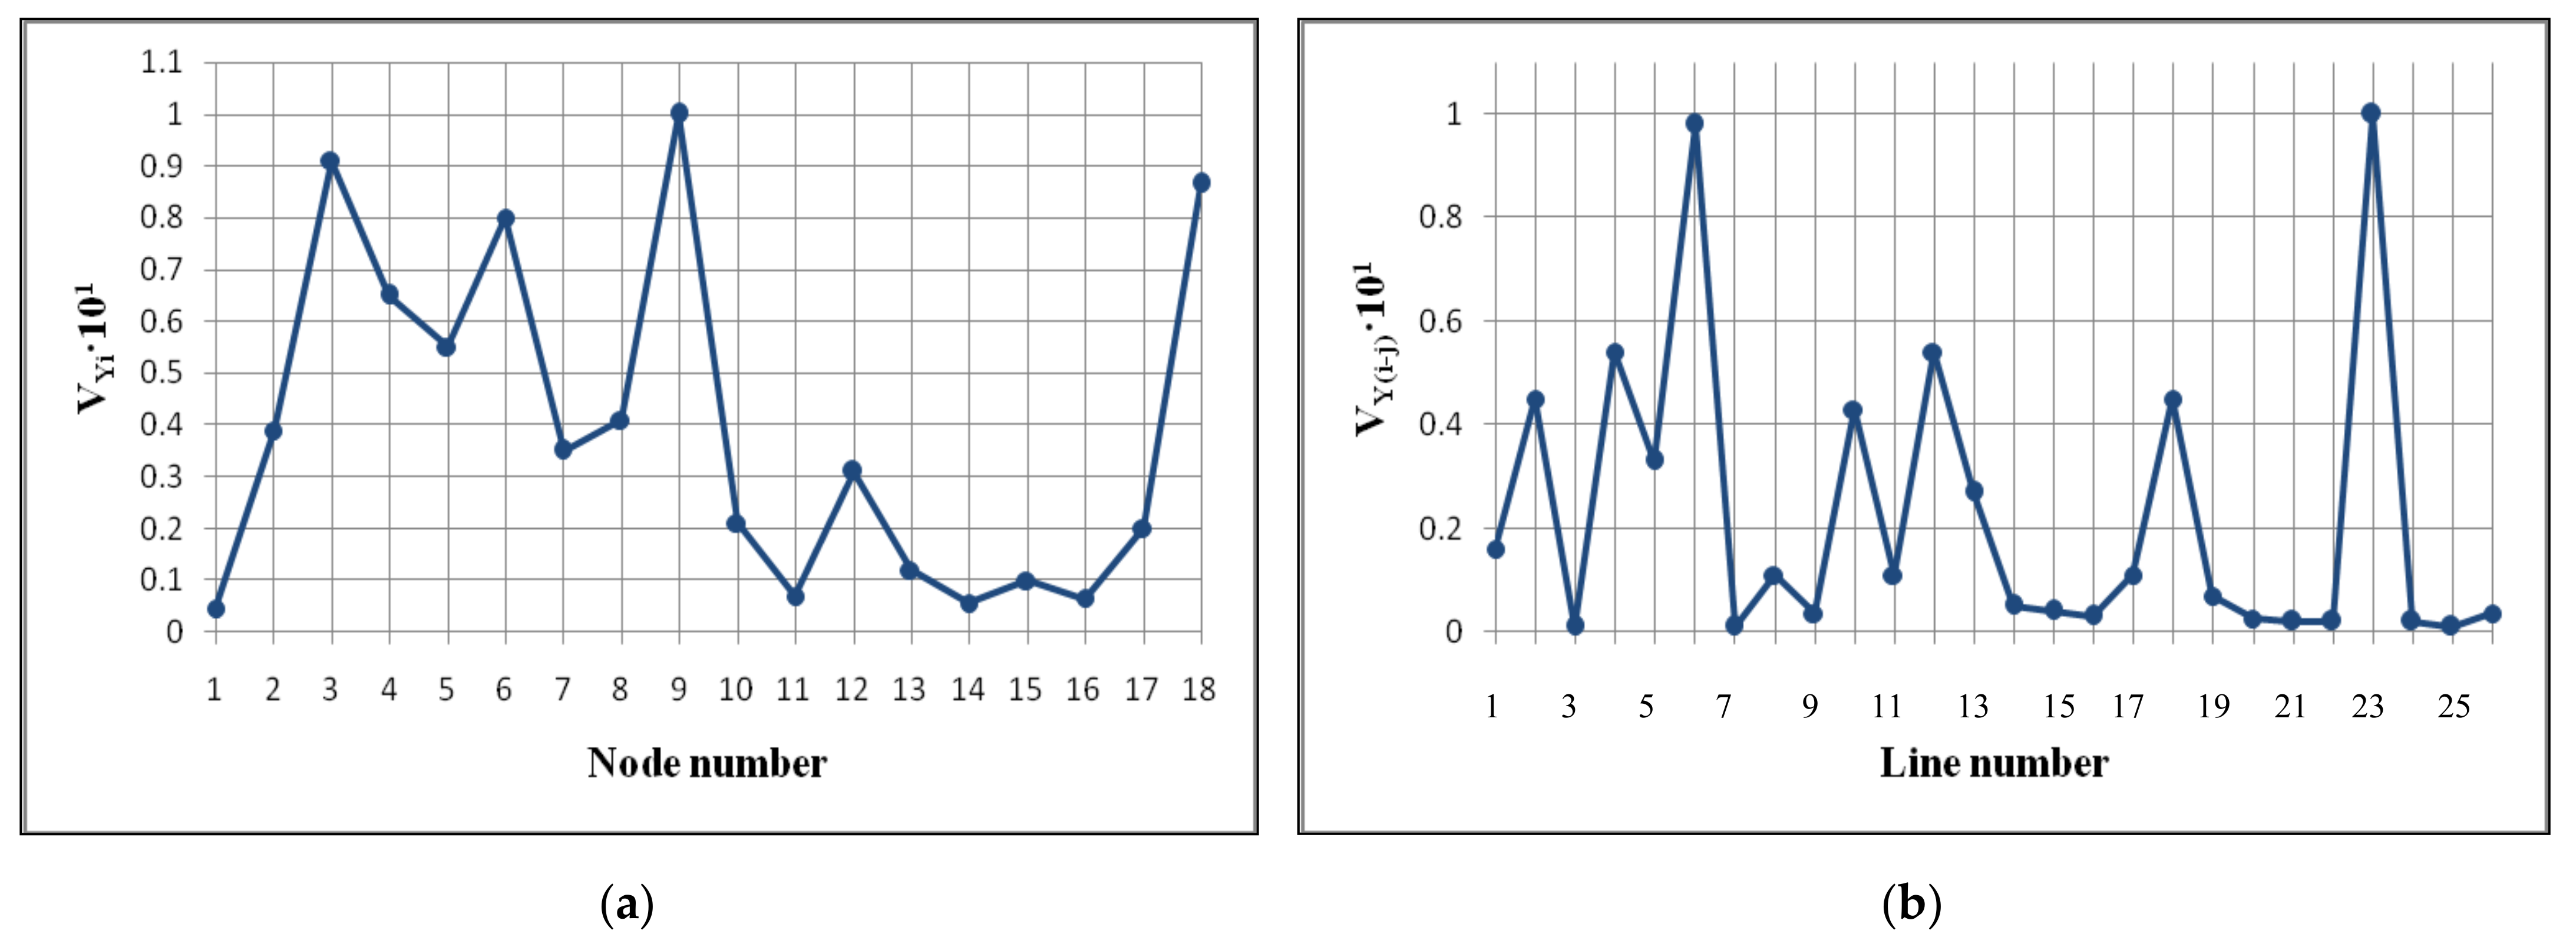
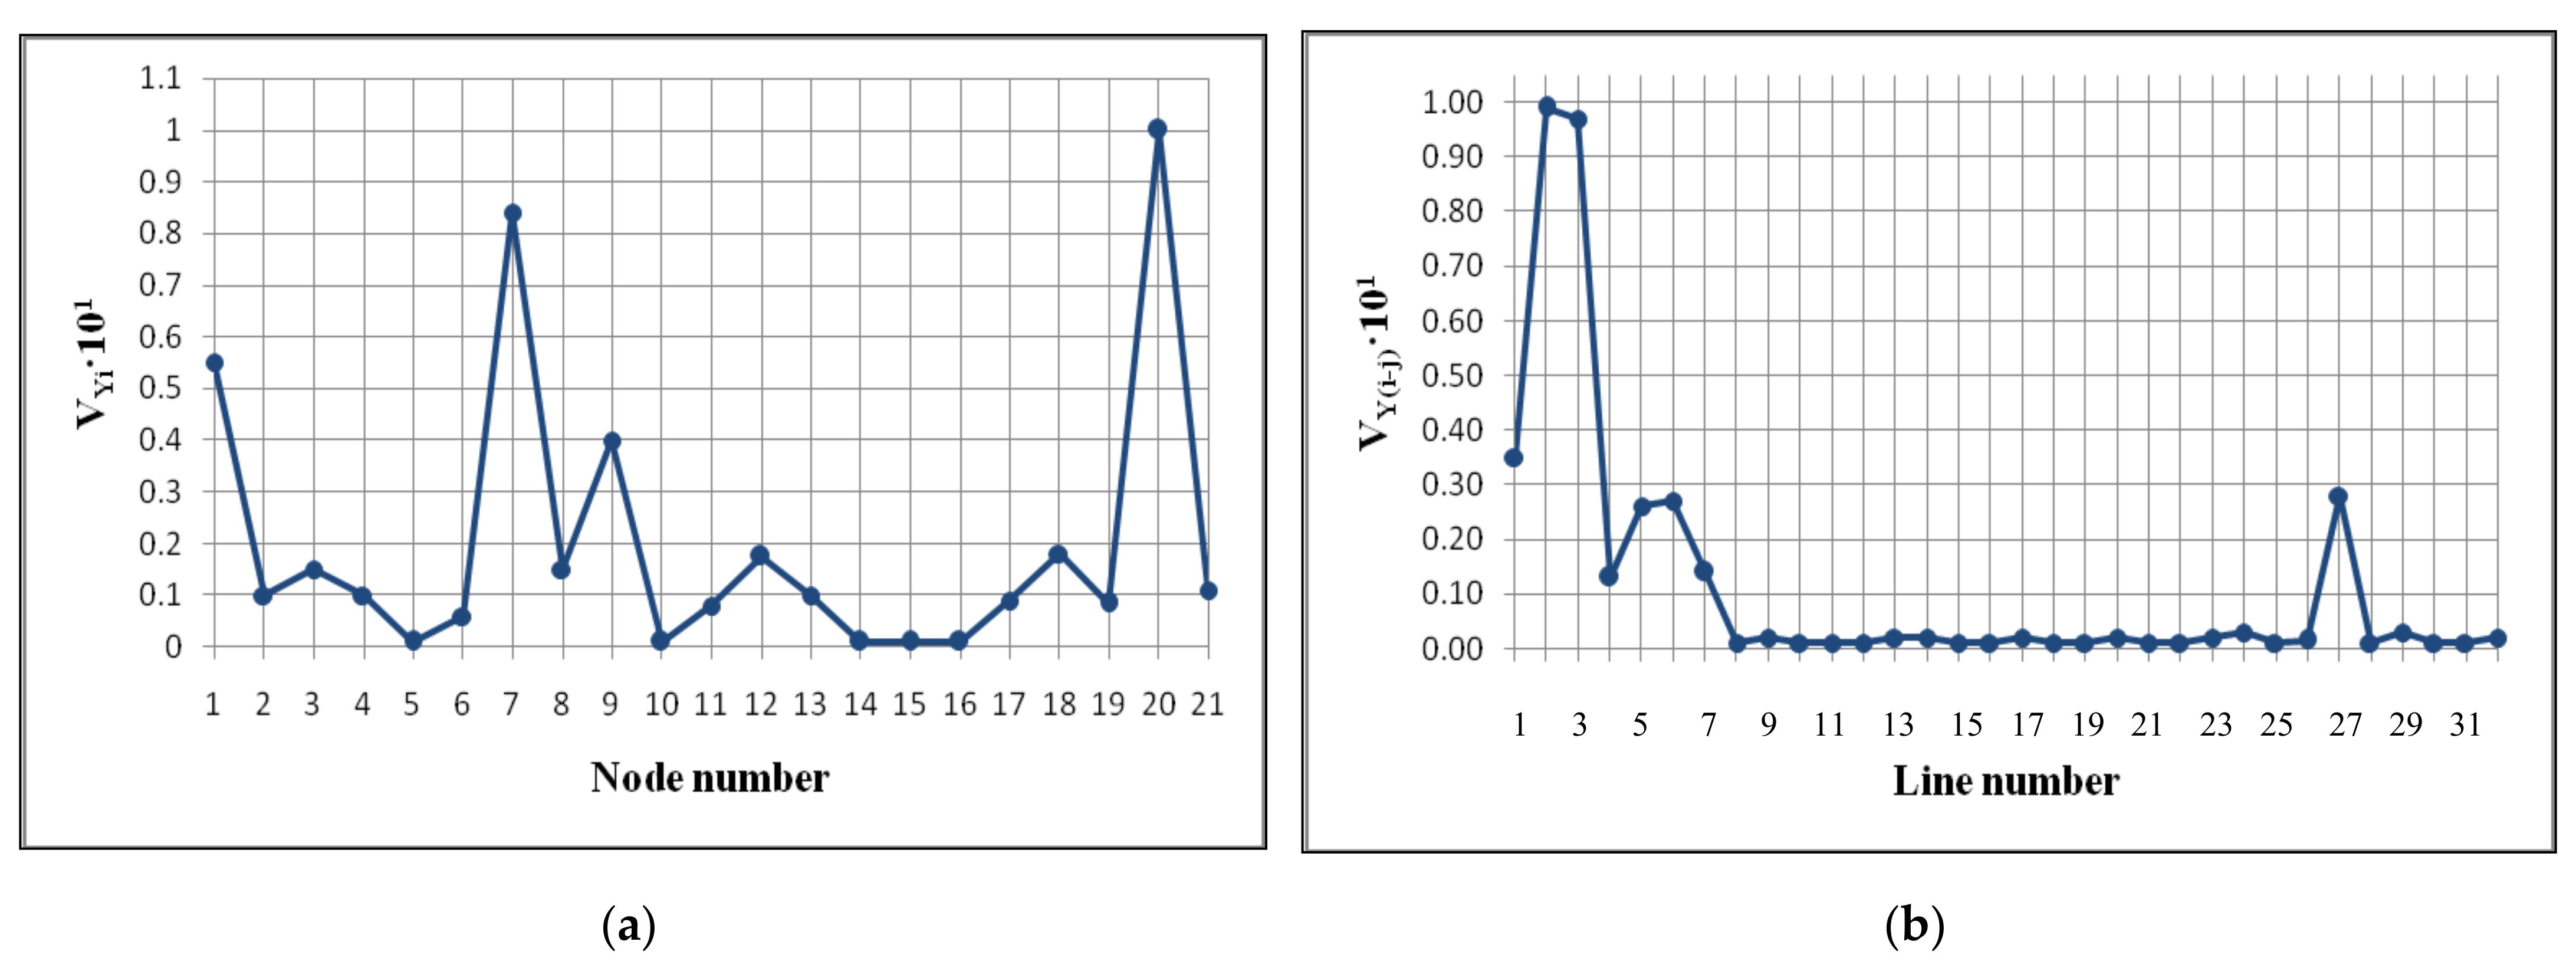
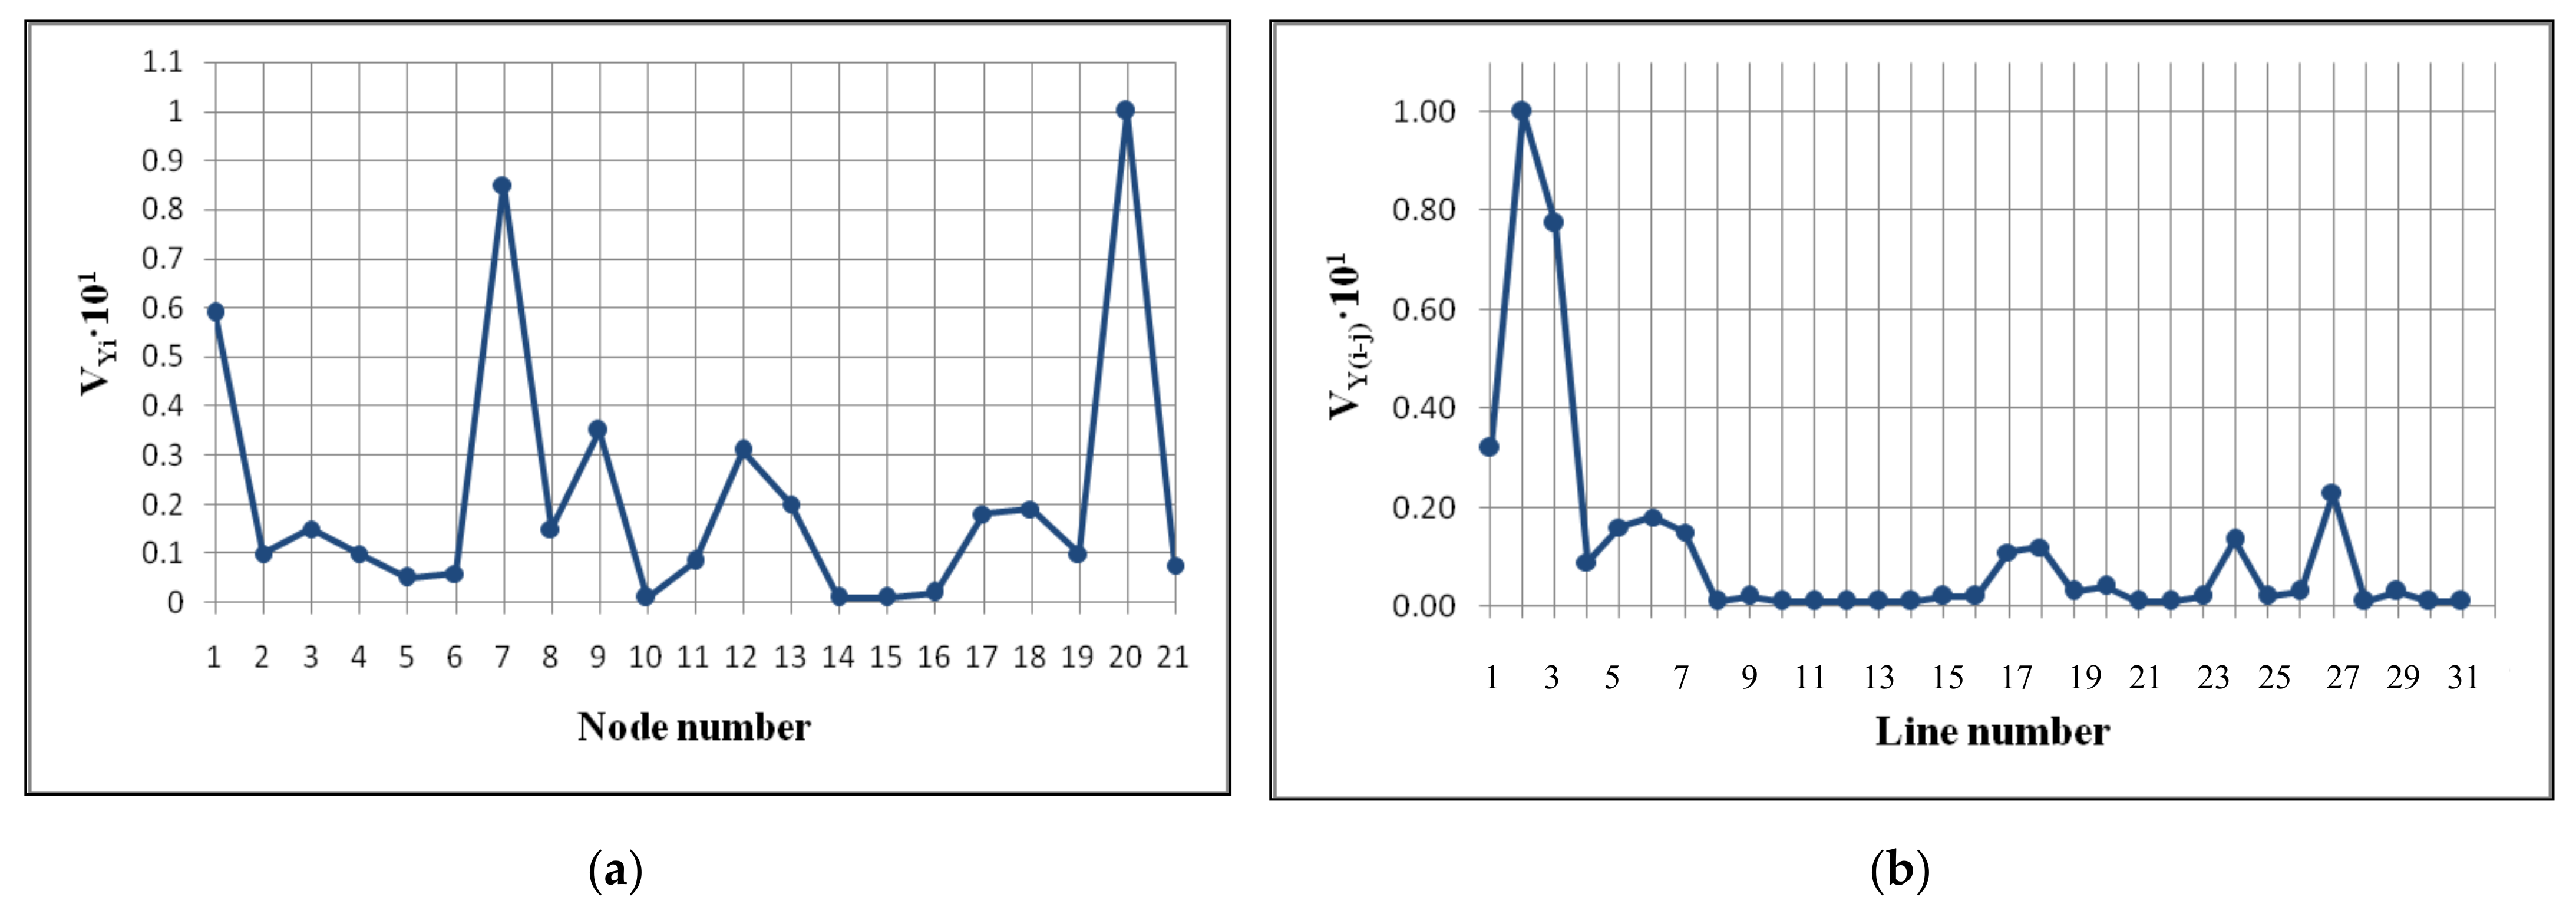
| Singular analysis of the bus admittance matrix | 3′, 6′, 9′, 18′ | 6, 23 | 1′, 7′, 20′ | 2, 3 | 1′, 7′, 20′ | 2, 3 |
| Note: | Figure 10a | Figure 10b | Figure 12a | Figure 12b | Figure 14a | Figure 14b |
Publisher’s Note: MDPI stays neutral with regard to jurisdictional claims in published maps and institutional affiliations. |
© 2021 by the authors. Licensee MDPI, Basel, Switzerland. This article is an open access article distributed under the terms and conditions of the Creative Commons Attribution (CC BY) license (https://creativecommons.org/licenses/by/4.0/).
Share and Cite
Zicmane, I.; Kovalenko, S.; Beryozkina, S.; Berzina, K.; Sobolevskis, A. Evaluation of Latvian Power System Static Stability According to a New Development Strategy until 2025. Sustainability 2021, 13, 6860. https://doi.org/10.3390/su13126860
Zicmane I, Kovalenko S, Beryozkina S, Berzina K, Sobolevskis A. Evaluation of Latvian Power System Static Stability According to a New Development Strategy until 2025. Sustainability. 2021; 13(12):6860. https://doi.org/10.3390/su13126860
Chicago/Turabian StyleZicmane, Inga, Sergey Kovalenko, Svetlana Beryozkina, Kristina Berzina, and Aleksejs Sobolevskis. 2021. "Evaluation of Latvian Power System Static Stability According to a New Development Strategy until 2025" Sustainability 13, no. 12: 6860. https://doi.org/10.3390/su13126860