
Anaerobic Digestion of Food Waste, Brewery Waste, and Agricultural Residues in an Off-Grid Continuous Reactor


Voinovich School of Leadership and Public Affairs, Ohio University, The Ridges Building 22, Athens, OH 45701, USA
*
Author to whom correspondence should be addressed.
Sustainability 2021, 13(12), 6509; https://doi.org/10.3390/su13126509
Submission received: 15 April 2021
/
Revised: 30 May 2021
/
Accepted: 31 May 2021
/
Published: 8 June 2021
(This article belongs to the Special Issue Food and Agroindustrial Waste Trends and Prospective towards Circular Bioeconomy)
Abstract
:Small-scale anaerobic digestion (AD) can be an effective organic waste management system that also provides energy for small businesses and rural communities. This study measured fuel production from digestions of single and mixed feedstocks using an unheated, 2 m3 digester operated continuously in a temperate climate for over three years. Using local food waste, brewery waste, grease waste, and agricultural residues, this study determined that small-scale AD co-digestions were almost always higher yielding than single feedstocks during psychrophilic operation and seasonal temperature transitions. Agricultural residues from Miscanthus x giganteus had the greatest impact on biomethane production during co-digestion (4.7-fold greater average biogas %CH4), while mesophilic digestion of brewery waste alone produced the most biogas (0.76 gCH4 gVS−1 d−1). Biogas production during the transition from mesophilic to psychrophilic was temporarily maintained at levels similar to mesophilic digestions, particularly during co-digestions, but biogas quality declined during these temperature shifts. Full-time operation of small-scale, unheated AD systems could be feasible in temperate climates if feedstock is intentionally amended to stabilize carbon content.
1. Introduction
Anaerobic digestion (AD) is an accepted technology for organic waste management coupled with bioenergy production, but it is not clear that it is feasible at the scale of a rural family, small farm, or small business. In particular, smaller AD systems, and systems that use heterogeneous feedstocks as a substrate, represent a technology with great potential to provide distributed (i.e., decentralized) energy production and waste management in both urban and rural locales. Despite the advantages, wide-spread implementation of small-scale AD systems is hindered by issues that do not affect commercial- or lab-scale AD, including inconsistent access to feedstocks, costs of heating and stirring mechanization, and the time-intensive monitoring necessary for effective maintenance.
Small-scale AD systems with low energy input requirements could be an important aspect of resilient energy production in rural areas [1]. To address the gaps in our understanding about these small-scale AD systems, this study evaluated the fuel quality produced from a non-mechanized 2 m3 digestion vessel that was operated continuously from 2015 to 2018. The results provide novel insight into the practical challenges of continuously operating a small-scale AD system through seasonal changes with different feedstocks.
While the impacts of temperature and feedstock characteristics on fuel production via AD are well described in prior literature [2,3,4], there are no refined projections of energy output in small-scale, unheated AD systems with varied feedstocks in a temperate climate. Heating for AD systems is a significant barrier in temperate regions [5,6,7,8], as the investment in the infrastructure required to safely heat a digester unit is expensive and complex, with training required to both build and maintain the system [9]. Some evidence suggests that mesophilic AD systems, particularly those with solar-assisted heating, can be resilient to temperature changes [2,10] and that temperature fluctuations have only minor impacts on the overall biogas yield relative to systems with consistent, high temperatures [3,11], but there are still many questions about the function and feasibility of small-scale systems operating in a temperate climate year-round.
Using waste feedstocks available locally, this study tested serial digestions of both mono-digestions and co-digestion mixtures, simulating realistic operating conditions for a small-scale AD facility. Feedstocks included mixed food waste (FW), sourced from a university, brewery wastes (BW), grease waste (GW), and agricultural residues of Miscanthus x giganteus (MC). Food waste and BW are both high-volume organic waste streams that currently pose waste management problems for businesses and municipalities alike [8,12]. Grease waste and agricultural residues have a greater proportion of carbon, relative to FW and BW, which can be converted to biogas fuel via AD.
Food waste is an excellent feedstock for biomethane production via AD and is currently used in successful AD systems at multiple scales around the world [8,13,14,15,16]. Importantly, food waste is a common and consistent waste stream that does not dramatically change over the course of a year [16] and can therefore serve as a steady base feedstock for small AD systems. However, using food waste—especially post-consumer—requires sorting to remove contaminants and a mechanical pre-treatment to increase the surface area prior to processing via AD in order to maximize the net biomethane yield [17,18].
Brewery wastewater that includes trub—the slurry of dead yeast and hops residues that must be discarded after the primary fermentation—is a growing concern for waste management districts nationwide as the number of microbrewing operations in the United States has increased from 405 in the year 2000 to over 4522 in the year 2018 [19]. In particular, the trub waste stream is an organics-rich wastewater with a high potential energy yield [20]. The sharp rise in the number of microbrewery operations has meant a dramatic increase in the amount of high-strength wastewater sent to wastewater treatment facilities, heralding the collective need for breweries and their communities to address the economic and environmental costs of their operations [12,21]. Small scale AD could be an effective and energy efficient on-site treatment of BW, the disposal and treatment of which can be a significant financial burden to both the brewery and wastewater management districts [21].
Both crop residues and used cooking oil can serve to supplement carbon (C) in AD feedstocks sourced from FW and BW that typically have carbon-to-nitrogen ratios (C:N) lower than the ideal for AD [20,22]. The C:N of AD feedstocks is an important aspect of digestion maintenance, as the C:N of the raw material can greatly impact the healthy functioning of the microbial communities within the digester [7,18]. Crop residues that are rich in C would be easily accessible if a digester was located on or near a farm or agricultural processing facility and could balance the high nitrogen (N) contents of both FW and BW streams [20,22]. Miscanthus x giganteus (hereafter, MC) is an advanced lignocellulosic perennial bioenergy crop that can produce high yields in soils that are deemed unsuitable for other crops with little to no fertilization required [23,24]. Many field trials of MC have been demonstrated in the US [25,26] and it is already produced for bioenergy commercially in Europe [27,28]. Used cooking oil (hereafter, grease waste or GW) is another desirable C-rich feedstock with high potential energy yield in AD, but it must be co-digested with other feedstocks for functional AD [29].
Each feedstock type described above has different characteristics that both offer benefits and pose challenges in AD systems. Mixed pre- and post-consumer FW has a relatively compatible C:N within the ideal range for AD, but is difficult to process to a uniform size ideal for digestion and often requires pretreatment to maintain a pH above 6 [2]. Trub BW is very uniform, requires no processing, and is nutritionally well-balanced, but can also have a very low pH (in the range of 2–4) that would inhibit the microbial community within a digestion vessel without pretreatment [30]. Crop residues from MC have a high C:N that balances the higher N contents of other feedstocks, but MC is difficult to grind and mix and contains relatively large amounts of recalcitrant C forms that are not ideal for quick conversion into biomethane [31,32]. Grease waste is easily incorporated in AD without processing, but the extremely high chemical oxygen demand (COD) of this material can cause sudden system imbalances that impact organic conversion and fuel yield, if not carefully controlled [33,34].
This study examines the feasibility of using mono- and co-digestion mixtures of FW, BW, GW, and MC feedstocks in a small-scale AD system with low energy inputs. Given the strengths and challenges of each of these feedstocks, we hypothesized that co-digestion mixtures would optimize the biomethane conversion potential relative to mono-digestions of either the FW or the BW feedstocks alone [35]. In addition, the MC and GW could be used to enhance the biomethane production [36]. The objective was to resolve (1) the relative biomethane production rates from the various feedstock mixtures; (2) the effect of seasonal temperature changes on feedstock digestion; and (3) the factors that impact digester stability. An unstirred tubular plug-flow digester was operated in the temperate climate of southeast Ohio with only passive solar heating from a greenhouse enclosure. The experimental AD system was continuously operated over a four-year period and digestion periods with either a single feedstock (FW, BW) or co-digested feedstock mixtures (FWBW, FWBWGW, FWMC) were evaluated.
2. Materials and Methods
2.1. Site Description and Climate
A small greenhouse structure to contain the experimental AD unit was constructed in the spring of 2015 adjacent to a Class 2 composting facility in Athens, Ohio (39.32° N 82.1° W, elevation 226 m). The greenhouse is a 12-by-24 ft (3.7-by-7.3 m) aluminum frame structure with 6 mm twin wall polycarbonate panels (Juliana Gardner 21.4 Greenhouse, International Greenhouse Company, Danville, IL, USA).
The study site is located in plant hardiness zone 6a, characterized by an average annual (winter) minimum temperature range of −23.3 °C to −20.6 °C (USDA Plant Hardiness Zone, 2012, http://planthardiness.ars.usda.gov/PHZMWeb/, accessed on 6 February 2021). The Ohio University weather station located in Athens, Ohio, recorded average summer temperatures of 22.3 °C, 23.6 °C, 20.8 °C, and 23.0 °C in 2015, 2016, 2017, and 2018, respectively, and average winter temperatures of 2.2 °C, 2.8 °C, and 1.4 °C in 2015–2016, 2016–2017, and 2017–2018, respectively. For this project, we defined season boundaries with equinox and solstice dates: 21 March, 21 June, 21 September, and 21 December. Hourly meteorological data was collected at the Ohio University weather station located 2 km northeast of the AD facility. We used the daily average, minimum, and maximum temperatures recorded at the weather station (2015–2018) and within the greenhouse (2016–2018 only; HOBO pendant dataloggers, Onset Computer Corporation, Bourne, MA, USA) in all analyses reported herein.
2.2. Feedstock and Inoculum
A variety of feedstock mixtures were used over the course of the experiment (detailed in Table 1) as they were available. Food waste collection and processing systems were described in detail previously [2]. Briefly, we captured daily samples of well-mixed FW from the centralized pre- and post-consumer FW composting facility adjacent to the study site, then ground the material to <4.5 mm pieces and mixed in rainwater collected on-site to make a slurry of approximately 10–20% solids. Used GW was collected bimonthly from a dining hall on the Athens campus of Ohio University. In order to increase the feedstock digestion potential while not altering the OLR above our target maximum of 2.0 gVS L−1 d−1, GW was added every other feeding (320 mL each time) during periods that included GW, amounting to an additional 0.05 gVS L−1 d−1 [37].
During periods when BW was a feedstock, we collected fresh post-secondary fermentation brewery wastewater (i.e., the trub and spent hops materials) from local breweries (Jackie O’s Brewery and Devil’s Kettle Brewing, both of Athens, OH, USA); these materials were kept refrigerated until the day of use. The FWBW feedstock was made from approximately equal wet weights of the two feedstocks. The BW had an average moisture content of 89%, but periodically had to be mixed with small volumes of rainwater to make the solid plant material flow through the inlet plumbing. Miscanthus x giganteus residues from local agricultural plots were ground from whole stalks and leaves to pieces <1 cm3 with a modified paper shredder (Fellowes Brands C120, Itasca, IL, USA); during the FWMC experimental period (C5), 308 gdry weight ground MC mixed with 317 gdry weight ground FW and 11.7 L of collected rainwater per day were mixed to create a feedstock with approximately 5% solids.
Feedstock mixtures were mixed in 5-gallon buckets with rainwater to an approximate solids content of 10% and added daily, 4–7 days per week, during functional digestion periods. Digestion periods were defined as periods of continuous feeding with the same feedstock, with no longer than 14 days between blocks of time with regular feedings (Table 1). Feeding breaks happened during digester repairs, upgrades, souring events, and when frozen plumbing prevented the flow of material into the digester. The pH of all feedstocks was measured and sodium bicarbonate (CAS #144-55-8) was added as a buffer to achieve a neutral pH (6.8–7.2) prior to introduction into the digester, as needed.
Inoculation events occurred a total of four times (Table 1) with healthy reactor effluent collected from nearby industrial AD facilities using mesophilic digestion (Quasar Energy Group; Independence, OH, USA). The inoculations that occurred in June of 2015 (pH 7.96, VFA/TIC 0.57) and September of 2016 (pH 8.14, VFA/TIC 0.40) were each approximately 225–250 gallons of healthy effluent from the Quasar Columbus, Ohio plant, which typically processed ca. 33% FW, 33% GW, and 33% biosolids. The inoculation in May of 2016 was approximately 250 gallons of healthy effluent (pH 7.90, VFA/TIC 0.21) from the Quasar plant in Wooster, OH, which was processing exclusively municipal wastewater sewage sludge at the time. The inoculation in May of 2018 (pH 7.71, VFA/TIC 0.31) was approximately 260 gallons of healthy effluent from the Quasar Zanesville, Ohio plant, which was processing a feedstock mixture of 20% fats, oils, and greases, 25% municipal wastewater treatment plant biosolids, 20% spent grain, 25% glycerines/food processing wastes, and 10% leachate.
2.3. Digester Setup
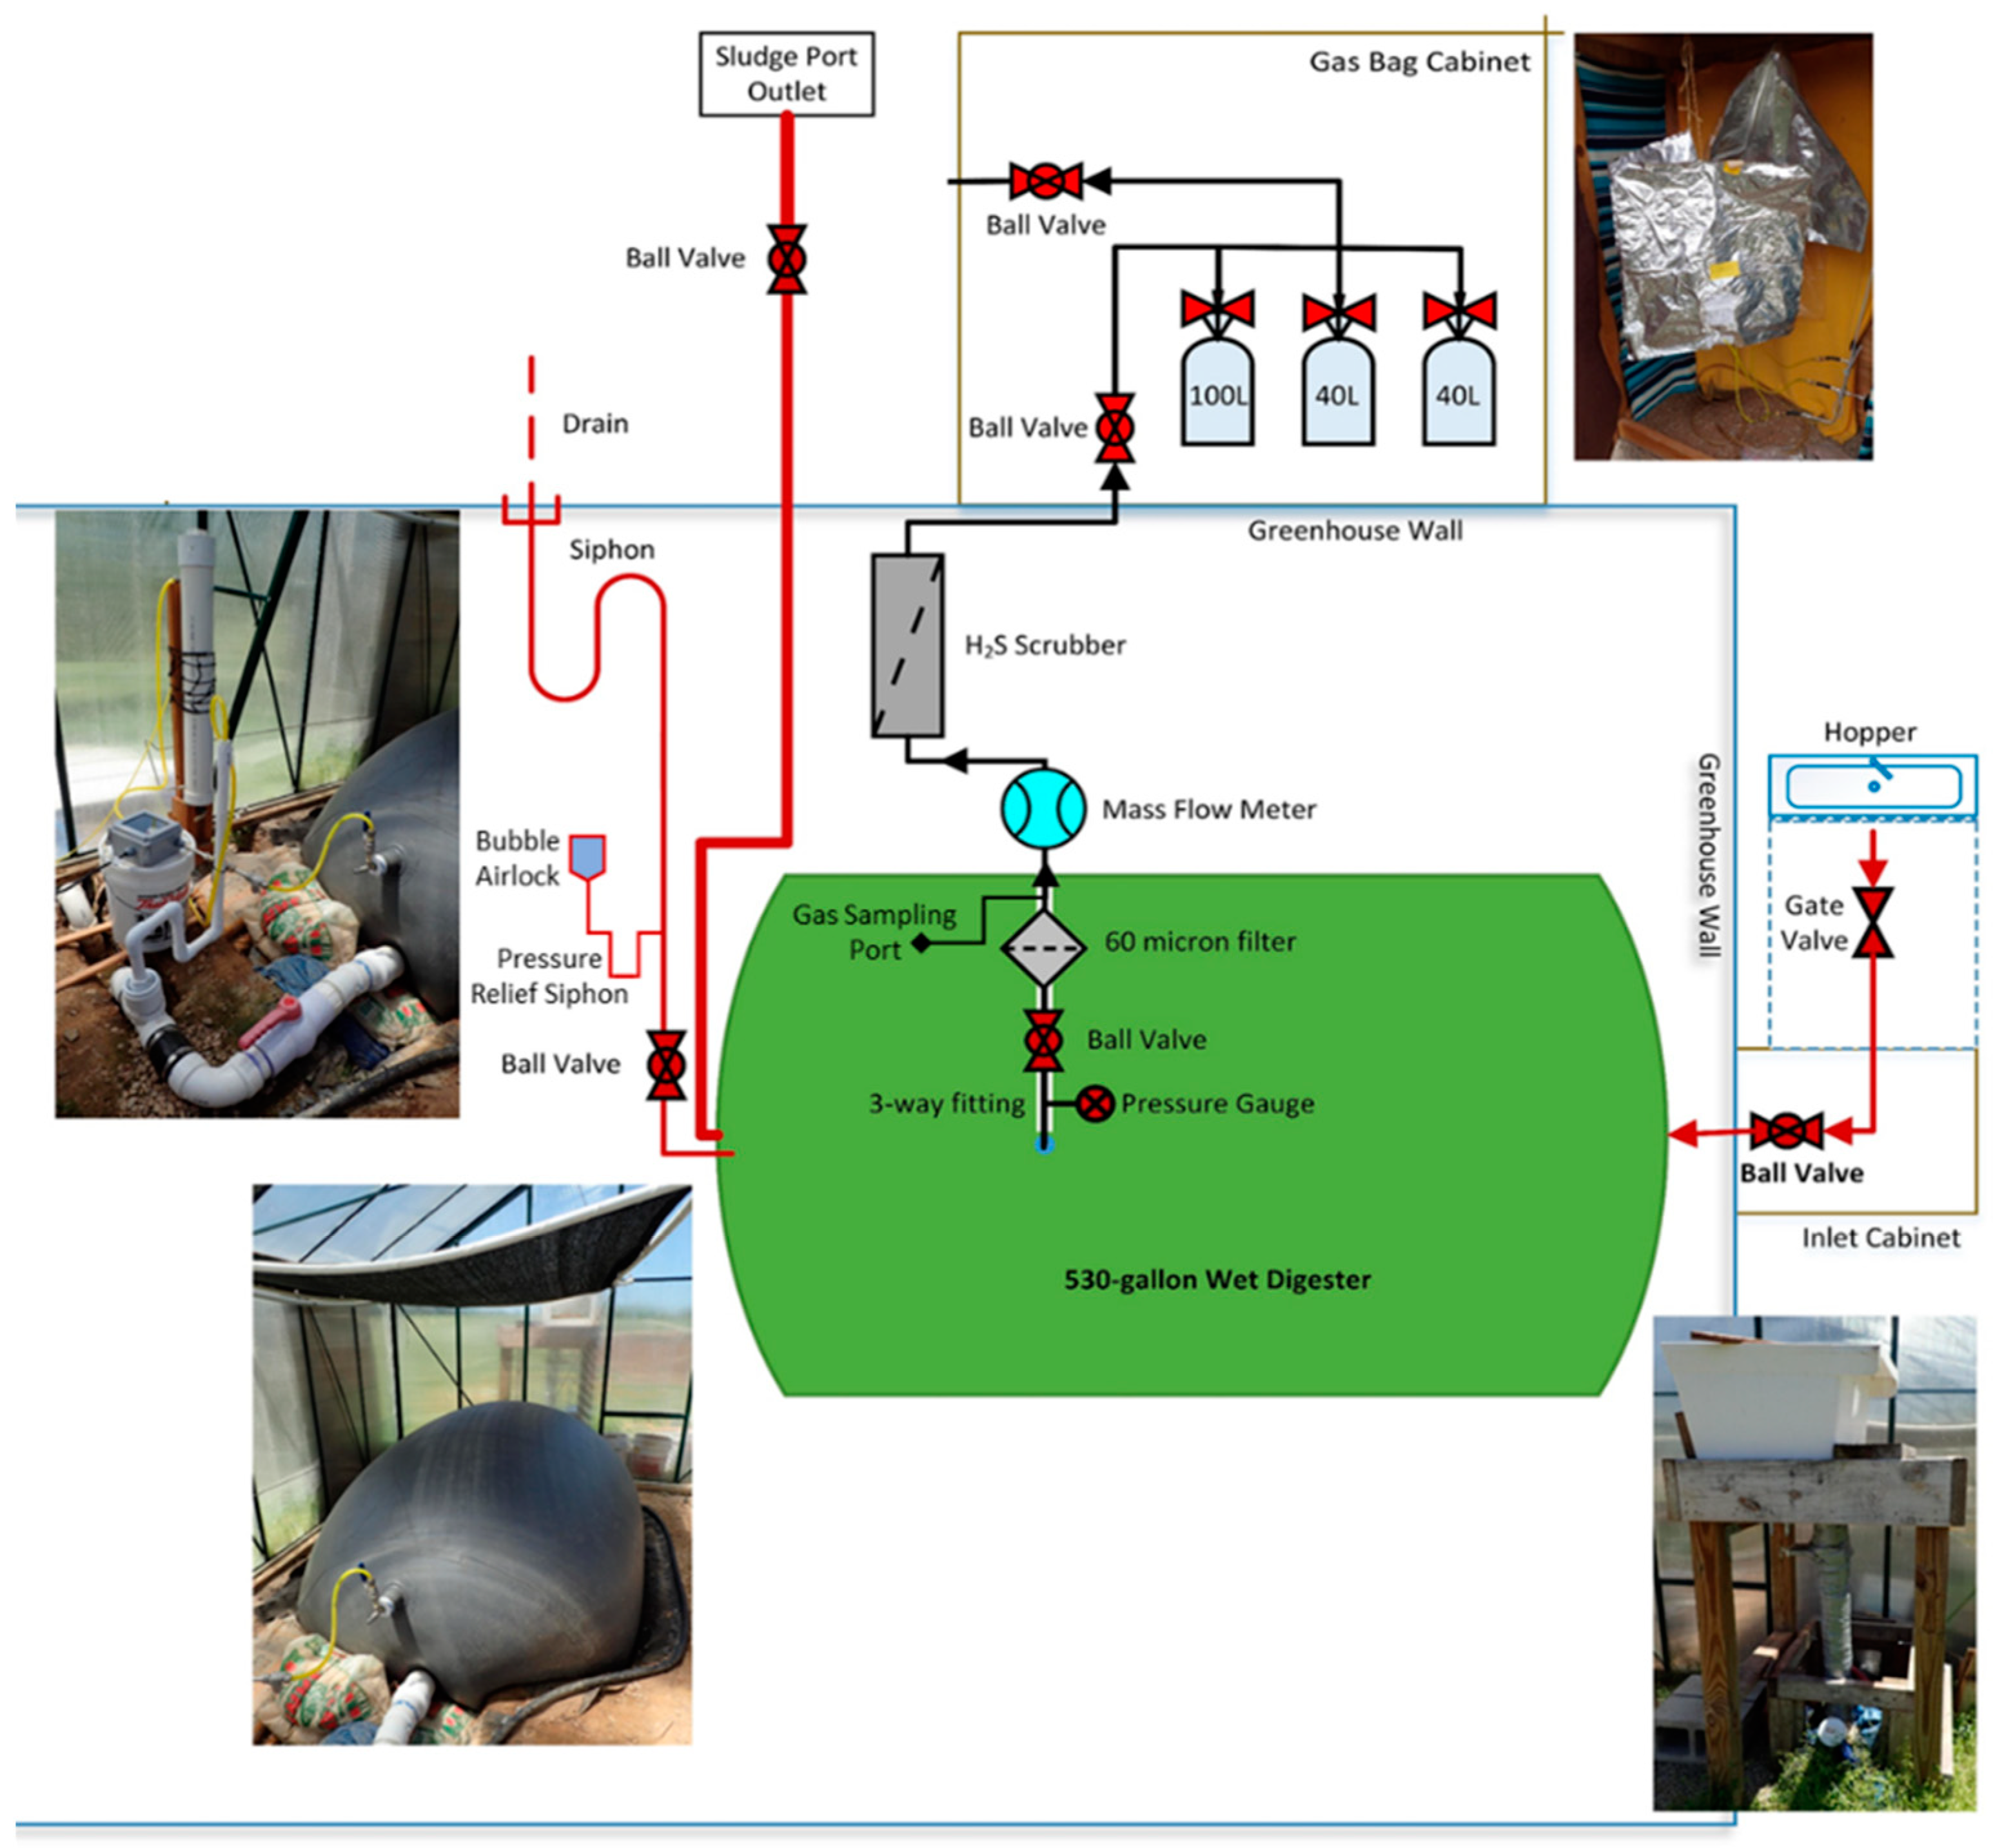
The digester (Figure 1) was a cylindrical, geomembrane vessel made from 1 mm flexible polyvinyl chloride (PVC) with a 2 m3 liquid capacity and an equal area for gas accumulation (Viogaz Inc., Heredia, Costa Rica). The digester was installed in a well-drained, two-sided sloped trench designed to keep the liquid level inside the digester flush with ground level. Three, nearly identical digestion vessel setups were used over the course of the study (noted as letters in Table 1). Minor differences include: (i) the gas output port was in a different location on the top of Digester A and (ii) a secondary sludge port and associated external plumbing to allow for easier materials removal were added to Digester C.
The digester had four ports: (1) a 5 cm diameter PVC port on the top half of the digester to allow for biogas output flows fitted with a stainless steel ball valve and tube fitting; (2) a 7.6 cm diameter PVC inlet at ground level connected to a hopper located 1.2 m above ground level and sealed with a ball valve at the digester connection and a gate valve immediately below the hopper; (3) a 7.6 cm diameter PVC outlet sealed with a ball valve connected to a gas pressure relief valve on one end and a 50 cm deep passive siphon on the other; and (4) a 10 cm diameter sludge port with a 90 cm deep passive siphon that drained from the bottom of the digester and sealed with a ball valve at the terminus (see Figure 1). The trench and digester footprint was 1.8 m × 2.7 m, with the input, output, and sludge ports plumbed to originate/terminate outside of the greenhouse. In order to protect the digester from UV damage, we suspended a 1.8 m × 2.4 m shade panel (Shatex 90% black, Wellco Industries, Corona, CA, USA) at a height of 1 m above the digester when inflated.
2.4. Digestion Temperature
A temperature sensor (DS18B20; Dallas Semiconductor, Dallas, TX, USA) was installed 30 cm below the liquid level along the outside edge of the digester for a 35-day period to determine the relationship between digestate temperature and air temperature. The maximum daily air temperature was strongly correlated to the digestate temperatures (R2 = 0.75; Figure S2); this relationship was used to estimate digestate temperature during periods when temperature sensor data was not available. There was an 8-month period spanning two seasonal transitions that was used to resolve the correlation between the outdoor temperature and the temperature of the material flowing out of the digester (p < 0.001, R2 = 0.7288, N = 337). Using this relationship, digestion periods were characterized as mesophilic (>20 °C) and psychrophilic (<20 °C). Periods of less than five days in a row of cooler temperatures within otherwise mesophilic seasons were not reclassified as psychrophilic due to the thermal entropy of the liquid digestate. The digester was considered psychrophilic once daily maximum outdoor air temperatures did not reach 20 °C for more than five days in a row. Equally, the shift to mesophilic occurred at the first five-day long period of >20 °C daily maximum air temperatures.
2.5. Chemical Characterization
Feedstock mixtures and digester waste products were regularly sampled (once weekly) from October 2016 to October 2018. The pH and temperature were immediately measured with a pH pen (850052, Sper Scientific, Scottsdale, AZ, USA). Well-mixed samples were collected in bubble-free 50 mL centrifuge tubes that were stored at 4 °C and then analyzed within 2 weeks of sampling. A portion of each sample was used to measure the total N, phosphorus (reactive and total), and chemical oxygen demand (COD), using persulfate, ascorbic acid, and reactor digestion methods, respectively, via spectrophotometric kits (Hach Co., Loveland, CO, USA). A 10 mL subsample was used to determine the density and dry weight by oven drying at 105 °C for 24 h. The C and N contents were determined via elemental analysis with an ECS 4010 CHNSO analyzer equipped with a 3 m HAYESEP Q 80/100 MESH column and a TCD (Costech Analytical Technologies, Inc., Valencia, CA, USA).
2.6. Biogas Quantification and Quality Assessments
A mass flow meter (MS-series, Alicat Scientific, Tucson, AZ, USA) was installed on the gas output line of the digester on 10 November 2016. The biogas flow was continuously measured thereafter, with only three, multi-day power-related disruptions in the data collection that occurred between 14 July 2017 and 9 August 2017, 3 December 2017 and 17 December 2017, and 16 August 2018 and 28 September 2018. Temperature-corrected mass flow rates were recorded every 100 milliseconds with a datalogger (CR-1000, Campbell Scientific, Logan, UT, USA). Flow rates were averaged by minute in units of standard cubic centimeters per minute and then summed to generate daily volumes of biogas production. Due to a small leak in the digester that we discovered on 19 April 2018, flowmeter data for the C7_damaged, C8, and C9 periods were not included in any statistical analyses.
Biogas samples were collected from fixed volume Tedlar and multi-layer foil gas sampling bags (Restek Corporation, U.S., Bellefonte, PA, USA) that passively filled directly from the digester; samples were collected for gas analysis once a bag was filled to capacity (either 40 or 100 L) and the bag fill time was used to calculate a biogas production rate. We analyzed biogas samples with a gas chromatograph using FID and TCD detectors (Bruker Daltonics, Billerica, MA, USA) to determine CH4 and CO2 content, respectively. Temperature-standardized volumetric data were used to calculate the mass of CH4 generated per unit volatile solids (VS) fed to the digester per day, or CH4 production rate.
Carbon Conversion Efficiency during FWMC Trial
The gas leak mentioned in Section 2.6 affected the FWMC trial period (C9). To estimate the volume of biogas produced, we calculated the difference in the amount of C (determined by elemental analysis) entering the system as feedstock (input) and exiting the system as digestate (output). Biogas samples taken three times a week directly from the digester headspace provided the estimates of the proportion of CH4 within the biogas generated. These measurements were used to calculate the amount of C converted to CH4 according to Equations (1) and (2):
and
where Biomassx is the mass of the input and output material in g, the Cx is the carbon content of the input and output material in g, and Cbiogas is the fraction of C converted to biogas. For Equation (2), CCH4 is the proportion of CH4 measured in the biogas, and FCH4 is the fraction of C converted to CH4. Equation (2) accounts for a fraction of the biogas C (0.01, or 1%) lost due to carbon monoxide production [38]; the C corresponding to cell growth was neglected.
(CInput/BiomassInput) − (COutput/BiomassOutput) = Cbiogas,
(Cbiogas − 0.01 × Cbiogas) × CCH4/Cbiogas = FCH4,
2.7. Statistics and Analysis
We analyzed the relationship between daily and seasonal weather station and greenhouse temperatures using an analysis of covariance (ANCOVA). We used a nested analysis of variance (ANOVA) to determine the effect of digestion temperature (psychrophilic vs. mesophilic) and feedstock mixtures on biogas CH4 content and biogas production rates; Tukey honest significant difference (Tukey HSD) tests determined the direction and significance of pairwise comparisons following significant ANOVA results. We performed all statistics in RStudio version 1.3.959 with R version 3.5.3 [39].
3. Results
3.1. Physical Conditions
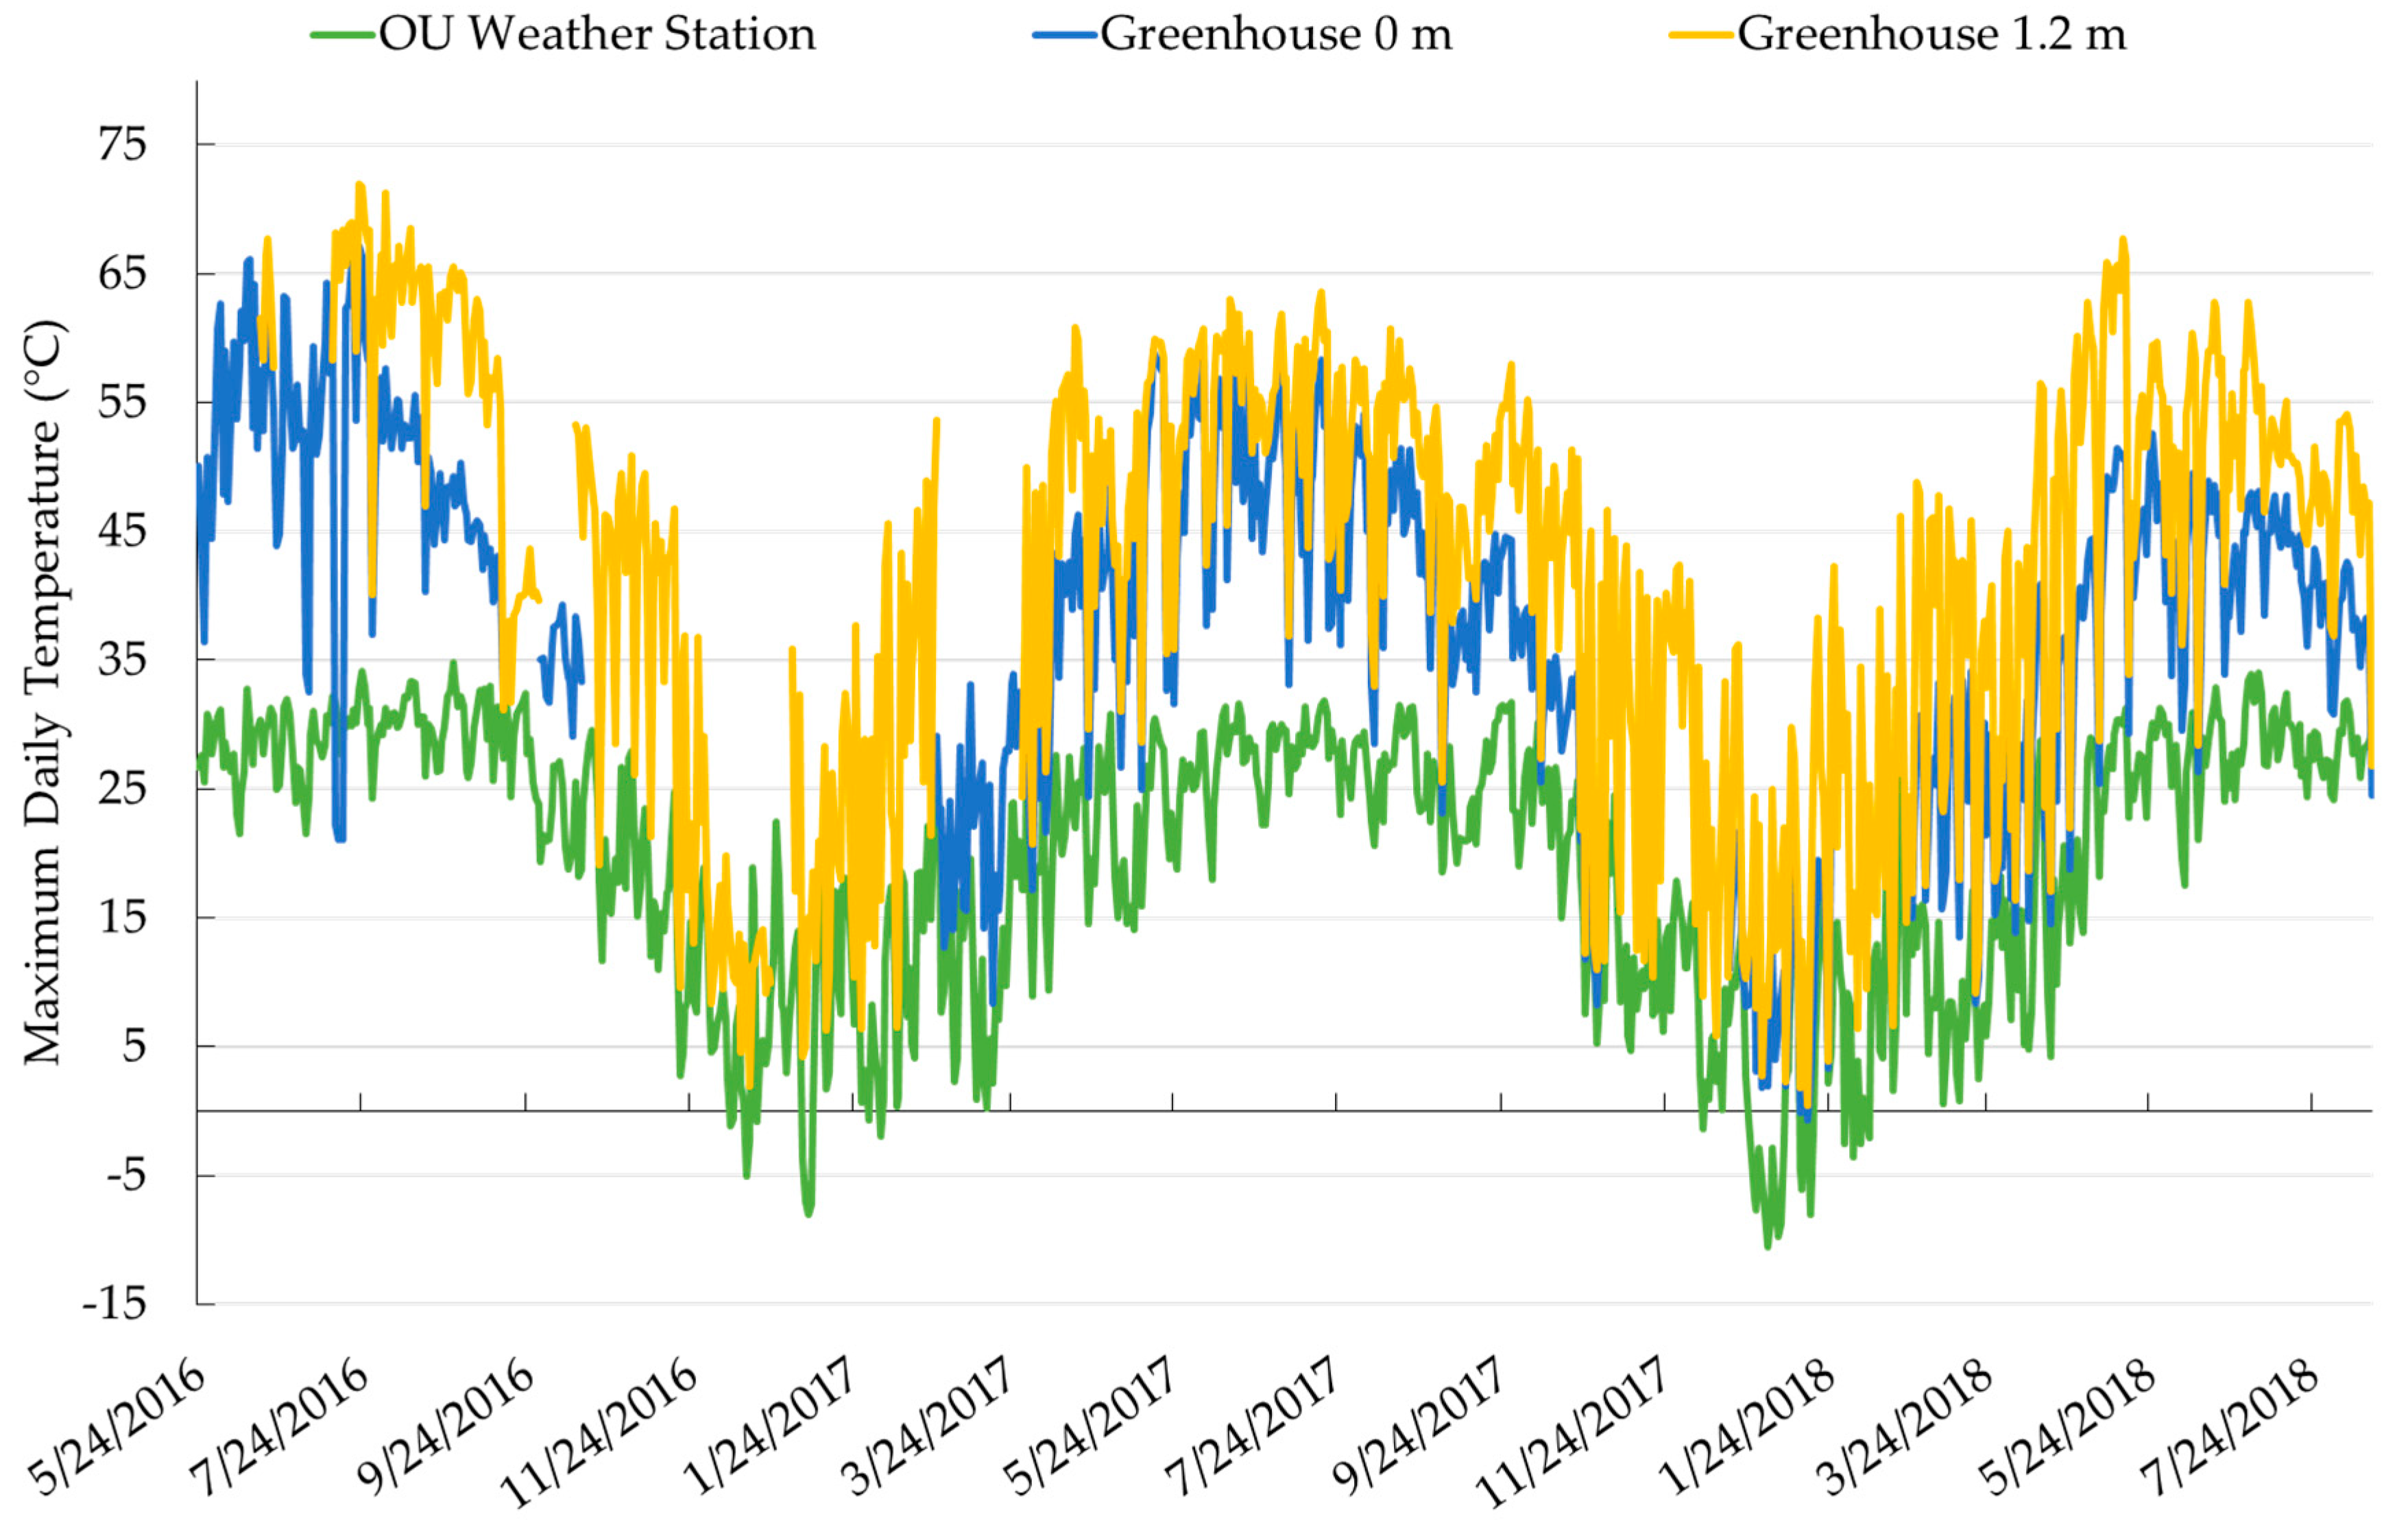
The greenhouse enclosure provided elevated maximum daily temperatures relative to ambient air (Figure 2). Maximum daily air temperatures recorded within the greenhouse were significantly greater than the temperatures recorded at the Ohio University weather station on the same date (ANCOVA p < 0.001), particularly in the late spring, summer, and early fall (Figure 2). This same trend was not observed in the daily minimum air temperature data, where there were no significant differences between the temperatures recorded outside and inside of the greenhouse (Figure S1).
3.2. Feedstocks
The nutrient content and chemical characteristics of the different feedstock materials and digester effluent are summarized in Table 2, organized according to the feedstock(s) being digested (see Table 1 for feedstock assignments by period). The FWMC feedstock mixtures had significantly lower contents of dissolved N, dissolved P, and COD than the other feedstock materials tested (p < 0.001); this was due to the much lower solids content of the FWMC feedstock (5% vs. an average of 19% in all other feedstock mixtures) necessary to make the ground MC material flow easily through the plumbing. When the N, P, and COD measurements were standardized into units per g FW−1 L−1, there were no differences in the nutrient and COD contents of the FW used during the FWMC period relative to the FW feedstock use in all other digestion periods. The COD values for the feedstocks were typically high (>50,000 mg L−1), which supported the suitability of the materials for treatment with AD.
All feedstocks and inoculum inputs to the digester, except MC, had C:N ratios below the 20–35 optimal range for mesophilic AD [40]. The C content of MC was much greater than the other feedstocks and, even when mixed with FW, the C:N ratio of FWMC was above the typical optimum.
3.3. Carbon Conversion Efficiency
During the FWMC trial (C9) period, an average of 71% of the feedstock C was converted into CH4, or 0.712 gCH4 gCinput−1. The minimum and maximum weekly efficiency rates were 66% and 80%, respectively.
Relative to the CH4 production rates for the other digestion periods (Table 3), a C conversion efficiency of 0.712 gCH4 gVS−1 would make the FWMC trial the second-highest period for CH4 production rate behind the BW trial (C4) period (0.761 gCH4 gVS−1). The FWMC digestion period also had more consistent daily and weekly conversion rates compared to the other functional digestion periods. For co-digestion mixtures, MC as a feedstock had the single greatest impact on the rate of CH4 yield (p < 0.001). For the periods not including MC, the presence of FW in a co-digestion mixture was more important to the biogas production dynamics than was the inclusion of either BW or GW (p < 0.001).
3.4. Biogas Production
The quantity of biogas generated (L d−1) as measured by the mass flowmeters varied substantially over time (Figure S3). The biogas production was sensitive to both changes in the physical conditions (e.g., temperature and HRT) as well as changes in feedstock. We see this as sharp declines in biogas production during frozen periods when feeding was not continuous, for example. Shifts in feedstock were more often accompanied by at least a temporary surge in biogas production.
Seasonal transitions had dynamic biogas production rates. For example, the shift from mesophilic to psychrophilic during the onset of winter (this shift consistently occurred between late October and early December in 2015, 2016, and 2017) did not result in a significant loss of biogas production prior to the freezing of the plumbing in any of the years measured. For example, there was no difference in the biogas production rate between the mesophilic and psychrophilic periods within the C1 FW mono-digestion period in late 2016. The biogas production rates during the psychrophilic FW mono-digestion period (C2) immediately following a 22-day starvation due to frozen plumbing were also statistically indistinguishable from the rates observed during the last month of the psychrophilic digestion period (C1) of the same feedstock (73 and 97 L d−1, respectively).
The seasonal shift that occurred with the onset of winter in November 2017 during a FWBWGW digestion period (C6) also did not show significant declines in biogas production prior to the plumbing freezing (C6_frozen). However, there was significantly lower biogas production in the month after the 14-day starvation C6_frozen period compared to the month before the freezing (ANOVA p < 0.001).
3.5. Biogas Quality
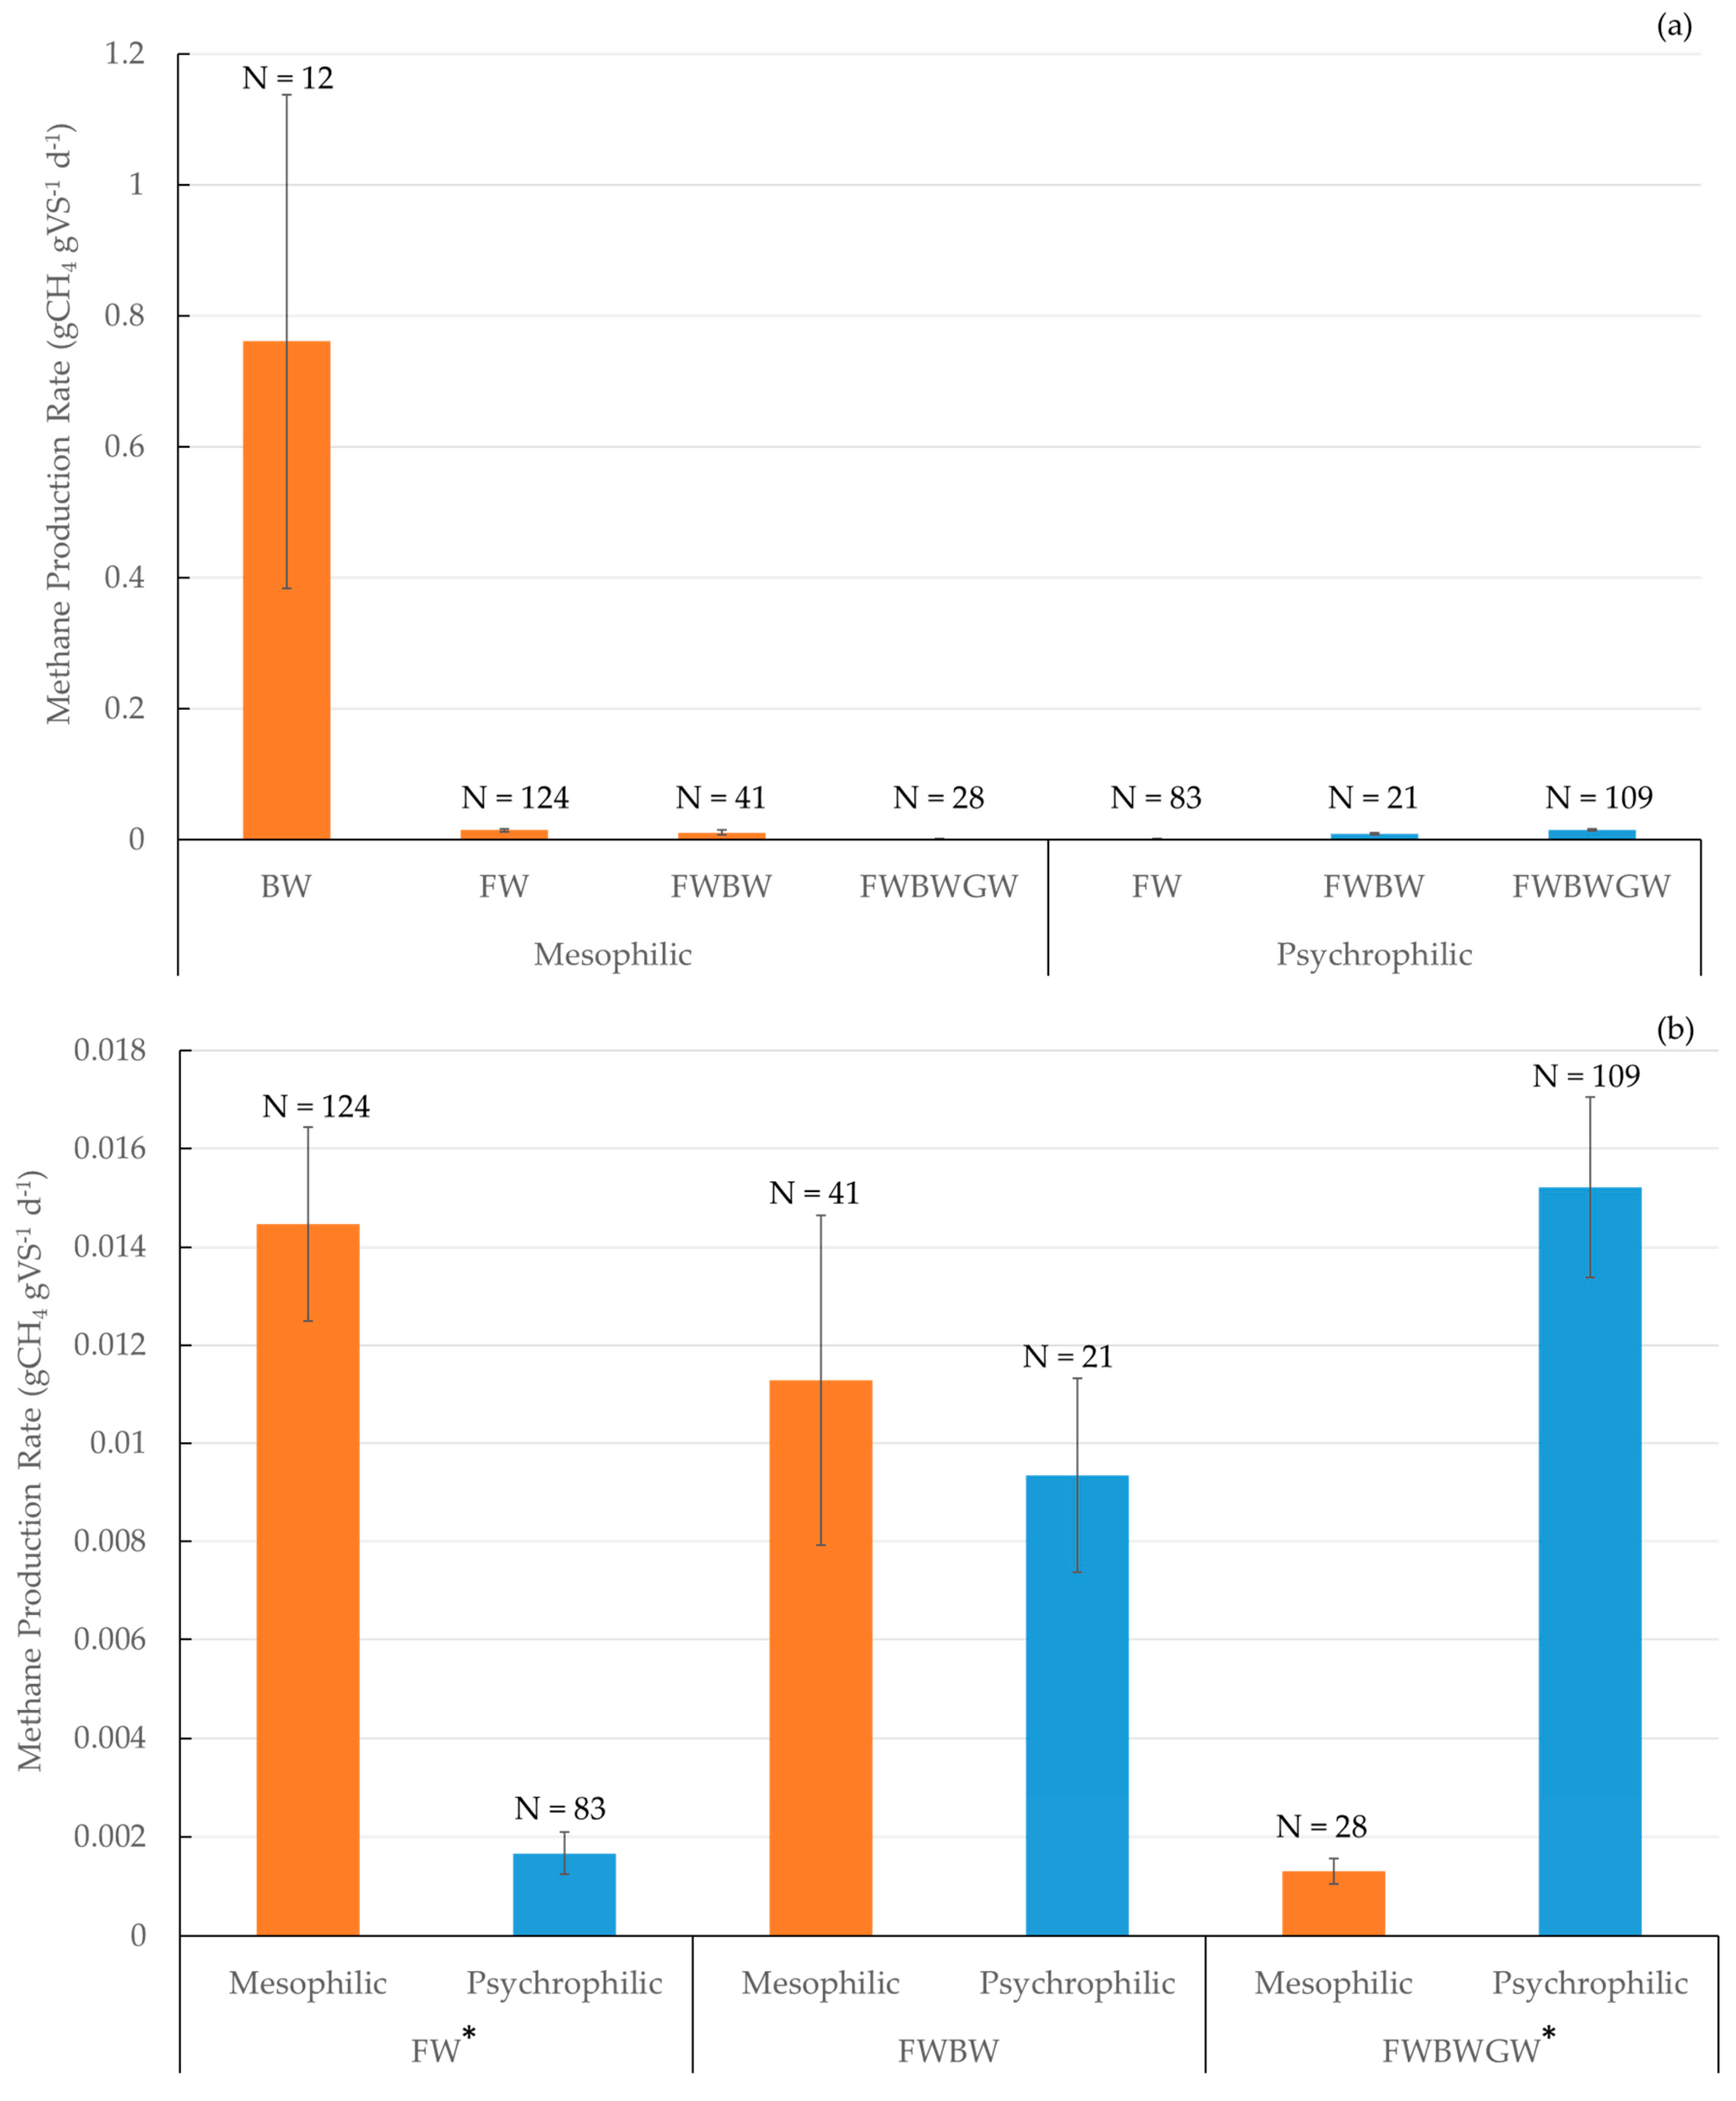
Overall, the digestion temperature (mesophilic vs. psychrophilic) explained more of the variation in the CH4 production rate (gCH4 gVS−1 d−1) than the feedstock type, but the magnitude and direction of the effect differed by feedstock type. Temperature conditions, mesophilic or psychrophilic, were a strong determinant of the CH4 production rate (gCH4 gVS−1 d−1; ANOVA p <0.001), regardless of feedstock type (ANOVA p < 0.001), with more consistent and higher rates of CH4 production during mesophilic conditions. When comparing the temperature effect within each feedstock separately, there was a significant difference in CH4 produced from digestions at different temperatures for FW alone (p = 0.04) and FWBWGW (p = 0.03), but not for FWBW (Figure 3b). The direction of these differences was also dependent on the feedstock type (ANOVA interaction effect p < 0.001), as FW digestion resulted in higher rates of CH4 production during the mesophilic periods while FWBWGW had lower rates of CH4 production during its mesophilic periods (Figure 3b).
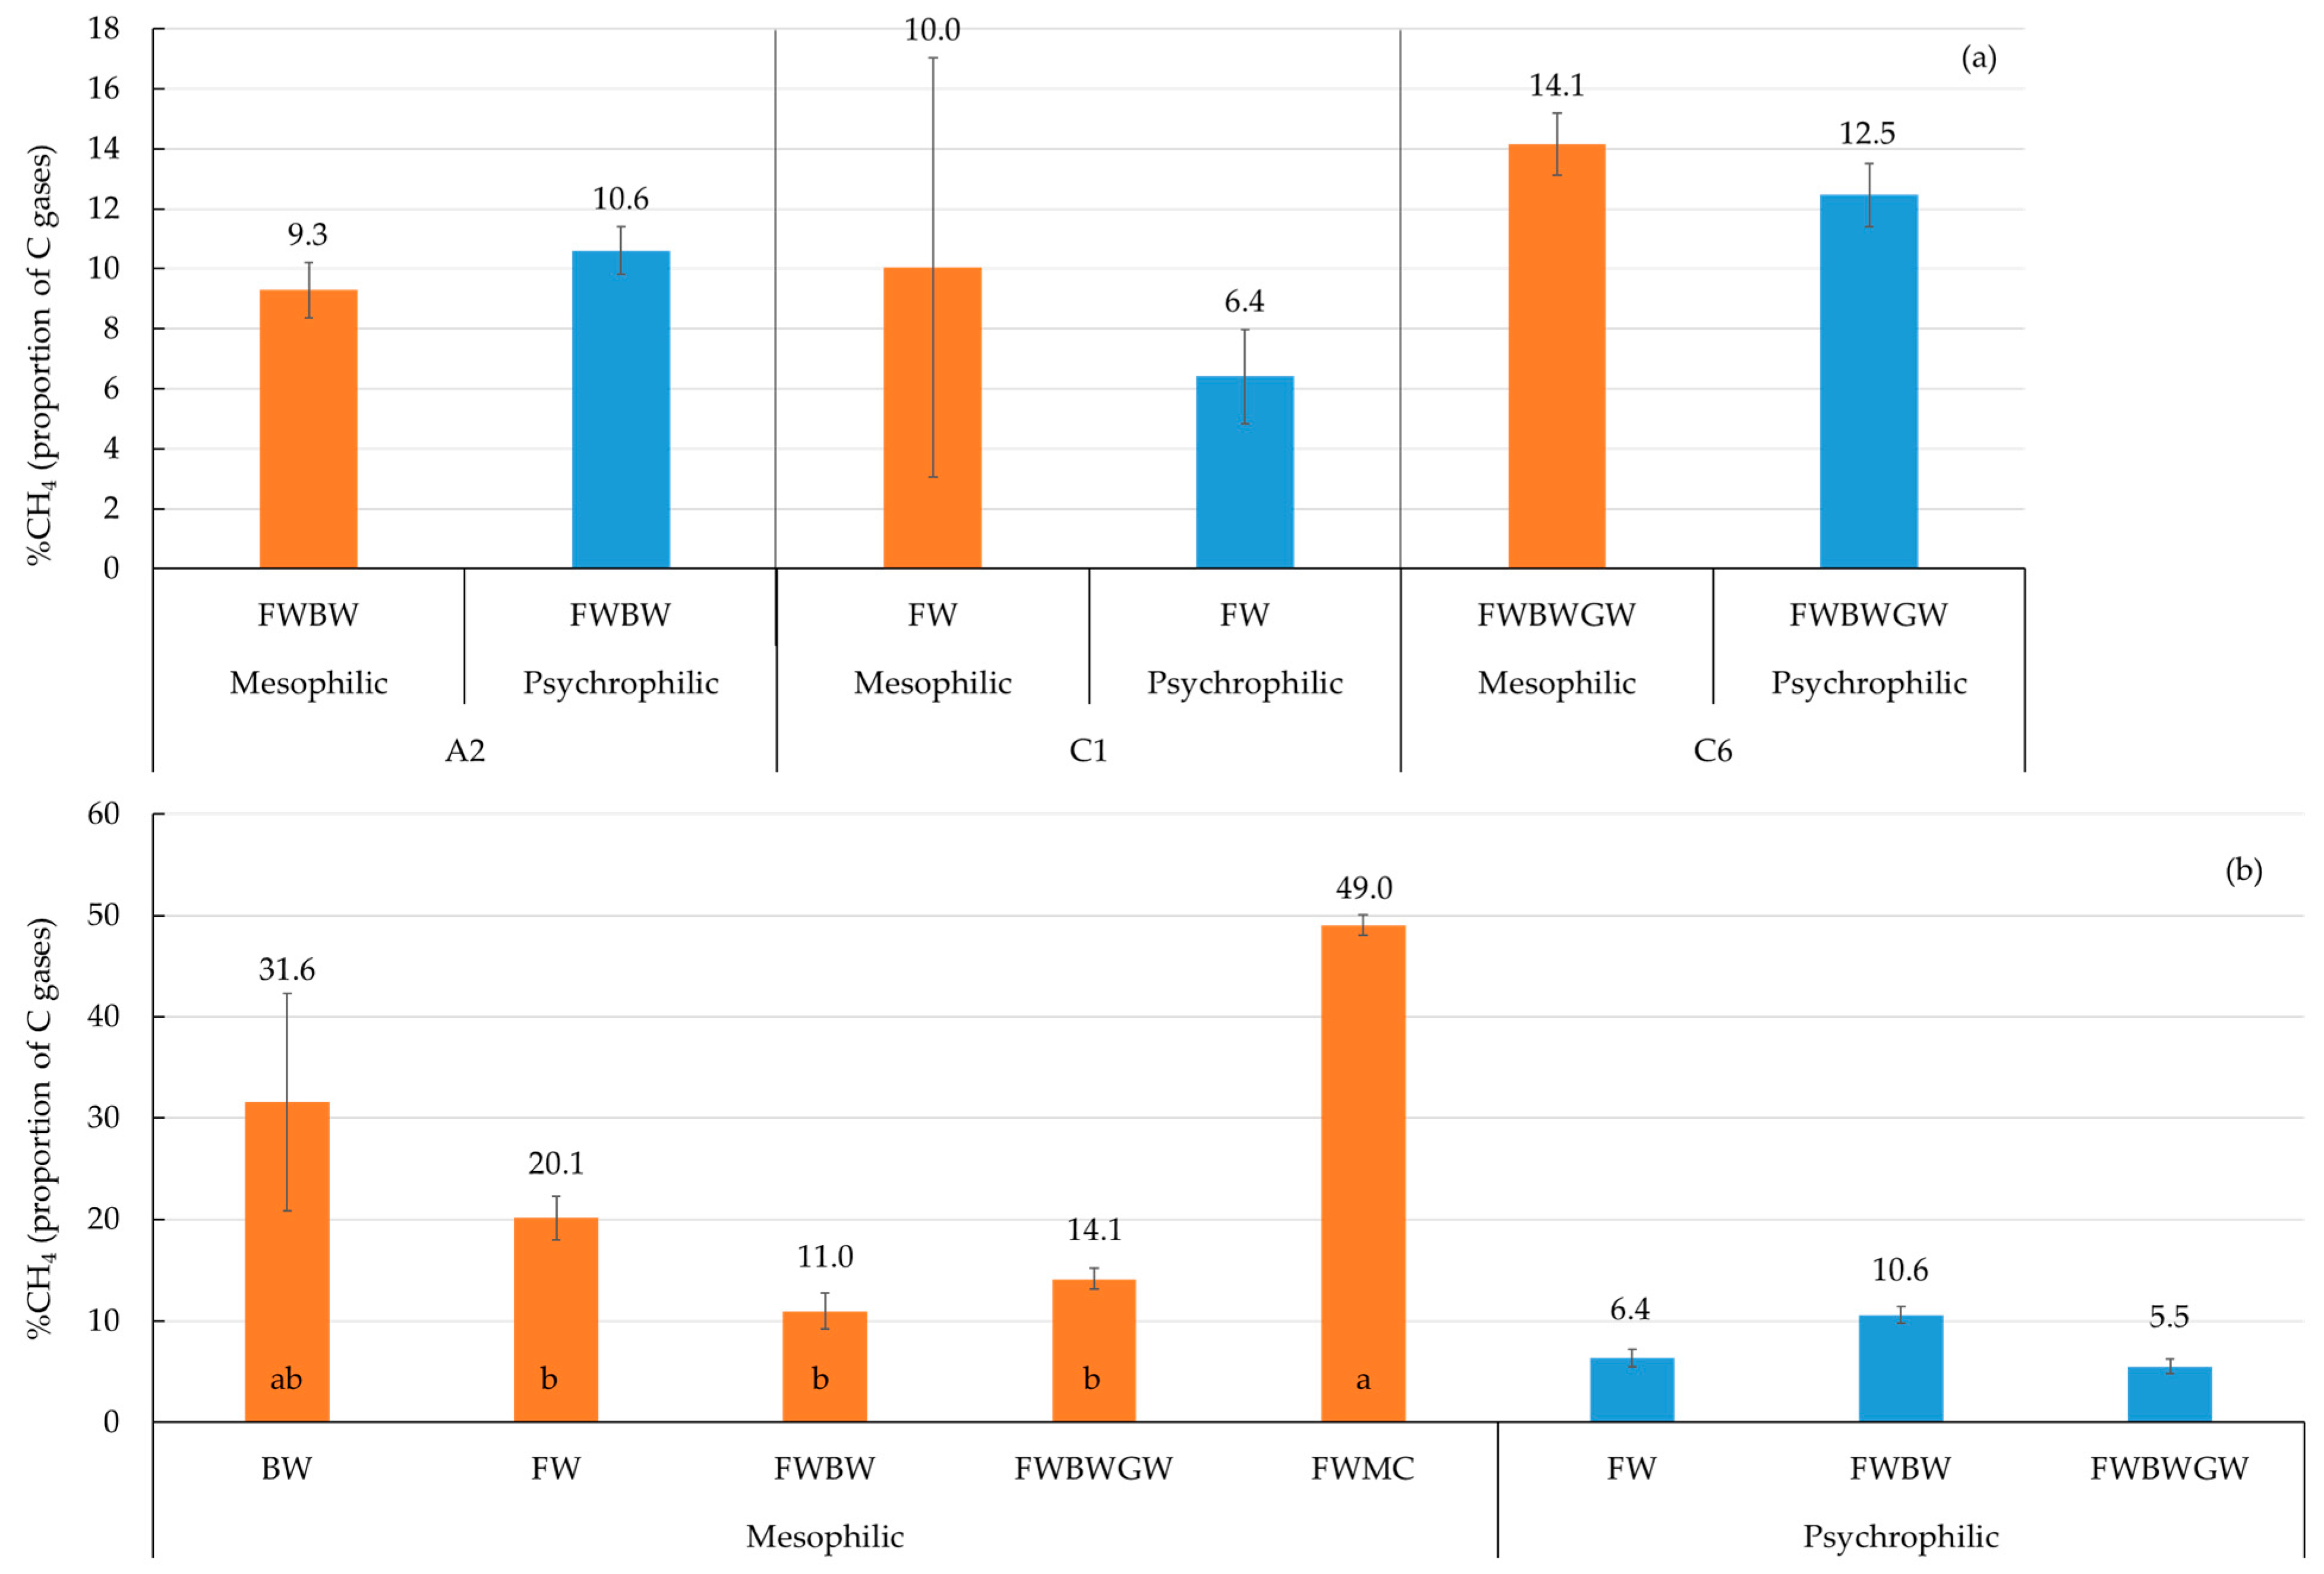
There was a positive correlation between digestate temperature and the proportion of CH4 in the biogas (p < 0.001). The digestion period, digestion temperature, and feedstock all significantly affected the proportion of CH4 in the biogas (Figure 4; ANOVA p < 0.05). Overall means (and standard error) of CH4 in the biogas were 21% ± 2% and 20% ± 3% for mesophilic mono- and co-digestions, respectively, and 6.4% ± 1% and 6.9% ± 1% for psychrophilic mono- and co-digestions, respectively. Post-hoc analysis by Tukey HSD contrasts of an ANOVA with feedstock nested within digestion temperature showed that the CH4 fraction in the biogas produced when digesting FWMC was significantly greater than the CH4 fraction from other feedstock mixtures containing FW (p < 0.001). This same analysis showed that biogas CH4 proportion during digestions of FW, FWBW, and FWBWGW were not significantly different regardless of digestion temperature (p > 0.05).
The CO2:CH4 ratio of the biogas (Table 3) can be used to provide information on the balance of the anaerobic respiration activities occurring within the digester. Mesophilic conditions yielded biogas CO2:CH4 ratios with overall averages and standard errors of the mean of 29 ± 14 and 8.2 ± 1.2 for mono- and co-digestions, respectively, showing the greater proportion of methanogenesis during co-digestions. Psychrophilic conditions yielded biogas CO2:CH4 ratios with overall averages and standard errors of the mean of 21 ± 2 and 37 ± 11 for mono- and co-digestions, respectively. There was also a significant relationship between the COD degradation and the CO2:CH4 of the biogas (p = 0.038, R2 = 0.52), such that higher COD degradations (i.e., a more efficient microbial organic degradation) were correlated with lower biogas CO2:CH4 ratios (i.e., more relative methane production). This correlation, which could be linked to the differences in the feedstock chemistry that impact the proportional importance of methanogenesis, could be a useful way to monitor digestion health and success in small-scale systems with inconsistent feedstock chemistry.
4. Discussion
Small-scale AD systems have potential to contribute to climate resiliency, especially in rural areas where agricultural residues are easily accessible [1,8,13,41]. In this study, with an unheated 2 m3 digester continuously operated for over three years with a variety of seasonally available feedstocks, co-digestion of feedstocks supported greater biogas production during cooler seasons. The shift from mesophilic conditions to psychrophilic conditions, as winter began, did not have a large effect on biogas production. If the freezing of plumbing in and out of the digester can be prevented, small-scale AD systems could likely be operated year-round in temperate climates with very little heating. Feedstock mixtures that generate the greatest biogas in mesophilic conditions differ from those that generate the greatest biogas in psychrophilic conditions. Seasonal adjustments in feedstock, with mono-digestion favored during warm months and co-digestions favored in colder months, would maximize fuel production from off-grid AD systems in temperate climates.
This study resolved that FWMC and BW produced the highest biomethane and biogas production rates, respectively, of the various feedstock mixtures, but co-digestions of FWBW and FWBWGW resulted in consistent biogas production rates and high biomethane content of the biogas during seasonal transitions. Co-digested FWMC was an excellent feedstock for biomethane production and digester stability during a mesophilic period. Psychrophilic conditions, especially after freezing occurred in the system plumbing, had a significant impact on the biogas production and overall digester stability. The OLR, feedstock chemistry, and digestion temperature were factors that had significant impacts on digester performance and stability of the unheated tubular digester operated in a temperate climate.
4.1. Feedstock and Temperature Effects
Overall, we determined that there was a persistent effect of temperature on both biogas quality and quantity that was largely independent of feedstock. However, there were significant interactive effects between the feedstock and seasonal temperature transitions on the quality (%CH4, ANOVA interaction p = 0.01) and quantity (biogas L d−1, ANOVA interaction p < 0.001) of the biogas produced. While the FW mono-digestion in 2017 was more productive going into the winter temperature transition and more resilient immediately following the transition in terms of its continuous biogas production, the CH4 production rate during the psychrophilic period in early 2018 when digesting FWBWGW was much higher than the same period in 2017. Co-digestions were the most productive in terms of the combination of CH4 production rate (Figure 3b) and biogas quality (Table 3, Figure 4).
The seasonal nature of the different feedstocks digestion performance measured here supports an operation that shifts between mono-digestions during mesophilic periods and co-digestions leading up to and throughout psychrophilic periods. We also speculate that the co-digestion mixtures such as the FWBWGW material, for example, performed well during psychrophilic digestion periods because the combination of feedstocks contained an adequate amount of trace elements and a more-ideal combination of macromolecules for the microbial community present within the digester at that time [42].
4.2. FWMC and BW Trials
The FWMC experimental period yielded several interesting observations. The feedstock during this period varied only in the makeup of the FW component, as the MC material was obtained from a single source that was kept consistent throughout the experiment. Feedstock C:N varied slightly by week throughout the 3-month experimental period, but was overall almost as consistent as the C:N of FW alone during FW mono-digestion periods (Table 2). In contrast, the output C:N remained much more consistent during the FWMC period than the output during FW mono-digestions, suggesting that the system obtained much higher CH4 production rates with the consistently high C input from MC relative to the much more variable feedstock of FW alone. This means that moderately inconsistent feedstock chemistry—with a feedstock C:N that ranged from 19.6 to 79.4 during the 14-week trial—is not harmful to quality biogas production.
The shredded MC plant material proved challenging to use in our passive inlet plumbing system due to clogging and thus daily feeding volumes of a mixture of only FWMC were limited. The lower-volume feedings translated into a longer retention time (196 d vs. an average of 145 d for all the other feeding periods) and a low OLR (0.2 gVS L−1 d−1). In contrast, the watery consistency of most of the BW we processed might make it an excellent candidate for an additional feedstock to be co-digested with the FWMC mixture, without having to further dilute the organics. In addition, both mono- and co-digestions indicate that BW is a good feedstock to help maintain a consistent and high CH4 production rate despite the temperature of the digestion, as the FWBW feedstock yielded about the same amount of biogas regardless of digestion condition/temperature (Figure 4). Future work on FWBWMC as a co-digestate feedstock could allow for an increased OLR, decreased HRT, and high biomethane production success without a loss of system resiliency with respect to digestion temperatures.
4.3. Interventions
The decline in biogas quality, but not quantity, observed during the seasonal transition shifts (Figure 3 and Figure 4, Table 3) suggests a microbial and/or biochemical imbalance favoring non-methanogenic anaerobic degradation pathways [30]. Both biogas quality and quantity issues could theoretically be addressed by adjusting the OLR [43], inoculating with the appropriate microbial community for the new temperature [17,44], and/or changing the feedstock chemistry [45] during critical transition periods.
In addition to the bottom-up inoculations and the top-down shifts in OLR and feedstock chemistry during seasonal transition and psychrophilic periods, there are engineering solutions that could help to physically buffer the digester and its contents from experiencing the more extreme temperature changes that perturb successful mesophilic digestions. Recent work on solar-assisted AD, or AD systems that use passive solar heating methods, has shown that relatively small increases in average digester temperatures can have a significant impact on the biogas and CH4 yields from small-scale systems [10,46]. The earthen trench and passive greenhouse used in this study managed to somewhat shield the digester from rapid temperature shifts, but this buffering effect was limited to daylight hours (Figure S1). The combination of solar assistance, feedstock chemistry, OLR, and inoculation interventions could be a powerful set of tools to help make small-scale AD in temperate climates a functional reality.
4.4. Considerations for Future Work
Future work will be required to test co-digestion feedstock mixtures with different conditions to determine if an alteration in the feedstock chemistry, the HRT, and/or the OLR could provide a more balanced production of quality biogas during mesophilic, psychrophilic, and seasonal transition periods in an unheated digester. Specifically, reducing the HRT could be helpful in preventing chemical inhibition and souring without the need to chemically pretreat the feedstocks. A reduced HRT would also provide an AD operator greater control over digester chemistry before, during, and after seasonal temperate shifts.
Work on the effectiveness of novel inoculations during both types of seasonal transitions (cold to warm and warm to cold) is the next logical step for research to advance unheated AD system resiliency. The imbalances in the CO2:CH4 of the biogas measured in this study, particularly during and immediately following seasonal transition periods, suggest an imbalance in the microbial community that functionally hinders methanogens relative to other anaerobic degraders [17]. There are examples of highly successful AD systems operating under psychrophilic conditions [11,47,48], with evidence suggesting a mismatch in bacterial versus methanogenic growth at low temperatures. Unbalanced microbial functional communities can also lead to digester conditions that further inhibit methanogenic activity (e.g., the abundance of inhibitory intermediary chemical species) and preventing robust CH4 production [48,49]. Previous research has also shown that methanogenic communities can be relatively slow-changing, particularly at lower temperatures [47].
Strategic inoculations with cold- or warm-tolerant methanogens might be a way to counteract the natural slowdown in methanogenesis during an unheated seasonal transition. One remarkably tolerant group of methanogenic archaea are Methanosarcina spp., which can use both acetoclastic and hydrogenotrophic pathways [50]. This robust genus has been found to grow in temperatures both as high as 70 °C and as low as 1 °C [51,52] and could be very valuable to psychrophilic and/or temperature-shifting AD systems. With a high tolerance for system shocks and environmental variation [49,50], Methanosarcina spp. could buffer production against gradual temperature changes experienced by unheated AD systems in temperate climates.
5. Conclusions
Small-scale AD systems could address the multidimensional needs of rural communities by providing energy security and improved waste management. The optimization of small digestion systems that use local, mixed organic waste streams could strongly impact the ability for individuals and small businesses to adopt ecologically and economically sustainable practices. This study addressed some of the outstanding questions regarding low-tech, small-scale AD systems in temperate climates with special attention paid to seasonal transitions that would allow for year-round operation. While more work is required to optimize small-scale AD systems that experience significant feedstock and temperature fluctuations throughout the year, this study also made clear that AD could be a viable treatment for wastes from rural microbreweries and co-digestion of agricultural residues can increase fuel yield from AD when FW is the primary feedstock.
Supplementary Materials
The following are available online at https://www.mdpi.com/article/10.3390/su13126509/s1, Figure S1: Daily minimum average air temperatures 2016–2018, Figure S2: Digestate temperature sensor and weather station data comparison 2017, Figure S3: Daily biogas production rate (2016–2018).
Author Contributions
Conceptualization, S.C.D. and K.E.M.; methodology, S.C.D. and K.E.M.; software, K.E.M.; validation, K.E.M., T.H. and D.A.P.; formal analysis, K.E.M.; investigation, S.C.D., K.E.M., T.H. and D.A.P.; resources, S.C.D.; data curation, K.E.M.; writing—original draft preparation, K.E.M.; writing—review and editing, K.E.M. and S.C.D.; visualization, K.E.M.; supervision, S.C.D. and K.E.M.; project administration, S.C.D. and K.E.M.; funding acquisition, S.C.D. and K.E.M. All authors have read and agreed to the published version of the manuscript.
Funding
This research was funded by National Science Foundation grant number 1230961, US Department of Agriculture grant number 2019-51300-30257, Ohio University 1804 Fund, and the AEP Foundation. The APC was funded by Ohio University Voinovich School of Leadership and Public Affairs.
Institutional Review Board Statement
Not applicable.
Informed Consent Statement
Not applicable.
Data Availability Statement
Data available upon request.
Acknowledgments
The authors are grateful for the collaboration and support provided by (1) Art Oestrike, Alan Gordon, and Cameron Fuller for providing brewery waste from their operations for this study, (2) Steve Mack and the facilities staff that assisted with food waste collection, and (3) Nicholas Momenee, Abbey Rodjom, Alexander Jones, Nicholas Niechayev, Esther Grossman, Kristeena Blaser, and Jingtong Li for assistance with daily feeding and monitoring of the digester.
Conflicts of Interest
The authors declare no conflict of interest. The funders had no role in the design of the study, in the collection, analysis, or interpretation of data, in the writing of the manuscript, or in the decision to publish the results.
References
- Evangelisti, S.; Clift, R.; Tagliaferri, C.; Lettieri, P. A Life Cycle Assessment of Distributed Energy Production from Organic Waste: Two Case Studies in Europe. Waste Manag. 2017, 64, 371–385. [Google Scholar] [CrossRef] [PubMed] [Green Version]
- Miller, K.E.; Grossman, E.; Stuart, B.J.; Davis, S.C. Pilot-Scale Biogas Production in a Temperate Climate Using Variable Food Waste. Biomass Bioenergy 2020, 138, 105568. [Google Scholar] [CrossRef]
- Chae, K.J.; Jang, A.; Yim, S.K.; Kim, I.S. The Effects of Digestion Temperature and Temperature Shock on the Biogas Yields from the Mesophilic Anaerobic Digestion of Swine Manure. Bioresour. Technol. 2008, 99, 1–6. [Google Scholar] [CrossRef]
- Bong, C.P.C.; Lim, L.Y.; Lee, C.T.; Klemeš, J.J.; Ho, C.S.; Ho, W.S. The Characterisation and Treatment of Food Waste for Improvement of Biogas Production during Anaerobic Digestion—A Review. J. Clean. Prod. 2018, 172, 1545–1558. [Google Scholar] [CrossRef]
- Martí-Herrero, J.; Alvarez, R.; Cespedes, R.; Rojas, M.R.; Conde, V.; Aliaga, L.; Balboa, M.; Danov, S. Cow, Sheep and Llama Manure at Psychrophilic Anaerobic Co-Digestion with Low Cost Tubular Digesters in Cold Climate and High Altitude. Bioresour. Technol. 2015, 181, 238–246. [Google Scholar] [CrossRef] [PubMed]
- Bohn, I.; Björnsson, L.; Mattiasson, B. Effect of Temperature Decrease on the Microbial Population and Process Performance of a Mesophilic Anaerobic Bioreactor. Environ. Technol. 2007, 28, 943–952. [Google Scholar] [CrossRef] [PubMed]
- Angelidaki, I.; Karakashev, D.; Batstone, D.J.; Plugge, C.M.; Stams, A.J.M. Chapter sixteen—Biomethanation and Its Potential. In Methods in Enzymology; Methods in Methane Metabolism, Part A; Rosenzweig, A.C., Ragsdale, S.W., Eds.; Academic Press: Cambridge, MA, USA, 2011; Volume 494, pp. 327–351. [Google Scholar]
- Lansing, S.; Hülsemann, B.; Choudhury, A.; Schueler, J.; Lisboa, M.S.; Oechsner, H. Food Waste Co-Digestion in Germany and the United States: From Lab to Full-Scale Systems. Resour. Conserv. Recycl. 2019, 148, 104–113. [Google Scholar] [CrossRef]
- Silva, F.P.; de Souza, S.N.M.; Kitamura, D.S.; Nogueira, C.E.C.; Otto, R.B. Energy Efficiency of a Micro-Generation Unit of Electricity from Biogas of Swine Manure. Renew. Sustain. Energy Rev. 2018, 82, 3900–3906. [Google Scholar] [CrossRef]
- Gaballah, E.S.; Abdelkader, T.K.; Luo, S.; Yuan, Q.; El-Fatah Abomohra, A. Enhancement of Biogas Production by Integrated Solar Heating System: A Pilot Study Using Tubular Digester. Energy 2020, 193, 116758. [Google Scholar] [CrossRef]
- Garfí, M.; Ferrer-Martí, L.; Villegas, V.; Ferrer, I. Psychrophilic Anaerobic Digestion of Guinea Pig Manure in Low-Cost Tubular Digesters at High Altitude. Bioresour. Technol. 2011, 102, 6356–6359. [Google Scholar] [CrossRef] [PubMed] [Green Version]
- Hoalst-Pullen, N.; Patterson, M.W.; Mattord, R.A.; Vest, M.D. Sustainability Trends in the Regional Craft Beer Industry. In The Geography of Beer: Regions, Environment, and Societies; Patterson, M., Hoalst-Pullen, N., Eds.; Springer: Dordrecht, The Netherlands, 2014; pp. 109–116. ISBN 978-94-007-7787-3. [Google Scholar]
- Curry, N.; Pillay, P. Biogas Prediction and Design of a Food Waste to Energy System for the Urban Environment. Renew. Energy 2012, 41, 200–209. [Google Scholar] [CrossRef]
- Bernstad, A.; la Cour Jansen, J. A Life Cycle Approach to the Management of Household Food Waste—A Swedish Full-Scale Case Study. Waste Manag. 2011, 31, 1879–1896. [Google Scholar] [CrossRef]
- Davis, S.C.; Kauneckis, D.; Kruse, N.A.; Miller, K.E.; Zimmer, M.; Dabelko, G.D. Closing the Loop: Integrative Systems Management of Waste in Food, Energy, and Water Systems. J. Environ. Stud. Sci. 2016, 6, 11–24. [Google Scholar] [CrossRef] [Green Version]
- Djekic, I.; Operta, S.; Djulancic, N.; Lorenzo, J.M.; Barba, F.J.; Djordjević, V.; Tomasevic, I. Quantities, Environmental Footprints and Beliefs Associated with Household Food Waste in Bosnia and Herzegovina. Waste Manag. Res. 2019, 1250–1260. [Google Scholar] [CrossRef] [PubMed]
- Ventorino, V.; Romano, I.; Pagliano, G.; Robertiello, A.; Pepe, O. Pre-Treatment and Inoculum Affect the Microbial Community Structure and Enhance the Biogas Reactor Performance in a Pilot-Scale Biodigestion of Municipal Solid Waste. Waste Manag. 2018, 73, 69–77. [Google Scholar] [CrossRef]
- Agyeman, F.O.; Tao, W. Anaerobic Co-Digestion of Food Waste and Dairy Manure: Effects of Food Waste Particle Size and Organic Loading Rate. J. Environ. Manag. 2014, 133, 268–274. [Google Scholar] [CrossRef]
- Brewers Association. National Beer Sales & Production Data; Brewers Association: Boulder, CO, USA, 2019. [Google Scholar]
- Perimenis, A.; Nicolay, T.; Leclercq, M.; Gerin, P.A. Comparison of the Acidogenic and Methanogenic Potential of Agroindustrial Residues. Waste Manag. 2018, 72, 178–185. [Google Scholar] [CrossRef]
- Ness, B. Beyond the Pale (Ale): An Exploration of the Sustainability Priorities and Innovative Measures in the Craft Beer Sector. Sustainability 2018, 10, 4108. [Google Scholar] [CrossRef] [Green Version]
- Banks, C.J.; Chesshire, M.; Heaven, S.; Arnold, R. Anaerobic Digestion of Source-Segregated Domestic Food Waste: Performance Assessment by Mass and Energy Balance. Bioresour. Technol. 2011, 102, 612–620. [Google Scholar] [CrossRef] [Green Version]
- Heaton, E.; Voigt, T.; Long, S.P. A Quantitative Review Comparing the Yields of Two Candidate C4 Perennial Biomass Crops in Relation to Nitrogen, Temperature and Water. Biomass Bioenergy 2004, 27, 21–30. [Google Scholar] [CrossRef]
- Adjuik, T.; Rodjom, A.M.; Miller, K.E.; Reza, M.T.M.; Davis, S.C. Application of Hydrochar, Digestate, and Synthetic Fertilizer to a Miscanthus x Giganteus Crop: Implications for Biomass and Greenhouse Gas Emissions. Appl. Sci. 2020, 10, 8953. [Google Scholar] [CrossRef]
- Arundale, R.A.; Dohleman, F.G.; Heaton, E.A.; Mcgrath, J.M.; Voigt, T.B.; Long, S.P. Yields of Miscanthus × Giganteus and Panicum Virgatum Decline with Stand Age in the Midwestern USA. GCB Bioenergy 2014, 6, 1–13. [Google Scholar] [CrossRef]
- Heaton, E.A.; Dohleman, F.G.; Long, S.P. Meeting US Biofuel Goals with Less Land: The Potential of Miscanthus: Miscanthus And Switchgrass Trials In Illinois. Glob. Chang. Biol. 2008, 14, 2000–2014. [Google Scholar] [CrossRef]
- Finch, J.W.; Karp, A.; McCabe, D.P.M.; Nixon, S.; Riche, A.B.; Whitmore, A.P. Miscanthus, Short-Rotation Coppice and the Historic Environment; English Heritage: New York, NY, USA, 2009. [Google Scholar]
- Clifton-Brown, J.C.; Stampfl, P.F.; Jones, M.B. Miscanthus Biomass Production for Energy in Europe and Its Potential Contribution to Decreasing Fossil Fuel Carbon Emissions: Miscanthus Biomass Production. Glob. Chang. Biol. 2004, 10, 509–518. [Google Scholar] [CrossRef]
- Hidalgo, D.; Martín-Marroquín, J.M. Effects of Inoculum Source and Co-Digestion Strategies on Anaerobic Digestion of Residues Generated in the Treatment of Waste Vegetable Oils. J. Environ. Manag. 2014, 142, 17–22. [Google Scholar] [CrossRef] [PubMed]
- Chen, Y.; Cheng, J.J.; Creamer, K.S. Inhibition of Anaerobic Digestion Process: A Review. Bioresour. Technol. 2008, 99, 4044–4064. [Google Scholar] [CrossRef] [PubMed]
- Gerin, P.A.; Vliegen, F.; Jossart, J.-M. Energy and CO2 Balance of Maize and Grass as Energy Crops for Anaerobic Digestion. Bioresour. Technol. 2008, 99, 2620–2627. [Google Scholar] [CrossRef] [PubMed]
- Barbanti, L.; Di Girolamo, G.; Grigatti, M.; Bertin, L.; Ciavatta, C. Anaerobic Digestion of Annual and Multi-Annual Biomass Crops. Ind. Crop. Prod. 2014, 56, 137–144. [Google Scholar] [CrossRef]
- Lansing, S.; Martin, J.F.; Botero, R.B.; Nogueira da Silva, T.; Dias da Silva, E. Wastewater Transformations and Fertilizer Value When Co-Digesting Differing Ratios of Swine Manure and Used Cooking Grease in Low-Cost Digesters. Biomass Bioenergy 2010, 34, 1711–1720. [Google Scholar] [CrossRef]
- Hidalgo, D.; Martín-Marroquín, J.M.; Sastre, E. Single-Phase and Two-Phase Anaerobic Co-Digestion of Residues from the Treatment Process of Waste Vegetable Oil and Pig Manure. Bioenergy Res. 2014, 7, 670–680. [Google Scholar] [CrossRef]
- Poulsen, T.G.; Adelard, L.; Wells, M. Improvement in CH4/CO2 Ratio and CH4 Yield as Related to Biomass Mix Composition during Anaerobic Co-Digestion. Waste Manag. 2017, 61, 179–187. [Google Scholar] [CrossRef] [PubMed]
- Kainthola, J.; Kalamdhad, A.S.; Goud, V.V. Optimization of Process Parameters for Accelerated Methane Yield from Anaerobic Co-Digestion of Rice Straw and Food Waste. Renew. Energy 2020, 149, 1352–1359. [Google Scholar] [CrossRef]
- Labatut, R.A.; Angenent, L.T.; Scott, N.R. Biochemical Methane Potential and Biodegradability of Complex Organic Substrates. Bioresour. Technol. 2011, 102, 2255–2264. [Google Scholar] [CrossRef] [PubMed]
- Coombs, J. The present and future of anaerobic digestion. In Anaerobic Digestion: A Waste Treatment Technology; Critical Reports in Applied Chemistry; Chapman & Hall: New York, NY, USA, 1990; Volume 31, pp. 1–42. [Google Scholar]
- R Core Team. R: A Language and Environment for Statistical Computing; R Foundation for Statistical Computing: Vienna, Austria, 2017. [Google Scholar]
- Khalid, A.; Arshad, M.; Anjum, M.; Mahmood, T.; Dawson, L. The Anaerobic Digestion of Solid Organic Waste. Waste Manag. 2011, 31, 1737–1744. [Google Scholar] [CrossRef]
- Garfí, M.; Martí-Herrero, J.; Garwood, A.; Ferrer, I. Household Anaerobic Digesters for Biogas Production in Latin America: A Review. Renew. Sustain. Energy Rev. 2016, 60, 599–614. [Google Scholar] [CrossRef] [Green Version]
- Climenhaga, M.A.; Banks, C.J. Anaerobic Digestion of Catering Wastes: Effect of Micronutrients and Retention Time. Water Sci. Technol. 2008, 57, 687–692. [Google Scholar] [CrossRef] [PubMed]
- Nagao, N.; Tajima, N.; Kawai, M.; Niwa, C.; Kurosawa, N.; Matsuyama, T.; Md Yusoff, F.; Toda, T. Maximum Organic Loading Rate for the Single-Stage Wet Anaerobic Digestion of Food Waste. Bioresour. Technol. 2012, 118, 210–218. [Google Scholar] [CrossRef]
- Rajagopal, R.; Bellavance, D.; Rahaman, M.S. Psychrophilic Anaerobic Digestion of Semi-Dry Mixed Municipal Food Waste: For North American Context. Process Saf. Environ. Prot. 2017, 105, 101–108. [Google Scholar] [CrossRef]
- Neshat, S.A.; Mohammadi, M.; Najafpour, G.D.; Lahijani, P. Anaerobic Co-Digestion of Animal Manures and Lignocellulosic Residues as a Potent Approach for Sustainable Biogas Production. Renew. Sustain. Energy Rev. 2017, 79, 308–322. [Google Scholar] [CrossRef]
- Mahmudul, H.M.; Rasul, M.G.; Akbar, D.; Narayanan, R.; Mofijur, M. A Comprehensive Review of the Recent Development and Challenges of a Solar-Assisted Biodigester System. Sci. Total Environ. 2021, 753, 141920. [Google Scholar] [CrossRef]
- McKeown, R.M.; Scully, C.; Enright, A.-M.; Chinalia, F.A.; Lee, C.; Mahony, T.; Collins, G.; O’Flaherty, V. Psychrophilic Methanogenic Community Development during Long-Term Cultivation of Anaerobic Granular Biofilms. ISME J. 2009, 3, 1231–1242. [Google Scholar] [CrossRef] [PubMed] [Green Version]
- Raghoebarsing, A.A.; Pol, A.; van de Pas-Schoonen, K.T.; Smolders, A.J.P.; Ettwig, K.F.; Rijpstra, W.I.C.; Schouten, S.; Damsté, J.S.S.; den Camp, H.J.M.O.; Jetten, M.S.M.; et al. A Microbial Consortium Couples Anaerobic Methane Oxidation to Denitrification. Nature 2006, 440, 918–921. [Google Scholar] [CrossRef] [PubMed]
- Cho, K.; Jeong, Y.; Seo, K.W.; Lee, S.; Smith, A.L.; Shin, S.G.; Cho, S.-K.; Park, C. Effects of Changes in Temperature on Treatment Performance and Energy Recovery at Mainstream Anaerobic Ceramic Membrane Bioreactor for Food Waste Recycling Wastewater Treatment. Bioresour. Technol. 2018, 256, 137–144. [Google Scholar] [CrossRef]
- De Vrieze, J.; Hennebel, T.; Boon, N.; Verstraete, W. Methanosarcina: The Rediscovered Methanogen for Heavy Duty Biomethanation. Bioresour. Technol. 2012, 112, 1–9. [Google Scholar] [CrossRef]
- Tang, Y.-Q.; Matsui, T.; Morimura, S.; Wu, X.-L.; Kida, K. Effect of Temperature on Microbial Community of a Glucose-Degrading Methanogenic Consortium under Hyperthermophilic Chemostat Cultivation. J. Biosci. Bioeng. 2008, 106, 180–187. [Google Scholar] [CrossRef]
- Xing, W.; Zhao, Y.; Zuo, J. e Microbial Activity and Community Structure in a Lake Sediment Used for Psychrophilic Anaerobic Wastewater Treatment. J. Appl. Microbiol. 2010, 109, 1829–1837. [Google Scholar] [CrossRef]
Figure 1.
Schematic of the digester and greenhouse setup; modified from Miller et al. 2020 [2]. Black lines indicate stainless steel or Tygon fuel line tubing and fixtures; red lines indicate PVC fittings and tubing.
Figure 1.
Schematic of the digester and greenhouse setup; modified from Miller et al. 2020 [2]. Black lines indicate stainless steel or Tygon fuel line tubing and fixtures; red lines indicate PVC fittings and tubing.

Figure 2.
A comparison of daily maximum air temperatures from May of 2016 to August of 2018 by measurement location: the Ohio University weather station (green line), ground level (0 m) within the greenhouse (blue line), and mid-height (1.2 m) within the greenhouse air space (yellow line).
Figure 2.
A comparison of daily maximum air temperatures from May of 2016 to August of 2018 by measurement location: the Ohio University weather station (green line), ground level (0 m) within the greenhouse (blue line), and mid-height (1.2 m) within the greenhouse air space (yellow line).

Figure 3.
Average CH4 production rate by digestion type (mesophilic vs. psychrophilic) and feedstock. Rate comparisons of mesophilic (orange bars) and psychrophilic (blue bars) digestions by feedstock within digestion type (a) and by digestion type within the three feedstock mixtures with digestions in both temperature ranges (b). Bars represent average rates with standard error bars. The number of observations per summary are shown above each bar; the FW and FWBWGW feedstock names with asterisks (*) on the x-axis of panel b denote significant differences by digestion temperature within a feedstock group (ANOVA p < 0.01). For feedstocks with both mesophilic and psychrophilic digestions (panel b), there was a significant interaction effect between the feedstock and digestion temperature (ANOVA p < 0.001).

Figure 4.
Biogas quality measured as proportional CH4 content in the biogas during the A2, C1, and C6 period seasonal shifts (October–January) from mesophilic to psychrophilic (a) and the feedstock within each digestion temperature (b). Orange bars represent mesophilic digestions; blue bars represent psychrophilic digestions. Data are shown as averages with standard error bars and the average CH4 content (%) in text above each bar. Significantly different feedstocks by Tukey HSD within the mesophilic digestion temperature are shown as lowercase letters within the bars in the lower panel (b); psychrophilic feedstocks were not significantly different (p > 0.05).


Table 1.
Digester periods by date and feedstock used.
| Digestion Vessel | Period ID | Start Date | End Date | Feedstock ID(s) 1 | Average Feeding Rate (gal d−1) | Average Organic Loading (gVS L−1 d−1) | Hydraulic Retention Time (d) |
|---|---|---|---|---|---|---|---|
| A | A1 | 1 July 2015 3 | 28 September 2015 | FW | 4 | 0.87 | 120 |
| A | A2 | 29 September 2015 | 13 November 2015 | FWBW | 5 | 0.91 | 105 |
| A | A3 | 14 November 2015 | 29 November 2015 | FW | 2 | 0.43 | 314 |
| B | B1 | 24 May 2016 3 | 29 June 2016 | FW | 4 | 0.75 | 128 |
| C | C1 | 3 October 2016 3 | 19 December 2016 | FW | 5 | 1.2 | 98 |
| C | C1_frozen 2 | 20 December 2016 | 11 January 2017 | n/a | - | - | - |
| C | C2 | 12 January 2017 | 7 April 2017 | FW | 5 | 1.5 | 107 |
| C | C3 | 8 April 2017 | 14 June 2017 | FWBW | 5 | 1.5 | 106 |
| C | C4 | 15 June 2017 | 8 August 2017 | BW | 9 | 2.0 | 61 |
| C | C4_sour 2 | 9 August 2017 | 27 August 2017 | n/a | - | - | 114 |
| C | C5 | 28 August 2017 | 13 September 2017 | FWBW | 2 | 0.63 | 213 |
| C | C6 | 14 September 2017 | 25 December 2017 | FWBWGW | 3 | 0.77 | 185 |
| C | C6_frozen 2 | 26 December 2017 | 9 January 2018 | n/a | - | - | - |
| C | C7 | 10 January 2018 | 18 April 2018 | FWBWGW | 3 | 0.86 | 152 |
| C | C7_damaged 2 | 19 April 2018 | 21 May 2018 | n/a | - | - | - |
| C | C8 | 22 May 2018 | 3 June 2018 | FW | 3 | 0.81 | 181 |
| C | C9 | 4 June 2018 3 | 3 October 2018 | FWMC | 3 | 0.21 | 196 |
1 Feedstock ID key: FW, food waste; BW, brewery waste; GW, grease waste; MC, Miscanthus x giganteus residues. 2 Denotes periods when feeding was suspended and biogas data were not used in statistical analyses. 3 Denotes a seeding event on that date.
Table 2.
Chemical characterization of AD inputs and outputs by feedstock mixture period, presented as averages (with standard errors indicated in parentheses).
Table 2.
Chemical characterization of AD inputs and outputs by feedstock mixture period, presented as averages (with standard errors indicated in parentheses).
| Feedstock Period | Material | Total Nitrogen (mg L−1) | Total Phosphorus (mg L−1) | COD (mg L−1) | Carbon (%) | Nitrogen (%) | C:N Ratio 1 |
|---|---|---|---|---|---|---|---|
| Food Waste | Seed Material 2 | 11,652 | 5386 | 69,591 | 28 | 4 | 8 |
| FW | 2100 (375) | 378 (78) | 71,833 (5487) | 52 (0) | 4 (0) | 15 (0) | |
| Digestate | -- | -- | -- | 34 (1) | 2 (0) | 19 (1) | |
| Food &MiscanthusWaste | MC 3 | -- | -- | -- | 48 (0) | 0 (0) | 527 (146) |
| FWMC | 672 (106) | 54 (13) | 38,040 (6385) | 46 (1) | 2 (0) | 47 (8) | |
| Digestate | 1760 (177) | 333 (64) | 40,514 (8928) | 28 (1) | 2 (0) | 12 (0) | |
| Food, Brewery, & Grease Waste 4 | FW | 3297 (258) | 1592 (250) | 148,779 (12,260) | 52 (1) | 4 (0) | 18 (2) |
| BW | 5275 (329) | 2517 (179) | 192,244 (8241) | 60 (1) | 7 (1) | 11 (1) | |
| Digestate | 2998 (155) | 1581 (217) | 110,877 (6437) | 51 | 3 | 20 |
1 Average of C:N ratios. 2 Seed material from the Quasar Wooster plant collected on 24 May 2016. 3 MC would not dissolve completely enough for N, P, and COD analysis. 4 GW and feedstock mixtures including GW were not all analyzed due to an inability to dry the material enough to powder.
Table 3.
Digestion characteristics by digestion temperature, digester unit, and feedstock, presented as averages with standard errors.
Table 3.
Digestion characteristics by digestion temperature, digester unit, and feedstock, presented as averages with standard errors.
| Digestion Type | ID | Feedstock | Duration (d) | Maximum Daily Air Temp (°C) | Fed (kgVS d−1) | Average OLR (gVS L−1 d−1) | Methane Production Rate (gCH4 gVS−1 d−1) | Biogas CO2:CH4 | Input pH | Output pH | Input Temp (°C) | Output Temp (°C) |
|---|---|---|---|---|---|---|---|---|---|---|---|---|
| Mesophilic | (overall) | 638 | 26.8 (4) | 1.8 (3) | 0.9 (0.06) | 0.108 (0.4) | 19 (8) | 7.1 (0.6) | 6.8 (0.9) | 27.1 (18) | 32.0 (19) | |
| A | FW | 85 | 28.4 (3) | 1.7 (1) | 0.9 (0.05) | 0.014 (0.01) | 8 (1) | 6.9 (0.9) | 6.5 (0.3) | 22.1 (4) | 28.0 (3) | |
| A | FWBW | 25 | 21.5 (5) | 2.0 (1) | 1.0 (0.05) | 0.005 (0.00) | 10 (1) | 7.5 (0.3) | 7.1 (0.2) | 14.1 (4) | 22.6 (2) | |
| B | FW | 37 | 28.3 (3) | 1.5 (1) | 0.7 (0.08) | 0.025 (0.04) | 2 (0) | 6.9 (0.6) | 8.2 (0.4) | 20.9 (5) | 18.0 (3) | |
| C | BW | 74 | 27.7 (3) | 3.7 (6) | 1.9 (0.41) | 0.761 (1.3) | 196 (112) | 6.8 (0.7) | 5.7 (0.4) | 21.9 (5) | 24.8 (4) | |
| C | FW | 50 | 23.5 (5) | 2.0 (1) | 1.0 (0.05) | 0.005 (0.01) | 124 (109) | 7.2 (0.4) | -- | 26.4 (6) | -- | |
| C | FWBW | 84 | 23.6 (4) | 2.6 (2) | 1.3 (0.08) | 0.024 (0.04) | 21 (10) | 7.0 (0.7) | 5.8 (0.6) | 19.6 (5) | 21.2 (5) | |
| C | FWBWGW | 61 | 25.9 (4) | 1.4 (1) | 0.7 (0.06) | 0.001 (0.00) | 6 (0) | 7.2 (0.6) | 5.6 (0.7) | 16.2 (6) | 18.8 (5) | |
| C | FWMC | 127 | 27.8 (4) | 0.4 (0) | 0.2 (0.01) | -- | 1 (0) | 7.2 (0.4) | 7.5 (0.6) | 23.9 (3) | 24.1 (3) | |
| Psychrophilic | (overall) | 375 | 10.3 (8) | 2.1 (1) | 1.0 (0.03) | 0.009 (0.02) | 32 (7) | 7.1 (0.6) | 6.5 (0.7) | 9.4 (6) | 11.3 (5) | |
| A | FW | 15 | 13.8 (6) | 0.9 (1) | 0.4 (0.08) | 0.008 (0.01) | 9 (1) | 7.5 (0.2) | 7.0 (0.0) | 11.7 (4) | 16.6 (1) | |
| A | FWBW | 20 | 16.4 (6) | 1.8 (1) | 0.9 (0.06) | 0.009 (0.01) | 9 (1) | 7.6 (0.3) | 7.1 (0.2) | 13.6 (4) | 19.0 (1) | |
| C | FW | 150 | 10.4 (8) | 2.8 (1) | 1.4 (0.06) | 0.000 (0.00) | 24 (3) | 6.7 (0.7) | 6.3 (0.9) | 8.9 (5) | 9.5 (5) | |
| C | FWBWGW | 189 | 9.2 (8) | 1.6 (1) | 0.8 (0.04) | 0.015 (0.02) | 48 (15) | 7.3 (0.3) | 6.5 (0.5) | 9.0 (6) | 9.9 (5) |
Publisher’s Note: MDPI stays neutral with regard to jurisdictional claims in published maps and institutional affiliations. |
© 2021 by the authors. Licensee MDPI, Basel, Switzerland. This article is an open access article distributed under the terms and conditions of the Creative Commons Attribution (CC BY) license (https://creativecommons.org/licenses/by/4.0/).
Share and Cite
MDPI and ACS Style
Miller, K.E.; Herman, T.; Philipinanto, D.A.; Davis, S.C. Anaerobic Digestion of Food Waste, Brewery Waste, and Agricultural Residues in an Off-Grid Continuous Reactor. Sustainability 2021, 13, 6509. https://doi.org/10.3390/su13126509
AMA Style
Miller KE, Herman T, Philipinanto DA, Davis SC. Anaerobic Digestion of Food Waste, Brewery Waste, and Agricultural Residues in an Off-Grid Continuous Reactor. Sustainability. 2021; 13(12):6509. https://doi.org/10.3390/su13126509
Chicago/Turabian StyleMiller, Kimberley E., Tess Herman, Dimas A. Philipinanto, and Sarah C. Davis. 2021. "Anaerobic Digestion of Food Waste, Brewery Waste, and Agricultural Residues in an Off-Grid Continuous Reactor" Sustainability 13, no. 12: 6509. https://doi.org/10.3390/su13126509
Note that from the first issue of 2016, this journal uses article numbers instead of page numbers. See further details here.